Article

Phytoplankton Growth Rate and Microzooplankton Grazing under Conditions of Climatic Changes and Anthropogenic Pollution in the Coastal Waters of the Black Sea (Sevastopol Region)

Department of Ecological Physiology of Algae, A.O. Kovalevsky Institute of Biology of the Southern Seas of RAS, RU-299011 Sevastopol, Russia
*
Author to whom correspondence should be addressed.
Water 2021, 13(22), 3230; https://doi.org/10.3390/w13223230
Submission received: 23 September 2021 / Revised: 29 October 2021 / Accepted: 10 November 2021 / Published: 14 November 2021
(This article belongs to the Special Issue Phytoplankton and Phytobenthos: From Freshwater to Marine Ecosystems)

Abstract

:
In the coastal waters of the Black Sea near Sevastopol, a gradual temperature elevation and an increase in anthropogenic pressure since the early 2000s have caused significant structural and functional changes in phytoplankton. Currently, there is a significant decrease in the contribution of small diatom species (Skeletonema sp. and Chaetoceros socialis H.S.Lauder as well as coccolithophorids Emiliania huxleyi (Lohmann) W.W.Hay and H.P.Mohler) to the total phytoplankton biomass in these waters. Previously these species caused regular weak blooms. In the warm periods (from May to October), during which the main phytoplankton biomass is formed, large diatom species Pseudosolenia calcar-avis (Schultze) B.G.Sundström, 1986, Proboscia alata (Brightwell) Sundström and dinoflagellates predominate. Therefore, the maximum values of the phytoplankton community’s specific growth rate are about two times lower than in the preceding periods and do not exceed 1.10–1.40 day−1. There was also a decrease observed in the microzooplankton grazing rate, which, during the year, was no higher than 0.70–1.20 day−1. This is primarily conditioned by the increased role of large algae in phytoplankton, which means a decline in nutrition quality for microzooplankton. As a result of the joint influence of nutrition quality and water pollution, the relative share of net primary production consumed by microzooplankton in the warm periods of the year averaged only 32%, which is two times lower than the average values generally accepted for marine ecosystems. This means that the transfer of matter and energy from phytoplankton to higher trophic levels is significantly decreased.

1. Introduction

An assessment of the current state and possible evolution path of marine ecosystems within the conditions of global climate changes and constantly increasing anthropogenic pressures is one of the main ecological problems globally. Over the last century, due to climatic changes, seawater temperature has globally increased by approximately 1 °C [1]. From the middle of the 1990′s, within the surface layer of the Black Sea deep-water areas, temperature changes have been characterized by a positive trend [2]. As a result of temperature stratification increasing in the water column, nutrient supply from the depths to the photosynthesis zone gradually decreases [3]. The phytoplankton biomass, as well as the matter and energy flow from the phytoplankton to upper trophic levels, is, therefore, significantly lower than previously observed. In the coastal waters in the Crimean Peninsula area, the multiannual unidirectional positive trend in the water temperature of the surface layer has also been observed [4]. A gradual increase in the water temperature of the surface layer since the early 2000′s was detected in the coastal waters of the Black Sea near Sevastopol [5]. Studies are therefore directed at identifying changes occurring in the primary trophic links within the ecosystems of these water areas due to the warming effect and are considered to beextremely relevant. Moreover, aquatic organisms are exposed to the greatest anthropogenic impact within the coastal areas of the Black Sea. As a result of intensive human economic activity, a vast amount of various chemical compounds of organic and inorganic origin enters the coastal waters of the Black Sea near Sevastopol annually [6]. The water temperature of coastal surface waters has been increasingin this area since the beginning of the current century, and anthropogenic pollution, which has been rising in recent years, has caused changes in the structure and functioning of phytoplankton [5]. This circumstance should affect the functioning of microzooplankton, which in marine ecosystems, including the Black Sea, is the main consumer of primary phytoplankton production, and therefore plays a key role in the matter and energy transformation from phytoplankton to subsequent trophic levels [7,8].
The goal of this work is to study the seasonal dynamics of the phytoplankton growth rate and microzooplankton grazing under conditions of climatic change and anthropogenic pollution in the coastal waters of the Black Sea near Sevastopol.Achievement of the set tasks will contribute to a better understanding of thepatterns of coastal ecosystem transformations under conditions of climatic changes and anthropogenic pollution. It would alsosupport the organization of sustainable environmental management in the altered Black Sea ecosystem.

2. Materials and Methods

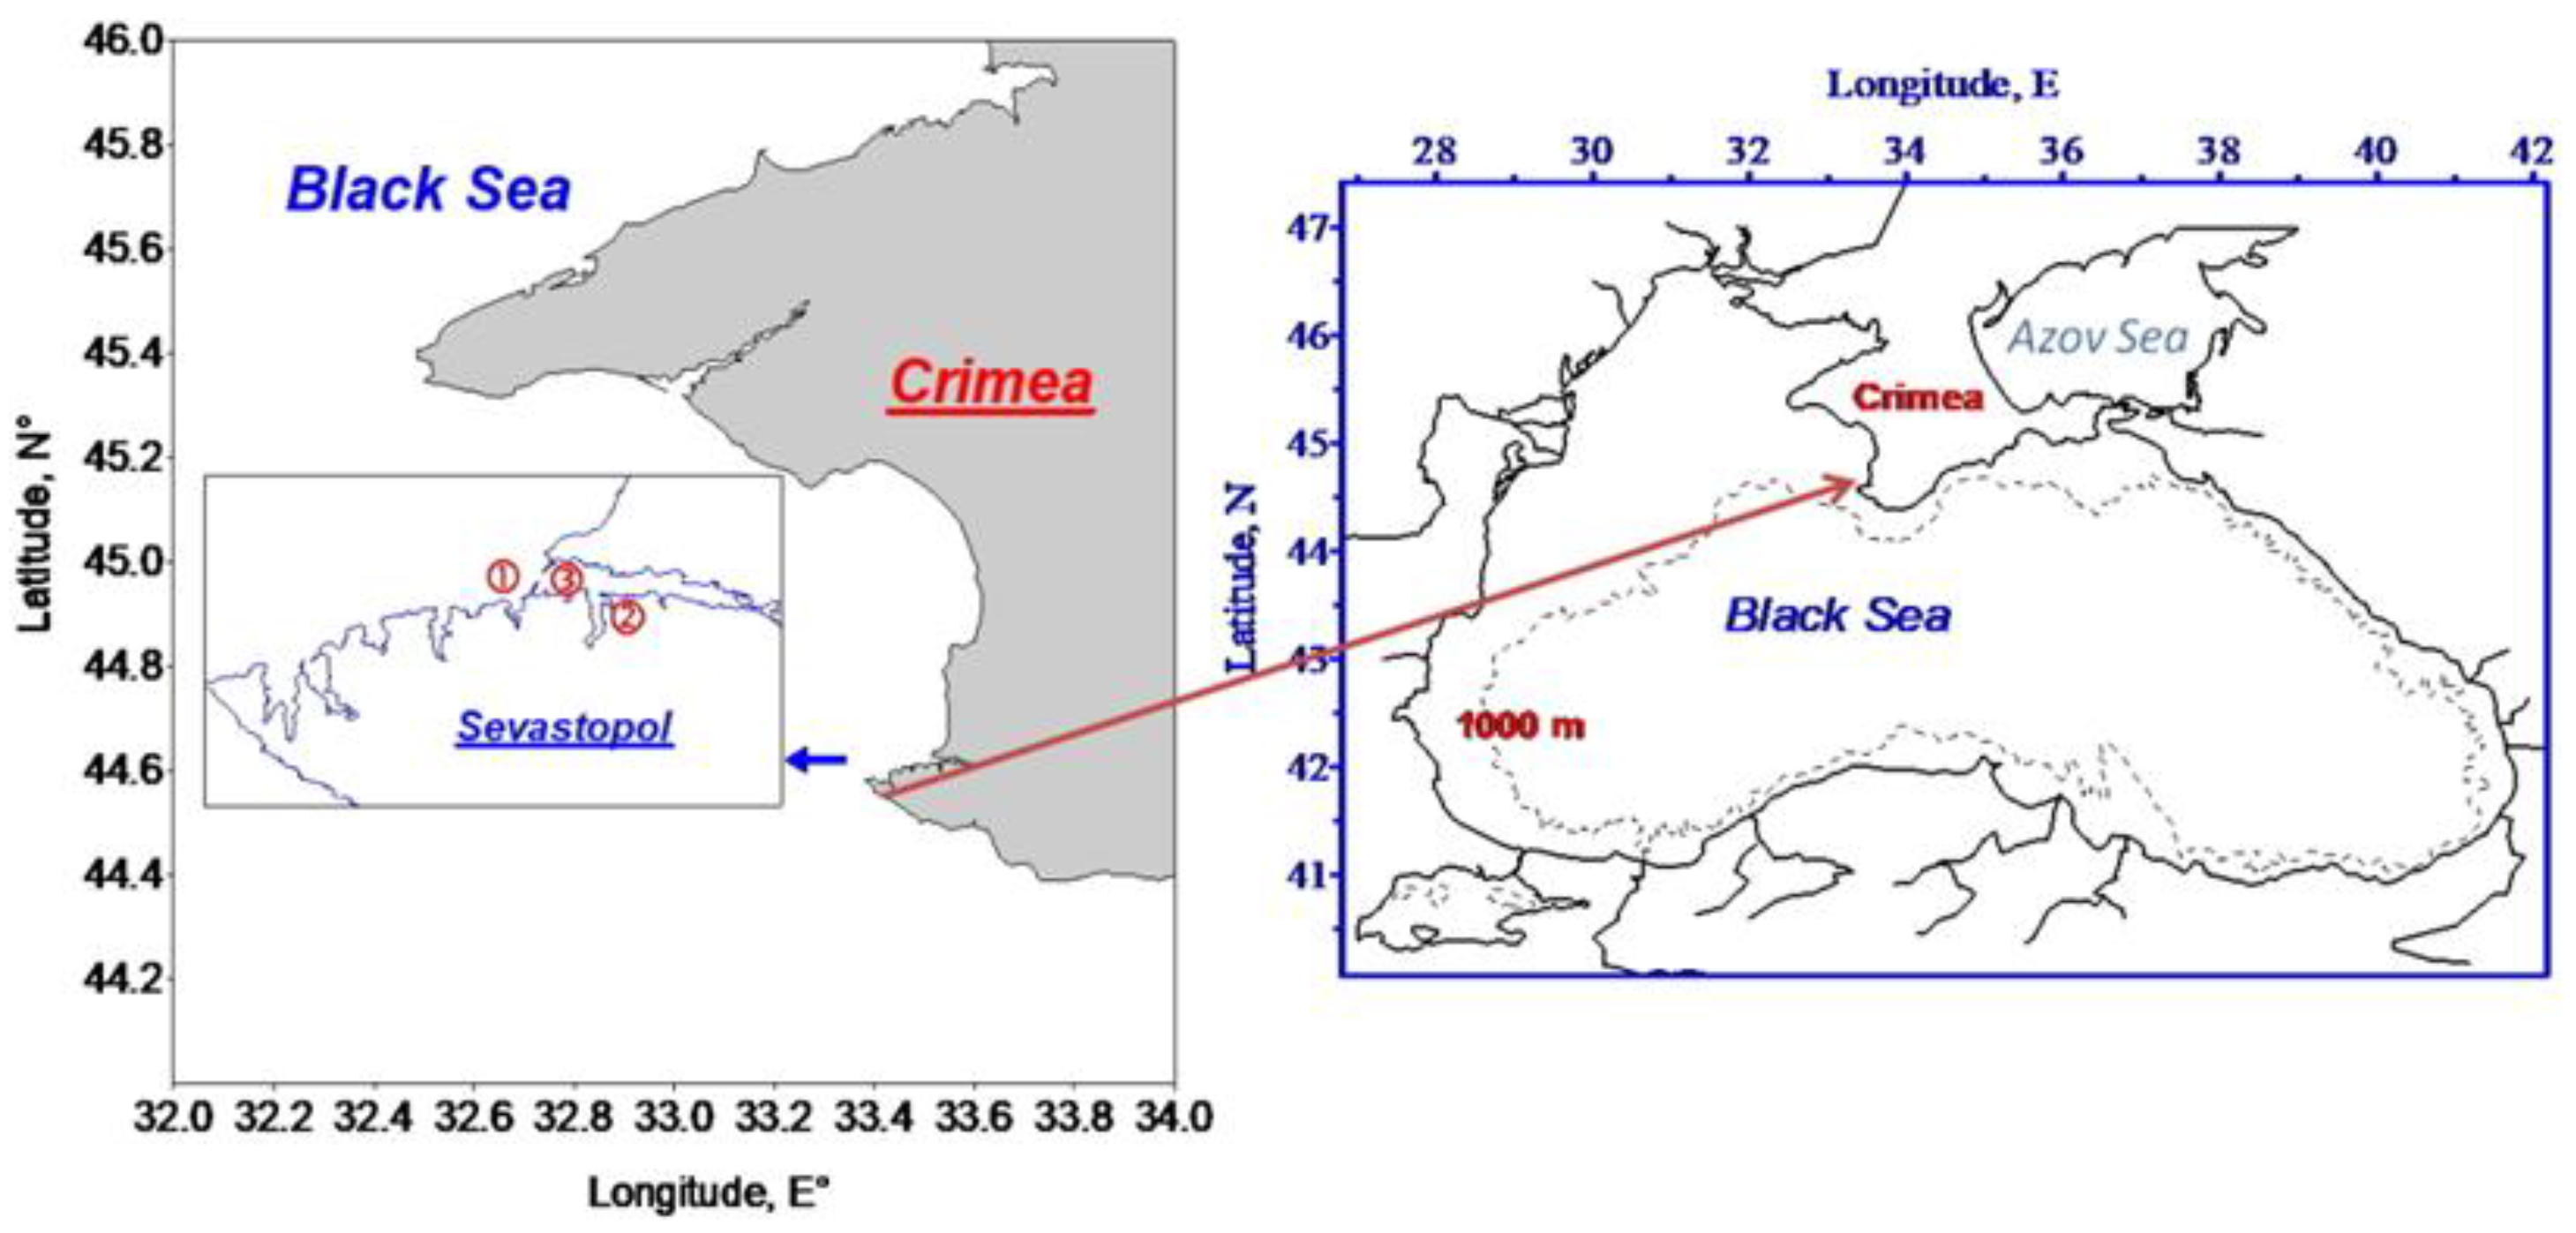
2.1. Study Area and Sampling

The study is based on the results of the authors’ research carried out during 2020 at three stations. The first station was located at the exit from Quarantine Bay (St. 1), the secondin Artillery Bay (St. 2) and the thirdwithin Sevastopol Bay (St. 3). The locations of the stations areshownin Figure 1. The total depth at the stations was 14–18 m. Water samples (8 L) were collected from the 0–0.5 m layer monthly using Niskin bottles.

2.2. Processing

For the determination of phytoplankton abundance, biomass and species composition, 2 L samples of seawater were concentrated using track membranes (1 μm pore size) in an inverse filtering funnel [9]. Samples were condensed to 50 mLsamples and fixed with neutralized 40% formaldehyde (final concentration in the sample1%). After that, for at least 24 h, the abundance and linear dimensions of algae cells were determined in a 0.1 mLdrop, placed into a Naujotte counting chamber, with three replications under a light microscope Carl Zeiss Primo Star (Göttingen, Germany). Linear dimensions were converted to cell volume using appropriately applicable geometric formulas [10]. Phytoplankton species identification was carried out using the manual of [11].
The phytoplankton growth rate and microzooplankton grazing were determined by the dilution method [12] with daily increases of chlorophyll a concentrations (Chla) in experimental bottles. Surface seawater was collected and pre-screened with 200 μm nylon netting for dilution experiments at each station. Particle-free seawater was obtained by filtering the seawater through a filter with a pore size of 0.22 μm. All four dilutions of the original sample in two repeats were used (0.2; 0.4; 0.8; 1.0).After preparation, the samples were poured into 1 L polycarbonate bottles rinsed with 10% hydrochloric acid and distilled water and placed for daily exposition in situ. No additional amount of nutrients was added to the experimental bottles. Initial samples, and the samples after daily exposition, were filtered through Whatman GF/F fiberglass filters (47 mm in diameter).After filtration, the filters were placed into 90% acetone. As soon as pigments were extracted, chlorophyll a was measured using fluorometric methods and calculated according to the equation presented in the work [13].
The phytoplankton growth rate was calculated from the chlorophyll a daily increase observed in experimental flasks. Apparent growth rate, μ(ap.), for each dilution was evaluated by the equation:
μ(ap.) = ln (Chl(t)/Chl(0))
where Chl(0) and Chl(t) are the initial and final concentrations of chlorophyll a. Values of μ(ap.) were determined for each dilution individually; later, computation of linear regression equations linking apparent and actual growth rates (μ(ap.) and μ, correspondingly) of microalgae and the rate of grazing by microzooplankton (g) was calculated as:
μ(ap.) = μ g·DF
where DF is the dilution factor. The coefficient of determination (R2) for linear regression equations in the experiment ranged from 0.87 to 0.96. Reliability of the regression equation was assessed by F-criterion (Fischer criterion) and reliability of equationcoefficientsby t-criterion (Student criterion). Parameters used in Equation 2 represent the actual growth rate (μ) of phytoplankton and specific rate of phytoplankton consumption by microzooplankton (g) and showed standard errors ranging from 5 to 15%.
The nutrient concentrations in the water were determined using the methods described in [14]. For example, to determine phosphorus, the Morphey-Riley method was used with ascorbic acid as a reducing agent. Determination of nitrite was carried out by the method of Bendschneider and Robinson [14] with sulfonamide in a solution of 1.2 N hydrochloric acid and N-(1-naphthyl)ethylenediamine. The determination of nitrate is based on the reduction of nitrate to nitrite using copper-plated cadmium. Disodium EDTA salt (Trilon B) was used as a complexing agent. The Koroleff method was used for the determination of silicate in seawater, which is based on colorimetry of a blue silicon-molybdenum complex. Ammonium nitrogen was determined by the Grasshoff-Johanssen method, which is based on the reaction of ammonium in an alkaline solution with an excess of 1,3-dichloroisocyanuric acid (trione), resulting in monochloroamine. The latter, in phenolic and nitroprusside solution, yields indophenol blue. The assessment of the dissolved organic matter content in water was carried out using the permanganate oxidizability method [15]. To estimate the overall environmental status of seawater, its trophic index (TRIX) values were calculated using the following formula [16]:
TRIX   =   log ( 1.5 [ Chl a ] [ 100   % O 2 ]   [ P tot . ]   [ N in ] ) / 1.2
where [Chla] is the concentrationof chlorophyll a in μg·L−1, [100 − %O2] is the absolute value of the residual of the dissolved oxygen saturation from 100%, [Ptot.] is the total phosphorus concentration in μg·L−1 and [Nin] is the dissolved inorganic nitrogen concentration in μg·L−1.

2.3. Data Analysis

Statistical treatment of the data was carried out using the software MS Excel 2007 and Sigma Plot 12.5 for Windows. In MS Excel 2007, we calculated average values, standard deviation (SD), standard error (SE), determination coefficient (R2) and parameters of the regression equation. The evaluation of the significance of differences was made using aStudent’s t-test, with anormality test in the program Sigma Plot 12.5 beforehand. The graphs were built using the Grafer 7 program. Map construction was carried out using the program Surfer 8.

3. Results

At Station 1, located at the Quarantine Bay’s exit, phytoplankton-specific growth rates changed almost five times during the year (Figure 2a). The highest values of this parameter (0.70–1.10 day−1) were observed in the spring and summer periods (from March to August) at a water temperature between 9.0 and 24.4 °C (Figure 2b).
During these time-spans, the main phytoplankton biomass consisted of various species of diatoms (Table 1).
Among them, during March–June, several smaller species of Skeletonema sp., Pseudo-nitzschia sp. and C. affinis, as well as a large species, such as Thalassiosira sp., primarily dominated. In July–August, the exceptionally large species P. calcar-avis and P. alata prevailed.
The second most important group of algae was dinoflagellates, among which P. cordatum, S. trochoidea, G. variabile and G. spinifera dominated most often. Among other species, the small coccolithophorid E. huxleyi was predominantly represented; however, its contribution to the total phytoplankton biomass was usually insignificant. None of the algae species listed above caused a bloom.
The microzooplankton grazing rate of phytoplankton at Station 1 in the spring-summer period was significantly lower than the specific rate of algae growth (0–0.70 day−1). The nitrate and silicate concentrations in water varied from 1 to 5 µM, and concentrations of phosphatefrom 0.04 to 0.27 µM (Figure 2c). This contributed to a gradual increase in phytoplankton biomass, which reached maximum values (200–210 mg C·m−3) in summer (Figure 2b), whereas the highest concentration of chlorophyll a (1.7–2.8 mg·m−3) was detected earlier (from February to April).
During the autumn-winter period, the phytoplankton growth rate and its biomass decreased. At the same time, among the algae, in most cases, either the largest species of diatoms P. calcar-avis, P. alata or dinoflagellates P. micans, P. cordatum, G. agile, C. furca, L. polyedrum, prevailed. As a result, from September to December, the average cell volume of the phytoplankton community was in the range of 4700–10,500 µm3, while in the spring-summer period, it was significantly lower 700–4500 µm3 (Figure 2a). An increase in the volume of phytoplankton cells in the autumn-winter period contributed to a microzooplankton grazing rate decrease, which was 0–0.50 day−1.
At Station 2, located in Artillery Bay, the phytoplankton specific growth rate changed during the year from 0.10 to 1.15 day−1 (Figure 3a). The highest values of this parameter (1.00–1.15 day−1) were observed in March, June and August at a water temperature of 9, 20 and 25 °C, respectively (Figure 3b). During March, the main phytoplankton biomass consisted of small diatom species (Table 2) and among them were Skeletonema sp., Pseudo-nitzschia sp. and C.insignis, while during August, the large species P. calcar-avis and P. alata were observed. At the same time, in June, small dinoflagellates species prevailed, among which P. cordatum, G. variabile and G. simplex were most frequently observed.
During this period, diatoms were the second most significant group of algae, among which Thalassiosira sp., C. affinisand C. curvisetus dominated. As a result, the average volume of phytoplankton cells in March was minimal and composed 900 µm3, and in June, it increased to 1300 µm3, while during August, it reached 9800 µm3 (Figure 3a).
The nitrate concentrations during the periods of the most intensive algae growth varied from 1.1 to 4.0 µM, silicate concentrationsfrom 3.2 to 4.5 µM and phosphate concentrationsfrom 0.02 to 0.60 µM (Figure 3c). At the same time, the nitrate and silicate concentrations were always observed to be at least 1.0 µM during the year.
The specific rate of phytoplankton grazing by microzooplankton at Station 2 reached its maximum values several times during the year, namely March, June and September. However, during March, the maximum value of this parameter was equal to the specific phytoplankton growth rate. During this period, therefore, the phytoplankton biomass was relatively insignificant and constituted only 80 mg C m−3 (Figure 3b), whereas, during June and September, the microzooplankton grazing was significantly lower than the phytoplankton growth rate, composing 0.45 and 0.58 day−1, respectively. This contributed to an increase in phytoplankton biomass, which, in August–October, reached the highest values (400–550 mg C m−3) due to the large diatom species development (Table 2).
During the same period, the chlorophyll a concentration was also maximal (3.0–4.7 mg m−3). It was noted that already in October, the phytoplankton growth rate began to decrease, and in December, it was minimal (0.10 day−1), which is primarily due to the cooling of surface waters.
At Station 3, located in Sevastopol Bay, during the year, the phytoplankton growth rate changed from 0.20 to 1.30 day−1 (Figure 4a). The maximum values (1.20–1.30 day−1) were observed in May and in August at a water temperature of 16 and 25 °C, respectively (Figure 4b). The main phytoplankton biomass consisted of diatoms.
During May, the small species Pseudo-nitzchia sp., C. affinis and the medium-sized species D. fragilissimus were observed among them. In August, the exceptionally large species, P. calcar-avis and P. alata, dominated. As a result, the average volume of phytoplankton cells in May was 1400 µm3, and in August, it reached 16,000 µm3 (Figure 4a). The nitrate and silicate concentrations in these periods were over 3 µM, and the phosphate concentrations were over 0.05 µM (Figure 4c), which provided the maximum algae growth.
The microzooplankton grazing at Station 3 reached its maximum values several times during the year, namely in April, July and October. It was also noted that in April, the value of this parameter (1.20 day−1) significantly exceeded the phytoplankton growth rate. Therefore, during this period, the phytoplankton biomass was relatively insignificant and constituted only 70 mg C m−3 (Figure 4b). Whereas, from May to October, the microzooplankton grazing was significantly lower than the phytoplankton growth rate and was in the range of 0.25–1.0 day−1. This supported the gradual increase in phytoplankton biomass, which was maximal in the autumn period (313–374 mg C m−3) due to the development of the predominantly large diatom species P. calcar-avis and P. alata (Table 3). During the same period, the chlorophyll a concentration was also maximal (2.44–2.88 mg m−3). As early as September, the phytoplankton growth rate began to decrease, and in December, it was only 0.33 day−1, which led to a decrease in the phytoplankton biomass to 60 mg C·m−3. During that time, the water temperature was two times lower than in July, and the average volume of phytoplankton cells reached the maximum values for the entire observation period, 27,000 µm3.
In the studied waters, the permanganate oxidizability at Station 1 changed from 2.63 to 4.74 mg O·L−1 (Figure 2d), at Station 2 from 0.66 to 6.52 mg O·L−1 (Figure 3d) and at Station 3 from 2.10 to 6.01 mg O·L−1 throughout a year (Figure 4d).
All data obtained during 2020 were divided into two groups. The first group included the results for the warm period, from May to October, when the water temperature was in the range of 16 to 25 °C, which averaged 21.9 °C (Table 4).The second group represented the data, obtained from November to April when the water temperature was lower than 16 °C, and its average value was 11.1 °C. Statistical analysis indicated that the average values of phytoplankton biomass, chlorophyll a concentration, net primary production as well as the phytoplankton growth rate in the warm period of the year were significantly higher than in the cold one (at p < 0.05). While the average microzooplankton grazing and the average share of primary production grazed by microzooplankton were significantly lower for the warm period (at p < 0.05).
At the same time, average values of almost all hydrochemical parameters, including permanganate oxidability and TRIX index, did not significantly differ between the periods (p > 0.05). The exception was ammonium, the concentration of which was two times higher in the warm period of the year than in the cold one.The assessment of the surface water quality carried out using the TRIX index indicated that this index varied from 1.93 to 3.85 during the cold period and averaged 2.87. During the warm period, it was in the range of 1.13 to 4.73, which averaged 3.06 (Table 4).
For the warm period, a regressive dependence was ascertained between the microzooplankton grazing and permanganate oxidizability, reflecting the amount of dissolved organicmatter in the water (Figure 5).Therefore, while water organic matter increases, the rate of phytoplankton consumption by microzooplankton decreases.
Based on the value of the determination coefficient, it can be concluded that more than 30% of the grazing rate variability in the warm period is caused by the different concentrations of dissolved organic matter in the water. Statistical analysis confirmed the reliability of the obtained dependence: the F-criterion was 7.80 at p = 0.013, the coefficient of the equation is significant at p = 0.013. During the cold period, such dependency was not observed. As for the growth rate, there was no regression dependency between this parameter and oxidizability.However, for the warm period, it was determined that with an average permanganate oxidizability value of 2.80 mg O·L−1 (ranging from 0.66 to 3.53 mg O·L−1), the value of the phytoplankton growth rate was 0.92 day−1. With an average oxidizability value of 4.36 mg O·L−1 (range 3.85–6.01 mg O·L−1), the average value of the phytoplankton growth rate decreased to 0.64 day−1. Statistical analysis confirmed the significance of the differences in the obtained average values of the growth rate (criterion t = 2.48 with a critical value of 2.14).

4. Discussion

The current stage of development of the Black Sea coastal water ecosystem is affected by growing anthropogenic pollution in addition to climatic changes. Since the beginning of the 2000′s, a positive temperature trend has been observed in the surface layer of the coastal waters of the Black Sea near Sevastopol. Here, during 2020, the water temperature was higher than in 2000–2004. In the winter and spring periods, these differences were about 1 °C, and in the summer and autumn periods, they increased to 2 °C. At the same time, in 2020, the concentration of nitrates, ammonium and silicon reached the highest values in recent years [5]. This was due to the increased inflow of nutrients into the sea within urban wastewater, river runoff and mainland runoff [6,17]. It is no coincidence that in 2020, the highest values of phytoplankton biomass and chlorophyll a concentrations were obtained compared to the past few years, although the quality of the studied waters, according to the eutrophication index (TRIX), has not changed. As stated earlier [18], the value of this index is currently, as a rule, below four, which may indicate low trophic levelsin the studied waters.
Water pollution by dissolved organic matter also increased, as proved by the permanganate oxidizability value, which was in the range from 1 to 3 mg O·L−1 in the studied waters until 2004 [19]; thus, in 2020, this parameter was significantly higher and in some cases reached 6.01–6.52 mg O·L−1. Along with traditional toxicants discharged into the sea (oil, heavy metals, various kinds of technogenic products), various kinds of artificial polymers enter the marine environment. As a result of the joint action of temperature and the growing water pollution in recent years [20], significant changes have occurred in the phytoplankton of the studied areas of the Black Sea and among the diatoms that generate the main phytoplankton biomass in the studied area; there is not a single species that would cause a weak water bloom. At the end of the last century, however, and at the beginning of the current one, the smallest diatom species of the genus Chaetoceros with a cell volume of 150–200 µm3 regularly caused weak water bloom in late spring or early summer as well as in autumn. This phenomenon did not cause deterioration in water quality and provided food for microzooplankton.During these periods, the specific growth rate of phytoplankton reached the highest values, constituting 2.50–2.75 day−1, the microzooplankton grazingrate reached 1.60–1.80 day−1 [8]. In addition, at the end of winter, water bloom regularly occurred, caused by the intensive growth of the small diatom Skeletonema sp., and at the beginning of summer, the small coccolithophorid E. huxleyi developed intensively and reached the bloom level [5,8]. Currently, these representatives are found rarely among the dominant species. As a result, the maximum values of phytoplankton biomass are observed as a rule in late summer and early autumn, when the majority of phytoplankton is constituted of large diatom species. One of the possible reasons for such alterations in phytoplankton is the reduction of the water mass dynamic activity in late winter, spring and autumn due to an increase in water temperature. This probably led to a decrease in the number of small algae resting cysts entering the photosynthetic zone from the underlying layers during the mixing of water masses. The indirect negative effect of high temperatures on small diatom species in late spring, as well as in early summer and autumn, is also due to discharging a large amount of organic forms of nitrogen with household effluents in the bays, which in the transformation process produce ammonium. Its content in the Sevastopol region waters during the warm period of the year is about two times higher than in the cold period. It has been established that this nitrogen compound, even at low concentrations, can inhibit the nitrate uptake by microalgae. This is especially characteristic of small diatom species since half-inhibition constants of the nitrate uptake rate by ammonium are lower for them than for large species [21]. Therefore, large diatom species are more competitive in these conditions than smaller species. They develop well in summer and early autumn on nitrates, providing the main increase in phytoplankton biomass and primary production in the warm season. The predominance of large species of diatoms is the main reason for the low values of the phytoplankton specific growth rate, even during periods of their intensive development. In 2020, the phytoplankton-specific growth rate of the studied waters in their maximums was 2–3 times lower than in 2006–2007, when there was an intense spring and autumn bloom of small diatom species, genus Chaetoceros [5,8]. During their bloom periods, the average volume of phytoplankton cells was 150–200 µm3, while during 2020, this parameter was not lower than 700–900 µm3. Although, during the period of most intensive development of large diatom species, P. calcar-avis and P. alata increased by an order of magnitude.
It is also possible that the high summer water temperature, which has increased by several degrees in recent years, provides a direct negative effect on diatoms. This is probably conditioned by the fact that when the maximum growth temperature (23–25 °C) is exceeded, it causes the degradation of their representatives, particularly Skeletonema sp. and C. curvisetus. For dinoflagellates, this parameter is 4–6 °C higher [22]. However, some diatom species isolated from the Black Sea plankton (e.g., Thalassiosira weissflogii (Grunow) G.Fryxell & Hasle and Cylindrotheca closterium (Ehrenberg) Reimann & J.C. Lewin do not differ from dinoflagellates by their temperature resistance [22]. It is perhaps due to this reason that the previously dominating diatoms, for example, representatives of the genus Chaetoceros, were found in small amounts in the researched bays during the summer period. At the same time, other species, such as P. calcar-avis and P. alata, began to prevail, which may indicate a high degree of temperature resistance. These species also probably have a high resistance to pollution, which is due to the low values of their specific surface area (0.20–0.30 µm−1).
It is known that in marine ecosystems, the main consumer of primary phytoplankton production is microzooplankton, which consumes on average 65% of the annual primary production [7,8]. However, in the coastal waters of the Black Sea near Sevastopol in 2020, changes in the species composition of phytoplankton and increased water pollution with anthropogenic origin substances caused a sharp decrease in the primary production share consumed by microzooplankton. In the warm period of the year, when the main biomass and primary production of phytoplankton are formed, this value was two times lower than the generally accepted values. The main reason for this decrease is, in our opinion, the deterioration in the nutrition quality for microzooplankton, which prefers to consume small algae species [8,23,24]. Whereas larges species, including P. calcar-avis and P. alata, are not consumed [8], which contributes to the accumulation of their biomass in the coastal waters of the Sevastopol region.According to our data, large phytoplankton prevailed in the studied waters during the warm period of the year, the average cell volume of which was in the range from 4000 to 27,000 µm3. The second, according to its significance factor, is water pollution. It is observed that in the warm period, as the proportion of dissolved organic substances in the water increases, the microzooplankton grazing decreases. As a result, the transfer of matter and energy from phytoplankton to higher trophic levels decreased, and the non-consumed cells of large diatom species will die off and undergo subsequent mineralization.

5. Conclusions

Summarizing the above, we can conclude that in 2020, as a result of temperature increase and growing anthropogenic water pollution, a significant restructuring of the species composition and size structure of phytoplankton occurred in the studied areas of the Black Sea. Weak blooms of small diatom species Skeletonema sp., C. socialis as well as coccolithophorids E. huxleyi, which were previously observed regularly, have not been identified at the present time. The main phytoplankton biomass was formed during the warm season. Among the dominant species were predominantly large diatoms P. calcar-avis and P. alata, which probably have a high resistance to elevated temperatures and increased anthropogenic pollution and are not consumed by microzooplankton. As a result, during the warm period, the maximum values of the phytoplankton specific growth rate, microzooplankton grazing and the proportion of net primary production consumed by microzooplankton decreased by about two times, compared to the values of these parameters obtained in 2006–2007. It can be assumed that if the positive temperature trend continues and the anthropogenic impact increases, the contribution of small diatom species to the total phytoplankton biomass will continue to decrease. This will lead to a further decrease in the share of primary production transformed by microzooplankton from phytoplankton to higher trophic levels, and the number of dying large algae cells settling to the bottom will increase.

Author Contributions

Conceptualization, L.S.; methodology, L.S.; field investigation and sampling, L.S. and N.K.; data formal analysis, L.S.; writing—original draft and text, L.S. All authors have read and agreed to the published version of the manuscript.

Funding

Sample processing, data analysis, and this manuscript writing was supported by the RFBR and Sevastopol, project No. 20-45-920002 “Adaptation strategies for phytoplankton and its consumption by microzooplankton under the influence of climatic changes and anthropogenic pressure on the coastal ecosystems of the Black Sea (Sevastopol region)” and, also within the framework of the state assignment of A.O. Kovalevsky Institute of Biology of the Southern Seas of RAS No. 121041400077-1 (“Functional, metabolic and toxicological aspects of the existence of aquatic organizations and their populations in habitats with different physical and chemical regime”).

Institutional Review Board Statement

Not applicable.

Informed Consent Statement

Not applicable.

Data Availability Statement

All data used in this study are available upon request from the corresponding author.

Acknowledgments

The authors are grateful to Irina Babich and Natalia Minina for their help in conducting a field study and obtaining data on chlorophyll concentration, phytoplankton biomass and species composition of algae.

Conflicts of Interest

The authors declare no conflict of interest.

References

  1. Häder, D.-P.; Gao, K. Interactions of anthropogenic stress factors on marine phytoplankton. Front. Environ. Sci. 2015, 3, 1–14. [Google Scholar] [CrossRef] [Green Version]
  2. Oguz, T.; Gilbert, D. Abrupt transitions of the top-down controlled Black Sea pelagic ecosystem during 1960–2000: Evidence for regime-shifts under strong fishery exploitation and nutrient enrichment modulated by climate-induced variations. Deep Sea Res. I 2007, 54, 220–242. [Google Scholar] [CrossRef]
  3. Mikaelyan, A.S.; Kubryakov, A.A.; Silkin, V.A.; Pautova, L.A.; Chasovnikov, V.K. Regional climate and patterns of phytoplankton annual succession in the open waters of the Black Sea. Deep Sea Res. I 2018, 142, 44–57. [Google Scholar] [CrossRef]
  4. Repetin, L.N. Spatial and temporal variability of the temperature regime of the Black Sea coastal zone. Environ. Saf. Coast. Shelf Zones Integr. Use Shelf Resour. 2012, 26, 99–116. (In Russian) [Google Scholar]
  5. Stelmakh, L.; Kovrigina, N.; Gorbunova, T. Phytoplankton adaptation strategies under the influence of climatic changes and anthropogenic pressure on the Black Sea coastal ecosystems on the example Sevastopol Bay. Ecol. Monten. 2020, 37, 34–42. [Google Scholar] [CrossRef]
  6. Orekhova, N.A.; Varenik, A.V. Current Hydrochemical Regime of the Sevastopol Bay. Phys. Oceanogr. 2018, 25, 124–135. [Google Scholar] [CrossRef] [Green Version]
  7. Schmoker, C.; Hernandes-Leon, S.; Calbet, A. Microzooplankton grazing in the oceans: Impacts, data variability, knowledge gaps and future directions. J. Plankton Res. 2013, 35, 691–706. [Google Scholar] [CrossRef]
  8. Stelmakh, L.V.; Georgieva, E.Y. Microzooplankton: The trophic role and involvement in the phytoplankton loss and bloom-formation in the Black Sea. Turk. J. Fish. Aquat. Sci. 2014, 14, 955–964. [Google Scholar] [CrossRef]
  9. Sorokin, Y.I.; Sukhanova, I.N.; Konovalova, G.V. The primary production and the phytoplankton of the equatorial divergence area in the eastern Pacific Ocean. Proc. Inst. Oceanol. Ac. Sci. USSR 1975, 102, 108–122. (In Russian) [Google Scholar]
  10. Bryantzeva, Y.; Liah, A.M.; Sergeeva, A.V. Estimation of Biovolume and Surface Area of Black Sea UnicelularAlagae; IBSS: Sevastopol, Ukraine, 2005; 25p. (In Russian) [Google Scholar]
  11. Tomas, C.R. Identifying Marine Diatoms and Dinoflagellates; Academic Press: New York, NY, USA, 1997; 858p. [Google Scholar]
  12. Landry, M.R.; Hassett, R.P. Estimating the Grazing Impact of Marine Micro-Zooplankton. Mar. Biol. 1982, 67, 283–288. [Google Scholar] [CrossRef]
  13. JGOFS Protocols. Protocols for the Joint Global Ocean Flux Study (JGOFS) Core Measurements. Manual and Guides; UNESCO: Paris, France, 1994; Volume 29. [Google Scholar] [CrossRef]
  14. Grasshoff, K.; Kremling, K.; Ehrhardt, M. Methods of Seawater Analysis, 3rd ed.; Wiley-VCH: Weinheim, Germany, 1999; 600p. [Google Scholar] [CrossRef]
  15. Skopintsev, B.A. Formation of the Modern Chemical Composition of the Black Sea Waters; Gidrometeoizdat: Leningrad, Russia, 1975; 336p. (In Russian) [Google Scholar]
  16. Vollenweider, R.A.; Giovanardi, F.; Montanari, G.; Rinaldi, A. Characterization of the trophic conditions of marine coastal waters with special reference to the NW Adriatic Sea: Proposal for a trophic scale, turbidity and generalized water quality index. Environmetrics 1998, 9, 329–357. [Google Scholar] [CrossRef]
  17. Sovga, E.E.; Mezenceva, I.V.; Hmara, T.V.; Slepchuk, K.A. On the prospects and possibilities of assessing the self-cleaning ability of the water area of Sevastopol Bay. Environ. Saf. Coast. Shelf Zones Integr. Use Shelf Resour. 2014, 28, 153–164. (In Russian) [Google Scholar]
  18. Gubanov, V.I.; Stelmakh, L.V.; Klimenko, N.P. Complex assessments of the water quality of the Sevastopol seaside (Black Sea). Ecol. Sea 2002, 62, 76–80. (In Russian) [Google Scholar]
  19. Kuftarkova, E.A.; Kovrigina, N.P.; Rodionova, N.Y.; Bobko, N.I. Hydrochemical characteristics of the coastal waters of the Crimean peninsula. In Mariculture of Mussels in the Black Sea; Ivanov, V.A., Ed.; ECOSI-Hydrophysica: Sevastopol, Ukraine, 2007; pp. 74–93. (In Russian) [Google Scholar]
  20. Gruzinov, V.M.; Dyakov, N.N.; Mezenceva, I.V.; Malchenko, Y.A.; Zhonova, N.V.; Korshenko, A.N. Sources of coastal waterpollution near Sevastopol. Oceanology 2019, 59, 523–532. [Google Scholar] [CrossRef]
  21. Lomas, M.W.; Glibert, P.M. Interactions between NH+4 and NO3 uptake and assimilation: Comparison of diatoms and dinoflagellates at several growth temperatures. Mar. Biol. 1999, 133, 541–551. [Google Scholar] [CrossRef]
  22. Akimov, A.I.; Solomonova, E.S. Characteristics of growth and fluorescence of certain types of algae during acclimation to different temperatures under culture conditions. Oceanology 2019, 59, 316–326. [Google Scholar] [CrossRef]
  23. Sherr, E.B.; Sherr, B.F. Heterotrophic dinoflagellates: A significant component of microzooplankton biomass and major grazers of diatoms in the sea. Mar. Ecol. Prog. Ser. 2007, 352, 187–197. [Google Scholar] [CrossRef] [Green Version]
  24. Strom, S.L.; Brainard, M.A.; Holmes, J.L.; Olson, L.B. Phytoplankton blooms are strongly impacted by microzooplankton grazing in coastal North Pacific waters. Mar. Biol. 2001, 138, 355–368. [Google Scholar] [CrossRef]
Figure 1. Sampling stations in the coastal waters of the Black Sea near Sevastopol. 1.the exit from Quarantine Bay; 2.Artillery Bay; 3.Sevastopol Bay.
Water 13 03230 g001
Figure 2. Seasonal variability: (a) phytoplankton growth rate (1), microzooplankton grazing (2) and average phytoplankton cell volume (3); (b) chlorophyll a concentration (1), phytoplankton biomass (2), water temperature (3); (c) nitrate (1), silicate (2), phosphate (3); (d) the permanganate oxidizability (1) in Station 1.
Water 13 03230 g002
Figure 3. Seasonal variability: (a) phytoplankton growth rate (1), microzooplankton grazing (2) and average phytoplankton cell volume (3); (b) chlorophyll a concentration (1), phytoplankton biomass (2), water temperature (3); (c) nitrate (1), silicate (2), phosphate (3); (d) the permanganate oxidizability (1) in Station 2.
Water 13 03230 g003
Figure 4. Seasonal variability: (a) phytoplankton growth rate (1), microzooplankton grazing (2) and average phytoplankton cell volume (3); (b)chlorophyll a concentration (1), phytoplankton biomass (2), water temperature (3); (c)nitrate (1), silicate (2), phosphate (3); (d)the permanganate oxidizability (1) in Station 3.
Water 13 03230 g004
Figure 5. Relationship between permanganate oxidizability (Oxid.) and microzooplankton grazing (g) in the warm period.
Water 13 03230 g005
Table 1. Relative biomass (B) and dominant species of diatoms (Bacillariophyceae) and dinoflagellates (Dinophyceae) in the phytoplankton of Station 1 in 2020.
MonthBacillariophyceaeDinophyceaeOther
B, %Dominant SpeciesB, %Dominant SpeciesB, %
January8.4Skeletonema sp. Dactyliosolen fragilissimus (Bergon) Hasle63.8Gymnodinium agile Kofoid & Swezy,
Prorocentrum micans Ehrenberg,
Protoceratium reticulatum(Claparède andLachmann) Bütschli
27.8
February70.0Pseudo-nitzschia sp.,
Chaetoceros curvisetus Cleve
21.5Prorocentrum cordatum (Ostenfeld) J.D.Dodge, P. micans, Prorocentrum scutellum Schröder8.5
March78.5Skeletonema sp.,
Pseudo-nitzchia sp., C. curvisetus
20.7Gonyaulax spinifera (Claparède andLachmann) Diesing, P. cordatum0.8
April97.0Striatella unipunctata(Lyngbye) C.Agardh,
Chaetoceros compressus Lauder,
Licmophora abbreviate C.Agardh
2.6Prorocentrum compressum (Bailey) T.H.Abé ex J.D.Dodge0.4
May45.0Proboscia alata(Brightwell) Sundström, Pseudo-nitzchia sp.15.8Gymnodinium variabile E.C.Herdman,
G. spinifera
39.2
June61.1Thalassiosira sp., Chaetoceros affinis Lauder, C. curvisetus37.6Kryptoperidinium foliaceum (F.Stein) Lindemann, G. variabile1.3
July65.4Pseudosolenia calcar-avis(Schultze) B.G.Sundström, P. alata31.0Scrippsiella trochoidea(F.Stein) A.R. Loeblich III, Gymnodinium sp.3.6
August52.0P. calcar-avis, P. alata44.0P. cordatum, Ceratium furca (Ehrenberg) Claparède andLachmann4.0
September87.0P. calcar-avis, P. alata11.0Gymnodinium wulffii J.Schiller
Gymnodinium simplex
2.0
October96.5P. calcar-avis, P. alata3.5G. simplex, Gymnodinium sp.0.0
November46.0P. calcar-avis, C. curvisetus53.0C. furca, Lingulodinium polyedrum (Stein) Dodge1.0
December24.8C. affinis, Nitzschia sigma (Kützing) W.Smith74.6P. micans, P. cordatum0.6
Table 2. Relative biomass (B) and dominant species of diatoms (Bacillariophyceae) and dinoflagellates (Dinophyceae) in the phytoplankton of Station 2 in 2020.
MonthBacillariophyceaeDinophyceaeOther
B, %Dominant SpeciesB, %Dominant SpeciesB, %
January70.2Skeletonema sp., Licmophora sp.29.6S. trochoidea, P. micans0.2
February82.0Skeletonema sp., Pseudo-nitzschia sp., C. curvisetus0-18.0
March71.9Pseudonitzchia sp., Chaetoceros insignis Müller Melchers, Skeletonema sp.27.9S. trochoidea, Gymnodinium sp.0.3
April35.9P. alata, C insignis, Chaetoceros socialis H.S.Lauder63.2G. spinifera, G. agile0.9
May78.9Pseudo-nitzchia sp., D. fragilissimus, C. affinis15.6P. micans, P. cordatum, S. trochoidea5.5
June41.5Thalassiosira sp, C. affinis, C. curvisetus56.4P. cordatum, G. variabile, G. simplex2.1
July73.9P. calcar-avis, P. alata25.2P. micans, Glenodinium pilula (Ostenfeld) J.Schiller0.9
August94.0P. calcar-avis, P. alata5.7P. micans, P. compressum0.2
September67.1P. calcar-avis, P. alata32.6P. micans, P. compressum0.3
October93.2P. calcar-avis, P. alata6.6P. micans, P. cordatum0.1
November19.0C. affinis, Entomoneis paludosa (W.Smith) Reimer80.9Goniaulax poligramma Stein, C. furca, C. fusus0.1
December51.0P. calcar-avis, P. alata37.2P. micans, P. cordatum11.8
Table 3. Relative biomass (B) and dominant species of diatoms (Bacillariophyceae) and dinoflagellates (Dinophyceae) in the phytoplankton of Station 3 in 2020.
MonthBacillariophyceaeDinophyceaeOther
B, %Dominant SpeciesB, %Dominant SpeciesB, %
January41.5Thalassionema nitzschoides (Grunow) Mereschkowsky, P. calcar-avis, Skeletonema sp.,45.6G. variabile, Gymnodinium sp.12.9
February62.4Skeletonema sp., Pseudo-nitzchia sp., Striatella unipunctata (Lyngbye) C.Agardh36.6P. micans1.0
March92.2C. insignis, Amphora hyalina Kützing, Licmophora flabellata(Greville) C.Agardh,7.7P. cordatum0.1
April99.1Licmophora abbreviata C. Agardh, Navicula pennata A.W.F.Schmidt, C. affinis0.9G. poligramma0.1
May75.7Pseudo-nitzchia sp.,
D. fragilissimus, C. affinis
23.7G. variabile, G. spinifera, C. furca0.6
June10.7Cyclotella caspia Grunow, C. affinis89.3G. variabile, Gymnodinium sp., P. cordatum, C. furca0.8
July97.8P. calcar-avis, P. alata2.1S. trochoidea, Gyrodinium sp.0.0
August92.0P. calcar-avis, P. alata7.9P. micans, S. trochoidea0.1
September88.2P. calcar-avis, P. alata, Pseudo-nitzchia sp.11.8P. micans, Gymnodinium sp.0.1
October98.0P. calcar-avis, P. alata2.0P. micans, P. cordatum0.0
November47.6Melosira moniliformis (O.F.Müller) C.A. Gardh, Cylindroteca closterium (Ehrenberg) Reimann and J.C.Lewin52.4C. furca, P. micans0.0
December10.9Nitzschia sigma (Kützing) W.Smith, Thalassiosira parva Pr.-Lavr.88.9C. furca, P. micans0.0
Table 4. Hydrochemical and hydrobiological parameters in the cold and warm periods of 2020.
ParametersWarm Period
(May–October)
Cold Period
(November–April)
RangeMean (±SE)RangeMean (±SE)
Chla, mg·m−30.91–4.702.13 (±0.20)0.47–2.861.37 (±0.20)
B, mg C·m−3136–564285 (±29)36–20972 (±31)
µ, day−10.37–1.380.80 (±0.07)0.08–1.200.52 (±0.08)
g, day−10–0.610.28 (±0.05)0–1.160.48 (±0.07)
µ/ g, %0–7732 (±6)0–20074 (±11)
T, °C16.0–25.021.9 (±0.7)8.0–15.111.1 (±0.6)
NO3, µM1.13–7.592.65 (0.37)1.29–5.213.33 (0.33)
NH4, µM0.11–2.690.78 (0.19)0.12–0.830.36 (0.14)
PO4, µM0.04–0.590.17 (0.03)0.05–0.210.12 (0.02)
Si, µM1.02–6.833.65 (0.43)2.41–7.734.36 (0.46)
Oxidizability, mg O·L−10.66–6.013.50(±0.26)2.63–6.523.84 (±0.27)
TRIX1.13–4.732.87 (±0.36)1.93–3.853.06 (±0.12)
Publisher’s Note: MDPI stays neutral with regard to jurisdictional claims in published maps and institutional affiliations.

