Article

Nitrogen and Phosphorus Diffusion Fluxes: Insight from High-Resolution Technology and Hydrodynamic Modeling

1
Institute of Surface Earth System Science, School of Earth System Science, Tianjin University, Tianjin 300072, China
2
State Key Laboratory of Environmental Geochemistry, Institute of Geochemistry, Chinese Academy of Sciences, Guiyang 550081, China
3
Environmental Protection Monitoring Station of Two Lakes and One Reservoir in Guiyang, Guiyang 551400, China
4
School of Management Science, Guizhou University of Finance and Economics, Guiyang 550025, China
*
Authors to whom correspondence should be addressed.
Water 2021, 13(22), 3232; https://doi.org/10.3390/w13223232
Submission received: 29 August 2021 / Revised: 24 October 2021 / Accepted: 5 November 2021 / Published: 15 November 2021

Abstract

:
Nitrogen and phosphorus are key elements in controlling eutrophication in the aquatic system. Water and sediment samples were collected from Hongfeng Lake, a seasonally stratified reservoir in southwest China, in winter and summer. Diffusion fluxes of NH4+, NO3, and labile P in summer using diffusive gradients in thin films technology were 3.4, −37.2, and 0.9 mg m−2 day−1, respectively, based on Fick’s first law. The diffusion flux of labile P was 2.05 mg m−2 day−1 in winter. The contributions fraction of the labile P diffusion flux from sediment to the overlying water were higher in winter than those in summer, because of the relatively lower external input, concentrations and higher diffusion fluxes in winter. After the external input decreased, all of the three diffusion fluxes were lower than the previous record. To understand the influence effect of hydrodynamics, environmental fluid dynamics code modeling was used to simulate the flow and temperature field in winter and summer. Modeling results showed that velocity in summer was higher than that in winter due to concentrated rainfall within the catchment. Moreover, the velocity and temperature in the euphotic zone were higher than that of the hypolimnion in summer. Less variation of velocity and temperature in vertical profile in winter than that in summer was observed, which may be attributable to the high specific heat capacity and the low heat conductivity of water. There was no significant correlation among velocity, hydrochemistry, nitrogen, and phosphorus concentrations. Hydrodynamics, solar radiation, and water depth affect the position of the thermocline, which was consequently to water temperature, hydrochemistry, dissolved nitrogen, and phosphorus concentration. Correlation analysis suggested that the higher bottom velocity and total bed shear may accelerate labile P, NH4+, and NO3 diffusion fluxes. These results provide evidence and suggestions for preventing and controlling reservoir eutrophication and water safety management.

1. Introduction

Nitrogen (N) and phosphorus (P) are essential elements in photosynthesis and metabolism [1], particularly P, which is one of the threshold elements of the aquatic system [2]. Nowadays, human-induced N and P imbalances altered freshwater, marine, and terrestrial ecosystems to eutrophication states [3,4]. One modeling work by N retention in reservoirs and lakes model result showed that approximately 33% of the total N was removed by lentic systems, which only occupy 6% of the global lentic surface area [5]. Meanwhile, as more and more dams are built, the retained fraction of P load increases from 7% to 17% from 1970 to 2030 [6]. Dual control of N and P should be the status quo for lacustrine eutrophication controlling [7,8,9], particularly the reduction of P external inputs and internal release [10,11].
The monsoon climate in the temperate zone results in seasonal variation of temperature (T), which consequently leads to the external N and P transportation on seasonal with high loading in the summer [12,13,14]. As for the internal source in the lake/reservoir system, the biogeochemistry processes of N and P are sensitive to redox conditions [15], particularly, degradation of organic matter, the redox of iron (Fe) and sulfur (S), which can regulate the internal N/P ratio at the sediment-water interface (SWI) and pose a potential challenge to understand nutrients cycles [11,16,17]. Therefore, more study is required on the contribution from internal N and P release and driver factors affecting the diffusion fluxes of the N and P in the reservoirs that be regulated frequently.
In seasonal hypoxia aquatic ecosystems of deep and sub-deep-water reservoir controlled strongly by hydrodynamic, the internal release of N and P is more than just a static release process [18]. The internal release flux may be beyond those of chronically oxygen-rich natural lakes and (or) lakes without the strong hydrodynamic [19,20,21]. It may be inferred that more N and P may be released in the period with the higher hydrodynamic and more oxygen-deprived environment at SWI than that in the period with the lower hydrodynamic and aerobic conditions. However, there was still a lack of hydrodynamic effect on the release of N and P in the previous research. For example, a previous study found that the estimations for the bed shear stress are essential to predict the erosion and deposition processes [22]. However, the direct measurement of bed shear stresses presents some difficulties [22,23]. Fortunately, total bed shear stress was calculated using waves and currents, which are interacted in a non-linear way [23], and the most widely used theories are the log-profile method, the turbulent kinetic energy (TKE) method, the modified TKE method, the Reynolds stress method, and the inertial dissipation method [22]. Environmental fluid dynamics code (EFDC), which was initially developed by the United States Environment Agency, has proved a powerful tool to simulate hydrodynamics, T, water quality, and sediment [12,13,14].
Diffusive gradients in thin layers (DGT) technique could collect and show the concentrations of the special forms in high resolution with micron and millimeter scales, which calculated the molecular diffusion flux at SWI using Fick’s first law [24]. Additionally, the simulated flow field can reflect the influence of hydrodynamic inside the reservoir [12]. Thus, the simulation of hydrodynamics helps in understanding the diffusion at SWI. Combing the DGT technology and modeling may provide useful information for N and P biogeochemistry processes.
In the present study, the N/P concentration of water profiles, at SWI, N/P diffusion flux at SWI and hydrodynamic of a reservoir system were analyzed to (1) know spatial and temporal distribution characteristic of hydrochemistry; (2) assess the effects of internal diffusion on water and sediment; (3) understand the hydrodynamic influence in spatial-temporal scale. This study highlighted the hydrodynamic contribution to the internal P and N release and potential biogeochemical processes.

2. Materials and Methods

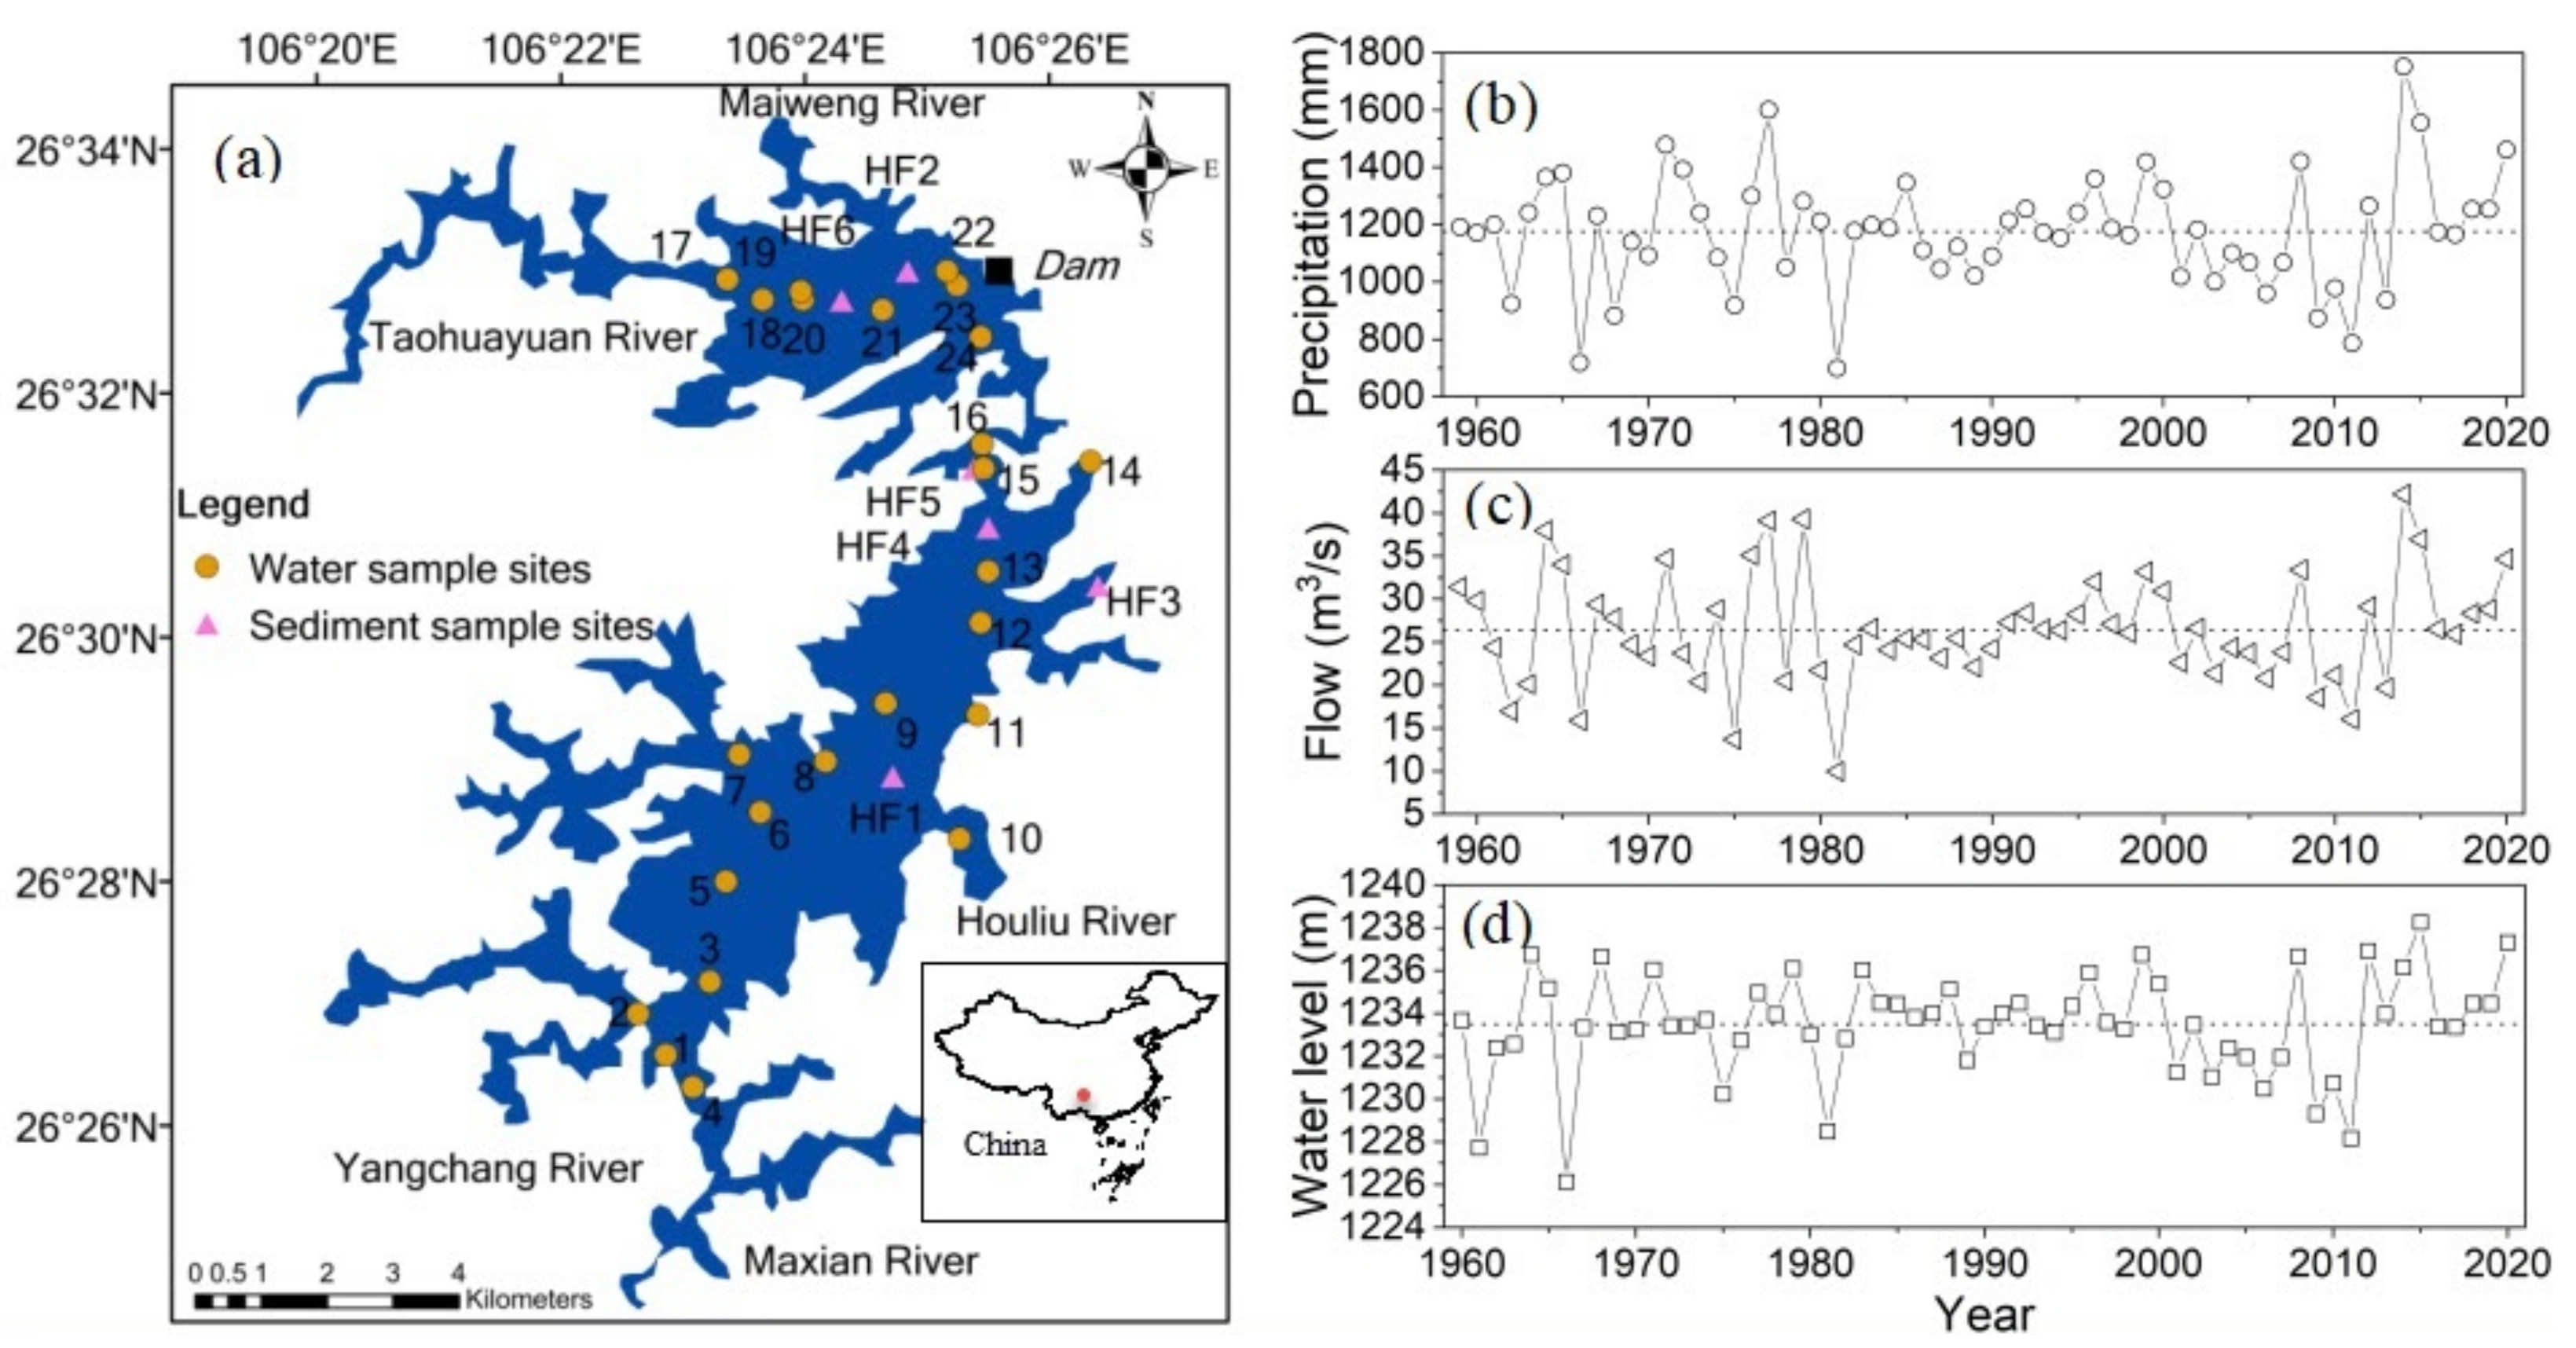
2.1. Site Description

Hongfeng Lake is a seasonal anoxic reservoir in Yunnan-Guizhou Plateau built in 1958 and provides drinking water for Guiyang city, the capital of Guizhou Province, China [25]. This lake, with an elevation of 1291 m and a mean water depth of 10.5 m (max 45 m), is located in the mountainous canyon consisting of South lake and North lake, which are connected by a long and narrow channel. This study area has a subtropical humid monsoon climate, with an average annual rainfall of about 1200 mm. The 30-year historical average daily values showed that solar radiation in July and August was highest, and precipitation in June and July was highest. Both in December and January were the lowest, respectively (Figure S1). The water area of Hongfeng Lake (Figure 1a 26°31′~26°34′ N, 106°24′~106°43′ E) is 57.2 km2 with length and width of approximately 16 km and 4 km, respectively. The hydraulic retention time is about 0.82 years [26].
Based on hydrometric station statistics (Figure 1b–d), the average precipitation, flow, and water level were 1175.44 mm, 26.37 m3/s, and 1233.48 m, respectively. The total storage capacity is 7.5 × 10⁸ m3 and the adjusted storage capacity is 4.3 × 10⁸ m3, with the functions of drinking water supply, flood control, hydropower, shipping, tourism and aquaculture [26].

2.2. Sampling and Analysis

To understand the variation between the mixing period (winter) and the stratification period (summer), water samples and sediment cores were collected at two sites (South lake, HF1, and North lake, HF2) in January 2017 (winter). Considering the spatial heterogeneity during the stratified period, more sampling sites were selected in July 2019 (summer) than in January 2017, including 6 sediment sites (HF1~HF6) and 24 water sites (1~24) (Figure 1a and Table S1). Sediment cores were collected with a portable gravity sediment sampler (Xiaohe, Guiyang, China) and wrapped with aluminum foil to prevent light influence during transportation (Figure S2a–c).
Hydrochemistry of water profiles in Hongfeng Lake was measured by YSI 6600 (Xylem Inc., New York, OH, USA), including T, pH, and DO in winter, T, pH, DO, chlorophyll, total dissolved solids (TDS) and oxidation-reduction potential (OPR) in summer, respectively. Before using YSI6600, DO, pH, chlorophyll, ORP, and TDS probes were calibrated according to the equipment calibration guide [27]. Transparency was measured by a black and white plate. The total nitrogen (TN) and total phosphorus (TP) were measured after oxidation by alkaline potassium persulfate and potassium persulfate, respectively [28]. NH4+-N, NO2-N, NO3-N, and PO43−-P concentrations were measured after filtration by Epoch microplate spectrophotometer (Bio Tek, Winooski, VT, USA). The samples were tested within 24 h.
T, pH, DO, and ORP were analyzed by multi-parameters HQ4001 (Hach, Loveland, CO, USA) at the overlying water of the sediment cores. Before using HQ4001, DO, pH, and ORP probes were calibrated according to the equipment guideline. In summer, ZrO-AT devices (Easysensor Ltd., Nanjing, China) were plugged after standing for 24 h, the films were cut with a 2-mm interval by the ceramic knife (Figure S2d–f) [29]. The films were extracted with 1 mol/L (M) NaCl standing for 24 h to measure NH4+-N, and NO3-N of pore water. Then, labile P of pore water was extracted with 1M NaOH standing for 24 h [29]. NH4+, NO3, and labile P concentrations at SWI were calculated according to Equation (1) [24].
c D G T = M Δ g / DAt
where, M (μg) is the mass accumulated over the deployment time, A (cm2) is the exposure area of the gel, t (s) is the deployment time, ∆g (cm) is the thickness of the diffusion layer, D (cm2/s) is the diffusion coefficient in the agarose gel. D of NH4+, NO3, and labile P of ZrO-AT were (17.41, 5.47 and 5.97) × 10−6 cm2/s at 20 °C.
ZrO devices (Easysensor Ltd., Nanjing, China) were used to collect labile P of pore water in winter using computer imaging density measurement [30]. The ZrO binding gels were put in molybdenum antimony color reagent to a water bath at 35 °C for 45 min (Figure S2g). The thin film of ZrO was scanned in a scanner (Figure S2h) and transformed with a software, ImageJ, and the gray value was calculated [30] and shown by Equation (2), and the concentrations are shown by Equation (1). The P accumulation, M (μg/cm2) in a thin film of ZrO was calculated according to the following Equation [30].
Gray   value = - 177 e M / 4 . 46 + 223
At last, the sediment cores were separated by ceramic knife at the interval of 1 cm (Figure S2i), the pore water was extracted by centrifugation (Heraeus Multifuge X1R, Thermo Fisher Scientific, Waltham, MA, USA), and the NH4+, NO3, PO43−, Fe2+, Mn2+, and S2− concentrations were measured by spectroscopy after filtration [28,29,30]. Total carbon (TC), total organic carbon (TOC) (treated by 0.5M HCl), TN, and total sulfur (TS) contents of sediment were analyzed by an elemental analyzer (Vario EL III, Elementar, Langenselbold, Germany) after freeze-drying (Labconco, Kansas City, MO, USA), grinding and screening (size 100 mesh). The NH4+-N, NO2-N, and NO3-N in the sediment extracted by 2 M KCl. For each core, 0.5 g dry surface sediment was incinerated for 2 h by muffle furnace under 500 °C, extracted by 3.5 M HCl, and the TP content was determined after oscillation for 16 h. Total inorganic P (TIP) was determined using a similar method without calcining. Total organic P (TOP) was the difference between TP and TIP. The P forms in sediment were determined by chemical sequential extraction [31], including NH4Cl-P (loosely adsorbed P), bicarbonate dithioniote-P (BD-P, P forms sensitive to redox potentials), NaOH-soluble reactive phosphorus (NaOH-SRP, exchangeable with hydroxide ions), NaOH-non-reactive phosphorus (NaOH-NRP, microbial phosphorus), HCl-P (Ca-bound fraction), and residual-P (refractory P of the Si crystal lattice and organic P fraction) (Text S1). The continuous extraction solution of Fe forms in sediment was selected as follows, including exchangeable form, carbonate bounded form, ferric and manganese oxide form, organic matter bounded form and residual form [32]. Total Fe in sediment was pretreated by microwave digestion using HNO3-HF-HCl (3:1:1) and monitored by an inductively coupled plasma optical emission spectrometer (Agilent, Santa Clara, CA, USA) [32]. The details are provided in Text S1. The reference soil standards of TC, TN, TS, TP, and Fe were GBW07407/GSS-7 and GBW07405/GSS-5. They were used to calculate the instrument accuracy and the extraction recovery.

2.3. Data Analysis

The molecules’ diffusion fluxes were calculated by Fick’s first law from the sediment culture experiment [33]. It was assumed that there was no benthic and hydrodynamic disturbance. According to Fick’s first law, the diffusion fluxes of NH4+-N, NO3N, and labile P at SWI were as the following Equation [33]:
F diffusion = F w + F s = D 0 C w Z     φ   ×   D s C s Z
where, F w means the diffusion flux of the overlying water. F s means the diffusion flux of the pore water in the surface sediment. Therefore, if the Fdiffusion value is higher than 0, the sediment will play a nutrients contributor to the overlying water as the internal source. Its contribution can be quantified as the release flux by Fdiffusion. C w / Z is the concentration gradient with the linear variation of P and N in the overlying water at SWI, C s / Z is that in surface sediment at SWI, which was usually within a spatial range of several tens of mm. φ is the porosity of surface sediment. D0 is the ideal diffusion coefficient of the infinite dilution solution. D s denotes the effective diffusion coefficient of ions in sediment. The details are provided in Text S2.
The contribution of diffusion flux of NH4+-N, NO3-N and labile P at SWI to the overlying water, Contribution Overlying , was calculated by Equation (4) [28]:
Contribution Overlying = C d / C = t w / t d C d = F diffusion · t w / H t d = C · H / F diffusion
where, C d   is the concentrations of diffused NH4+-N, NO3-N, and labile P from the pore water in the sediment to the overlying water, C is NH4+-N, NO3-N, and labile P concentration of the overlying water, H is water depth, t d is the diffusion lodging time of NH4+-N, NO3-N, and labile P, t w is hydraulic retention time. The higher the F diffusion and t w and the lower the H, the higher the C d   .
The contribution of diffusion flux of NH4+-N, NO3-N, and labile P at SWI to the sediments, Contribution sediment , was calculated by Equation (5) [28].
Contribution Sediment = F diffusion / F deposited = F diffusion / C s · k s
where, F deposited is deposited rate, k s is sediment accumulation rate, 0.176 g/(cm2·year) for Hongfeng Lake [34], C s   is molecule concentration in surface sediments. The details are provided in Text S2. The correlation analysis and the heat map were drawn, and diagrams of vertical sections were through spatial interpolation by Origin Pro Learning Edition 2021.

2.4. Hydrodynamics Modeling by Environmental Fluid Dynamics Code

EFDC was used to simulate velocity, total bed shear, and T. About 1418 grids of Hongfeng Lake were divided using CVLGrid1.1 (DSI, LLC., Washington, DC, USA). Notepad++ was used for data input. The three-dimensional hydrodynamic models were structured and simulated by EFDC Explorer 10.1.4 (DSI, LLC., Edmonds, WA, USA) [12] with a time step of 0.795 s and 40 layers vertically. The boundary was the water level of Hongfeng Lake, within which the flow field was simulated. The wave parameters, e.g., wave height, wave direction and wave period, are calculated by the Sverdrup, Munk, and Bretschneider (SMB) model, and then used to calculate total bed shear stress via the Grant Madsen approach [22]. The climate data were obtained from National Meteorological Science Data Center (https://data.cma.cn/), including wind direction, wind speed, air T, humidity, air pressure, precipitation (Figure S1), and solar radiation. Cloud-cover data were obtained from weather databases. Topographic data were obtained by 3.5 kHz and 10 kHz dual sonar (Stratabox, SyQwest Inc., Cranston, RI, USA). The detailed flow and water level data of inflow rivers were available from the Environmental Protection Monitoring Station of Two Lakes and One Reservoir, Guiyang. EFDC simulation was carried out to adjust the parameters and validate the model using data in 2013. The model parameters are shown in Table S2. Initial conditions are input to the model based on the measured values. The 6 monitoring sites of T inside Hongfeng Lake were used for the validation (Table S3). The data of flow and total bed shear inside the reservoir are lacking, and the model is validated by T. The deviation of simulated water T was −0.039 ± 0.0424 compared with the measured value (Table S4), indicating this model is practicable. Hydrodynamics of January 2017 and July 2019 were simulated.

3. Results

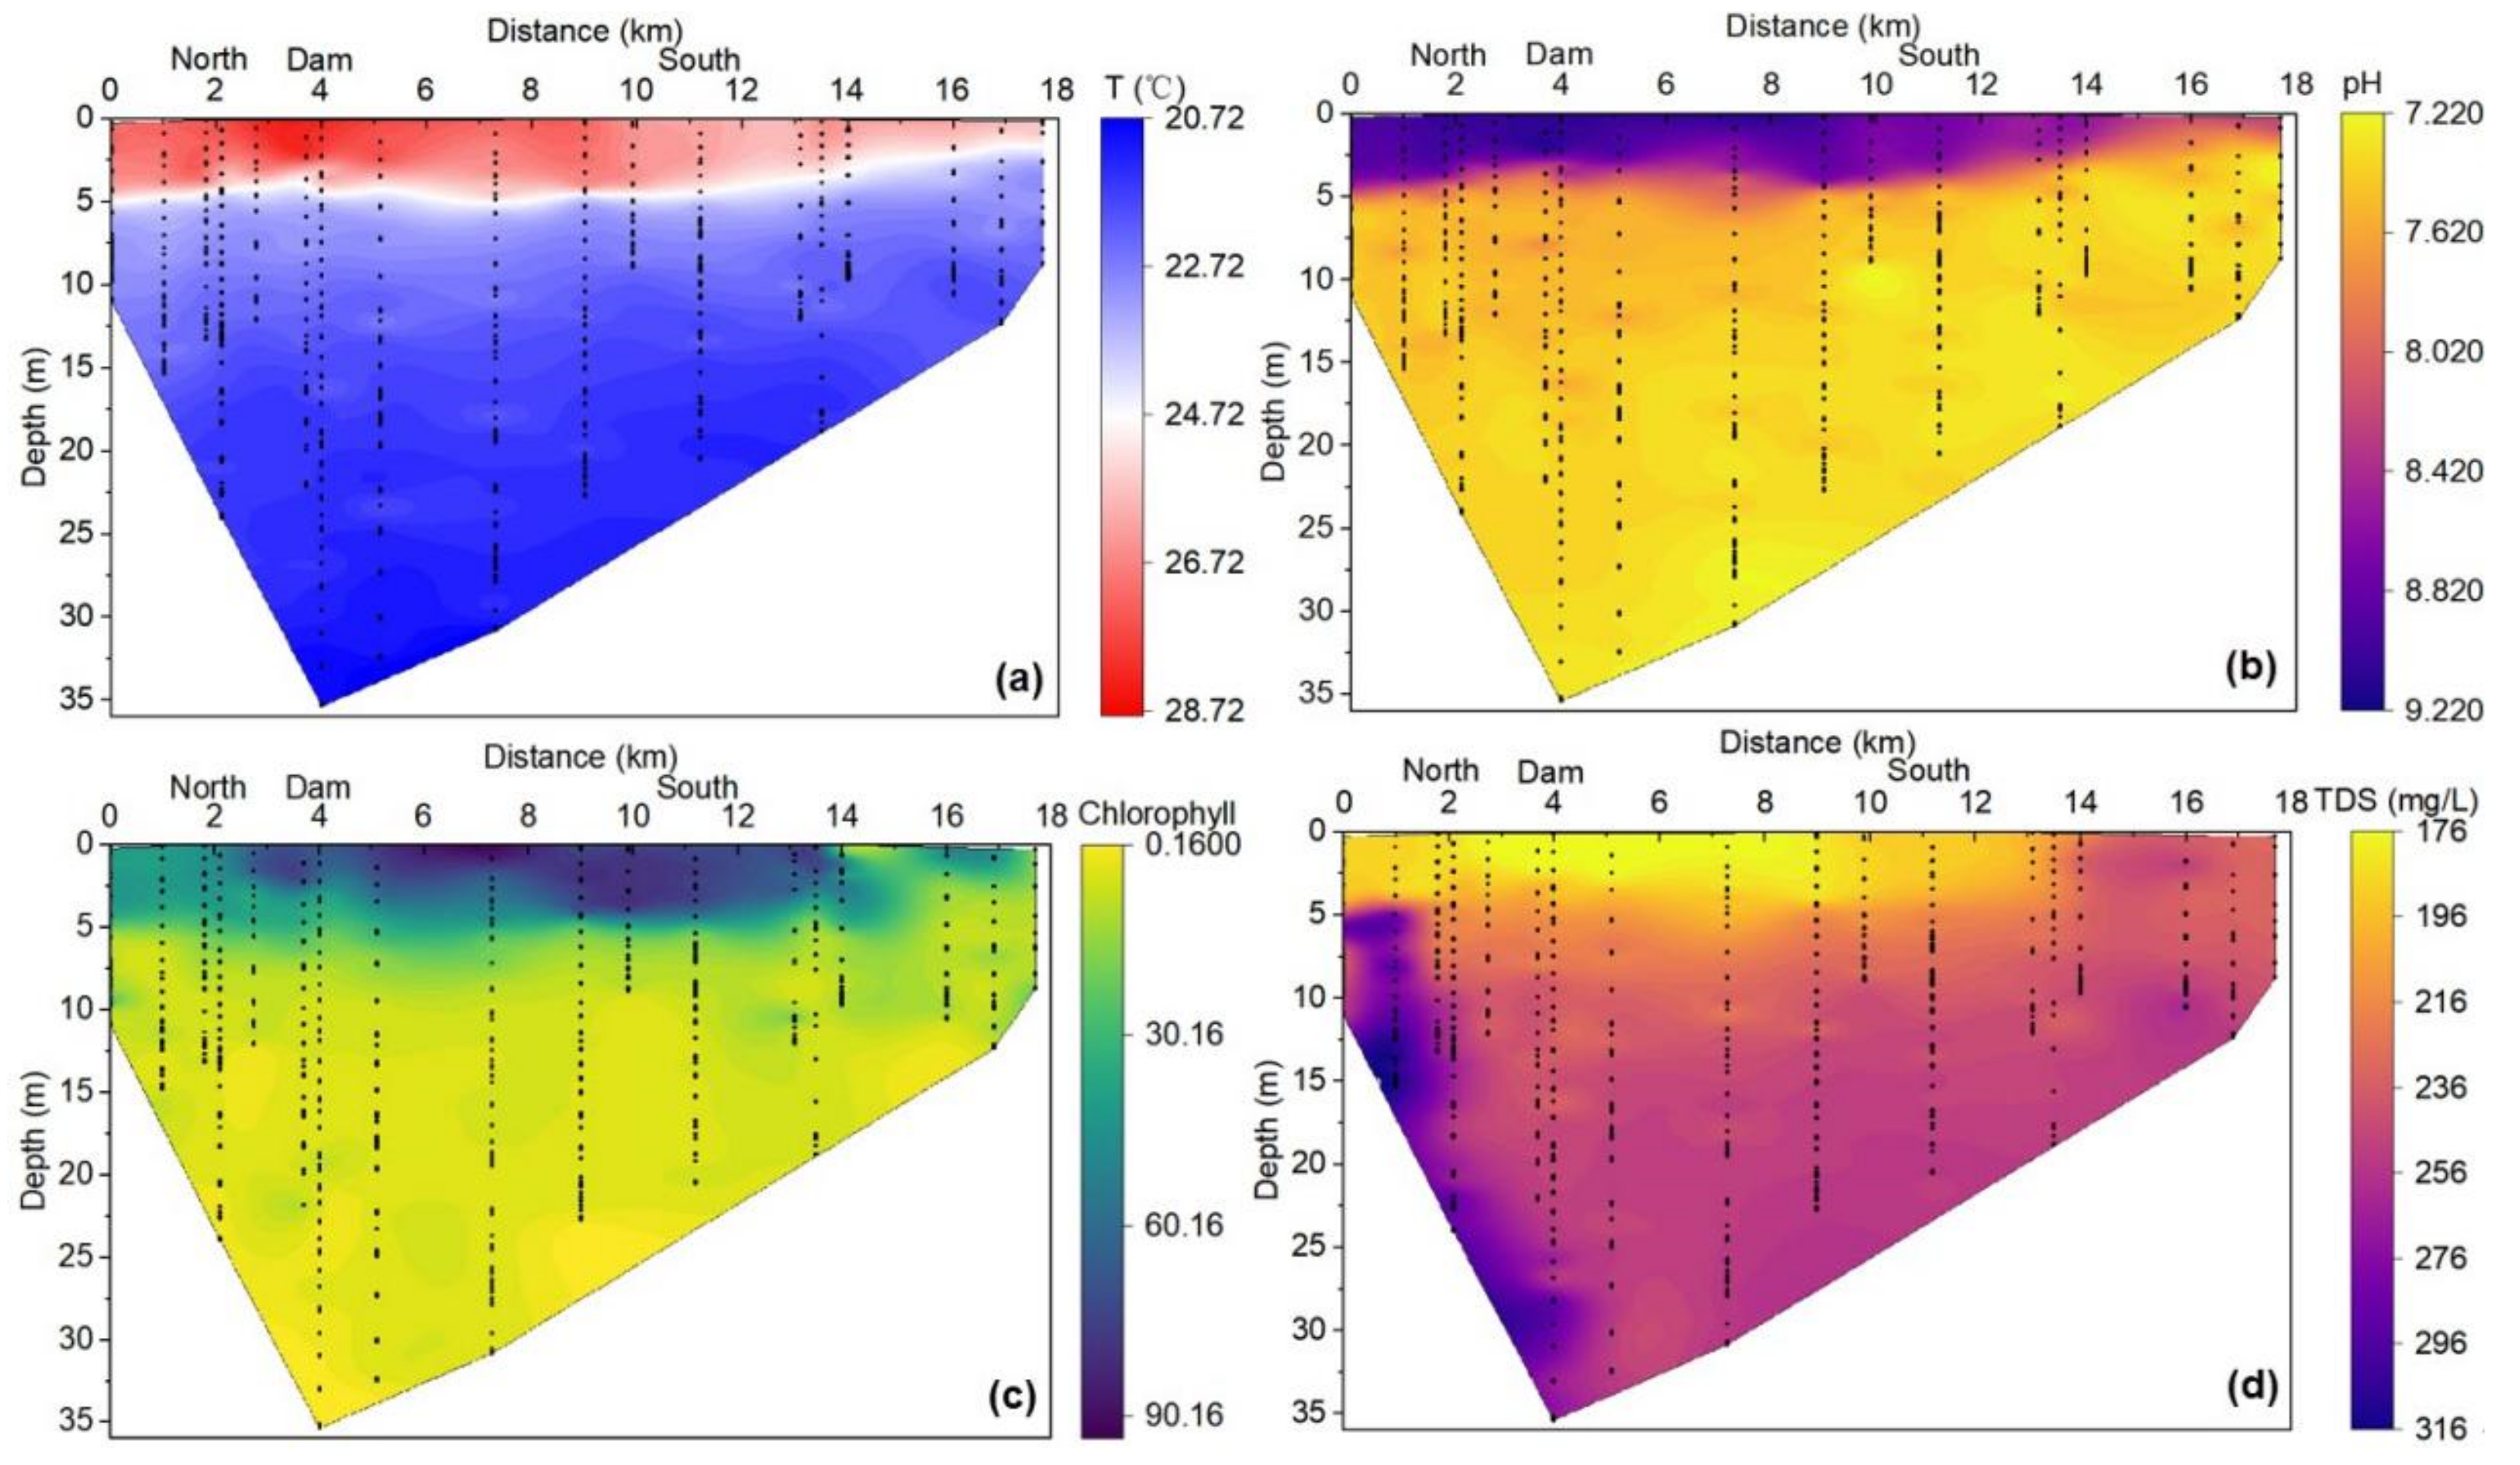
3.1. The Seasonal Variation of Hydrochemistry

In the winter, T, pH, and DO in Hongfeng Lake have little vertical change, ranging from 12.3 to 14.8 °C, 7.92 to 8.45, and from 6.19 to 8.63 mg·L−1, respectively. There are slight differences between North lake and South lake sites, with 1.5 °C, 0.7, and 2.2 mg/L, respectively. Large variation can be observed in the summer, particularly DO ranging from 0.23~10.13 mg/L. T and pH ranged from 20.39 to 28.29 °C and 7.21~9.11, respectively. The chlorophyll, TDS and ORP were 3.11~90.07 μg/L, 176~314 mg/L, and −200~232 mV, respectively (Figure 2 and Figure S4).
In summer, the values of T, pH, and DO concentration decreased with depth, while TDS showed a reversed trend (Figure S4). There did appear to be an oxycline in that oxygen is present in the epilimnetic zone (area with water depth ranges from 0 to 5 m). Nutrients were taken up by plankton in the epilimnetic zone. There is a stratification of DO. Degradation of organic matter consumed a large amount of oxygen, producing TDS in the hypolimnion (Figure 2d and Figure S4c,d). It can be observed that there was a sharp decline at a depth of 3.0~5.0 m (the thermocline) (Figure 2a). The thermocline and hypolimnion occurred in the static reservoir, not in the river-transition zone and river outlet (Figure S5). The variation of pH (Figure 2b) was consistent with that of water T and DO. The transparency was 1.75 m. Algae growth was mainly distributed in the euphotic zone (area with water depth < 1.75 m) (Figure 2c). Higher chlorophyll concentration also was corresponding to a higher concentration of DO produced by photosynthesis owing to plenty of light.

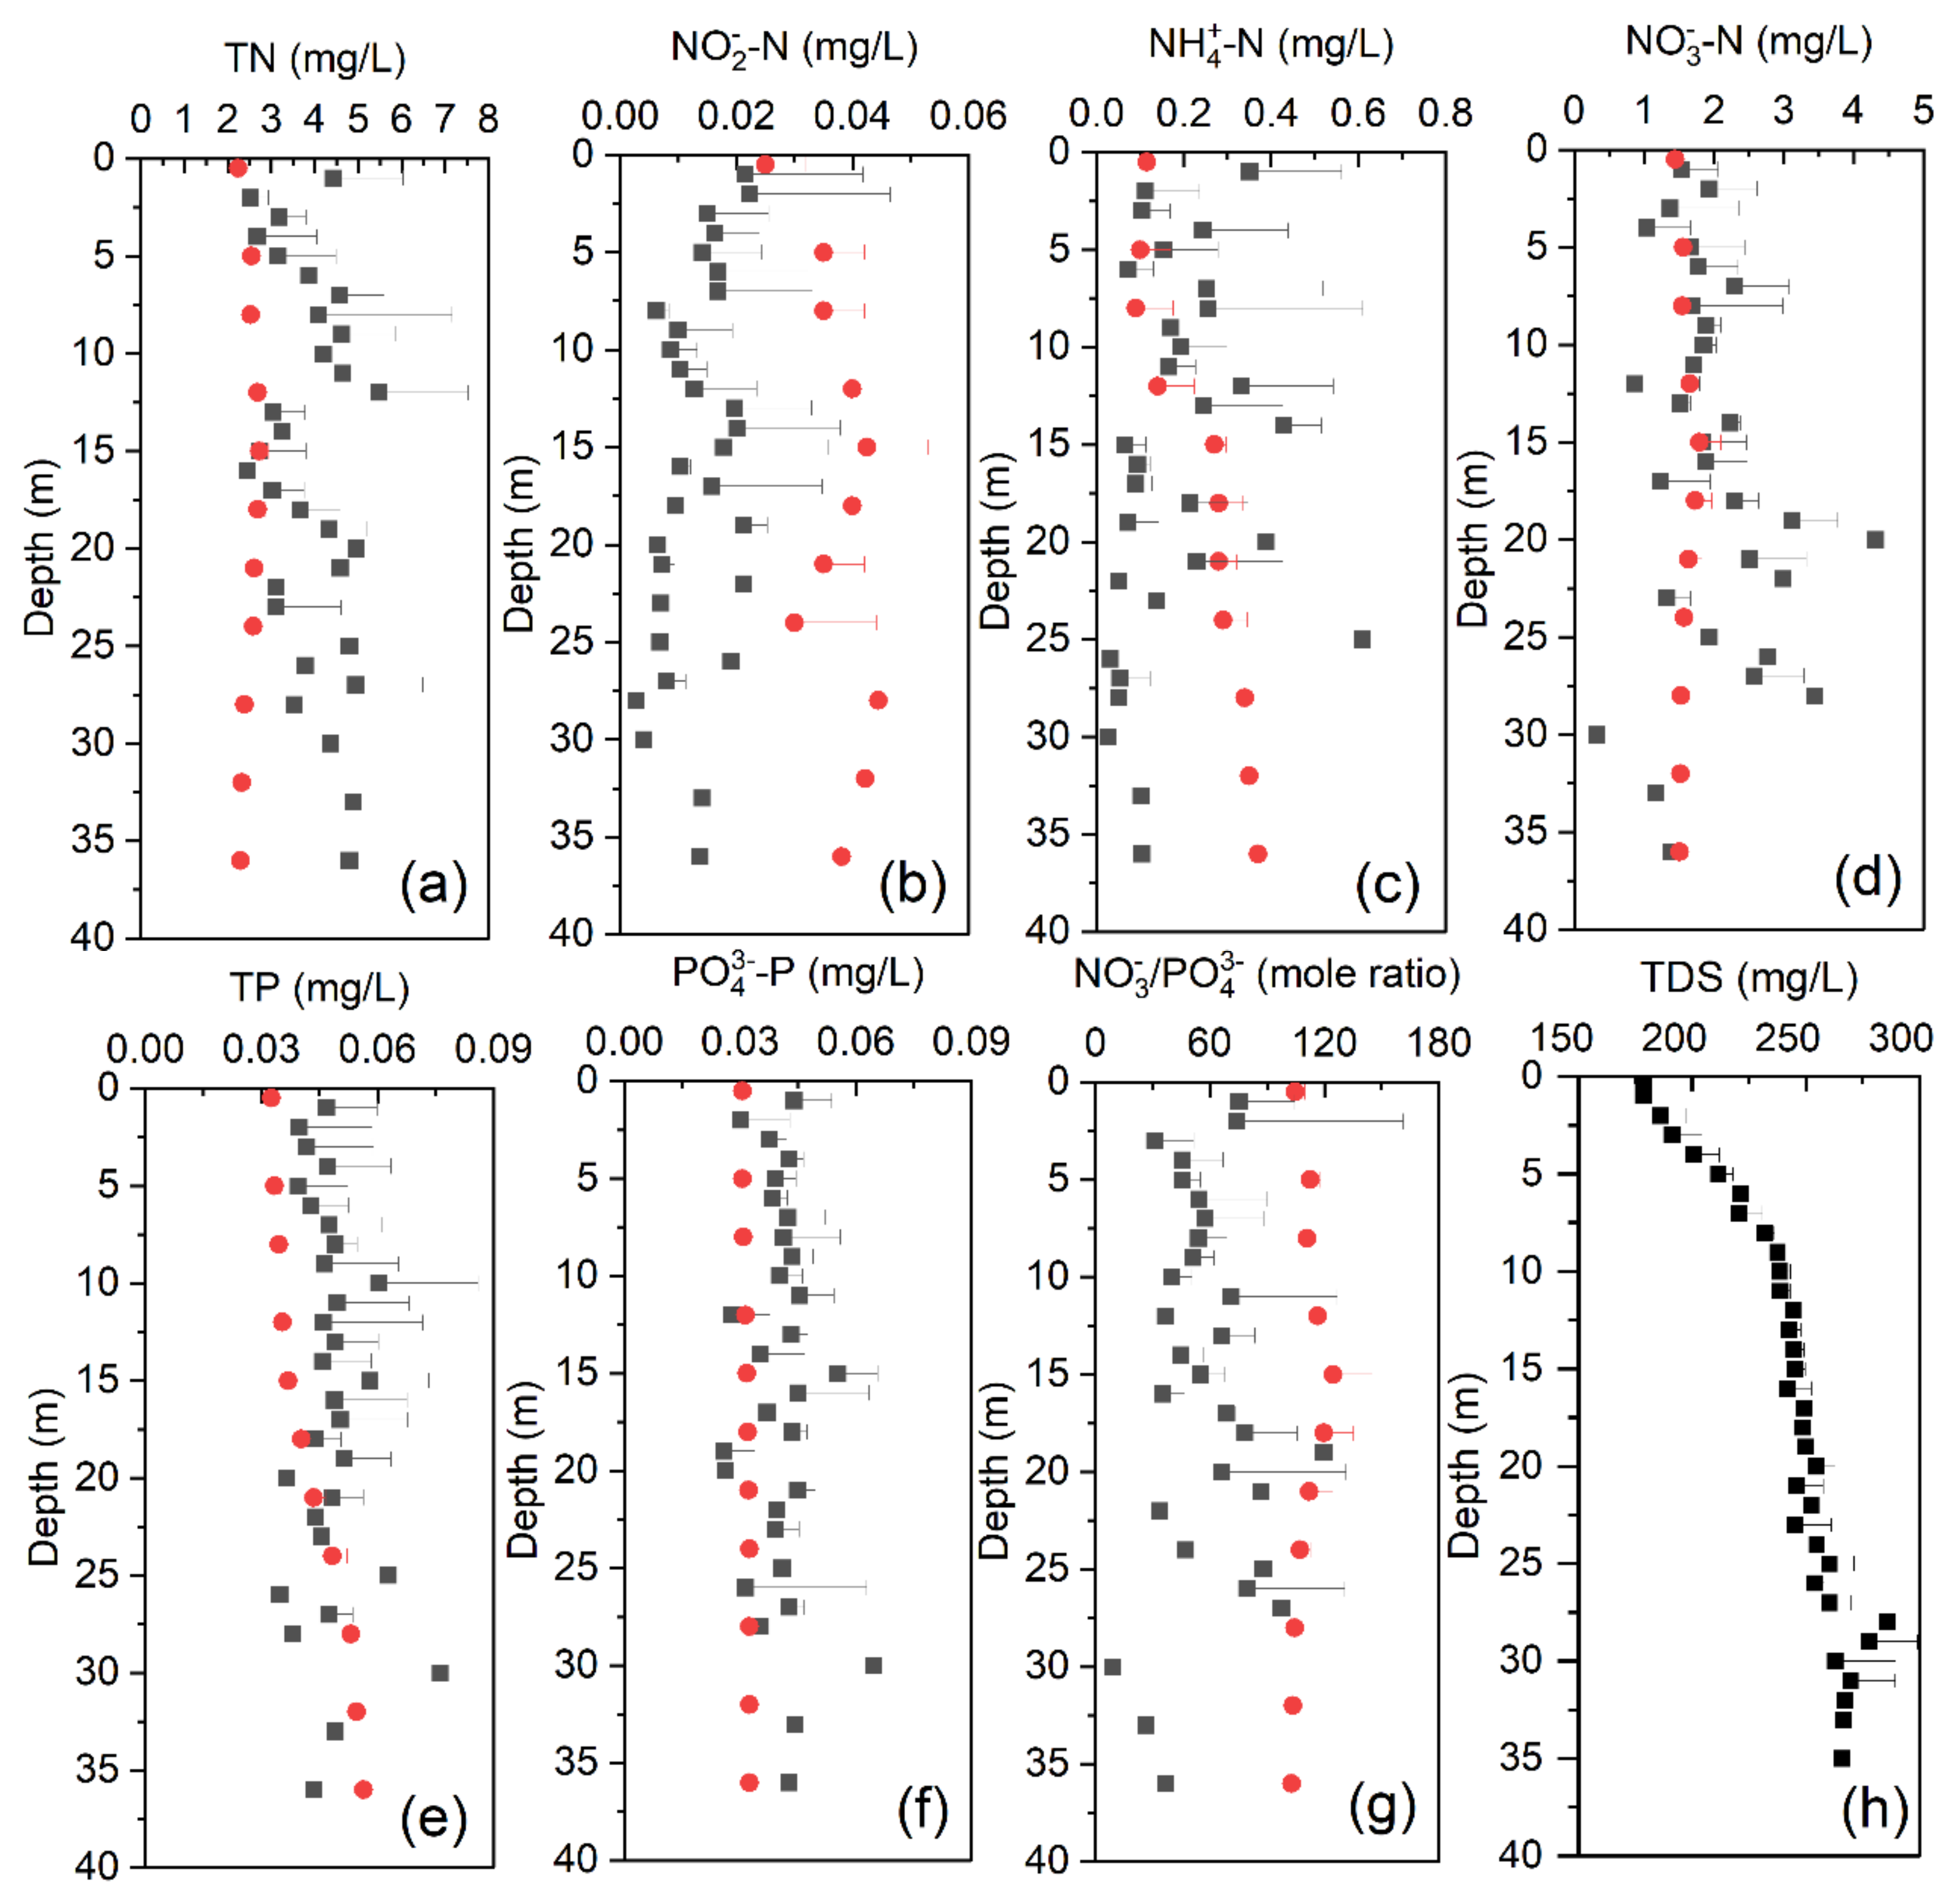
3.2. The Seasonal Difference of N and P Concentrations in Water
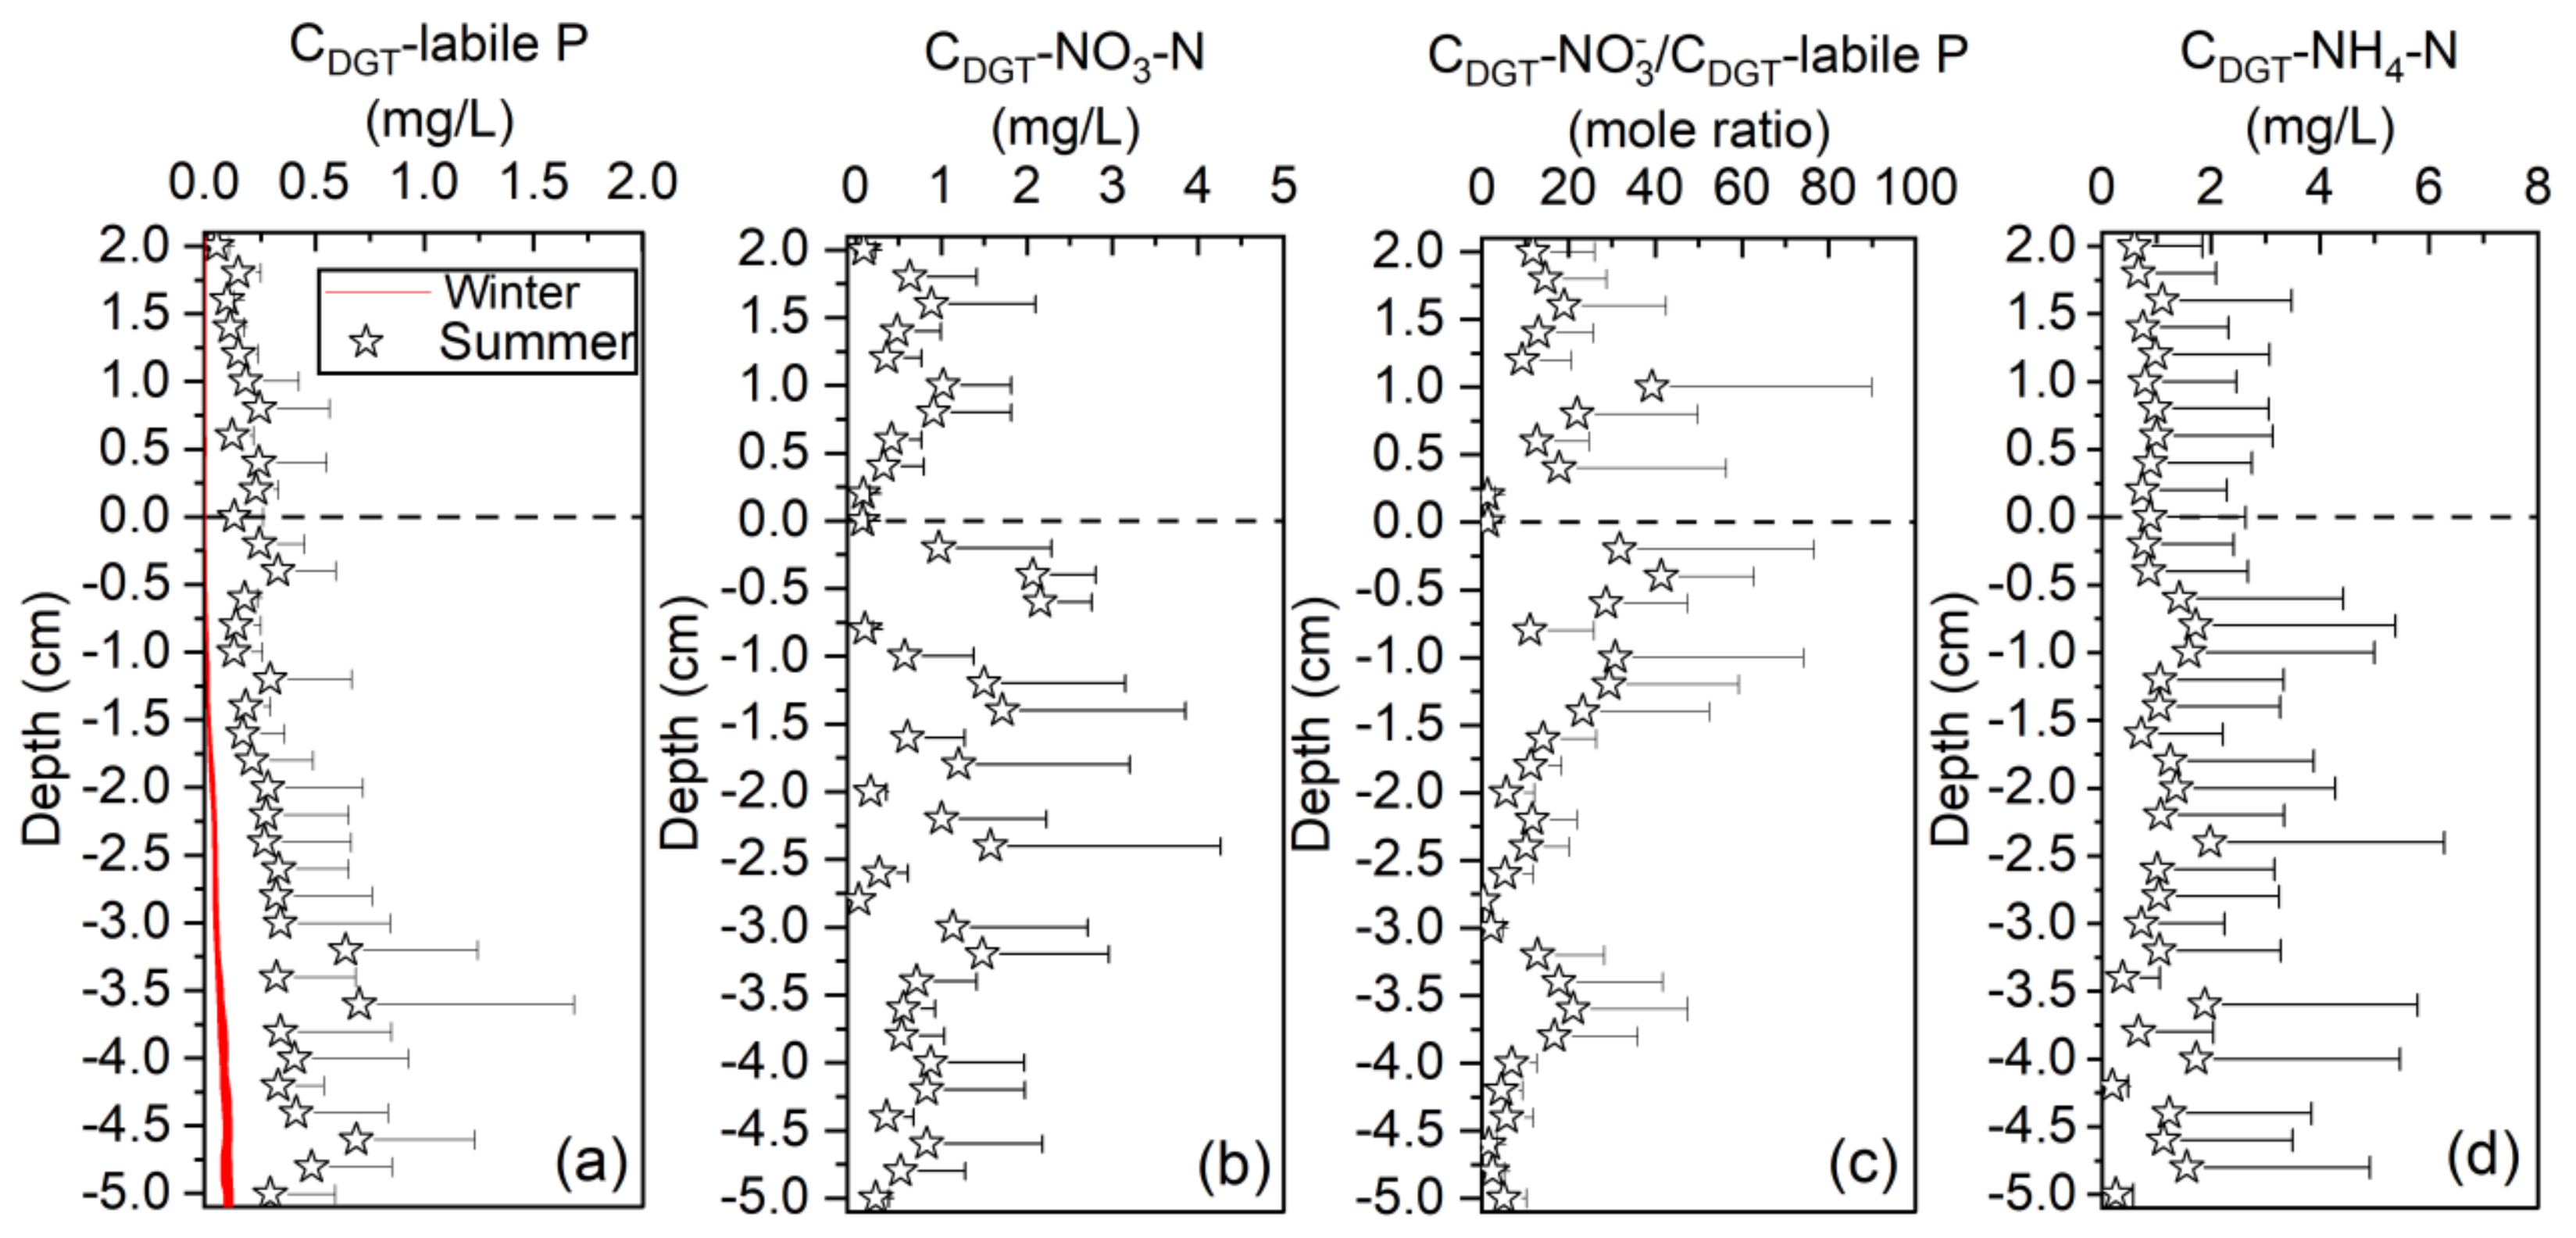
In winter, there was little vertical difference of N and P concentrations. The concentrations of TN, NH4+, NO3-N, TP, and PO43−-P in water in winter were lower than those in summer, while high NO2-N concentration was observed in winter (Figure 3 and Table 1). However, the vertical changes of N and P did not show an obvious trend in summer (Figure 3), which may be related to the rainstorm of 57.3 mm during the sampling period, indicating the influence of hydrodynamic and external input by runoff during a rainfall event. The average ratio of NO3-N: PO43-P was 111 ± 7 in winter and 100 ± 52 in summer. Relatively higher average concentrations and standard deviations at the water depths of 17 m, 18 m, 28 m, and 36 m in summer were observed, particularly at the bottom water of HF1, HF2, HF4 and HF6 (water depths are provided in Table S1). Spatially, the contents of TN and NH4+ in North lake were higher than those of South lake both in winter and summer, whereas NO2-N concentrations were reversed (Table 1).

3.3. The NH4+-N, NO3-N and Labile P Concentrations in Overlying Water and Pore Water

In winter, the average labile P concentration of overlying water was 0.007 mg/L, which is lower than that in the pore water (0.056 mg/L). In summer, the average NH4+-N, NO3-N, labile P concentrations, and the N/P mole ratio of overlying water were 0.85 mg/L, 0.48 mg/L, 0.15 mg/L, and 14, respectively. Similarly, all the concentrations in the overlying water were lower than those in the pore water, 1.11 mg/L, 0.88 mg/L, 0.33 mg/L and 62, respectively (Figure 4). The standard deviations of NH4+-N, NO3-N and labile P concentrations were mainly caused by the large redox difference at SWI.

3.4. The TC, TOC, TN, TP, TOP, TS, and Fe Content in the Sediment

The average TC, TN, TP, TS, and total Fe concentration of surface sediment was 8.24%, 0.50%, 0.16%, 0.61%, and 2.23% in winter, which were higher than in summer with average values 4.48%, 0.44%, 0.11%, 0.10%, and 2.13%, respectively. TOC and TOP concentration were 5.03% and 0.13% in winter, 2.68% and 0.07%, in summer, respectively. For other forms, the average NH4+-N and NO3-N content of surface sediment was 205 mg/kg and 21 mg/kg, accounting for 5% and 0.51% of TN, respectively. NH4Cl-P, BD-P, NaOH-SRP, NaOH-NRP, HCl-P, and Residual P accounted for 1.24%, 5.12%, 50.01%, 13.41%, 13.21%, and 17.01% of TP in winter, respectively. However, the fraction of NaOH-SRP and Residual P was changed more than other forms in summer, accounting for 29.37%, and 25.87% of TP, respectively (Figure S6). Therefore, the major forms of P were varied. Exchangeable P with hydroxide ions (NaOH-SRP) and Residual P in winter were two major forms, while microbial P (NaOH-NRP), Residual P, and Ca-P (HCl-P) were three major forms, accounting for more than 70% of TP in summer. The higher pH and DO at SWI in winter than in summer may result in the change of NaOH-SRP.
Compared with C:N:P of planktonic algae (Redfield-Ketchum-Richards reaction) of 106:16:1 (Redfield, Ketchum and Richards 1963), TC:TN ratio (10~52) and TC:TP ratio (22~115) in sediments of Hongfeng Lake were much higher. The average TOC/TOP ratio of the sediment profile was about 40 in Hongfeng Lake, which may be caused due to P depletion by aquatic organisms that provided the source of organic matter. The main Fe forms were ferric oxide form, and residual form in sediment accounting for 92.57% in winter. The main Fe forms were carbonate bounded form, ferric oxide form, and residual form accounting for 96.75%, in summer (Figure S6). The proportion of ferric oxide form in winter was 53.64%, which was higher than that in summer of 48.76%, and aerobic environment in winter is favorable for Fe enrichment in this form.

3.5. The Seasonal Difference of Diffusion Fluxes of NH4+-N, NO3-N and Labile P

The mean release of labile P in Hongfeng Lake calculated by Equations (1)–(3) was 2.05 mg/(m2·day) in winter. The average diffusion fluxes of NH4+-N, NO3-N and labile P at SWI calculated by Equations (1) and (3) were (3.4, −37.2 and 0.9) mg/(m2·day) in summer, respectively. As for NH4+-N, the release flux in North lake was higher than that of South lake. NO3-N in HF2 (North lake) and HF3 (South lake) was released from sediment to overlying water, whereas in other sampling sites was not released. The release flux of labile P in HF5 was the largest in summer (Table 2). The contribution of diffusion fluxes of NH4+-N, NO3-N, and labile P at SWI to overlying water in summer were calculated by Equation (4) ranging from 0.067 to 0.176, 0 to 0.847, and 0 to 0.602, respectively, which were lower than the previous study in the 1990s under serious eutrophication condition (Table 2) [28]. The contribution of diffusion fluxes of NH4+-N, NO3-N and labile P to the sediments in summer were calculated by Equation (5) and ranged from 0 to 0.009, from 0 to 0.012, and from 0 to 0.520 in summer, respectively. The contribution is related to water depth, N and P concentration of overlying water and sediment, mainly determined by diffusion flux. The higher the diffusion flux, the higher the concentration.
Spatially, the average NO3-N and labile P diffusion fluxes in Southlake were lower than that in North lake in summer, whereas high labile P diffusion flux in winter was observed in South lake (Table 2). In winter, the deposited fluxes of TP and dissolved inorganic phosphorus were 612 and 179 times of the release flux of labile P calculated by Equations S5 and S6 in Supporting Information, respectively. In summer, the deposited fluxes of TN and TP were 429 and 5447 times of the diffusion flux of dissolved inorganic N and labile P, respectively (Table S5). The deposited fluxes of NH4+-N, NO3-N, and phosphate were 28, 1515, and 1591 times of their diffusion fluxes, respectively (Table S6).

3.6. The Hydrodynamic Seasonal Difference by Modeling

The simulated results of velocity and T by EFDC showed that there was water exchange between North lake and South lake through the narrow, tortuous waterway (Figure 5), which may be attributable to the water plant, which uses 400,000 m3 of water every day in South lake (Figure 5a, “-water plant”, data form Environmental Protection Monitoring Station of Two Lakes and One Reservoir, Guiyang). Correlation analysis showed that higher input river flow increased the velocity and total bed shear (Figure S7). There was a correlation that water vertical velocity = 2.0 × 10⁻⁶ cumulative daily radiation + 0.0003 (R2 = 0.01, p < 0.01, Figure S8). Solar radiation has little effect on the mean vertical velocity of the water. The velocity of water and total bed shear in summer were greater than those in winter (Table S7). The potential reason mainly was the higher inflow of rivers and more rainfall in summer. The vertical velocity was very slow and barely changed in the winter of HF1, HF2~HF5 (Figure S9). The reason why the vertical velocity of HF2 fluctuated greatly is that it is located near the dam outlet. The total bed shear in HF2 was also the highest in summer (Table 2). Vertical velocities of HF1 and HF2 in summer were higher than those in winter (Table 2). The variations of water velocity and total bed shear were greater in summer than that in winter (Figure S9 and Figure S10).

4. Discussion

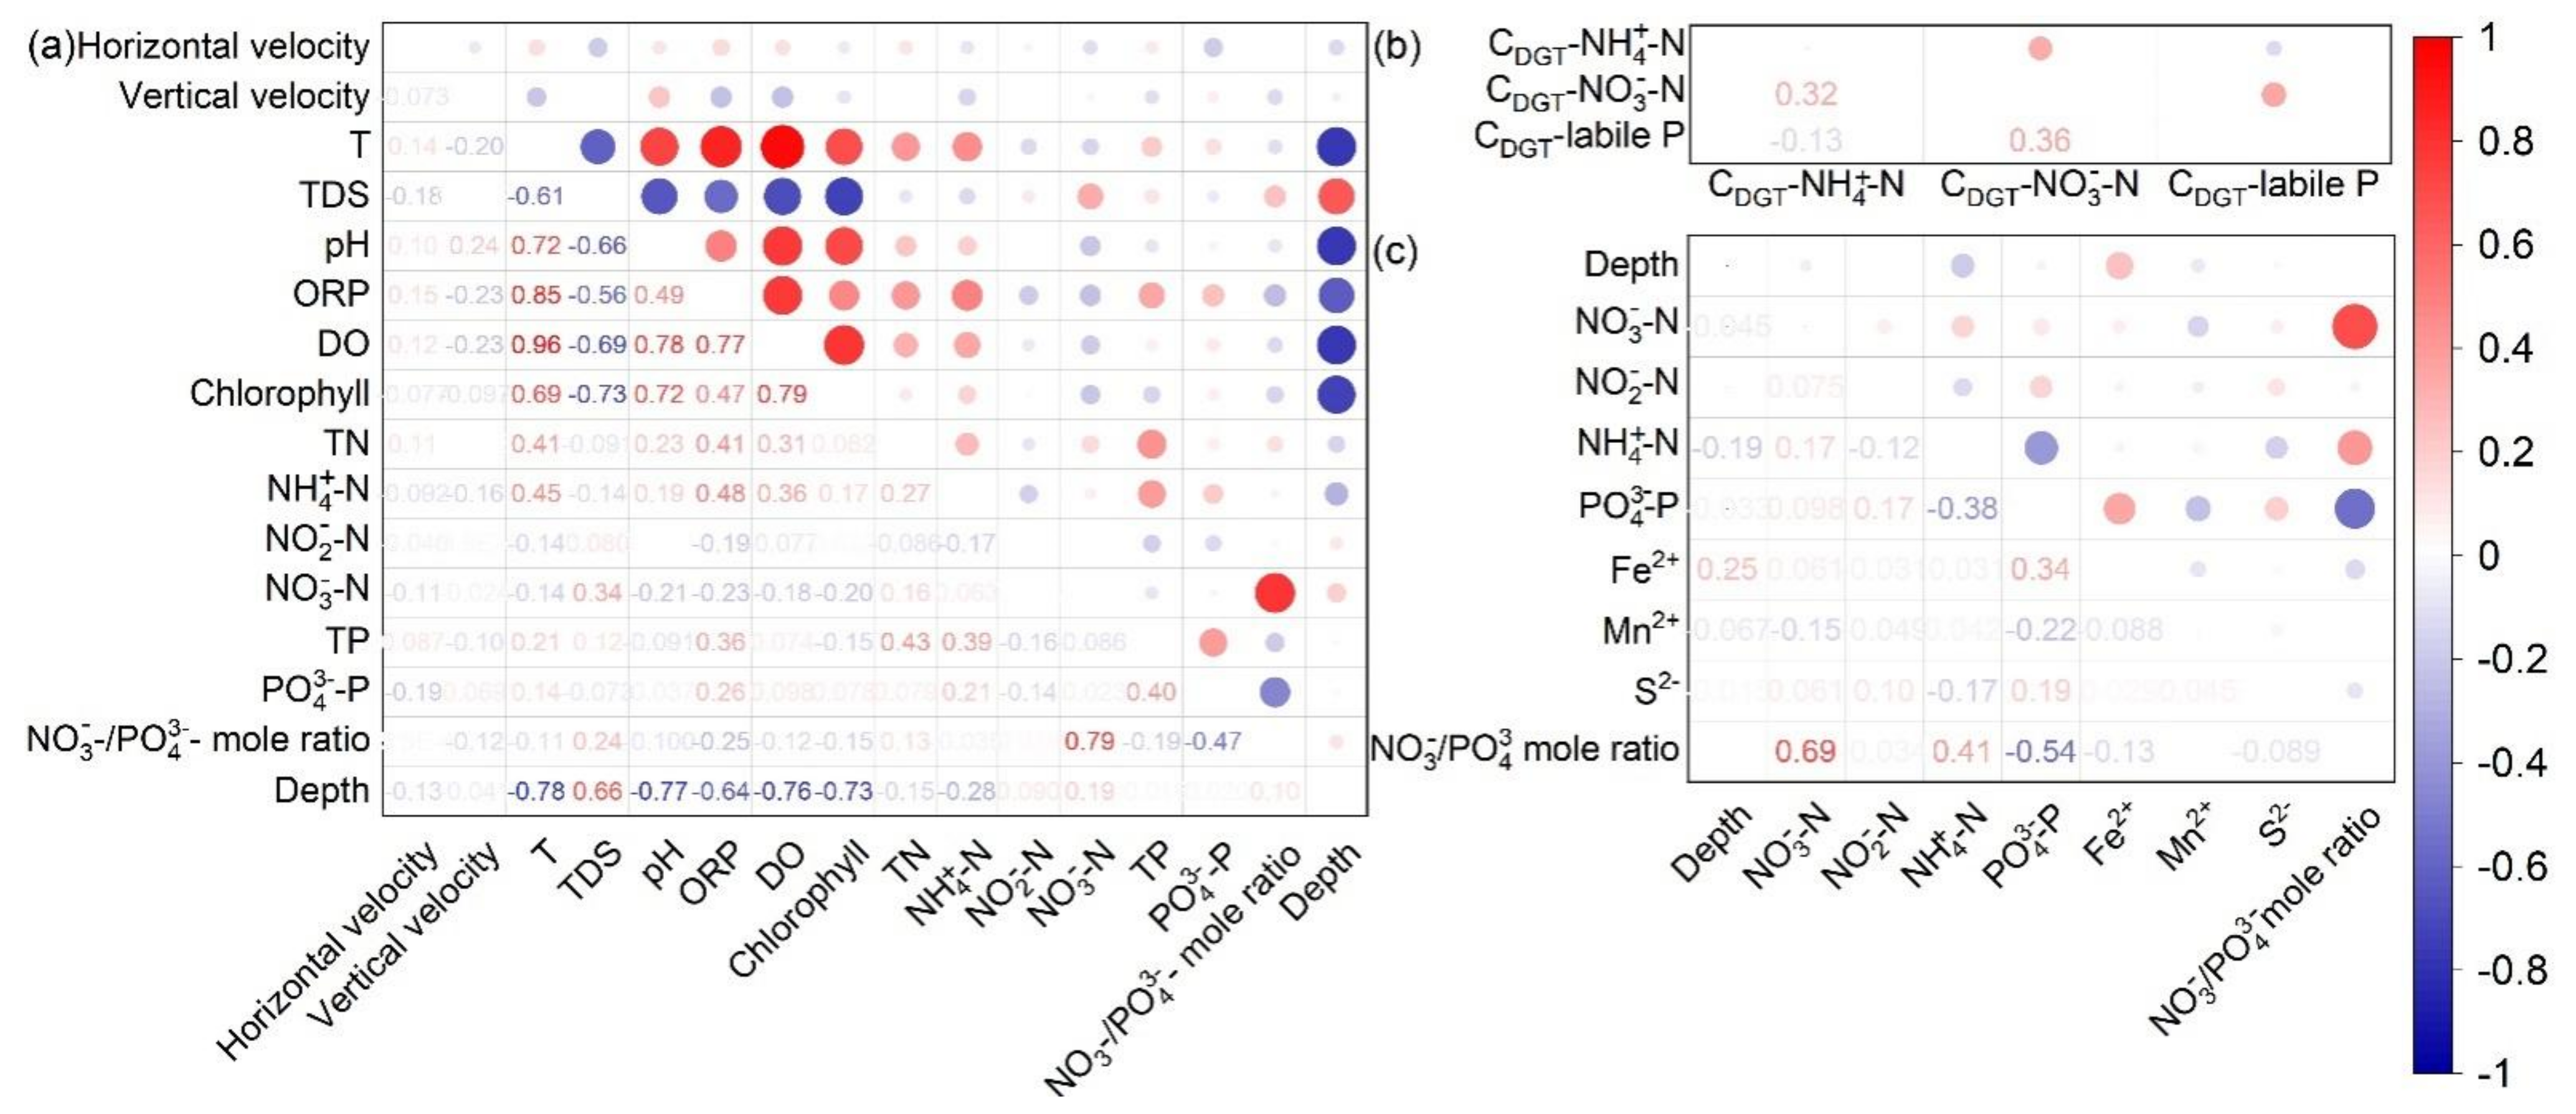
4.1. Factors Affecting Hydrochemistry, N and P Concentrations in Water and Sediment

The characteristics of T changed in the river-transition zone and static water area were varied due to the difference in the absorbing capacity by light radiation and hydrodynamics [12]. T simulation results did not show good thermal stratification in the river areas and transition areas which resulted in strong hydrodynamics, and frequent exchange of water (Figure S11). However, simulation of T showed good thermal stratification in the static and deep-water zone. T and water depth were the most important factors regulating hydrochemistry, especially in the stratified period [35]. There were positive correlations between T and pH, DO and ORP. The strong solar radiation continuously heated the surface water of the reservoir, the high specific heat capacity, and the low heat conductivity of water blocked the vertical mixing of the sub-deep lake [12,35]. Correlation analysis showed that TDS was negatively correlated with T, pH, ORP, DO, and water depth. Although velocity had poor correlations with hydrochemistry, vertical velocity had more effect on TDS, ORP, and DO than horizontal velocity. The chlorophyll content of the euphotic zone was higher in the area with a lower velocity, which may decrease the NH4+ and PO43− concentrations owing to algal growth under lower velocity (Figure 2 and Figure 5). Correlation analysis showed that water T, ORP, and DO affected TN, NH4+ concentrations, and ORP affected TP concentration (Figure 6a). In the stratified period, organic biological oxidation at SWI led DO of bottom water was reduced [36]. The hydrodynamic and photosynthesis after the oxygen mechanism of the euphotic zone and the hypolimnion were not enough to offset the decrease of DO in the bottom water. The relatively high N and P concentrations in summer mainly was attributable to more contribution from the external input and flow [7].
As for the pore water of the whole sediment cores, PO43− concentration was negatively correlated with that of NH4+ and Fe2+ (Figure 6c). This may be related to the competitive adsorption of inorganic acids from organic matter degradation [26]. The organic-metal ion binding group increases the P adsorption capacity of sediments [31]. As the limited DO in sediments, the oxidative degradation of organic matter was completed by replacing O2 with other electron acceptors, MnOOH, NO3, Fe3+, and SO42− (provided in Text S3). Under the reduction environment of the deeper sediment, S was easily reduced and generated the insoluble metal sulfide, e.g., MnS, FeS2. Mn2+ and S2−, which were less than Fe2+, had little correlation with other factors.

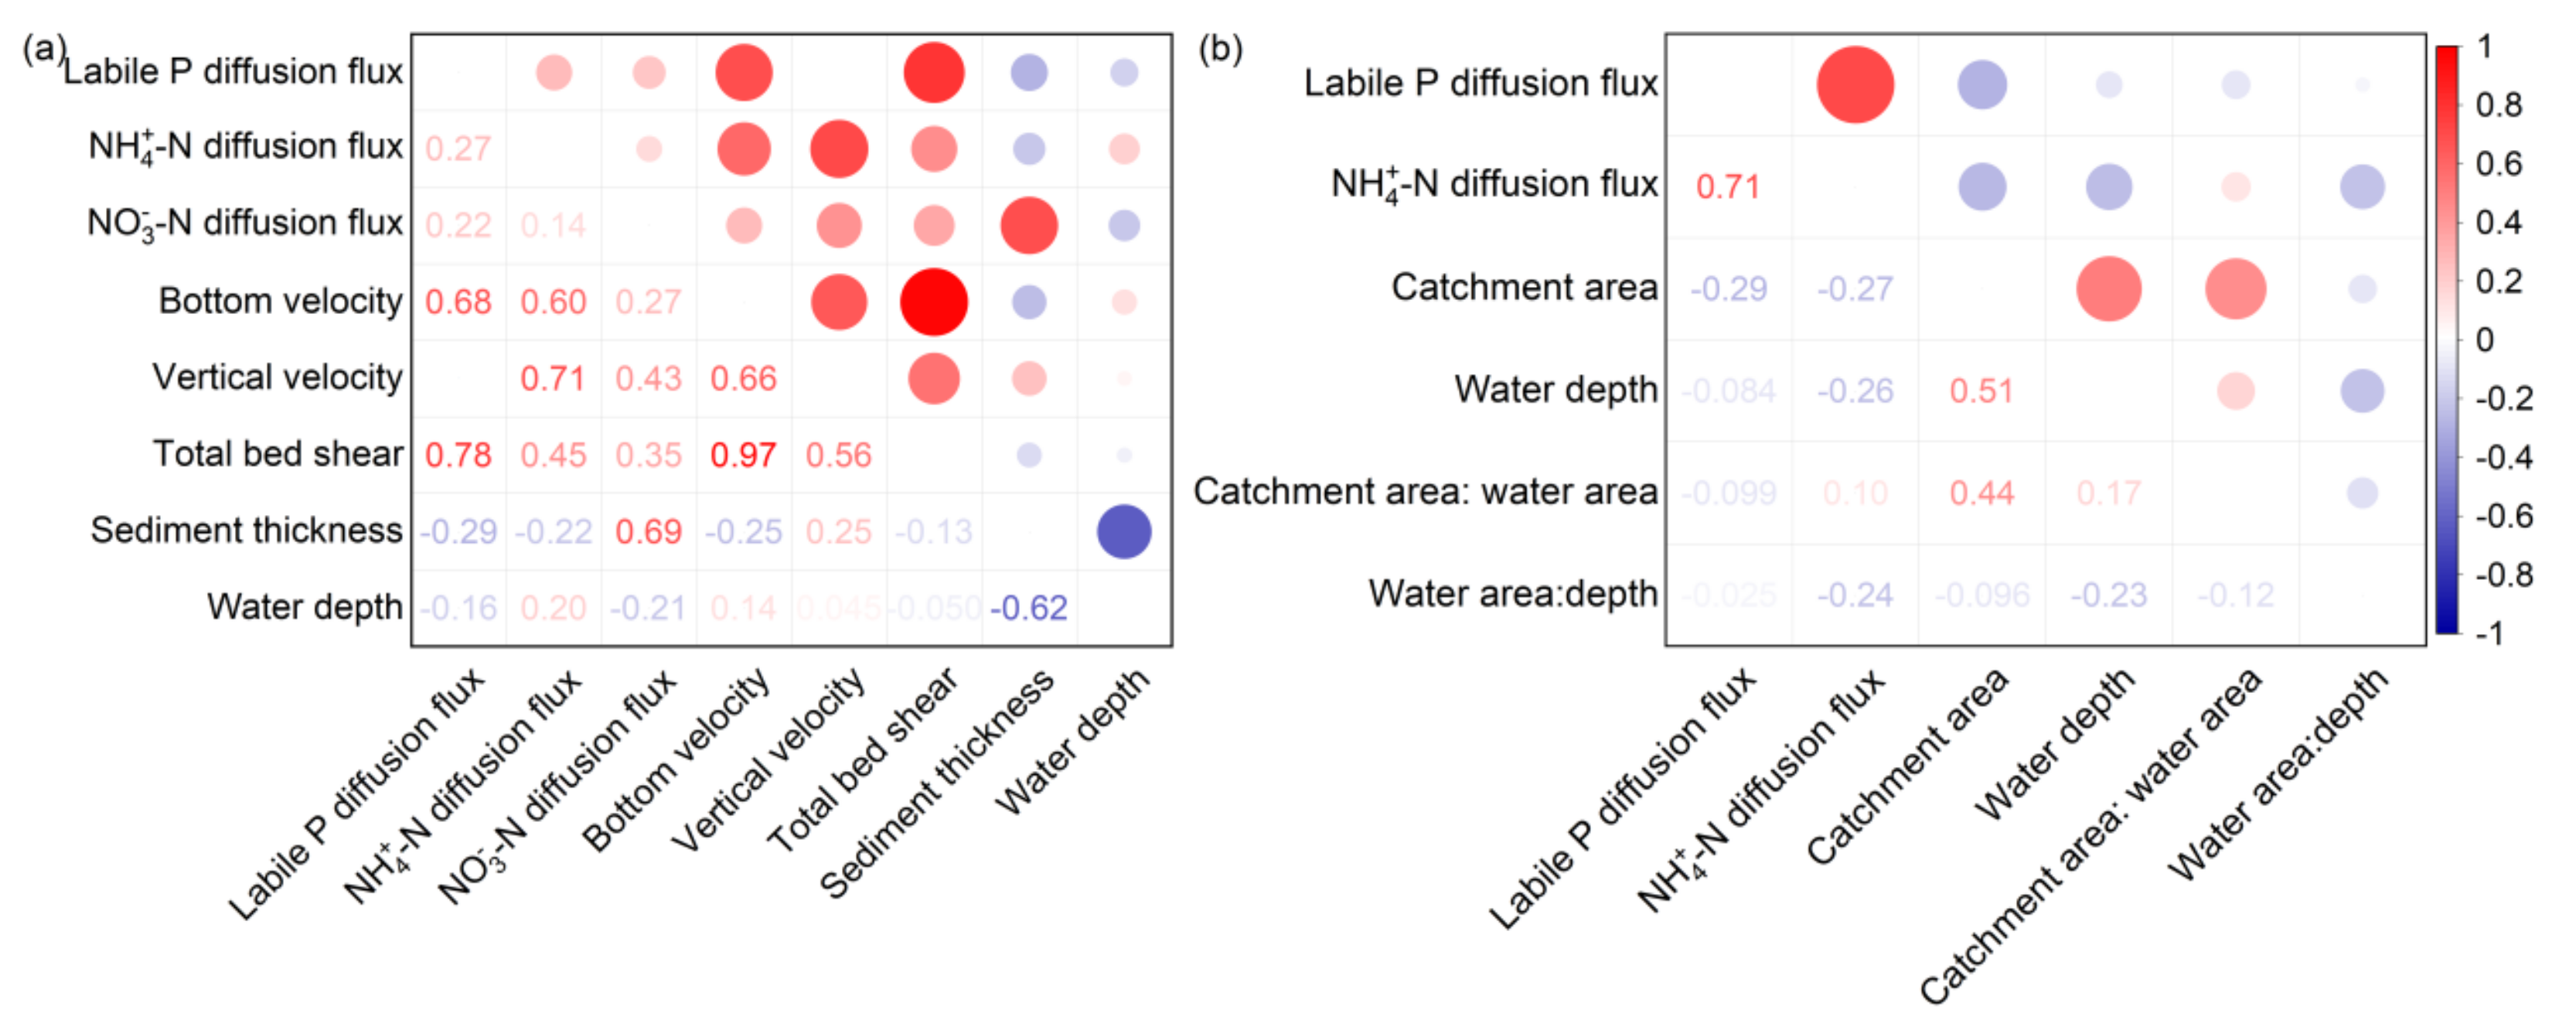
4.2. Factors Affecting the Diffusion Fluxes of NH4+, NO3, and Labile P

The change of seasonal redox conditions at SWI affects the internal release of N and P. Generally, anaerobic conditions promoted the reproduction of anaerobic microorganisms and accelerate the decomposition and release of N (particularly NH4+) and P in organic matter, which resulted in higher release flux in summer than an oxygen-rich environment in winter [28,37] (Table 3). The adsorption and desorption of unformed iron oxides and P in sediments was the main mechanism of P burial and release in sediments. The BD-P combined with Fe and Mn oxides exchanged between the overlying water and sediment, when the redox conditions changed [36,38]. The total Fe: total P ratio ~5 (adsorption of HPO42− by iron oxide) [38] of suspended particles was lower than that in sediments of a range from 13 to 17, where P (HPO42−) was adsorbed by iron oxides and iron hydroxides [17]. Fe concentration of ferric oxide form in winter was much large than that in summer, the decreased ferric oxide form Fe also led to more reduced Fe, further affecting P release [16,17].
After the effective external pollution control, the average diffusion flux of NH4+-N, NO3-N, and labile P in the present study was 39.8, 10.7, and 3.4 times lower than in 1998 [28]. Compare with the result in 2014, the average diffusion flux of labile P in the present study was only half of it of 2014 [21], which may be because of the increasingly strict watershed management [28], e.g., sewage treatment plant and fertilizer application control [39,40,41]. The internal control, inactive agent placement in the water intake area of the water plant (HF3) was tried in 2013. The release fluxes of NH4+-N and labile P in HF3 were the lowest among the 6 sampling sites. After 6 years, the inactive agent seems to be working. However, the diffusion fluxes of Hongfeng Lake in this study may be on the low side. The treatment of lake eutrophication is very difficult. Therefore, long-term control of internal and external N and P could reduce the release flux of N and P in the reservoirs system.
To compare the nutrient release flux with other lakes, Table 3 listed other research results from references. It can be found that the labile P release fluxes of Yuqiao Reservoir [42], Western Lake Erie [20], and Danjiangkou Reservoir [43] were 17, 15, and 11 times higher than that in Hongfeng Lake, respectively (Table 3). The NH4+-N release fluxes of Yuqiao Reservoir [42], Baihua Lake [28], Daheiting Reservoir [14], Hengshan Reservoir [21], and Danjiangkou Reservoir [43] were 66, 42, 28, 15, 11, and 9 times higher than that in Hongfeng Lake, respectively (Table 3). The release flux ratio of NH4+-N/labile P in 18 reservoirs or lakes (Table 3) varied from 4 to 345 with the average value was 61 ± 81, indicating the imbalance of internal N and P release.
To identify the potential influence from hydrodynamic, correlation analysis was done and shown in Figure 7. It is worth noting that positive correlations among the bottom velocity and the diffusion fluxes of labile P, NH4+-N, and NO3-N were observed (Figure 7), indicating that hydrodynamic drive the diffusion fluxes of N and P. The fluxes were higher in winter 2017 than those in summer 2019, which agreed with the velocity of the bottom water and total bed shear. In addition, the negatively correlated relationships among sediment thickness, the bottom velocity and total bed shear, which indicated that there may be less sediment in the area with strong hydrodynamic. However, based on available data from 12 reservoirs or lakes (Table 3), the catchment area, water depth, catchment area: water area and water area: depth had little effect on labile P and NH4+-N diffusion flux. There were positive relationships between labile P and NH4+-N diffusion fluxes.

5. Conclusions

There were significant seasonal and spatial differences in N and P concentrations, diffusion fluxes, velocity, and total bed shear of Hongfeng Lake. The concentrations of N and P of water in winter were lower than that in summer, expected NO2. The average concentration of labile P of pore water was 8 times that of overlying water in winter. The concentrations of NH4+, NO3, and labile P of pore water were 1.3, 1.8, and 2.2 times that of overlying water in summer, respectively. N and P contents in sediment in winter were 1.1 and 1.6 times that in summer. The main P forms changed from NaOH-SRP and residual P in winter to NaOH-NRP HCl-P and residual P in summer. The main Fe forms changed from ferric oxide form and residual form in winter to carbonate bounded form, ferric oxide form, and residual form in summer. In summer, the calcium deposited by river erosion combines with P and Fe under alkaline conditions. Excess Fe can effectively inhibit P release. The mean release of labile P was 2.05 mg/(m2·day) in winter, 2017. The average diffusion fluxes of NH4+-N, NO3-N and labile P were 3.4, −37.2, and 0.9 mg/(m2·day) in summer, 2019, respectively. The effect of diffusion fluxes on overlying water and sediment was very weak. Those values were less than the previous study in Hongfeng Lake. This is mainly due to internal and external N and P control. Under effective water management, the nutrient release fluxes greatly decrease compared to 30 years ago. Using EFDC modeling, the bottom velocities, vertical velocities, and total bed shear in summer (1.2, 2.3, and 1.5 times, respectively) were observed than in winter. Solar radiation and water depth affected the distribution of the T field, which affected the vertical distribution of hydrochemistry, N and P, subsequently resulting in the position of the thermocline during the stratified period. Correlation analysis suggested that bottom velocity and total bed shear accelerated the diffusion fluxes of NH4+-N, NO3-N, and labile P, which is consistent with our previous hypothesis. The results also suggested it is static necessary to control the input of the external N and P in summer. In the future, atmospheric dry and wet deposition, sediment, and water quality models need to be combined to understand the nutrient cycles in lake or reservoir systems.

Supplementary Materials

The following are available online at https://www.mdpi.com/article/10.3390/w13223232/s1. Figure S1: Average solar radiation and precipitation in 30 years. Atmospheric pressure, dry bulb temperature, relative humidity, rainfall, evaporation, wind speed and wind direction in 2013, 2017 and 2019, Figure S2: Sediment core sampling, storage, and treatment. (a) portable sediment sampler, (b) Sediment cores collected with a portable sediment sampler, (c) clear sediment-water interface, (d,e) DGT technology devices added at sediment-water interface, (f) films of ZrO-AT devices cut with 2-mm interval by the ceramic knife, (g) color film of ZrO device by molybdenum antimony color reagent in winter, (h) the thin film of ZrO scanned in a scanner, (i) sediment cut with 1-cm interval. Figure S3: Water temperature (a), pH (b), and DO (c) of water profiles in Hongfeng Lake in winter, Figure S4: Water temperature (a), pH (b), DO (c), ORP (d), Chlorophyll (e), and TDS (f) of water profiles in Hongfeng Lake in summer, Figure S5: Water temperature of river outlets(a) and still water zone (b) of water profiles in Hongfeng Lake in summer, Figure S6: P and Fe concentration and proportion of surface sediment of Hongfeng Lake, Figure S7: Correlation analysis among inflow, lake water velocity and total bed shear, Figure S8: Linear relationship between water vertical velocity and cumulative daily radiation, Figure S9: The simulated velocity magnitude of surface water, the vertical velocity, bottom water, and total bed shear in sample sites in January. The legend from top to bottom showed HF1~ 6 in turn, Figure S10: The simulated velocity magnitude of surface water, the vertical velocity, bottom water, and total bed shear in sample sites in July. The legend from top to bottom showed HF1~ 6 in turn, Figure S11. The water velocity (a) Day 14:00 29/07/ 2013; (b) Light 20:00 30/07/2013; (c) Temperature in the profiles of Hongfeng Lake; (d) The black line in Hongfeng Lake is the section. Table S1: Characteristics of the 24 water sampling sites and 6 sediment sampling sites, Table S2: Hydrodynamic and temperature modules parameter of Hongfeng Lake in EFDC, Table S3: Sample points information for verification and input data, Table S4: Verification of temperature module of Hongfeng Lake by EFDC and measured data, Table S5: Concentration in sediment, deposit rate, enrichment degree in sediment, release flux of N and P at the sediment-water interface in Hongfeng Lake, Table S6: Porosity φ, diffusion coefficient Ds, diffusion flux of NH4+, NO3, labile P surface sediment concentration, deposited fluxes of N and P, and the contribution rate of diffusion flux on the overlying water and sediment in Hongfeng Lake, Table S7: Velocity and total bed shear at HF1~HF6, Hongfeng Lake, in winter (W) and summer (S) (mean ± standard deviation).

Author Contributions

Conceptualization, Q.S.; data curation, Q.S., F.Y., J.W. and Y.L.; formal analysis, F.Y.; funding acquisition, J.W. and S.L.; investigation, Q.S. and X.L.; supervision, J.C., J.W., and S.L.; writing—review and editing, Q.S., F.Y., J.C., J.W., Y.L., X.L., M.A.B., J.L. and S.L. All authors have read and agreed to the published version of the manuscript.

Funding

This research was funded national key research and development projects (No. 2016YFA0601002), National Natural Science Foundation of China (No. 41403113; 42073076) and China Scholarship Council (No. 201906250213).

Institutional Review Board Statement

Not applicable.

Informed Consent Statement

Not applicable.

Data Availability Statement

The data is included in the main text and the Supplementary Materials.

Acknowledgments

Authors thank three anonymous reviewers for the constructive comments, which improved an early version of this manuscript.

Conflicts of Interest

The authors declare no conflict of interest.

References

  1. Raven, J. Interactions Between Nitrogen and Phosphorus Metabolism. In Annual Plant Reviews Book Series, Volume 48: Phosphorus Metabolism in Plants II. P-Sensing, Transport, and Metabolism; Jonn Wiley & Sons, Ltd.: West Wussex, UK, 2015; pp. 187–214. [Google Scholar]
  2. Elser, J.; Bracken, M.; Cleland, E.; Gruner, D.; Harpole, W.; Hillebrand, H.; Ngai, J.; Seabloom, E.; Shurin, J.; Smith, J. Global analysis of nitrogen and phosphorus limitation of primary producers in freshwater, marine and terrestrial ecosystems. Ecol. Lett. 2007, 10, 1135–1142. [Google Scholar] [CrossRef] [PubMed] [Green Version]
  3. Peñuelas, J.; Poulter, B.; Sardans, J.; Ciais, P.; van der Velde, M.; Bopp, L.; Boucher, O.; Godderis, Y.; Hinsinger, P.; Llusia, J.; et al. Human-induced nitrogen–phosphorus imbalances alter natural and managed ecosystems across the globe. Nat. Commun. 2013, 4, 2934. [Google Scholar] [CrossRef] [PubMed] [Green Version]
  4. Smith, V.H.; Tilman, G.D.; Nekola, J.C. Eutrophication: Impacts of excess nutrient inputs on freshwater, marine, and terrestrial ecosystems. Environ. Pollut. 1999, 100, 179–196. [Google Scholar] [CrossRef]
  5. Harrison, J.A.; Maranger, R.J.; Alexander, R.B.; Giblin, A.E.; Jacinthe, P.-A.; Mayorga, E.; Seitzinger, S.P.; Sobota, D.J.; Wollheim, W.M. The regional and global significance of nitrogen removal in lakes and reservoirs. Biogeochemistry 2009, 93, 143–157. [Google Scholar] [CrossRef]
  6. Maavara, T.; Parsons, C.T.; Ridenour, C.; Stojanovic, S.; Dürr, H.H.; Powley, H.R.; Van Cappellen, P. Global phosphorus retention by river damming. Proc. Natl. Acad. Sci. USA 2015, 112, 15603–15608. [Google Scholar] [CrossRef] [PubMed] [Green Version]
  7. Paerl, H.W.; Xu, H.; McCarthy, M.J.; Zhu, G.; Qin, B.; Li, Y.; Gardner, W.S. Controlling harmful cyanobacterial blooms in a hyper-eutrophic lake (Lake Taihu, China): The need for a dual nutrient (N & P) management strategy. Water Res. 2011, 45, 1973–1983. [Google Scholar] [CrossRef]
  8. Elser, J.J.; Marzolf, E.R.; Goldman, C.R. Phosphorus and Nitrogen Limitation of Phytoplankton Growth in the Freshwaters of North America: A Review and Critique of Experimental Enrichments. Can. J. Fish. Aquat. Sci. 1990, 47, 1468–1477. [Google Scholar] [CrossRef]
  9. Abell, J.M.; Özkundakci, D.; Hamilton, D.P. Nitrogen and Phosphorus Limitation of Phytoplankton Growth in New Zealand Lakes: Implications for Eutrophication Control. Ecosystems 2010, 13, 966–977. [Google Scholar] [CrossRef] [Green Version]
  10. Schindler, D.W.; Hecky, R.E.; Findlay, D.L.; Stainton, M.P.; Parker, B.R.; Paterson, M.J.; Beaty, K.G.; Lyng, M.; Kasian, S.E.M. Eutrophication of lakes cannot be controlled by reducing nitrogen input: Results of a 37-year whole-ecosystem experiment. Proc. Natl. Acad. Sci. USA 2008, 105, 11254–11258. [Google Scholar] [CrossRef] [Green Version]
  11. Zhou, B.; Fu, X.; Wu, B.; He, J.; Vogt, R.D.; Yu, D.; Yue, F.; Chai, M. Phosphorus Release from Sediments in a Raw Water Reservoir with Reduced Allochthonous Input. Water 2021, 13, 1983. [Google Scholar] [CrossRef]
  12. Ji, Z. Hydrodynamics. In Hydrodynamics and Water Quality; John Wiley & Sons Inc.: Hoboken, NJ, USA, 2017; pp. 11–71. [Google Scholar]
  13. Wu, G.; Xu, Z. Prediction of algal blooming using EFDC model: Case study in the Daoxiang Lake. Ecol. Model. 2011, 222, 1245–1252. [Google Scholar] [CrossRef]
  14. Wen, S.; Wu, T.; Yang, J.; Li, X.; Gong, W.; Zhong, J. Distribution characteristics and exchange flux of nitrogen and phosphorus at the sediment-water interface of Daheiting Reservoir in winter. China Environ. Sci. 2019, 39, 1217–1225. (In Chinese) [Google Scholar]
  15. Li, Q.; Wang, F.; Yu, Q.; Yan, W.; Li, X.; Lv, S. Dominance of nitrous oxide production by nitrification and denitrification in the shallow Chaohu Lake, Eastern China: Insight from isotopic characteristics of dissolved nitrous oxide. Environ. Pollut. 2019, 255, 113212. [Google Scholar] [CrossRef]
  16. Rysgaard, S.; Fossing, H.; Jensen, M.M. Organic matter degradation through oxygen respiration, denitrification, and manganese, iron, and sulfate reduction in marine sediments (the Kattegat and the Skagerrak). Ophelia 2001, 55, 77–91. [Google Scholar] [CrossRef]
  17. Jensen, H.S. Iron:Phosphorus ratio in surface sediment as an indicator of phosphate release from aerobic sediments in shallow lakes. Hydrobiologia 1992, 235, 731–743. [Google Scholar] [CrossRef]
  18. Valklump, J.; Martens, C.S. Chapter 12 Bethic nitrogen regeneration. In Nitrogen in the Marine Environment; Carpenter, E.J., Capone, D.G., Eds.; Academic Press: Burlington, MA, USA, 1983; pp. 411–457. [Google Scholar]
  19. Luo, J.; Chen, J.; Wang, J.; Ding, S. Estimation of the phosphorus flux from the sediment of Hongfeng Lake using the Zr-oxide diffusive gradient in thin films (Zr-oxide DGT) Technique. Bull. Mineral. Petrol. Geochem. 2015, 34, 1014–1020. (In Chinese) [Google Scholar] [CrossRef]
  20. Matisoff, G.; Kaltenberg, E.M.; Steely, R.L.; Hummel, S.K.; Seo, J.; Gibbons, K.J.; Bridgeman, T.B.; Seo, Y.; Behbahani, M.; James, W.F.; et al. Internal loading of phosphorus in western Lake Erie. J. Great Lakes Res. 2016, 42, 775–788. [Google Scholar] [CrossRef]
  21. Cui, H.; Chen, S.; Yang, C.; Tang, W.; Yin, P.; Yin, H. Endogenous pollution and release characteristics of bottom sediments of Hengshan Reservoir in Yixing City. Environ. Sci. 2020, 41, 5400–5409. (In Chinese) [Google Scholar] [CrossRef]
  22. Zhu, Q.; van Prooijen, B.C.; Wang, Z.; Ma, Y.; Yang, S. Bed shear stress estimation on an open intertidal flat using in situ measurements Author links open overlay panel. Estuar. Coast. Shelf Sci. 2016, 182, 190–201. [Google Scholar] [CrossRef]
  23. Grant, W.D.; Madsen, O.S. Combined wave and current interaction with a rough bottom. J. Geophys. Res. Ocean. Atmos. 1979, 84, 1797–1808. [Google Scholar] [CrossRef]
  24. Davison, W.; Zhang, H. Progress in understanding the use of diffusive gradients in thin films (DGT)—back to basics. Environ. Chem. 2012, 9, 1–13. [Google Scholar] [CrossRef]
  25. Tian, P.; Fu, Q.; Zheng, B.; Wang, G.; Yao, X. Environmental risk assessment of industrial enterprises in drinking water sources of Hongfeng Lake. Res. Environ. Sci. 2013, 26, 787–792. (In Chinese) [Google Scholar]
  26. Zhu, Y.; Zhang, R.; Wu, F.; Qu, X.; Xie, F.; Fu, Z. Phosphorus fractions and bioavailability in relation to particle size characteristics in sediments from Lake Hongfeng, Southwest China. Environ. Earth Sci. 2013, 68, 1041–1052. [Google Scholar] [CrossRef]
  27. YSI ADV6600 Operations Manual, Xylem Inc., USA. Available online: https://www.ysi.com/file%20library/documents/manuals%20for%20discontinued%20products/adv6600.pdf (accessed on 15 October 2021).
  28. Wang, Y. Biogeochemistry of Nutrient Elements (Carbon, Nitrogen and Phosphorus) at Sediment-Water Interface in Hongfeng Lake and Baihua Lake, Guizhou Province. Ph.D. Thesis, Institute of Geochemistry, Chinese Academy of Sciences, Guiyang, China, 2001. (In Chinese). [Google Scholar]
  29. Ding, S.; Wang, Y.; Xu, D.; Zhu, C.; Zhang, C. Gel-based coloration technique for the submillimeter-scale imaging of labile phosphorus in sediments and soils with diffusive gradients in thin films. Environ. Sci. Technol. 2013, 47, 7821–7829. [Google Scholar] [CrossRef] [PubMed]
  30. Xu, D.; Wu, W.; Ding, S.; Sun, Q.; Zhang, C. A high-resolution dialysis technique for rapid determination of dissolved reactive phosphate and ferrous iron in pore water of sediments. Sci. Total Environ. 2012, 421–422, 245–252. [Google Scholar] [CrossRef]
  31. Hupfer, M.; Gächter, R.; Giovanoli, R. Transformation of phosphorus species in settling seston and during early sediment diagenesis. Aquat. Sci. 1995, 57, 305–324. [Google Scholar] [CrossRef]
  32. Tessier, A.; Campbell, P.G.C.; Bisson, M. Sequential extraction procedure for the speciation of particulate trace metals. Anal. Chem. 1979, 51, 844–851. [Google Scholar] [CrossRef]
  33. Ullman, W.J.; Aller, R.C. Diffusion coefficients in nearshore marine sediments1. Limnol. Oceanogr. 1982, 27, 552–556. [Google Scholar] [CrossRef]
  34. Wan, G. 137Cs dating by annual distinguish for recent sedimentation: Samples from Erhai Lake and Hongfeng Lake. Quat. Sci. 1999, 1, 74–79. (In Chinese) [Google Scholar]
  35. Cantin, A.; Beisner, B.E.; Gunn, J.M.; Prairie, Y.T.; Winter, J.G. Effects of thermocline deepening on lake plankton communities. Can. J. Fish. Aquat. Sci. 2011, 68, 260–276. [Google Scholar] [CrossRef]
  36. Xu, Y.; Chen, J.; Wang, J.; Luo, J. The micro-scale investigation on the effect of redox condition on the release of the sediment phosphorus in Lake Hongfeng. J. Lake Sci. 2016, 28, 68–74. (In Chinese) [Google Scholar] [CrossRef]
  37. Reddy, K.R.; Fisher, M.M.; Ivanoff, D. Resuspension and Diffusive Flux of Nitrogen and Phosphorus in a Hypereutrophic Lake. J. Environ. Qual. 1996, 25, 363–371. [Google Scholar] [CrossRef]
  38. Buffle, J.; De Vitre, R.R.; Perret, D.; Leppard, G.G. Physico-chemical characteristics of a colloidal iron phosphate species formed at the oxic-anoxic interface of a eutrophic lake. Geochim. Cosmochim. Acta 1989, 53, 399–408. [Google Scholar] [CrossRef]
  39. Xu, S.; Li, S.; Zhong, J.; Li, C. Spatial scale effects of the variable relationships between landscape pattern and water quality:Example from an agricultural karst river basin, Southwestern China. Agric. Ecosyst. Environ. 2020, 300, 106999. [Google Scholar] [CrossRef]
  40. Li, Z.; Liu, H.; Jiang, C.; Gu, X.; Tu, Y. Non-point source pollution load of Hongfeng Lake reserve based on export coefficient model. Bull. Soil Water Conserv. 2020, 40, 193–198. (In Chinese) [Google Scholar] [CrossRef]
  41. Liu, X.-L.; Han, G.; Zeng, J.; Liu, M.; Li, X.-Q.; Boeckx, P. Identifying the sources of nitrate contamination using a combined dual isotope, chemical and Bayesian model approach in a tropical agricultural river: Case study in the Mun River, Thailand. Sci. Total Environ. 2021, 760, 143938. [Google Scholar] [CrossRef]
  42. Wen, S.; Gong, W.; Wu, T.; Zheng, X.; Jiang, X.; Li, X.; Zhong, J. Distribution characteristics and fluxes of nitrogen and phosphorus at the sediment-water interface of Yuqiao Reservoir. Environ. Sci. 2018, 39, 2154–2164. (In Chinese) [Google Scholar] [CrossRef]
  43. Wang, Z.; Liu, X.; Yao, Z.; Yao, L.; Chang, Y.; Liu, Z.; Cao, L. Endogenous release of Nitrogen and Phosphorus in the Danjiangkou Reservoir. Environ. Sci. 2019, 40, 4953–4961. [Google Scholar] [CrossRef]
  44. Zhang, H.; Chen, J.; Zeng, Y.; Wang, J.; Yang, H. A simulation study on calcium nitrate restraining the release of phosphorus from sediments. Earth Environ. 2015, 43, 565–571. (In Chinese) [Google Scholar] [CrossRef]
  45. Qu, Y. Nitrogen and Phosphorus Release of Cynodon dactylon (L). Pers. and Biochar Control in the Water-Level-Fluctuation Zone of the Three Gorges Reservoir. Master’s Thesis, Chongqing Three Gorges University, Chongqing, China, 2019. (In Chinese). [Google Scholar]
  46. Weng, Y.; Su, Y.; Zhang, Y.; Shao, K.; Zhan, X.; Liu, Y.; Jiang, B. Internal phosphorus loadings and fluxes of surface sediments in four summers in Shanzi reservoir. J. Lake Sci. 2014, 26, 871–878. (In Chinese) [Google Scholar]
  47. Huang, Y.; Liu, F.; Shi, J. Distribution features and diffusion fluxes of nutrient in interstitial water of a source water reservoir. Chin. J. Environ. Eng. 2016, 10, 4357–4363. (In Chinese) [Google Scholar] [CrossRef]
  48. Chen, Y.; Qin, B.; Teubner, K.; Dokulil, M.T. Long-term dynamics of phytoplankton assemblages: Microcystis-domination in Lake Taihu, a large shallow lake in China. J. Plankton Res. 2003, 25, 445–453. [Google Scholar] [CrossRef]
  49. Yu, J.; Fan, C.; Zhong, J.; Zhang, Y.; Wang, C.; Zhang, L. Evaluation of in situ simulated dredging to reduce internal nitrogen flux across the sediment-water interface in Lake Taihu, China. Environ. Pollut. 2016, 214, 866–877. [Google Scholar] [CrossRef]
  50. Qin, B.; Zhu, G.; Zhang, L.; Luo, L.; Gao, G.; Gu, B. Estimation of internal nutrient release in large shallow Lake Taihu, China. Sci. China D Earth Sci. 2006, 49, 38–50. [Google Scholar] [CrossRef]
  51. Zou, R.; Wu, Z.; Zhao, L.; Elser, J.J.; Yu, Y.; Chen, Y.; Liu, Y. Seasonal algal blooms support sediment release of phosphorus via positive feedback in a eutrophic lake: Insights from a nutrient flux tracking modeling. Ecol. Model. 2020, 416, 108881. [Google Scholar] [CrossRef]
  52. Liu, S.; Zhao, J.; Xiao, S.; Ni, Z.; Wang, S. Spatio-Temporal Variation of Release Flux of Sediment Nitrogen and Phosphorus in High-Risk Period of Algal Bloom in Lake Erhai. Environ. Sci. 2020, 41, 734–742. [Google Scholar] [CrossRef]
  53. Mu, Y.; Shi, H.; Zhao, B.; Sun, C.; Gao, Y.; Zhang, Z.; Li, C. Pollution load of Nitrogen and Phosphorus from Cage Aquaculture in Yangcheng lake. China Water Wastewater 2018, 34, 86–91. (In Chinese) [Google Scholar] [CrossRef]
  54. Fan, C.; Zhang, L.; Yang, L.; Huang, W.; Xu, P. Simulation of internal loanding of nitrogen and phosphorus in a lake. Oceanol. Limnol. Sinica 2002, 33, 370–378. (In Chinese) [Google Scholar]
  55. Haggard, B.E.; Moore, P.A., Jr.; Delaune, P.B. Phosphorus flux from bottom sediments in Lake Eucha, Oklahoma. J. Environ. Qual. 2005, 34, 724–728. [Google Scholar] [CrossRef] [Green Version]
Figure 1. Water and sediment sampling sites of Hongfeng Lake (a), the red point represents the location of the reservoir in China map, precipitation (b), flow (c), and water level (d) from 1959 to 2020. The dotted line represented the average value in (bd).
Water 13 03232 g001
Figure 2. Hydrochemistry distribution in 24 profiles on 29 July 2019 (from Taoguayuan river outlet to Yangchang river outlet, which was 4 km and 14 km from the dam, respectively). (a) water T, (b) pH, (c) chlorophyll, and (d) TDS.
Water 13 03232 g002
Figure 3. The profile variation of TN (a), NH4+-N (b), NO2 -N (c), NO3-N (d), TP (e), PO43−-P (f), NO3/PO43− mole ratio (g), and TDS (h) of water in Hongfeng Lake during winter (2 January 2017, HF1~HF2) and summer (12 July 2019, HF1~HF6). Red squares and black cycles represented the values in winter and summer, respectively.
Water 13 03232 g003
Figure 4. The concentrations of labile P at SWI in winter (a), labile P concentrations (a), NO3-N concentrations (b), NO3-N: labile P mole ratio (c), and NH4+-N concentrations (d) at SWI in summer.
Water 13 03232 g004
Figure 5. Flow field in winter (a) and summer (b); average velocity of the vertical profile in winter (c) and summer (d) simulated by EFDC. The arrow represents the direction of flow, + means input river, − means the output of the reservoir.
Water 13 03232 g005
Figure 6. Correlation analysis among N, P, and other indexes of surface water ((a), n = 104), overlying water ((b), n = 50), and pore water ((c), n = 212) in Hongfeng Lake in summer.
Water 13 03232 g006
Figure 7. Correlation analysis among labile P, NH4+-N and NO3-N diffusion fluxes, velocity, total bed shear, sediment thickness and water depth in Hongfeng Lake on 29 July 2019 ((a), n = 6), correlation analysis among labile P, NH4+-N diffusion fluxes, water depth, catchment area and water area (data were referred to Table 3) ((b), n = 12).
Water 13 03232 g007
Table 1. The average concentration of N and P (mg/L) at South lake and North lake of water profiles in Hongfeng Lake during winter and summer.
NumberWinterSummer
North LakeSouth LakeNorth LakeSouth Lake
1286961
TN2.57 ± 0.212.51 ± 0.124.41 ± 1.483.51 ± 1.59
NO3-N1.62 ± 0.181.56 ± 0.061.63 ± 0.571.76 ± 0.93
NO2-N0.03 ± 0.010.04 ± 0.000.01 ± 0.010.02 ± 0.02
NH4+-N0.25 ± 0.140.20 ± 0.060.28 ± 0.220.21 ± 0.17
TP 0.04 ± 0.010.04 ± 0.010.04 ± 0.020.04 ± 0.02
PO43−-P0.03 ± 0.000.03 ± 0.000.04 ± 0.010.04 ± 0.01
Table 2. Diffusion fluxes, their contribution to overlying water and sediment of NH4+-N, NO3-N and labile P, bottom velocity, vertical velocity, and total bed shear at HF1~HF6, Hongfeng Lake.
Sites Mixing PeriodStratified Period
HF1HF2HF1HF2HF3HF4HF5HF6HF1 bHF2 b
NH4+-N flux c6655 a6233 a37 ± 10583 ± 1315 ± 22−47 ± 68 e15 ± 4578 ± 403625810458
Contribution Overlying70.966.40.005 ± 0.0140.008 ± 0.0120.006 ± 0.023 0.016 ± 0.0500.002 ± 0.00828.354.4
Contribution Sediment9.319.43.13 ± 8.850.59 ± 0.181.24 ± 5.09 1.31 ± 2.040.56 ± 0.2912.925.1
NO3-N flux c1744 a2116 a−1553 ± 3371643 ± 893328 ± 359−362 ± 231 e−466 ± 1654 e−436 ± 777 e14721447
Contribution Overlying37.156.3 0.052 ± 0.0720.044 ± 0.048 16.622.6
Contribution Sediment0.04790.119 0.024 ± 0.0330.110 ± 0.120 0.05280.0751
Labile P flux c102 a, 55 a, 71.7108 a, 55 a, 82.01.5 ± 0.315 ± 391.3 ± 1.33 ± 325 ± 428 ± 838, 3125, 15
Contribution Overlying0.20 a; 0.400.20 a; 0.060.003 ± 0.0010.006 ± 0.0130.010 ± 0.0100.004 ± 0.0040.098 ± 0.1620.007 ± 0.0070.14; 0.150.08; 0.08
Contribution Sediment239 a, 12.6223 a, 5.640.061 ± 0.0112.22 ± 4.920.35 ± 0.350.14 ± 0.153.46 ± 5.735.31 ± 5.47239223
Bottom velocity 10−2 m/s3.75 ± 1.113.62 ± 1.401.85 ± 1.102.36 ± 0.840.30 ± 0.111.10 ± 0.321.69 ± 0.701.16 ± 0.85
Vertical velocity10−4 m/s2.67 ± 2.7812.96 ± 9.022.81 ± 0.4115.76 ± 5.94−0.35 ± 0.43−3.8 ± 0.89 f−6.2 ± 0.39 f1.29 ± 1.36
Total bed shear 10−2 N/m23.92 ± 2.103.88 ± 2.481.23 ± 2.721.45 ± 1.350.04 ± 0.040.55 ± 0.631.31 ± 2.431.31 ± 2.43
Note: a means the HPO42− data on 12 February 1999, and 29 April 1998, N data on 29 April 1998, b means P data on 30 July, 3 September 1999, N data on 3 September 1999 [28]. c the unit of flux is 10−6 nmol·cm−2·s−1. e minus sign, −, means molecule’s diffusion from overlying water to pore water. f minus sign, −, refereed to the negative direction in sigma three dimensions coordinate. The unit of Contribution Sediment was 10−3. HF1, HF3, HF4 and HF5 were in South lake, HF2 and HF6 were in North lake.
Table 3. The diffusion fluxes of labile P, NH4+-N and NO3-N at SWI.
SitesConditionsDiffusion Flux
NH4+-N
(g m−2 yr−1)
NO3-N
(g m−2 yr−1)
Labile P (mg m−2 yr−1)
Baihua Lake, China [28] Fick’s First Law31.6 (28.0~34.9)5.8 (3.8~8.2)524.5 (288.3~755.6)
Hongfeng Lake, China [28]Fick’s First Law31.9 (26.8~45.0)7.5 (6.4~9.3)521.9 (146.0~1051.2)
Hongfeng Lake, China [44]Static incubationconditions 456.3
Hongfeng Lake, China [19] Fick’s First Law 270 (11~596)
Hongfeng Lake, ChinaThis studyFick’s First Law0.8 (−2.7~1.8)−0.7 (−22.4~12.7)154.9 (1.6~910.8)
Three Gorges Reservoir, China [45] 0.8 (0.1~1.4) 2.2 (−1.1~4.7)
Danjiangkou Reservoir, China [43]Fick’s Fist Law1.0~2.6 14.6~65.7
Static incubation conditions4.8~9.1 1116.9~2197.3
Shanzi Reservoir, China [46] 251.9~897.9
Zhouchun Reservoir, China [47] 22.9~48.6 146.0~474.5
Daheiting Reservoir, China [14] 1.3~40.3 36.5~584.0
Yuqiao Reservoir, China [42] 7.5~91.6 401.5~4854.5
Hengshan Reservoir, China [21] 1.3~15.3 138.7~416.1
Taihu Lake, China −41.6~48.1 [48]−12.8~1.5 [49]−1186.3~2069.6 [50]
Dianchi Lake, China [51] 7.2 (N) 270.0
Erhai Lake, China [52] 2.3~3.7 (TON),1.9~5.2 (DIN) 25.5~32.9 (DIP), 14.6~18.2 (DOP)
Yangcheng Lake, China [53] 0.40.643.8 (TP)
Luoma Lake, China [54] 4.4 50
Apopka Lake, USA [37] 9.1 365.0
Eucha Lake, USA [55]Aerobic 378.0
Anaerobia 1606.0
Aerobic add alum 401.5
Anaerobic add alum 200.8
Western Lake Erie, Canada [20]Anoxic 401.5~4296.0
Publisher’s Note: MDPI stays neutral with regard to jurisdictional claims in published maps and institutional affiliations.

