
Validation of an In-Situ Observation Method for Nonpoint Source Pollution in Paddy Fields: A Case Study of a Beijing Paddy Field


Beijing Key Laboratory of Urban Hydrological Cycle and Sponge City Technology, College of Water Sciences, Beijing Normal University, Beijing 100875, China
*
Author to whom correspondence should be addressed.
Water 2021, 13(22), 3235; https://doi.org/10.3390/w13223235
Submission received: 29 September 2021
/
Revised: 9 November 2021
/
Accepted: 11 November 2021
/
Published: 15 November 2021
(This article belongs to the Special Issue Response Mechanism of Non-point Source Nitrogen Output in Farmland)
Abstract
:A Beijing paddy field, along with in-situ experiments, was used to validate and refine the in-situ observation (IO) method to describe nonpoint source pollution (NPS) in paddy fields. Based on synchronous observed rainfall, water depth, and water quality data at two locations (1# (near inlet) and 2# (near outlet)) with large elevation differences, the evapotranspiration and infiltration loss (ET+F), runoff depth and NPS pollution load were calculated according to IO, and a common method was used to calculate ET+F. Then, the results of the different methods and locations were compared and analyzed. The results showed that 1# observation point was located at a lower position compared with 2# observation point. According to 1# observation point, there were 5 days of dry field in the drying period, which was consistent with the actual drying period, and there was a dry period of 9 days based on 2# observation point. The ET+F estimated by IO fit well with the calculated values. In the experiment, 6 overflows and 1 drainage event were identified from the observed data at locations 1# and 2#. The relative deviation of the NPS pollution of total nitrogen (TN), total phosphorus (TP), chemical oxygen demand (COD), nitrate-nitrogen (NO3−-N) and ammonia nitrogen (NH4+-N) was between 0.6% and 2.0%. The water level gauge location had little influence on IO but mostly affected the water depth observations during the field drying period. The mareographs should be installed in low-lying paddy field areas to monitor water depth variation throughout the whole rice-growing season.
1. Introduction
China is the largest rice producer and consumer in the world [1,2]. To increase rice yield, most rice planting areas in China use excessive chemical fertilizers and pesticides. Chemical fertilizers and pesticides, except for a small portion absorbed by rice, are mostly lost to the environment through gaseous loss, leaching, or surface runoff, causing pollution to the environment [3,4]. Due to the large rice planting area, severe nitrogen and phosphorus losses cause nonpoint source (NPS) pollution [5,6]. Especially with fertilization early or during the rainy season, nitrogen and phosphorus loss is the most significant [7,8]. Therefore, reducing runoff pollution has become a necessary measure to control nonpoint source pollution [9,10]. Accurately verifying paddy fields’ nonpoint source pollution load is significant for reducing chemical fertilizers and formulating a total pollution control system [11,12].
Currently, there are three ways to observe NPS pollution in rice paddies: the runoff storage pond method (RSP) [13,14], synchronous observation (SO) method [15], and in-situ observation (IO) method [16,17]. The RSP method requires the construction of a runoff pond with a specific volume at the outlet of a paddy field. The pond should have an individual runoff outlet and an unchangeable ridge height, all of which has impacts on crop planting and harvesting, and the construction costs are relatively expensive. Thus, this method is often used in experiment stations or experimental plots. The SO method requires the observation of the water volume and water quality at the water inlet and outlet simultaneously and deduction of the pollutant load from the water inlet through the water balance relationship to obtain the pollution caused by the outflow of the rice field [18]. This method also requires a separate water inlet and outlet.
The IO method requires only the installation of a mareograph in the paddy field, and combined with observed surface water quality data, NPS pollution in outflow from the paddy field can be derived. The method is simple to operate and saves labor and material resources. Although this method has been applied in research on NPS pollution of different paddy fields [17,19], its accuracy and adaptability have not been effectively verified: (1) This method only requires the installation of a mareograph at the outlet of the rice field, and whether the difference in the elevation of the bottom of the paddy field affects the calculation results has not been explored; (2) This method uses the steady decline stage of water depth as the basis for the estimation of evapotranspiration and infiltration loss and does not explore whether there is a significant difference between the estimation method and common calculation methods. Thus, further research is needed.
In the present study, a paddy plot in Beijing was chosen for experiments to verify the applicability of the IO method. Mareographs were installed at the water inlet (point 1#) and outlet (point 2#) positions with large bottom elevation differences to explore whether there are significant differences in evapotranspiration and infiltration loss (ET+F), runoff, and pollutant export coefficients estimated by the IO method based on two sets of water depth observation data at different locations in the same paddy field. Moreover, using the meteorological data of the 2017 rice season, the evapotranspiration (ET) was calculated by the crop coefficient method with the recommended FAO-56 Penman-Monteith equation [20], and the infiltration (F) were calculated by a common method [21,22], then compared with the (ET+F) estimated by IO to further validate and refine the IO method and provide a more appropriate approach for field experiments on NPS pollution from paddy fields.
2. Methods and Data
2.1. Experimental Site
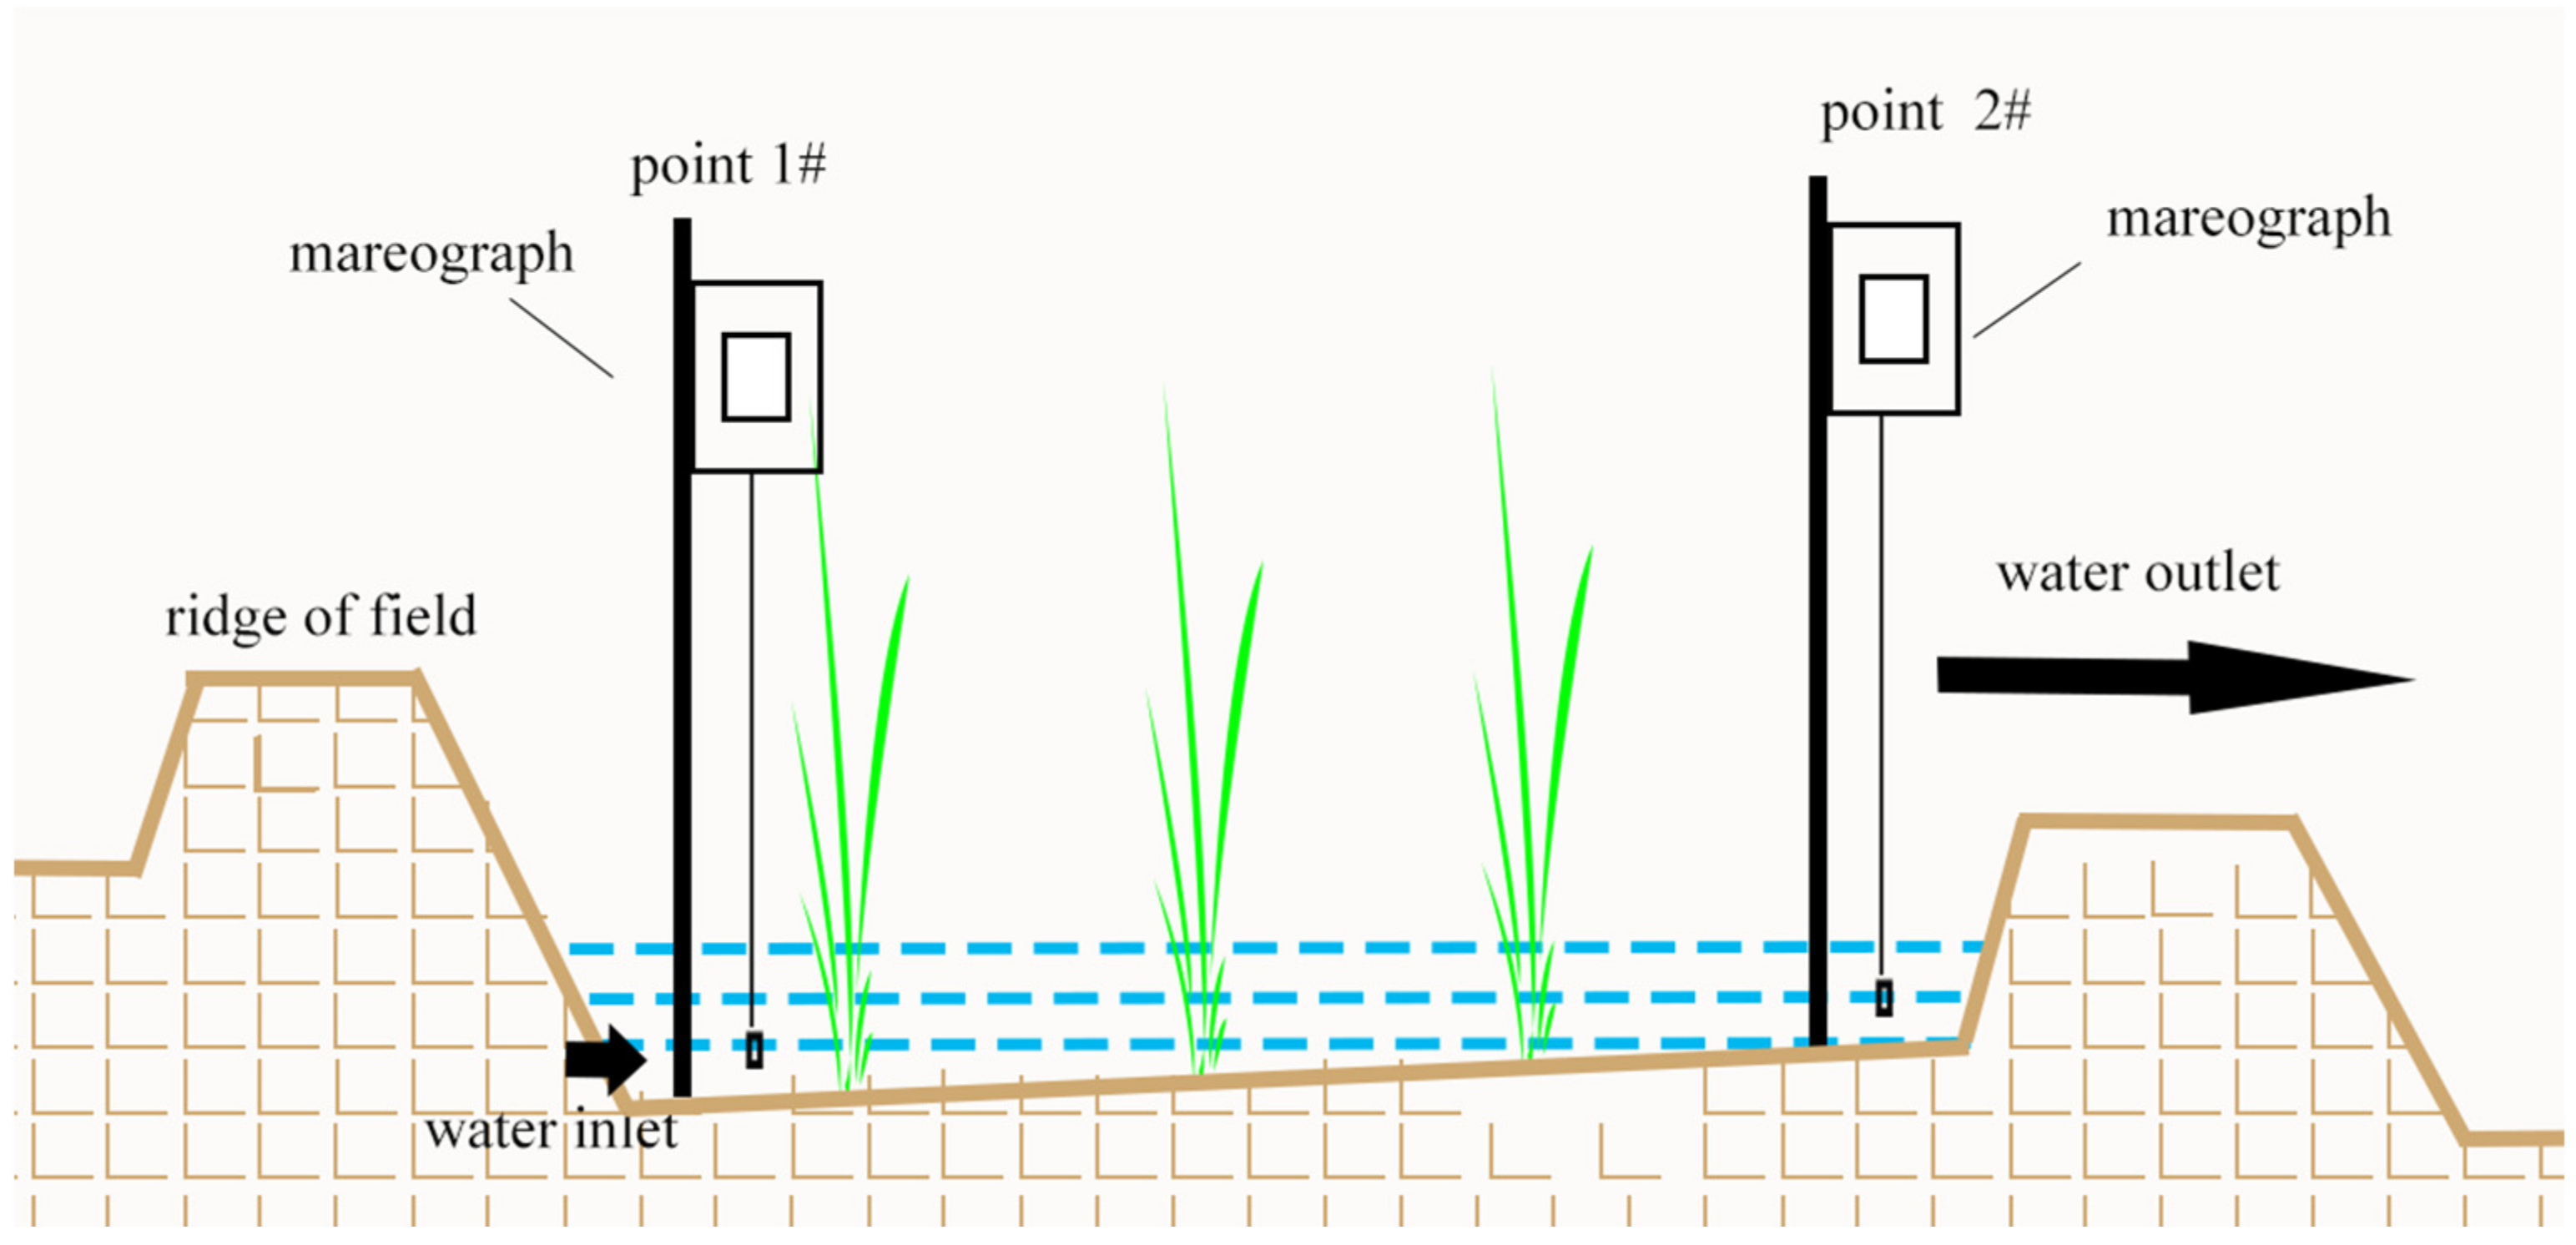
This study was conducted at the Haidian district rice planting base in 2017, with a paddy field area of 625 m2. In this experiment, point 1#, which was located in the low-lying area and near the water inlet, and point 2#, which was near the water outlet, were selected as the test points (Figure 1). The paddy fields were transplanted in early June and fertilized once at the end of June and July. The paddy field was irrigated many times throughout the growing season, with the most significant irrigation times in July and August. The paddy field was irrigated by intermittent groundwater irrigation, except on rainy days. Sometimes the number of irrigations per day was two or more. High-frequency irrigation was stopped after 25 August and switched to small-scale irrigation with a relatively low flow and frequency.
The water and fertilizer management measures for the experimental fields were as follows: seedlings were transplanted in early June, harvested in mid-October, the growth period was approximately 150 days, and the observation period was from 14 June to 23 August, totaling 70 days. After 25 August, irrigation was stopped, and the paddy field was dried out. On 25 May, base fertilizer was uniformly applied with compound fertilizer applied at 375 kg/hm2 and urea applied at 45 kg/hm2 by the manual spreading method. Topdressing fertilizer was applied 25 June and 10 July with urea at 12.5 kg/hm2.
2.2. Data Collection
To obtain continuously observed precipitation and water depth data, a pluviograph was set up to record precipitation every 10 min, and a mareograph was set up to record the surface water depth of paddy fields every 30 min. Moreover, different sampling points were selected in the target paddy plot to measure the average water quality of surface water at regular intervals. Moreover, water samples were collected twice a week for water quality analysis in the laboratory. The NH4+-N (ammonium nitrogen), NO3−-N (nitrate-nitrogen), and TN (total nitrogen) concentrations were determined using Nessler’s reagent colorimetric I method, the UItraviolet spectrophotometry method, and the Alkaline potassium persiflage digestion-UV spectrophotometric method, respectively. The TP (total phosphorus) and COD (chemical oxygen demand) concentrations were determined using the molybdenum-antimony anti-spectrophotometric method and UV absorption spectroscopy, respectively.
The fundamental meteorological data, which are on a daily scale, were obtained from the Haidian Meteorological Station. The data include cumulative precipitation (mm), average relative humidity (%), mean wind speed (m s−1), sunshine duration (h), mean air temperature (°C), maximum air temperature (°C), minimum air temperature (°C) and net radiation (MJ m−2 day−1). The mean wind speed was measured at 2 m above ground level.
2.3. Data Analysis Methods
2.3.1. Runoff Calculation from the Paddy Field
The variation in the water depth of paddy fields depends mainly on precipitation, irrigation, evapotranspiration, infiltration and runoff [23]. When there is always water in a paddy field, the water variation can be calculated using the water balance model [24]. The water balance equation is as follows:
where P is the daily precipitation (mm), Rin is the irrigation water inflow depth (mm), (ET+F) is the evapotranspiration and infiltration loss (mm), Rout is the water outflow depth (mm), and ∆H is the depth variation (mm).
Based on water balance Equation (1), the irrigation and runoff of the paddy field could be calculated by daily precipitation, the water depth difference between the first and second days, and ET+F, as shown in Equation (2).
where Pi is the precipitation (mm d−1) of day i, ETi is the evapotranspiration (mm d−1) of day i, Fi is the infiltration (mm d−1) of day i, Hi is the water depth (mm) of day i, Hi+1 is the water depth (mm) of day i + 1, ΔRi is the difference (mm d−1) between the water inflow and outflow of day i, Rin,i is the paddy irrigation of water (mm d−1) of day i and Rout,i is the paddy outflow of water (mm d−1) of day i.
2.3.2. (ET+F) Estimation by the IO Method
The ET+F of paddy fields is estimated by using the IO method. Factors influencing water depth include natural factors and artificial factors. Natural factors mainly include ET+F and precipitation. Artificial factors mainly include irrigation and artificial drainage. When there was no rainfall, irrigation, or artificial drainage, the steady decline in the water depth variation process line was only affected by the (E+F) process. Therefore, the Equation (1) can be simplified as follows:
The key procedure for estimating ET+F based on IO method of precipitation and water depth is to detect steady decline processes of water depth, which were selected to calibrate ET+F by determining the steady decreasing rate of the water depth. The rice growing period includes four stages: returning green, tillering, jointing-booting and maturation. ET+F analysis was applied to the observation of water retained in the paddy field.
2.3.3. ET Caculation by the Common Method
The crop coefficient method with the recommended FAO-56 Penman-Monteith equation [25] is applied to calculate the ET of paddy fields with synchronous meteorological data. In this paper, the single crop coefficient method was applied. During the rice jointing-booting stage, water remained in the paddy field, indicating that there was no water stress. The ETc of the paddy field is calculated as follows:
where ETc is the daily ET (mm day−1) of the paddy field, ET0 is the reference crop evapotranspiration (mm day−1), and KC is the rice coefficient.
- 1.
- Reference crop evapotranspiration (ET0)
The FAO 56 Penman-Monteith (PM) method is one of the most extensively used methods for ET0 estimation in open field conditions [26,27]. The FAO 56 Penman-Monteith method defines the reference crop as a hypothetical crop with an assumed height of 0.12 m, with a surface resistance of 70 s m−1 and an albedo of 0.23, closely resembling evaporation from an extensive surface of green grass. The ET0 is defined and calculated using the FAO-56 Penman-Monteith equation:
where ET0 is the reference crop evapotranspiration (mm day−1), Rn is the net radiation at the crop surface (MJ m−2 day−1), G is the soil heat flux density (MJ m−2 day−1), T is the mean daily air temperature at 2 m height (°C), u2 is the wind speed at 2 m height (m s−1), es is the saturation vapor pressure (kPa), ea is the actual vapor pressure (kPa), (es − ea) is the saturation vapor pressure deficit (kPa), 1 is the slope vapor pressure curve (kPa °C−1), and γ is the psychrometric constant (kPa °C−1).
- 2.
- The rice coefficient (KC)
The crop coefficient incorporates crop characteristics and averaged effects of evaporation from the field of the single crop coefficient method. The FAO-56 Penman-Monteith equation gives the recommended values of the crop coefficient during different crop growing stages under standard conditions. For the rice coefficient (KC), the recommended value was adjusted to the nonstandard condition value using the following equation:
where KC,mid is the recommended value of the growing stage, RHmin is the mean value for daily minimum relative humidity (%) during the growing stage, and h is the mean maximum plant height (m).
2.3.4. Infiltration (F) Calculation by the Common Method
Infiltration (F) in paddy fields is divided into horizontal leakage and vertical leakage, which is an important part of rice water consumption. Due to the large differences in topography, soil conditions and hydrological conditions, the amount of paddy field leakage in various parts of our country varies greatly. According to the two conditions of the water layer and the non-water layer in the field, the paddy field leakage was calculated according to the linear model and the nonlinear model, respectively.
- (1)
- When Hi > 0, it is assumed that there is a linear relationship between F and the depth of the field water layer.where Si is the infiltration in paddy fields (mm) of day i, a and b are fitting parameters, with a = 0.09 and b = 2.58.
- (2)
- When Hi = 0. At the later stage of rice growth, there is often no water layer on the field surface. At this time, since the soil moisture content in the paddy field is higher than the water holding rate in the field, the soil water content in the root layer of rice still decreases significantly, and the F value can be calculated according to Equation (8):where Si is the infiltration of the paddy field on day i, mm; and K0 is the saturated hydraulic conductivity (m/d), which is mainly related to the soil texture, which is generally 0.1~1.0 m/d. α is an empirical constant, generally ranging from 50 to 250, ti is the time when the saturated soil moisture content reaches level (d), and H is the depth of the rice main root layer (m).
2.3.5. Accuracy Analysis
In this analysis the relationship between the calculated and estimated values were determined by statistical measures including the coefficient of determination (R2), mean bias error (MBE), root mean square error (RMSE), relative root mean square error (RRMSE) and index of agreement (d) (Table 1).
2.3.6. Runoff Pollution Calculation
It was difficult to determine the pollutant concentration of all runoff in the paddy field in-situ observation, so the paddy field water was collected and analyzed regularly. The pollution concentration variation during the growing period was obtained by the interpolation method. The runoff pollution was calculated by multiplying the runoff depth by the pollutant concentration as follows:
where L is the pollution load generated during the rice growth period (mg), Cq is the pollutant concentration corresponding to the outflow from the qth rainfall event (mg/L), Rout is the outflow depth (mm), and S is the experimental field area (m2).
3. Results and Discussion
3.1. Analysis of Evapotranspiration and Infiltration Loss
3.1.1. Comparison of (ET+F) between Points 1# and 2#
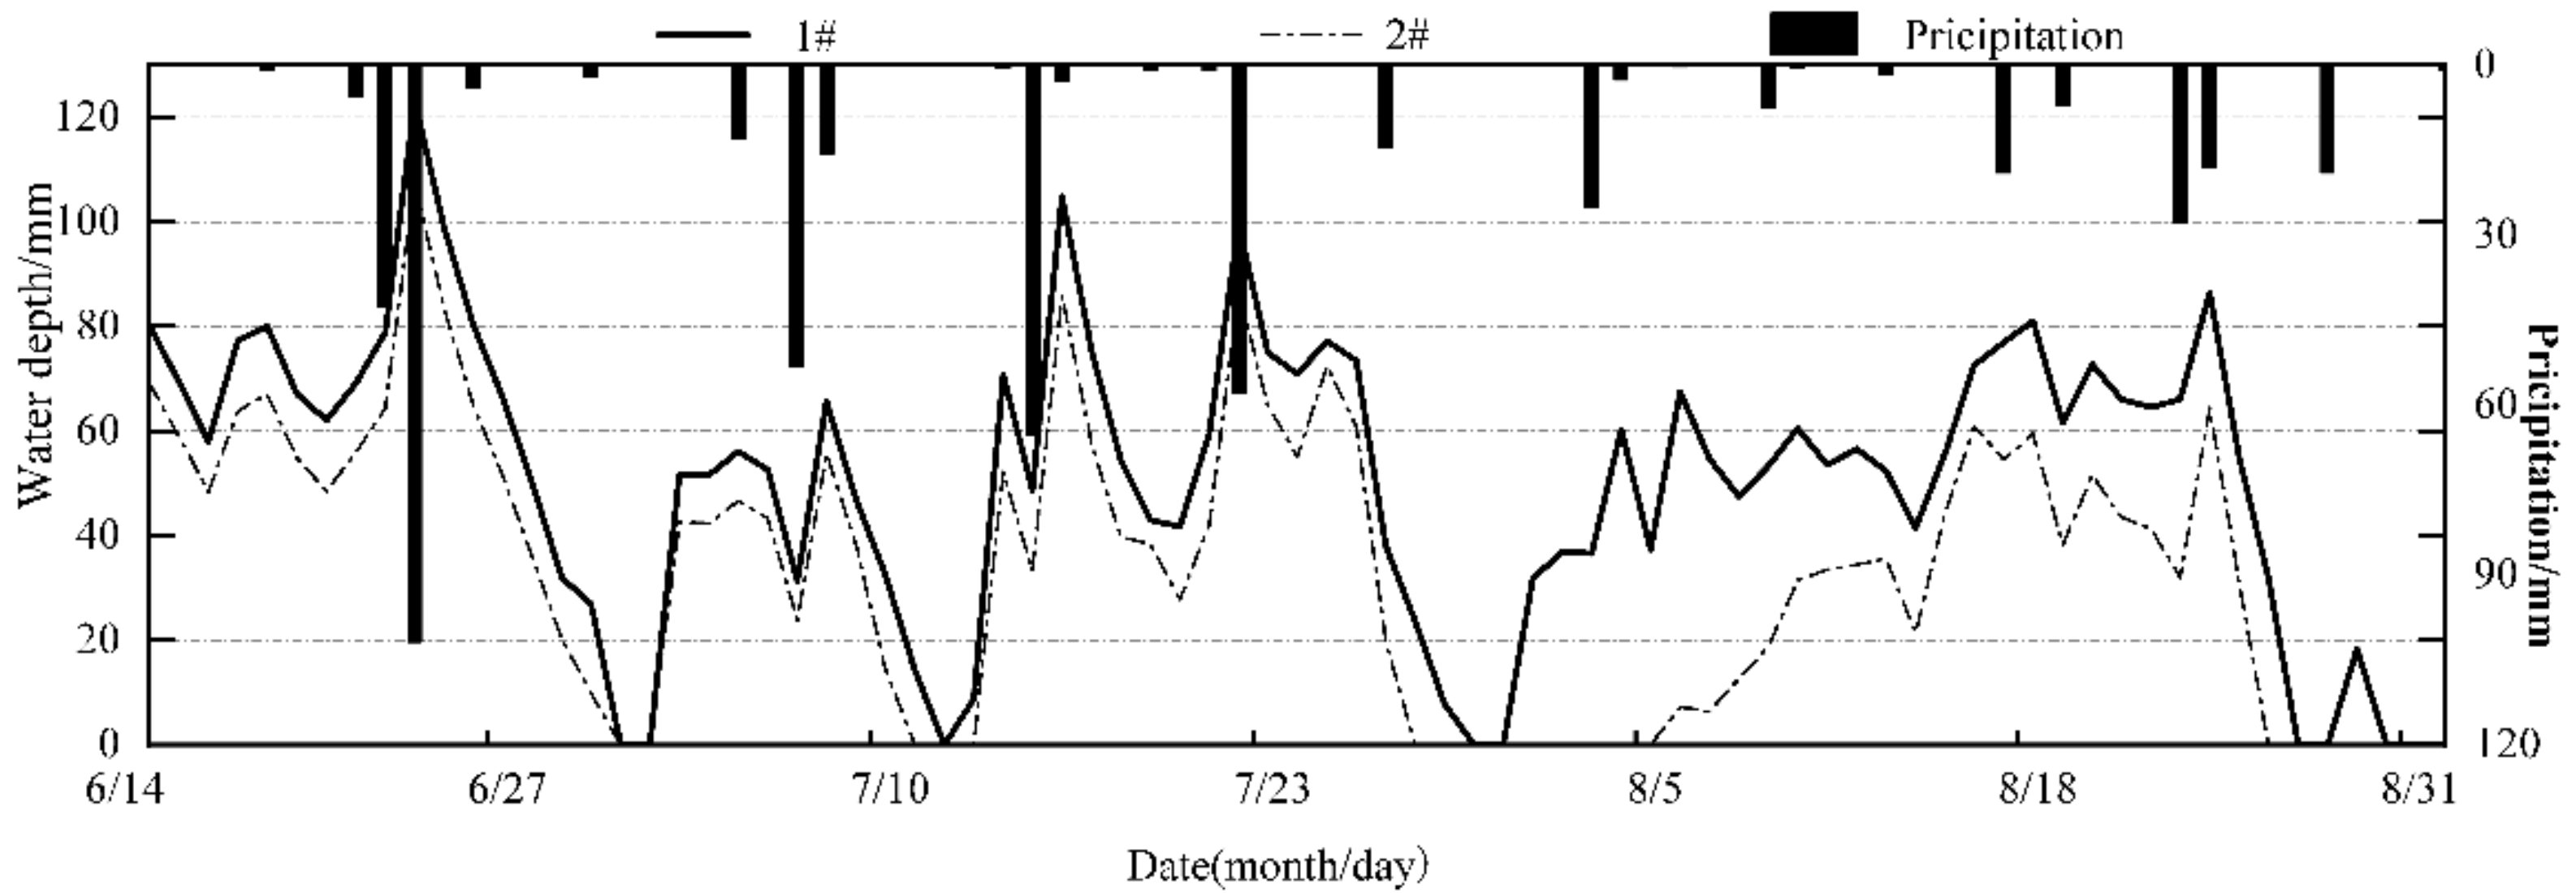
The growing period division, water depth and hyetograph of points 1# and 2# in the paddy field are shown in Figure 2. Due to the uneven bottom of the paddy field and the relatively low position of point 1#, the water depth was slightly deeper than that of point 2#. The water depth at point 2 during the drying period was 0, and the water depth height difference in other periods fluctuated at approximately 10 mm, with an average of 10.78 mm. After 23 August, the rice entered the mature period, and no irrigation was carried out. There was basically no water in the field, and no runoff occurred.
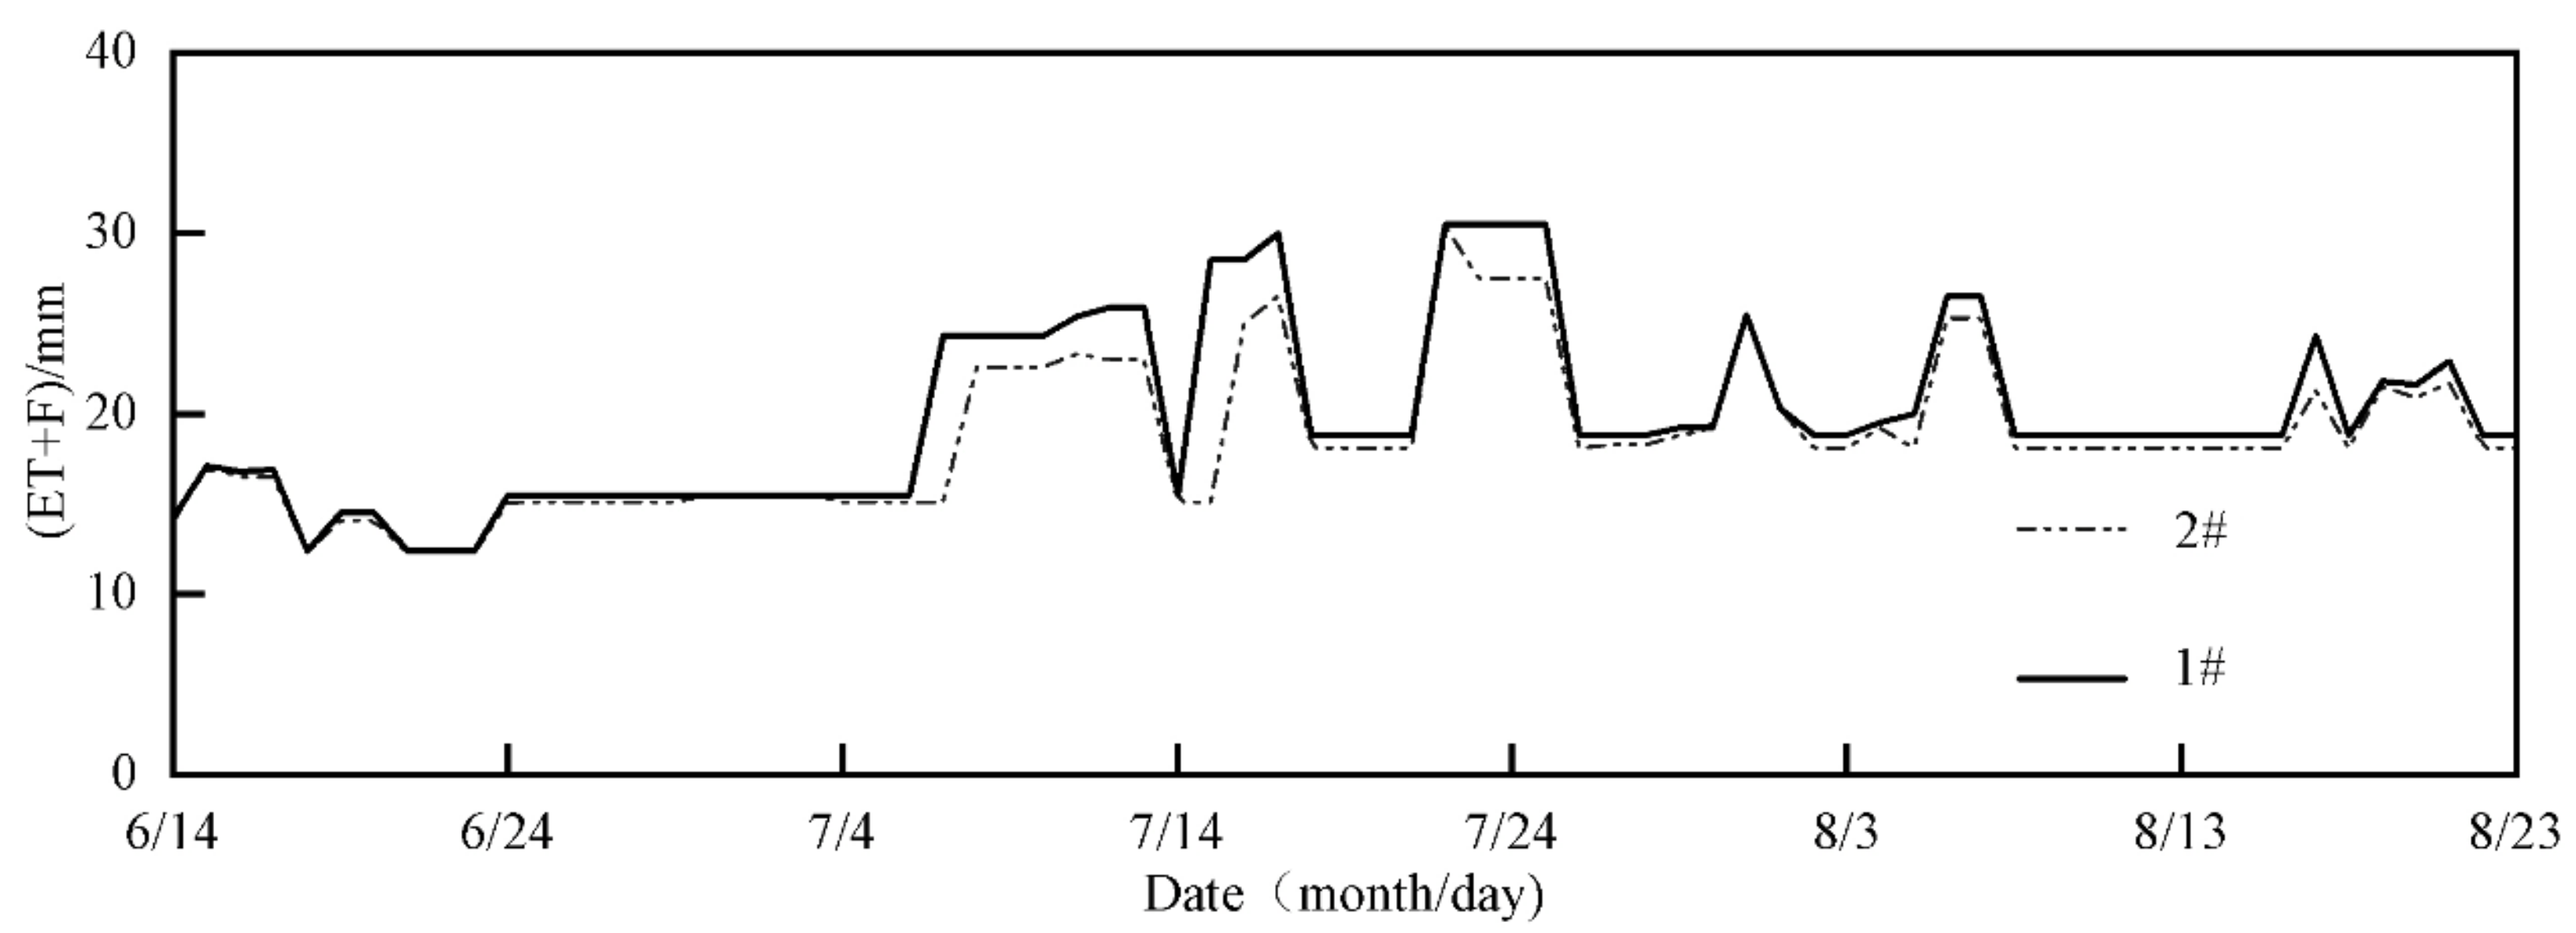
Figure 3 shows that the (ET+F) values derived from the water level data of 1# and 2# were roughly the same. The value of ET+F during the returning green period was the lowest: the average value based on point 1# data was 14.5 mm; the average value based on point 2# data was 14.2 mm; that at the tillering period was relatively high: the average value based on point 1# was 21.4 mm; and the average value based on point 2# was 20.6 mm. The value at the jointing-booting stage was the highest: the average value based on point 1# was 22.3 mm, and the average value based on point 2# was 21.5 mm. Since the paddy field in the study area was planted in the third year, it was dry land before, so the overall loss of ET+F was relatively significant. The reason why ET+F based on point 1# was slightly larger than that based on point 2# was investigated. The main reason is that the field surface of the rice field is uneven, resulting in significant differences in water depth measurements during the drying period. The water depth in period 1# was recorded as 0 for only 5 days, which was basically in line with the actual drying period, but there were 9 days in point 2# recorded as 0. When there were no water depth data, linear interpolation was used to estimate ET+F. As a part of the water balance, (ET+F) will directly affect runoff recognition. Therefore, water depth data are the key to (ET+F) estimation and runoff recognition using IO methods. In summary, it is recommended that mareographs be installed in relatively low-lying paddy fields to ensure complete monitoring of water depth variation during the whole rice-growing season.
The Mann-Whitney U test is the most widely used rank sum test for two independent samples [32]. The nonparametric Mann-Whitney U test was performed on the ET+F values derived from the data of point 1# and point 2#. The results showed that the average value of ET+F at point 1# was 20.8 mm. The median was 18.8 mm. The average value of ET+F at point 2# was 20.1 mm, and the median was 18.1 mm. In the result of the Mann-Whitney U test, Z = −1.60, and p = 0.11. There was no significant difference in ET+F between points 1# and 2#. This means that although the installation location of the water level gauge was different, and the measured value of the water depth would be different, this did not affect the results of ET+F calculation in this study.
3.1.2. Comparison of ET+F between IO and Common Methods
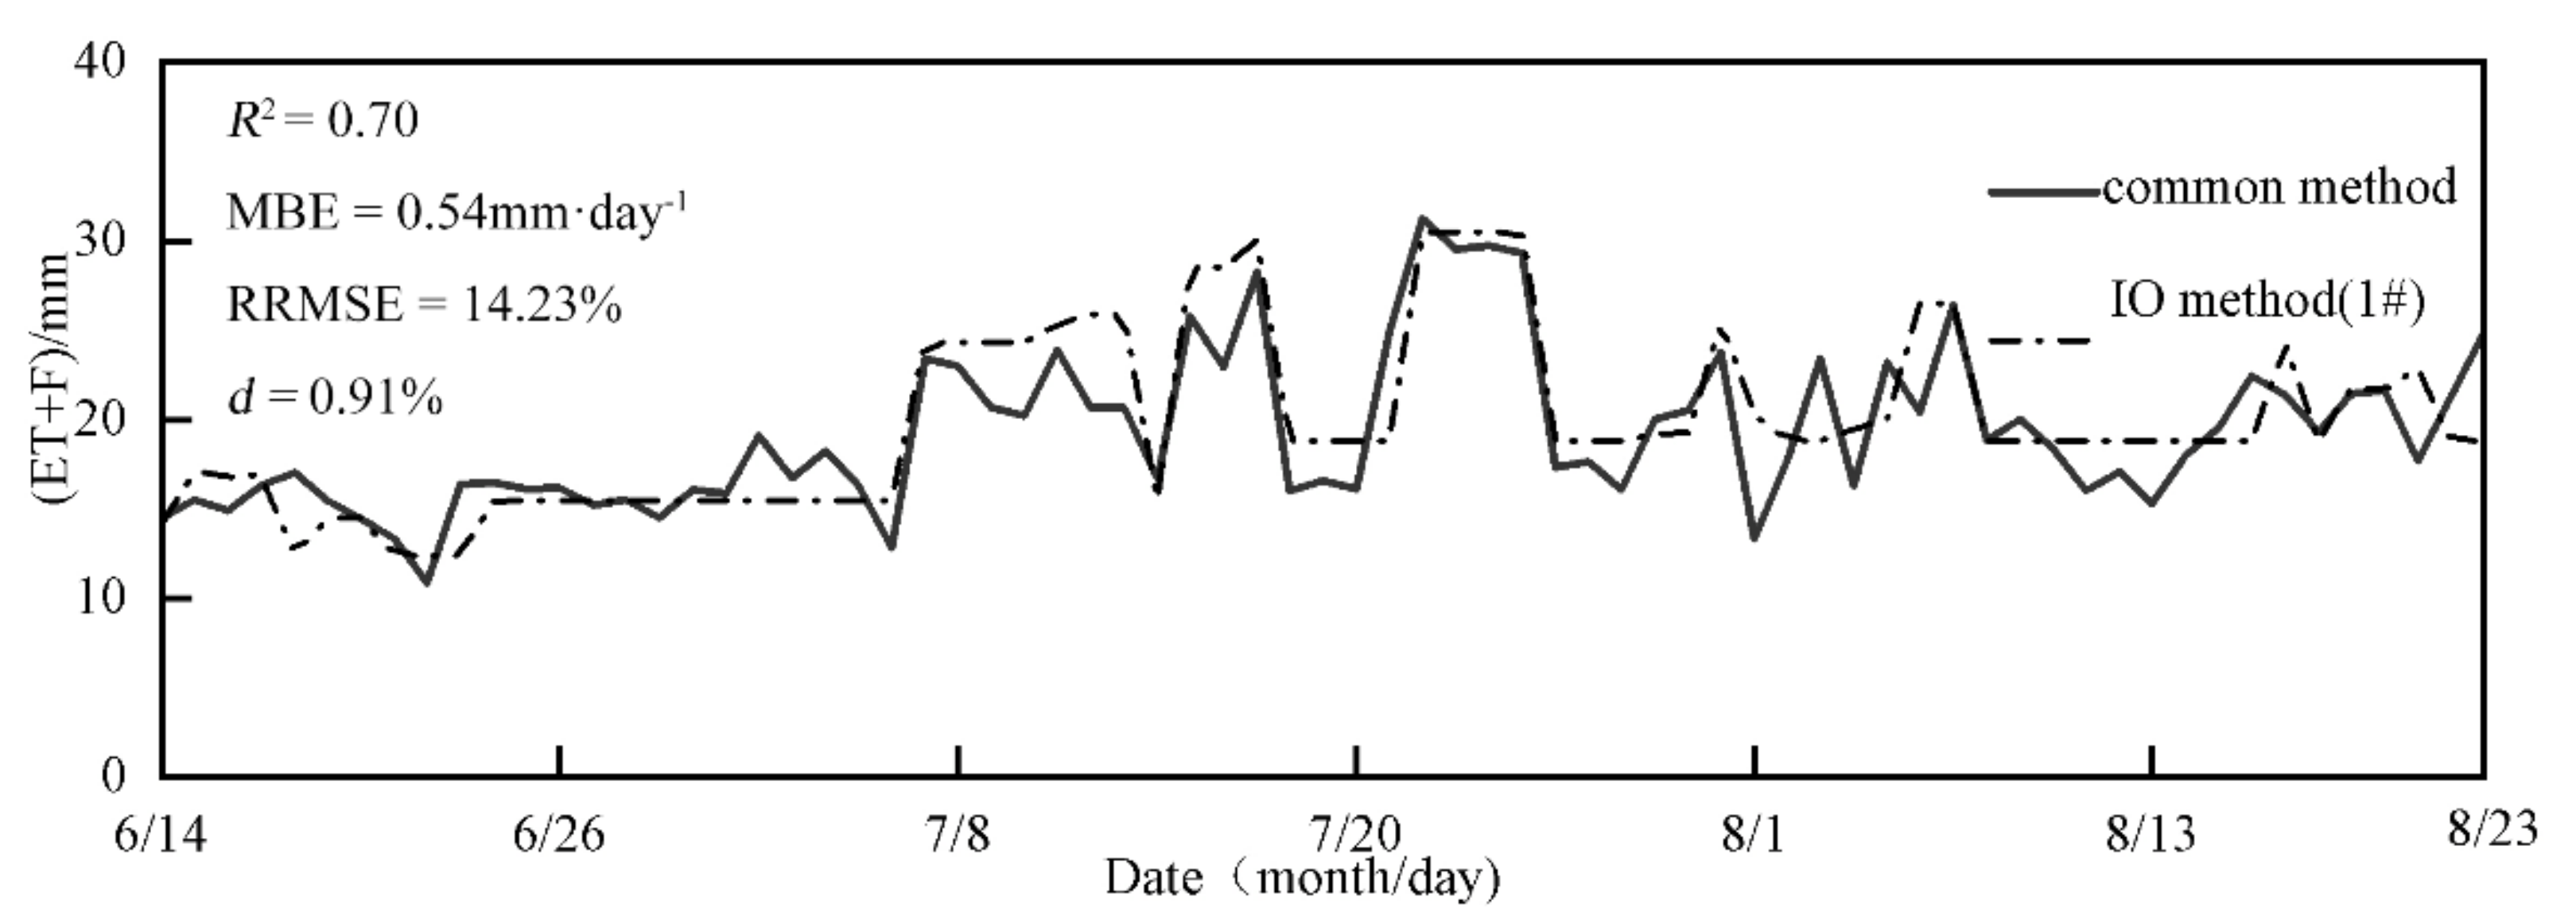
A comparison of ET+F values obtained by common IO methods during the rice observation period in 2017 is shown in Figure 4. Intuitively, the results of the two methods fit well. In this analysis, the difference in ET+F values between the IO method and the common method was determined by statistical measures, including the coefficient of determination (R2), mean bias error (MBE), root mean square error (RMSE), relative root mean square error (RRMSE) and index of agreement (d) [28,33] (Table 1). The validation results showed a satisfactory correlation between the two methods calculated (ET+F), with R2, MBE, RMSE, RRMES and d values of 0.70, 0.54 mm day−1, 14.23% and 0.91, respectively.
3.2. Outflow Calculation
There are two situations of outflow from paddy fields: artificial drainage during rice field drying and surface water overflow caused by precipitation. As shown in Table 2, the daily outflow from the target paddy plot during the whole growing period can be calculated based on Equations (1) and (2). The results based on points 1# and 2# showed that 7 events had outflows and generated nonpoint source pollution. In addition, 6 events were caused by surface water overflow, and 1 event was caused by artificial irrigation. The largest outflow of the two points occurred at 23 June 2017, and the values based on points 1# and 2# were both 113.6 mm. The total outflow depth calculated based on point 2# was 267 mm, which is 5.6 mm larger than the calculated outflow of 261.4 mm based on point 1#. Due to uncontrollable measurement deviation in the paddy field experiment, within a specific error range, approximately the same magnitude of runoff recognition occurred for the two points, and the calculated results were identical, indicating that the installation location of the water level gauge has little influence on the calculation of the rice field runoff depth.
3.3. Comparison of Pollutant Loss Load
According to the regularly monitored water quality data, variations in different forms of nitrogen and phosphorus and the COD of surface water at points 1# and 2# were obtained. Then, these data were combined with runoff depth to estimate loads of nitrogen, phosphorus and COD and the export coefficients.
The changes in the concentrations of COD, TP, TN, NH4+-N, and NO3−-N in the surface water of the experimental rice field are shown in Figure 5. After the rice seedlings were transplanted, the pollutant concentration showed a sharp increase and decreased under basal fertilizer application. The concentrations of TP, TN, NH4+-N, and NO3−-N pollutants decreased to stable values within 1 week after fertilization and reached a peak within 1~3 days after fertilization. The main reason was that heavy rain fell during this period, accelerated the loss of pollutants, and made the field water quality indexes drop [34,35]. Therefore, the control of farmland runoff within 1 week after fertilization can effectively reduce farmland runoff pollution. After urea topdressing, the concentrations of TN, NH4+-N, and NO3−-N showed a significant upward trend, and the concentration of TP was always kept at a low level. After cessation of fertilization, the concentration of each pollutant gradually decreased and stabilized over time. The variation in water concentration at points 1# and 2# showed a similar trend.
According to the variation in basic water quality indicators and Equation (9), the export coefficient of COD, TN, TP, NH4+-N, and NO3−-N at points 1# and 2# were 135.45, 0.97, 0.3, 4.37, and 1.25 kg/hm and 137.25, 1.01, 0.30, 4.47, and 1.28 kg/hm2, respectively as shown in Table 3. Except for the same export coefficient of NO3−-N, other indexes at point 1# and point 2# were slightly different, among which the export coefficient of NH4+-N had the largest difference, with a relative deviation of 2.0%. The second greatest difference was for TP and TN, with relative deviations of 1.1%. The relative deviation of COD was the smallest, at 0.6%. The relative deviation range of the pollutant export coefficient obtained based on water depth at the two observation points was 0.6–2.0%, which is acceptable.
3.4. Analysis of the Factors Affecting the Concentration of Pollutants
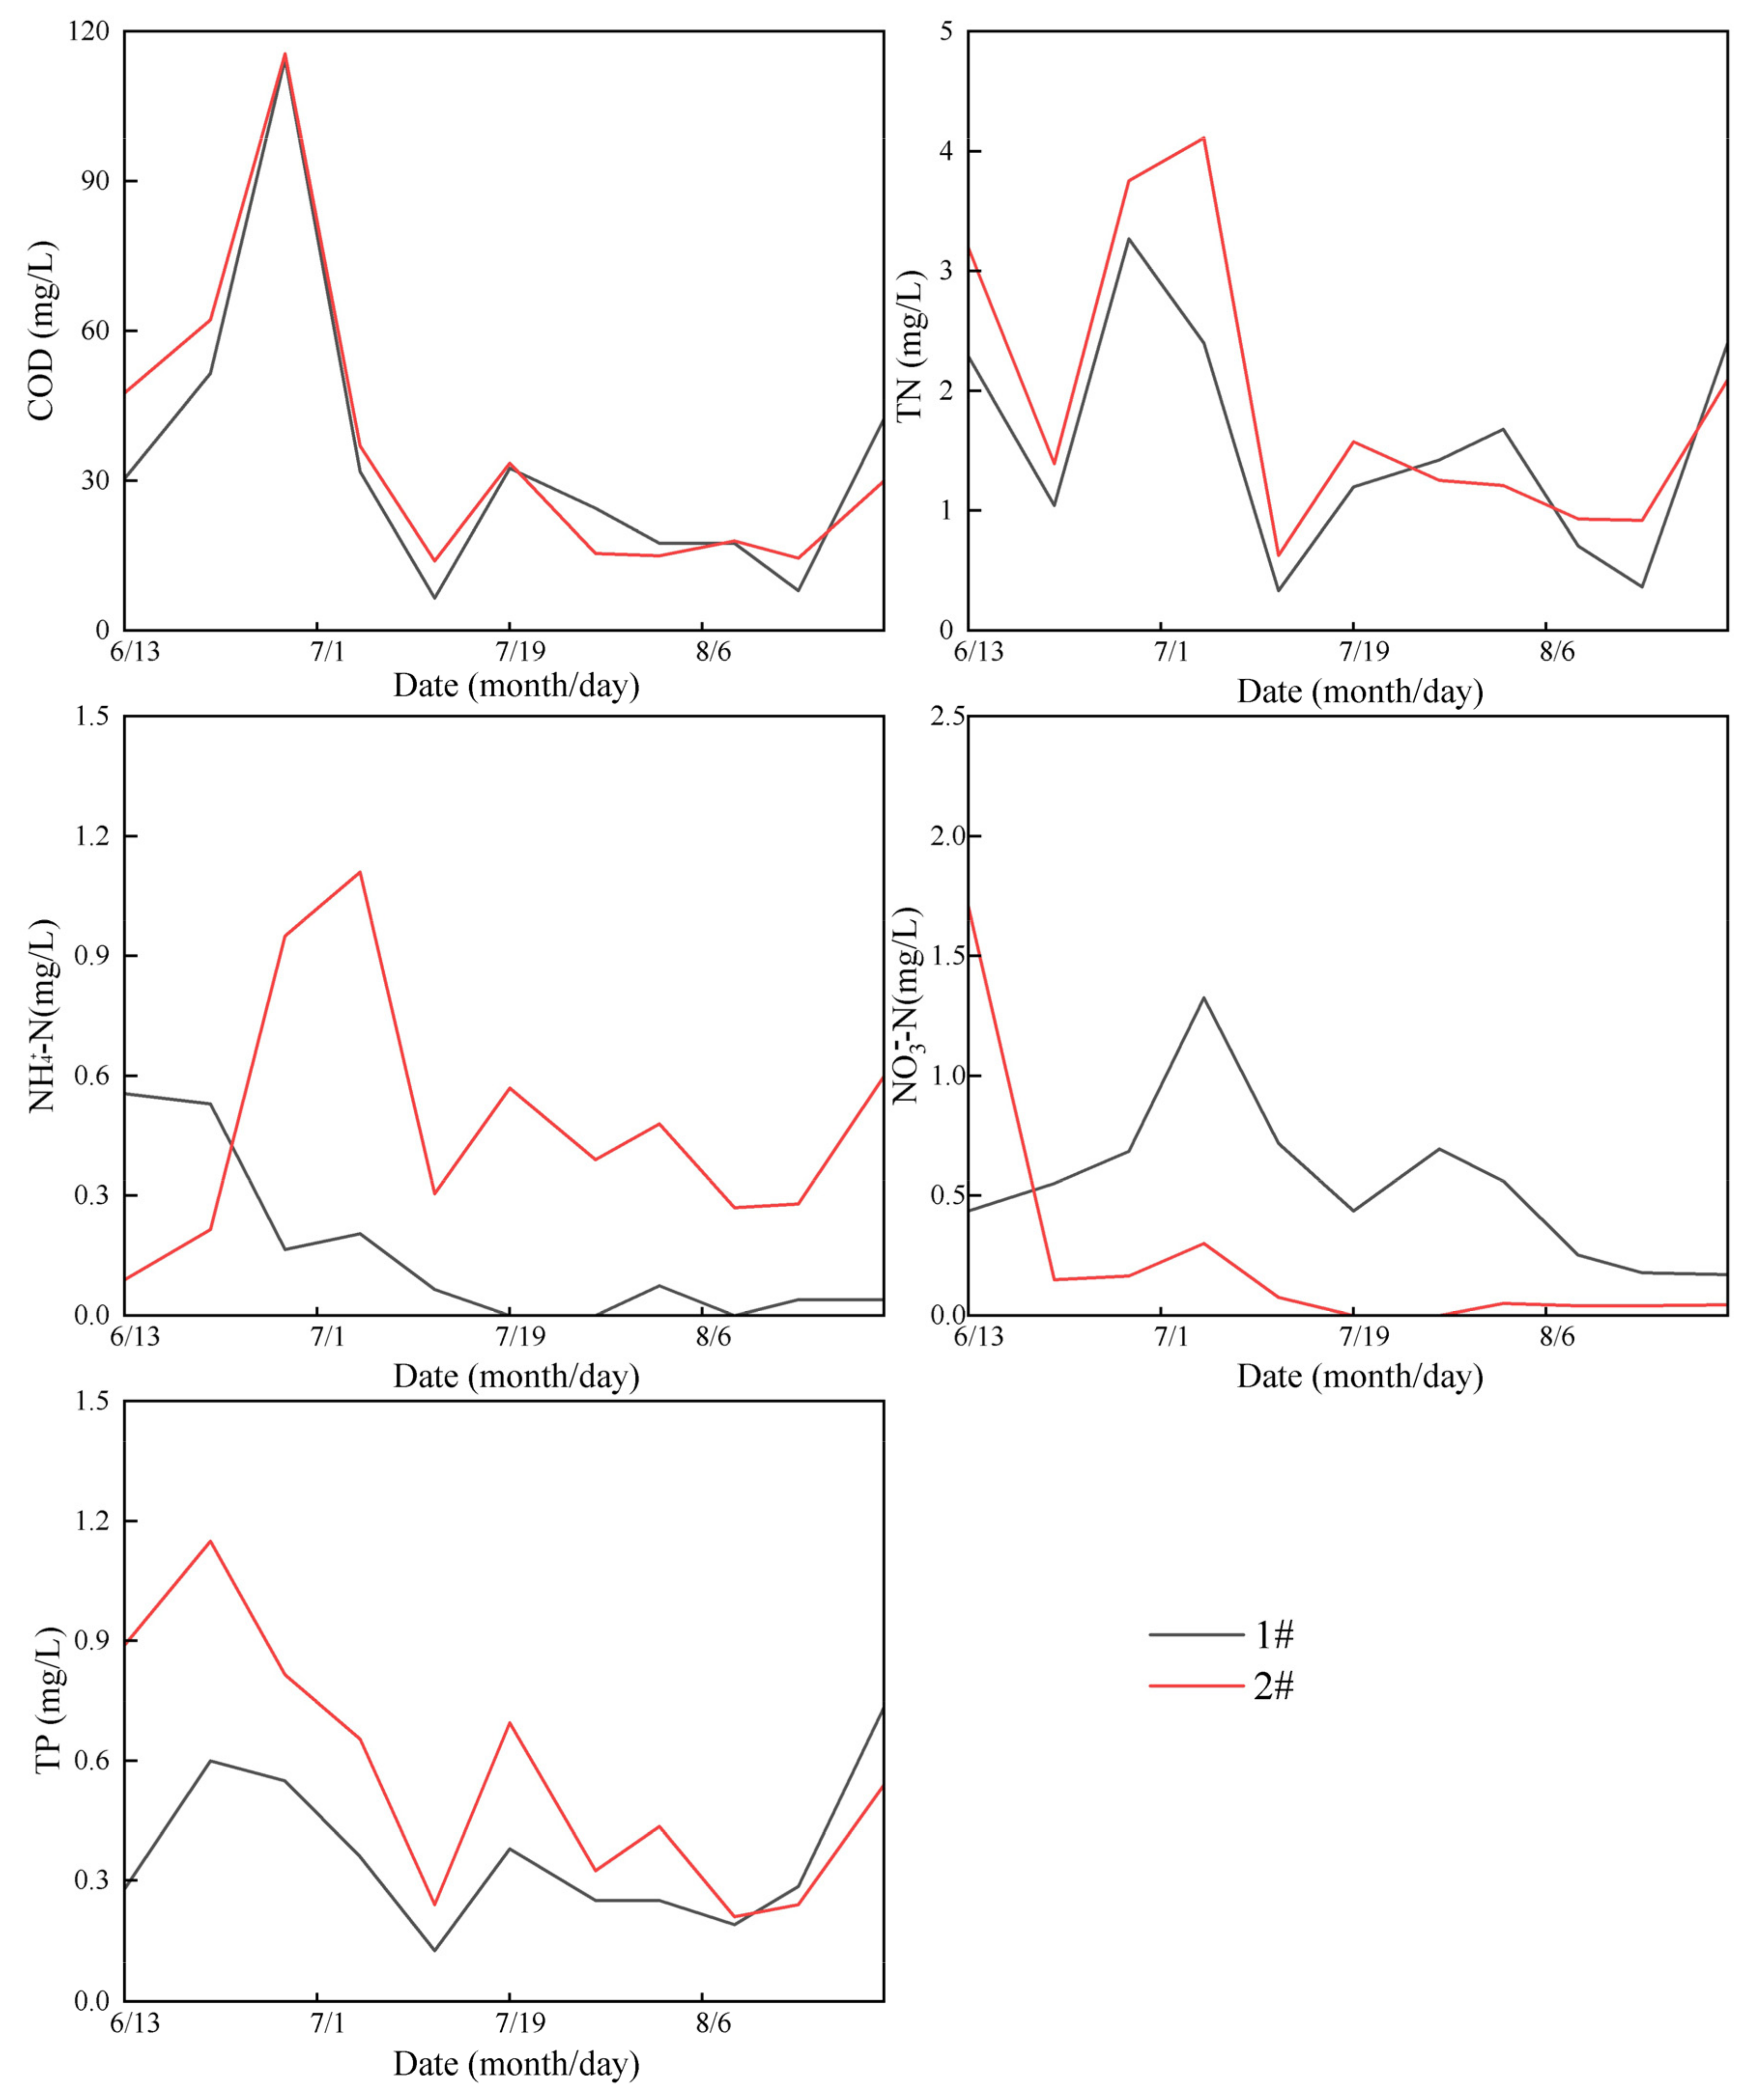
In this experiment, the water quality at the different points had specific characteristics and dynamics (Figure 6). The COD, TN, and TP concentrations at the two sampling points had similar changing trends. After the seedlings were transferred, the COD concentration gradually decreased until it tended to become stable. After topdressing in rice fields, the concentrations of TN and TP increased significantly. The changing trends of NH4+-N and NO3−-N concentrations at points 1# and 2# showed apparent irregularities. Taking NH4+-N as an example, the maximum concentration of NH4+-N at point 1#, which was 1.11 mg/L, appeared after the first top dressing and the maximum value of NH4+-N at point 2#, which was only 0.56 mg/L, appeared after basal fertilizer application, which was mainly caused by uneven fertilization [36,37]. Since there was no runoff in the paddy field within 1 week after topdressing, it can be considered that uneven fertilization does not affect the nitrogen load calculated by the IO method. The nonparametric test of the pollutant concentration at each sampling point showed that only the NO3−-N concentration in the two-point pollutant concentration change sequence significantly differed at the p = 0.05 level, indicating that different sampling locations in the test will have a specific impact on the concentration of some pollutants. Therefore, it is recommended to sample near the main radial outlet to ensure that the measured pollutant concentration is representative of NPS pollution concentration in rice fields.
Wang [38] found that fertilization could increase the NH4+-N concentration, but the effect on NO3−-N concentration was limited; however, in this paper, fertilization could increase the TN, NH4+-N, NO3−-N concentrations. The main reason for this difference is the different fertilization methods. In this paper, the surface spreading method was used to apply basal fertilizer and for topdressing, while Wang applied basal fertilizer with holes and topdressing on the surface. This method is conducive to the adsorption of nitrogen by soil particles, which makes the concentration of NO3−-N in the field water lower, and the concentration of NH4+-N required for rice growth is high. In addition, different fertilizers are also among the reasons for the above difference [39]. Reducing agricultural nitrogen runoff pollution requires combining local environmental conditions to minimize the application of nitrogen fertilizer.
4. Conclusions
- (1)
- Using the in-situ observation (IO) methods in different locations with large elevation differences to study NPS pollution in paddy fields, 1# observation point was located at a lower position compared with 2# observation point. According to 1# observation point, there were 5 days of dry field in the drying period, which was consistent with the actual drying period, and there was a dry period of 9 days based on 2# observation point. We found that water depth data are the key to applying IO methods for evapotranspiration and infiltration loss estimation and runoff identification.
- (2)
- It is recommended that mareographs be installed in relatively low-lying areas of paddy fields to ensure that the water depth variation during the rice-growing season can be fully monitored.
- (3)
- The paddy field experienced 4 rainfall runoffs and 3 irrigation return flows based on observations at points 1# and 2#. The highest farmland outflow occurred in late June, reaching 261.4 mm and 267 mm based on observations at locations 1# and 2#, respectively. The installation location of the water level gauge has little effect on the use of the IO method. The IO method of installing water level meters in low-lying areas allows for more accurate measurement of NPS pollution in paddy fields.
- (4)
- The relative deviation of the NPS pollution of total nitrogen (TN), total phosphorus (TP), chemical oxygen demand (COD), nitrate-nitrogen (NO3−-N) and ammonia nitrogen (NH4+-N) was between 0.6% and 2.0%.
- (5)
- Among NPS caused by the outflow of rice fields, the pollutant concentration distribution at points 1# and 2# was uneven, and it is recommended to sample near the main radial outlet to ensure that the measured pollutant concentration is representative.
Author Contributions
Conceptualization, Y.L. and B.S.; methodology, Y.L.; software, Y.L.; validation, Y.L., B.S. and J.D.; formal analysis, Y.L.; investigation, J.H.; resources, Y.X.; data curation, L.L.; writing original draft preparation, Y.L.; writing review and editing, Y.L.; visualization, Y.L.; supervision, B.S. All authors have read and agreed to the published version of the manuscript.
Funding
This work was supported by the Major Science and Technology
Programme for Water Pollution Control and Treatment under Grant
2013ZX07501-005, Grant 2017ZX07301-003 and the Fundamental
Research Funds for the Central Universities.
Institutional Review Board Statement
Not applicable.
Informed Consent Statement
Not applicable.
Data Availability Statement
The data presented in this study are available on request from the corresponding authors.
Conflicts of Interest
The authors declare no conflict of interest.
References
- Xin, F.; Xiao, X.; Dong, J.; Zhang, G.; Zhang, Y.; Wu, X.; Li, X.; Zou, Z.; Ma, J.; Du, G.; et al. Large increases of paddy rice area, gross primary production, and grain production in Northeast China during 2000–2017. Sci. Total Environ. 2020, 711, 135183. [Google Scholar] [CrossRef]
- Zhuang, Y.; Liu, H.; Zhang, L.; Li, S. Research perspectives on paddy field systems: Ecological functions and environ-mental impacts. Int. J. Agric. Sustain. 2020, 18, 505–520. [Google Scholar] [CrossRef]
- Carpenter, S.R.; Caraco, N.F.; Correll, D.L.; Howarth, R.W.; Sharpley, A.N.; Smith, V.H. Nonpoint pollution of surface waters with phosphorus and nitrogen. Ecol. Appl. 1998, 8, 559–568. [Google Scholar] [CrossRef]
- Zhao, J.; Zhao, Y.; Zhao, X.; Jiang, C. Agricultural runoff pollution control by a grassed swales coupled with wetland detention ponds system: A case study in Taihu Basin, China. Environ. Sci. Pollut. Res. 2016, 23, 9093–9104. [Google Scholar] [CrossRef]
- Papadakis, E.-N.; Tsaboula, A.; Vryzas, Z.; Kotopoulou, A.; Kintzikoglou, K.; Papadopoulou-Mourkidou, E. Pesticides in the rivers and streams of two river basins in northern Greece. Sci. Total Environ. 2018, 624, 732–743. [Google Scholar] [CrossRef]
- Hou, X.; Zhou, F.; Leip, A.; Fu, B.; Yang, H.; Chen, Y.; Gao, S.; Shang, Z.; Ma, L. Spatial patterns of nitrogen runoff from Chinese paddy fields. Agric. Ecosyst. Environ. 2016, 231, 246–254. [Google Scholar] [CrossRef]
- Wang, Z.; Wan, L.; Xu, C.M. Spectrums of Nitrogen and Phosphorus Leaching Loss from Different Land-Use Types. CLEAN Soil Air Water 2018, 46, 1700538. [Google Scholar] [CrossRef]
- Luo, Y.; Khan, S.; Cui, Y.; Peng, S. Application of system dynamics approach for time varying water balance in aerobic paddy fields. Paddy Water Environ. 2009, 7, 1–9. [Google Scholar] [CrossRef]
- Jeon, J.-H.; Yoon, C.G.; Ham, J.-H.; Jung, K.-W. Model Development for Nutrient Loading Estimates from Paddy Rice Fields in Korea. J. Environ. Sci. Health Part B Pestic. Food Contam. Agric. Wastes 2004, 39, 845–860. [Google Scholar] [CrossRef]
- Rajaei, F.; Sari, A.E.; Salmanmahiny, A.; Delavar, M.; Bavani, A.R.M.; Srinivasan, R. Surface drainage nitrate loading estimate from agriculture fields and its relationship with landscape metrics in Tajan watershed. Paddy Water Environ. 2016, 15, 541–552. [Google Scholar] [CrossRef]
- Cui, N.; Cai, M.; Zhang, X.; Abdelhafez, A.A.; Zhou, L.; Sun, H.; Chen, G.; Zou, G.; Zhou, S. Runoff loss of nitrogen and phosphorus from a rice paddy field in the east of China: Effects of long-term chemical N fertilizer and organic manure applications. Glob. Ecol. Conserv. 2020, 22, e01011. [Google Scholar] [CrossRef]
- Xiao, M.; Li, Y.; Wang, J.; Hu, X.; Wang, L.; Miao, Z. Study on the Law of Nitrogen Transfer and Conversion and Use of Fertilizer Nitrogen in Paddy Fields under Water-Saving Irrigation Mode. Water 2019, 11, 218. [Google Scholar] [CrossRef] [Green Version]
- Chun, J.A.; Cooke, R.A.; Kang, M.S.; Choi, M.; Timlin, D.; Park, S.W. Runoff Losses of Suspended Sediment, Nitrogen, and Phosphorus from a Small Watershed in Korea. J. Environ. Qual. 2010, 39, 981–990. [Google Scholar] [CrossRef] [Green Version]
- Xin, Y.; Liu, G.; Xie, Y.; Gao, Y.; Liu, B.; Shen, B. Effects of soil conservation practices on soil losses from slope farm-land in northeastern China using runoff plot data. Catena 2019, 174, 417–424. [Google Scholar] [CrossRef]
- Cherobim, V.F.; Huang, C.-H.; Favaretto, N. Tillage system and time post-liquid dairy manure: Effects on runoff, sediment and nutrients losses. Agric. Water Manag. 2017, 184, 96–103. [Google Scholar] [CrossRef] [Green Version]
- Huang, N.-B.; Su, B.-L.; Li, R.-R.; Yang, W.-Z.; Shen, M.-M. A field-scale observation method for non-point source pollution of paddy fields. Agric. Water Manag. 2014, 146, 305–313. [Google Scholar] [CrossRef]
- Xu, Y.; Su, B.; Wang, H.; He, J.; Yang, Y. Analysis of the water balance and the nitrogen and phosphorus runoff pollution of a paddy field in situ in the Taihu Lake basin. Paddy Water Environ. 2020, 18, 385–398. [Google Scholar] [CrossRef]
- Phong, T.K.; Nguyen, M.H.; Komany, S.; Vu, S.H.; Watanabe, H. Alternative water management for controlling simetryn and thiobencarb runoff from paddy fields. Bull. Environ. Contam. Toxicol. 2006, 77, 375–382. [Google Scholar] [CrossRef]
- Xu, Y.; Su, B.; Wang, H.; He, J. A new method for indirectly estimating infiltration of paddy fields in situ. Proc. Int. Assoc. Hydrol. Sci. 2018, 379, 205–210. [Google Scholar] [CrossRef] [Green Version]
- Liu, W.; Zhang, B.; Han, S. Quantitative Analysis of the Impact of Meteorological Factors on Reference Evapotranspiration Changes in Beijing, 1958–2017. Water 2020, 12, 2263. [Google Scholar] [CrossRef]
- Liu, C.-W.; Cheng, S.-W.; Yu, W.-S.; Chen, S.-K. Water infiltration rate in cracked paddy soil. Geoderma 2003, 117, 169–181. [Google Scholar] [CrossRef]
- Liu, C.-W.; Chen, S.-K.; Jang, C.-S. Modelling water infiltration in cracked paddy field soil. Hydrol. Process. 2004, 18, 2503–2513. [Google Scholar] [CrossRef]
- Jiang, S.; Liang, C.; Cui, N.; Zhao, L.; Liu, C.; Feng, Y.; Hu, X.; Gong, D.; Zou, Q. Water use efficiency and its drivers in four typical agroecosystems based on flux tower measurements. Agric. For. Meteorol. 2020, 295, 108200. [Google Scholar] [CrossRef]
- Khepar, S.D.; Yadav, A.K.; Sondhi, S.K.; Siag, M. Water balance model for paddy fields under intermittent irrigation practices. Irrig. Sci. 2000, 19, 199–208. [Google Scholar] [CrossRef]
- Pereira, L.S.; Allen, R.G.; Smith, M.; Raes, D. Crop evapotranspiration estimation with FAO56: Past and future. Agric. Water Manag. 2015, 147, 4–20. [Google Scholar] [CrossRef]
- López-Urrea, R.; Martín de Santa Olalla, F.; Fabeiro, C.; Moratalla, A. Testing evapotranspiration equations using lysimeter observations in a semiarid climate. Agric. Water Manag. 2006, 85, 15–26. [Google Scholar] [CrossRef]
- Rahimikhoob, H.; Sohrabi, T.; Delshad, M. Assessment of reference evapotranspiration estimation methods in controlled greenhouse conditions. Irrig. Sci. 2020, 38, 389–400. [Google Scholar] [CrossRef]
- Wu, G.; Li, L.; Ahmad, S.; Chen, X.; Pan, X. A Dynamic Model for Vulnerability Assessment of Regional Water Re-sources in Arid Areas: A Case Study of Bayingolin, China. Water Resour. Manag. 2013, 27, 3085–3101. [Google Scholar] [CrossRef]
- Chicco, D.; Warrens, M.J.; Jurman, G. The coefficient of determination R-squared is more informative than SMAPE, MAE, MAPE, MSE and RMSE in regression analysis evaluation. PeerJ Comput. Sci. 2021, 7, e623. [Google Scholar] [CrossRef]
- Muniandy, J.M.; Yusop, Z.; Askari, M. Evaluation of reference evapotranspiration models and determination of crop coefficient for Momordica charantia and Capsicum annuum. Agric. Water Manag. 2016, 169, 77–89. [Google Scholar] [CrossRef]
- Conversa, G.; Bonasia, A.; Di Gioia, F.; Elia, A. A decision support system (GesCoN) for managing fertigation in vegetable crops. Part II—Model calibration and validation under different environmental growing conditions on field grown tomato. Front. Plant Sci. 2015, 6, 495. [Google Scholar] [CrossRef] [Green Version]
- Zhou, M.; Li, Y.; Tahir, M.J.; Geng, X.; Wang, Y.; He, W. Integrated Statistical Test of Signal Distributions and Access Point Contributions for Wi-Fi Indoor Localization. IEEE Trans. Veh. Technol. 2021, 70, 5057–5070. [Google Scholar] [CrossRef]
- Gocic, M.; Petković, D.; Shamshirband, S.; Kamsin, A. Comparative analysis of reference evapotranspiration equations modelling by extreme learning machine. Comput. Electron. Agric. 2016, 127, 56–63. [Google Scholar] [CrossRef]
- Qi, D.; Yan, J.; Zhu, J. Effect of a reduced fertilizer rate on the water quality of paddy fields and rice yields under fishpond effluent irrigation. Agric. Water Manag. 2020, 231, 105999. [Google Scholar] [CrossRef]
- Qiao, J.; Yang, L.; Yan, T.; Xue, F.; Zhao, D. Nitrogen fertilizer reduction in rice production for two consecutive years in the Taihu Lake area. Agric. Ecosyst. Environ. 2012, 146, 103–112. [Google Scholar] [CrossRef]
- Zhao, C.; Huang, H.; Qian, Z.-H.; Jiang, H.-X.; Liu, G.-M.; Xu, K.; Hu, Y.-J.; Dai, Q.-G.; Huo, Z.-Y. Effect of side deep placement of nitrogen on yield and nitrogen use efficiency of single season late japonica rice. J. Integr. Agric. 2021, 20, 1487–1502. [Google Scholar] [CrossRef]
- Contreras, J.I.; Baeza, R.; Alonso, F.; Cánovas, G.; Gavilán, P.; Lozano, D. Effect of Distribution Uniformity and Fertigation Volume on the Bio-Productivity of the Greenhouse Zucchini Crop. Water 2020, 12, 2183. [Google Scholar] [CrossRef]
- Wang, L.J.; Yang, Y.; Zheng, J.J.; Liu, Y.N.; Guo, Q.K.; Wang, D.A.; Liu, B.Y. Effects of fertilization on nitrogen and phosphorous losses from cropland in Beijing Mountainous Area. Sci. Soil Water Conserv. 2017, 15, 97–104. [Google Scholar]
- Liu, X.; Chen, L.; Hua, Z.; Mei, S.; Wang, P.; Wang, S. Comparing ammonia volatilization between conventional and slow-release nitrogen fertilizers in paddy fields in the Taihu Lake region. Environ. Sci. Pollut. Res. 2020, 27, 8386–8394. [Google Scholar] [CrossRef]
Figure 1.
Schematic of experimental field setup.

Figure 2.
Growing period division, water depth and hyetograph of points 1# and 2# in paddy fields.

Figure 3.
Comparison of the ET+F between points 1# and 2# in paddy fields.

Figure 4.
Comparison of ET+F in paddy fields between the common method and IO method.

Figure 5.
Changes in the basic water quality indicators in the surface runoff at points 1# and 2#; (a) describes the changes in COD, TN, TP, NH4+-N, and NO3−-N at 1# point, and (b) describes the changes in COD, TN, TP, NH4+-N,and NO3−-N at 2# point.
Figure 5.
Changes in the basic water quality indicators in the surface runoff at points 1# and 2#; (a) describes the changes in COD, TN, TP, NH4+-N, and NO3−-N at 1# point, and (b) describes the changes in COD, TN, TP, NH4+-N,and NO3−-N at 2# point.

Figure 6.
Comparison of COD, TN, TP, NH4+-N, and NO3−-N at two sampling points.


Table 1.
Statistical measures calculated for ET estimation equations between the common method and IO method.
Table 1.
Statistical measures calculated for ET estimation equations between the common method and IO method.
| Statical Measures | Symbol | Meaning | Corresponding Equation | Value |
| Coefficient of determination | R2 | R2 indicates the dispersion of dependent variables around the regression line, high values of R2 criterion indicates perfect consistency of the computational methods with the actual conditions [28] | 0.70 | |
| Mean bias error | MBE | The MBE measures the average difference between two methods [29] | 0.54 mm day−1 | |
| Relative root mean square error | RRMSE | The performance of computational methods is considered excellent when the RRMSE is lower than 10%, good if between 10 and 20%, fair if between 20 and 30%, and poor if values are greater than 30% It shows overestimation or underestimation of each method and computes the errors in the same unit and scale [30] | 14.23% | |
| Index of agreement | d | The index of agreement as a descriptive measure indicating consistency between predicted and observed values [31] | 0.91 |
Where N is the number of observations; Pi and Oi are the values estimated with the IO method and calculated with the common method, respectively; is the mean value estimated with the IO method; is the mean value calculated with the common method; Pi = Pi − and Oi = Oi − .
Table 2.
Calculated results of outflow between data for points 1# and 2#.
| Date | Pi/mm | Hi+1−Hi/mm | (ET+F)/mm | Rout/mm | Remarks | |||
|---|---|---|---|---|---|---|---|---|
| 1# | 2# | 1# | 2# | 1# | 2# | |||
| 23 June 2017 | 102 | 24 | 23.9 | 12.4 | 12.3 | 113.6 | 113.6 | Overflow |
| 7 July 2017 | 15.7 | 18.8 | 17.4 | 15.5 | 15.1 | 19 | 18 | Overflow |
| 15 July 2017 | 0 | 32.4 | 31.3 | 15.5 | 15.1 | 16.9 | 16.2 | Drainage |
| 21 July 2017 | 58.2 | 24.4 | 21.8 | 18.8 | 18.1 | 63.8 | 61.9 | Overflow |
| 26 July 2017 | 14.8 | 14.3 | 19.8 | 18.8 | 18.1 | 10.3 | 16.5 | Overflow |
| 2–3 August 2017 | 27.9 | 0 | 0 | 18.8 | 18.1 | 6.9 | 7.1 | Overflow |
| 23 August 2017 | 18.1 | 49.7 | 51.8 | 18.8 | 18.1 | 30.9 | 33.7 | Overflow |
Table 3.
Loads of different forms of COD, TN, TP, NH4+-N, and NO3−-N based on points 1# and 2# in the paddy field.
Table 3.
Loads of different forms of COD, TN, TP, NH4+-N, and NO3−-N based on points 1# and 2# in the paddy field.
| Date | Rout/mm | COD (mg) | NH4+-N (mg) | NO3−-N (mg) | TN (mg) | TP (mg) | |||||
|---|---|---|---|---|---|---|---|---|---|---|---|
| 1# | 2# | 1# | 2# | 1# | 2# | 1# | 2# | 1# | 2# | ||
| 23 June 2017 | 113.60 | 50,765.00 | 50,765.00 | 238.36 | 238.36 | 150.11 | 150.11 | 1261.77 | 1261.77 | 415.86 | 415.86 |
| 7 July 2017 | 19.00 | 3104.46 | 2941.07 | 63.62 | 60.27 | 16.46 | 15.59 | 238.01 | 225.48 | 40.38 | 38.25 |
| 15 July 2017 | 16.90 | 2248.30 | 2155.18 | 11.77 | 11.28 | 3.62 | 3.47 | 76.35 | 73.19 | 22.48 | 21.55 |
| 21 July 2017 | 63.80 | 13,756.88 | 13,347.19 | 79.75 | 77.38 | 0.00 | 0.00 | 474.51 | 460.38 | 115.64 | 112.19 |
| 26 July 2017 | 10.30 | 1496.72 | 2397.66 | 35.41 | 56.72 | 0.00 | 0.00 | 91.09 | 145.92 | 15.45 | 24.75 |
| 2–3 August 2017 | 6.90 | 819.38 | 843.13 | 37.09 | 38.16 | 2.59 | 2.66 | 62.10 | 63.90 | 9.49 | 9.76 |
| 23 August 2017 | 30.90 | 9076.88 | 9899.38 | 113.94 | 124.27 | 7.73 | 8.43 | 415.22 | 452.84 | 131.33 | 143.23 |
| Total | 81,267.61 | 82,348.59 | 579.93 | 606.43 | 180.50 | 180.26 | 2619.05 | 2683.49 | 750.62 | 765.59 | |
| Export coefficient | 135.45 | 137.25 | 0.97 | 1.01 | 0.30 | 0.30 | 4.37 | 4.47 | 1.25 | 1.28 | |
Publisher’s Note: MDPI stays neutral with regard to jurisdictional claims in published maps and institutional affiliations. |
© 2021 by the authors. Licensee MDPI, Basel, Switzerland. This article is an open access article distributed under the terms and conditions of the Creative Commons Attribution (CC BY) license (https://creativecommons.org/licenses/by/4.0/).
Share and Cite
MDPI and ACS Style
Liao, Y.; He, J.; Su, B.; Dou, J.; Xu, Y.; Li, L. Validation of an In-Situ Observation Method for Nonpoint Source Pollution in Paddy Fields: A Case Study of a Beijing Paddy Field. Water 2021, 13, 3235. https://doi.org/10.3390/w13223235
AMA Style
Liao Y, He J, Su B, Dou J, Xu Y, Li L. Validation of an In-Situ Observation Method for Nonpoint Source Pollution in Paddy Fields: A Case Study of a Beijing Paddy Field. Water. 2021; 13(22):3235. https://doi.org/10.3390/w13223235
Chicago/Turabian StyleLiao, Ya, Jingyi He, Baolin Su, Junfeng Dou, Yunqiang Xu, and Lifen Li. 2021. "Validation of an In-Situ Observation Method for Nonpoint Source Pollution in Paddy Fields: A Case Study of a Beijing Paddy Field" Water 13, no. 22: 3235. https://doi.org/10.3390/w13223235
Note that from the first issue of 2016, this journal uses article numbers instead of page numbers. See further details here.