Article

Evidence for Microplastics Contamination of the Remote Tributary of the Yenisei River, Siberia—The Pilot Study Results

by
Yulia A. Frank
1,*,
Danil S. Vorobiev
1,
Olga A. Kayler
1,
Egor D. Vorobiev
1,
Ksenia S. Kulinicheva
1,
Anton A. Trifonov
1 and
Tina Soliman Hunter
2
1
Biological Institute, Tomsk State University, Lenin Avenue, 36, 634050 Tomsk, Russia
2
Macquarie Law School, Macquarie University, Sydney, NSW 2109, Australia
*
Author to whom correspondence should be addressed.
Water 2021, 13(22), 3248; https://doi.org/10.3390/w13223248
Submission received: 19 October 2021 / Revised: 12 November 2021 / Accepted: 14 November 2021 / Published: 16 November 2021

Abstract

:
This study is a pioneering attempt to count microplastics (MPs) in the Yenisei River system to clarify the role of Siberian Rivers in the transport of MPs to the Arctic Ocean. The average MPs content in the surface water of the Yenisei large tributary, the Nizhnyaya Tunguska River, varied from 1.20 ± 0.70 to 4.53 ± 2.04 items/m3, tending to increase along the watercourse (p < 0.05). Concentrations of MPs in bottom sediments of the two rivers were 235 ± 83.0 to 543 ± 94.1 with no tendency of downstream increasing. Linear association (r = 0.952) between average organic matter content and average counts of MPs in bottom sediments occurred. Presumably MPs originated from the daily activities of the in-situ population. Further spatial-temporal studies are needed to estimate the riverine MPs fluxes into the Eurasian Arctic seas.

1. Introduction

Global research is increasingly focusing on microplastics (MPs) (plastic particles < 5 mm in diameter), both their presence as well as the source of this pollution. Environmental and health concerns regarding water pollution from MPs include the ecotoxicological effect on aquatic organisms, as well as its potential accumulation in food chains up to humans [1,2]. Such concerns arise as a result of the hazardous chemicals present in the plastics, which arise both as a result of additives during the manufacturing process to improve polymer properties, and the adsorption of toxic chemicals by MP, enabling MP to become carriers of these chemicals into ecosystems [3,4].
MPs enter into oceans and continental water bodies primarily via rivers [5,6], which deliver up to 80% of plastic detritus into these water bodies [7]. Lebreton et al. [5] estimates that 1.15–2.41 million tons of plastic flow into oceans from riverine systems across the globe every year. The north-flowing rivers of Eurasia can carry MPs to the Arctic Ocean, and these Arctic waters are susceptible to contamination. A recent study found MPs, with particle average concentration 1.14 items per cubic meter, in 7 out of 13 sites in the White Sea basin, [8]. The results of quantitative analyses of MP abundance in the surface and subsurface waters of the East Siberian, Laptev, Barents and Kara seas have been published [9]. The highest mass concentration of MPs was observed in surface waters of Atlantic origin, whilst Siberian Rivers were identified as the second most important source of pollution in the Eurasian Arctic [9]. However, the contribution of rivers of Siberia to MPs flows in the Arctic region remains uncertain.
The load and transport of MPs in the Arctic-emptying great Siberian Rivers remain grossly understudied. In this preliminary study, we quantified MPs in the surface of the Ob River in its upper and middle course [10], thereby demonstrating the capacity for MPs to flow to arctic waters via the discharge of the Ob River to the Kara Sea. The Yenisei River system has not been previously investigated for the presence and abundance of MP particles in water and bottom sediments. This study is a pioneering attempt to count MPs in the Yenisei River system. Obtaining quantitative data on the presence of plastic microparticles in the components of the aquatic environment of the remote Yenisei tributary, the Nizhnyaya Tunguska (Lower Tunguska) River, will supplement current aggregate knowledge about the distribution of pollution of global aquatic ecosystems.

2. Materials and Methods
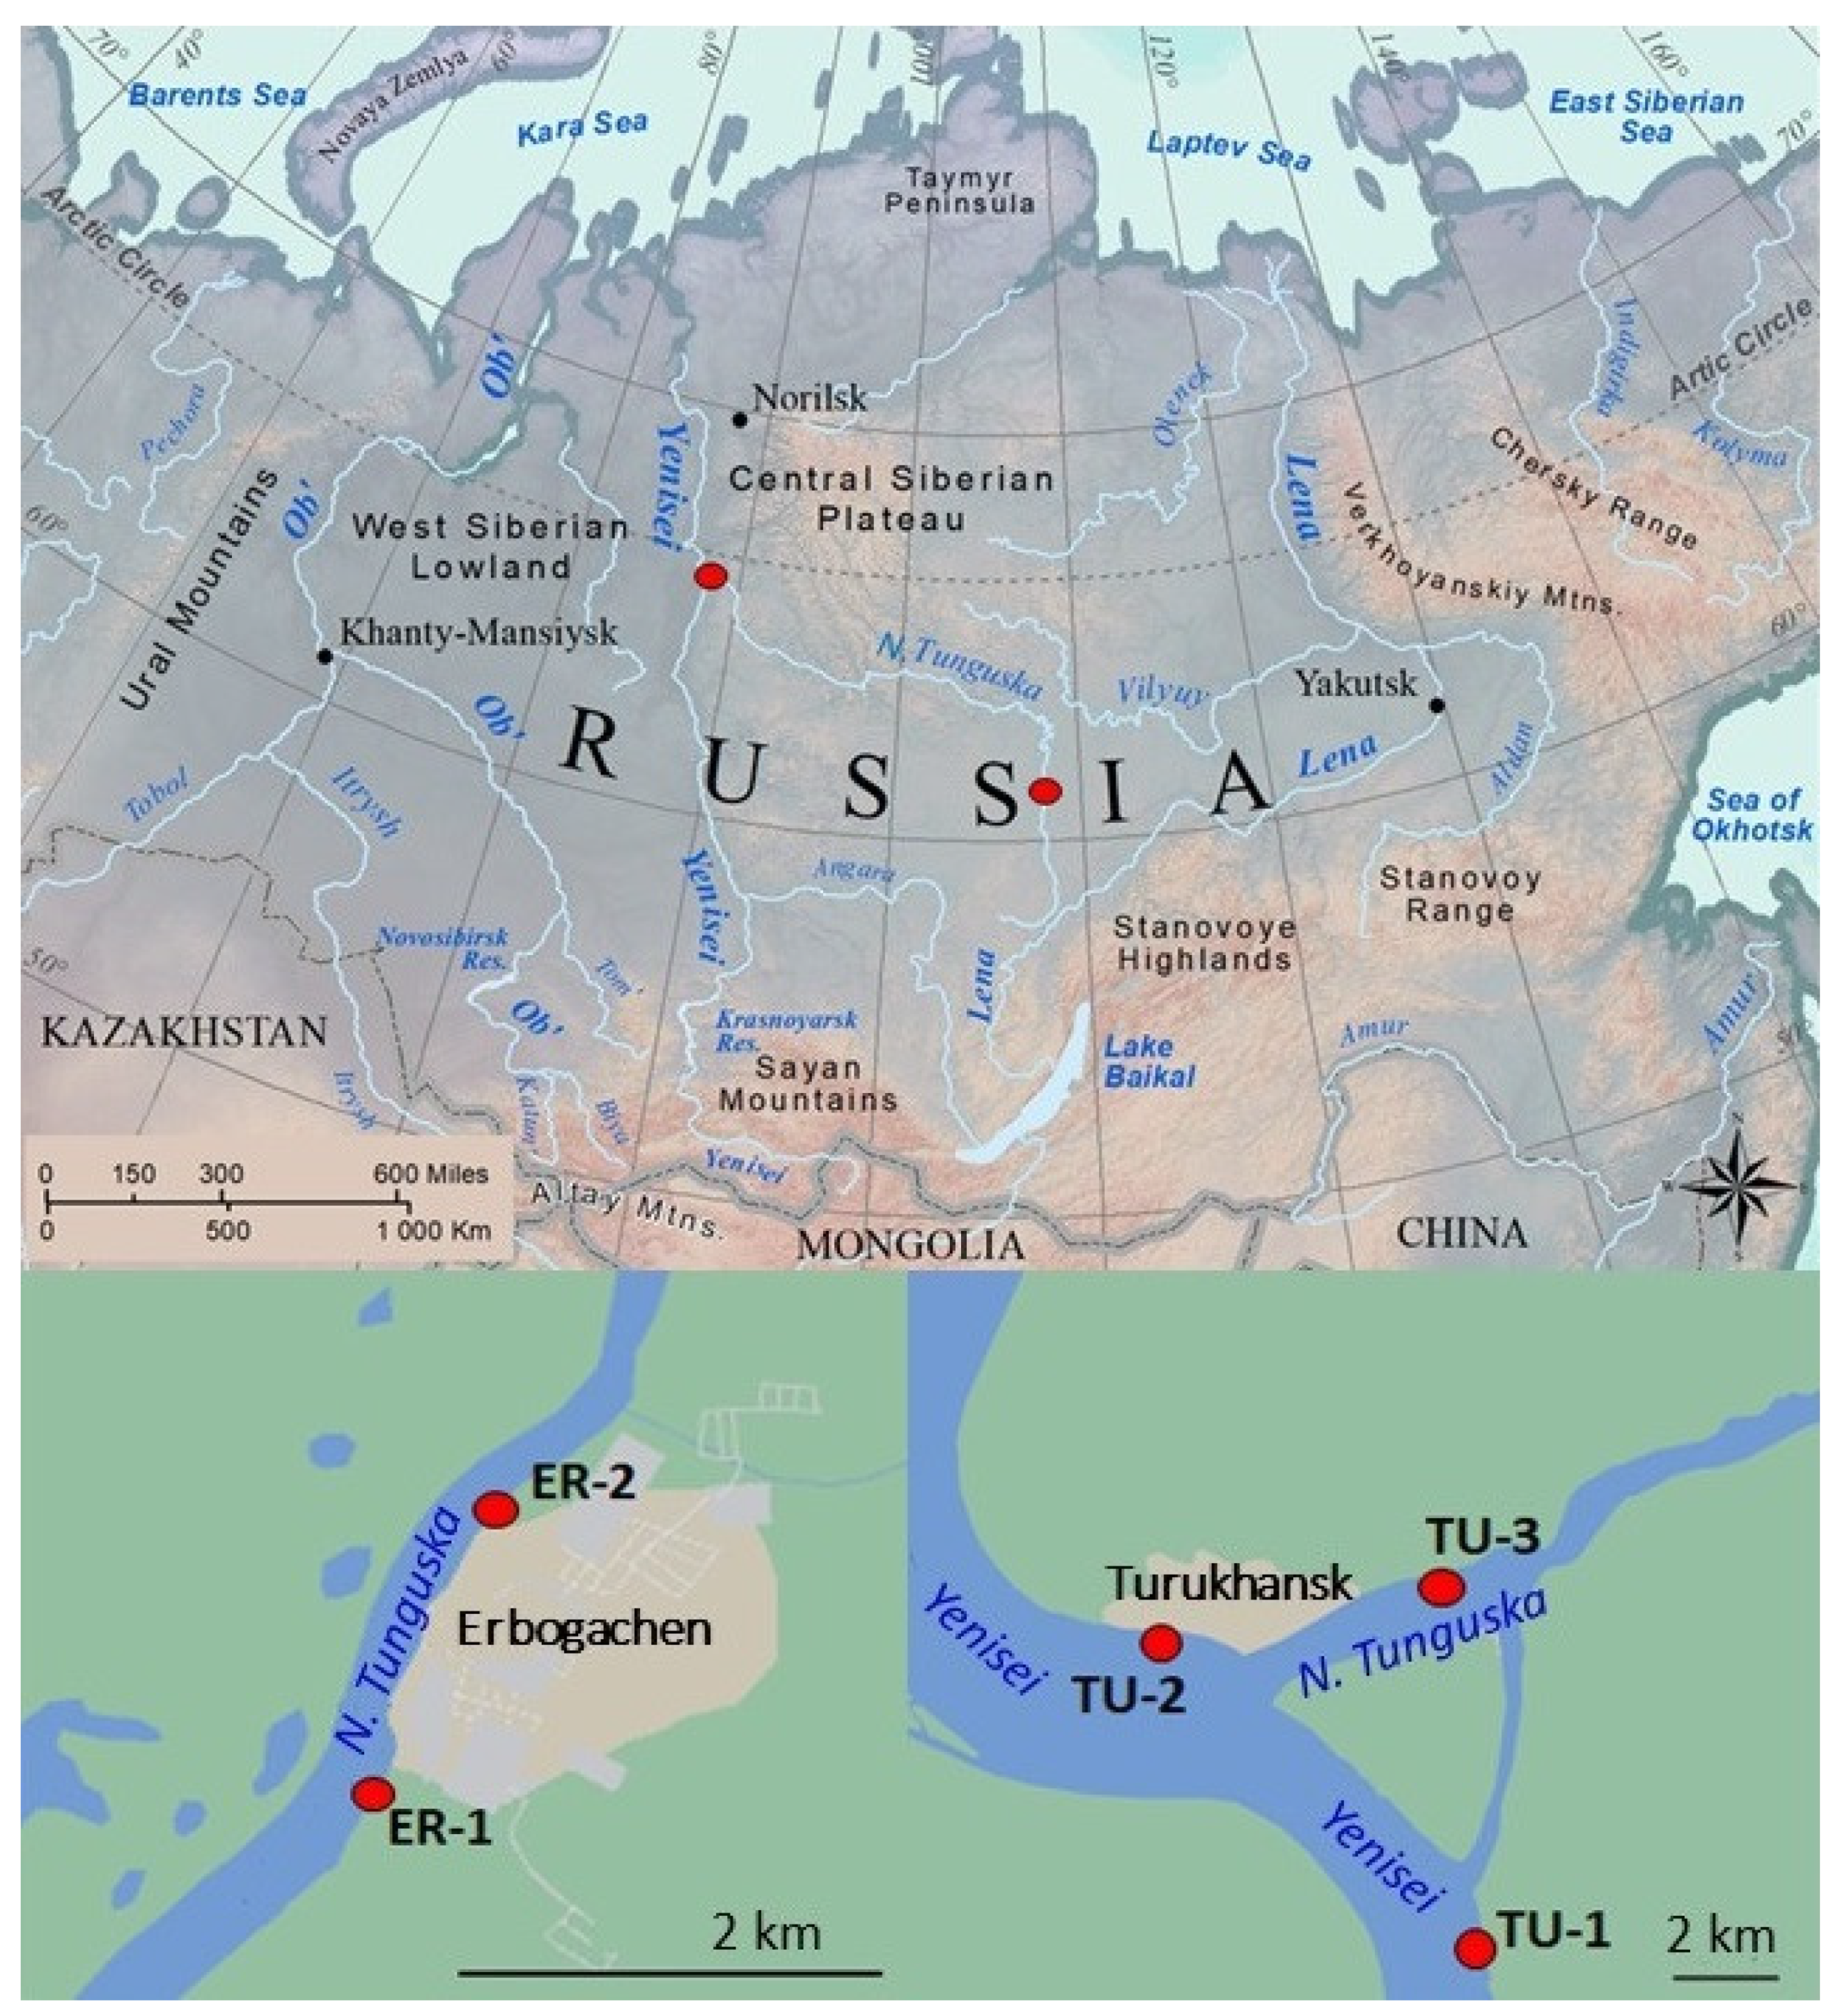
2.1. Study Area

The Nizhnyaya Tunguska River (N. Tunguska) is the right-bank tributary of the Yenisei River, one of the largest Siberian Rivers flowing into the Kara Sea (Figure 1). At a length of 2989 km; and a basin area of 473,000 km2 the N. Tunguska is the longest Yenisei tributary and the second largest in terms of water discharge [11]. The N. Tunguska rises in the Central Siberian Plateau, east of the Angarsk Ridge, within the Irkutsk Region, flowing across the Central Siberian Plateau through the Irkutsk Region and the Krasnoyarsk Territory.
The catchment of the river is poorly populated. Relatively large settlements located on the banks of the river include Turukhansk (population 4662), Tura (5343), and Erbogachen (1965) [12]. There are no centralized wastewater treatment plants in the settlements as local population use private septic tanks. The N. Tunguska is difficult for ship navigation due to numerous rapids and shoals, although small cargo ships sail in the upper and middle course. The navigation of heavy vessels on the N. Tunguska occurs primarily during the spring flood.

2.2. Sampling

Sampling sites were located in the middle course of the N. Tunguska near Erbogachen (ER-1-ER-2), and in the mouth of the Nizhnyaya Tunguska River near Turukhansk (TU-1–TU-3) (Figure 1 and Figure S1, Table 1). Sampling of surface water and bottom sediments was conducted from the right bank in late June–mid July 2021.
We sampled surface water by Mantra trawl with a 330 µm neuston mesh net designed to capture floating particles from top 15 cm layer of river water [13]. The sampler was equipped with a flowmeter (Hydro-Bios, Altenholz, Germany) to determine the volume of water with the Manta trawl aligned with the direction of flow of the river, fixed in-situ, and remained for 15 min to collect floating plastic particles. Three individual samples of water and bottom sediments were taken at the same site. Bottom sediments were sampled near the coast (0.5–1 m from the water’s edge) using a stainless steel spoon, and stored in an aluminum foil bags. Three 1.5 kg bottom sediments samples were collected in randomly chosen locations at each sampling site. Since TU-2 and TU-3 sampling sites contained a thin layer of silty-sandy deposits atop a pebble layer, a relatively wider area collection areas was required compared to ER-1, ER-2 and TU-1 sites.
Based on the data obtained after sample processing, the arithmetic mean and standard deviation were subsequently calculated.
Collected sample water was tested for temperature, pH and oxidation-reduction potential (Eh) onsite using Hanna Instruments’ (Vöhringen, Germany) portable pH/mV/°C meter HI 8314. To estimate total organic matter content (%) in the bottom sediments the loss-on-ignition (LOI) was determined [14].

2.3. Laboratory Processing

Utilizing U.S. National Oceanic and Atmospheric Administration (NOAA) protocol, total water samples were treated by sieving and dense-liquid separation to extract MPs [15]. Organic material was digested using wet peroxide oxidation with 30% hydrogen peroxide 0.05 M Fe(II) at 70 °C, and repeated twice to remove sample organic material. Plastic and mineral particles were separated by placing the sample in a 1.20 g/mL NaCl solution in a separating funnel overnight.
For the extraction of MPs from bottom sediments, the technique proposed by Thompson et al. [16] and subsequently modified and applied in other studies [17,18] was used: (1) the total samples of bottom sediments were dried at 60–80 °C for at least 48 h to a constant weight; (2) three subsamples of air dry bottom sediments, 50 g each, were taken and placed in clean 500 mL beakers; (3) 200 mL of saturated NaCl solution (ρ = 1.20 g/mL) were added to each sample, agitated for 1 min and left for 12 h for density separation; (4) the upper phase (half of the volume) was carefully transferred to clean 500 mL serum bottles, separated for another 12 h and repeated this stage one more time; (5) a 30% H2O2 solution was added to a final concentration of 0.73% to degrade the organic matter [17] and left for 24 h to oxidize the organic matter; (6) final density separation was carried out in a separatory funnel for 12 h.
Particles extracted from water and bottom sediments samples were collected by vacuum filtration on the 0.45 μm acetate cellulose filters (Sartorius, Göttingen, Germany). Filters were kept in the dark until microscopic analysis. There were three replicates for each sampling site. MP particles were then analyzed by a visual method, according to MP physical characteristics, under a Micromed MC2 (Micromed, Saint-Petersburg, Russia) stereomicroscope equipped with a digital ToupView USB 2.0 CMO S camera and ToupView 3.7.6273 software (ToupTek, Hangzhou, China). Visual assessment of MP particles on the surface of the filter was undertaken, and the sum of MP particles detected on each filter provided a baseline for recalculating MP content in 1 m3 (taking into account the readings of the flow meter and the sampler cross-sectional area) and in 1 kg of dry weight for bottom sediments (taking into account the aliquot taken for analysis and the moisture content of the initial samples). The rules were followed to identify MP particles [19]: particles differing in color from organic residues were taken into account; having a uniform color; not having a cellular structure. It was also taken into account that synthetic fibers, in contrast to natural polymer structures, usually have the same thickness and color along their entire length, an even surface, appear transparent or translucent, and are characterized by smooth bends. In doubtful cases, an additional hot needle test was performed. Polymer analysis was not conducted, as this was a preliminary study only.

2.4. Prevention and Control of Contamination

Where possible, the materials and the implements used in the laboratory were comprised of inert materials such as stainless steel, glass, and aluminum, to minimize sample contamination with MP. Similarly, only cotton was used for laboratory cloths and field clothing. Evaluation of contamination during the sample preparation process was controlled using replicated procedural blanks of negative controls with distilled water (n = 3 for each batch of samples) [20]. We observed single microfibers on the control filters and normalized results taking into account air pollution.

2.5. Data Analysis

The concentration of MP particles was estimated by the number of items per m3 (for surface water), or per kg of dry weight (for bottom sediments). The processing of the samples and the detection of MPs from three independent samples of surface water and bottom sediments were carried out in parallel. Based on the data obtained, the arithmetic mean and standard deviation were calculated for each sampling site.
The MP particles were visually classified into four groups by shape as described by Frias and Nash [21]: (1) microfragments of irregular shape, (2) microfibers, (3) microfilms, and (4) microspheres, and into five groups by colors: (1) blue, (2) red, (3) transparent, (4) black, and (5) other colors. In each of these groups the particles were then further classified by dimension, which were measured using ToupView 3.7.6273 software instrument (ToupTek, Hangzhou, China): (1) 0.15–0.30 mm, (2) 0.30–1.00 mm, (3) 1.00–2.00 mm, (4) 2.00–3.00 mm, (5) 3.00–4.00 mm, and (6) 4.00–5.00 mm, and the percentage of the different shapes and sizes of the MPs were determined.
To compare differences in total MPs counts between sites and sampling locations, a non-parametric Mann–Whitney U test [22] was used, with results determined to be statistically significant (p ≤ 0.05). The correlation in physico-chemical parameters and MPs counts was evaluated using Pearson’s correlation coefficient [23].

3. Results

3.1. Total Counts of Microplastics and Physico-Chemical Parameters of the Surface Water and Bottom Sediments

The average concentration of MPs in the surface water of the Nizhnyaya Tunguska River in its middle course (sampling sites ER-1 and ER-2) was 1.20–2.01 particles per cubic meter (Table 2). No significant differences were found between the ER-1 (upstream of the settlement) and ER-2 (downstream) sites (Table 3a). In the lower course of the N. Tunguska (river mouth, site TU-3) the concentration of MPs in the water was higher (on average 4.53 units per cubic meter) and differed from ER-2 site at a significance level of p <0.05 (Table 2 and Table 3a). This indicates that a single settlement (in particular, Erbogachen) may not make a significant contribution to surface water pollution (in terms of the total number of particles). However, anthropogenic activity along the entire length of the N. Tunguska River makes a significant contribution to the pollution of river waters.
Total counts of MPs in the surface water of the Yenisei River before the confluence of the N. Tunguska (TU-1) and downstream of its mouth (TU-2), were at approximately the same level (2.89–3.01) and did not differ significantly (Table 2 and Table 3a).
Water of the N. Tunguska and the Yenisei Rivers at the studied locations was characterized by circumneutral to slightly alkaline pH conditions (Table 2). The water temperature in the middle course of the N. Tunguska in June 2021 reached 25.5 °C. At the mouth of the River it was much lower, at 15.1 °C in the middle of July 2021 (Table 2). As summarized by Rummel et al. [24], MP biofouling process depends on environmental factors, mainly light and temperature, with early biofilm formation on plastic debris influenced by pH and ionic strength. Given that biofouling is important in determining MP behavior in the aquatic environment, it is clear that the concentration of particles in water can be affected by physico-chemical parameters. However, this study found that the MP count did not depend on the water’s physico-chemical parameters.
The average count of MPs in bottom sediments in the middle course of the N. Tunguska (ER-1, ER-2) ranged from 235 to 543 particles per kilogram of dry weight (Table 2). Higher MP count variability in TU-2 and TU-3 bottom sediment was due to the nature of the bottom sediments and the need to collect these samples from larger areas than the other samples, as described in Section 2.2 above. Significantly, more particles were recorded upstream than downstream of the Erbogachen settlement (Table 3b), which may be explained by physico-chemical parameters of the sediments (see below). In the bottom sediments collected at the mouth of the N. Tunguska River (TU-3), an average of 489 particles per kg of dry weight was detected. The total counts of MPs in TU-3 bottom sediments did not differ significantly from those in the ER-2 (Table 3b). Therefore, it is impossible to draw conclusions about the influence of anthropogenic factors on the general level of pollution of bottom sediments of the river with MPs.
MP concentration in bottom sediments depended on the total organic matter content determined as LOI. Minimum and maximum average plastic particles content (235 and 543 items per kg) observed in sites ER-2 and ER-1 where sediments were correspondingly characterized by lowest and highest average total content of organic matter (Table 2). Pearson’s correlation (r = 0.952) indicates a strong linear association between average organic matter content and average counts of MPs in bottom sediments.

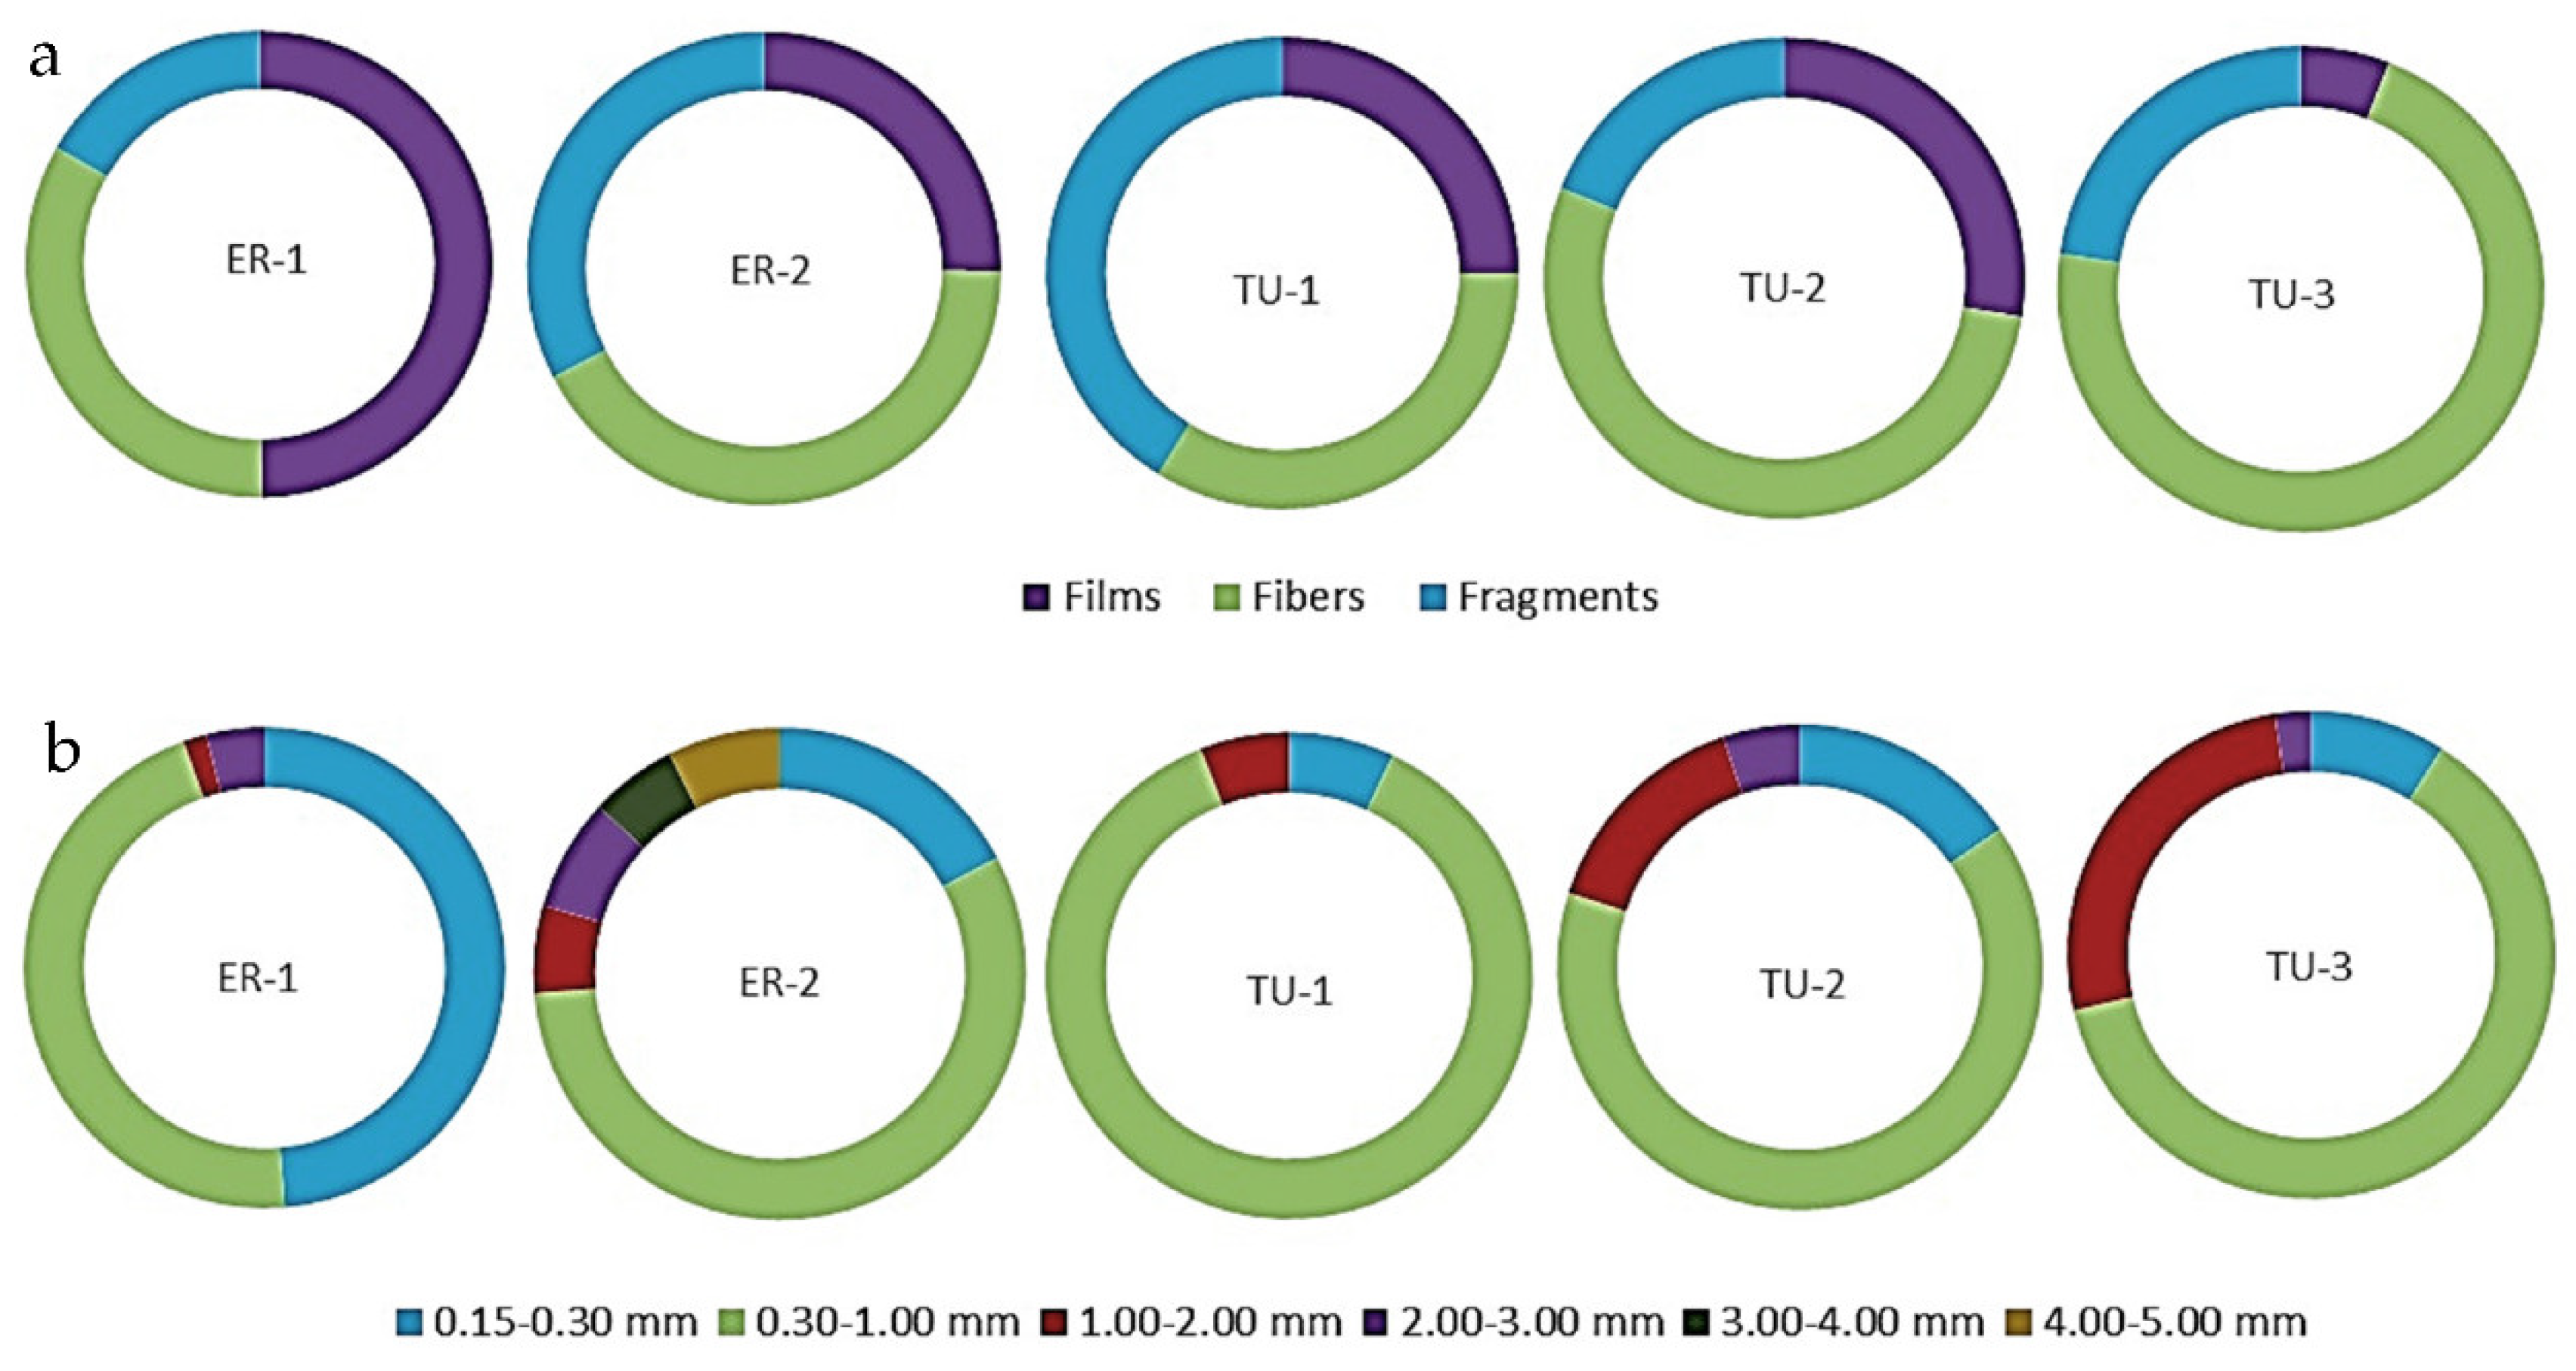
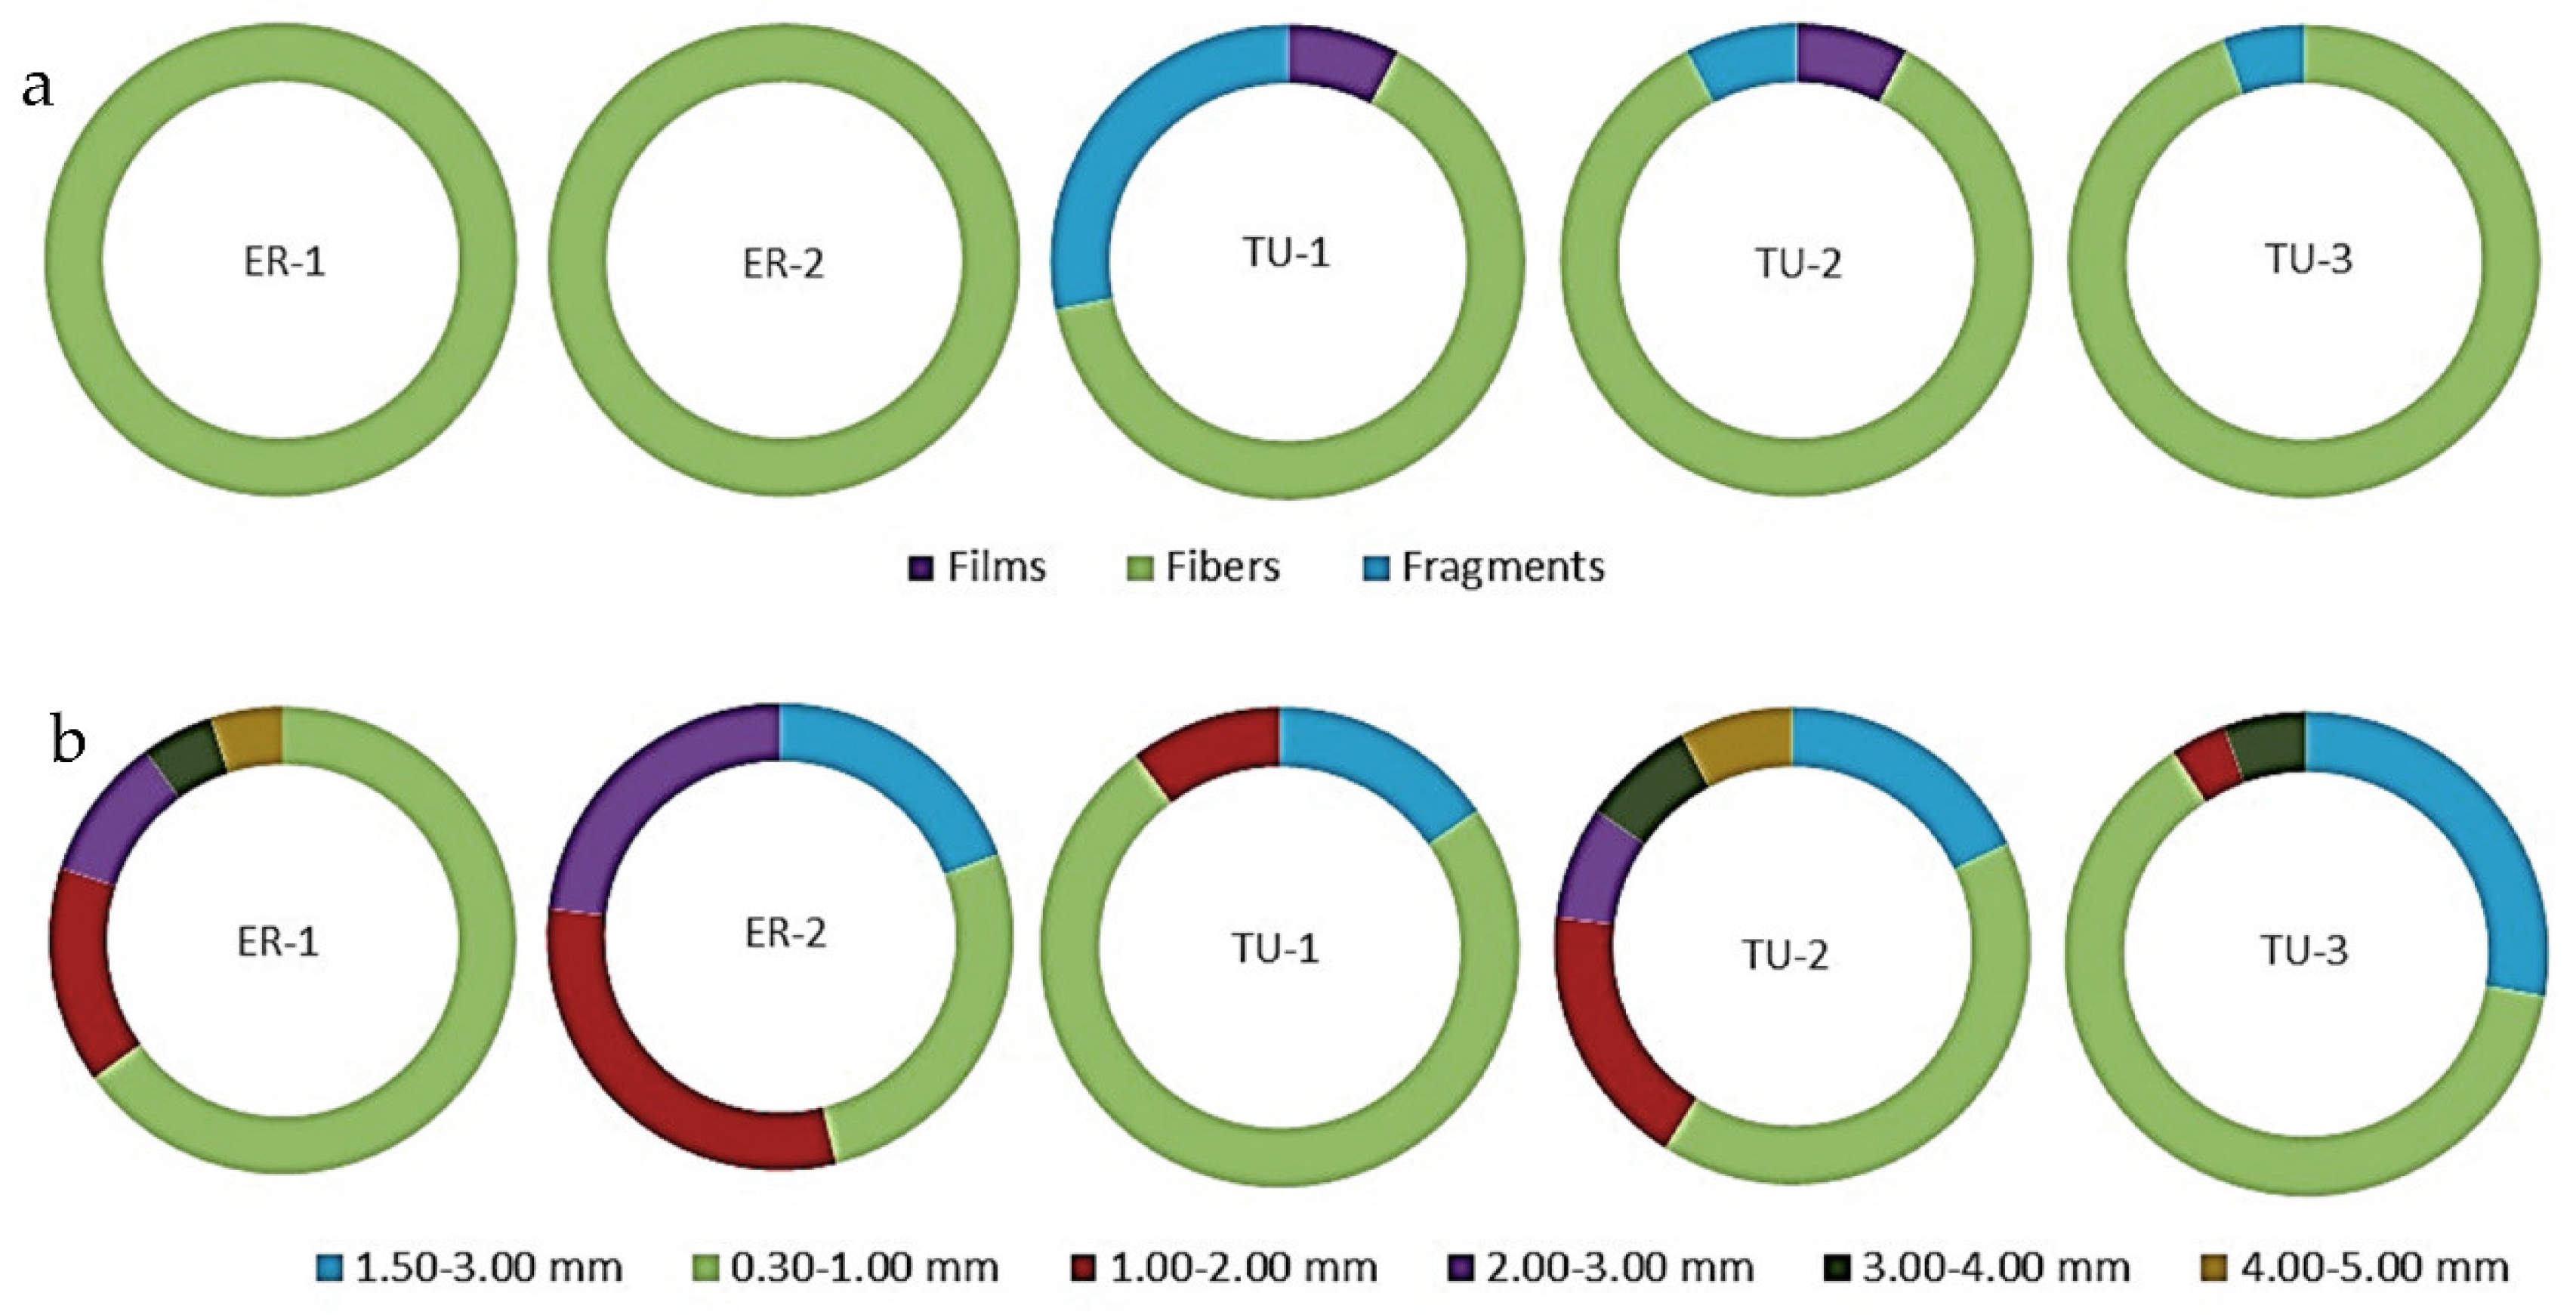
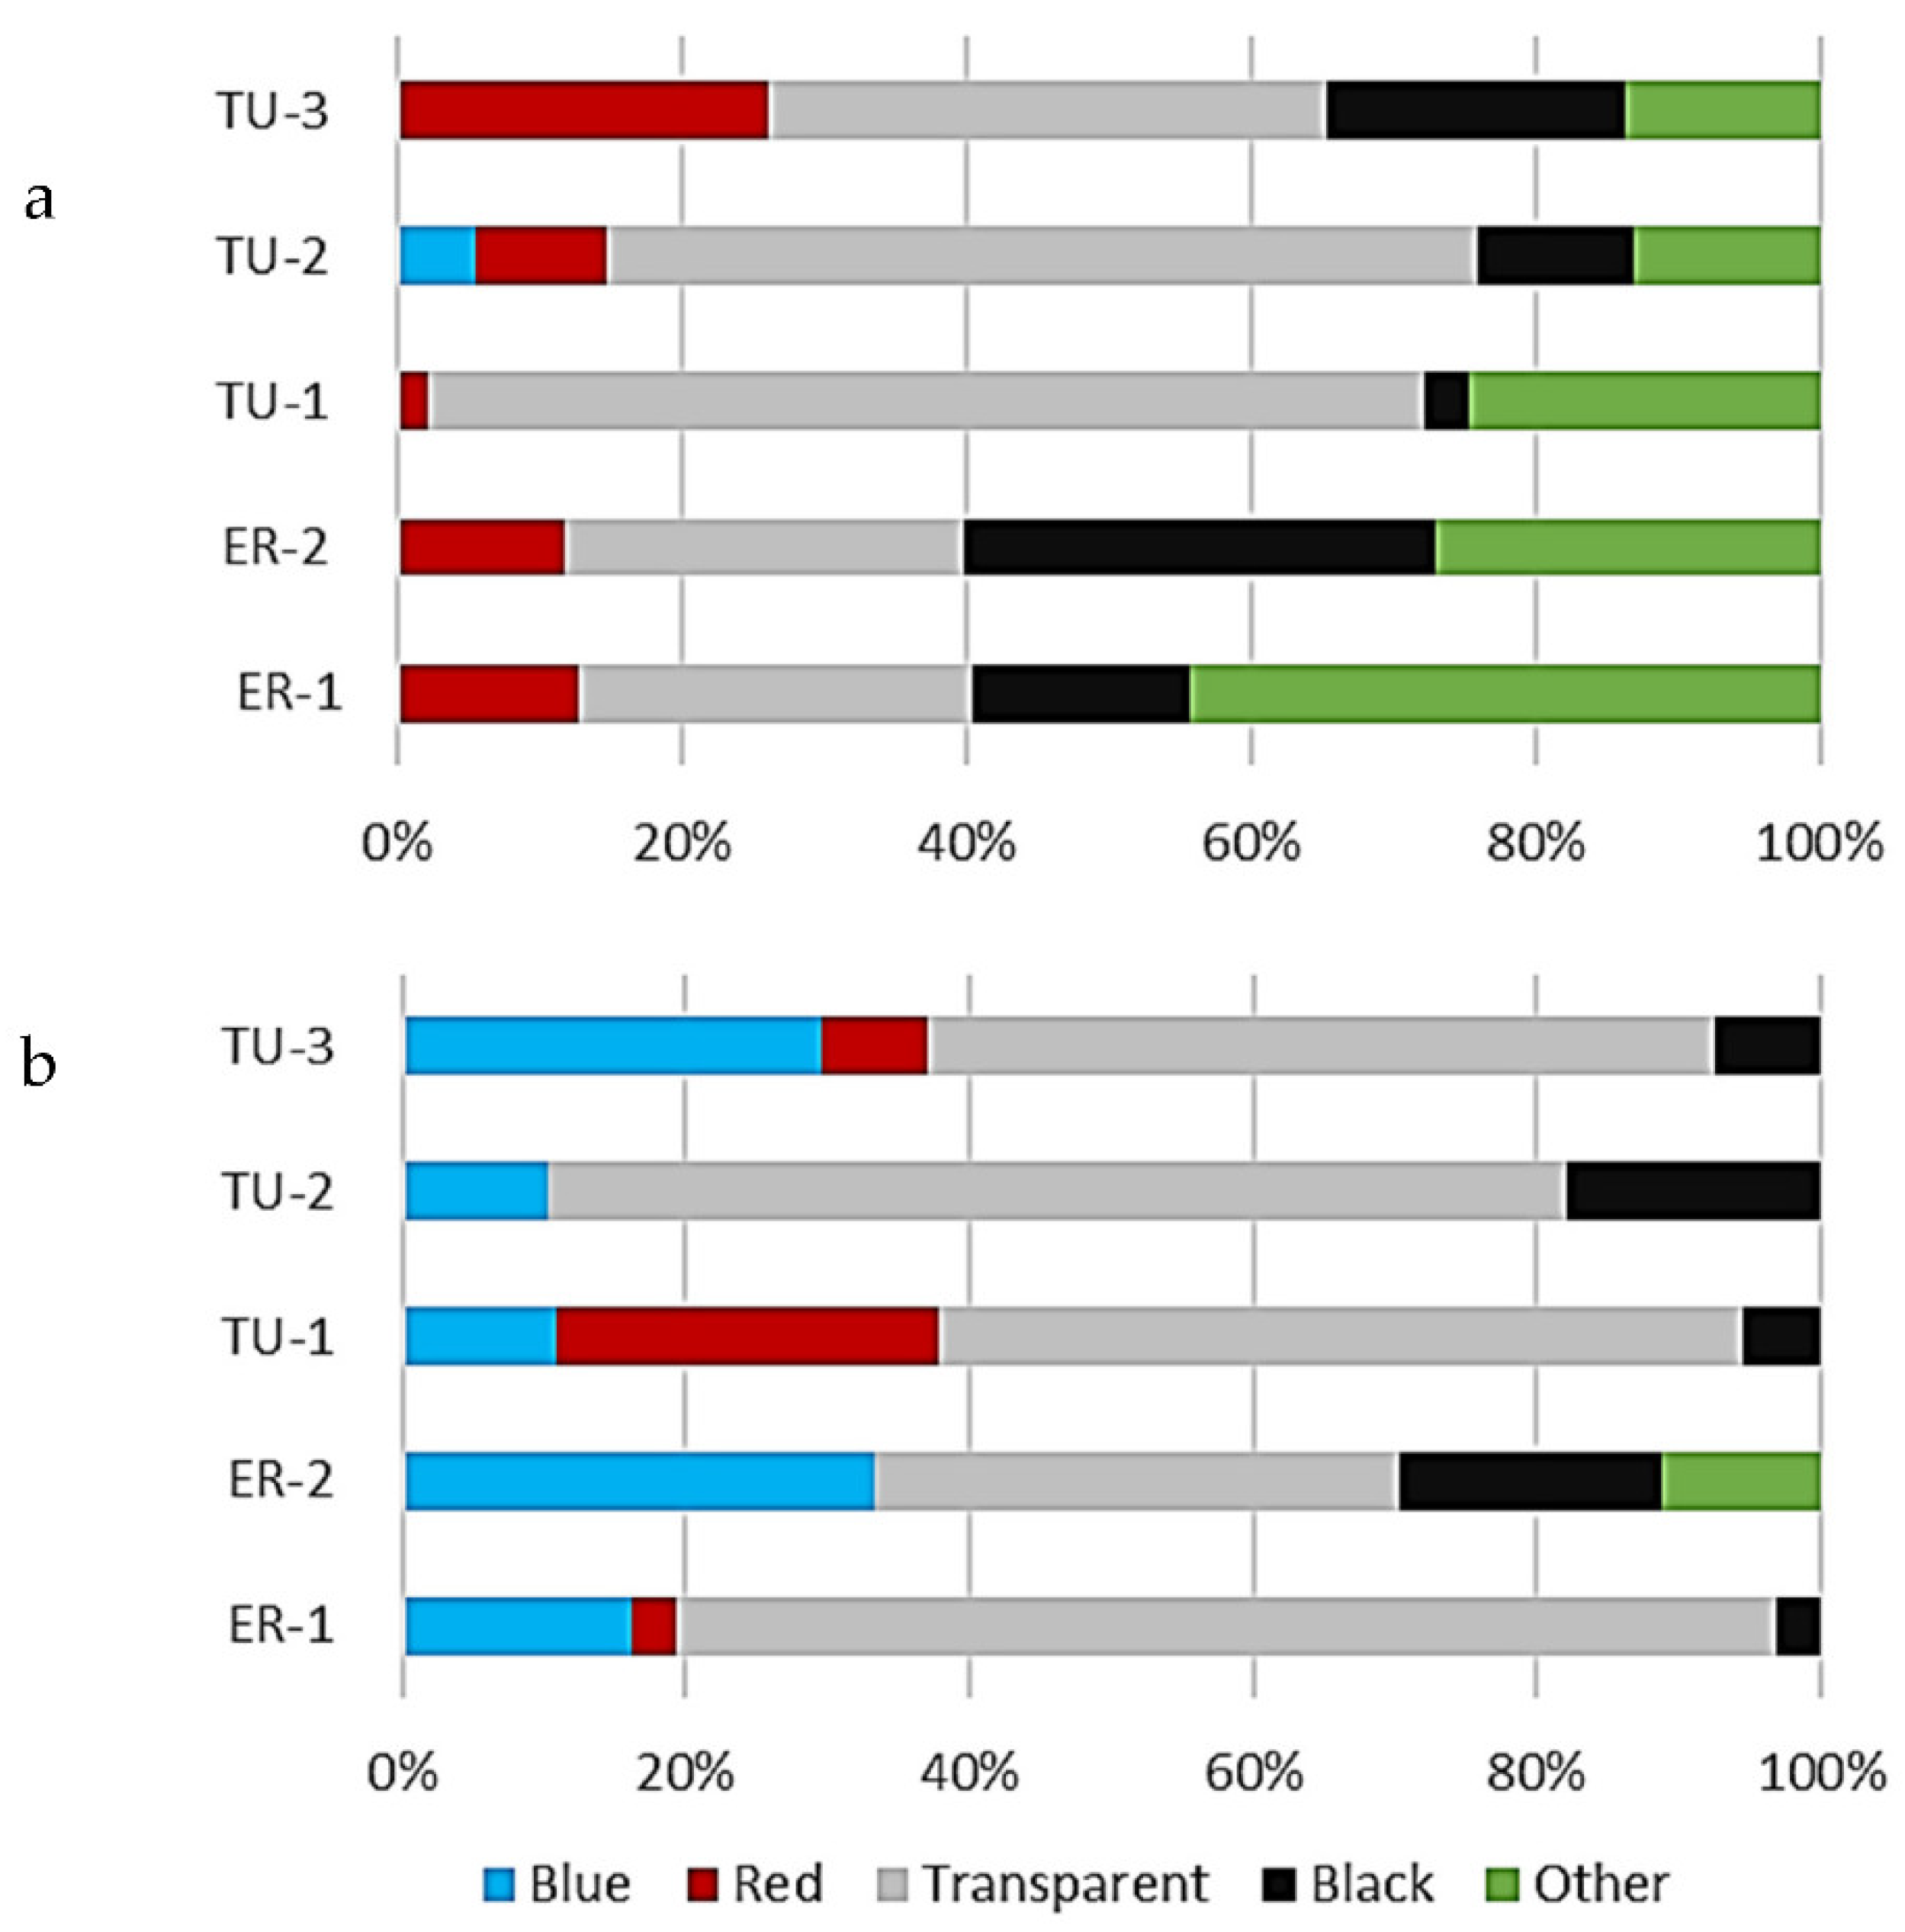
3.2. Morphology of Microplastics in the Surface Water and Bottom Sediments

Microfibers, microfragments of irregular shape, and microfilms were detected among the plastic particles extracted from the surface waters and bottom sediments of the N. Tunguska and the Yenisei rivers (Figure 2a and Figure 3a). Although the nomenclature used for taxonomy of MP shapes is not standardized, these terms are commonly used to describe MP morphology, along with “microspheres” [21]. No microspheres, including micropellets or microbeads, were found in either the surface water or bottom sediments of either river studied. The bottom sediments were obviously dominated by fibers (Figure 3a and Figure S2). In ER-1 and in ER-2 samples of bottom sediments (middle course of the N. Tunguska River) microfibers accounted for 100% of total microplastics counts; in TU-3 sample (mouth of the River) microfibers and microfragments were 94% and 6%, correspondingly (Figure 3a).
In the Yenisei sites TU-1 and TU-2, bottom sediments contained microfilms apart from fibers and fragments (8% of the total counts in both sites), which may reflect differences in sources of pollution.
The sizes of MPs particles from riverine water and bottom sediments were analyzed visually using a stereomicroscope (Figure 2b and Figure 3b). Since visual analysis has limitations on the size of the detected particles [25], only MPs larger than 0.15 were counted. In most of the studied water and bottom sediment samples, particles from 0.30 to 1.00 mm were most abundant (Figure 2b and Figure 3b). Particles of more than 3.00 mm in the longest axis were found in one of the water samples (ER-2) and in several sediment samples (ER-1, TU-2, TU-3).
Mostly transparent MPs were found in the water (up to 70% in TU-1) and in bottom sediments (up to 77% in ER-1), Figure 4. In the surface water, we found also red, black and other colored particles, blue particles were detected in TU-2 only (Figure 4a). MPs color distribution profiles differed for bottom sediments where blue particles were the second major group followed by black MPs (Figure 4b).

4. Discussion

4.1. Levels of the Microplastic Pollution in Rivers

MPs are abundant in freshwater environments, but regional variations in intensity and distribution of MP pollution occur due to population density, industrial sources, accepted wastewater treatment technologies, and waterbody characteristics [6,26,27]. Moreover, a reliable comparison of particles counts for different rivers to date has been very difficult because variable and non-standardized methods are currently used for sample collection and processing in riverine MPs quantification studies [28,29]. This study attempts to compare the total counts of MPs in the N. Tunguska and the Yenisei Rivers with published data on the world’s rivers; data on the particle content of surface water and bottom sediments of the world’s rivers, obtained using the similar methodology, mainly visual counting and sorting, were selected.
Data from 37 global freshwater locations demonstrate that continent with the highest level of freshwater MP is Asia, followed by North America, Africa, Oceania, South America, and Europe. Of all Asian countries, China has the highest level of MP pollution [27]. Comparative analysis of the particle counts in rivers shows that the content of MPs in river water can vary from <1 item/m3 [30,31,32] to >1000 items/m3 [33,34,35]. So, the N. Tunguska and the surveyed section of the Yenisei River cannot be classified as rivers heavily polluted with MPs. This is expected, given there are no large industrial centers or large settlements in the study area, and therefore no strong sources of pollution. Compared with the previously survey of sections of the Ob River system utilizing the same methodology [10], which are much more populated and with a developed industry, the average concentrations of MPs in the surface water of the N. Tunguska and the Yenisei River are 10–40 times lower.
Concomitantly, bottom sediments are considered as a long-term sink for MPs [36,37] and could serve as a more reliable criterion of plastic pollution level, although to date few studies have focused on MPs in freshwater bodies [32,38]. However, oscillations in the spread of MPs in bottom sediments along the river course arises since complete mixing and redistribution of the pollutant can occur at a considerable distance from the source, with currents, turbulence, and wind forces contributing to the accumulation of MP particles [39]. MPs distribution may depend on the morphology and sedimentation rates in the of the waterbody sections. Association of the MP counts with the total organic matter content in bottom sediments revealed in our study may also reflect higher rates of sedimentation processes in different parts of the river.
To date, there have been occasional reports of low concentrations of MPs in freshwater bottom sediments [32,40,41]. More often, the values are expressed in hundreds or thousands of particles per kg of dry sediments. The highest average MPs count revealed in the bottom sediments of the Wen-Rui Tang River, China, 32,947 ± 15,342 items kg−1 dry sediment [42]. However, this number were dominated by small particles (0.02–0.30 mm), which are rarely quantified in other studies.
It is documented that MPs pollution reaches remote areas of the planet such as remote mountain regions in Europe, and National Parks in the USA [43,44,45], with air transport reported as the main transport route for MPs. However, the patterns of the pollution in the Nizhnyaya Tunguska indicates the ingress of plastics from the shore and from fishing activities (Section 4.2). The N. Tunguska is a remote tributary of the Yenisei River, flowing through sparsely populated territory, but even minimum anthropogenic load is enough to pollute rivers with MPs. Similarly, previous studies demonstrate that MPs can contaminate waterbodies in remote areas like rivers in the Tibet Plateau, China, and Lake Hovsgol in Mongolia [46,47].

4.2. Potential Sources and Distribution of Microplastics in the Surveyed Area

MPs in freshwater environments arise from multiple sources, including synthetic fabrics and fibers, health and hygiene products, plastic waste, and raw materials from industry [37]. According to some estimates [48], the majority of MPs entering the sea from rivers occurs from particles of synthetic polymers remaining after incomplete wastewater treatment (42%), microfibers of synthetic fabrics (29%), fragments and fibers formed during the decay of plastic waste (19%), and microspheres from personal hygiene products and industrial sources (10%).
MPs sources may be characterized by specific “profiles” that reflect the origin of the pollution. For instance, levels of microspheres used in personal care and cosmetic products, along with microfibers from synthetic fabrics and fibers, are highest close to wastewater discharge points [49,50]; high concentrations of polyester fibers located near textile factories [51]; microbeads typically occur in areas located near the production of plastic goods [52]; fragments of composite thermoplastics containing reflective glass spheres may be associated with the ingress of road marking components into surface waters along with storm runoff [28]. Of course, remote locations have fewer sources of pollution, and some of them can be excluded from the list for Siberian Rivers.
Polymer composition analysis may help for the identification of MP sources. This study is a fast screening of the MP presence and abundance in the Yenisei River system and does not include analysis of the particles polymer composition due its pilot nature. Rather, this study focuses on the morphology of the MPs based on the possible pollution source given that MP shapes, sizes and colors are determined (but not limited to) by the original plastic features [53,54].
In our study, the most abundant particles in the water and sediments were those ranging in size from 0.30 to 1.00 mm. MPs in this size range are typical for the riverine MP studies, including Russian rivers [10,31]. This may be explained by using of 0.30–0.33 mm mesh nets for sampling in most of cases, which cut off the quantification of the smallest particles. In general, MPs with a particle size of less than 1.00 mm are more abundant in freshwater sediments and as particle size increased, the MP abundances show a trend of decrease [42,55].
Generally, fibers are the dominant shape for MPs in freshwater sediment worldwide [35]. MPs recovered from the surface of the N. Tunguska and the Yenisei Rivers include fibers, fragments and films. MP particles from the bottom sediments were also dominated by transparent fibers, indicating that MPS in this study might be derived from the fishing activity of the local population [56], such as that identified in the relatively clean Dalälven River that flows through a basin in Sweden with a population of less than 250,000 [57]. Since we also observed colored fibers in the water and sediments samples (Figure S2), the second possible source of fiber-shaped MPs is the direct clothing of residents and other synthetic fabrics. Intentional or accidental discarding of garbage by local residents is identified as another source of plastic waste, with plastic wastes observed on the bank of the N. Tunguska River, as well as direct plastic contamination of the small watercourses in the settlements during sampling fieldwork in this study (Figure S1(7–9)).
Therefore, potential sources of MPs in the N. Tunguska and the Yenisei Rivers may be associated with the human activities, including mismanaging of the plastic waste, use of synthetic fabrics, and intensive fishing. Previously, MPs have been identified in remote rivers, confirmed by MP in both surface water and bottom sediments on the Tibet Plateau [47] with resident and tourist activities likely the source of the MPs.

5. Conclusions

In this study, we documented the presence of MPs in the surface waters and bottom sediments of the remote Yenisei tributary–the Nizhnyaya Tunguska River, and in adjacent section of the Yenisei River. The average MPs content in the surface water varied from 1.20 ± 0.70 to 4.53 ± 2.04 items/m3 and tend to rise in the N. Tunguska watercourse (p < 0.05). Concentrations of MPs in bottom sediments of the two rivers reached 543 ± 94.1; no tendency of downstream increasing observed. Linear association (r = 0.952) between average organic matter content and average counts of MPs in bottom sediments reflected differences in sedimentation rates in different parts of the river system. Probable sources of MPs in the N. Tunguska and the Yenisei Rivers include mismanaging plastic waste in settled areas, using of synthetic fabrics, and intensive fishing activity of the local population.
The results of this preliminary study confirm the potential role of the Yenisei River in the transport of MPs to the Kara Sea. However, future intensive research on riverine MP abundance and transport are needed to fill the gap in the study of the pollution in the Siberian and Arctic regions. Spatial-temporal studies to determine the average concentrations of MPs in the Siberian Rivers over a certain representative time along, with further analysis of the polymer composition will help estimation the total particle influx into the Arctic seas.

Supplementary Materials

The following are available online at https://www.mdpi.com/article/10.3390/w13223248/s1, Figure S1: The N. Tunguska River and the Yenisei River in the sampling locations and anthropogenic litter near the settlements. Figure S2: Microfibers from the surface water and bottom sediments of the N. Tunguska River and the Yenisei River.

Author Contributions

D.S.V. and Y.A.F. conceived the study and contributed to the design and implementation of the research; Y.A.F., D.S.V. and A.A.T. performed the sampling and fieldwork; Y.A.F., O.A.K., E.D.V. and K.S.K. contributed to the laboratory work and the analysis of the results; Y.A.F. and T.S.H. wrote the manuscript. All authors have read and agreed to the published version of the manuscript.

Funding

This research was funded by the East Siberian Oil and Gas Company JSC, Rosneft (contract No. 2103-NIR/1) and by TSU project No. 2.0.9.21 within the federal academic leadership program Priority 2030.

Institutional Review Board Statement

Not applicable.

Informed Consent Statement

Not applicable.

Acknowledgments

We are grateful to Andrey Trifonov for the excellent organization of the fieldtrips.

Conflicts of Interest

No authors declare a conflicting or competing interest.

References

  1. Sharma, S.; Chatterjee, S. Microplastic pollution, a threat to marine ecosystem and human health: A short review. Environ. Sci. Pollut. Res. 2017, 24, 21530–21547. [Google Scholar] [CrossRef]
  2. Wang, W.; Gao, H.; Jin, S.; Li, R.; Na, G. The ecotoxicological effects of microplastics on aquatic food web, from primary producer to human: A review. Ecotoxicol. Environ. Saf. 2019, 173, 110–117. [Google Scholar] [CrossRef] [PubMed]
  3. Eerkes-Medrano, D.; Thompson, R.C.; Aldridge, D.C. Microplastics in freshwater systems: A review of the emerging threats, identification of knowledge gaps and prioritisation of research needs. Water Res. 2015, 75, 63–82. [Google Scholar] [CrossRef] [PubMed]
  4. Campanale, C.; Massarelli, C.; Savino, I.; Locaputo, V.; Uricchio, V.F. A detailed review study on potential effects of microplastics and additives of concern on human health. Int. J. Environ. Res. Public Health 2020, 17, 1212. [Google Scholar] [CrossRef] [PubMed] [Green Version]
  5. Lebreton, L.C.; van der Zwet, J.; Damsteeg, J.W.; Slat, B.; Andrady, A.; Reisser, J. River plastic emissions to the world’s oceans. Nat. Commun. 2017, 8, 15611. [Google Scholar] [CrossRef]
  6. Skalska, K.; Ockelford, A.; Ebdon, J.E.; Cundy, A.B. Riverine microplastics: Behaviour, spatio-temporal variability, and recommendations for standardised sampling and monitoring. J. Water Process. Eng. 2020, 38, 101600. [Google Scholar] [CrossRef]
  7. Alimi, O.S.; Hernandez, L.M.; Tufenkji, N. Microplastics and nanoplastics in aquatic environments: Aggregation, deposition, and enhanced contaminant transport. Environ. Sci. Technol. 2018, 52, 1704–1724. [Google Scholar] [CrossRef]
  8. Ershova, A.; Makeeva, I.; Malgina, E.; Sobolev, N.; Smolokurov, A. Combining citizen and conventional science for microplastics monitoring in the White Sea basin (Russian Arctic). Mar. Pollut. Bull. 2021, 173, 112955. [Google Scholar] [CrossRef]
  9. Yakushev, E.; Gebruk, A.; Osadchiev, A.; Pakhomova, S.; Lusher, A.; Berezina, A.; van Bavel, B.; Vorozheikina, E.; Chernykh, D.; Kolbasova, G.; et al. Microplastics distribution in the Eurasian Arctic is affected by Atlantic waters and Siberian rivers. Commun. Earth Environ. 2021, 2, 23. [Google Scholar] [CrossRef]
  10. Frank, Y.A.; Vorobiev, E.D.; Vorobiev, D.S.; Trifonov, A.A.; Antsiferov, D.V.; Soliman Hunter, T.; Wilson, S.P.; Strezov, V. Preliminary screening for microplastic concentrations in the surface water of the Ob and Tom Rivers in Siberia, Russia. Sustainability 2021, 13, 80. [Google Scholar] [CrossRef]
  11. The State Water Register. Available online: http://textual.ru/gvr/ (accessed on 5 October 2021).
  12. Russian Federal State Statistics Service. 2010 All-Russian Population Census, Volume 1. 2011. Available online: https://catalog.ihsn.org/index.php/catalog/4215 (accessed on 6 October 2021).
  13. Tokai, T.; Uchida, K.; Kuroda, M.; Isobe, A. Mesh selectivity of neuston nets for microplastics. Mar. Pollut. Bull. 2021, 165, 112111. [Google Scholar] [CrossRef]
  14. Sutherland, R.A. Loss-on-ignition estimates of organic matter and relationships to organic carbon in fluvial bed sediments. Hydrobiologia 1998, 389, 153–167. [Google Scholar] [CrossRef]
  15. Masura, J.; Baker, J.; Foster, G.; Arthur, C. Laboratory Methods for the Analysis of Microplastics in the Marine Environment: Recommendations for Quantifying Synthetic Particles in Waters and Sediments; NOAA Technical Memorandum NOS-OR&R-48; NOAA Marine Debris Division: Silver Spring, MD, USA, 2015; p. 39.
  16. Thompson, R.C.; Olsen, Y.; Mitchell, R.P.; Davis, A.; Rowland, S.; John, A.; McGonigle, D.; Russell, A. Lost at sea: Where is all the plastic? Science 2004, 304, 838. [Google Scholar] [CrossRef] [PubMed]
  17. Zhao, J.; Ran, W.; Teng, J.; Liu, Y.; Liu, H.; Yin, X.; Cao, R.; Wang, Q. Microplastic pollution in sediments from the Bohai Sea and the Yellow Sea, China. Sci. Total Environ. 2018, 640–641, 637–645. [Google Scholar] [CrossRef] [PubMed]
  18. Jahan, S.; Strezov, V.; Weldekidan, H.; Kumar, R.; Kan, T.; Sarkodie, S.A.; He, J.; Dastjerdi, B.; Wilson, S.P. Interrelationship of microplastic pollution in sediments and oysters in a seaport environment of the eastern coast of Australia. Sci. Total Environ. 2019, 695, 133924. [Google Scholar] [CrossRef]
  19. Hidalgo-Ruz, V.; Gutow, L.; Thompson, R.C.; Thiel, M. Microplastics in the marine environment: A review of the methods used for identification and quantification. Environ. Sci. Technol. 2012, 46, 3060–3075. [Google Scholar] [CrossRef]
  20. Koelmans, A.A.; Nor, N.H.M.; Hermsen, E.; Kooi, M.; Mintenig, S.M.; De France, J. Microplastics in freshwaters and drinking water: Critical review and assessment of data quality. Water Res. 2019, 155, 410–422. [Google Scholar] [CrossRef]
  21. Frias, J.P.G.L.; Nash, R. Microplastics: Finding a consensus on the definition. Mar. Pollut. Bull. 2019, 138, 145–147. [Google Scholar] [CrossRef]
  22. Mann, H.B.; Whitney, D.R. On a test of whether one of two random variables is stochastically larger than the other. Ann. Math. Stat. 1947, 18, 50–60. [Google Scholar] [CrossRef]
  23. Rodgers, J.L.; Nicewander, W.A. Thirteen ways to look at the correlation coefficient. Am. Stat. 1988, 42, 59–66. [Google Scholar] [CrossRef]
  24. Rummel, C.D.; Jahnke, A.; Gorokhova, E.; Kühnel, D.; Schmitt-Jansen, M. Impacts of biofilm formation on the fate and potential effects of microplastic in the aquatic environment. Environ. Sci. Technol. Lett. 2017, 4, 258–267. [Google Scholar] [CrossRef] [Green Version]
  25. Lusher, A.L.; Bråte, I.L.N.; Munno, K.; Hurley, R.R.; Welden, N.A. Is it or isn’t it: The importance of visual classification in microplastic characterization. Appl. Spectrosc. 2020, 74, 1139–1153. [Google Scholar] [CrossRef] [PubMed]
  26. Heidbreder, L.M.; Bablok, I.; Drews, S.; Menzel, C. Tackling the plastic problem: A review on perceptions, behaviors, and interventions. Sci. Total Environ. 2019, 668, 1077–1093. [Google Scholar] [CrossRef] [PubMed]
  27. Chen, H.; Qin, Y.; Huang, H.; Xu, W. A Regional difference analysis of microplastic pollution in global freshwater bodies based on a regression model. Water 2020, 12, 1889. [Google Scholar] [CrossRef]
  28. Horton, A.A.; Walton, A.; Spurgeon, D.J.; Lahive, E.; Svendsen, C. Microplastics in freshwater and terrestrial environments: Evaluating the current understanding to identify the knowledge gaps and future research priorities. Sci. Total Environ. 2017, 586, 127–141. [Google Scholar] [CrossRef] [PubMed] [Green Version]
  29. Weis, J.S. Aquatic microplastic research—A critique and suggestions for the future. Water 2020, 12, 1475. [Google Scholar] [CrossRef]
  30. Lechner, A.; Keckeis, H.; Lumesberger-Loisl, F.; Zens, B.; Krusch, R.; Tritthart, M.; Glas, M.; Schludermann, E. The Danube so colourful: A potpourri of plastic litter outnumbers fish larvae in Europe’s second largest river. Environ. Pollut. 2014, 188, 177–181. [Google Scholar] [CrossRef] [Green Version]
  31. Lisina, A.A.; Platonov, M.M.; Lomakov, O.L.; Sazonov, A.A.; Shishova, T.V.; Berkovich, A.K.; Frolova, N.L. Microplastic Abundance in Volga River: Results of a pilot study in summer 2020. Geogr. Environ. Sustain. 2021, 14, 82–93. [Google Scholar] [CrossRef]
  32. Singh, N.; Mondal, A.; Bagri, A.; Tiwari, E.; Khandelwal, N.; Monikh, F.A.; Darbha, G.K. Characteristics and spatial distribution of microplastics in the lower Ganga River water and sediment. Mar. Pollut. Bull. 2021, 163, 111960. [Google Scholar] [CrossRef]
  33. Moore, C.J.; Lattin, G.; Zellers, A.F. Quantity and type of plastic debris flowing from two urban rivers to coastal waters and beaches of Southern California. J. Integr. Coast. Zone Manag. 2011, 11, 65–73. [Google Scholar] [CrossRef]
  34. Rodrigues, M.O.; Abrantes, N.; Gonçalves, F.J.M.; Nogueira, H.; Marques, J.C.; Gonçalves, A.M. Spatial and temporal distribution of microplastics in water and sediments of a freshwater system (Antuã River, Portugal). Sci. Total Environ. 2018, 633, 1549–1559. [Google Scholar] [CrossRef] [PubMed]
  35. Eo, S.; Hee, S.; Kyoung, Y.; Myung, G. Spatiotemporal distribution and annual load of microplastics in the Nakdong River, South Korea. Water Res. 2019, 160, 228–237. [Google Scholar] [CrossRef] [PubMed]
  36. Rochman, C.M. Microplastics research—From sink to source. Science 2018, 360, 28–29. [Google Scholar] [CrossRef]
  37. Li, C.; Busquets, R.; Campos, L.C. Assessment of microplastics in freshwater systems: A review. Sci. Total Environ. 2020, 707, 135578. [Google Scholar] [CrossRef]
  38. Yang, L.; Zhang, Y.; Kang, S.; Wang, Z.; Wu, C. Microplastics in freshwater sediment: A review on methods, occurrence, and sources. Sci. Total Environ. 2021, 754, 141948. [Google Scholar] [CrossRef] [PubMed]
  39. Bellasi, A.; Binda, G.; Pozzi, A.; Galafassi, S.; Volta, P.; Bettinetti, R. Microplastic contamination in freshwater environments: A review, focusing on interactions with sediments and benthic organisms. Environments 2020, 7, 30. [Google Scholar] [CrossRef] [Green Version]
  40. Alam, F.C.; Sembiring, E.; Muntalif, B.S.; Suendo, V. Microplastic distribution in surface water and sediment river around slum and industrial area (case study: Ciwalengke River, Majalaya district, Indonesia). Chemosphere 2019, 224, 637–645. [Google Scholar] [CrossRef] [PubMed]
  41. Nel, H.A.; Dalu, T.; Wasserman, R.J. Sinks and sources: Assessing microplastic abundance in river sediment and deposit feeders in an Austral temperate urban river system. Sci. Total Environ. 2018, 612, 950–956. [Google Scholar] [CrossRef] [PubMed]
  42. Wang, Z.; Su, B.; Xu, X.; Dia, D.; Huang, H.; Mei, K.; Dahlgren, R.A.; Zhang, M.; Shang, X. Preferential accumulation of small (<300 µm) microplastics in the sediments of a coastal plain river network in eastern China. Water Res. 2018, 144, 393–401. [Google Scholar] [CrossRef]
  43. Allen, S.; Allen, D.; Phoenix, V.R.; Le Roux, G.; Jiménez, P.D.; Simonneau, A.; Binet, S.; Galop, D. Atmospheric transport and deposition of microplastics in a remote mountain catchment. Nat. Geosci. 2019, 12, 339. [Google Scholar] [CrossRef]
  44. Bergmann, M.; Mutzel, S.; Primpke, S.; Tekman, M.B.; Trachsel, J.; Gerdts, G. White and wonderful? Microplastics prevail in snow from the Alps to the Arctic. Sci. Adv. 2019, 5, eaax1157. [Google Scholar] [CrossRef] [Green Version]
  45. Brahney, J.; Hallerud, M.; Heim, E.; Hahnenberger, M.; Sukumaran, S. Plastic rain in protected areas of the United States. Science 2020, 368, 1257–1260. [Google Scholar] [CrossRef]
  46. Free, C.M.; Jensen, O.P.; Mason, S.A.; Eriksen, M.; Williamson, N.; Boldgiv, B. High-levels of microplastic pollution in a large, remote, mountain lake. Mar. Pollut. Bull. 2014, 85, 156–163. [Google Scholar] [CrossRef] [PubMed]
  47. Jiang, C.; Yin, L.; Li, Z.; Wen, X.; Luo, X.; Hu, S.; Yang, H.; Long, Y.; Deng, B.; Huang, L.; et al. Microplastic pollution in the rivers of the Tibet Plateau. Environ. Pollut. 2019, 249, 91–98. [Google Scholar] [CrossRef] [PubMed]
  48. Siegfried, M.; Koelmans, A.A.; Besseling, E.; Kroeze, C. Export of microplastics from land to sea. A modelling approach. Water Res. 2017, 127, 249–257. [Google Scholar] [CrossRef]
  49. Murphy, F.; Ewins, C.; Carbonnier, F.; Quinn, B. Wastewater treatment works (WwTW) as a source of microplastics in the aquatic environment. Environ. Sci. Technol. 2016, 50, 5800–5808. [Google Scholar] [CrossRef] [PubMed] [Green Version]
  50. Ziajahromi, S.; Neale, P.A.; Leusch, F.D.L. Wastewater treatment plant effluent as a source of microplastics: Review of the fate, chemical interactions and potential risks to aquatic organisms. Water Sci. Technol. 2016, 74, 2253–2269. [Google Scholar] [CrossRef] [PubMed]
  51. Lahens, L.; Strady, E.; Kieu-le, T.; Dris, R.; Boukerma, K.; Rinnert, E.; Gasperi, J.; Tassin, B. Macroplastic and microplastic contamination assessment of a tropical river (Saigon River, Vietnam) transversed by a developing megacity. Environ. Pollut. 2018, 236, 661–671. [Google Scholar] [CrossRef] [PubMed] [Green Version]
  52. Klein, S.; Worch, E.; Knepper, T.P. Occurrence and spatial distribution of microplastics in river shore sediments of the Rhine-Main Area in Germany. Environ. Sci. Technol. 2015, 49, 6070–6607. [Google Scholar] [CrossRef]
  53. Boyle, K.; Örmeci, B. Microplastics and nanoplastics in the freshwater and terrestrial environment: A review. Water 2020, 12, 2633. [Google Scholar] [CrossRef]
  54. Tanentzap, A.J.; Cottingham, S.; Fonvielle, J.; Riley, I.; Walker, L.M.; Woodman, S.G.; Kontou, D.; Pichler, C.M.; Reisner, E.; Lebreton, L. Microplastics and anthropogenic fibre concentrations in lakes reflect surrounding land use. PLoS Biol. 2021, 19, e3001389. [Google Scholar] [CrossRef] [PubMed]
  55. Corcoran, P.L.; Norris, T.; Ceccanese, T.; Walzak, M.J.; Helm, P.A.; Marvind, C.H. Hidden plastics of Lake Ontario, Canada and their potential preservation in the sediment record. Environ. Pollut. 2015, 204, 17–25. [Google Scholar] [CrossRef] [PubMed]
  56. Boucher, J.; Friot, D. Primary Microplastics in the Oceans: A Global Evaluation of Sources; IUCN: Gland, Switzerland, 2017; p. 43. [Google Scholar] [CrossRef]
  57. van der Wal, M.; Van Der Meulen, M.; Tweehuijsen, G.; Peterlin, M.; Palatinus, A.; Kovač Viršek, M.; Coscia, L.; Kržan, A. Identification and Assessment of Riverine Input of (Marine) Litter; European Commission: Bruxelles, Belgium, 2015; p. 186. [Google Scholar]
Figure 1. Siberian Rivers and sampling locations on the Nizhnyaya Tunguska and Yenisei (shown by red circles). Map source: Wiertz S., 2020, College of DuPage, from https://cod.pressbooks.pub/ (accessed on 15 October 2021), under a CC Attribution 4.0 International License.
Water 13 03248 g001
Figure 2. MP shape composition (%) (a) and sizes (b) in the surface water for each sampling site.
Water 13 03248 g002
Figure 3. MP shape composition (%) (a) and sizes (b) in bottom sediments for each sampling site.
Water 13 03248 g003
Figure 4. Percent composition of MP colors in the surface water (a) and bottom sediments (b) for each sampling site.
Water 13 03248 g004
Table 1. Location of the sampling sites.
Sampling SitesER-1ER-2TU-1TU-2TU-3
River and locationN. Tunguska, upstream Erbogachen settelmentN. Tunguska, downstream Erbogachen settelmentYenisei, upstream the confluence of the N. TunhuskaYenisei, downstream the confluence of the N. TunhuskaN. Tunguska, upstream Turukhansk settelment
Geographical coordinates61°16′02.0″ N
107°59′43.3″ E
61°17′00.1″ N
108°00′45.1″ E
65°43′25.9″ N
88°04′18.8″ E
65°47′22.3″ N
87°53′46.0″ E
65°48′00.9″ N
88°01′35.7″ E
Table 2. Abundance of MPs and physico-chemical characteristics of the water and bottom sediments.
ER-1ER-2TU-1TU-2TU-3
MPs in water 1, items/m32.01 ± 0.521.20 ± 0.703.01 ± 0.912.89 ± 0.514.53 ± 2.04
MPs in sediments 1, items/kg543 ± 94.1235 ± 83.0353 ± 47.0353 ± 237489 ± 367
T, °C23.825.517.716.815.1
pH7.937.877.967.657.55
Eh, mV+167+186+171+176+164
LOI in sediments 1, %3.43 ± 1.840.62 ± 0.101.59 ± 0.311.81 ± 0.362.19 ± 0.89
Note: 1 Arithmetic mean ± standard deviation.
Table 3. Differences in MP concentrations in riverine water and bottom sediments between sites.
Water (a)ER-1ER-2TU-1TU-2TU-3
ER-1 0.05
ER-2 0.050.050.05
TU-10.05
TU-20.050.05
TU-30.05
Sediments (b)ER-1ER-2TU-1TU-2TU-3
ER-1 0.050.05
ER-20.05
TU-10.05
TU-2
TU-3
Note: 0.05: Significant difference (p < 0.05); –: no significant difference.
Publisher’s Note: MDPI stays neutral with regard to jurisdictional claims in published maps and institutional affiliations.

