Article

Effects of Stepwise Adjustment of C/N during the Start-Up of Submerged Membrane Bioreactors (SMBRs) on the Aerobic Denitrification of Wastewater

School of Life and Environmental Sciences, Hangzhou Normal University, Hangzhou 311121, China
*
Author to whom correspondence should be addressed.
Water 2021, 13(22), 3251; https://doi.org/10.3390/w13223251
Submission received: 25 October 2021 / Revised: 14 November 2021 / Accepted: 15 November 2021 / Published: 17 November 2021
(This article belongs to the Special Issue Nanotechnology-Enabled Water Technologies for a Sustainable Future)

Abstract

:
Based on the improved high-efficiency sewage treatment performance of submerged membrane bioreactors (SMBRs), we focused on how to adjust the C/N ratio of the influent water during reactor start-up to prevent an excessive C/N ratio from causing membrane fouling. In this study, an experimental method of gradually adjusting the influent C/N ratio to quickly start the reactor was proposed, and the results showed that biofilm formation in R1 (SMBR, three influent C/N ratios of 5, 10, and 20) was approximately completed in 32 days, shorter than that (40 days) required in R2 (SMBR, influent C/N ratio of 20). Higher removal efficiencies of 76.4% for TN, 70.1% for COD, and 79.2% for NH3-N were obtained in R1 than in R2. The high-throughput sequencing results indicated that after 150 days of operation, the Shannon index of bacteria in R1 increased from 2.97 to 4.41 and the growth of Nakamurella, Ferruginibacter, and Rhodanobacter was promoted in the reactor, which indicated substantial microbial diversity in the biofilm. Therefore, gradually adjusting the influent C/N ratio could effectively enhance the nitrogen removal performance of denitrification microbial communities in SMBRs. This study offers a reliable approach for starting the SMBR-enhanced biological nutrient removal process in wastewater treatment plants by gradually adjusting the influent C/N ratio.

1. Introduction

Highlights:
  • Using influent with different C/N ratios of 5, 10, and 20 in three phases can shorten the time of biofilm formation in SMBRs.
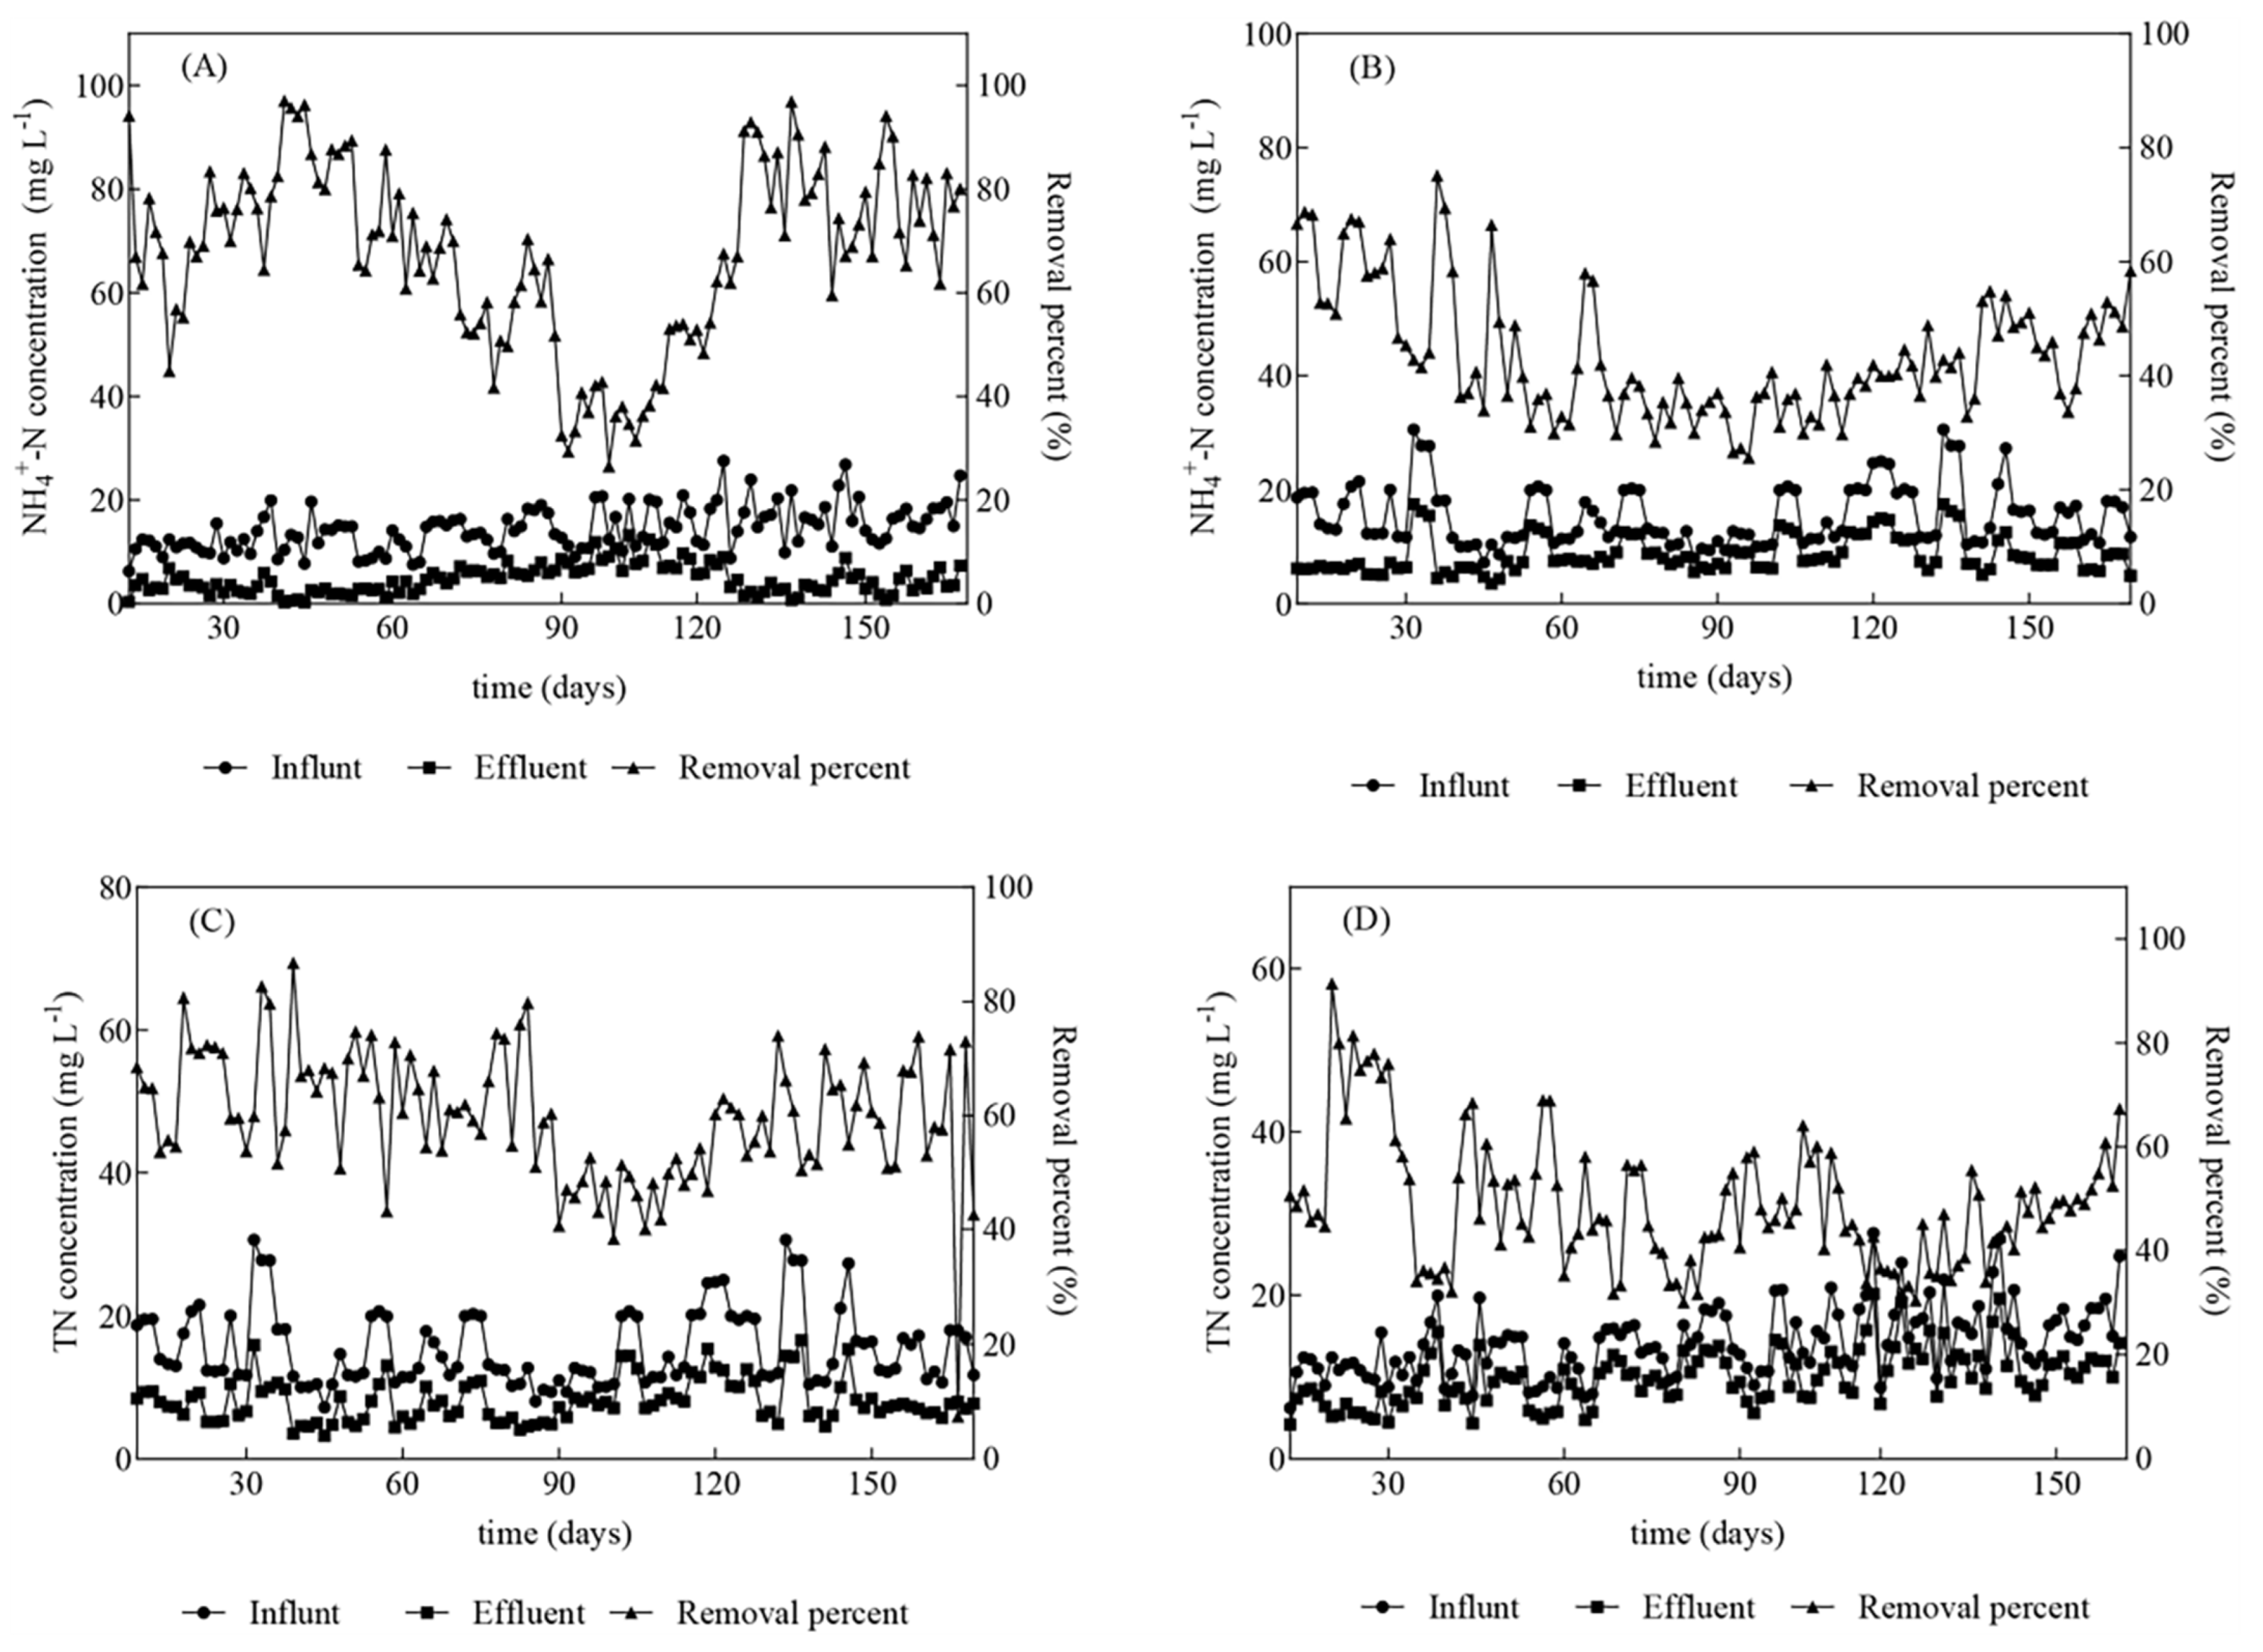
  • The SMBR exhibited excellent denitrification capacity, as the average removal percentage of TN reached 76.4%.
  • The stepwise feed adjustment process promoted the growth of Nakamurella, Ferruginibacter, and Rhodanobacter in the reactor.
Biological technologies are currently the most common methods used for nitrogen treatment of municipal wastewater because of their convenient separation of sludge-liquid and highly efficient removal of organic micropollutants [1]. Membrane bioreactors (MBRs) are widely used biofilm processes that have recently it has attracted widespread attention because they are easy to operate, require little space and offer energy and cost savings [2,3]. Improved submerged membrane bioreactors (SMBRs) have the advantages of high biomass, rich biodiversity, and little sludge expansion. In recent years, adding highly efficient functional microorganisms to SMBRs has been used as an efficient way to improve denitrification. Aerobic denitrification is a frequent biological nitrogen removal technology in recent years [4], and it has been far and wide investigated as a vicissitudinary to classical denitrification due to its unique advantages such as its advantages of simultaneous nitrification and denitrification.
In recent years, many researchers have successfully used aerobic denitrifying bacteria to strengthen bioreactor performance [5]. For example, Feng et al. [6] used biofilms in biodegradable carriers to enhance solid-phase denitrification systems to treat actual river water, and Li et al. [7] used Pseudomonas sp. to enhance a biofilm system for treating synthetic wastewater. Furthermore, the use of aerobic denitrifying bacteria also has the advantages of improving reaction efficiency and reducing investment and operating costs [8,9]. Further studies are needed to determine the inherent factors associated with MBRs, such as the dissolved oxygen concentration [10], carbon-to-nitrogen (COD/TN) ratio, and temperature [11], that promote the performance of aerobic denitrifying bacteria.
At present, urban sewage generally has insufficient carbon sources, but when the traditional activated sludge process is used for treatment, a low C/N ratio leads to an unsteady microbial state with limited substances for the communities [12], and the lack of carbon sources can have a detrimental impact on the denitrification process [13]. If the water is discharged, there is a potential risk of eutrophication. To solve the problem of a low C/N ratio in feedwater, a carbon source is added to improve the C/N ratio in some MBR wastewater treatment plants, which has impacts on membrane fouling. The low C/N ratio needed for efficient nitrogen removal in sewage has become a problem in today’s water treatment technology. The formation of biofilms and the time required for biofilm formation play important roles in the performance of MBR because they are the basis for a successful start-up of the reactors [14].
In the biological denitrification process of sewage, the organic carbon source plays a very important role as an electron acceptor for heterotrophic aerobic bacteria and denitrification process. It is a material and energy source necessary for bacterial metabolism and is a prerequisite for an effective denitrification reaction to proceed. The C/N ratio has been proven to be one of the important factors involved in the formation of biofilms [15]. Ge et al. [16] investigated the effects of influent distribution of nutrient substance, and the results indicated that the capability of nitrogen removal had a positive correlation with influent C/N. The SND pilot study by Zhao et al. [17] in a two-stage intermittent aeration complete mixing reactor (IACM) showed that adding acetic acid and methanol can significantly enhance nitrification and denitrification. Ding et al. [18] investigated the effect of water TC/N addition ratio on the denitrification effect, showing that when the influent C/N = 10:1, the system has the best denitrification effect. Klangduen et al. [19] suggest that the denitrification process can be satisfied when C/N-5-20. The addition of soluble organic matter can effectively improve the efficiency of simultaneous nitrification and denitrification.
Most of the previous studies focused on nitrogen removal performance, and limited studies have considered the impact of both the time of reactor start-up and membrane fouling with adjusted influent C/N ratios. Therefore, the main purpose of this study was to evaluate the effect of adjusting the C/N ratio of SMBRs during the start-up time on its denitrification performance. High-throughput sequencing was utilized to investigate the characteristics of the bacterial structures and to evaluate the difference of the denitrification microbial community characteristics between the SMBRs started in different ways. In brief, this work provides a theoretical reference for the application of an increased C/N ratio in stages during MBR start-up to treat wastewater more efficiently.

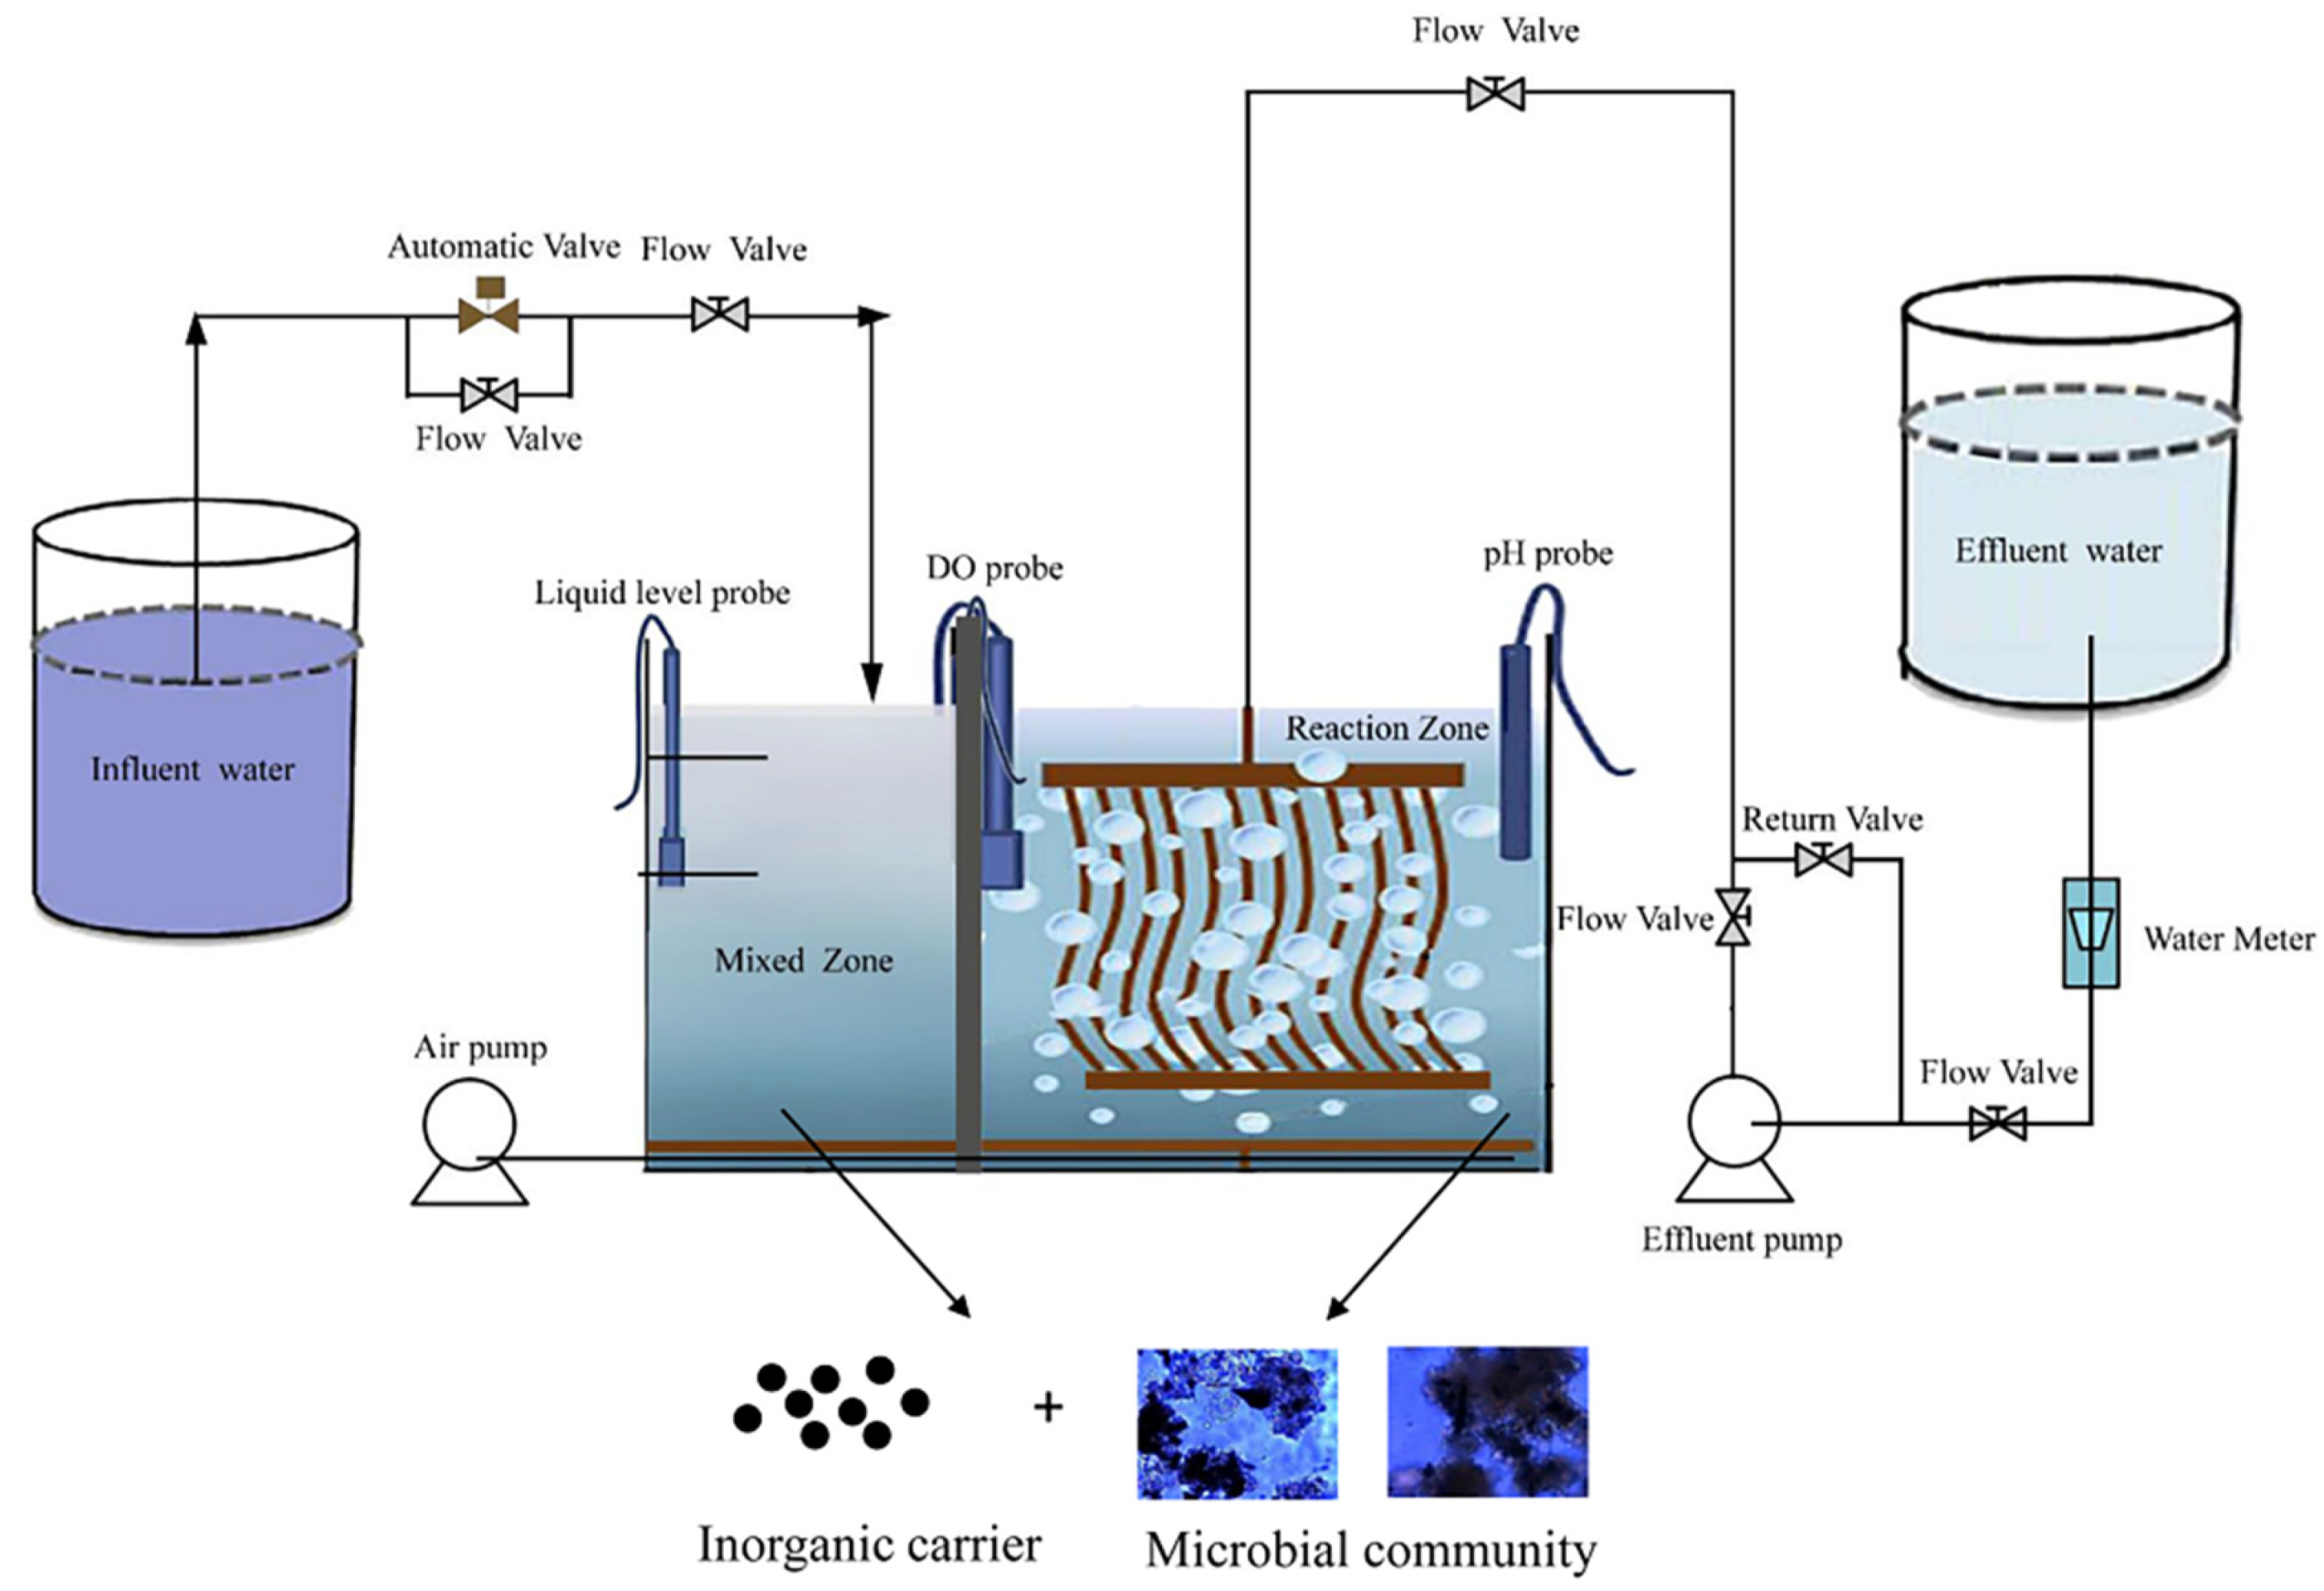
2. Materials and Methods

2.1. SMBR Start-Up Strategy

The SMBR device used in this experiment was a continuous-flow biofilm reactor patented by our research group. The configuration of the SMBR is illustrated in Figure 1. The reaction volume was 100 L (60 × 140 × 70 cm), installed with five hollow-fiber membrane modules composed of polyethylene. The mean pore size of the hollow-fiber membranes was less than 0.1 μm. An aeration system (aeration rate of 0.2 m3 h−1) was setted at the bottom of the reactor.
The experiments were performed in two SMBRs for more than 150 days in order to study the effect of different COD/N ratios on the start-up time. The influent concentrations of NH3-N were 15 mg L−1, and the C/N ratio of the influent water was adjusted by changing the COD concentration. In reactor R1, the whole operation lasted 150 days and was evenly divided into three phases according to the COD/N ratio COD/N = 5 (phase I, 1–30 days), COD/N = 10 (phase II, 31–75 days), and COD/N = 20 (phase III, 76–150 days), Reactor R2 was directly started with wastewater with C/N = 20. (The COD mentioned here and below all represent COD(B): the biodegradable part of the Chemical Oxygen Demand, and they were abbreviated as “C” in C/N ratio.)
During the study, the suction mode comprised an 8 min “start” period and 2 min “stop” period. As the dissolved oxygen (DO) and temperature are two of the key factors affecting the denitrification effect, therefore during the experiment, the DO and temperature concentration was detected at each sampling time during the operation. The hydraulic residence time (HRT) of the SMBR was maintained at 1 h.

2.2. Seed Microbial Community

Following the previous operation of our research group [20], the main denitrifying microbial community was activated under the temperature of 25 ± 2 °C to ensure that the microbial community can be stably maintained in the SMBRs and then was added into the reactors.

2.3. Synthetic Wastewater

The NH4+-N, TN and COD of the synthetic wastewater were provided by C6H12O6, CH4N2O and KH2PO4, respectively. No NO2-N or NO3-N was added to the synthetic wastewater. Additionally, trace elements were added to the influent, the specific ingredients and content are shown in the Supplementary Materials. The measurement method of the MLSS (Mixed Liquor Suspended Solids) and MLVSS (Mixed Liquor Volatile Suspended Solids) of the seed sludge were referenced by Zhang et al. [21] as being 10.5–11.3 g L−1 and 5.3–5.8 g L−1, respectively.

2.4. Chemical Analysis

The NH3-N (4500-NH3, 4–119, F: Phenate Method), NO2-N (4500-NO2, 4–124, B: Colorimetric Method), NO3-N (4500-NO3-, 4–127, B. Ultraviolet Spectrophotometric), TN (4500-Norg NITROGEN (ORGANIC), 4–139, B: Macro-Kjeldahl Method), and COD (5220-Chemical Oxygen Demand, 5–20, C: Closed Reflux, Titrimetric Method) concentrations in the water samples were determined by standard methods [22]. A fluorescence spectrophotometer (LS-55, Perkin-Elmer Co., Waltham, MA, USA) was used to acquire the Excitation–emission matrix (EEM).
Thermal extraction [23] was used to extract the extracellular polymeric substances (EPS). The culture broth was centrifuged at 9000 rpm, 4 °C for 20 min to obtain supernatant (containing slime EPS, termed as S-EPS). The biomass pellet was resuspended in deionized water equal to the initial volume and then heated at 60 °C for 20 min to extract capsular EPS (C-EPS). The enthrone method was used as the determination of polysaccharides, and the protein content were extracted by the modified Lowry method. The output of EPS is expressed as the sum of protein and polysaccharide, and the unit is mg·g−1 (calculated as VSS). The experimental results are all the average of 3 parallel experiments.

2.5. Microbial Community Structure Analysis

The microbial sample was collected from the suspended sludge in the SMBRs in the end of each phase. According to Zhang et al. [24], the microbial DNA was extracted by Personal Bio Company, and they also analyzed the microbial communities. High-throughput sequencing of 16S rRNA genes was performed for microbial community analysis as previously reported. We amplified the V3-V4 region of the bacterial 16S ribosomal RNA gene in polymerase chain reaction (PCR) by the bacterial primers 338F and 806R. Library construction and sequencing of amplicons for different samples were performed by Major Biopharm Technology (Shanghai, China). QIIME2 software was used to analyze the sequencing results, including quality filtration and taxonomic classification. A value of 97% was selected as the threshold for defining the operational taxonomic units (OTUs). The sequences were deposited in National Center for Biotechnology Information (NCBI) Sequence Read Archive (SRA) under accession number SRR14662507. All the data were analyzed on the free online platform of https://www.genescloud.cn (accessed on 30 December 2019).

3. Results

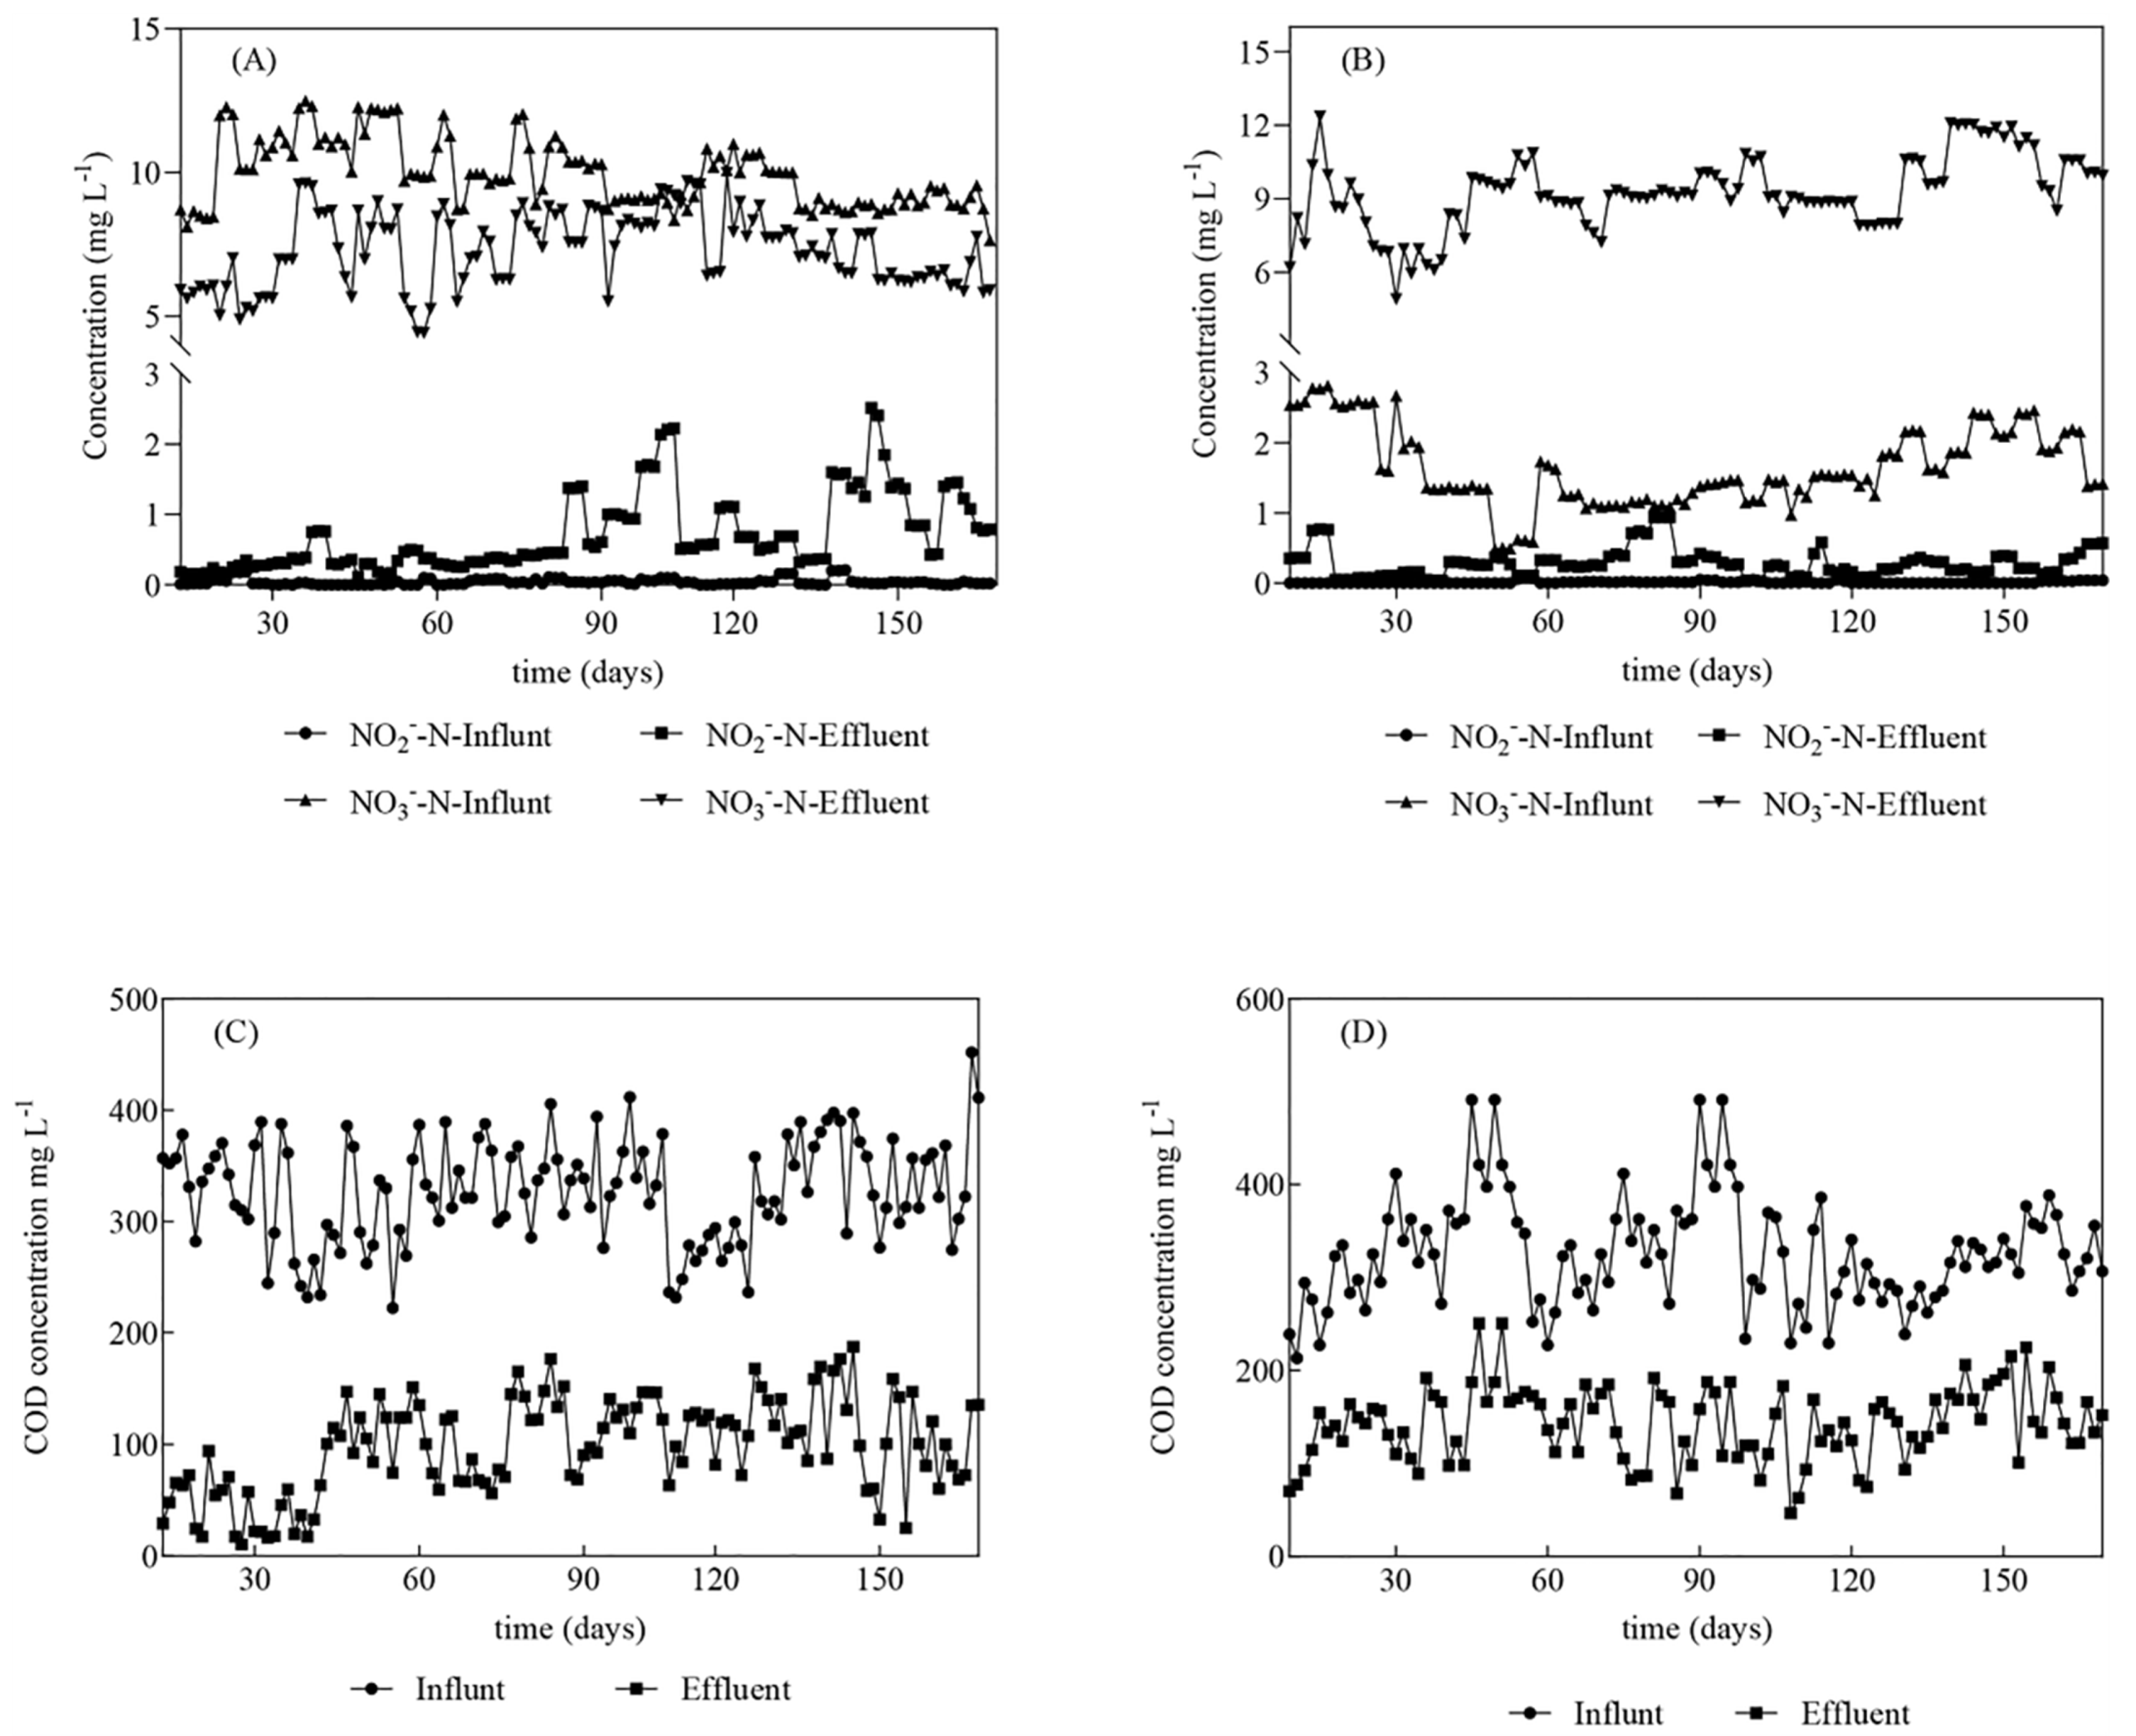
3.1. Water Quality under Different SMBR Reactor Effluent Conditions

The two SMBRs were operated to investigate the nitrogen removal capacity for 150 days. As shown in Figure 2A,B, in phase I, the average removal percentage of NH3-N was 69.3% in R1 and 59.3% in R2. In phase II, there were some differences between the two reactors regarding their average NH3-N removal performance. The average removal percentage of NH3-N in R1 remained almost stable at 79.2%, while in R2 the average NH3-N removal percentage gradually decreased to 43.2%. In the final phase, the average NH3-N removal percentage in R1 recovered from 26.5% to 71.1% after 45 days, while the average NH3-N removal percentage in R1 recovered from 28.4% to 43.6%.
The removal percentage of TN in R1 and R2 changed with biofilm status. The average TN removal efficiency in R1 showed a more rapid increase than that in R2 (Figure 2C,D). In phase I, the average TN removal efficiencies of R1 and R2 reached 69.3% and 59.3%, respectively. After 75 days, the TN removal efficiency of R1 remained practically stable at 75.9, while the TN removal ratio in R2 gradually decreased to 48.6%. The removal ratios of TN in R1 and R2 significantly decreased. The average TN removal percentage in R1 recovered from 29.3% to 76.4%, and the average TN removal percentage in R1 recovered from 28.4% to 45.1%.
To further analyze the nitrogen removal characteristics under each C/N ratio, the changes in NO3-N and NO2-N over the course of each operation phase were determined and are shown in Figure 3A,B. The process performance was summarized as a single table (Table 1). In phase I, compared with the influent value, in R1, the NO2-N remained at low levels, and the NO3-N content in the effluent was reduced by 21.3%. Rather, in R2, the NO2-N and the NO3-N concentration gradually increased. In phase II, the NO2-N concentration in R1 tended to increase slightly, but finally grew to a relatively low level of 1 mg L−1 in phase III. In the meantime, the effluent NO3-N content continuously decreased. In R2, the NO2-N concentration continued to keep rising until remained at around 0.64 mg L−1, and the NO3-N concentration also increased sharply.
In the two reactors, the COD removal ratios did not show a significant difference (Figure 3C,D). With the gradually development of biofilms, the COD removal ratios in the two reactors stabilized at approximately 70.01% and 55.6%, respectively.

3.2. Adhesion Ability of Carriers with Different C/N Ratios

In phase I (R1: C/N = 5, R2: C/N = 20), as shown in Figure 4A, the EPS content was maintained at a high level. The average loosely bound EPS (LB-EPS) and tightly bound EPS (TB-EPS) contents in R1 were 60.33 mg g−1 VSS and 611.78 mg g−1 VSS, respectively, which were higher than those in R2 (50.78 mg g−1 VSS and 308.56 mg g−1 VSS).
In phase II (R1: C/N = 10, R2: C/N = 20), the average LB-EPS and TB-EPS contents of the two reactors decreased, and greater accumulation was observed in R1 (47.22 mg g−1 VSS and 414.67 mg g−1 VSS) than in R2 (25.44 mg g−1 VSS and 153.78 mg g−1 VSS).
In phase III (R1: C/N = 20, R2: C/N = 20), the average LB-EPS and TB-EPS contents of both reactors decreased, and greater accumulation was observed in R1 (42.67 mg g−1 VSS and 214.89 mg g−1 VSS) than in R2 (19.04 mg g−1 VSS and 85.11 mg g−1 VSS).

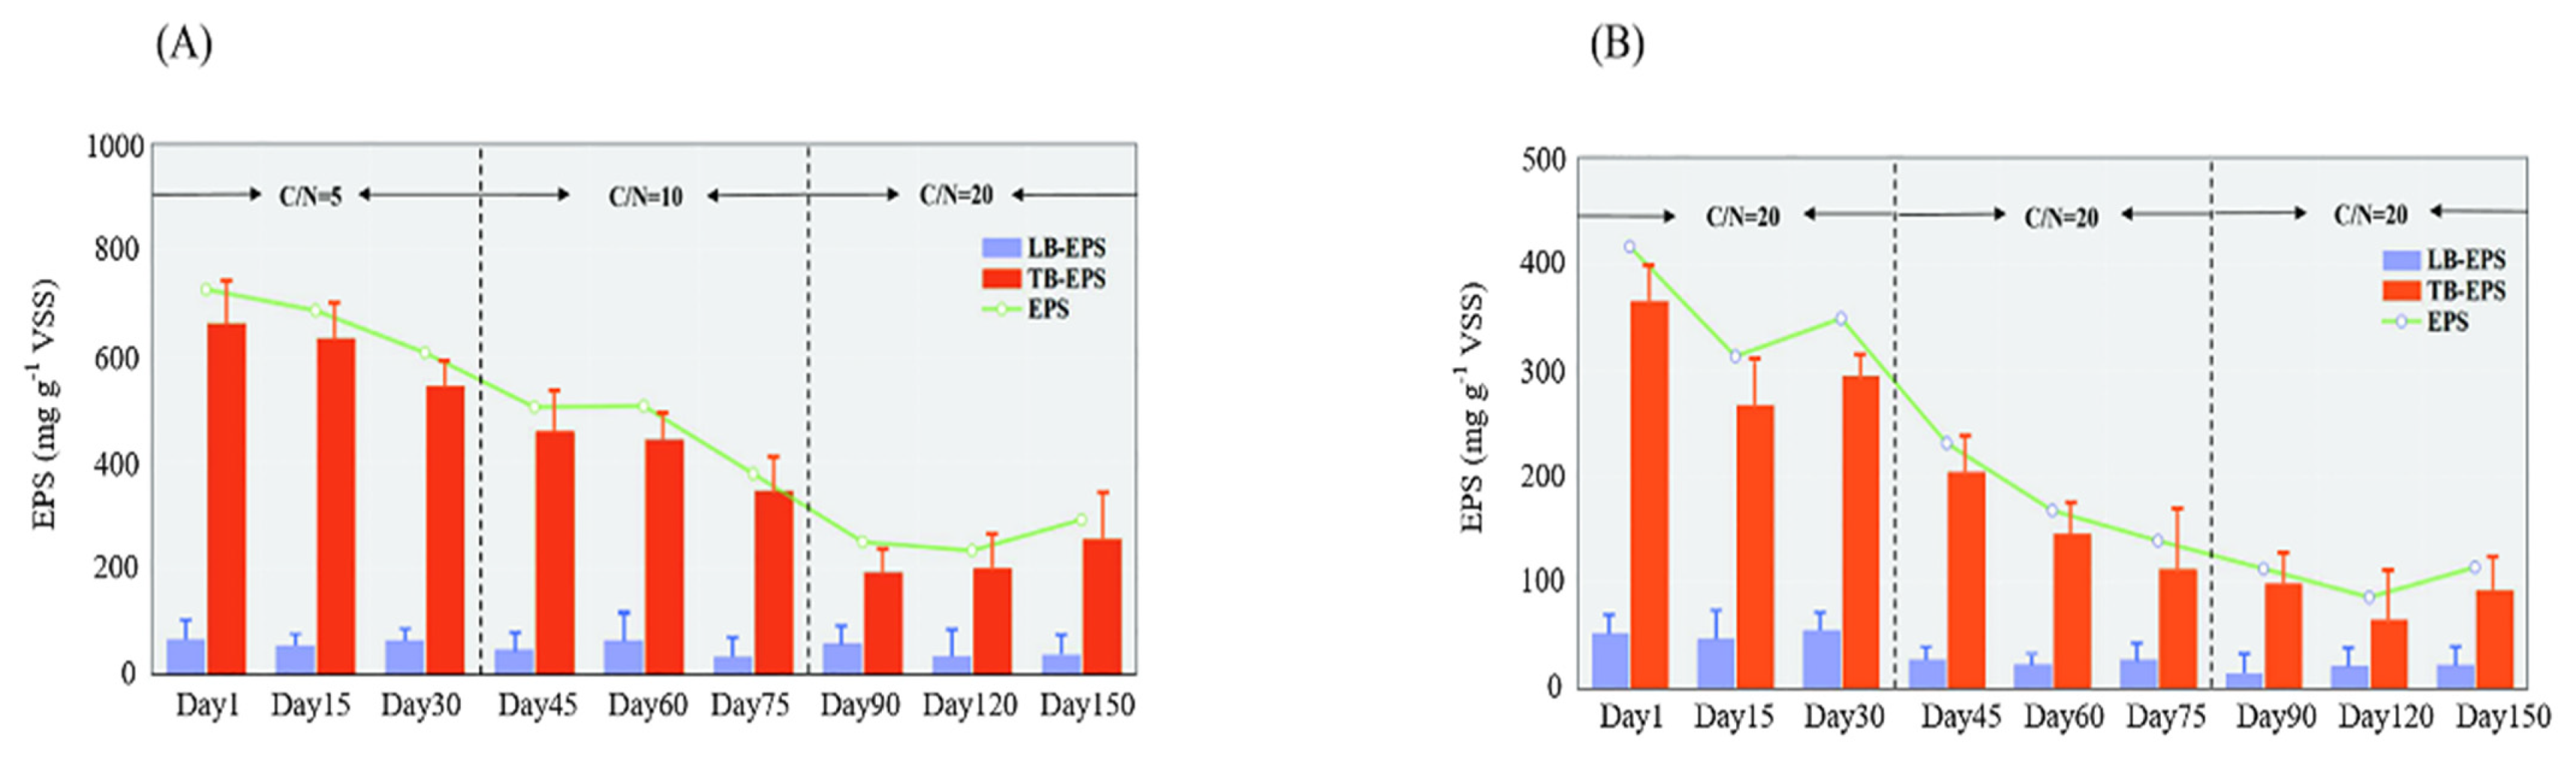
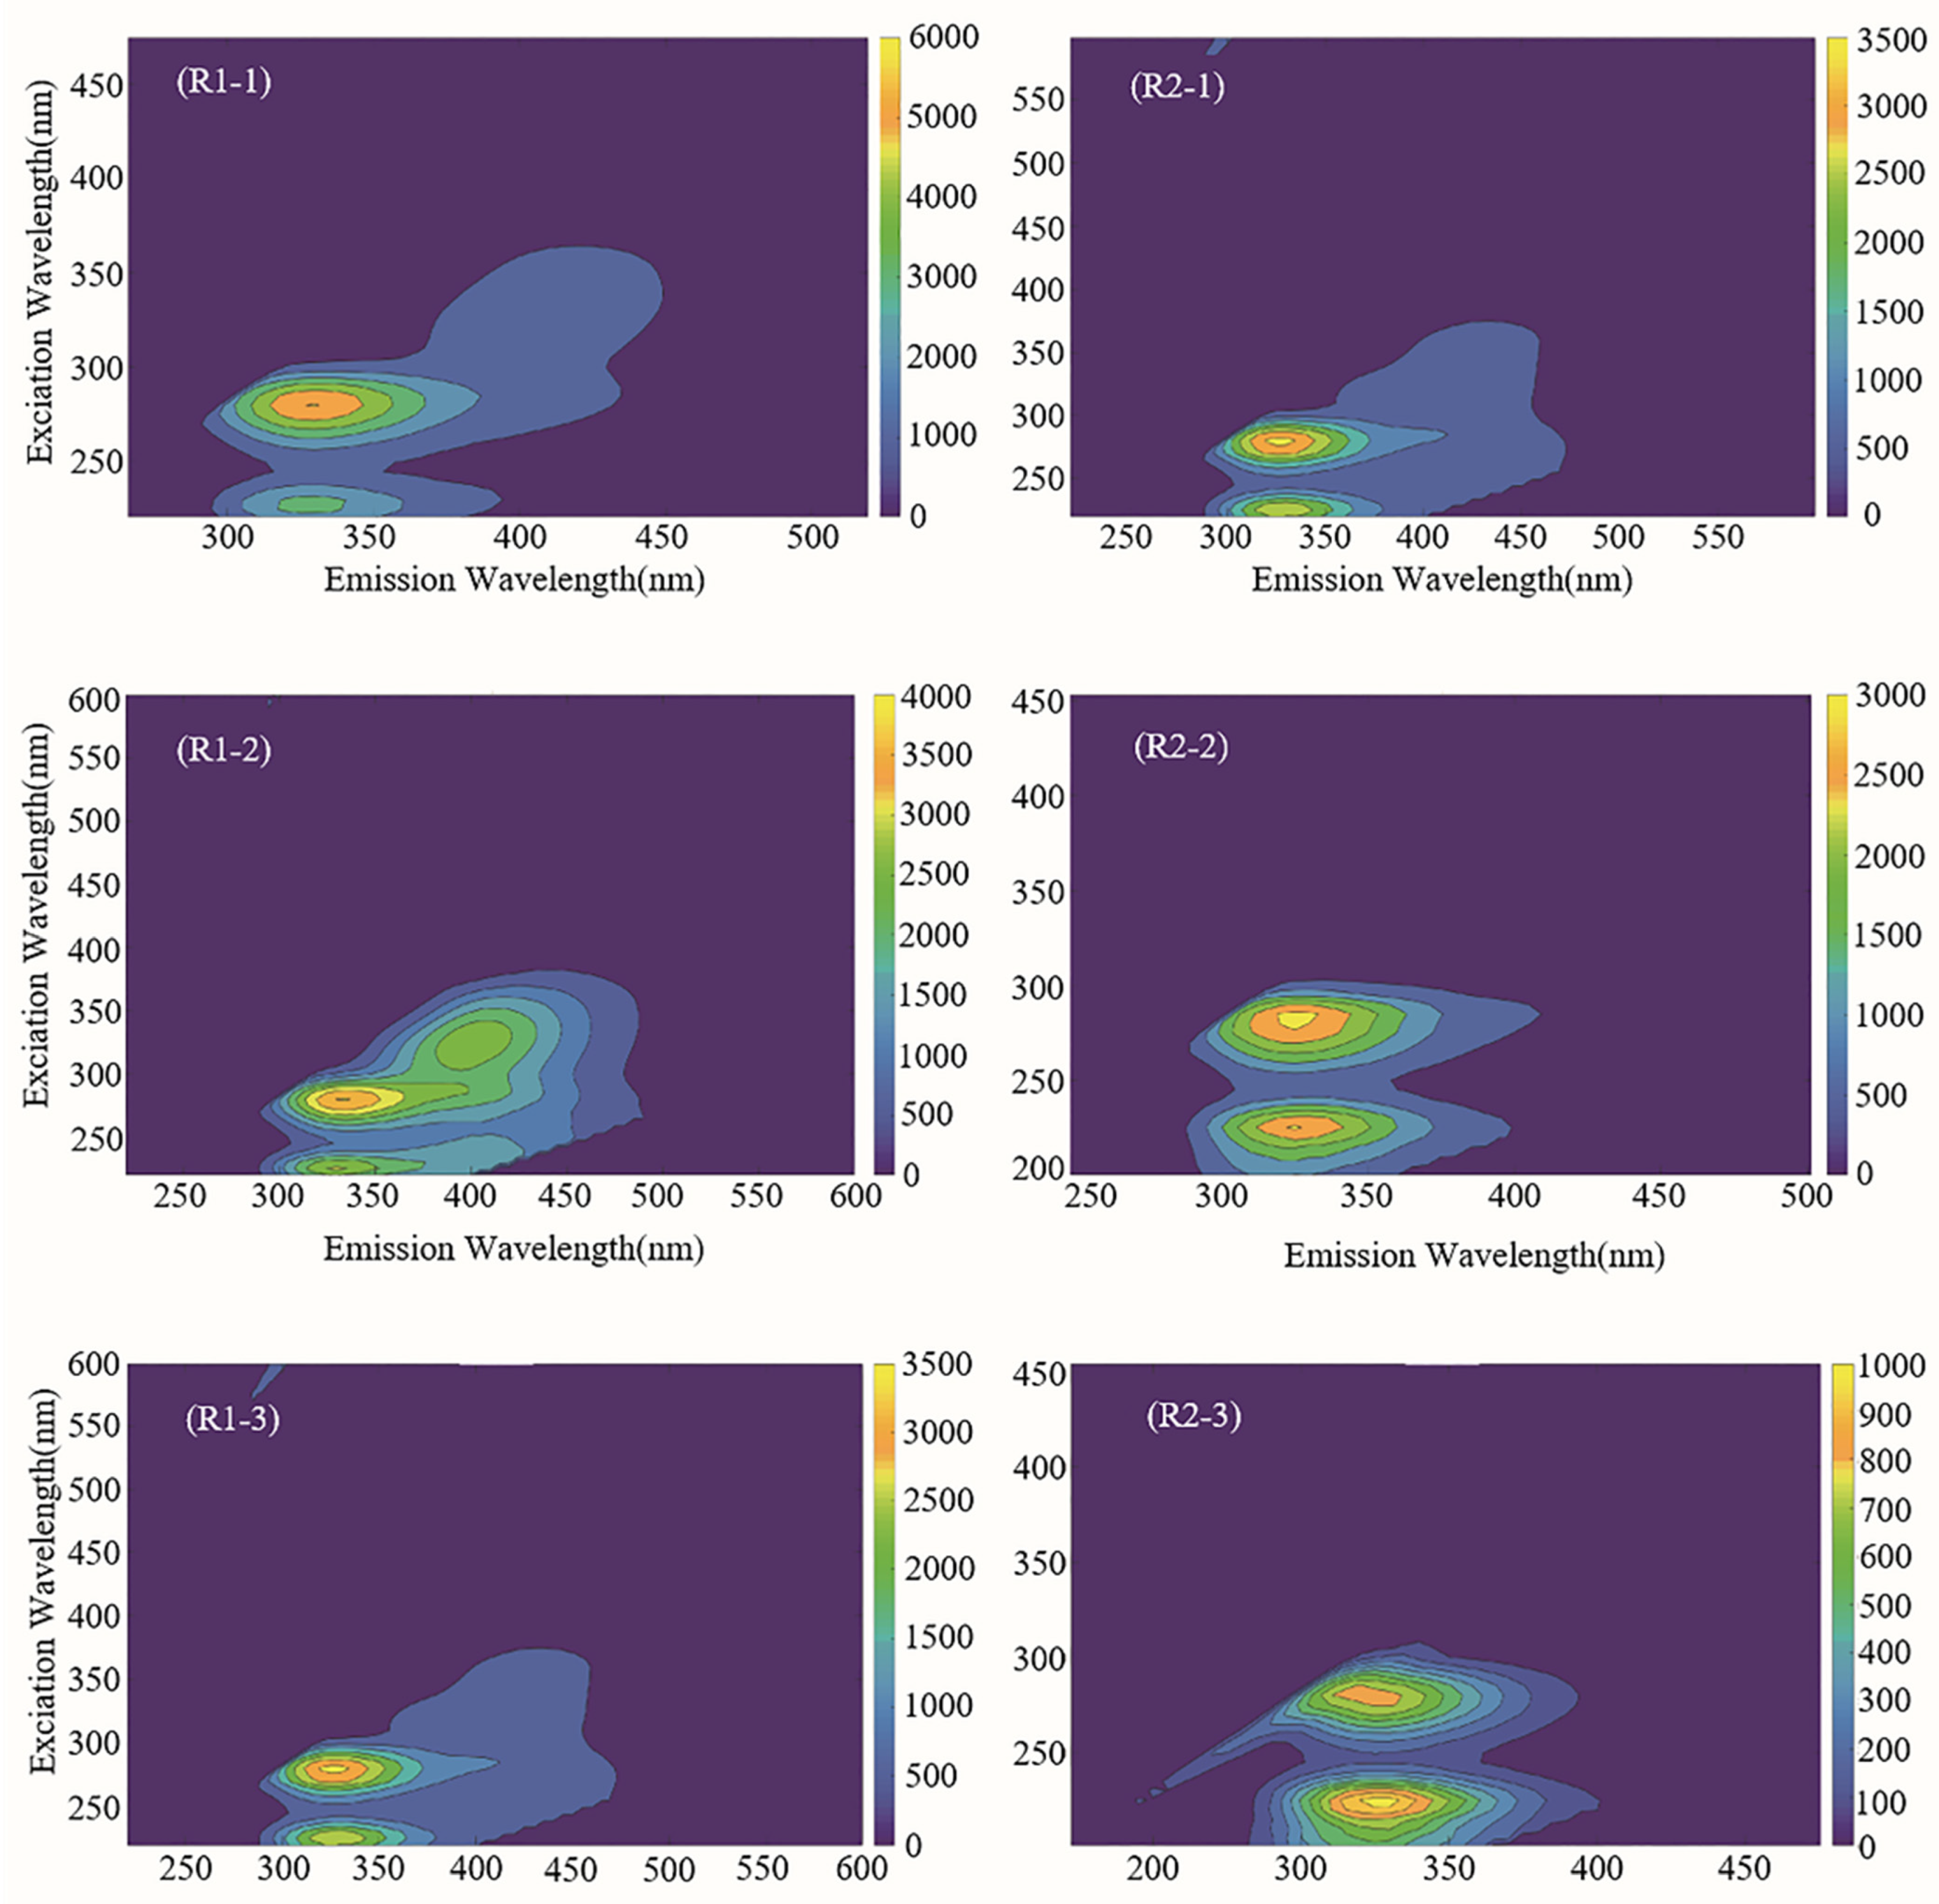
3.3. EEM Fluorescence Spectral Analysis

As shown in Figure 5, in the EEM spectra, the sample from three phases of the two reactors excited two peaks that can be clearly identified. Compared with the results in some researches (Chen et al., 2003), it can be determined that the first peak represents aromatic proteins (which Ex/Em was 220–250 nm (Ex)/330–360 nm (Em)) and the other peak represents tryptophan-like proteins (which Ex/Em was 250–300 nm (Ex)/330–360 nm (Em)). These fluorescent compounds consist of two parts: one part from the remaining soluble microbial product (SMP) fractions from the last reaction cycle, and one part from the new reaction cycle. The underlying mechanism needs further discussion.

3.4. Microbial Community Analysis

3.4.1. Bacterial α-Diversity Analysis

The α-diversity indices, such as Chao1, Shannon, Simpson, and ACE, were evaluated first. The data shown in Table 2 compared the α-diversity of microbial samples from the three phases in two reactors. With the operation time of the SMBR increasing, the Shannon, Chao1, and ACE index of R1 increased from 2.97, 394.85, and 404.72 to 4.41, 680.27, and 693.42, respectively. Correspondingly, in R2, they gradually increased from 2.62, 346.80, and 327.26 to 3.91, 585.48, and 570.29, respectively. At the end of the experiment, the diversity and richness of the microbial community were highest in R1.
The microbial community structures of the two reactors were divided into different clusters (in R1, the microbial community structures were divided as R1-1/-2/-3, and in R2, same as R2-1/-2/-3). The data shown in Figure S1 are the result of a principal component analysis (PCA) of 18 samples. In R1, components 1 and 2 contributed the ratio of 31.81% and 25.64% to sample variation, and in R2, the rates were 29.81% and 19.61%, respectively.

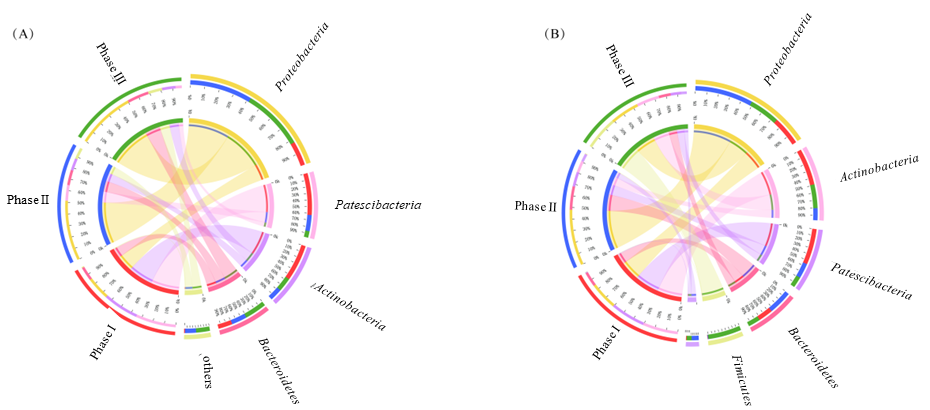
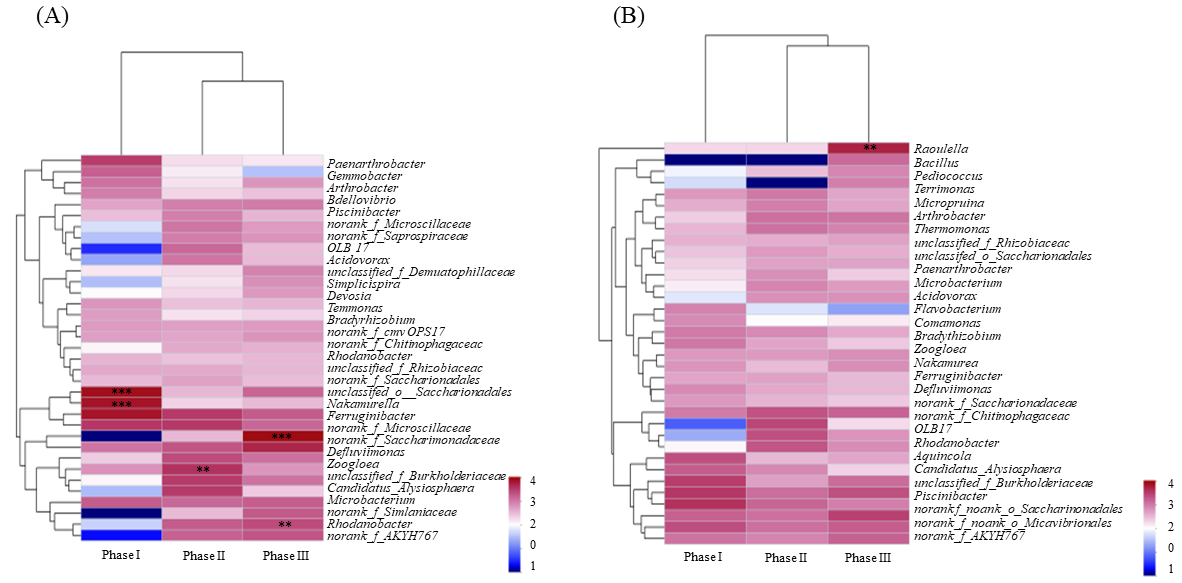
3.4.2. Composition of the Bacterial Community

As shown in Figure 6, there exist excited differences of the relative abundances of the dominant communities between the two reactors. At the phylum level, the mainly microbial community in R1 and R2 included Proteobacteria, Bacteroidetes, Firmicutes, Actinobacteria, and Patescibacteria. Compared the results of the three phases, in R1, Proteobacteria was the dominant phylum with an average relative abundance of 41.38%. However, in R2, the average relative abundance of Proteobacteria was 33.03%. The average relative abundances of Actinobacteria, Patescibacteria, Bacteroidetes, and Firmicutes in both reactors were 20.54%, 17.56%, 14.58%, and 10.87% and 17.82%, 18.27, 14.80%, and 0%, respectively.
At the genus level (Figure 6), in phase I, Nakamurella and Ferruginibacter were the predominant genera, and their average relative abundances were 15.21% (R1) and 14.36% (R2) and 7.82% (R1) and 7.45% (R2), respectively.
In phase II, the predominant genera in R1 were Saccharimonadales and Rhodanobacter, and their relative abundances were 9.89% and 4.71%, respectively. In R2, the dominant bacterial genus was AKYH767, followed by Rhodanobacter. In phase III, the predominant genera in R1 were Zoogloea (4.29%), Ferruginibacter (4.78%), Nakamurella (6.75%), and Candidatus Alysiosphaera (6.80%). The relative abundance of Zoogloea both increased, the data hoisted from 1.11% to 7.81% in R1, in R2 it also increased from 2.74% to 4.29%.

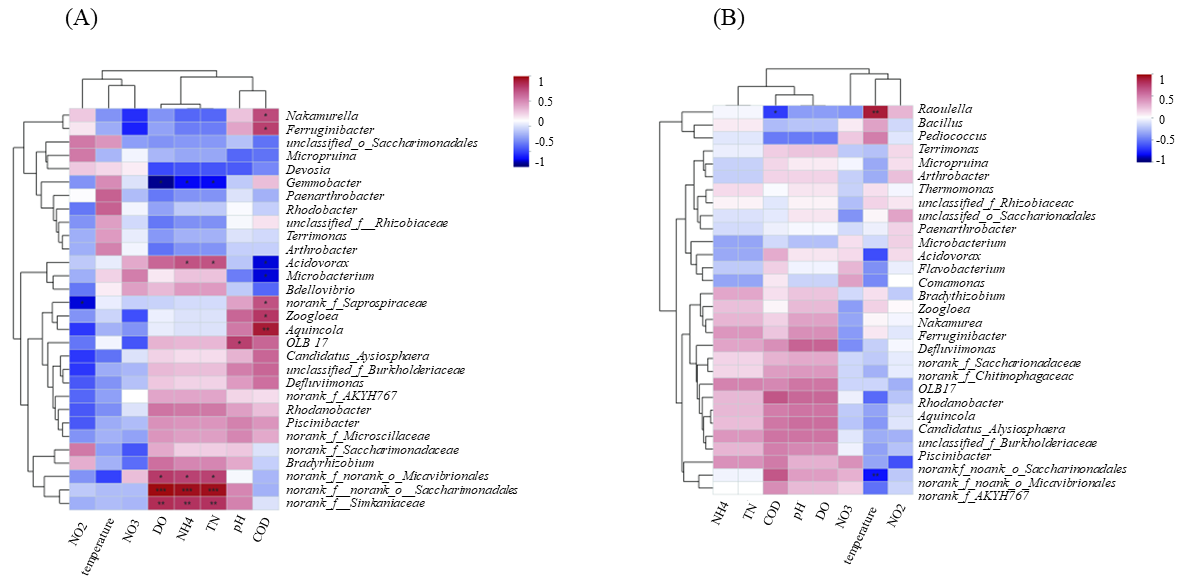
3.4.3. Correlation between Reactor Performance and Microbial Characteristics

Pearson’s correlation analysis was utilized to reveal the effect of the different influent C/N on the MBR denitrifying system (Figure 7 and Figure 8). In R1 (Figure 7A), the influent COD(B) content was positively correlated with the abundances of Nakamurella (R = 0.725), Ferruginibacter (R = 0.759), Zoogloea (R = 0.794), Aquincola (R = 0.897), and Saprospiraceae (R = 0.696), but negatively correlated with the abundances of Acidovorax (R = −0.690), Saccharimonadales (R = −0.380) and Microbacterium (R = −0.690). The effluent TN content was negatively correlated with the abundances of Nakamurella (R = −0.414), Ferruginibacter (R = −0.345) and Gemmobacter (R = −0.673). In R2 (Figure 7B), the effluent TN content was negatively correlated with the abundances of Acidovorax (R = −0.318), Comamonas (R = −0.336), and Flavobacterium (R = −0.190).

4. Discussion

Water quality characteristics can be used to intuitively judge the differences in the start-up time and denitrification effect of the SMBRs with different influent C/N ratios. The increase of NO2-N and the decrease of NO3-N indicated the progress of denitrification. Note that if a sufficient carbon source could be provided, nitrogen could be removed by simultaneous nitrification and denitrification [25]. These results implied that R1 formed a more stable biofilm structure than R2 [26]. It can be inferred from this phenomenon that the biofilms in the R1 reactor were stable, causing the simultaneous nitrification and denitrification to be strengthened. Moreover, because the HRT was only 1 h, the conditions caused insufficient nitrification/denitrification. There was a certain amount of nitrous nitrogen accumulation [27].
R1 presented rapid stabilization of the effluent water, which showed the smoothly formation of biofilms intuitively, demonstrating the success of the shorter start-up time of R1 by adopting adjusting influent C/N ratios. The recovery trends of the average NH3-N removal percentage of the two reactors were similar, but the corresponding recovery degrees were different. The time for R2 to reach stability and its recovery degree was significantly greater than those for R1. This result indicated that the rapid formation of biofilms was beneficial to a rapidly decreased NH3-N content. The phenomenon also suggested that gradually increasing the C/N ratio might be suitable for the rapid start-up of MBR reactors.
The proteins and polysaccharides in EPS play a vital role in improving the adhesion of microorganisms, which is one of the main factors that determine the formation of biofilms [28]. Previous studies have confirmed that the C/N ratio is one of the important influencing factors that can affect the nature and content of microbial EPS. According to Wang et al. [29], the flocculation properties of EPS could influence the ability of microorganisms to adhere to the surface of biofilms.
In R1, under low C/N conditions, the activity of heterotrophic microorganisms decreased and the level of endogenous metabolism increased. Some microorganisms died and disintegrated, which released more EPS, resulting in higher EPS in the carrier [30]. This increase in EPS would make microorganisms easily adhere to the coconut shell activated carbon and might speed up biofilm formation. With increased C/N and operation time, the microbial secretion of EPS gradually decreased, which caused the compactness of the biofilm to decrease. The diffusion resistance of the bioactive matrix in the biofilm decreased. Then, the microbial nutrition level in the biofilm gradually increased. The NOx generated during the denitrification process diffused into the hypoxic area inside the biofilm. The abundance of heterotrophic bacteria was reduced by denitrification [30], which led to the increase of the removal performance of TN in R1. In R2, the microorganisms adapted to the nutritional environment with a high COD(B)/TN ratio. Therefore, the amount of EPS gradually decreased and remained at a low level. This process reduced the EPS content secreted by microorganisms in this phase.
In R1, when C/N increased to 20, a great quantity of heterotrophic bacteria proliferated in the outer layer of the biofilm, which created a good hypoxic environment inside the biofilm. The NOx generated during the denitrification process diffused to the hypoxic zone and the surface aerobic zone in the biofilm, and the hypoxic zone trapped some NOx. The presence of high concentrations of organic matter also provided sufficient electron donors for NOx reduction [31]. According to Yang et al. [32], in a good anoxic environment with a sufficient external carbon source, the denitrification process can reduce the NOx produced in the nitrification stage to N2. However, the EPS content in R2 was only 55.9% of the EPS content in R1. This low content might have caused the structure of the biofilm in R2 to be unstable, resulting in unstable aerobic and anoxic environments and affecting the activity of denitrifying bacteria. Moreover, the addition of excess carbon sources to the MBR promoted the proliferation of heterotrophic bacteria, weakened the competitive ability of autotrophic nitrifying bacteria with a low growth rate, and made NH4+-N unable to be completely oxidized, which in turn caused the TN removal rate to decrease [33,34,35].
In our study, SMP, as an important indicator in the effluent water at different phases of R1 and R2, was detected by the EEM fluorescence spectra. SMP is a substance that can determine the percentage of COD residues in wastewater [36,37]. Therefore, in phases I–III, SMPs in the R1 and R2 reactors were mainly composed of tryptophan-like proteins and aromatic proteins. Aromatic proteins are easily produced by microorganisms under either aerobic conditions or anoxic conditions. The tryptophan-like proteins were most generated from cell breakdown and EPS hydrolysis. A large number of tryptophan-like protein aromatic proteins are produced and accumulate under famished and aerobic conditions. Microorganisms can use aromatic proteins and tryptophan-like proteins for biological metabolism under hypoxic conditions [38]. When the C/N was 5, microorganisms secreted EPS to maintain their own metabolic activities, so the fluorescence intensity of SMPs might be the mainly proof of the increase of EPS hydrolysis, making the SMP fluorescence intensity in R1 higher than that in R2 [39]. As C/N increased, correspondingly, the fluorescence intensity of SMPs in the effluent water gradually decreased in R1.
How the C/N ratio acts on the key factors that result in the changes of the bacterial community structure is a deep question that we wanted to explore. We used the composition of the microbial communities to determine whether different C/N ratios of influent water can affect the proportion of functional microorganisms in the process. The R1 reactor was started by gradually increasing the influent C/N ratio, while the R2 reactor used wastewater with a high C/N ratio of 20 during start-up, which might be the reason that caused the differences of the microbial community structure [40,41,42]. As shown in Table 1, the data indicated that R1 had higher microbial diversity and richness than R2. In R1, the relative abundance of bacteria reactor increased, which promoted the formation of biofilms. After high-throughput sequencing, as shown in Figure 7, the functional denitrifying bacteria are mainly in the phylum Proteobacteria [43]. Many bacteria in Proteobacteria can secrete EPS. An increase in the relative abundance of these microorganisms would mean that they can adhere to biofilms and promote the formation [44]. Therefore, the relative abundance of aerobic denitrifying bacteria and the amount of EPS in R1 were higher than R2, which indirectly indicates that the biofilm formation rate in R1 may have been faster than that in R2. Bacteroidetes play the important role of denitrification, because under most of the anaerobic or anoxic conditions, they can involve in the hydrolysis of macromolecular substances. Some Bacteroidetes have the capability of EPS production [45]. Rhodanobacter is an aerobic denitrifying bacterium [46] that can completely denitrify at a pH of 6.5, which is suitable for growth in alternating anaerobic and aerobic environments [47]. The increase in relative abundance of Rhodanobacter means that biofilms formed in R1.
According to Tice et al. [48] and Table S1, Nakamurella can quickly absorb substrates and accumulate nutrients in the absence of nitrogen and phosphate sources and can secrete large amounts of polysaccharides. These polysaccharides are conducive to the accumulation of EPS [49]. According to Liu et al. [50], Ferruginibacter is a heterotrophic bacterium that can degrade organic matter. In addition, it is a flocculating bacterium that may be involved in biosynthesis and the output of EPS. The increased abundance of the relative bacteria indicated that the addition of coconut shell activated carbon increased the EPS content in the reactor, which might promote biofilm growth.
The results regarding microbial communities explained why there were significant differences in denitrification performance in two different reactors. In R1, a genus of microorganisms with a relatively high relative abundance gradually formed. Micro-bacterium has been explored for biological nitrogen removal processes [51]. The genera Ferruginibacter, Rhodobacter, and Zoogloea are some of the NH-AD denitrifiers [52], the products of heterotrophic nitrification can be used as reactants for aerobic denitrification of HN-AD bacteria, thereby making simultaneous nitrification and denitrification possible. In addition, Zoogloea enhance the stability of the biofilm structure and reserve carbon sources for themselves [53]. The growth of Zoogloea increased the thickness of biofilms. The genus Zoogloea also contributes to TN reduction [52]. Saccharimonadales has been detected in aerobic granular sludge, indicating that it might be involved in the aerobic denitrification process [54]. The detection of this taxon indicated that Saccharimonadales is suitable for growth under a higher C/N ratio but might also indicate that the formation of biofilms requires the participation of Saccharimonadales. Correspondingly, the average relative abundance of Rhodanobacter in R1 gradually increased from 0.09% to 3.59%, which has a higher cell growth rate than traditional nitrifying microorganisms and can use organic carbon sources as substrates to convert different forms of nitrogen into nitrogen, so it has the ability to simultaneously remove nitrogen and carbon. The biofilm in the R1 reactor matured and formed a stable aerobic/anaerobic environment, a suitable living environment for aerobic denitrifying bacteria. In the R2 reactor, Bacillus and Microbacterium were the predominant genera, with average relative abundances of 25.61% and 10.81%, respectively. Microbacterium and Bacillus are aerobic denitrifying bacteria that have been detected in biofilms [55]. In brief, the diversity and richness of the microbial community in the biofilm formed in the R1 reactor was higher than that in the R2 reactor. Gradually increasing the C/N ratio of the influent water as the intake method could make the dominant microbiological communities flora grow and enrich rapidly in a shorter period of time [56]. What is more, the biofilm in the R1 reactor was more adaptable to environmental changes, such as temperature changes. It can be speculated that the more stable the structure of a biofilm is, the higher the microbial richness and diversity [57,58].

5. Conclusions

In a word, gradually increasing the C/N ratio might be suitable for the rapid start-up of SMBRs, and the performance was relatively stable in the removal of nutrients. Using influents with different C/N ratios of 5, 10, and 20 in three phases shortened the time of biofilm formation in the SMBR to 32 days. The SMBR exhibited excellent denitrification capacity as the average removal percentage of TN reached 76.4%, which was 31.3% greater than that of the reactor starting with a C/N ratio of 20. The 3D-EEM spectra indicated that when the EPS content reached 672.11 mg g-1 VSS, the peak intensity first increased and then decreased, reaching its highest point in the initial 32 days and then decreasing in the following operation. This effect promoted the gradual stabilization of the biofilm and increased the abundance of functional microbial taxa and community diversity. Furthermore, the relative abundances of Zoogloea, Microbacterium, Ferruginibacter, Nakamurella, and Rhodanobacter increased. This study showed that starting an SMBR by gradually increasing the C/N ratio can avoid membrane fouling of the reactor caused by an excessively high carbon–nitrogen ratio and can yield better wastewater treatment while shortening the start-up time; this approach offers a reliable and practical technique for the rapid start-up of SMBRs in engineering applications.

Supplementary Materials

The following are available online at https://www.mdpi.com/article/10.3390/w13223251/s1, Figure S1: principal component analysis (PCA); A: R1 and B: R2, Table S1: Summary of identified denitrification bacteria and main functional genes in the literature.

Author Contributions

Conceptualization and supervision by J.D., H.Z., Y.F. and Y.Z. conceived, designed, performed research and analysis of data, and wrote the paper. B.W. contributed with some experiments. All authors have read and agreed to the published version of the manuscript.

Funding

This work was supported by grants from the key Research and Development Project of Zhejiang Province (Grant Numbers 2021C02048), the Social Development Research Initiative Design Project of Hangzhou (Grant Numbers 20180417A05).

Data Availability Statement

Exhaustive information about the summary of identified denitrification bacteria and main functional genes in the literature in this work is included in the Supplementary Materials.

Conflicts of Interest

The authors declare no conflict of interest.

Ethics Approval

This article does not contain any studies with human participants or animals performed by any of the authors.

References

  1. Alzate, M.J.C.; Caravelli, A.H.; Zaritzky, N.E. Nitrification and aerobic denitrification in anoxic-aerobic sequencing batch reactor. Bioresou. Technol. 2016, 200, 380–387. [Google Scholar] [CrossRef]
  2. Sun, P.F.; Yu, H.J.; Liu, T.T.; Li, Y.S.; Wang, Z.S.; Xiao, Y.F.; Dong, X.P. Efficiently photothermal conversion in a MnOx-based monolithic photothermocatalyst for gaseous formaldehyde elimination. Chin. Chem. Lett. 2021. [Google Scholar] [CrossRef]
  3. Deng, L.J.; Guo, W.S.; Ngo, H.H.; Zhang, X.B.; Wang, X.C.; Zhang, Q.H.; Chen, R. New functional biocarriers for enhancing the performance of a hybrid moving bed biofilm reactor-membrane bioreactor system. Bioresour. Technol. 2016, 208, 87–93. [Google Scholar] [CrossRef] [PubMed]
  4. Huang, H.; Peng, C.; Peng, P.C.; Lin, Y.; Zhang, X.X.; Ren, H.Q. Towards the biofilm characterization and regulation in biological wastewater treatment. Appl. Microbiol. Biotechnol. 2019, 103, 1115–1129. [Google Scholar] [CrossRef] [PubMed]
  5. Ji, B.; Yang, K.; Zhu, L.; Jiang, Y.; Wang, H.Y.; Zhou, J.; Zhang, H.N. Aerobic denitrification: A review of important advances of the last 30 years. Bioprocess. Eng. 2015, 20, 643–651. [Google Scholar] [CrossRef]
  6. Feng, L.J.; Pi, S.Y.; Zhu, W.Z.; Wang, X.M.; Xu, X.Y. Nitrification and aerobic denitrification in solid phase denitrification systems with various biodegradable carriers for ammonium-contaminated water purification. J. Chem. Technol. Biot. 2019, 94, 3569–3577. [Google Scholar] [CrossRef]
  7. Li, Y.; Yang, Y.; Feng, Y.R.; Pu, J.; Hou, L.A. Combined effects of Pseudomonas quinolone signal-based quorum quenching and graphene oxide on the mitigation of biofouling and improvement of the application potential for the thin-film composite membrane. Sci. Total Environ. 2021, 760, 8. [Google Scholar] [CrossRef]
  8. Guo, L.J.; Zhao, B.; An, Q.; Tian, M. Characteristics of a novel aerobic denitrifying bacterium, Enterobacter cloacae strain HNR. Appl. Microbiol. Biotechnol. 2016, 178, 947–959. [Google Scholar] [CrossRef]
  9. Ruan, Y.; Taherzadeh, M.J.; Kong, D.D.; Lu, H.F.; Zhao, H.P.; Xu, X.Y.; Liu, Y.; Cai, L. Nitrogen removal performance and metabolic pathways analysis of a novel aerobic denitrifying halotolerant Pseudomonas balearica strain RAD-17. Microorganisms 2020, 8, 72. [Google Scholar] [CrossRef] [Green Version]
  10. Huang, H.K.; Tseng, K. Nitrate reduction by Citrobacter diversus under aerobic environment. Appl. Microbiol. Biotechnol. 2001, 55, 90–94. [Google Scholar] [CrossRef]
  11. Wang, Y.Y.; Zhang, Z.J.; Qiu, L.; Guo, Y.; Wang, X.J.; Xiong, X.J.; Chen, S.H. Effect of temperature downshifts on biological nitrogen removal and community structure of a lab-scale aerobic denitrification process. J. Biol. Eng. 2015, 101, 200–208. [Google Scholar] [CrossRef]
  12. Dube, C.D.; Guiot, S.R. Characterization of the protein fraction of the extracellular polymeric substances of three anaerobic granular sludges. AMB Express 2019, 9, 23. [Google Scholar] [CrossRef] [PubMed]
  13. Sparacino-Watkins, C.; Stolz, J.F.; Basu, P. Nitrate and periplasmic nitrate reductases. Chem. Soc. Rev. 2014, 43, 676–706. [Google Scholar] [CrossRef]
  14. Sonwani, R.K.; Swain, G.; Giri, B.S.; Singh, R.S.; Rai, B.N. A novel comparative study of modified carriers in moving bed biofilm reactor for the treatment of wastewater: Process optimization and kinetic study. Bioresour. Technol. 2019, 81, 335–342. [Google Scholar] [CrossRef] [PubMed]
  15. Sun, G.P.; Wan, J.F.; Sun, Y.C.; Li, H.S.; Chang, C.; Wang, Y. Enhanced removal of nitrate and refractory organic pollutants from bio-treated coking wastewater using corncobs as carbon sources and biofilm carriers. Chemosphere 2019, 237, 124520. [Google Scholar] [CrossRef] [PubMed]
  16. Ge, S.; Peng, Y.; Cao, X.X. Optimization of a Modified UCT Step Feed Process Treating Municipal Wastewater. Environ. Sci. 2011, 32, 2006–2012. [Google Scholar]
  17. Zhao, H.W.; Mavinic, D.S.; Oldham, W.K.; Koch, F.A. Controlling factors for simultaneous nitrification and denitrification in a two stage intermittent aeration process treating domestic sewage. Water Res. 2000, 33, 961–970. [Google Scholar] [CrossRef]
  18. Ding, S.; He, J.; Luo, X.; Zheng, Z. Simultaneous nitrogen and carbon removal in a packed A/O reactor: Effect of C/N ratio on microbial community structure. Bioprocess Biosyst. Eng. 2020, 43, 1241–1252. [Google Scholar] [CrossRef] [PubMed]
  19. Pochana, K.; Keller, J. Study of factors affecting simultaneous denitrification and netrification (SND). Water Sci. Technol. 1999, 39, 61–68. [Google Scholar]
  20. Ding, J.F.; Chen, B.; Zhang, Y.N.; Ye, X.P.; Li, Y.; Zhou, D.R.; Ding, Y.; Zhu, W.Q.; Zhang, H.J. Effects of poly (1,4-butanediol succinate) carrier on the nitrogen removal performance and microbial community of sequencing batch reactors. J. Clean Prod. 2020. [Google Scholar] [CrossRef]
  21. Zhang, P.; Ding, X.S.; Zhao, B.; An, Q.; Guo, J.S. Acceleration of biofilm formation in start-up of sequencing batch biofilm reactor using carriers immobilized with Pseudomonas stutzeri strain XL-2. Bioresour. Technol. 2020, 314, 123736. [Google Scholar] [CrossRef]
  22. APHA (The 23th Edition). Standard Methods for the Examination of Water and Wastewater, 22nd ed.; AWWA; WEF: Washington, DC, USA, 2017. [Google Scholar]
  23. Cheng, Y.F.; Li, G.F.; Liu, Y.Y.; Zhu, B.Q.; Zhang, Q.; Xue, Y.; Zhang, Z.Z.; Jin, R.C. Evaluating the effects of Zn (II) on high-rate biogranule-based denitrification: Performance, microbial community and sludge characteristics. Bioresour. Technol. 2019, 279, 393–397. [Google Scholar] [CrossRef] [PubMed]
  24. Zhang, D.Y.; Li, W.G.; Huang, X.F.; Qin, W.; Liu, M. Removal of ammonium in surface water at low temperature by a newly isolated Microbacterium sp. strain SFA13. Bioresour. Technol. 2013, 137, 147–152. [Google Scholar] [CrossRef] [PubMed]
  25. Gan, Y.L.; Zhao, Q.L.; Ye, Z.F. Denitrification performance and microbial diversity of immobilized bacterial consortium treating nitrate micro-polluted water. Bioresour. Technol. 2019, 281, 351–358. [Google Scholar] [CrossRef]
  26. Wang, J.Y.; Rong, H.W.; Zhang, C.S. Evaluation of the impact of dissolved oxygen concentration on biofilm microbial community in sequencing batch biofilm reactor. J. Biosci. Bioeng. 2018, 125, 532–542. [Google Scholar] [CrossRef] [PubMed]
  27. Ye, L.T.; Yu, G.; Zhou, S.B.; Zuo, S.P.; Fang, C.X. Denitrification of nitrate-contaminated groundwater in columns packed with PHBV and ceramsites for application as a permeable reactive barrier. Water Sci. Technol. Water Supply 2017, 17, 1241–1248. [Google Scholar] [CrossRef]
  28. Skariyachan, S.; Sridhar, V.S.; Packirisamy, S.; Kumargowda, S.T.; Sneha, B.C. Recent perspectives on the molecular basis of biofilm formation by Pseudomonas aeruginosa and approaches for treatment and biofilm dispersal. Folia Microbiolo. 2018, 63, 413–432. [Google Scholar] [CrossRef]
  29. Wang, X.L.; Zhang, L.; Peng, Y.Z.; Zhang, Q.; Li, J.L.; Yang, S.H. Enhancing the digestion of waste activated sludge through nitrite addition: Insight on mechanism through profiles of extracellular polymeric substances (EPS) and microbial communities. J. Hazard. Mater. 2019, 369, 164–170. [Google Scholar] [CrossRef]
  30. Rusanowska, P.; Cydzik-Kwiatkowska, A.; Świątczak, P.; Wojnowska-Baryła, I. Changes in extracellular polymeric substances (EPS) content and composition in aerobic granule size-fractions during reactor cycles at different organic loads. Bioresour. Technol. 2018, 272, 188–193. [Google Scholar] [CrossRef]
  31. Sabba, F.; Terada, A.; Wells, G.; Smets, B.F.; Nerenberg, R. Nitrous oxide emissions from biofilm processes for wastewater treatment. Appl. Microbiol. Biotechnol. 2018, 102, 9815–9829. [Google Scholar] [CrossRef] [Green Version]
  32. Yang, Q.; Liu, X.; Peng, C.; Wang, S.Y.; Sun, H.W.; Peng, Y.Z. N2O Production during Nitrogen Removal via Nitrite from Domestic Wastewater: Main Sources and Control Method. Environ. Sci. Technol. 2009, 43, 9400–9406. [Google Scholar] [CrossRef] [PubMed]
  33. Zhou, J.; He, Q.; Hemme, C.L.; Mukhopadhyay, A.; Hillesland, K.; Zhou, A.; He, Z.; Van Nostrand, J.D.; Hazen, T.C.; Stahl, D.A.; et al. How sulphate-reducing microorganisms cope with stress: Lessons from systems biology. Nat. Rev. Microbiol. 2011, 9, 452–466. [Google Scholar] [CrossRef] [Green Version]
  34. Zhang, W.T.; Hou, F.; Liu, Q.S.; Shao, Y.Q.; Xue, X.F.; Peng, Y.Z. Effect of hrt and aeration rate on performance of aao-baf system for denitrifying phosphorus removal. Chem. Eng. J. 2014, 65, 1436–1442. [Google Scholar]
  35. Zhang, M.; Wang, C.; Peng, Y.Z.; Wang, S.Y.; Jia, F.X.; Zeng, W. Organic substrate transformation and sludge characteristics in the integrated anaerobic anoxic oxic–biological contact oxidation (A2/O–BCO) system treating wastewater with low carbon/nitrogen ratio. Chem. Eng. J. 2016, 283, 47–57. [Google Scholar] [CrossRef]
  36. Wang, Z.P.; Zhang, T. Characterization of soluble microbial products (SMP) under stressful conditions. Water Res. 2010, 44, 5499–5509. [Google Scholar] [CrossRef]
  37. Zhou, W.L.; Wu, B.T.; She, Q.H.; Chi, L.N.; Zhang, Z.J. Investigation of soluble microbial products in a full-scale UASB reactor running at low organic loading rate. Bioresour. Technol. 2009, 100, 3471–3476. [Google Scholar] [CrossRef] [PubMed]
  38. Zhang, X.N.; Sun, Y.L.; Ma, F.; Li, A.; Zhao, H.P.; Wang, A.J.; Yang, J.X. In-situ utilization of soluble microbial product (SMP) cooperated with enhancing SMP-dependent denitrification in aerobic-anoxic sequencing batch reactor. Sci. Total Environ. 2019, 693, 133558. [Google Scholar] [CrossRef]
  39. Ni, B.J.; Zeng, R.J.; Fang, F.; Xie, W.M.; Sheng, G.P.; Yu, H.Q. Fractionating soluble microbial products in the activated sludge process. Water Res. 2010, 44, 2292–2302. [Google Scholar] [CrossRef] [PubMed]
  40. Liu, Q.; Wang, X.C.C.; Liu, Y.J.; Yuan, H.L.; Du, Y.J. Performance of a hybrid membrane bioreactor in municipal wastewater treatment. Desalination 2010, 258, 143–147. [Google Scholar] [CrossRef]
  41. Pacek, L.; Svehla, P.; Hrncirova, H.; Radechovsky, J. Rapid achievement of nitrification in CSTR and SBR treating reject water at high ammonia levels. Desalin. Water Treat. 2016, 57, 15958–15969. [Google Scholar] [CrossRef]
  42. Palmarin, M.J.; Young, S. The effects of biocarriers on the mixed liquor characteristics, extracellular polymeric substances, and fouling rates of a hybrid membrane bioreactor. Biochem. Eng. J. 2019, 1, 278–284. [Google Scholar] [CrossRef]
  43. Chen, Q.; Ni, J.R.; Ma, T.; Liu, T.; Zheng, M.S. Bioaugmentation treatment of municipal wastewater with heterotrophic-aerobic nitrogen removal bacteria in a pilot-scale SBR. Bioresour. Technol. 2015, 183, 25–32. [Google Scholar] [CrossRef]
  44. Zhang, L.L.; Yue, Q.Y.; Yang, K.L.; Zhao, P.G.; Bao, Y. Analysis of extracellular polymeric substances (EPS) and ciprofloxacin-degrading microbial community in the combined Fe-C micro-electrolysis-UBAF process for the elimination of high-level ciprofloxacin. Chemosphere 2018, 193, 645–654. [Google Scholar] [CrossRef]
  45. Pishgar, R.; Dominic, J.A.; Sheng, Z.Y.; Tay, J.H. Denitrification performance and microbial versatility in response to different selection pressures. Bioresour. Technol. 2019, 281, 72–83. [Google Scholar] [CrossRef]
  46. Green, S.J.; Prakash, O.; Jasrotia, P.; Overholt, W.A.; Cardenas, E.; Hubbard, D.; Tiedje, J.M.; Watson, D.B.; Schadt, C.W.; Brooks, S.C.; et al. Denitrifying bacteria from the genus Rhodanobacter dominate bacterial communities in the highly contaminated subsurface of a nuclear legacy waste site. Appl. Environ. Microbiol. 2012, 78. [Google Scholar] [CrossRef] [PubMed] [Green Version]
  47. O’Toole, G.; Kaplan, H.B.; Kolter, R. Biofilm formation as microbial development. Annu. Rev. Microbiol. 2000, 54, 49–79. [Google Scholar] [CrossRef]
  48. Tice, H.; Mayilraj, S.; Sims, D. Complete genome sequence of Nakamurella multipartita type strain (Y-104). Stand. Genom. Sci. 2018, 2, 168–175. [Google Scholar] [CrossRef] [Green Version]
  49. Huang, H.; Yu, Q.S.; Ren, H.Q.; Geng, J.J.; Xu, K.; Zhang, Y.; Ding, L.L. Towards physicochemical and biological effects on detachment and activity recovery of aging biofilm by enzyme and surfactant treatments. Bioresour. Technol. 2018, 247, 319–326. [Google Scholar] [CrossRef] [PubMed]
  50. Liu, T.; Mao, Y.J.; Shi, Y.P.; Xie, Q. Start-up and bacterial community compositions of partial nitrification in moving bed biofilm reactor. Appl. Microbiol. Biotechnol. 2017, 101, 2563–2574. [Google Scholar] [CrossRef]
  51. Iannacone, F.; Di Capua, F.; Granata, F.; Gargano, R.; Esposito, G. Simultaneous nitrification, denitrification and phosphorus removal in a continuous-flow moving bed biofilm reactor alternating microaerobic and aerobic conditions. Bioresour. Technol. 2020, 310, 123453. [Google Scholar] [CrossRef] [PubMed]
  52. Liu, T.; He, X.; Jia, G. Simultaneous nitrification and denitrification process using novel surface-modified suspended carriers for the treatment of real domestic wastewater. Chemosphere 2020, 247, 125831. [Google Scholar] [CrossRef] [PubMed]
  53. Chen, H.; Li, A.; Cui, D.; Cui, C.W.; Ma, F. Evolution of microbial community and key genera in the formation and stability of aerobic granular sludge under a high organic loading rate. Bioresour. Technol. Rep. 2019, 7, 100280. [Google Scholar] [CrossRef]
  54. Luo, J.; Hao, T.; Wei, L.; Mackey, H.R.; Lin, Z.; Chen, G. Impact of influent COD/N ratio on disintegration of aerobic granular sludge. Water Res. 2014, 62, 127–135. [Google Scholar] [CrossRef] [PubMed]
  55. Deng, Z.W.; Wang, Z.C.; Zhang, P.; Xia, P.H.; Ma, K.D.; Zhang, D.A.; Wang, L.; Yang, Y.S.; Wang, Y.J.; Chen, S.P.; et al. Effects of divalent copper on microbial community enzymatic activity and functional genes associated with nitrification and denitrification at tetracycline stress. Enzyme Microb. Technol. 2019, 126, 62–68. [Google Scholar] [CrossRef]
  56. Zhang, X.Y.; Xu, Z.W.; Sun, X.M.; Dong, W.Y.; Ballantine, D. Nitrate in shallow groundwater in typical agricultural and forest ecosystems in China. J. Environ. Sci. 2013, 25, 1007–1014. [Google Scholar] [CrossRef]
  57. Yang, X.H.; Song, X.F.; Hallerman, E.; Huang, Z.T. Microbial community structure and nitrogen removal responses of an aerobic denitrification biofilm system exposed to tetracycline. Aquaculture 2020, 529, 735665. [Google Scholar] [CrossRef]
  58. Bereschenko, L.A.; Heilig, G.H.J.; Nederlof, M.M.; van Loosdrecht, M.C.M.; Stams, A.J.M.; Euverink, G.J.W. Molecular characterization of the bacterial communities in the different compartments of a full-scale reverse-osmosis water purification plant. Appl. Environ. Microbiol. 2008, 74, 5297–5304. [Google Scholar] [CrossRef] [Green Version]
Figure 1. Schematic diagram of the SMBR.
Water 13 03251 g001
Figure 2. Performances of the different reactors in a synthetic wastewater degradation experiment based on the NH4+-N and TN concentrations: (A,C) R1 and (B,D) R2.
Water 13 03251 g002
Figure 3. Performances of the different reactors in a synthetic wastewater degradation experiment based on the NO2-N and NO3-N concentrations: (A,C) R1 and (B,D) R2.
Water 13 03251 g003
Figure 4. EPS concentrations in the reactors during the experiments: (A) R1 and (B) R2.
Water 13 03251 g004
Figure 5. EEM fluorescence spectra of SMPs from the different reactor effluents during the experiments; (R1-1) and (R2-1) EEM fluorescence spectra for (R1) and (R2), respectively, in phase I; (R1-2) and (R2-2) EEM fluorescence spectra for (R1) and (R2), respectively, in phase II; and (R1-3) and (R2-3) EEM fluorescence spectra for (R1) and (R2), respectively, in phase III.
Water 13 03251 g005
Figure 6. Circos of microbial community (abundance greater than 1%) dynamics of the biofilm samples in different phases at the phylum. (A) R1; (B) R2.
Water 13 03251 g006
Figure 7. Heat map of microbial community (abundance greater than 1%) at genus level. (A) R1; (B) R2.
Water 13 03251 g007
Figure 8. Pearson’s correlation analysis showing the relationship between the water quality and the characteristics of the denitrifying bacteria in the biofilm samples. Red represents a positive correlation, and blue represents a negative correlation. A deeper color indicates a stronger correlation. (A) R1; (B) R2.
Water 13 03251 g008
Table 1. Summary of the process performance of R1 and R2.
ReactorAverage Removal Rate (%)
Phase IPhase IIPhase III
NH3-NTNNH3-NTNNH3-NTN
R169.3 ± 3.565.3 ± 5.579.2 ± 2.875.6 ± 1.271.1 ± 1.676.4 ± 3.6
R259.3 ± 5.251.3 ± 1.953.3 ± 1.748.6 ± 2.143.6 ± 2.545.1 ± 2.5
Table 2. Species richness and diversity indicators of the microbial communities of samples in R1 and R2 (R1-1: in the beginning of the test, R1-1: in the end of the test; R2-1: in the beginning of the test, R2-1: in the end of the test).
ShannonSimpsonChao1ACE
R1-12.940.177394.85404.72
R1-24.410.652680.27693.42
R2-12.620.189327.26346.80
R2-23.910.437570.29585.48
Publisher’s Note: MDPI stays neutral with regard to jurisdictional claims in published maps and institutional affiliations.

