
Groundwater Depletion in an Urban Environment under Semiarid Climate and Persistent Drought–City of Marrakesh (Morocco)


Laboratory Geosciences Semlalia, Department Geology, Faculty of Sciences Semlalia, Cadi Ayyad University, Marrakesh 40000, Morocco
*
Author to whom correspondence should be addressed.
Water 2021, 13(22), 3253; https://doi.org/10.3390/w13223253
Submission received: 14 September 2021
/
Revised: 1 November 2021
/
Accepted: 5 November 2021
/
Published: 17 November 2021
(This article belongs to the Section Urban Water Management)
Abstract
:The quantitative monitoring of the shallow aquifer in Marrakesh and its surrounding area shows that the water table has been lowered gradually over the last 40 years, and attaining an acute decline in the early 2000s. This declining trend—if confirmed in the future—may lead to a water shortage, or even to a total aquifer depletion, which would be devastating for a region where economic activity and drinking water supply rely partly on groundwater resources. Two factors account for this situation: the hot semi-arid climate characterized by high temperatures and low precipitation, causing an inadequate groundwater recharge (deficit between rainwater supply and the potential evapotranspiration), and the over-pumping of groundwater from wells for intensive agricultural uses and some leisure activities (golf courses, waterparks and pools, for example). The objective of this study is to assess the hydrodynamic behaviour of the shallow aquifer in this context of persistent drought and semi-arid climate under intense use conditions. Based on earlier research studies and hydrological data recently collected from the field, a spatiotemporal analysis using a geographic information system has been conducted, allowing researchers to monitor the evolution of groundwater resources under the impact of intense exploitation. This study shows a general decline of groundwater level in the city of Marrakesh between 1962–2019. However, by dividing this period into three periods (1962–1985, 1986–2001 and 2002–2019), it is obvious that the main groundwater fall occurred during the two last decades, a period marked by highest recorded temperatures and decreased precipitation levels. This water table decline impacted 85% of the study area and is estimated at 0.9 m/year. The area most affected by the drawdown of the water table experienced a decline reaching 37 m between 2002 and 2019 (more than 2 m a year).
1. Introduction
For over half a century, the city of Marrakesh and its region has had a great economic, demographic and urban development, marked by an exceptional construction boom [1,2]. The buildable surface area increased from 2000 ha in the beginning of the 1970s to almost 20,000 ha in 2020 [3,4]. This process has enormously upsurged during the last 20 years since the city has become the Moroccan tourism capital, receiving 3 million visitors annually [5,6]. The region is also the main mining region in the country (28% of the national production) and one of the main agricultural areas [7,8]. This situation places increasing pressure on natural resources, particularly groundwater resources used for agricultural irrigation, drinking water supplies and other activities [9].
Indeed, the shallow aquifer experiences an intensive use or even an overexploitation, which is worrying in the local context characterized by a hot semi-arid climate and increasingly severe dryness [10,11]. Drought is seen as a worsening threat at the global level, but especially in those countries and regions with arid (desert) and semi-arid climate [12], and several indicators have been developed to characterize the drought [13].
The pressure on groundwater in Marrakesh is linked to the demand for drinking water and the needs of some leisure activities, such as golf courses, water parks and public or domestic swimming pools. Those activities have been expanding rapidly in this region where the hot and dry climate is attracts plenty of tourists [14]. In 1970, 100% of the drinking water supply (12 Mm3) was ensured by groundwater pumped from Marrakesh’s perimeter. In 2015, only 5% of the 61 Mm3 of drinking water was provided by the shallow aquifer, while the remaining supply came from surface waters. This is attributable to a decline of the aquifer productivity, which decreased from 1805 L/s to 330 L/s within 40 years (1976–2015) [15]. In addition, a huge amount of groundwater is used to meet the needs of the agricultural development around Marrakesh and more generally in the Haouz Plain [16]. In fact, almost 500 Mm3 of groundwater is exploited to meet the needs of the irrigated areas (185,244 ha) [17].
The intensive exploitation of groundwater in the region of Marrakesh has substantially modified the natural functioning of the shallow aquifer in terms of both quality and quantity. As concerns the qualitative aspect, urbanization and human activities engender a massive production of wastewater and solid wastes, which affect the groundwater layer by physicochemical and mineralogical contaminations, making water noncompliant with irrigation and drinking water standards [18,19,20,21]. Moreover, agricultural activities result in pollution from various origins (fertilizers, pesticides, wastewater irrigation, septic tanks, slaughterhouses, oil mills, etc.), leading to pH, conductivity and oxygenation rate values exceeding the allowed limit, as well as an excessive accumulation of some heavy metals [22,23,24]. Furthermore, a natural degradation of groundwater is expressed as a heavy salinization is due to the inflow of salt surface water and to the reduction of groundwater quantity, causing a high concentration of salt [24].
While many studies have been conducted in order to evaluate the quality of groundwater in the region of Marrakesh, those relating to the quantitative dimension were fewer, but all agree on the same point: the water table has been experiencing a continuous decline for more than half a century, with the trend gathering momentum from the 2000s [10,25,26]. The furtherance of this phenomenon or its intensification could have tragic consequences, including the risk of the depletion of groundwater resources with all significant repercussions in terms of impact on environment and society [27].
This study aimed to assess groundwater level evolution in the area of Marrakesh during the last 60 years, by analysing recent data collected from observation wells, and by comparing this information with older data starting from the 1960s. In addition to the older and more recent hydrological data, Geographic Information Systems and satellite imagery were used.
2. Materials and Methods
2.1. Study Area and Context
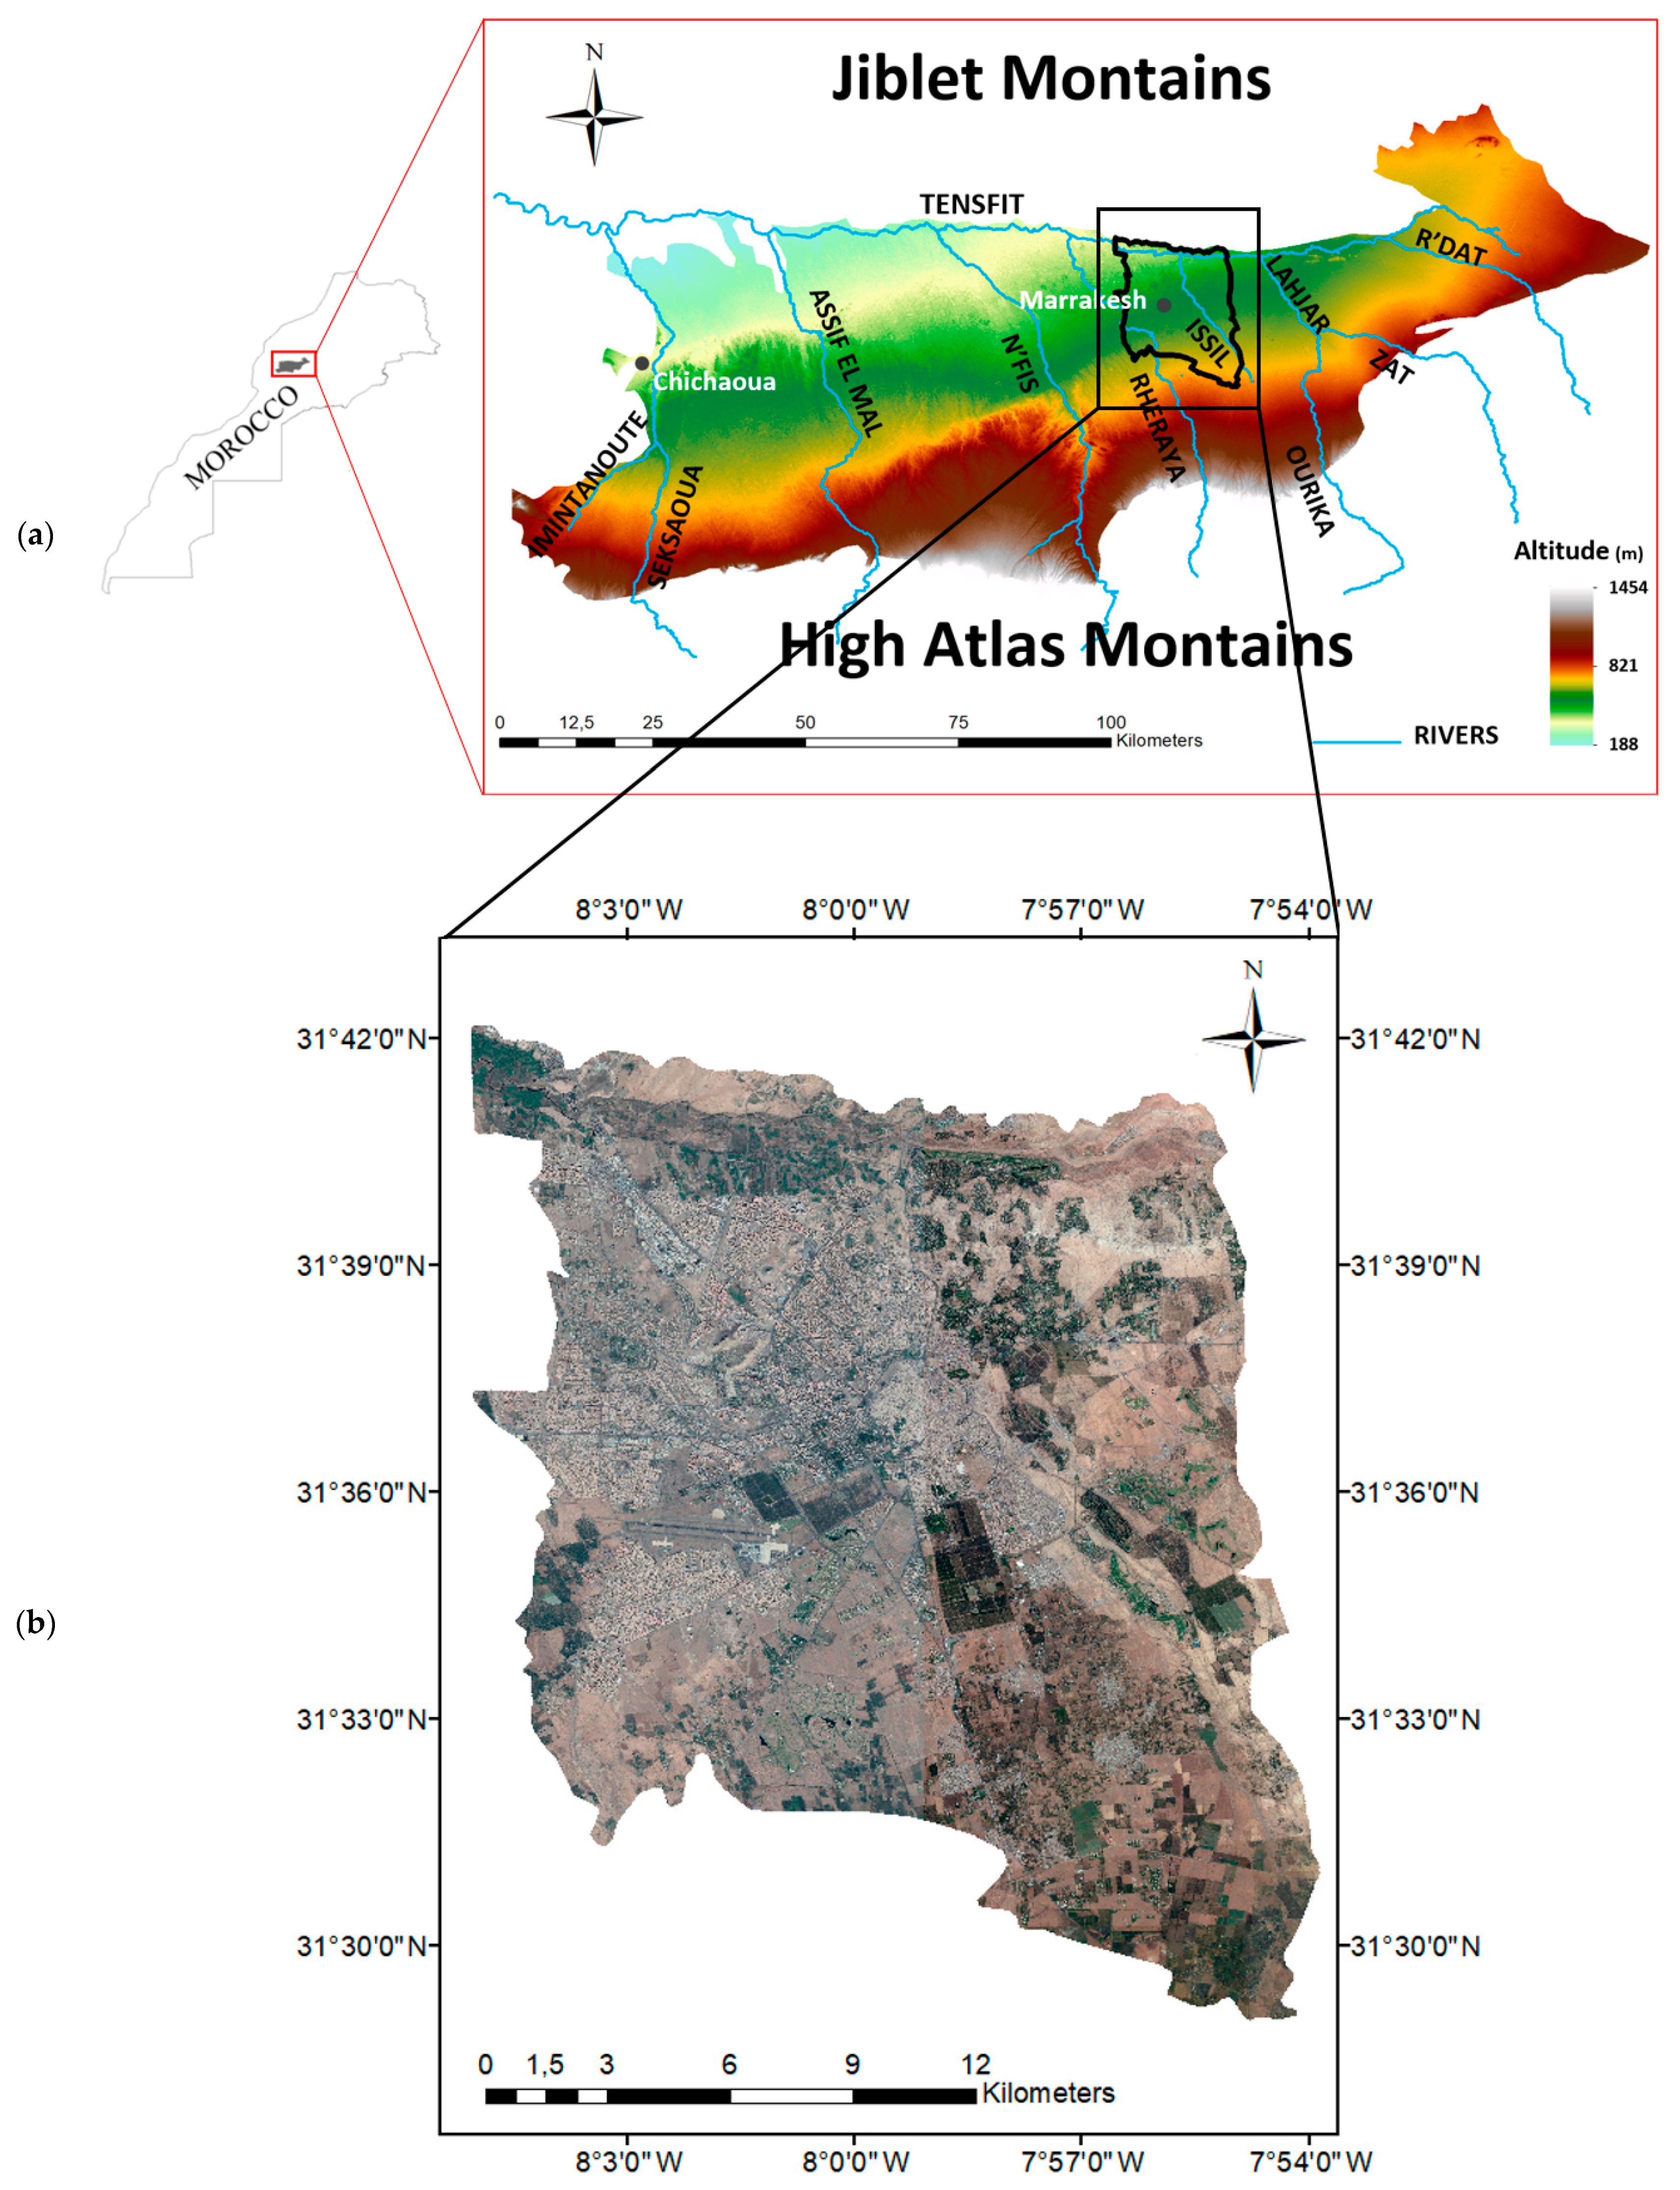
The study area (Figure 1) encompasses the city of Marrakesh (31°37′48″ N, 8°00′00″ W) and its very small radius and covers 290 km2. The area is bordered to the North by the Tensift River, which is the natural outlet of the groundwater system.
On the geological aspect, the zone is situated in the Haouz of Marrakesh, a plain extending 6000 km2, and limited by the ancient and low altitudes mountainous massif of Jbilet to the North, the High-Atlas Mountains in the South, the Plateaux of Chichaoua in the west and the first reliefs of the Middle Atlas Mountain in the east. The Haouz is a sedimentary basin having a tectonic origin, with an overall slope decreasing from the High Atlas Mountain to the Tensift River. Some peaks form the Paleozoic Basement (primary schists) outcrops, such as the Guemmassa, Jbel Gueliz and Jbilet mountains.
The plain is made up of significant detrital formation accumulated during the Mio-Pliocene (conglomerates) and the Quaternary (alluvium), due to the dismantling of the Atlasic chain. The thickness of the deposits (detrital formation) decreases from south to north [26,28,29,30].
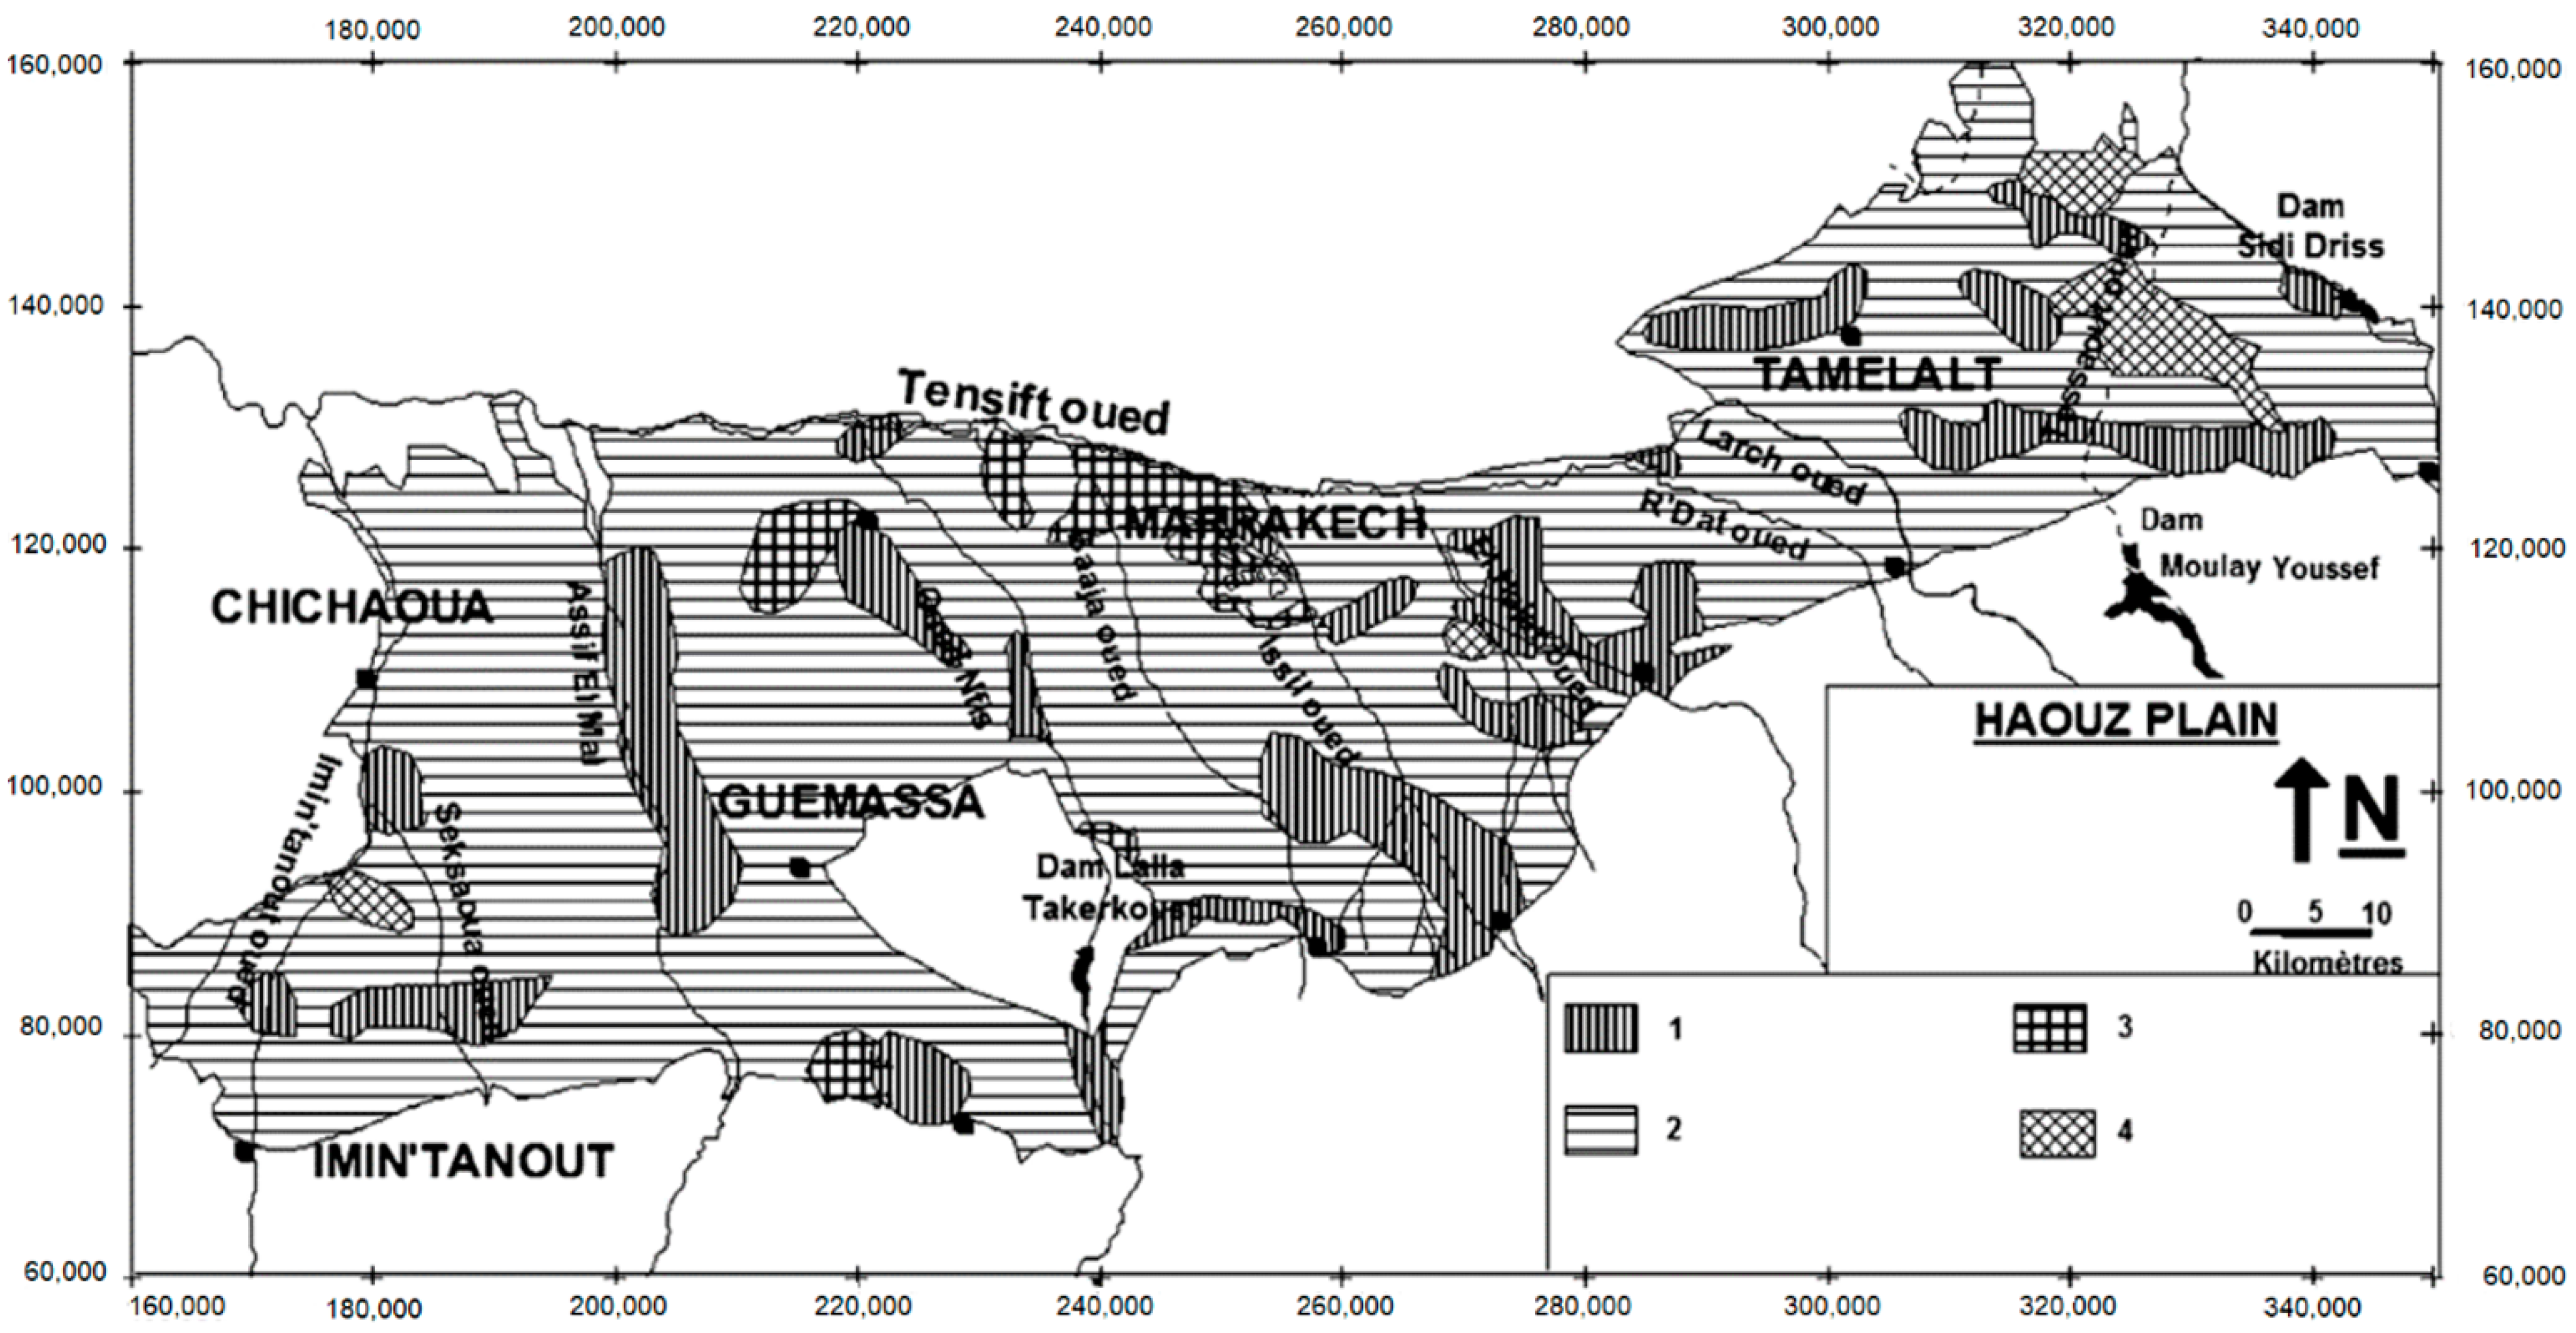
Figure 2 shows the lithological facies of the saturated zone of the Haouz aquifer.
In a considerable part of the plain, an unconfined aquifer is located in the Plio-Quaternary alluvial deposits, with a varying and remarkable thickness up to 70 m in the south. The water table depth generally varies between 0 and 10 m in the north of the basin (along the Tensift River) and between 40 m and more than 65 m along the northern border of the High Atlas (south of the basin). In the central part, the depth of the water table varies between 20 m and 40 m. In the study area, the deposits are characterized by vertical and lateral facies variations and consist of alternate regions of alluvia with calcareous intercalations and heterogeneous alluvia (pebbles, gravels, sands, clays and marls), involving highly spatial variability of the hydraulic gradient and the hydrodynamic properties [31].
The groundwater flows generally from the south toward the northern part of the region (Tensift River), with a strong downward hydraulic gradient near the southern edge of the aquifer.
The Haouz basin is drained by the Tensift River and its tributaries originating in the High Atlas (the Lahjar, Tessaoute, R’dat, Zat, Ourika, Rheraya, N’fis, Issil, Assif El Mal, Seksaoua, and Imin Tanoute Rivers). The majority of this hydrographic network is dry, except at times of snowmelt or exceptional rainfall [32].
- -
- The first is that of Tensift, oriented east–west and located in the western and central part of the Haouz Plain. The Tensift River is fed by several tributaries coming down for the north side of the High Atlas Mountains. These tributaries are: R’dat, Zat, Ourika, Rheraya and N’Fis (west to east).
- -
- The second is that of R’dat which drains the eastern part of the Haouz Plain.
- -
- The average water supply of these watercourses is about 887.89 million m3/year. The tributaries of the Tensift account for 70% of the total contribution of water supply (620.15 million m3/year–19.67 m3/s). The higher flow rate comes from Ourika (6.39 m3/s) and N’fis (5.4 m3/s). The remaining 30% (267.74 million m3/year–8.48 m3/s) of water supply is from the eastern hydrological systems of Haouz Plain.
- -
- The lithological, geometrical and structural heterogeneities of the shallow aquifer of the Haouz Plain involve a high spatial variability in the hydrodynamic parameters average value in the study area:
- -
- The transmissivity of the Haouz aquifer presents a significant dispersion with values ranging from 1.10−4 m2/s to 4.10−2 m2/s (average value in the study area 0.0063 m2/s).
- -
- The hydraulic conductivity is less heterogeneous than the transmissivity. Ninety-five percent of hydraulic conductivity values are between 7.10−4 m/s to 1.10−3 m/s (0.00044 m/s).
- -
- The storage coefficient varies between 0.1 and 26% (4.4%). This coefficient is identical to the specific yield as the Haouz aquifer is unconfined.
Issil is the only river that runs through Marrakesh, in the direction of groundwater flow, from south to north. The spring of this river emerges in the High Atlas Mountain at almost 2300 m altitude in a region where the climate is similar to a wet climate, with higher and more intense rainfall and lower temperature compared to the plain context. The precipitation can be caused by severe thunderstorms involving a water concentration within the river basin. This phenomenon is accentuated by a relatively impermeable floor in the mountainous part, leading to a poor infiltration and a rapid runoff flowing into the plain. This results in a rapid accumulation of water in the river outlet with a risk of a sudden upwelling at the entrance of the city, and into the urban area all along the river.
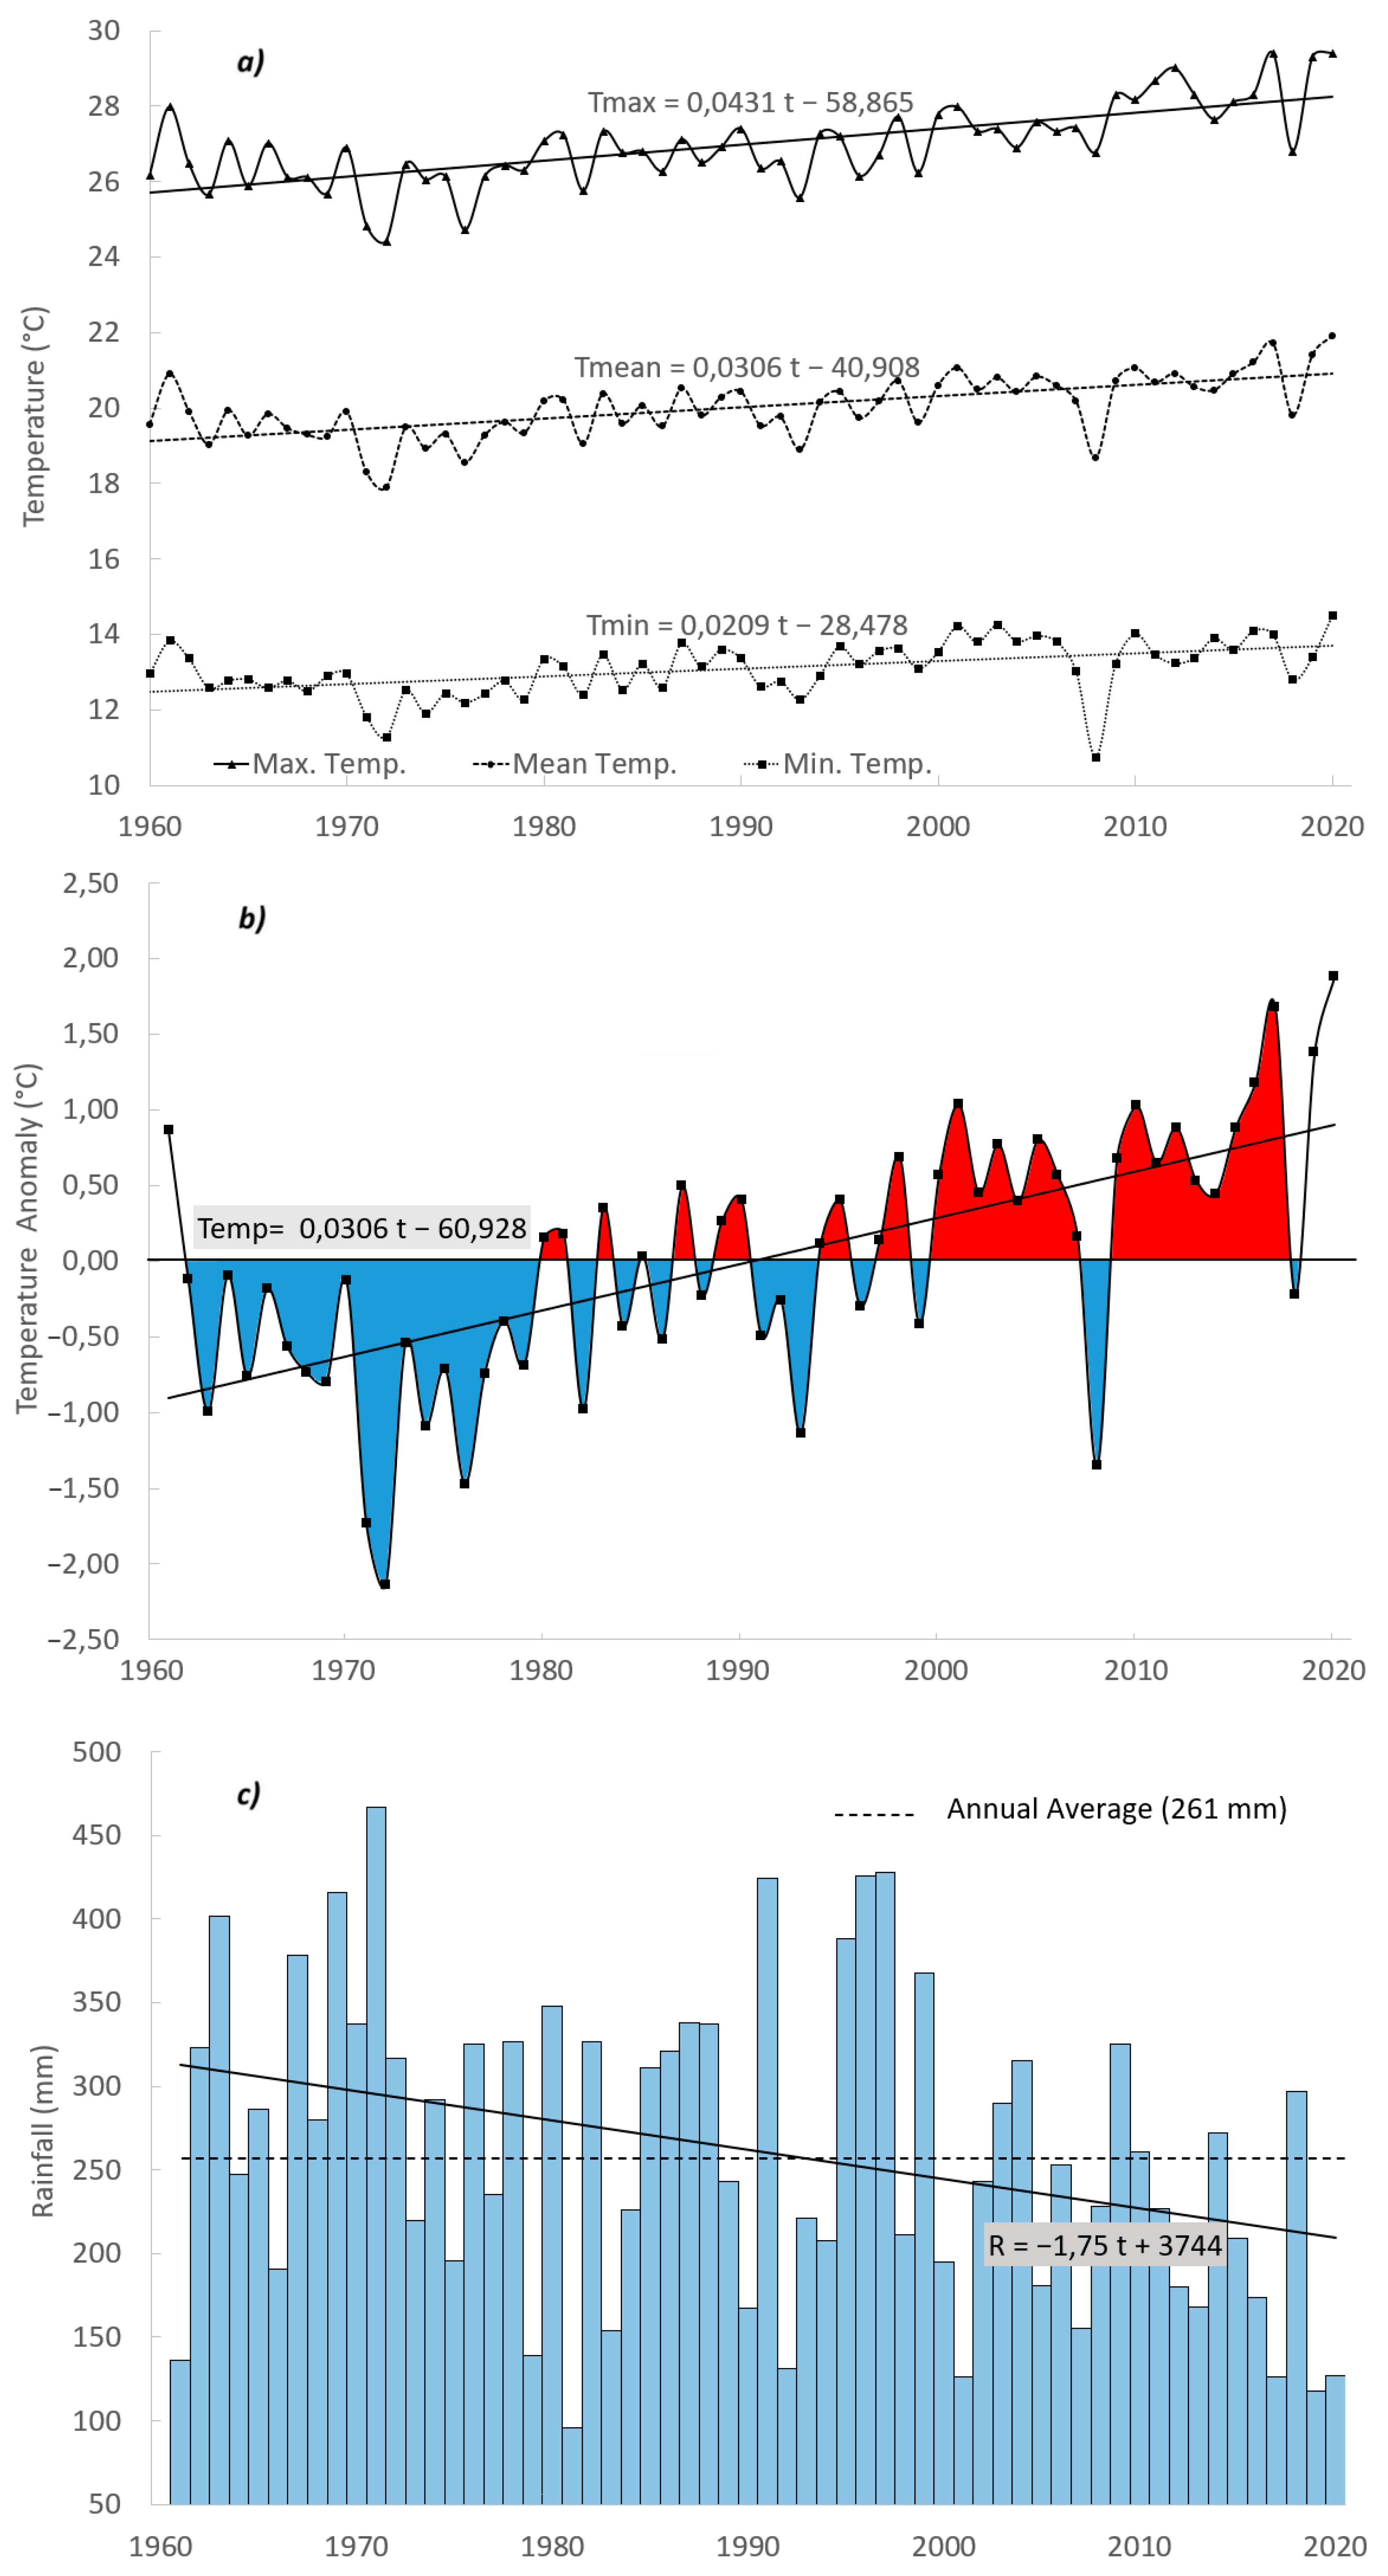
From a climatic point of view, the zone is located in a hot semi-arid region (Köppen classification: BSh), with average temperatures ranging between 12 °C in the winter and 26 °C to 30 °C in the summer (Figure 3). During the summer, temperature exceeds 40 °C in the daytime, with a record high temperature of 49.6 °C recorded in July 2012. In terms of precipitation, the annual average is 261.3 mm.
The intensive use of the groundwater is exacerbated by the scarcity of stormwater and the high temperatures causing an intense evaporation and consequently a poor recharge.
Over the past 60 years, average temperatures have increased continuously (Figure 3a) with a total increase of 1.8 °C in this period. Figure 3b shows that annual mean temperatures have been, since 2000, higher than the average temperature (except two years, 2008 and 2018). This anomaly is becoming more acute with a peak in 2020 of 1.9 °C. Conversely, temperature below average was recorded along the years before 1980. The period 1980–2000 was a transition phase, with alternating cold and hot years. For their part, the rainfall data confirm also this intensification of drought, with an average drop in rainfall of 105 mm from 1961 to 2020, in which the annual average is 261 mm. From 1961 to 1980, 13 years out of 20 recorded higher cumulative rainfall to this average, while only 5 years out of 20 extinguished above the average between 2001 and 2020.
The time series of anomalies were constructed by calculating the difference between the average temperatures over the reference period (1961–2020) −20.02 °C and the annual average temperature for each year. This results in a set of values fluctuating around 0 between −2.13 °C and 1.88 °C.
2.2. Water Table Evolution under the Impact of Increasing Demand
Marrakesh, the touristic capital of the Kingdom of Morocco, is a very authentic city thanks to its historical heritage and its spatial, architectural and urban characteristics. Furthermore, the region has tremendous natural potential composed of mountains, green areas, palm groves and desert. These surroundings attract millions of tourists who come annually for the sun and the hot and dry climate throughout the year. Thus, tourism has become the driving force for local economic development, involving the development of different sectors, such as hotels, restaurants and transport. In order to better meet clients’ needs, water parks, artificial beaches, swimming pools and golf courses have multiplied, thus putting strong pressure on groundwater. Additionally, to meet the food needs of the population, agriculture showed a very significant boom around the city, especially in the west at the N’fis River basin. Because of low rainfall, this agriculture is based on irrigation using groundwater and exploits a huge amount of water from the shallow aquifer. This leads to an irremediable decrease in the water table level and runs the risk of aquifer exhaustion.
The intensive use of the groundwater is exacerbated by the scarcity of stormwater and the high temperatures causing an intense evaporation and consequently a poor recharge.
This circumstance in which a poorly supplied aquifer is excessively exploited requires constant monitoring of the spatial and temporal variation of the water table level in Marrakesh and its close proximity. For this reason, the quantitative aspect of the water table has been monitored since the 1960’s by the ABHT, over the entire Haouz Plain. The ABHT (Agence du Bassin Hydraulique de Tensift-Tensift Watershed Agency) is a public institution in charge of groundwater resources planning and management in the Tensift watershed.
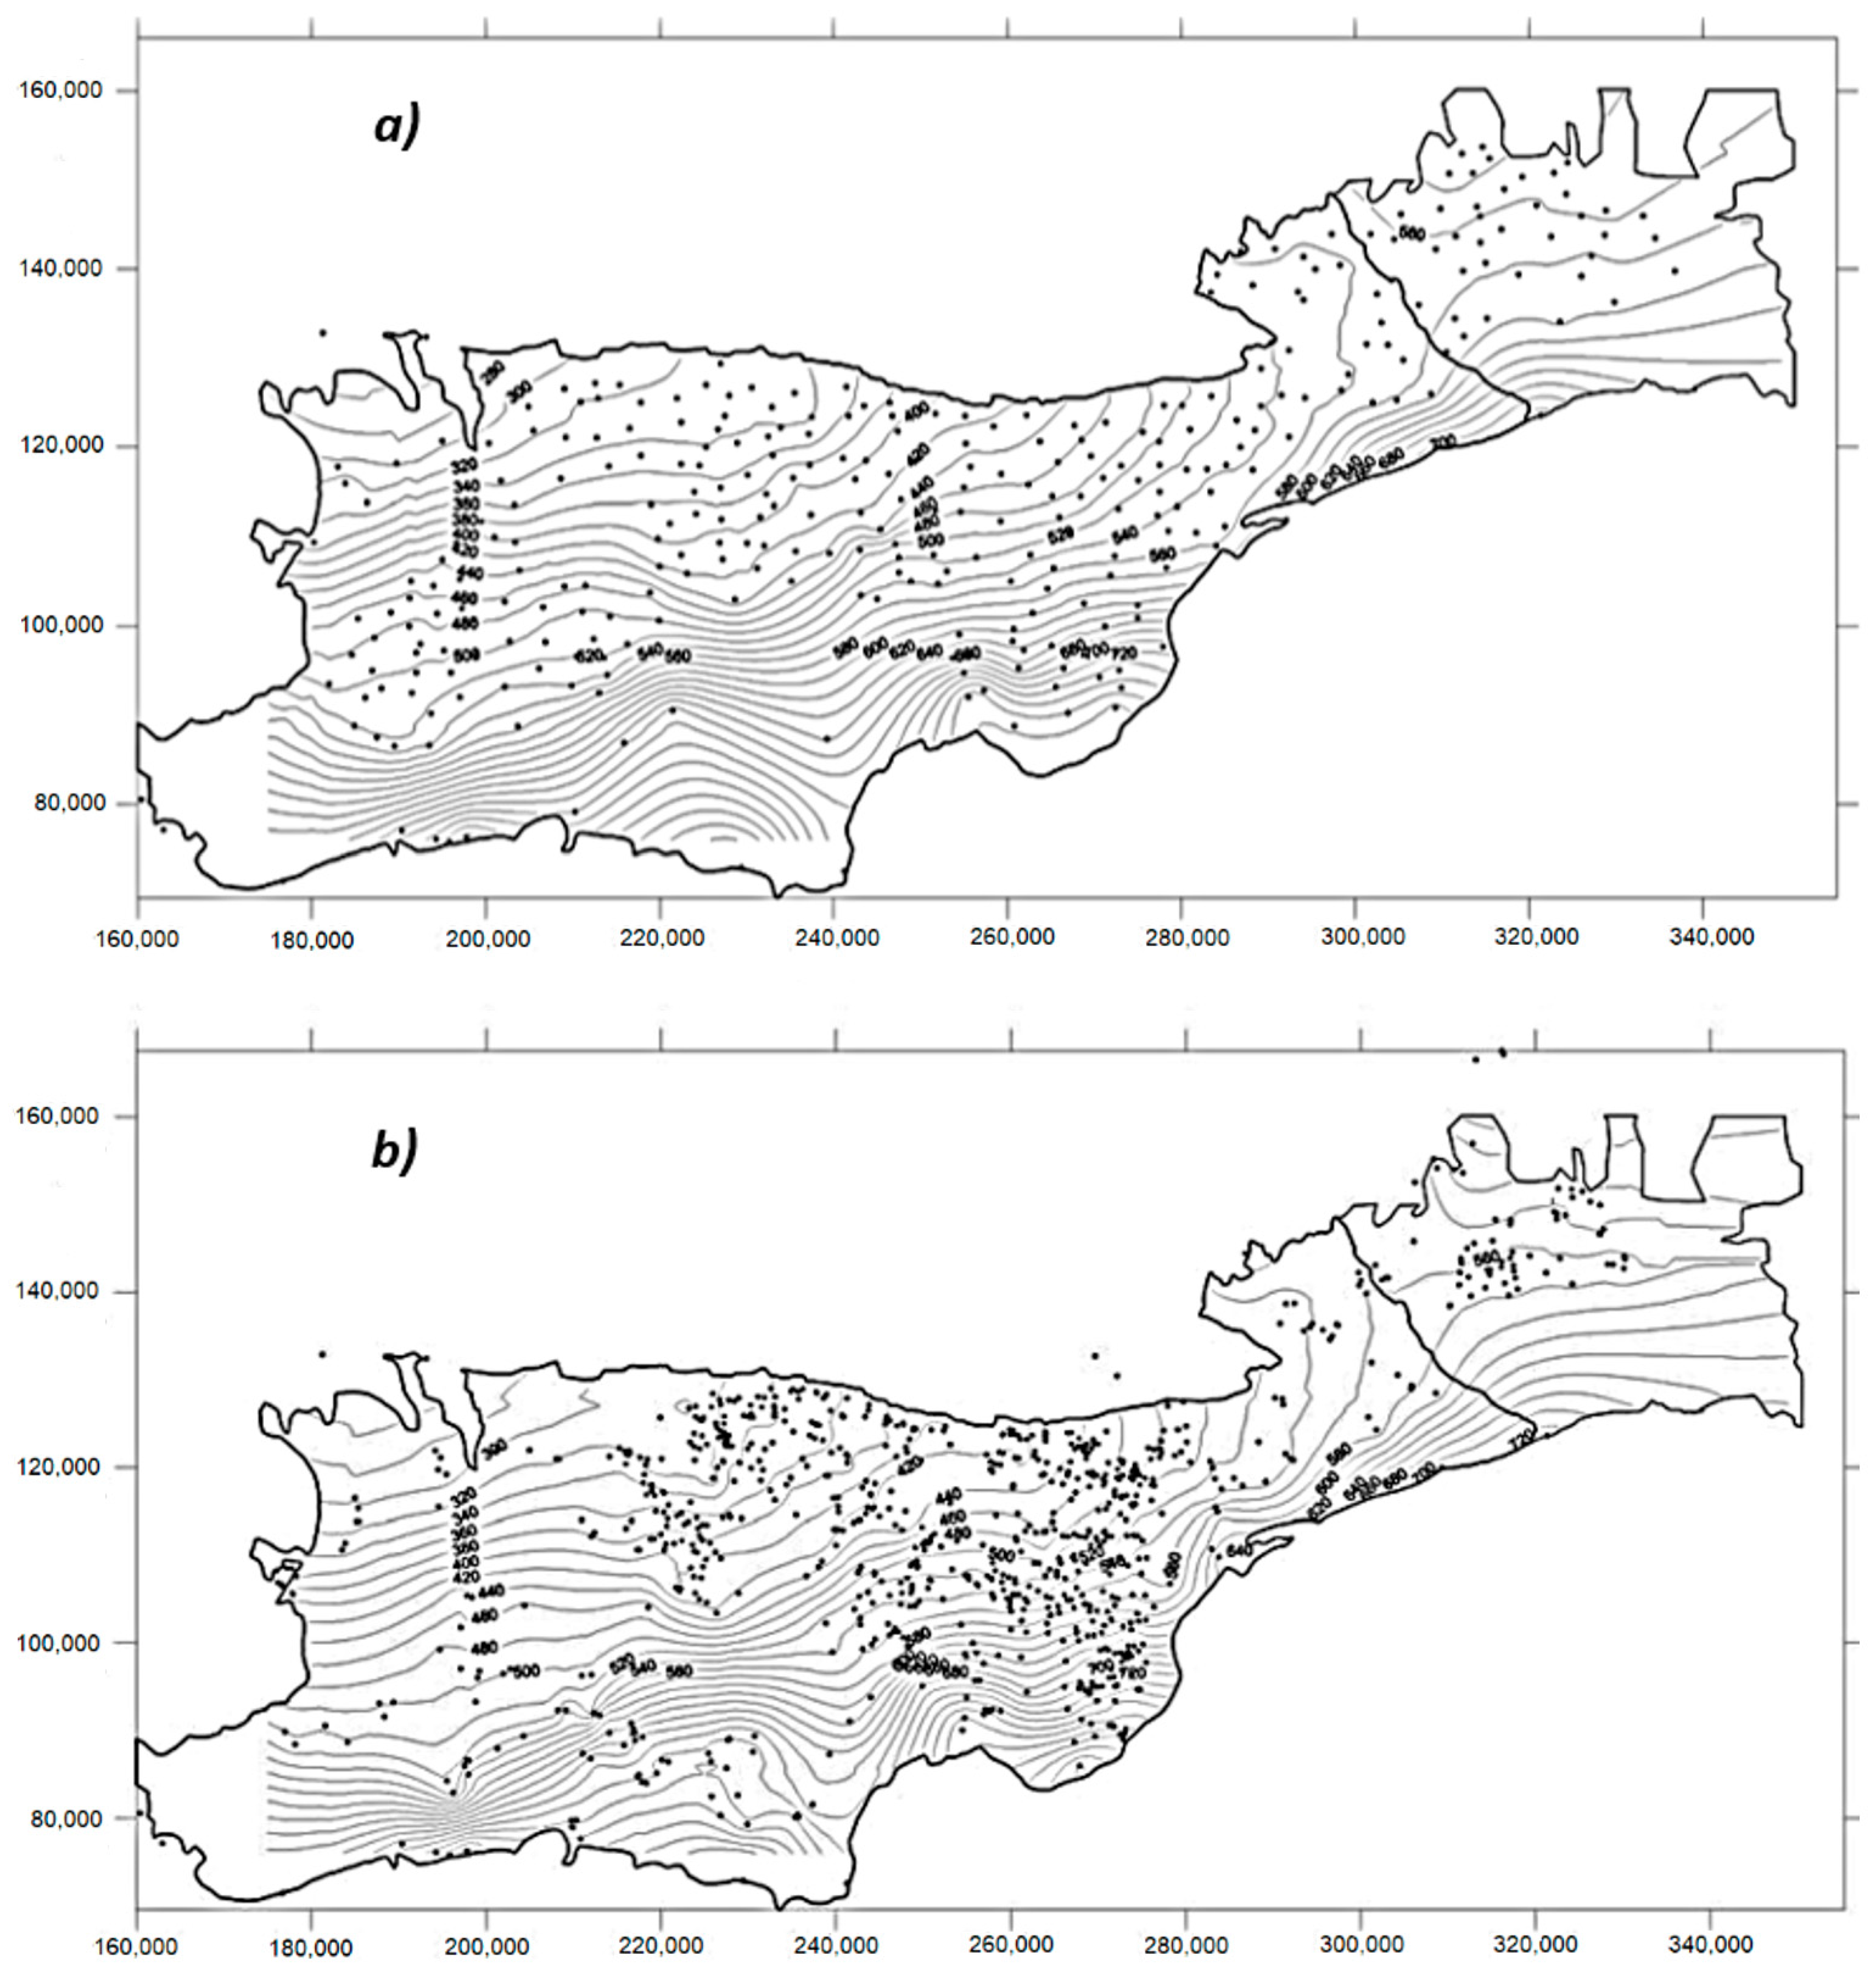
For this study, data from the ABHT dating from 1962, 1986 and 2002 (Figure 4 shows the data for 1986 and 2002) were used to determine the hydrodynamic evolution of the groundwater.
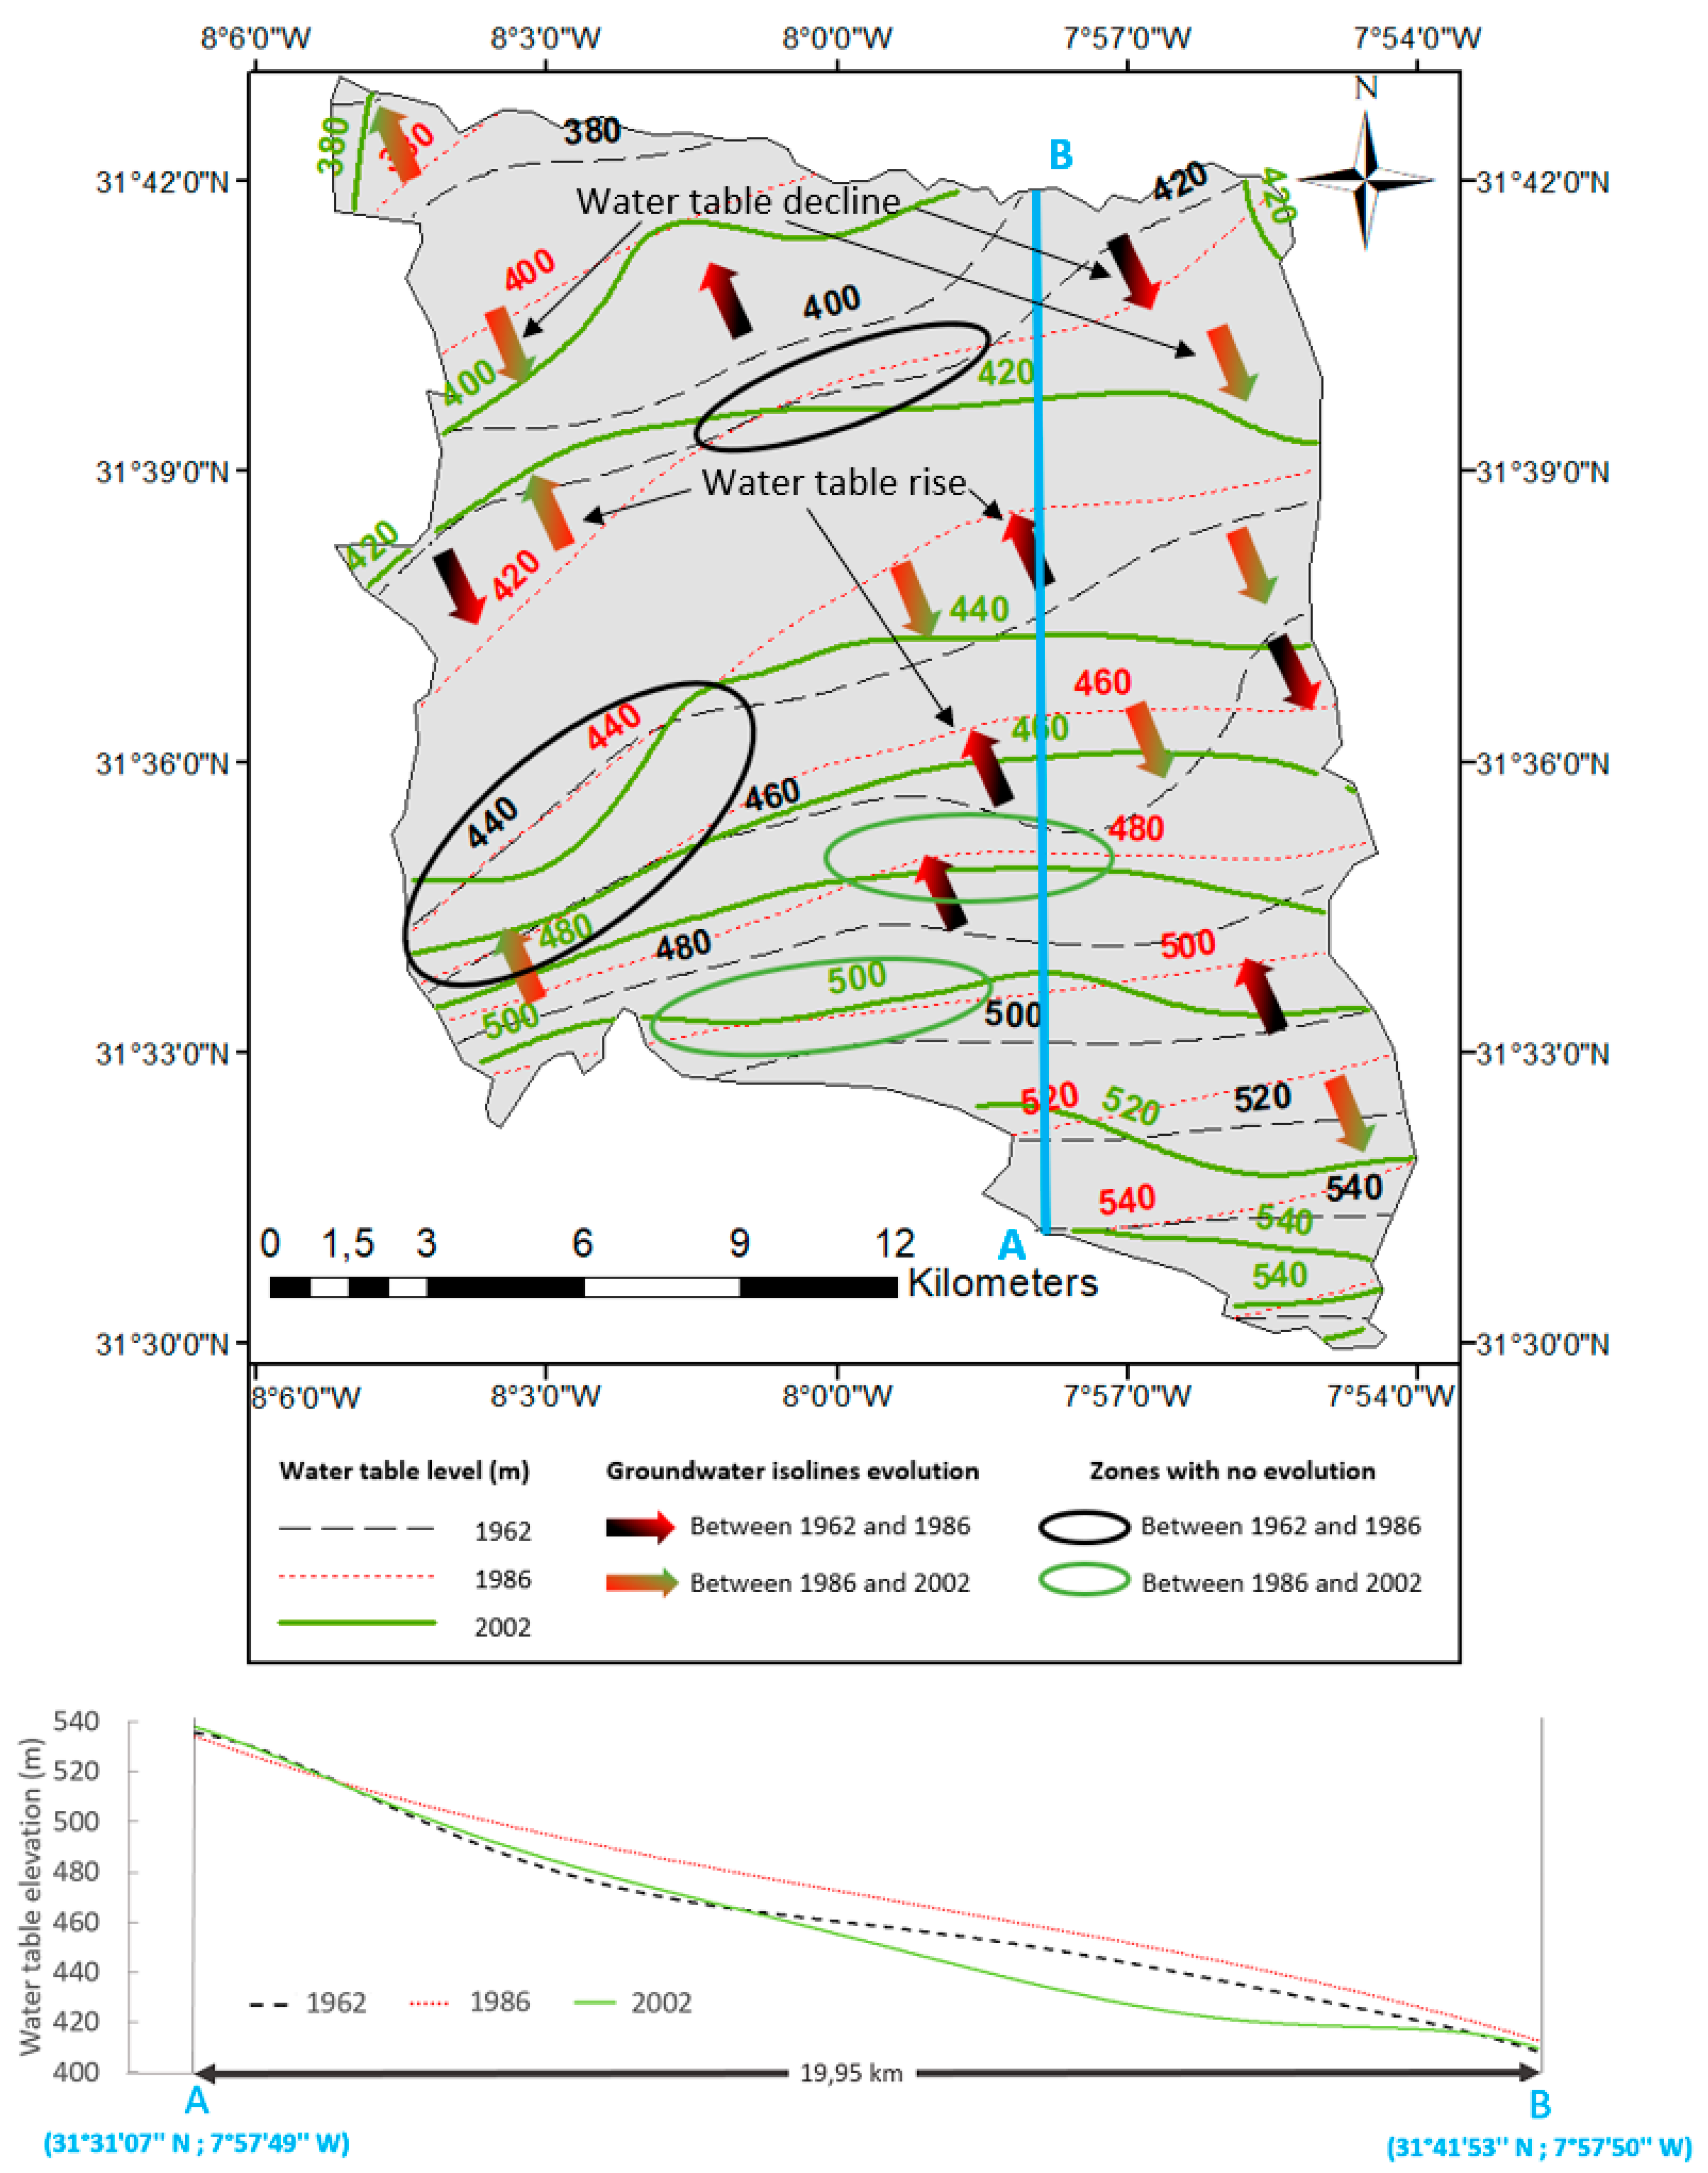
The above data were processed by digitizing the lines of equal hydrostatic heads over the study area for these 3 years (1962, 1986 and 2002). The obtained lines were then superimposed on the same map (Figure 5) in order to better visualize the evolution of the water table. The black dashed lines, the red dotted lines and the green lines indicate the groundwater level in 1962, 1986 and 2002, respectively. On this map, arrows were added to show the water table variation; black–red arrows for evolution between 1962 and 1986, and the red–green ones represent 1986–2002. As the groundwater flow is south-north, an arrow pointing to the north reflects a water table rise, where a south-arrow represents a drop of groundwater. In certain areas, there is no line movement of the same hydrostatic head between two periods, which reveals groundwater stability. In Figure 5, such zones are circled in black for 1962–1986 and in green for 1986–2002.
As shown in Figure 5, the majority of black–red arrows point to the south, while the opposite is seen for the red–green arrows. This indicates that the water table increased from 1962 up to 1986, before starting a decline between 1986 and 2002. The groundwater level remained stable both in the southwest of the study area from 1962 to 1986, and in a large part of the zone stretching from east to west between 31°33′ and 31°36′ for the period 1986–2002.
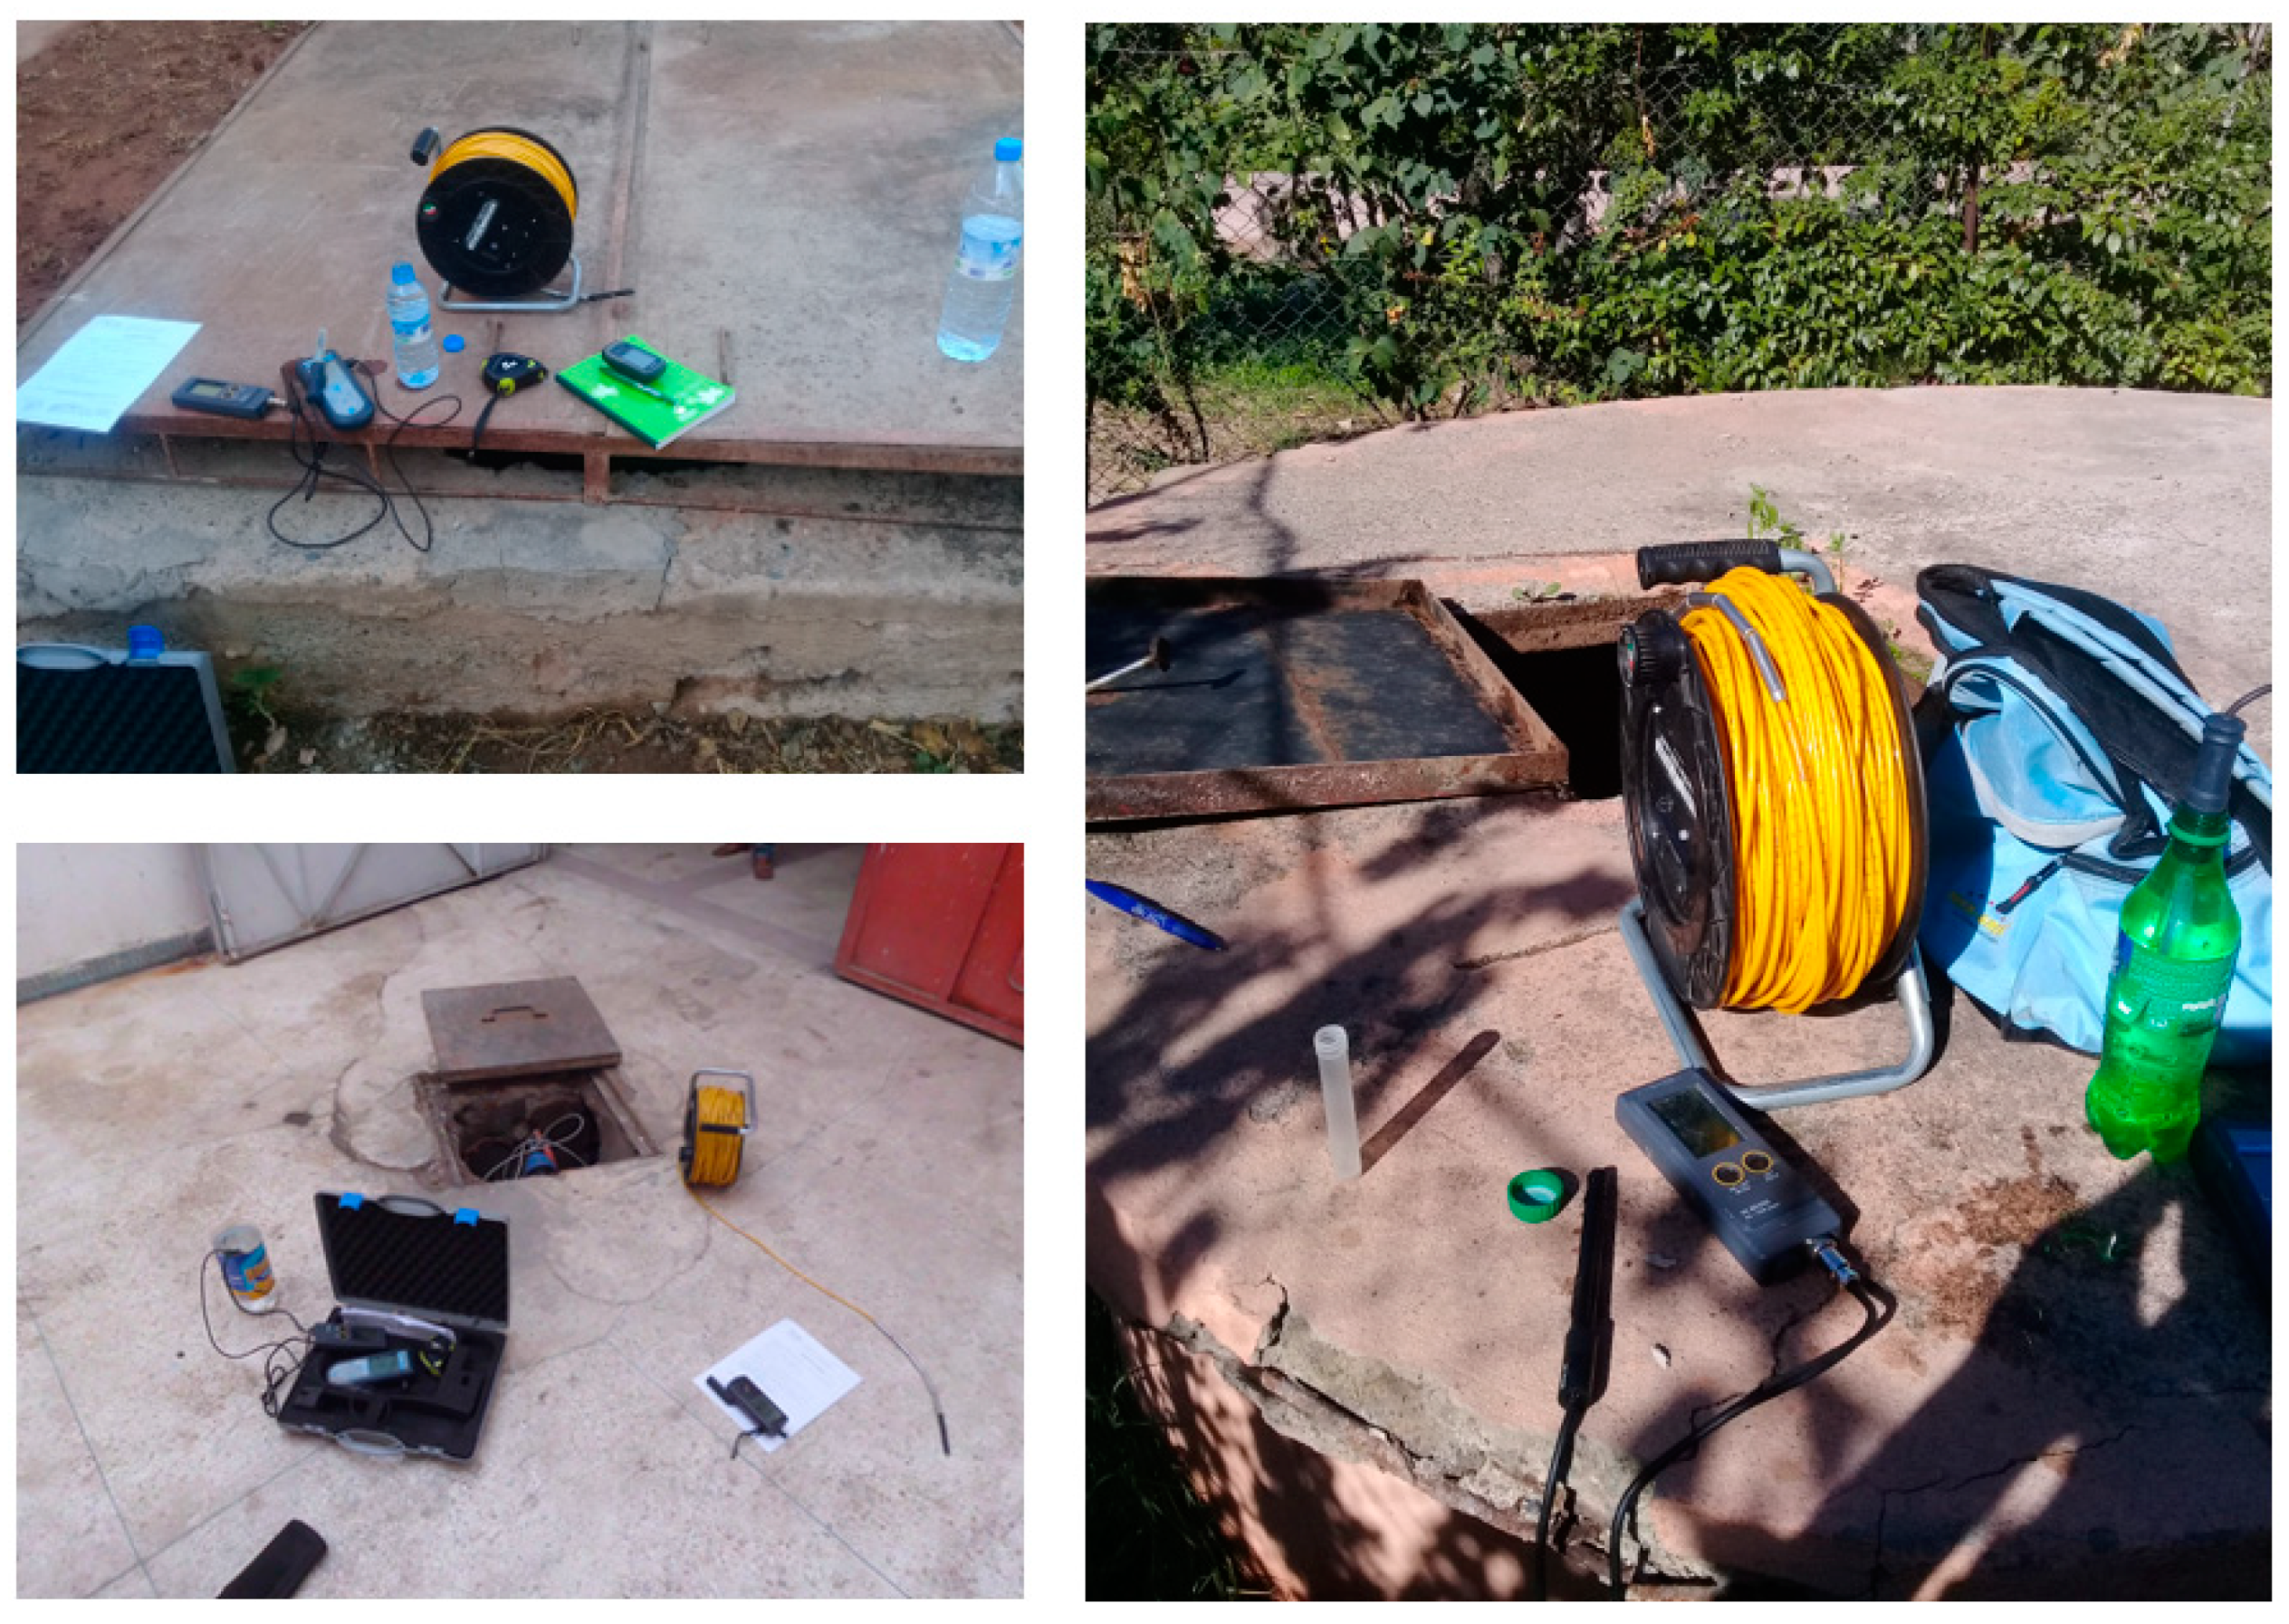
In order to analyse the current hydrodynamic behaviour of the shallow aquifer in the city of Marrakesh, a specific measurement campaign was set up in 2019 to determine the water levels in wells. The observations were made during the low-water period.
The following procedure was adopted to make these measurements:
- -
- The measurements were done with a manual piezometric probe (Figure 6).
- -
- For each observation well, a measuring point (MP) was established.
- -
- GPS, topographic map and satellite imaging were used to determine the exact location of each well (MP) and the corresponding altitude of land–surface datum (LSD).
- -
- A correction length was made if the MP was above (−) or below (+) the LSD. It should be noted here that all observation wells are vertical.
- -
- All the measurements were made by ensuring that the pumping is off for a sufficient period so as to enable the water table to regain its natural static level.
- -
- The water table level was calculated according to the following formula:
During the measurement campaign, no significant weather that could affect the ground water was reported.
3. Results
3.1. Marrakesh Water Table in 2019
There is a total of 68 measurement points, of which 48 are within the study area and 20 outside and all around. The measurements outside the studied zone are done to avoid any edge effect when interpolating data. The inspected wells are used for different purposes: watering public or house gardens, car wash and petrol pump, hammam, agricultural exploitations, slaughterhouses, wells in industrial areas, swimming pools, etc.
There are two types of wells:
- -
- Traditional hand-dug wells: the diameters of these wells lie between 1.20 and 2.90 m. Typically, these are shallow and lined with stones, concrete or brick to prevent their collapse.
- -
- Drilled wells: constructed by percussion or rotary-drilling machines, with a diameter smaller than traditional wells, not exceeding 75 cm. These wells are equipped with casing.
In the flowing figures, the groundwater level is related to elevation above sea level (expressed in meters).
The groundwater levels in these wells were used to create a map of the water table surface for 2019 (Figure 7) using universal kriging interpolation technique as it is a preferred technique of interpolation for a non-stationary variable [33,34]. The map, obtained thanks to the spatial data analysis using GIS shows that the groundwater is flowing south to north (with slight NE deviation in the north), in coherence with what is intended, from older data or broader area data.
This map also shows a remarkable pattern in the hydrodynamic behaviour of the shallow aquifer, precisely in the central part of the study area. In this sector, the hydraulic gradient decline is less marked, with a higher water level than in the areas on either side of the zone concerned.
Furthermore, the current water table isolines are positioned further south in comparison with its previous states. Only the two isolines 380 and 400 maintain their respective positions, precisely in those previously mentioned. These lines are situated on the north side of the study area.
3.2. Water Table Trend from 1962 to 2019
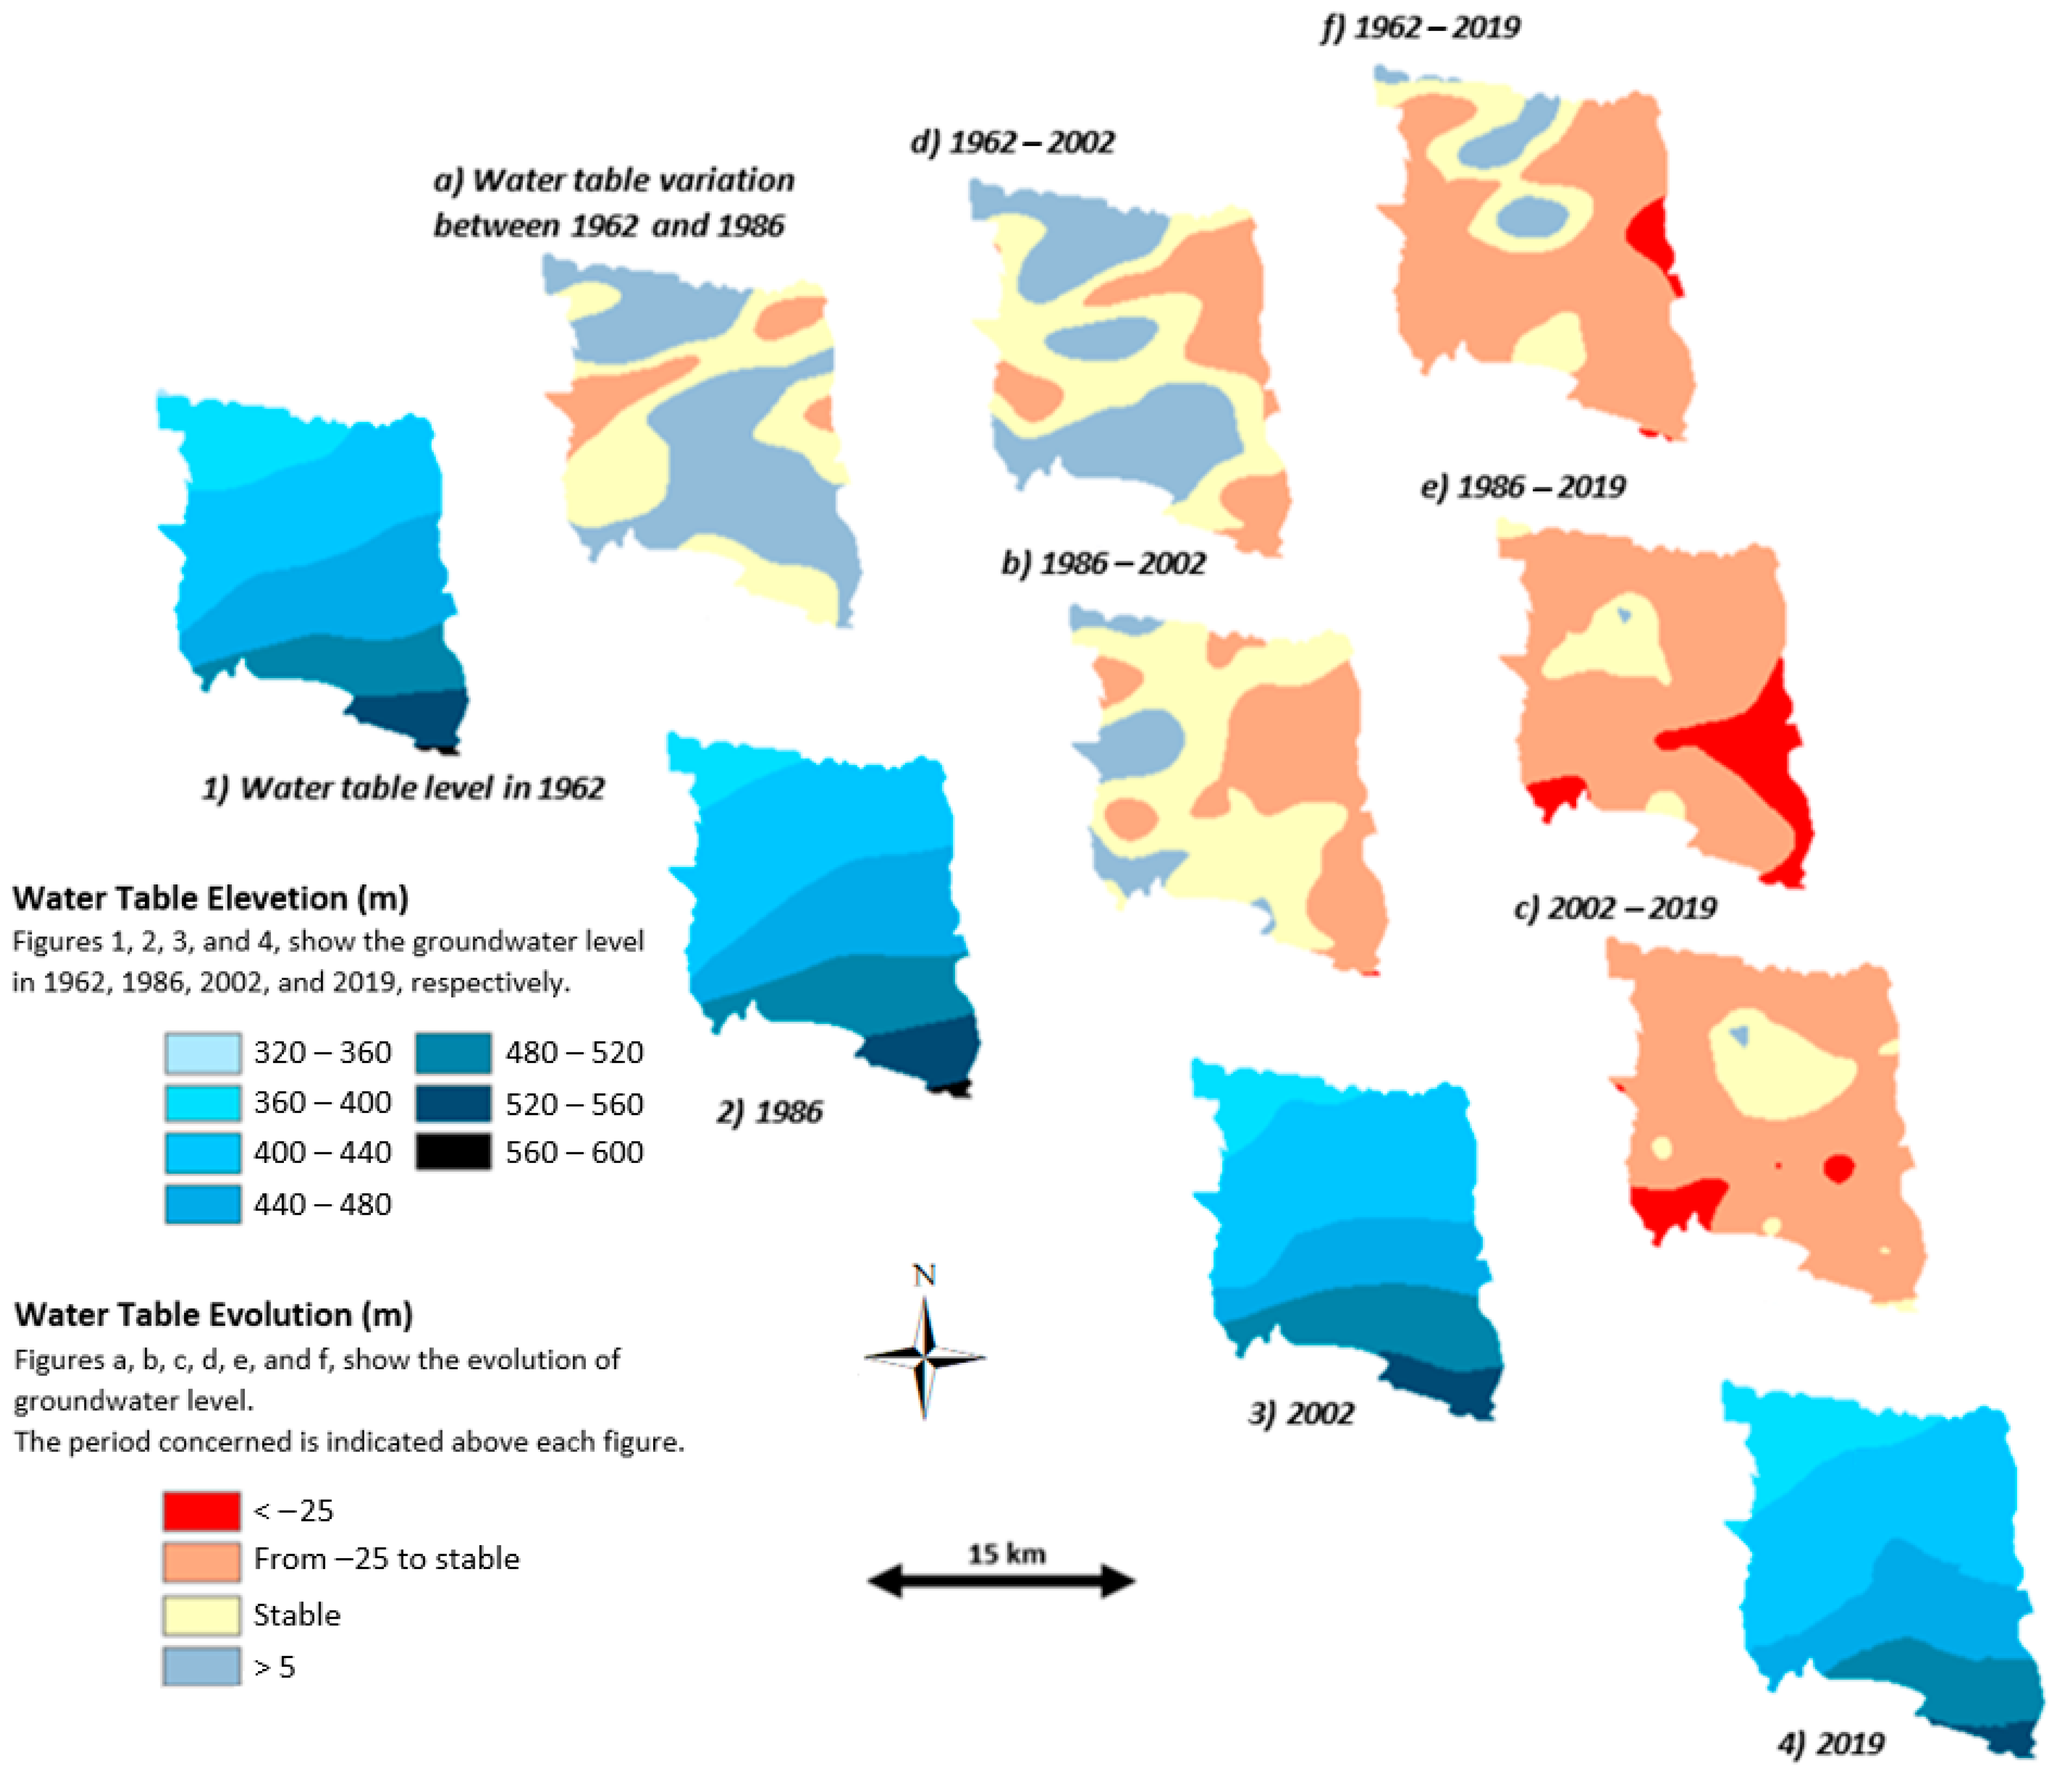
To analyse the water table variation between 1962 and 2019, several different situations are compared by subtracting older data from newer data (Figure 8). The percentage values mentioned below indicate the surface proportion of the total study area concerned by the rise, fall or stabilisation of groundwater.
The data presented relate to the low-water period. This allows a comparison without the impact of seasonal variations within the same year.
Over 24 years, from 1962 to 1986 (Figure 8a), in almost the entire study area, the water table level has risen by 0.5 m/year (54% of the scope of the study area) or remained stable (36%). Only a small portion in the north, covering 10%, is affected by a fall of the water table, with an average annual decline of 0.3 m/year.
From the mid-1980s until the early 2000s (Figure 8b), the trend changed, with an increase concerning only a limited portion (13%) of the study area. The groundwater has stabilised in half of the territory. However, the drop of the water table was more extensive (38%) and is mainly concentrated in the eastern portion.
For the whole of these two periods spanning 40 years (1962–2002), (Figure 8d), the aquifer level remained stable or rose within the three-quarters of the study area, despite a sharper and larger decline from the mid-1980s.
The drop has strengthened and broadened throughout the whole territory since the 2000s (Figure 8c). This declining tendency affected 85% of the zone in the period from 2002–2019 (−0.9 m/year). In 5% of the territory, situated mainly in the extreme SW the region, the drop outpaces 25 m, with a maximum of 37 m, which means that the water table recedes by more than two m per year. A small portion of the aquifer (13%) remained stable. Water table increase is negligible (less than 1%).
If the considered starting point is 1986, the drop is more pronounced in 2019 and covers almost 90% of the zone, while the remainder stayed at the same level (Figure 8e).
Finally, over the whole period under consideration, i.e., from 1962 to 2019 (Figure 8f), the water table dropped in a large part of the territory (71% of its extension), with a zone in the east, representing 3% of the whole area, in which the decline exceeds 25 m. The groundwater remained stable in 18% and increased in 8% of the area. These latter zones are located in the north-central part of the map.
The following Table 1 summarizes the information mentioned above.
4. Discussion
4.1. Understanding the Current Water Table Behaviour
The analysis of the groundwater level map within the study area shows an abnormal hydrodynamic behaviour of the shallow aquifer in the north-central sector. This is reflected by a water table level higher than it would be in the absence of a disturbance, which indicates that there is an additional water source supplying the aquifer.
To understand this issue, there is a need to focus on what is happening at the surface, starting with putting together both the map of groundwater level and that of the river system (Figure 9). First, it is noticed that this remarkable pattern coincides with the downstream part of Issil Wadi, which is the only river that runs through Marrakesh, in the direction of the groundwater flow, from south to north.
As described in Section 2.1, the rapid accumulation of water in the river outlet with a risk of a sudden upwelling at the entrance of the city, and into the urban area all along the river, is a phenomenon that is recurring regularly, leading to floods in many areas in Marrakesh [35]. Over the last 10 years, the neighbourhoods most impacted have been Sakar, the Wilaya, Belbekkar, Daoudiate, Nakhil and Amerchich (Figure 9).
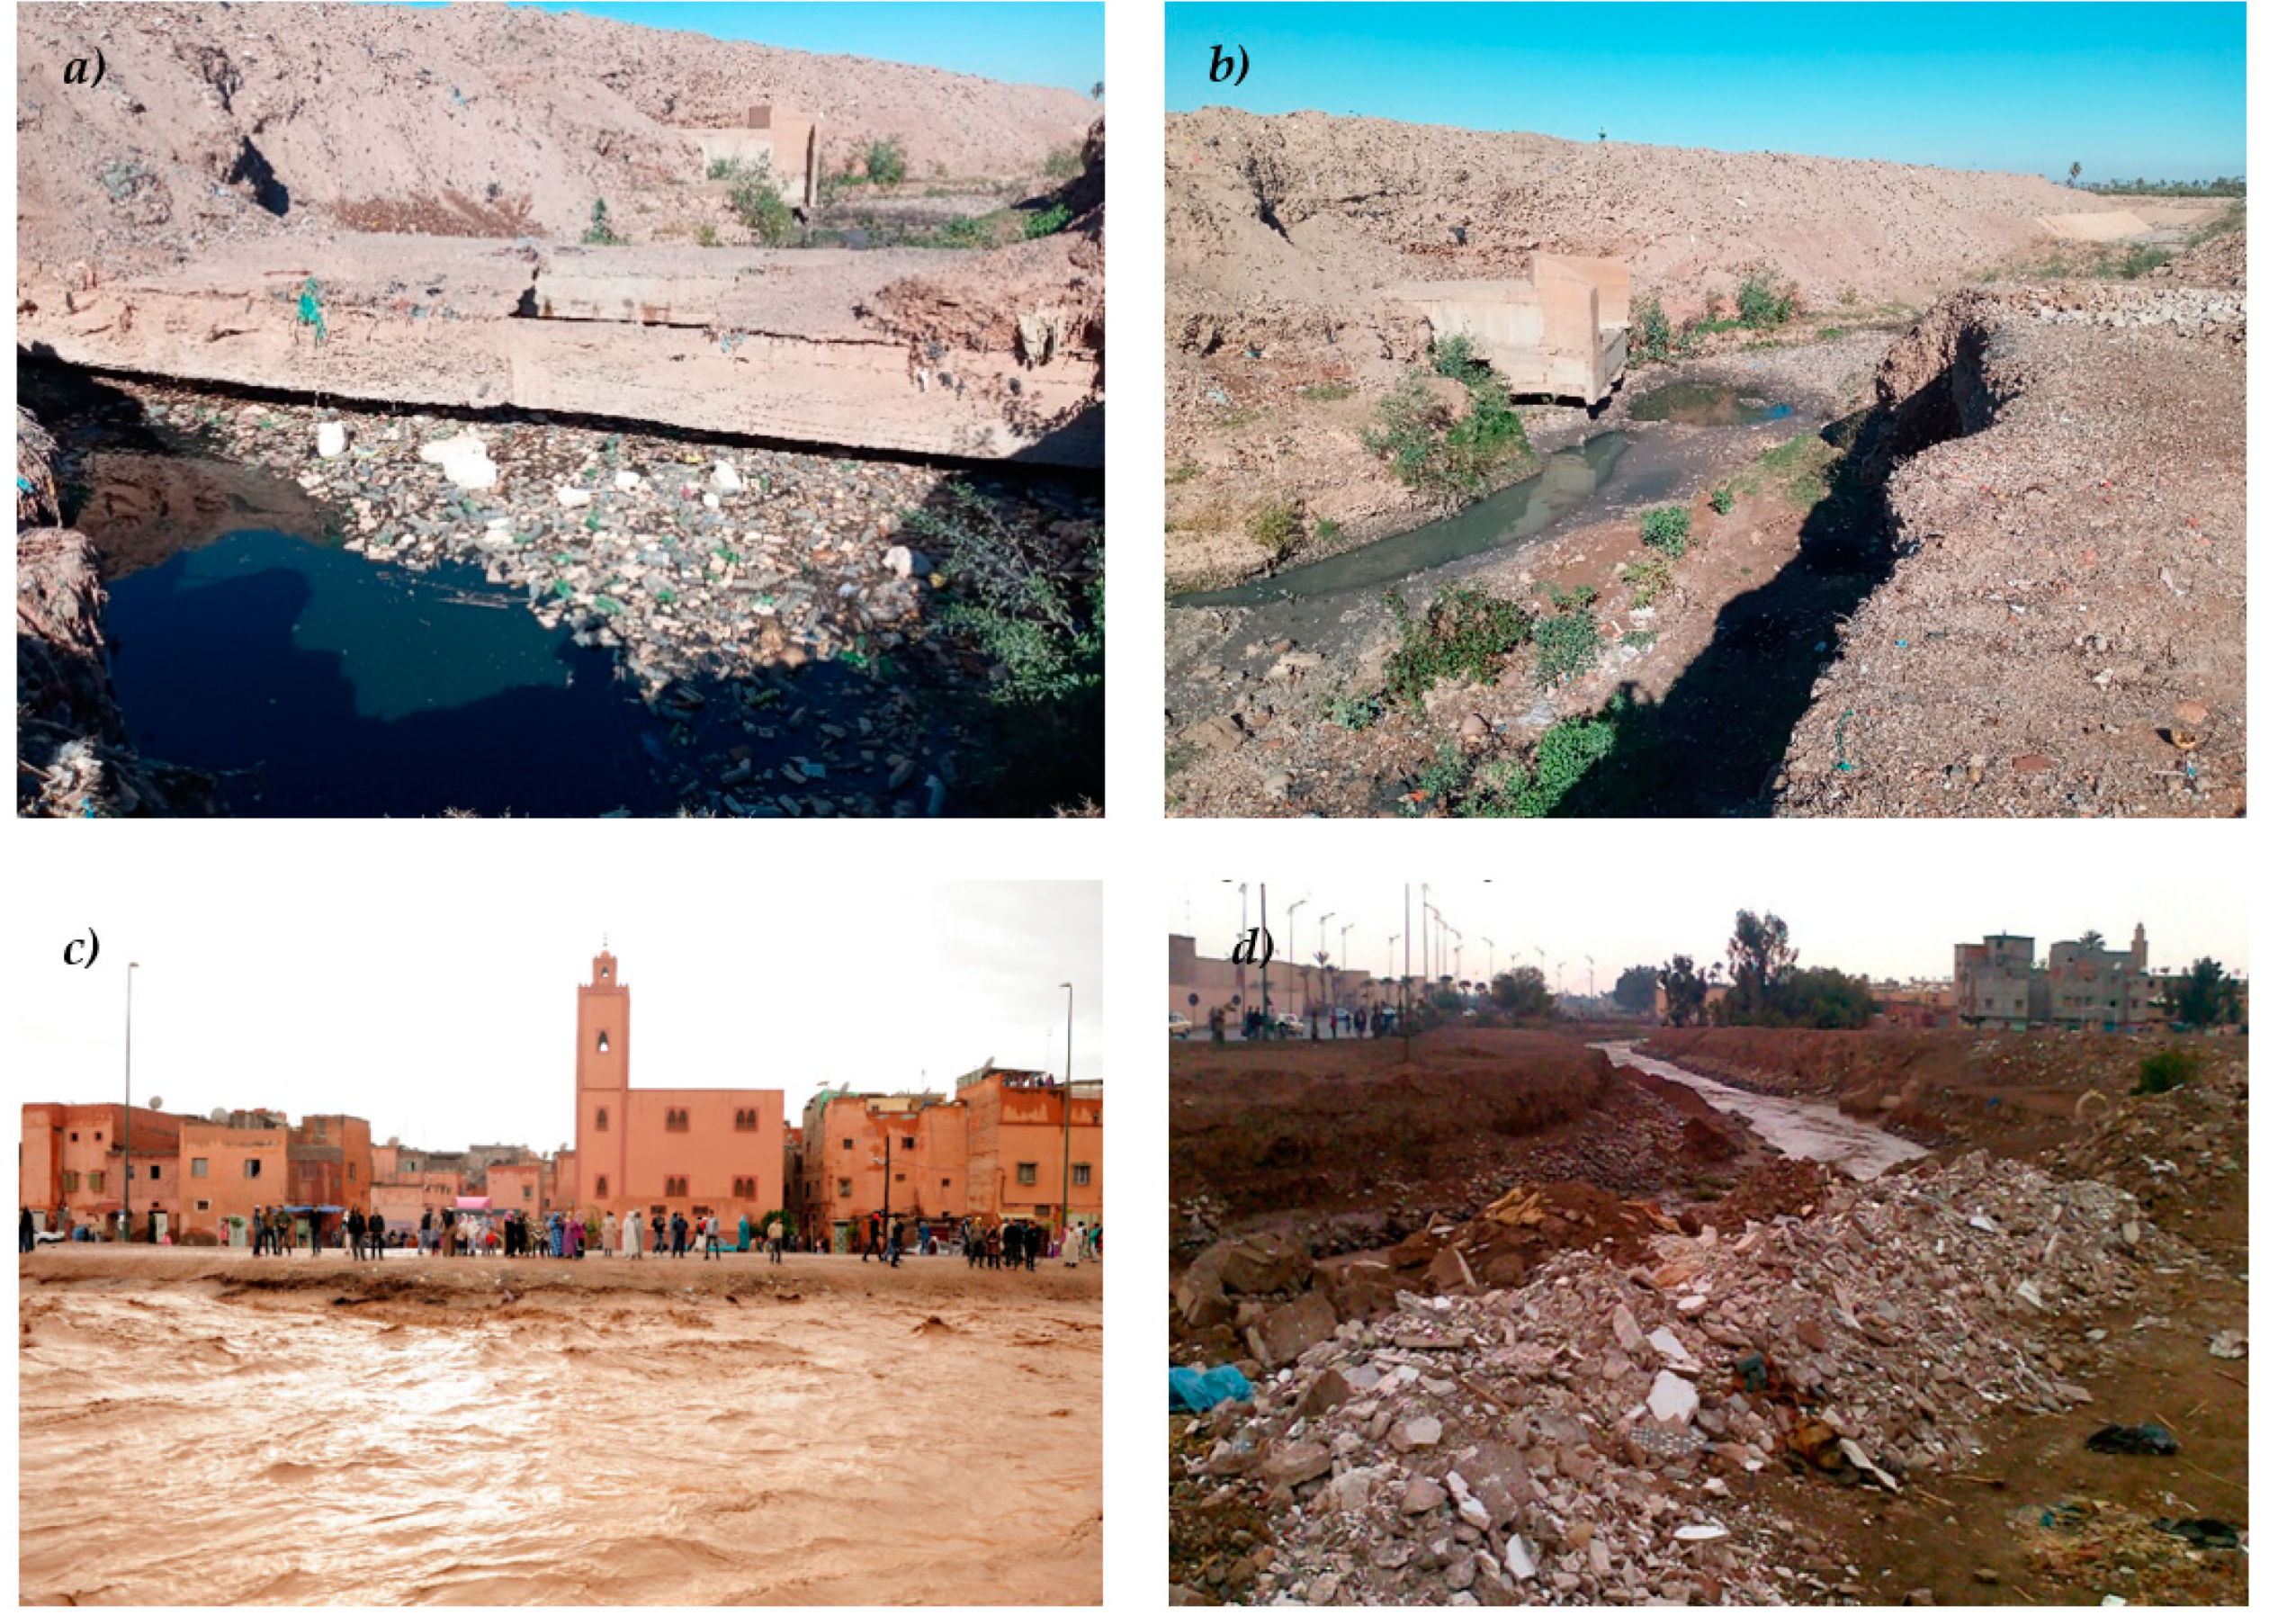
In addition, and despite increased vigilance of competent authorities, the riverbed is used—when it is dry—as a disposal area for heaps of building rubble or household waste, impacting the watercourse by reducing the surface of the flow cross-section of the river, which leads to a decrease in the water flow rate and a higher overflow risk. This situation of water flow reduction is further reinforced by the small spaces in some infrastructures (Figure 10).
Furthermore, in the upstream of the designated area, on the west side of Ourika Road, and in the Agdal Gardens and Menara Gardens, there is an agriculture zone (fruit and olive trees, cereals) but also many gardens where the irrigation is performed by seguias systems and retention basins. In both cases, the water is supplied directly from the high mountain. In these irrigated areas, the return of water via infiltration into soil participates in the groundwater recharge. A return rate of 20% is allocated for the gravity irrigated surfaces and 10% for seguias dug in the land.
4.2. The Water Table Decline, a General Trend
Despite the aquifer recharge from surface water provided by the Issil River and the infiltration of irrigation water, there is a general decline in the water table, particularly in the period after 1986. This reflects a regional phenomenon in the Haouz Plain, where the quantity of groundwater has continued to fall during the last decades, mostly due to some human exploitation that results in consuming large amounts of groundwater, such as intensive agricultural uses and some leisure practices, such as golf courses, waterparks and pools.
The water table fluctuations over the period of study, as described above (Section 3.2), involve increases and decreases in available groundwater volumes, which have been calculated by taking into account the quantitative hydrodynamic characteristics of the aquifer and the water table evolution over each period.
The following Table 2 provides the results obtained.
In 1962, the total volume of water available was 331 Mm3.
The rise of the water table level between 1962 and 1986, which affected 54% of the study area, is reflected by a water volume increase from 331 to 392 Mm3 (+18%).
The period 1986–2002, in which the groundwater level table remained stable in about half of the studied territory (13% of rise and 38% of decline), saw a slight drop of 39 Mm3 (from 392 to 353 Mm3: −9.9%).
During the period 2002–2019, marked by a general decline of the water table (85% of the study area), the groundwater quantity decreased by 146 Mm3 from 353 to 207 Mm3, representing a decrease of 41.3%.
In 2019, the total volume of groundwater remaining available in the shallow aquifer was 207 Mm3.
5. Conclusions
This work, based on old hydrological data that began in 1962 and recent data collected from the field in 2019, provides an update of the hydrodynamic trend of the shallow aquifer. The comparison of the present situation with the older data, corresponding respectively to the years 1962, 1986 and 2002, shows a generalized lowering of the water table level in the fieldwork area, which covers the city of Marrakesh and its close perimeter. This decline was observed in 73% of the territory. However, this study shows that the groundwater levels did not progressively and consistently fall over the reference period from 1962–2019.
Indeed, by dividing that period into three segments, 1962–1986, 1986–2002 and 2002–2019, it has been established that the decline occurred mainly in the recent period, which is marked by the highest recorded temperatures and decreased precipitation. Since 2002, groundwater levels have dropped by an average of −0.9 m per year in 80% of the territory studied. The most affected area experienced a drop of 37 m (more than 2 m per year). During this period (2002–2019), there was an area coinciding with the Issil River where the groundwater level remained stable. More particularly, the areas which have been impacted by the floods of this river over the past 20 years are the best supplied.
In contrast, the period from 1962–1986, when temperatures were lower and precipitation higher than average, saw an increase in groundwater levels in half of the study area. Groundwater recession was only observed in a limited portion, not exceeding 10%.
This decline of groundwater in the urban perimeter of Marrakesh is consistent with the global phenomenon experienced by the Haouz Plain more generally, due to intensive exploitation of the groundwater from different causes (leisure activities, intense irrigation, etc.), as well as to the hot semi-arid climate that is characteristic of the region, worsened by a prolonged drought.
In terms of the volume of groundwater available in the shallow aquifer, this has fallen from 331 Mm3 in 1962 to 207 Mm3 in 2019. More specifically, over the most critical period (2002–2019), groundwater resources have declined by an average of 8.5 Mm3 per year, reducing the available quantity from 353 Mm3 to 207 Mm3, which represents a decrease of 41% in only 17 years. If this trend continues, the aquifer is at risk of exhaustion in less than 25 years. However, the future development could be worse, because on the one hand, precipitation is on a downward trend, and the temperatures have increased over the last 60 years, and on the other hand, projects, such as new golf courses and agriculture exploitations, requiring large quantities of water, continue to be planned in the study area, especially in the most affected areas, where the level has dropped by more than 30 m over the past 2 to 3 decades.
If such a striking phenomenon continues in the years to come, it will certainly lead to the complete depletion of groundwater resources, which would be ultimately devastating to the city, its population and the economic activity in the entire region.
Author Contributions
Data curation, M.A.; Formal analysis, M.A.; Investigation, M.A.; Methodology, M.A. and N.-E.L.; Validation, N.-E.L.; Writing—original draft, M.A.; Writing—review & editing, M.A. and N.-E.L. All authors have read and agreed to the published version of the manuscript.
Funding
This research received no external funding.
Institutional Review Board Statement
Not applicable.
Informed Consent Statement
Not applicable.
Data Availability Statement
The data that support the findings of this study are available from the corresponding author upon reasonable request.
Acknowledgments
The authors would like to express their sincere gratitude to Bouzekri Draiouiy for the English editing, and to the unidentified reviewers and editors for their generous efforts in reviewing and improving the manuscript.
Conflicts of Interest
The authors declare no conflict of interest.
References
- Lachir, A.; Bounoua, L.; Zhang, P.; Thome, T.; Messouli, M. Modeling the Urban Impact on Semiarid Surface Climate: A Case Study in Marrakesh, Morocco. Can. J. Remote Sens. 2016, 42, 379–395. [Google Scholar] [CrossRef]
- Bigio, A.G. The Sustainability of Urban Heritage Preservation. The Case of Marrakesh. In Inter-American Development Bank; 1300 New York Ave. NW: Washington, DC., USA, 2010. [Google Scholar]
- Nakhli, A. La Mobilité Urbaine à Marrakech: Enjeux et Perspectives. Ph.D. Thesis, Université Bordeaux Montaigne, Bordeaux, France, 2015. [Google Scholar]
- Colsado, E. Étalement Urbain et Opérations Immobilières Périurbaines Pour Classes Moyennes à Marrakech: Production, Peuplement et Modes D’habiter. Ph.D. Thesis, Université François-Rabelais, Tours, France, 2015. [Google Scholar]
- Bolzman, C.; Fokkema, T.; Guissé, I.; DalenStarting, D.V. Starting a new life in the South? Swiss, Dutch and Flemish ageing in Morocco: A lifecourse perspective. Ageing Soc. 2021, 41, 1240–1266. [Google Scholar] [CrossRef]
- Twil, A.; Bidan, M.; Bencharef, O.; Kaloun, S.; Safaa, L. Exploring destination’s negative e-reputation using aspect based sentiment analysis approach: Case of Marrakesh destination on TripAdvisor. Tour. Manag. Perspect. 2021, 40, 100892. [Google Scholar]
- Lghoul, M.; Kchikach, A.; Hakkou, R.; Zouhri, L.; Guerin, R.; Bendjoudi, H.; Teíxido, T.; Penã, J.A.; Enriqué, L.; Jaffal, M.; et al. Etude géophysique et hydrogéologique du site minier abandonné de Kettara (région de Marrakech, Maroc): Contribution au projet de rehabilitation. Hydrol. Sci. J. 2012, 57, 370–381. [Google Scholar] [CrossRef] [Green Version]
- Kahime, K.; Ben Salem, A.; El Hidan, A.; Messouli, M.; Chakhchar, A. Vulnerability and Adaptation Strategies to Climate Change on Water Resources and Agriculture in Morocco: Focus on Marrakesh-Tensift-Al Haouz Region. Int. J. Agric. Environ. Res. 2018, 4, 58–77. [Google Scholar]
- Hssaisoune, M.; Bouchaou, L.; Sifeddine, A.; Bouimetarhan, I.; Chehbouni, A. Moroccan Groundwater Resources and Evolution with Global Climate Changes. Geosciences 2020, 10, 81. [Google Scholar] [CrossRef] [Green Version]
- Choukrani, G.; Hamimsa, A.; Saidi, M.; Babqiqi, A. Diagnosis and Future Projection of Climate Change in Arid Zone. Case of Marrakesh-Safi Region (Morocco). LARHYSS J. 2018, 36, 49–63. [Google Scholar]
- Burke, J.J. Groundwater for irrigation: Productivity gains and the need to manage hydro-environmental risk. In Intensive Use of Groundwater—Challenges and Opportunities; Swets & Zeitlinger B.V.: Lisse, The Netherlands, 2002; pp. 59–91. [Google Scholar]
- Noori, R.; Maghrebi, M.; Mirchi, A.; Tang, Q.; Bhattarai, R.; Sadegh, M.; Noury, M.; Torabi Haghigh, A.; Kløve, B.; Madani, K. Anthropogenic depletion of Iran’s aquifers. Proc. Natl. Acad. Sci. USA 2021, 118, e2024221118. [Google Scholar] [CrossRef]
- Barzkar, A.; Najafzadeh, M.; Homaei, F. Evaluation of Drought Events in Various Climatic Conditions using Data-Driven Models and A Reliability-Based Probabilistic Model. Nat. Hazards 2021. [Google Scholar] [CrossRef]
- Saddou, H. Tourisme à Marrakech: Impacts économiques, socioculturels et environnementaux éminents. Espace Géographique Société Maroc. 2009, 28/29, 221–251. [Google Scholar]
- Belkouadssi, M. Gestion intégrée des eaux urbaines de la ville de Marrakech. In Proceedings of the Center of Mediterranean Integration Conference, Marseille, France, 9 January 2017. [Google Scholar]
- Ruf, T.; Kleiche-Dray, M. Les eaux d’irrigation du Haouz de Marrakech: Un siècle de confrontations des modèles de gestion publics, privés et communautaires. EchoGéo 2018, 43, 1–42. [Google Scholar] [CrossRef] [Green Version]
- Abourida, A.; Simonneaux, V.; Errouane, S.; Berjami, B.; Sghir, F. Estimation des volumes d’eau pompés dans la nappe pour l’irrigation (plaine du Haouz, Marrakech, Maroc). Comparaison d’une méthode statistique et d’une méthode basée sur l’utilisation de la télédétection. Rev. Sci. L’Eau 2009, 22, 1–13. [Google Scholar]
- El Fadeli, S.; Bouhouch, R.R.; Benmazhar, H.; Barkouch, Y.; Zimmermann, M.B.; Sedki, A. Characterization of physico-chemical and mineralogical quality of drinking water from four areas of the city of Marrakesh, Morocco. J. Mater. Environ. Sci. 2015, 6, 2437–2445. [Google Scholar]
- Hakkou, R.; Wahbi, M.; Bachnou, A.; Elamari, K.; Hanich, L.; Hibti, M. Impact of Marrakesh (Morocco) municipal landfill on water resources. J. Mater. Environ. Sci. 2001, 60, 325–336. [Google Scholar]
- Lyakhloufi, S.; Ouazzani, N.; Er Rouane, S.; Hassani, L.; El Hebil, A. Impact de l’utilisation des eaux usées urbaines brutes sur la qualité de l’eau d’une nappe alluviale près de Marrakech (Maroc). Bull. Soc. Hist. Nat. 1999, 135, 59–70. [Google Scholar]
- Moumou, A. Contribution à L’étude de Fonctionnement d’une Décharge, Approche de Caractérisation Sur Volume du Comportement Hydraulique et Physico-Chimique d’un Déchet Type et Essai de Simulation. Ph.D. Thesis, Fac. Sc., Cadi Ayyad University, Marrakesh, Morocco, 1997. [Google Scholar]
- Choua, S.; Boussaa, S.; El Gharmali, A.; Boumezzough, A. Impact of irrigation with wastewater on accumulation of heavy metals in soil and crops in the region of Marrakesh in Morocco. J. Saudi Soc. Agric. Sci. 2019, 18, 429–436. [Google Scholar]
- Boukhoubza, F.; Ait Boughrous, A.; Yacoubi-Khebiza, M.; Jail, A.; Hassani, L.; Idrissi, L.; Nejmeddine, A. Impact of olive oil wastewater on the physicochemical and biological quality of groundwater in the Haouz plain, south of Marrakesh (Morocco). Environ. Technol. 2008, 29, 959–974. [Google Scholar] [CrossRef] [PubMed]
- Lyakhloufi, S. Vulnérabilité et Risque de Pollution de la Nappe Phréatique du Haouz de Marrakech. Ph.D. Thesis, Fac. Sc., Cadi Ayyad University, Marrakesh, Morocco, 2001. [Google Scholar]
- Fakir, Y.; Limam, N. Quantitative groundwater zoning of the Haouz aquifer (Morocco). In Proceedings of the Seventeenth International Water Technology Conference, IWTC17. Istanbul, Turkey, 5–7 November 2013. [Google Scholar]
- Abourida, A.; Errouane, S.; Leduc, C.; Chehbouni, G. Impact de la modernisation agricole sur l’évolution piézométrique de la nappe phréatique du Haouz (Maroc central). In Proceedings of the Séminaire sur la Modernisation de L’agriculture Irriguée, Rabat, Morocco, 19–23 April 2004. [Google Scholar]
- Morris, B.L.; Lawrence, A.R.L.; Chilton, P.J.C.; Adams, B.; Calow, R.C.; Klinck, B.A. Groundwater and Its Susceptibility to Degradation: A Global Assessment of the Problem and Options for Management; Early Warning and Assessment Report Series, RS. 03-3; United Nations Environment Programme: Nairobi, Kenya, 2003. [Google Scholar]
- Sinan, M.; Moumtaz, R. An extension to the DRASTIC model to assess groundwater vulnerability to pollution: Application to the Haouz aquifer of Marrakesh (Morocco). Environ. Geol. 2009, 57, 349–363. [Google Scholar] [CrossRef]
- Ferrandini, J.; Ferrandini, M. Evidence of Lias and middle Jurassic of the northern High-Atlas of Marrakesh (Morocco). Paleogeographical History. C. R. L Acad. Sci. Ser. II 1984, 299, 351–356. [Google Scholar]
- Ferrandini, J.; Le Marrec, A. The Jurassic to Paleogene cover of the High Atlas of Marrakesh is allochthonous in the “zone des cuvettes” of Ait Ourir (Maroc). C. R. L Acad. Sci. Ser. II 1982, 295, 813–816. [Google Scholar]
- Sinan, M. Méthodologie D’identification, D’évaluation et de Protection des Ressources en Eau des Aquifères Régionaux par Couplage des SIG, de la Géophysique et de la Géostatistique Application à L’aquifère du Haouz de Marrakech (Maroc). Ph.D. Thesis, Ecole Mohammadia d’Ingénieurs, Rabat, Morocco, 2000. [Google Scholar]
- Ait El Mekki, O.; Laftouhi, N.-E. Combination of a geographical information system and remote sensing data to map groundwater recharge potential in arid to semi-arid areas: The Haouz Plain, Morocco. Earth Sci. Inform. 2006, 9, 465–479. [Google Scholar] [CrossRef]
- Kumar, V. Optimal contour mapping of groundwater levels using universal kriging—A case study. Hydrol. Sci. J. 2007, 52, 1038–1050. [Google Scholar] [CrossRef]
- Kaur, S.; Aggarwal, R.; Soni, A. Study of water-table behaviour for the Indian Punjab using GIS. Water Sci. Technol. 2011, 63, 1574–1781. [Google Scholar] [CrossRef] [PubMed]
- Saidi, M.E.; Bouloumou, Y.; Ed-Daoudi, S.; Aresmouk, M.E. Les crues de l’oued Issil en amont de Marrakech (Maroc), un risque naturel recurrent—The floods of the Wadi Issil upstream of Marrakesh (Morocco), a recurring natural hazard. Eur. Sci. J. 2013, 9, 189–208. [Google Scholar]
Figure 1.
(a) Topography of the Haouz Plain and location of the study area. (b) Satellite image of the study area.
Figure 1.
(a) Topography of the Haouz Plain and location of the study area. (b) Satellite image of the study area.

Figure 2.
Lithological facies of the saturated zone of the Haouz aquifer; 1 Coarse alluvia (pebbles, gravels, sands); 2 heterogeneous alluvia (pebbles, gravels, sands, clays, marls); 3 alluvia with calcareous intercalations; 4 conglomerates [28].
Figure 2.
Lithological facies of the saturated zone of the Haouz aquifer; 1 Coarse alluvia (pebbles, gravels, sands); 2 heterogeneous alluvia (pebbles, gravels, sands, clays, marls); 3 alluvia with calcareous intercalations; 4 conglomerates [28].

Figure 3.
Annual average and extreme (averaged maximum and minimum temperatures) temperature values (a), temperature anomalies (b) and annual rainfall (c) for the period 1960–2020 in Marakech-Marrakesh (31°37′12″ N; 8°1′48″ W).
Figure 3.
Annual average and extreme (averaged maximum and minimum temperatures) temperature values (a), temperature anomalies (b) and annual rainfall (c) for the period 1960–2020 in Marakech-Marrakesh (31°37′12″ N; 8°1′48″ W).

Figure 4.
Original maps of groundwater level in the Haouz Plain for the years (a) 1986 and (b) 2002. Points indicate observation wells-ABHT.
Figure 4.
Original maps of groundwater level in the Haouz Plain for the years (a) 1986 and (b) 2002. Points indicate observation wells-ABHT.

Figure 5.
Water table trend in 1962, 1986 and 2002 and cross-section (N-S) indicating the average groundwater table.
Figure 5.
Water table trend in 1962, 1986 and 2002 and cross-section (N-S) indicating the average groundwater table.

Figure 6.
Example of wells prospected and equipment used for groundwater level survey.

Figure 7.
Trend of the water table in 2019. Points indicate sampling wells (box at the lower left); arrows indicate flow direction.
Figure 7.
Trend of the water table in 2019. Points indicate sampling wells (box at the lower left); arrows indicate flow direction.

Figure 8.
Fluctuation of groundwater level between 1962 and 2019.

Figure 9.
Synthetic map of the fluctuation of groundwater between 1986 and 2019. Areas a and b represent gardens. Areas c, d, e, f and g are flood-affected zones.
Figure 9.
Synthetic map of the fluctuation of groundwater between 1986 and 2019. Areas a and b represent gardens. Areas c, d, e, f and g are flood-affected zones.

Figure 10.
Photos of Issil River: (a,b) infrastructures and waste causing water retention; (c) Issil River during a peak flow (euneighbours.eu); (d) clandestine waste disposal along the Issil River (ABHT).
Figure 10.
Photos of Issil River: (a,b) infrastructures and waste causing water retention; (c) Issil River during a peak flow (euneighbours.eu); (d) clandestine waste disposal along the Issil River (ABHT).


Table 1.
Percentage of area concerned by decline, stabilisation or increase of water table between 1962 and 2019.
Table 1.
Percentage of area concerned by decline, stabilisation or increase of water table between 1962 and 2019.
 |
Table 2.
Groundwater volume variations in the study area.
 |
Publisher’s Note: MDPI stays neutral with regard to jurisdictional claims in published maps and institutional affiliations. |
© 2021 by the authors. Licensee MDPI, Basel, Switzerland. This article is an open access article distributed under the terms and conditions of the Creative Commons Attribution (CC BY) license (https://creativecommons.org/licenses/by/4.0/).
Share and Cite
MDPI and ACS Style
Analy, M.; Laftouhi, N.-E. Groundwater Depletion in an Urban Environment under Semiarid Climate and Persistent Drought–City of Marrakesh (Morocco). Water 2021, 13, 3253. https://doi.org/10.3390/w13223253
AMA Style
Analy M, Laftouhi N-E. Groundwater Depletion in an Urban Environment under Semiarid Climate and Persistent Drought–City of Marrakesh (Morocco). Water. 2021; 13(22):3253. https://doi.org/10.3390/w13223253
Chicago/Turabian StyleAnaly, Mohammed, and Nour-Eddine Laftouhi. 2021. "Groundwater Depletion in an Urban Environment under Semiarid Climate and Persistent Drought–City of Marrakesh (Morocco)" Water 13, no. 22: 3253. https://doi.org/10.3390/w13223253
Note that from the first issue of 2016, this journal uses article numbers instead of page numbers. See further details here.