
The Catastrophe of the Niedów Dam—The Causes of the Dam’s Breach, Its Development, and Consequences


1
Faculty of Civil Engineering, Wrocław University of Science and Technology, 50-370 Wrocław, Poland
2
Institute of Meteorology and Water Management—National Research Institute, 01-673 Warszawa, Poland
*
Author to whom correspondence should be addressed.
Water 2021, 13(22), 3254; https://doi.org/10.3390/w13223254
Submission received: 11 October 2021
/
Revised: 5 November 2021
/
Accepted: 14 November 2021
/
Published: 17 November 2021
(This article belongs to the Section Hydraulics and Hydrodynamics)
Abstract
:Due to extreme rainfall in 2010 in the Lusatian Neisse River catchment area (in Poland), a flood event with a return period of over 100 years occurred, leading to the failure of the Niedów dam. The earth-type dam constructed for cooling the Turów power plant was washed away, resulting in the rapid release of nearly 8.5 million m3 of water and the flooding of the downstream area with substantial material losses. Here we analyze the conditions and causes of the dam’s failure, with special attention given to the mechanism and dynamics of the compound breaching process, in which the dam’s upstream slope reinforcement played a specific and remarkable role. The paper also describes a numerical approach for simulating a combined flood event downstream from the dam with the use of a two-dimensional hydrodynamic model (MIKE21). Considering the specific local conditions, i.e., wide floodplain, meandering character of the main channel, embankment overtopping, and available data set, an iterative solution of the unsteady state problem is proposed. This approach enables realistic flood propagation estimates to be delivered, the dam breach outflow to be reconstructed, and several important answers concerning the consequences of the dam’s failure to be provided. Finally, the paper presents the reconstruction of the dam that is more resilient to extreme hydrological conditions under changing climate.
1. Introduction
The number of dams for storing and supplying water is increasing worldwide due to the growing demand from towns, agriculture, industry, or power generation. Dams also play an important role in reducing the risk of flooding. Apart from the substantial benefits to society provided by dams, there is also an inherent and growing risk of dam failure. This results in flooding that can cause serious material and environmental damage and loss of life. The failure of a dam could have occurred due to technical faults during the design and construction stages, the aging of the structure, miss-operation, and climate change that resulted in the altering of meteorological and hydrological patterns [1,2,3]. The International Commission on Large Dams (https://www.icoldchile.cl/boletines, accessed on 15 October 2021) [4,5], later referred to as Commission, has reported 176 failures among the 17,406 registered dams in the world. According to the Commission, the failure rate for embankment dams is higher than for concrete dams. It also revealed, in the case of embankment dams, that overtopping failure is the most common cause of failure when compared with other types of failures, such as piping and slope failure. Analysis of the dams’ failure plays a key role in understanding the mechanisms of such disasters [6]. This, in turn, enables more accurate methods of forecasting failures, as well as ways to prevent them, to be developed. These actions are also a great help for administration bodies when preparing flood hazard maps and contingency plans, which allow for a quick and effective response to disasters [7]. However, obtaining detailed data on the course of such an event is difficult, because on the one hand, the activities of the services in a hazardous situation come down to protecting people and valuable areas against a flood wave, and on the other hand, disasters occur unexpectedly and under the conditions of limited monitoring. Therefore, the analysis of the dynamics of a disaster and the development of a breach, as well as the preparation of the hydrograph of the outflow, are performed after the flood on the basis of often uncertain or scarce data. However, due to the importance of this issue, efforts are made to recreate these events and expand the existing database of the descriptions of the causes and effects of recent disasters [7,8,9], as well as those that occurred a long time ago, including those from the first half of the last century [10,11].
The key data for assessing the consequences of dam failure in terms of the downstream inundation time, depth of flooding, and extent of possible damage, is the outflow hydrograph. The hydrograph’s shape, volume, and peak outflow depend on the evolution of the dam break, the height of the dam, and the reservoir storage volume. Using regression formulas, e.g., [12,13,14,15], the evolution of a dam breach can be assessed relatively easily and correctly, but only for simple cases, i.e., dams made of homogeneous soil. However, earth dam structures are typically more complex and consist of a number of different material layers. They are equipped with sealing cores, drainage facilities, and wave protectors and can even have a paved road on the top. Therefore, forecasting a breach in a dam is much more complicated, and in most practical applications, various simplifications and approximations are used [16].
Another approach of calculating dam failure parameters involves numerical methods that use equations of fluid motion (such as Navier–Stokes or Saint–Venant equations) coupled with erosion extensions for the dam’s body (e.g., dam break module in MIKE11, [17]). The main advantage of these methods is the more precise consideration of the parameters describing the mechanical properties of the soil, such as cohesion, friction, etc. This means that if appropriate parameters are available, the numerical method is more accurate than the empirical method [18]. However, in the case of a more complex dam structure, the uncertainty of predicting its washing away also increases due to the difficulty of correctly determining the critical parameters of the model [19]. The evaluation of the consequences of dam failure relies on the testing of a number of catastrophic scenarios in order to further analyze and assess the consequences of the potential flood. The basis of such analysis includes hydrologic simulations, numerical modeling of breaching processes, flood plain flows, and the preparation of inundation maps using GIS systems [20,21,22,23,24,25]. One-dimensional models can predict flood propagation in channels and narrow valleys with reasonable accuracy and good efficiency [11,26,27]. However, a 2D or hybrid 1D/2D approach should be used in wide floodplains and complex terrain regions with elevated roads, secondary dikes, levees, buildings, and other obstacles [28]. The 2D models are more commonly applied due to significant computational power advances and the availability of air-born topographical data in recent years [29,30,31]. In addition, hybrid models are used to derive 1D-based breach outflow hydrographs, whereas the 2D models are used for flood plain modeling and the generation of inundation maps downstream of a dam [32].
The current work presents a case study of a catastrophic failure of the Niedów dam in Poland on the 7th of August 2010. The goals of the study are to give an explanation of the failure mechanism in the case of this concrete face earth dam and to determine the impact of the failure on the flooding of the area below. This will enable it to be used as a case study for the testing and validation of the breaching of similarly constructed dams. The geographic, meteo- and hydrological conditions leading to this event are also presented. Consequently, a 2D hydrodynamic model was applied in order to more reliably determine the hydrograph of the outflow from the reservoir and the propagation of the flood wave for the purpose of determining the impact of the failure on the flooding of the area below. Finally, the remediation works, and reconstruction of the dam are briefly reported.
2. Case Study
2.1. Description of the Study Area
The Niedów dam on the Witka river (at km 2.2) is located in southwest Poland, near the Polish–Czech and Polish–German borders, as shown in Figure 1. It was constructed in 1962 to supply water to the Turów coal power station (the fourth largest power station in Poland) for cooling purposes, and also to supply drinking water to nearby settlements, including the town of Bogatynia located 15 km to the south. In essence, the function of the reservoir was not to mitigate the flood hazard. The storage capacity of the reservoir before failure-at a normal water level of 210 m a.s.l. was 5.6 million m3 (measured past the flood), and the water surface area was 183 ha. The reservoir’s catchment area is 321 km2 in the (sub)mountainous region of the Izerskie Mountains and has significant stream slopes. Most of the catchment area is located on the territory of Czechia. The geological structure of the riverbed is made up of granite and gneiss formations under 75 m of sands, gravels, and clay (locally). Such formations are favorable for high runoff.
2.2. Description of the Niedów Dam
The Niedów dam consisted of three major sections: the central section (with a concrete water release structure equipped with movable gates, a bottom outlet, and a hydropower plant) and two earth embankments. The total length of the central part of the dam was equal to 47.05 m. The length of the earth embankments on the left and right sides were 126 m and 94 m, respectively (see Figure 2).
Three tainter steel gates, with a width of 6.7 m and a height of 6.6 m each, controlled the water outflow from the reservoir (see Figure 3). The maximum capacity of the weir, when the gates were elevated by 5.0 m, and the water level in the reservoir reached 210 m a.s.l., was 500.0 m3s−1. This corresponds to the design flow with an exceedance probability of 1%. This yield can reach a value of 655 m3s−1 for the designed maximum water level of 210.4 m a.s.l. In addition, the pillars of the central section contained bottom outlets with a size of 2 m × 1 m, which were equipped with vertically moving flat closures. The yield capacity of each outlet was equal to 10 m3s−1 (at a water level upstream of 210 m a.s.l. and a water level downstream of 202.20 m a.s.l.). In normal conditions, these openings were utilized to empty the reservoir. They were also used during the catastrophic event.
The structure and geometry of the earth dam are presented in Figure 4. The maximum height of the embankment with respect to the base ground level was 11.6 m. The body of the dam was made of well-compacted sand without a clay core. The slope upstream was of a ratio of 1:3, while the slope downstream had a ratio of 1:2.5. Because the sand had a high permeability coefficient of 2.8 × 10⁻³ ms−1, the upstream slope was shielded with a double layer of concrete slabs with dimensions of 1.5 m × 1.5 m × 0.1 m, which were sealed with a bituminous material. The shield from the upstream water was supported by a vertical reinforced concrete cut-off wall, which reached down to the basement rock. The downstream slope was covered with hummus and grass. On the lower part of the slope, there was a drainage of mixed gravel and stone. The dam’s crest was 5 m wide and served as a road made of concrete slabs with asphalt. The power plant and water outlet sections were connected to the dam with abutments. The total volume of the earth dam was ca. 61,000 m3.
The dam was technically supervised regularly and was stable and in good condition. A number of maintenance and restoration works were executed in the years from 1998 to 2009, including the repair of the steel and concrete structures, the repair of the upstream slope, and the replacing of the road pavement on the top of the dam in 2009. The dam was operated according to its documentation, which consisted of five major items: (i) guidelines for the operation of the water intake, (ii) guidelines for flood management for the reservoir area, (iii) technical instruction of the dam’s operation during a flood, (iv) a manual for gate control, (v) a manual for the operation of the power plant.
2.3. Meteorological and Hydrological Conditions
In the period between 6 and 8 of August 2010, the upper catchment area of the Lusatian Neisse (in Polish-Nysa Łużycka) was subjected to exceptionally high amounts of rainfall. In the Witka catchment area, a tributary of the Lusatian Neisse, the cumulated rainfall reached values in the range of 150–250 mm in 48-h, and the daily sum on the 7th of August reached values of 128.5 and 179 mm in the meteorological stations of Mnisek and Heinice, respectively (see Figure 5). The most intensive rainfall occurred in the morning between 8:00 and 9:00, with 15–35 mm of rain falling in an hour, locally reaching as high as 58 mm at the Heinice station. These rainfall statistics correspond to one-fourth of the yearly rainfall in this mountainous region [33]. Moreover, the hydrological situation deteriorated due to the unprecedented wet period in the second half of July (with precipitation above the norm), which led to the saturation of the ground and the acceleration of the subsequent runoff. The consequence of such a meteorological situation was the occurrence of catastrophic floods on several rivers, including flash floods on the Witka River, the Miedzianka River, and the Lusatian Neisse River. Figure 6 shows a map that indicates the hydrological network in question and the meteorological and hydrological observation stations. In most hydrological gauge stations, the observed water levels significantly exceeded the historical maxima. Remarkably, a number of gauge meters were destroyed during the passage of the floodwater, making it more difficult to subsequently assess the quantitative data of the flood. The return period of the flood is estimated to be within 100–200 years.
The flow of the Witka river—its name on the Czech territory is the Smeda river—is monitored at four gauge stations. On the Polish section from km 0.0 (river mouth) to km 8.0, there are two stations: Ostróżno (km 7.98), upstream from the reservoir, and Ręczyn (km 1.8), downstream from the reservoir (Figure 2). On the 7th of August at the Ostróżno gauge station, the highest water level of the flash flood occurred at 16:40. The Ręczyn gauge station recorded the water level until 15:20 and thus until it was destroyed due to the high release of water from the reservoir before the failure of the dam. During the 45-year period of continuously monitoring flow at Ostróżno gauge station, the flood discharges were less than 70 m3s−1, which is still within the limit of bankful flow. There was only one case of higher flow, which occurred in August 2001 and which was equal to 171 m3s−1. That event also featured a rapid ascent and descent of the wave, which is typical for a flash flood. On the 7th of August, the estimated flood rate was 615 m3s−1, but this estimation is still burdened with significant uncertainty. This estimation was difficult, as the water level substantially exceeded the measured range due to a locally wide floodplain. Between the Ostróżno cross-section and the reservoir, there is an increase in the catchment area from 268 to 331 km2, including the Koci Potok stream, which also severely flooded and delivered a significant direct inflow to the reservoir. This stream is not monitored, but based on the field survey after the flood, the peak flow rate was estimated at ca. 70 m3s−1.
2.4. Dam Failure–Wash Out Mechanism and Breach Characteristics
The water level in the reservoir was controlled according to the operational manual. The procedure involved the gradual elevation of the gate by 0.2 m in order to maintain the desired water level. When the control of one gate was insufficient, the additional gate was also raised by 0.2 m. In the course of this unpreceded water level rise, the opening of the gate was accelerated. During the catastrophic flood, one of the two turbines was undergoing renovation. After the water level exceeded the edge of the maintenance gate at the inlet to the hydropower channel, the water flowed into the hydroelectric power plant. As a result, the control room was also flooded, the crew was evacuated to the top of the dam, and the power supply was turned off. The crew still tried to open more gates manually from the dam’s crest but were unsuccessful. The overflow started at 17:00 over the left side of the dam near the bank because the crest was slightly inclined toward it. The water passing over the crest caused the erosion, which first occurred around the lamp post’s foundations, and then on the slope covered with grass. This process took about half an hour and resulted in the gradual disintegration of the road on the dam’s crest. The concrete slabs then lost their support and fell due to the washing away of the sand that constituted the dam’s body. Remarkably, the concrete slabs, when losing support, broke in a series like chocolate and were swept away by the intensified flow. Afterward, another important moment occurred. As the support of the earth embankment vanished, the left training wall flanking the central concrete dam collapsed due to upstream water pressure. This resulted in a further rapid outbreak. This phase was relatively short but intense, and resulted in a torrential flood wave downstream, which is documented in Figure 7. After the next 80 min, the left side of the earth dam was almost completely swept away (Figure 8).
The overtopping of the right dam began approximately 15 min after the left one. The breaching in this case developed in a similar but less dynamic way. The washout started at the central part of the right dam, and evolved toward the right bank of the valley. As a result of the fall of the left abutment and a fast lowering of the water level in the reservoir, the right bank washing out decelerated. In addition, the concrete slabs resisted failure and worked as a weir for about 20 min. It is difficult to explain the origin of this. Possibly, the slabs jammed or concrete debris temporally hindered the erosion process. Figure 7 shows the hindered breaching of the right side of the dam. Finally, the concrete slabs were washed away. Nevertheless, the outflow here was not that intense since the upstream water level had already substantially decreased. The washing out of the right side of the dam lasted for about 130 min, causing the devastation of 62% of its length. The washing out reached the level of 200.00 m a.s.l. (the bottom of the breach). The final width of the breach of the right dam was 58 m. Figure 9 illustrates the complete dam breach. Part of the dam adjacent to the control structure remained. Table 1 collects the crucial moments of the development of the breach, established on the basis of observations, records, and interviews. The breach parameters, i.e., the eroded earth volume Ver, the mean breach width Bavg, and breaching time Tf are further collected in Table 2 for the left and right embankment. The peak discharge is a result of the numerical flood routing (see Section 4).
2.5. Flooding Downstream of the Niedów Dam
At 16:00, the high water discharges from the Niedów reservoir caused an overflow of water from the banks of the Witka River and also the flooding of the adjacent areas. At 16:20, the Ręczyn water gauge station on the Witka River (km 2.2) was destroyed, and the floodwaters headed to the mouth of the river into the Nysa Łużycka River and toward the village of Radomierzyce through the Mill channel. The dramatic situation started at 17:20 when the left dam broke. The rapid outflow of water destroyed the weir on the Witka River (which directed the water to the Mill channel) and the railway line on the embankment. The wave then reached the nearest village of Radomierzyce. The areas of the village were flooded to a depth of about 2 m. However, there was no collapse of buildings. The flood wave of the Witka River, combined with the ascending flood wave of the Nysa Łużycka River, caused the flooding of the areas on the German side of the border. First, it flooded the Hagenwerder estate, located near the Pliessnitz mouth, and then the water overflowed the embankments into the Berzdorff reservoir, destroying the railway line running along the border. The subsequent serious flood damage took place on August 8, between 00:00 to about 12:00 on the further section of the Nysa Łużycka River when the wave reached the city of Görlitz on the German side and the city of Zgorzelec on the Polish side (the peak of the wave in Zgorzelec was at 06:40). It was the largest flood ever recorded in this area, and it caused losses on the German and Polish sides of the border. The historic centers of both cities were partially flooded, and the water depth was up to 1.5 m. Supplementary Material Figure S1 contains pictures of the flooding, and a film is easily accessible under the website [34].
2.6. Field Observation
A field survey was carried out after the flood in order to collect data on the flood wave passage along the Lusatian Neisse river and its major tributaries [35]. A number of eyewitnesses of the flood were interviewed, including several local authority representatives. The maximum water elevation marks were sought and fixed for further geodesy recording at over 50 locations, including upstream and downstream of the Niedów dam. In some cases, clear water lines were found on walls in the form of sediment and residue marks or washed-out dirt, but in several locations, the high water marks were only approximate and based on residues found on trees, bridge piers, or decks. Therefore, the error of maximum water elevation may vary from a few millimeters to ca. 0.4 m. The ranges of the flooded area were also determined in the field—first marked on a map and then digitized. The time of the flood peak passage on the Lusatian Neisse River at the section located next to the Witka River mouth, due to the fact that there was no water gauge station on this section of the river, was determined based on interviews of inhabitants. It was found that the culmination of the flood occurred between 02:00 and 03:00 on 8 August 2010, and therefore, 8 h later than the peak outflow from the failed Niedów dam. This information helps to reconstruct the flood wave hydrograph, to quantify the argued effect of coincidence flood waves from the two rivers, and to define the upper boundary conditions for the hydrodynamic model.
3. 2D Modeling of the Food Routing
Due to the topographical complexity of the river, including its locally meandering character and two-dimensional flow patterns, flood routing using two-dimensional modeling is adopted herein. This approach enables the best mapping of the variability of the flood wave along the Nysa Łużycka River while at the same time ensuring accurate compliance of the water flow volume. This is essential for correct modeling. The particular purpose of the modeling was to determine the hydrogram of the outflow from the reservoir due to the dam’s failure and ultimately to assess its impact on the flooding downstream.
3.1. Model Area and Boundary Conditions
The domain of the 2D model begins with a section located several hundred meters above the mouth of the Witka River and ends in the city of Zgorzelec at the gauging section. The end section of the Witka River, beginning close to the dam, was modeled along with a Mill channel running through the village of Radomierzyce. The tributaries of the Pliessnitz River and the Czerwona Woda River were also included. An important aspect of the flood routing was also to restore the overflow volume through the left embankment to the Berdzorfer Lake, which is an artificial post-mining lake that received a substantial amount of water during the flood. The considered hydrological scheme, a part of which was implemented into the 2D model, is presented in Figure 10. The unsteady state conditions were defined as follows:
where QNL,in (t)—the discharge hydrograph for the Lusatian Neisse (considered as the upper boundary condition)-(unknown); QND (t)—the hydrograph of the outflow through the Niedów dam (unknown); QP (t), QCW (t)—the flow rate hydrographs for the tributaries of the Pliessnitz River and the Czerwona Woda River (known); QB (t)—the inflow to the Berzdorfer lake (the total volume of inflow ranging from 3.5 to 4 million m3; this water was retained in the reservoir and did not return to the river valley); dV/dt—the change in the retention volume of the river valley; QNL,Z (t)—the discharge hydrograph for the Zgorzelec gauge station; the discharges were calculated based on the flow rate curve for this station.
QNL,in (t) + QND (t) + QP (t) + QCW (t) − dV/dt − QB (t) = QNL,Z (t)
Importantly, the discharge measured by the hydrometric service of the Institute of Meteorology and Water Management in Zgorzelec (from a bridge) during the maximum water level was 1040 m3s−1. This is somewhat more than the value obtained from the extrapolated rating curve, i.e., 980 m3s−1. Despite this difference, the downstream outflow has been relatively well defined and reliable. This enabled the inflows QNL,in(t) and QND(t), while taking into account the additional inputs of the Pliessnitz and Czerwona Woda rivers (which were relatively insignificant), to be searched for. The maximum discharge rates of these tributaries were 46 and 36 m3s−1, respectively.
3.2. Model Set Up
The hydraulic modeling was executed using MIKE21 software [17,36]. This is a commercial, commonly used software by researchers and consultants for flood simulations [37,38]. The two-dimensional model was based on the depth-averaged Saint–Venant equations, describing the evolution of the water level and two velocity components under the assumption of incompressible flow, uniform density, and hydrostatic pressure. The two velocity components permit a detailed description of the flow velocity on complex floodplains. The unsteady differential form of the mass conservation and momentum equations used in the model is as follows [39]:
where is the water depth, is the time-varying water depth, is the surface elevation, is the flux density in direction and is the depth-averaged velocity, is Chezy resistance, is the acceleration due to gravity, is the wind friction factor, is the wind speed and components, is the Coriolis parameter, is atmospheric pressure, is the density of water, are space coordinates and , is the time, components of effective shear stress, is the Kronecker delta, Einstein’s notation applies.
The MIKE 21 flow model is a finite difference model with constant grid spacings in the x- and y-direction, and therefore the model area has to be rectangular.
The development of the model in the current case study included the following works: (i) preparation of the digital elevation model (DEM) based on both Polish and German data sets (selected DEM-DGM_Q1 with horizontal resolution of 5 m × 5 m); (ii) generation of the bathymetry of the main river channel based on field surveyed cross-sections (every 300 m on average) by making use of a ArcGIS linear interpolation; (iii) generation of the calculation bathymetry with a regular grid resolution of 5 m × 5 m by merging the main channel bathymetry with the DEM; (iv) implementation of hydrotechnical structures and buildings, as well as linear structures surveyed in the field (e.g., embankments), by adjusting the ordinates of corresponding grid cells; (v) preparation of a raster map of the initial roughness on the basis of land cover maps and aerial photos; in total 15 roughness classes were distinguished—the main channel and open surface waters, grassland and tree areas, bushes, paved surfaces, roads, etc.; (vi) formulation of boundary conditions in the form of water level and discharge series [35]. The computation bathymetry and roughness parameters (expressed by the Strickler coefficient M = 1/n, where n is the Manning coefficient) are provided as Supplementary Material (Figure S2 and S3, respectively), while the roughness parameter was preliminarily determined with guidance from Arcement and Schneider [40] and Morvan [41]. The final M-values, resulting from the evaluation of the model’s performance, ranged from 22 m3s−1 (meandering sections) to 36 m3s−1 (regular channel in Zgorzelec) for the main channel. For grassland, the M value was set to 17, for bushes to 8, while for building surfaces, it was as low as 1. Since the Lusatian Neisse River was modeled as an open-ended reach, the downstream boundary condition was set as a water elevation as a function of time. This was adopted directly from the observations of the Zgorzelec gauge station because the modeled area ends on the cross-section of this station. The size of the modeled area was 13.3 km by 5.0 km, the total number of grid cells was 2.65 million, and the computation step was from 0.5 to 0.75 s. The assumed computation step of the calculations was meant to limit the Courant number to the value of 1.0 for the purpose of obtaining numerical stability, accuracy of the calculations, and a computation time of the simulations that was not too long.
3.3. Results Discussion
The flooding along the Lusatian Neisse in the studied case was a combination of two major flood waves that originated from the upstream river section and the reservoir outflow. The flood hydrographs, which peaked at different times, constituted the two upper boundary conditions of the model (see Figure 11). The aim of the modeling was the reconstruction of these hydrographs, which was iterative, and involved the conducting of a number of computations in which the shapes of the inflow hydrographs were adjusted in order to satisfy Equation (1). Initially, the shape of the Lusatian Neisse hydrograph was approximated based on the recorded hydrograph from the Sieniawka gauge station located upstream. The further adjustments of the hydrographs mainly concerned the value of the wave’s peaks (with their known timing) and, to a lesser extent, the shape of the hydrographs. In addition to this, the analysis of several different time failure scenarios led to the conclusion that limited variations of the hydrograph’s shapes (related to the dynamics of the dam’s failure) had a negligible practical influence on the spatial envelope of the maximum values of the water depth and downstream discharge. This is in accordance with the research results of Pilotti [11]. Moreover, a simultaneous sensitivity analysis was performed in order to identify and analyze the influence of the change in the Strickler coefficient on the peak flow and wavefront propagation downstream. The roughness parameter is considered to be the most influential for the flow, as was the case in other numerical studies [42,43]. Therefore, the roughness values were changed in order to bring the calculated discharge hydrograph in Zgorzelec in line with the hydrograph measured on the water gauge, as well as to obtain a good agreement of the calculated water level with the measured marks of the high water.
Moreover, the overflow to the Berzdorfer lake was calculated using the model. This flow over the embankment can be extracted in a function of time. However, there are no field data to verify this variation. Nevertheless, this would probably have a relatively minor impact on the flood propagation (taking into account the total retention of the valley). Therefore, during the calculations, the volume of water that flowed into the lake was one of the issues of the model’s calibration. A substantially increased peak outflow from the dam resulted in higher water levels and a larger overflow volume to the Berzdorfer lake. Trying to compensate for this using decreased roughness parameters resulted in a deviation from the hydrograph timing in Zgorzelec. Therefore, the high-water marks, the overflow volume to Berzdorfer lake, and the flood propagation timing were conditions/restrictions that helped Equation (1) to be solved. The peak outflow from the dam was then expected to not have a substantial error due to the fact that the discharge from the Lusatian Neisse at the moment of the dam’s break was still below 400 m3s−1, and that its estimation error was relatively low. Obviously, in this situation of limited data, there is still a possibility of the input hydrographs changing, but the obtained results can still be considered as satisfactory. However, it should also be emphasized that these calculations were very time-consuming. As a result of the conducted simulations, Figure 12 illustrates the flooding at 10:00 on 8 August 2010, when the flood peak reached the city of Zgorzelec. This figure also indicates the location of the high-water marks (denoted as WW) on the right bank. The calculated ordinates of the water level correspond relatively well with the high-water marks that were measured on-site after the flood. The differences between the calculated values and those that were determined varied from a few centimeters to approx. 0.3 m (Table 3).
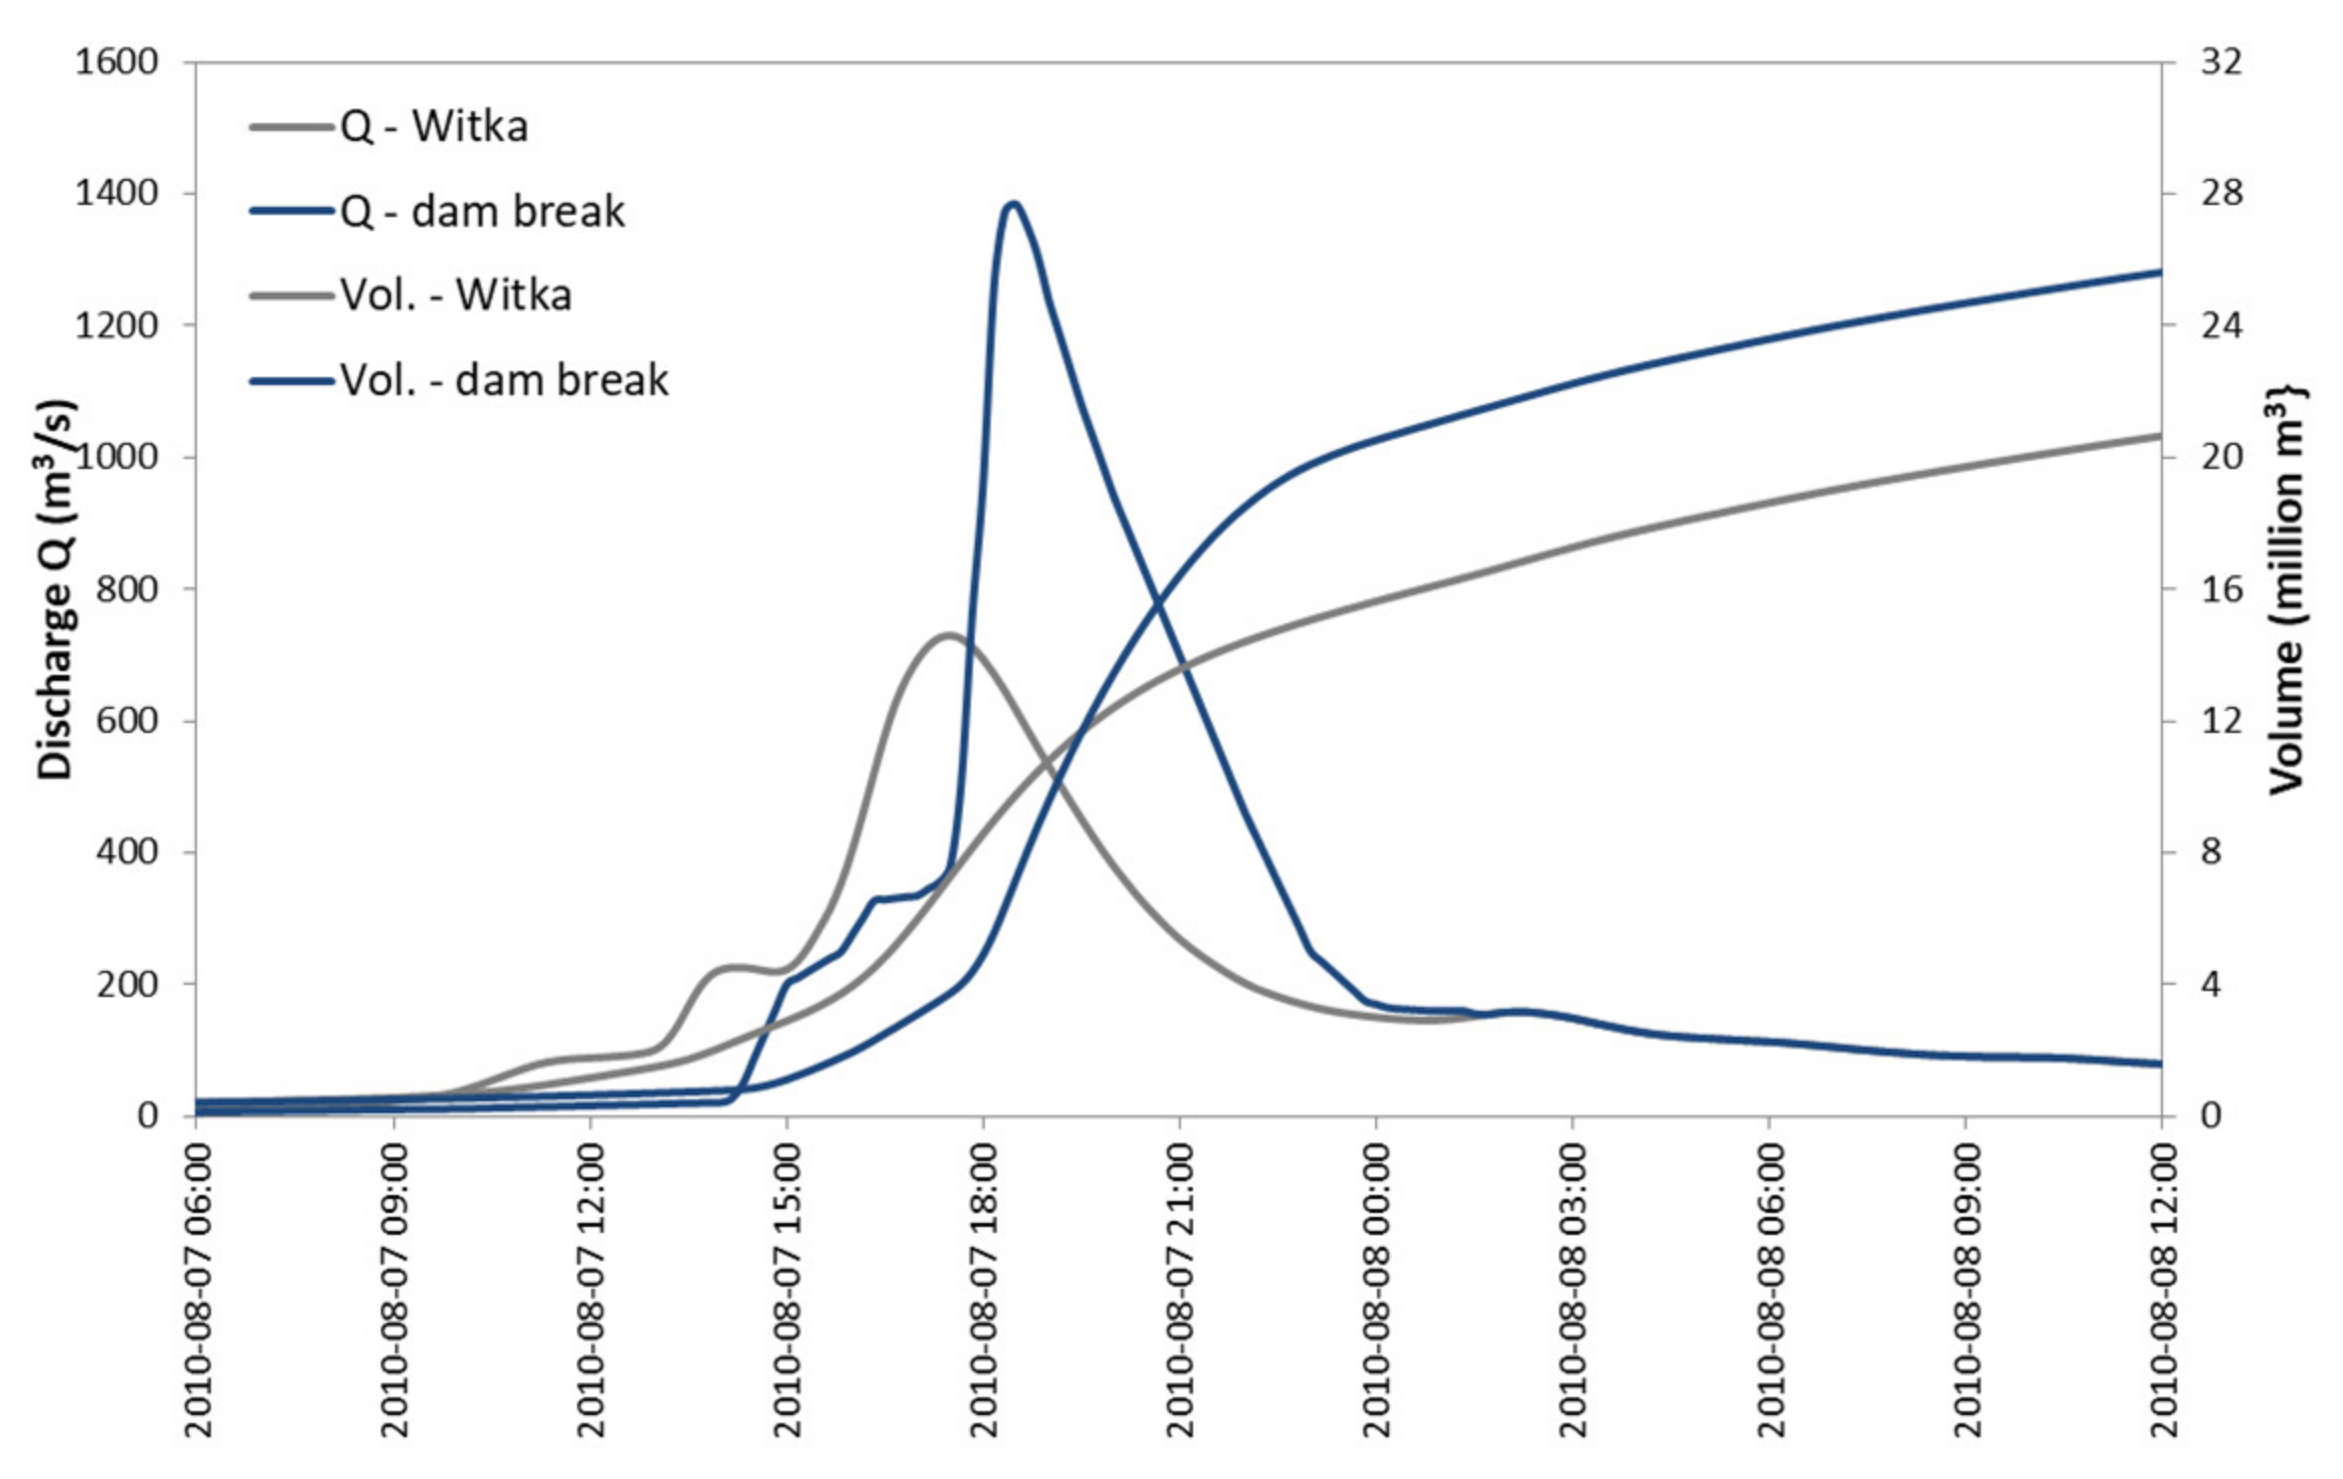
In addition, the calculated overflow volume to the Berzdorfer Lake amounted to 3.783 million m3, which is in accordance with the data provided by the German party. This value was assessed based on the water level increase in the lake prior and after the flood passage. The resulting upstream dam breach hydrograph QND (t) was determined for a peak discharge of 1380 m3s−1 at 18:20 (see Figure 13). The total volume of water passing the dam was equal to 22 million m3, which was about 5 million m3 more than the inflow to the reservoir.
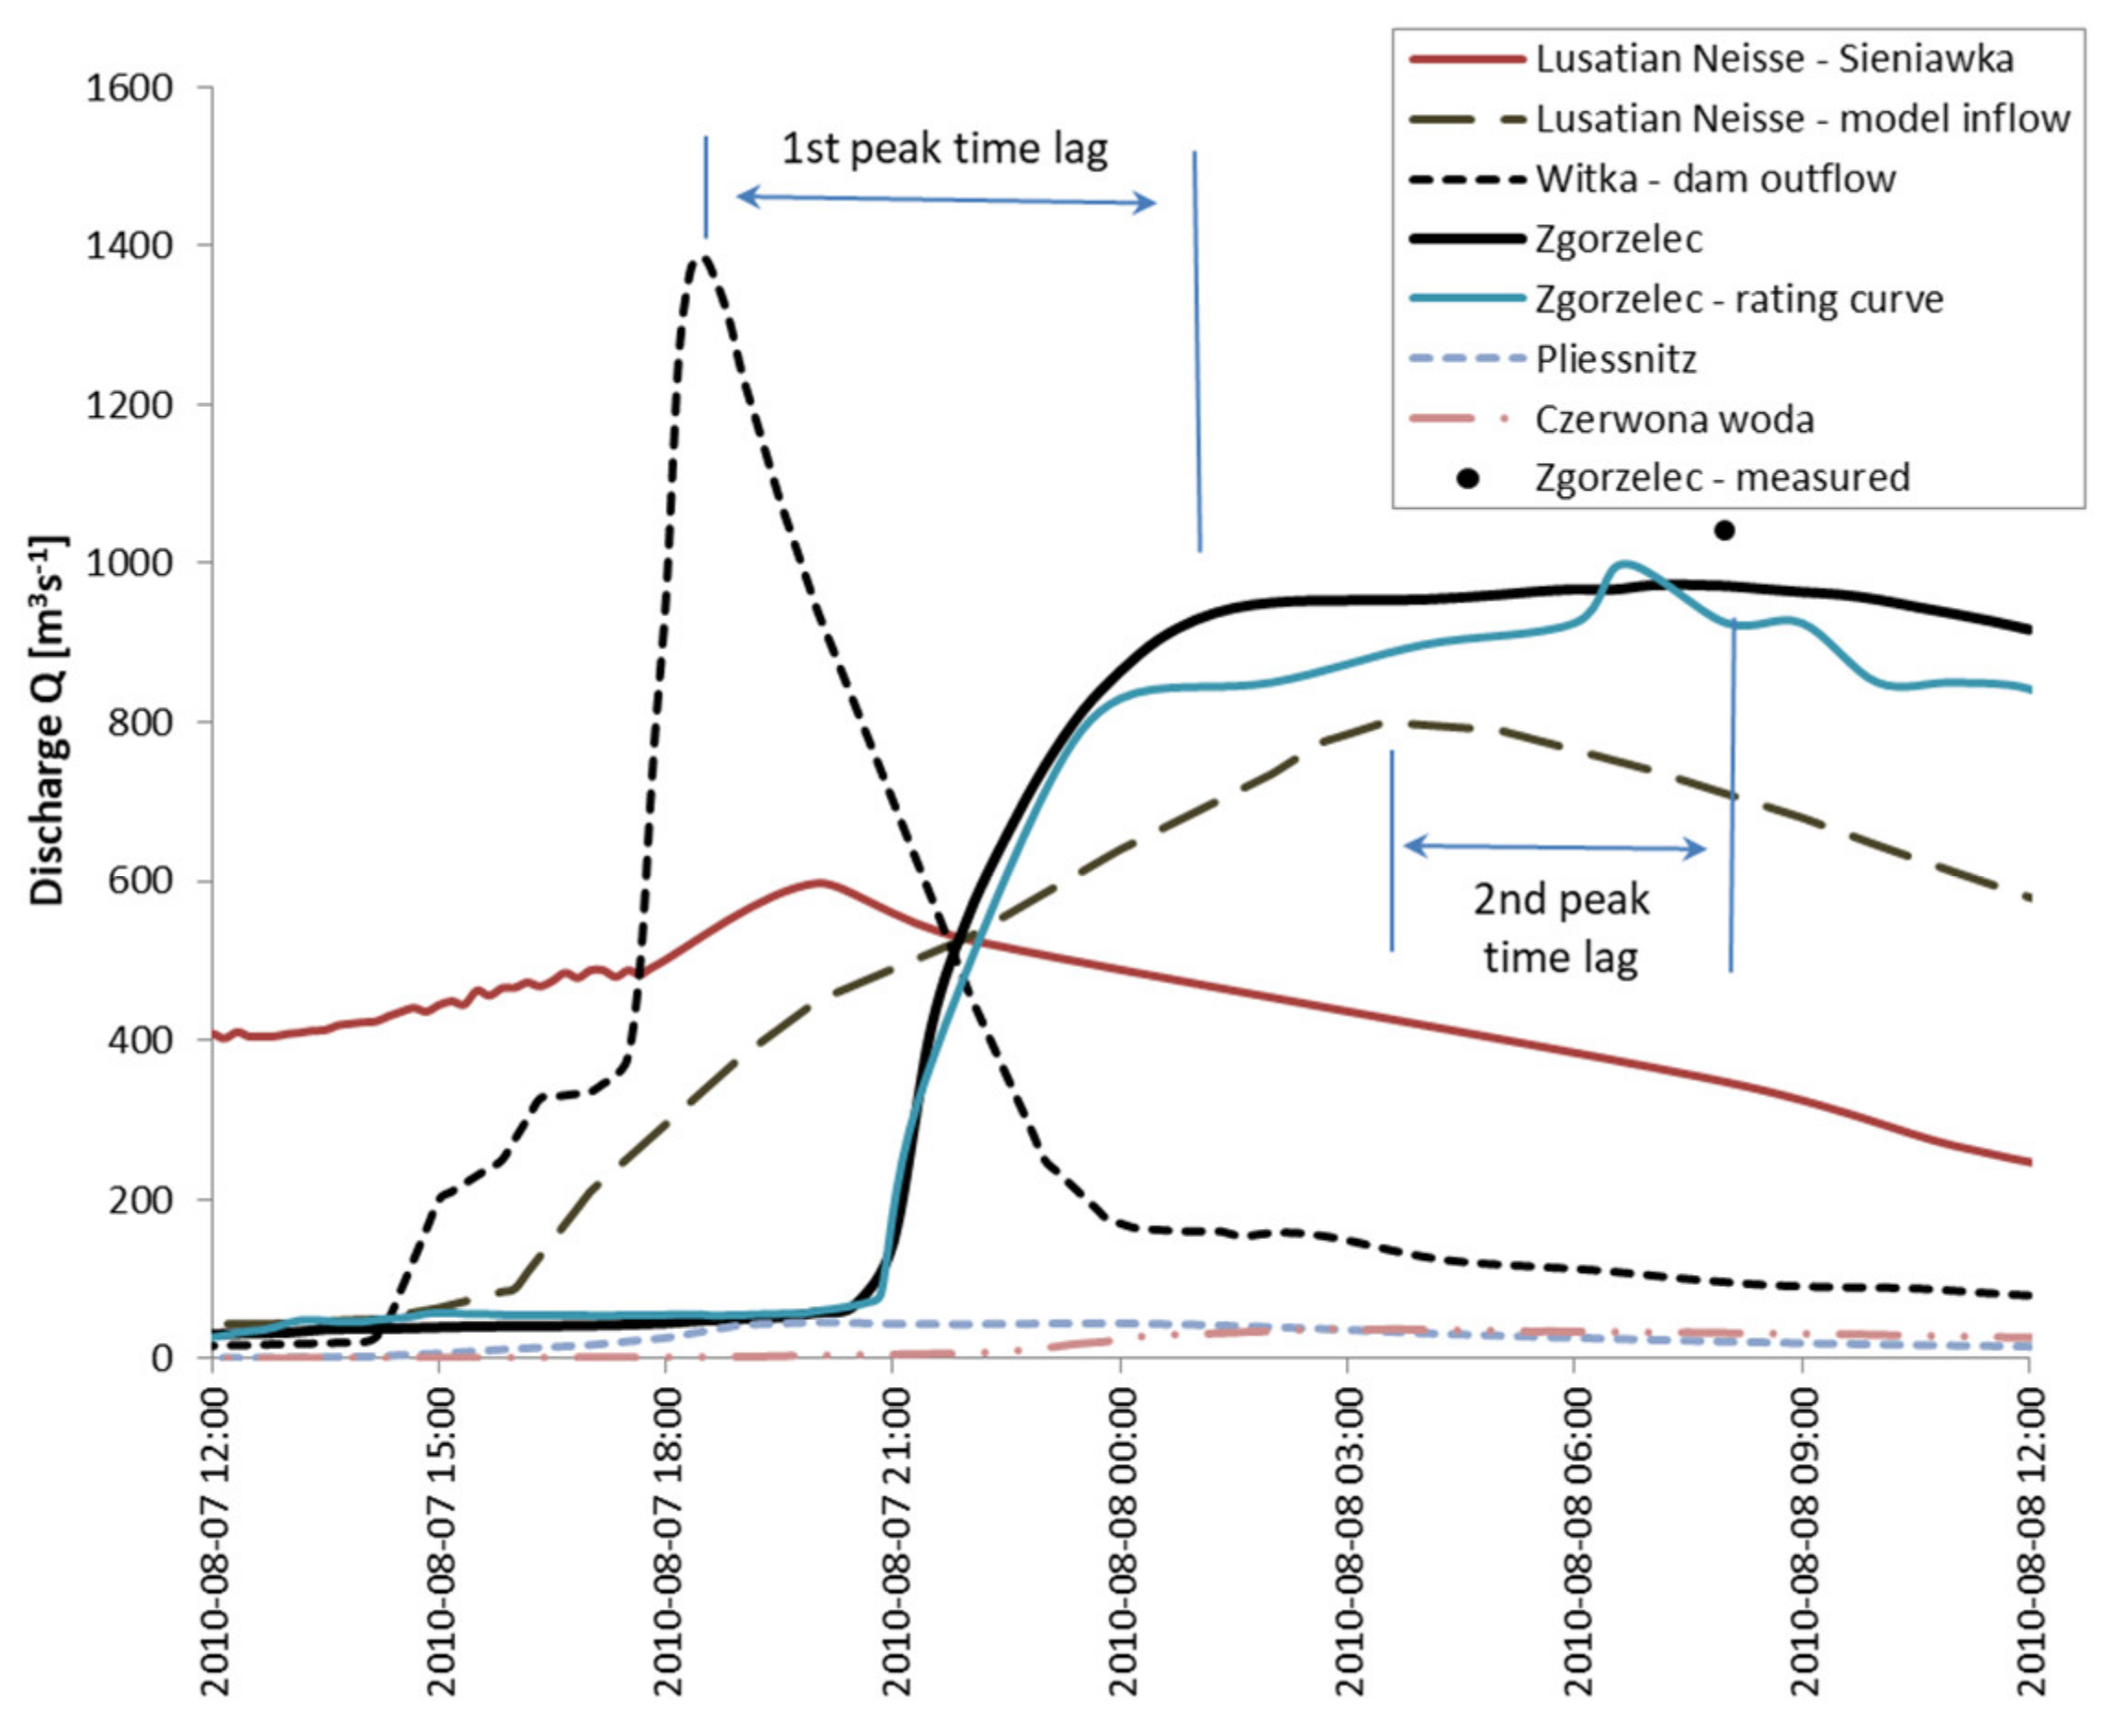
Finally, Figure 14 presents the crucial discharge hydrographs, which reflect the flood wave transformation along the modeled river section. The influence of valley retention on flood propagation was remarkable. This retention was of about 20 million m3, not counting the inflow to the Berzdorfer Lake. Therefore, there was a significant reduction in the flood peak discharge from 1730 m3s−1 at the cross-section near the Witka mouth (km 169.5) to 950 m3s−1 at the Zgorzelec gauge station (km 151.4), which prevented more severe damage in the city of Zgorzelec. In addition, the discharge hydrograph at Zgorzelec shows two peaks—the first was caused by the Niedów dam’s break, and the second was caused by the flood wave on the Lusatian Neisse, which culminated, importantly and fortunately, about eight hours later than that of the Witka River. As depicted in Figure 14, the travel time of the first flood peak from the outflow from the Niedów reservoir to the Zgorzelec gauge station took about seven hours, while the second peak of the Lusatian Neisse traveled for about 4.5 h. This can be justified by the fact that the second peak traveled over areas that were already flooded, and therefore was faster than the first one.
4. The Niedów Dam Restoration
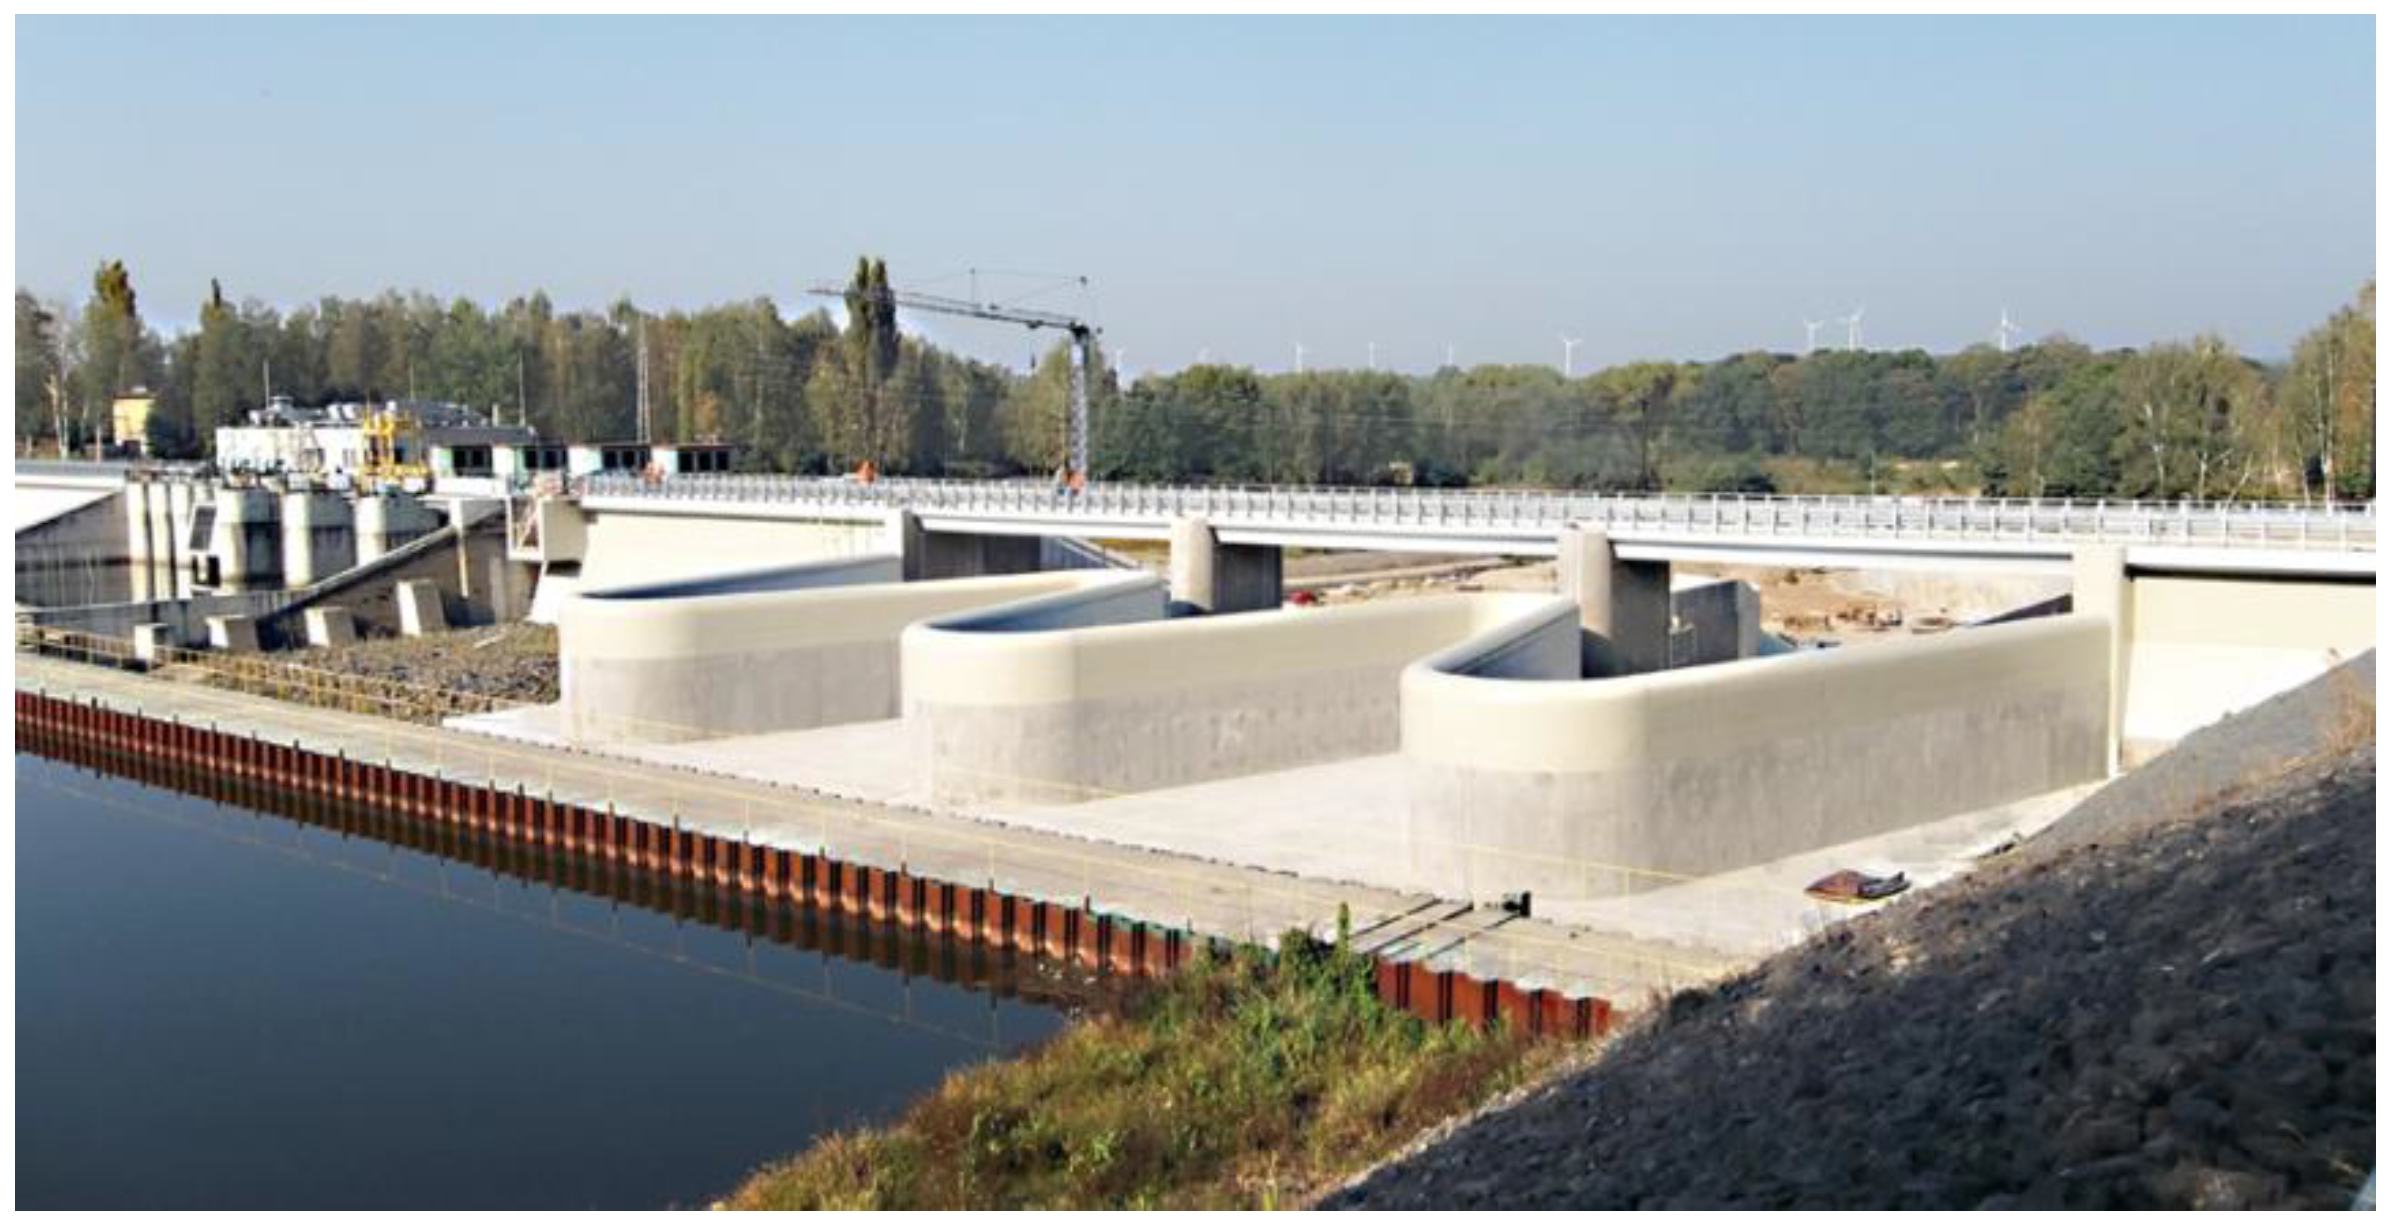
A direct consequence of the failure of the Niedów dam was a threat to Poland’s energy security in the case of needing to stop the Turów power plant. Immediate measures were taken, which involved changing the power plant’s water supply from the Niedów reservoir to the small reserve Zatonie reservoir. Moreover, it was decided to rebuild the Niedów reservoir. Within 4 months, the broken training wall was renovated, the structures of the pump station and the ogee weir of the hydroelectric power plant were renovated, and a steel sheet piling cofferdam was made in order to restore damming in the reservoir to the ordinate of 206 m a.s.l. The cofferdam enabled water for the Turów power plant to be collected, and work on the reconstruction of the Niedów reservoir to be commenced. In the meantime, new hydrological calculations of the design flows were performed while taking into account the catastrophic wave of 2010. A new dam design was then developed on this basis. A concrete buttress dam was designed, which was set on rock formations in the ground, and which had its crown at an ordinate of 212 m above sea level. Such a structure ensures the complete safety of the dam in the event of water overflowing through its crown. To further improve the safety of the dam, an additional labyrinth weir was designed with an overflow edge length of 146.5 m, see Figure 15. With the assumed thickness of the overflow layer (after reaching the extraordinary damming level in the reservoir), the capacity of the labyrinth weir amounts to 60 m3s−1, and the total capacity of all the structures is equal to 711 m3s−1. When the water ordinate in the reservoir increases to the crown ordinate of 112 m above sea level, the capacity of the labyrinth will increase to 700 m3s−1, which in combination with the existing ogee weir (that is closed with segments) makes the total capacity of the dam 1400 m3s−1. This is more than twice the value of the flood wave that caused the dam’s failure in 2010, and therefore the dam should withstand future extreme events caused by the potential impact of climate change. The last effect of the dam’s failure is the better adaptation of the new structure to environmental requirements. A folded fishway (reversed several times), located between the ogee weir and the labyrinth weir, which was missing before the disaster, was designed and implemented. Construction works started in June 2014, and the reconstruction of the reservoir was completed in November 2016.
5. Conclusions
The literature review and the current case study demonstrated that the dam breach mechanism and its prediction is an extensively studied and complex subject. There was a variety of failure modes and possible approaches to quantitatively assess the dynamics and consequences of the dam break. Thus, the study aimed to reconstruct and explain the catastrophic event of the Niedów dam failure in order to contribute to the current database concerning the developments of dam breaches. As a result, a detailed description of the dam breaching mechanism was provided with the final breach parameters, which can be used for statistical analyses or for the development of a model that was based on the description of the physics of this phenomenon. A particular feature of the Niedów dam was the fact that the homogenous embankments made of sand and gravel had a concrete facing, which acted as an impermeable barrier. This, along with the asphalt road on top, substantially affected the process of the washing out of both sides of the embankments, which was remarkably different and longer than what can be expected in the case of homogenous earth embankments. The slower washing away of the dam resulted in a lower peak value of the wave flowing out of the breach. Therefore, according to the authors of the article, when preparing a forecast of a concrete faced dam failure, this fact should be taken into account in the analysis of the flood risk, as it may significantly affect the assessment of the consequences of the disaster. It can also be concluded that the concrete facing of dams can be a measure for limiting the peak outflow of a potential dam breach and reducing the risk of flooding.
Another particularity of this case study is that the catastrophic flooding along the Lausatian Neisse was a superposition of two floods, with the consequences of both needing to be explained. The paper, therefore, presented an implementation of a 2D hydrodynamic model for simulating flood wave propagation along the Lusatian Neisse River while at the same time taking into account the Niedów dam failure. With the use of this model, the unknown upper boundary hydrographs of this complex flood situation, in particular the outflow from the reservoir, were determined in an iterative way while also making use of the mass conservation principle in unsteady-state simulations. This modeling approach is considered to be an alternative to the assessment of outflow hydrographs based on statistical formulas, which are not successfully applied because of the present complexity of the breaching process. Remarkably, as a result of the executed hydraulic modeling in a data-limited situation, relevant answers concerning flood-related damage to various stakeholders in a bilateral, cross-border context could also be provided.
Finally, a positive consequence and outcome of the restoration works is a new dam construction that meets better environmental and climate standards.
Supplementary Materials
The following are available online at https://www.mdpi.com/article/10.3390/w13223254/s1, Figure S1: Flood_photo 1-3, Figure S2: Model bathymetry, Figure S3: Model roughness parameter M.
Author Contributions
S.K. and R.B. collected the data, conceived the study, interpreted the results, and wrote the paper. S.K. assessed the dam breaching while R.B. conducted the flood routing. The authors revised and approved the paper. All authors have read and agreed to the published version of the manuscript.
Funding
This research received no external funding.
Institutional Review Board Statement
Not applicable.
Informed Consent Statement
Not applicable.
Data Availability Statement
Data availability belongs to the authors.
Conflicts of Interest
The authors declare that they have no conflict of interest.
References
- Grant, G. Dam removal: Panacea or Pandora for rivers? Hydrol. Process 2001, 15, 1531–1532. [Google Scholar] [CrossRef]
- Hansen, H.H.; Forzono, E.; Grams, A.; Ohlman, L.; Ruskamp, C.; Pegg, M.A.; Pope, K.L. Exit here: Strategies for dealing with aging dams and reservoirs. Aquat. Sci. 2020, 2, 2–16. [Google Scholar] [CrossRef]
- Ho, M.; Lall, U.; Allaire, M.; Devineni, N.; Kwon, H.H.; Pal, I.; Raff, D.; Wegner, D. The future role of dams in the United States of America. Water Resour. Res. 2017, 53, 982–998. [Google Scholar] [CrossRef]
- ICOLD: Dam Failures—Statistical Analysis; Bulletin 99; International Commission on Large Dams (ICOLD): Paris, France, 1995.
- Ariey, M.; Bridle, R.; Cambridge, M.; Hughes, A.; Sawyer, J.; Spasic-Gril, L.; Williamson, T. Meeting report, ICOLD 2011, Lucerne, Switzerland. Dams Reserv. 2011, 21, 95–100. [Google Scholar] [CrossRef]
- Wu, W. Earthen Embankment Breaching. J. Hydraul. Eng. 2011, 137, 1549–1564. [Google Scholar] [CrossRef]
- Alcrudo, F.; Mulet, J. Description of the Tous Dam break case study (Spain). J. Hydraul. Res. 2007, 45, 45–57. [Google Scholar] [CrossRef]
- Yochum, S.E.; Goertz, L.A.; Jones, P.H. Case study of the Big Bay Dam failure: Accuracy and comparison of breach predictions. J. Hydraul. Eng. 2008, 134, 1285–1293. [Google Scholar] [CrossRef]
- Azeez, O.; Elfeki, A.; Kamis, A.S.; Chaabani, A. Dam break analysis and flood disaster simulation in arid urban environment: The Um Al-Khair dam case study, Jeddah, Saudi Arabia. Nat. Hazards 2020, 100, 995–1011. [Google Scholar] [CrossRef]
- Begnudelli, L.; Sanders, B.F. Simulation of the St. Francis Dam-Break Flood. J. Eng. Mech. 2007, 133, 1200–1212. [Google Scholar] [CrossRef]
- Pilotti, M.; Maranzoni, A.; Tomirotti, M.; Velerio, G. 1923 Gleno Dam Break: Case Study and Numerical Modeling. J. Hydraul. Eng. 2011, 137, 480–492. [Google Scholar] [CrossRef] [Green Version]
- Bureau of Reclamation. Downstream Hazard Classification Guidelines; ACER Tech. Memorandum Rep, No. 11; U.S. Department of the Interior, Bureau of Reclamation: Denver, CO, USA, 1988.
- Froehlich, D.C. Embankment Dam Breach Parameters and Their Uncertainties. J. Hydraul. Eng. 2008, 134, 1708–1721. [Google Scholar] [CrossRef]
- Xu, Y.; Zhang, L.M. Breaching Parameters for Earth and Rockfill Dams. J. Geotech. Geoenviron. Eng. 2009, 135, 1957–1970. [Google Scholar] [CrossRef]
- Zhang, L.M.; Xu, Y.; Jia, J.S. Analysis of earth dam failures: A database approach. Georisk 2009, 3, 184–189. [Google Scholar] [CrossRef] [Green Version]
- Kostecki, S.; Rędowicz, W. The washout mechanism of the Niedów Dam and its impact on the parameters of the flood wave. Procedia Eng. 2014, 91, 292–297. [Google Scholar] [CrossRef] [Green Version]
- DHI: MIKE 11—A modeling system for Rivers and Channels. In User Manual; DHI Water Environment Health: Hørsholm, Denmark, 2011.
- Saberi, O. Embankment Dam Failure Outflow Hydrograph Development. Ph.D. Thesis, Graz University of Technology, Graz, Austria, 2016; p. 159. [Google Scholar]
- Borowicz, A.; Urbański, M. Hydraulic Model for the Witka River and the Niedów Reservoir—The Niedów Dam Failure during the Flood in August 2010 and the Determination of Flooded Area; Wrocław University of Science and Technology: Wrocław, Poland, 2011. (In Polish) [Google Scholar]
- Altinakar, M. Modeling Tools for Dam Break Analysis. In Mississippi: National Center for Computational Hydroscience and Engineering; University of Mississippi: Oxford, MS, USA, 2008. [Google Scholar]
- Cleary, P.W.; Prakash, M.; Mead, S.; Tang, X.; Wang, H.; Ouyang, S. Dynamic simulation of dam-break scenarios for risk analysis and disaster management. Int. J. Image Data Fusion 2012, 3, 333–363. [Google Scholar] [CrossRef]
- Cleary, P.W.; Prakash, M.; Mead, S.; Lemiale, V.; Robinson, G.K.; Ye, F.; Ouyang, S.; Tang, X. A scenario-based risk framework for determining consequences of different failure modes of earth dams. Nat. Hazards 2015, 75, 1489–1530. [Google Scholar] [CrossRef]
- Cannata, M.; Marzocchi, R. Two-dimensional dam break flooding simulation: A GIS-embedded approach. Nat. Hazards 2012, 61, 1143–1159. [Google Scholar] [CrossRef]
- Álvarez, M. Two-Dimensional Dam-Break Flood Analysis in Data-Scarce Regions: The Case Study of Chipembe Dam, Mozambique. Water 2017, 9, 432. [Google Scholar] [CrossRef] [Green Version]
- Zhong, D. Dam break threshold value and risk probability assessment for an earth dam. Nat. Hazards 2011, 59, 129–147. [Google Scholar] [CrossRef]
- Teng, J.; Jakeman, A.J.; Vaze, J.; Croke, B.F.W.; Dutta, D.; Kim, S. Flood inundation modelling: A review of methods, recent advances and uncertainty analysis. Environ. Model. Softw. 2017, 90, 201–216. [Google Scholar] [CrossRef]
- Tayefi, V.; Lane, S.N.; Hardy, R.J.; Yu, D. A comparison of one- and two-dimensional approaches to modelling flood inundation over complex upland floodplains. Hydrol. Process. 2007, 21, 3190–3202. [Google Scholar] [CrossRef]
- Vanderkimpen, P.; Peeters, P. Flood modeling for risk evaluation: A MIKE FLOOD sensitivity analysis. In Proceedings of the International Conference on Fluvial Hydraulics (River Flow 2008), Çeșme, Izmir, Turkey, 3–5 September 2008; pp. 2335–2344. [Google Scholar]
- Saberi, O.; Dorfman, C.; Zenz, G. 2-D Hydraulic Modelling of a Dam Break Scenario. Conference: ICOLD 2013. 2013. Available online: https://www.researchgate.net/publication/311807694 (accessed on 15 October 2021).
- Yakti, B.P.; Adityawan, M.B.; Farid, M.; Suryadi, Y.; Nugroho, J.; Hadihardaja, I.K. 2D Modeling of Flood Propagation Due to the Failure of Way Ela Natural Dam. MATEC Web of Conferences 147. 2018. Available online: https://www.matec-conferences.org/articles/matecconf/abs/2018/06/matecconf_sibe2018_03009/matecconf_sibe2018_03009.html (accessed on 15 October 2021).
- Banasiak, R. 1D or/and 2D numerical modelling of river flood—Practical approaches towards flood hazard mapping for the Odra River, Poland. In Proceedings of the 6th IAHR Europe Congress, Warsaw, Poland, 15–18 February 2021. [Google Scholar]
- Shah, M.R.M.; Sidek, L.M.; Yalit, M.R.; Marufuzzaman, M.; Basri, H.; Yaacob, K.M. 2D Hydraulic Modelling of Dam Break Analysis Using MIKE FLOOD for Kenyir Dam. In ICDSME 2019. Proceedings of the 1st International Conference on Dam Safety Management and Engineering (Water Resources Development and Management); Sidek, L., Salih, G.H.A., Boosroh, M.H., Eds.; Springer: Singapore, 2019. [Google Scholar] [CrossRef]
- Jelonek, L.; Wrzeszcz, L.; Zawiślak, J.; Walther, P.; Winkler, U.; Wortha, S.; Srejber, J.; Petr, J. Common Polish, Czech and German Report on the Flood Event on 7–10 August 2010 on the Nysa Łużycka River for the Preliminary Flood Risk Assessment Conform with the EU Art. 4 Flood Directive (2007/60/EG); Institute of Meteorology and Water Management (IMGW): Wrocław, Poland, 2010. (In Polish) [Google Scholar]
- Flood: Zgorzelec under water. Gazeta.pl. Available online: https://www.youtube.com/watch?v=UEFCJWT6HtQ (accessed on 15 October 2021).
- Tokarczyk, T.; Banasiak, R.; Bogusz, A.; Orczykowski, T.; Zdralewicz, M. Assessment of the Niedów Dambreak on the Flood Wave Propagation on the Lusatian Neisse on the Section between the Witka River and the Zgorzelec Gauging Station; Institute of Meteorology and Water Management (IMGW): Wrocław, Poland, 2011. (In Polish) [Google Scholar]
- McCowan, A.D.; Rasmussen, E.B.; Berg, P. Improving the Performance of a Two-dimensional Hydraulic Model for Floodplain Applications. The Institution of Engineers, Australia. Conference on Hydraulics in Civil Engineering, Hobart 28–30 November, Models. Nat. Hazards 2001, 84, 1385–1418. [Google Scholar]
- Kho, F.W.L.; Law, P.L.; Lai, S.H.; Oon, Y.W.; Ngu, L.H.; Ting, H.S. Quantitative dam break analysis on a reservoir earth dam. Int. J. Environ. Sci. Tech. 2009, 6, 203–210. [Google Scholar] [CrossRef]
- Ahmad, S.; Simonović, S.P. Comparison of One-Dimensional and Two-Dimensional Hydrodynamic Modeling Approaches for Red River Basin; Final Report to International Joint Commission; University of Manitoba: Winnipeg, MB, Canada, 1999. [Google Scholar]
- DHI: MIKE21 Flow Model & MIKE 21 Flood Screening Tool. In Hydrodynamic Module; Scientific Documentation: Hørsholm, Denmark, 2017.
- Arcement, G.J.; Schneider, V.R. Guide for selecting Manning’s roughness coefficients for natural channels and flood plains. U.S. Geological Survey. In Water Supply Paper; U.S. Government Publishing Office, Federal Center: Denver, CO, USA, 1989; Volume 2339. [Google Scholar] [CrossRef] [Green Version]
- Morvan, H.; Knight, D.; Wright, N.; Tang, X.; Crossley, A. The concept of roughness in fluvial hydraulics and its formulation in 1D, 2D and 3D numerical simulation models. J. Hydraul. Res. 2008, 46, 191–208. [Google Scholar] [CrossRef]
- Hall, J.W.; Tarantola, S.; Bates, P.D.; Horritt, M.S. Distributed sensitivity analysis of flood inundation model calibration. J. Hydraul. Eng. 2005, 131, 117e126. [Google Scholar] [CrossRef]
- Pappenberger, F.; Beven, K.; Horritt, M.; Blazkova, S. Uncertainty in the calibration of effective roughness parameters in HEC-RAS using inundation and downstream level observations. J. Hydrol. 2005, 302, 46–69. [Google Scholar] [CrossRef]
Figure 1.
The catchment area of the Witka River.

Figure 2.
Plan view of the Niedów Dam.

Figure 3.
Ogee weir cross-section.

Figure 4.
Cross-section of the earth dam.

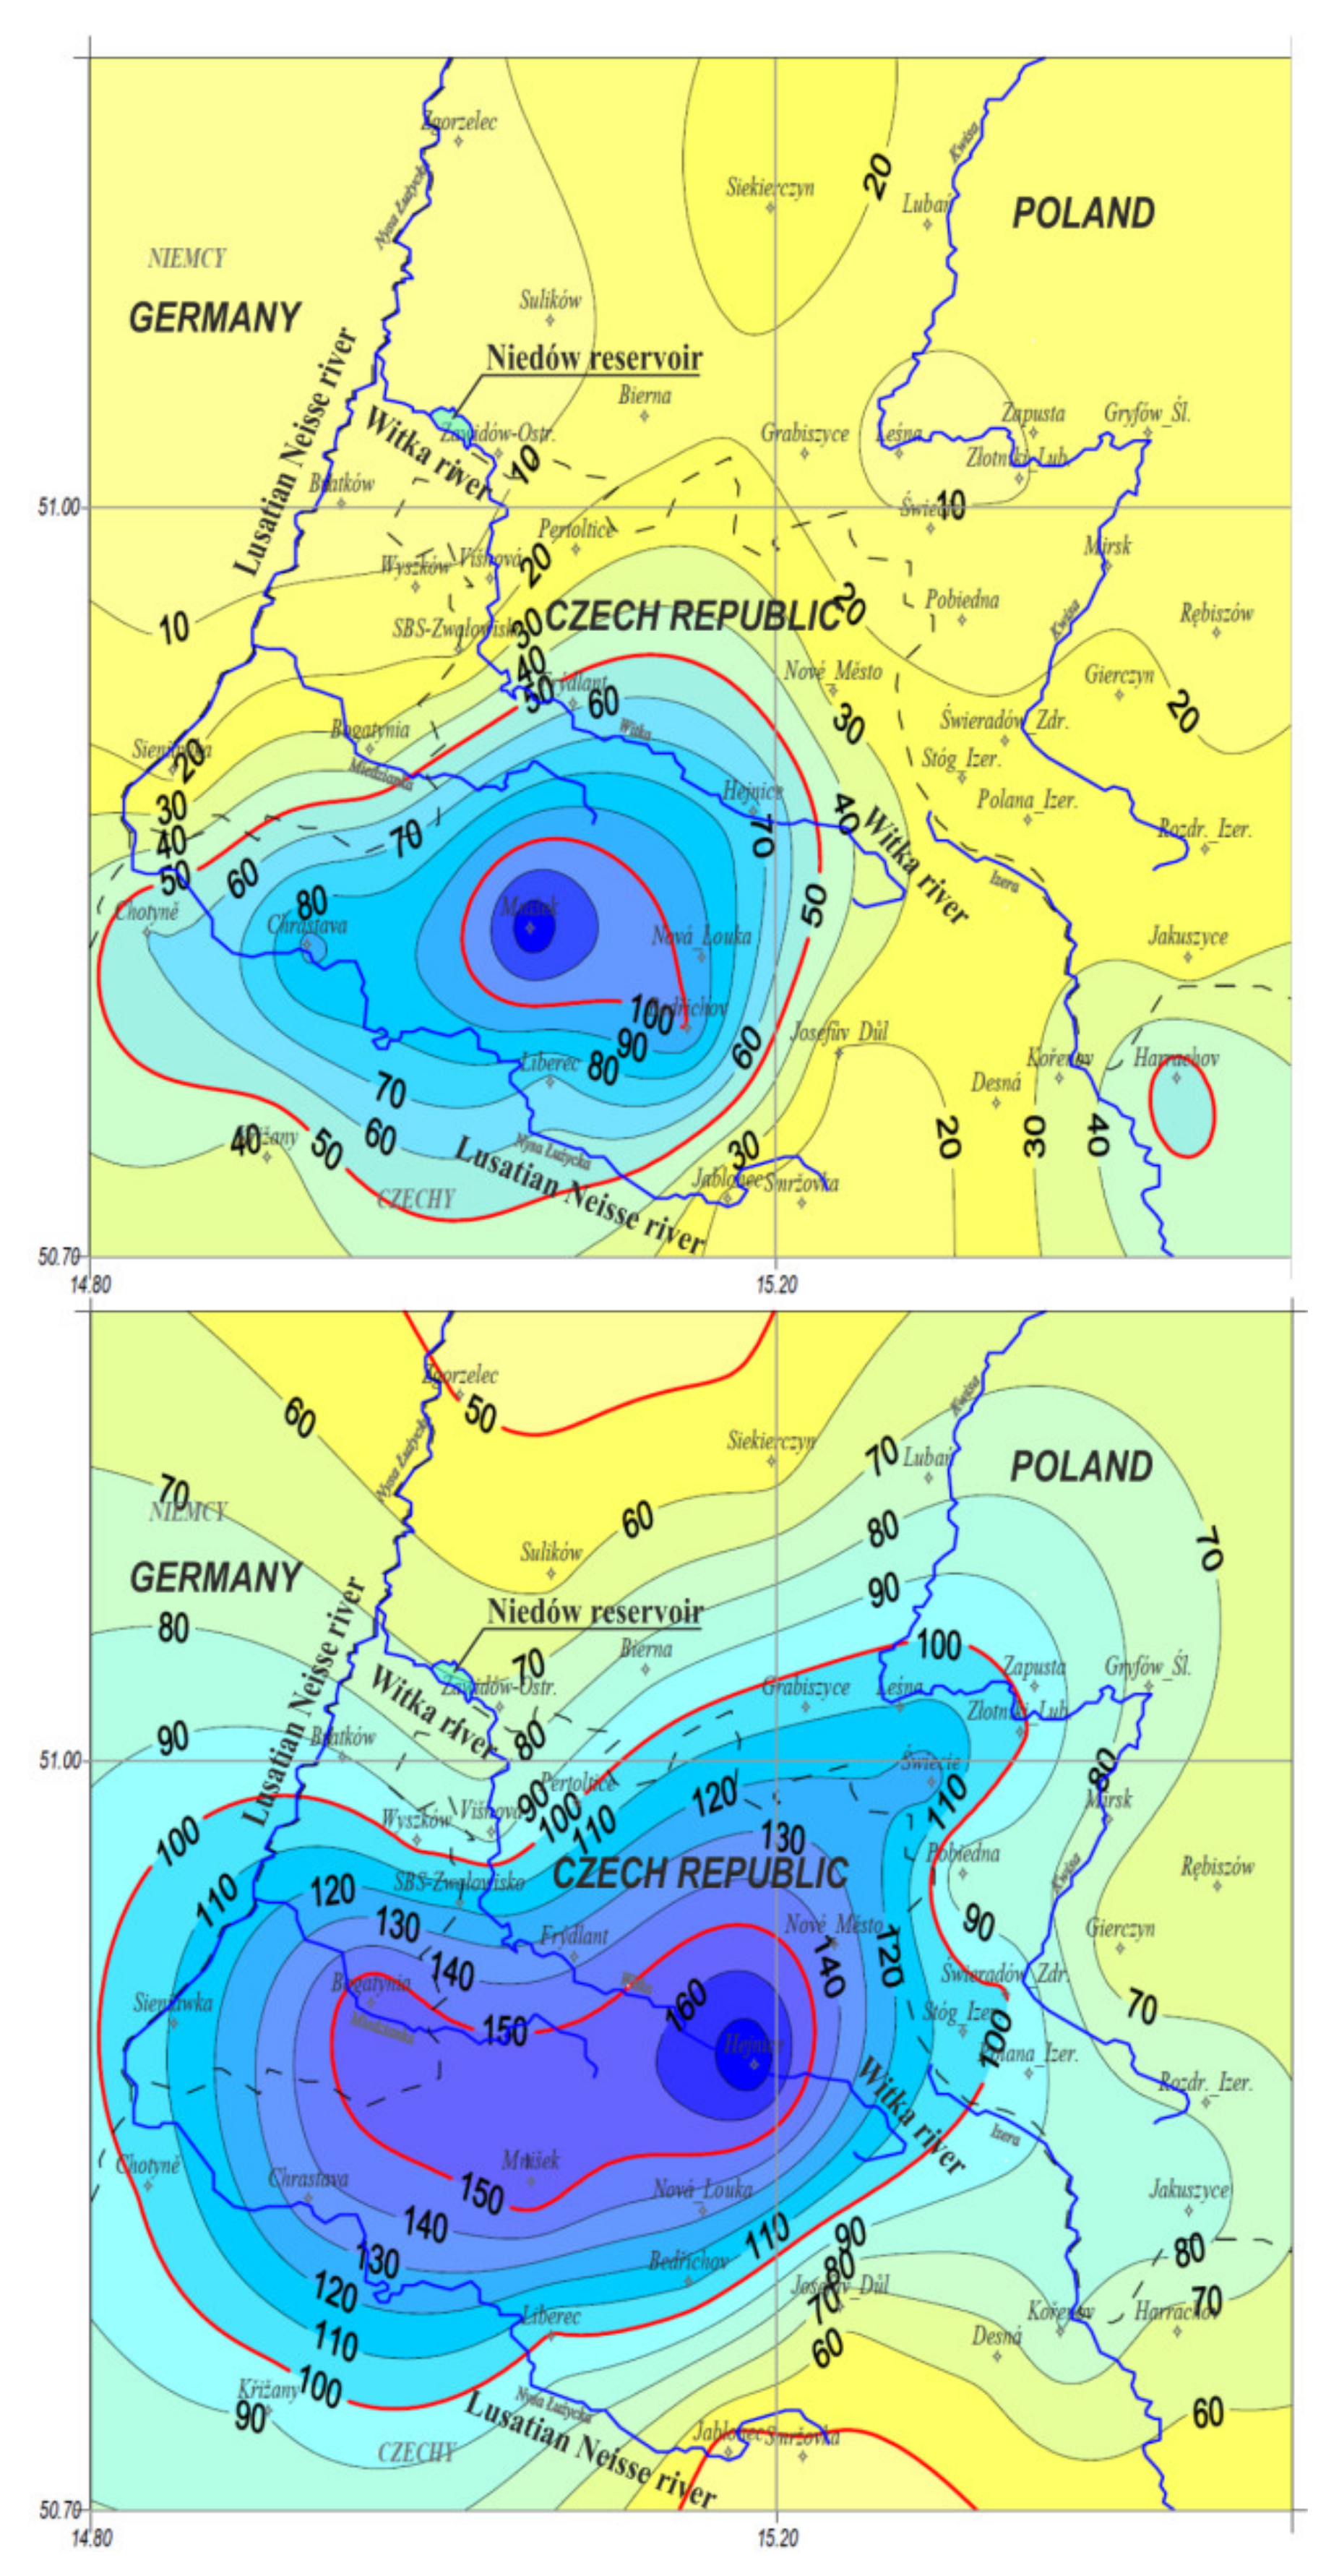
Figure 5.
Rainfall values for 6.08.2010 (top) and 7.08.2010 (bottom) (in mm, source: [33]).
Figure 5.
Rainfall values for 6.08.2010 (top) and 7.08.2010 (bottom) (in mm, source: [33]).

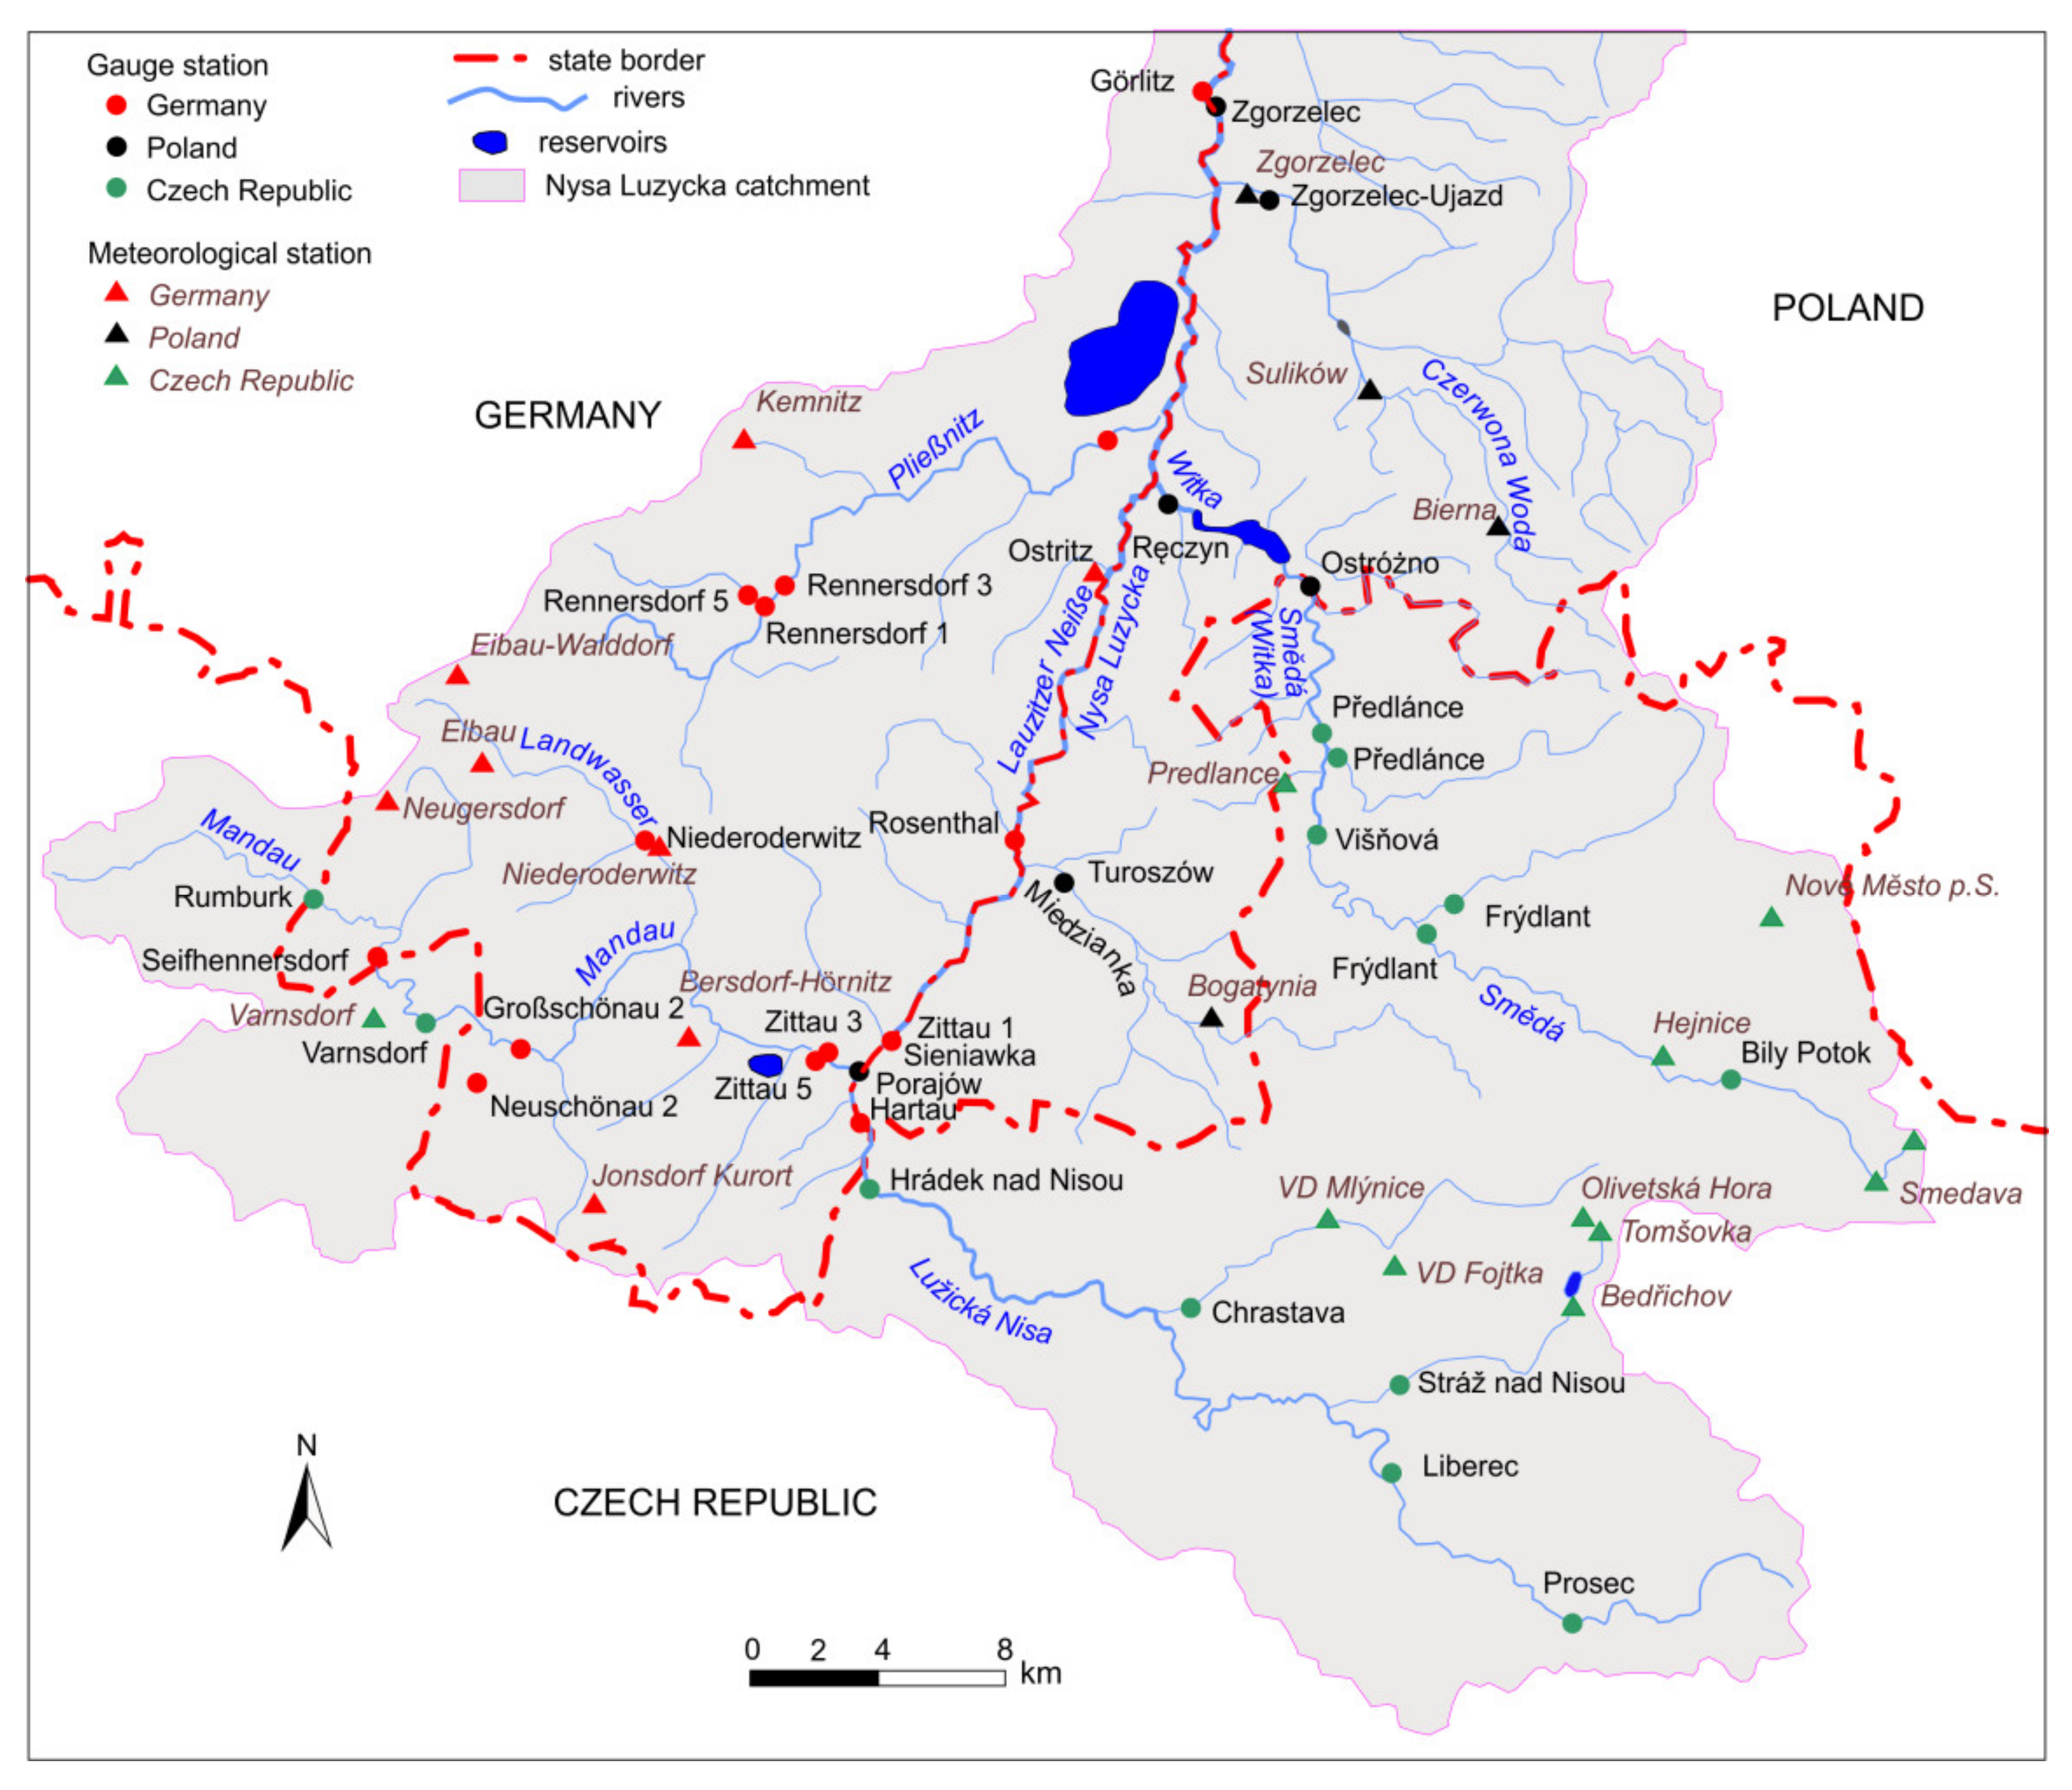
Figure 6.
The upper Lusatian Neisse catchment area up to the Görlitz (GE)/Zgorzelec (PL) gauge station.
Figure 6.
The upper Lusatian Neisse catchment area up to the Görlitz (GE)/Zgorzelec (PL) gauge station.

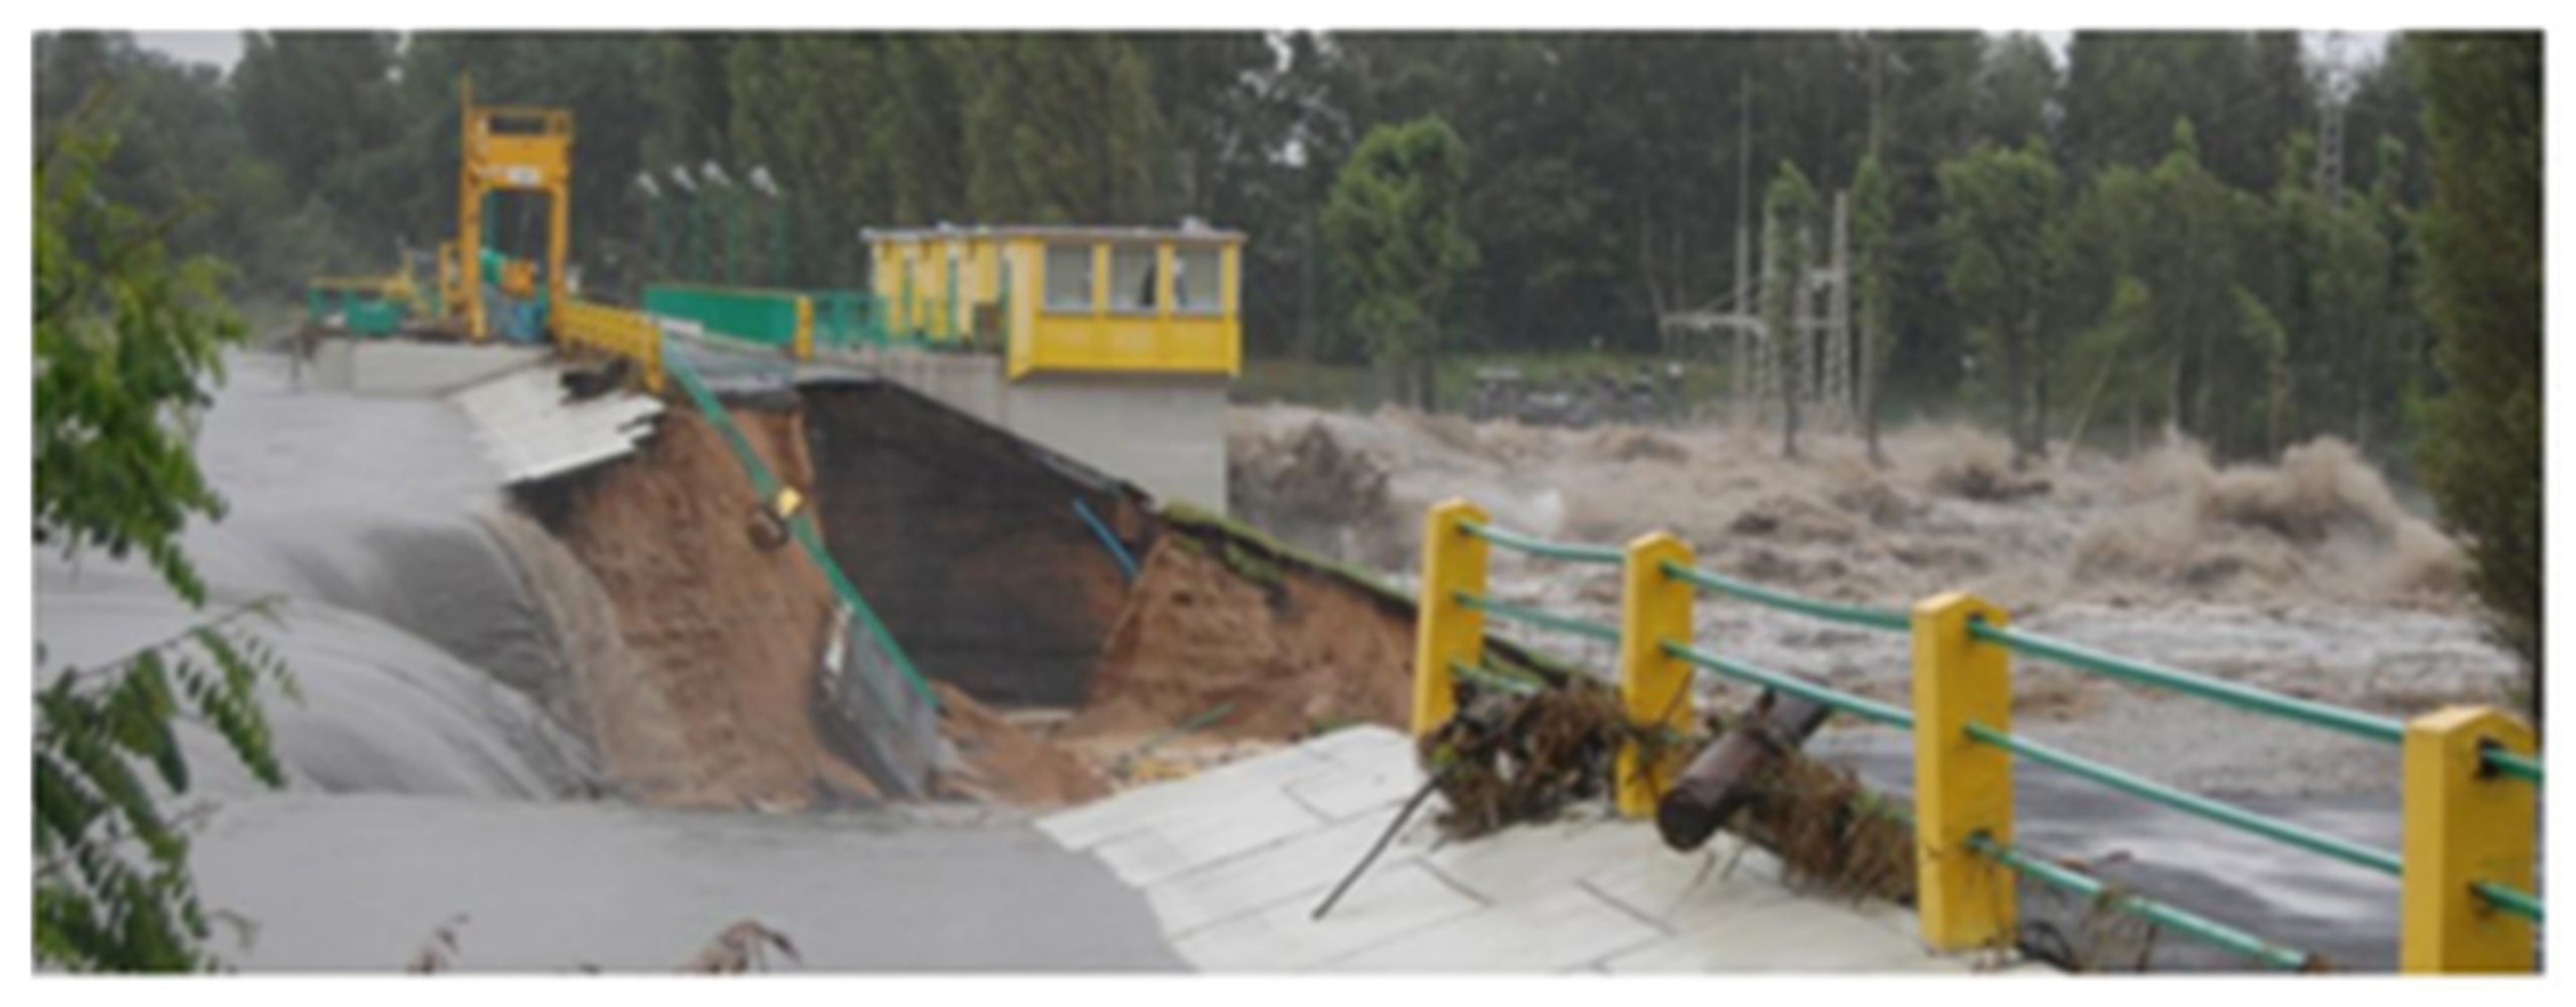
Figure 7.
View from the right bank on 7 August 2010, time 18:22. Behind the concrete structure, an immense outflow is visible after the abutment had collapsed. Water level in the reservoir ca. 210.90 m a.s.l.
Figure 7.
View from the right bank on 7 August 2010, time 18:22. Behind the concrete structure, an immense outflow is visible after the abutment had collapsed. Water level in the reservoir ca. 210.90 m a.s.l.

Figure 8.
Broken left retaining wall of the control structure on 7 August 2010, time ca. 20:00.

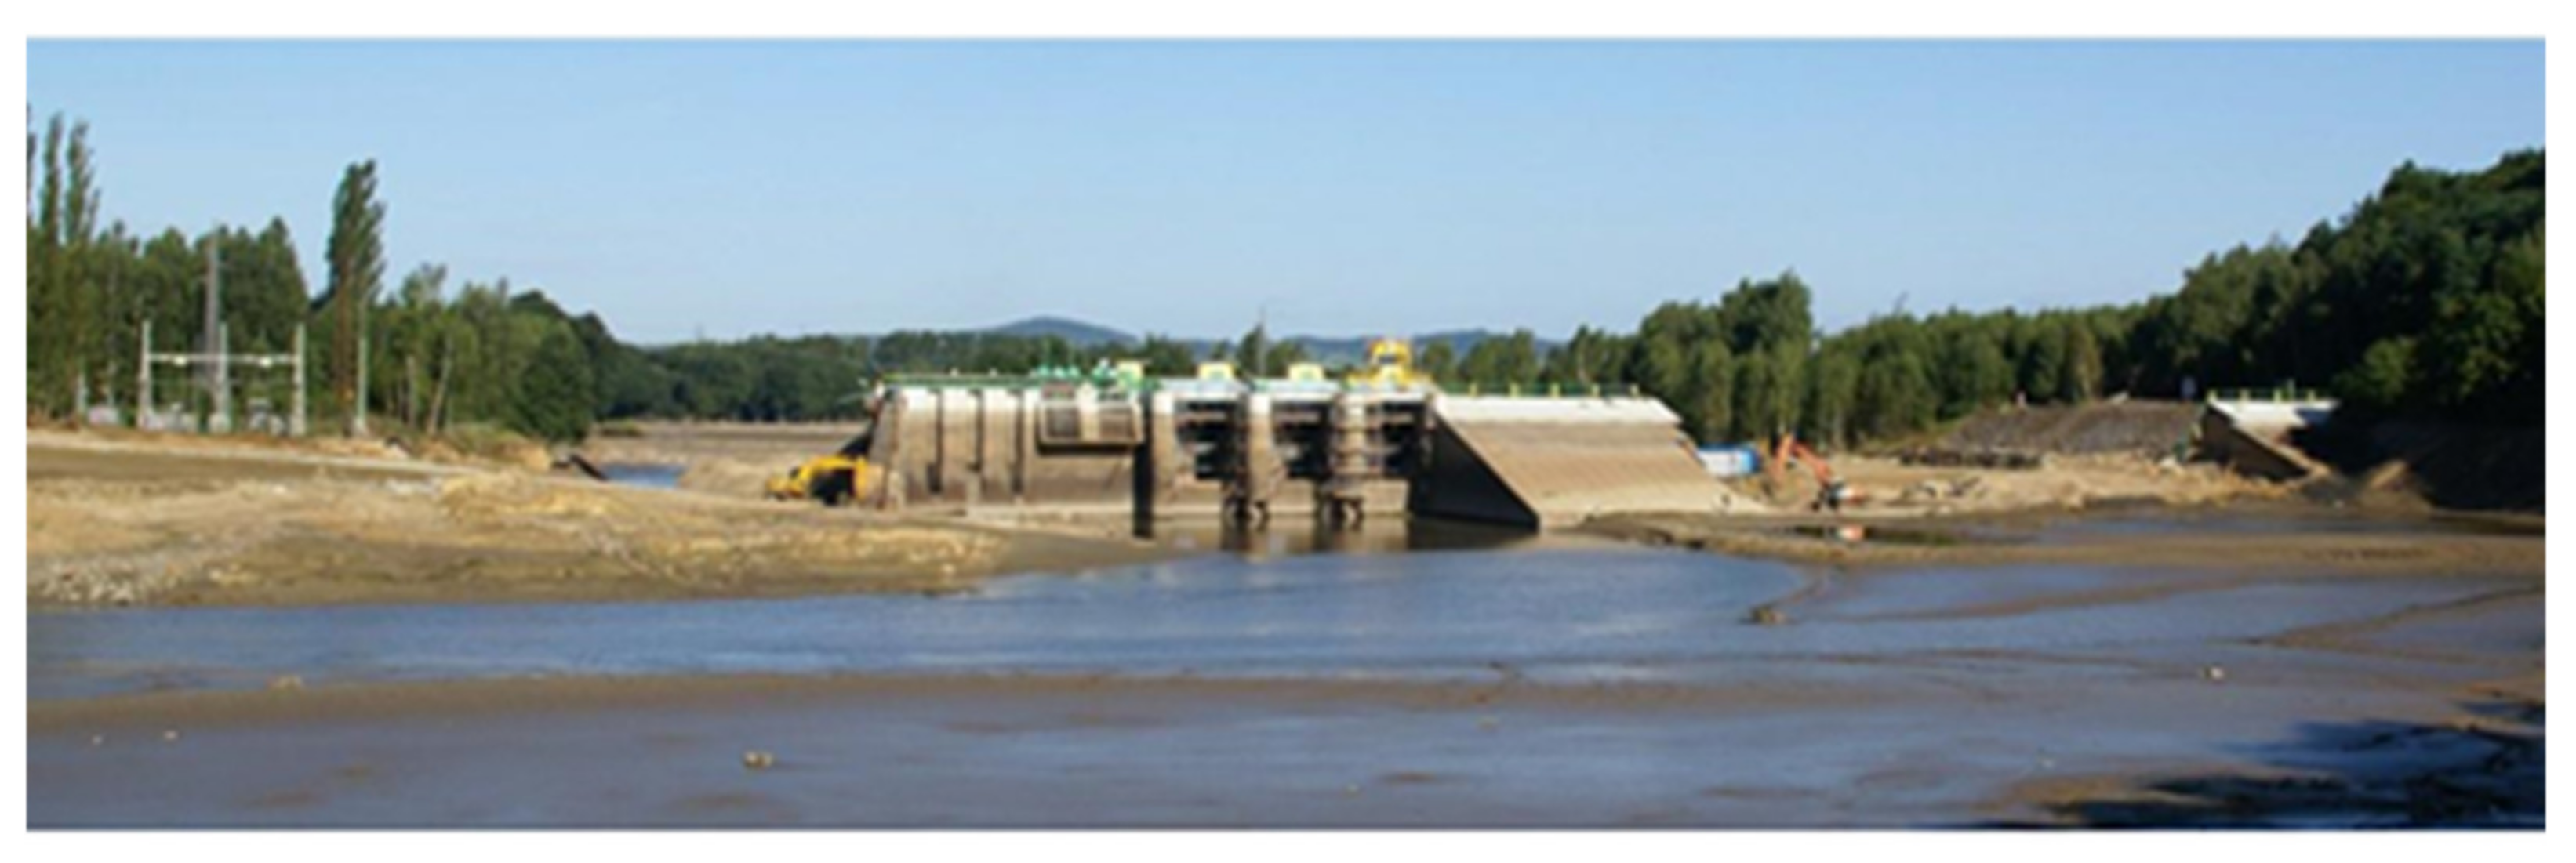
Figure 9.
The final breach of the dam-an upstream view on 12 August 2010.

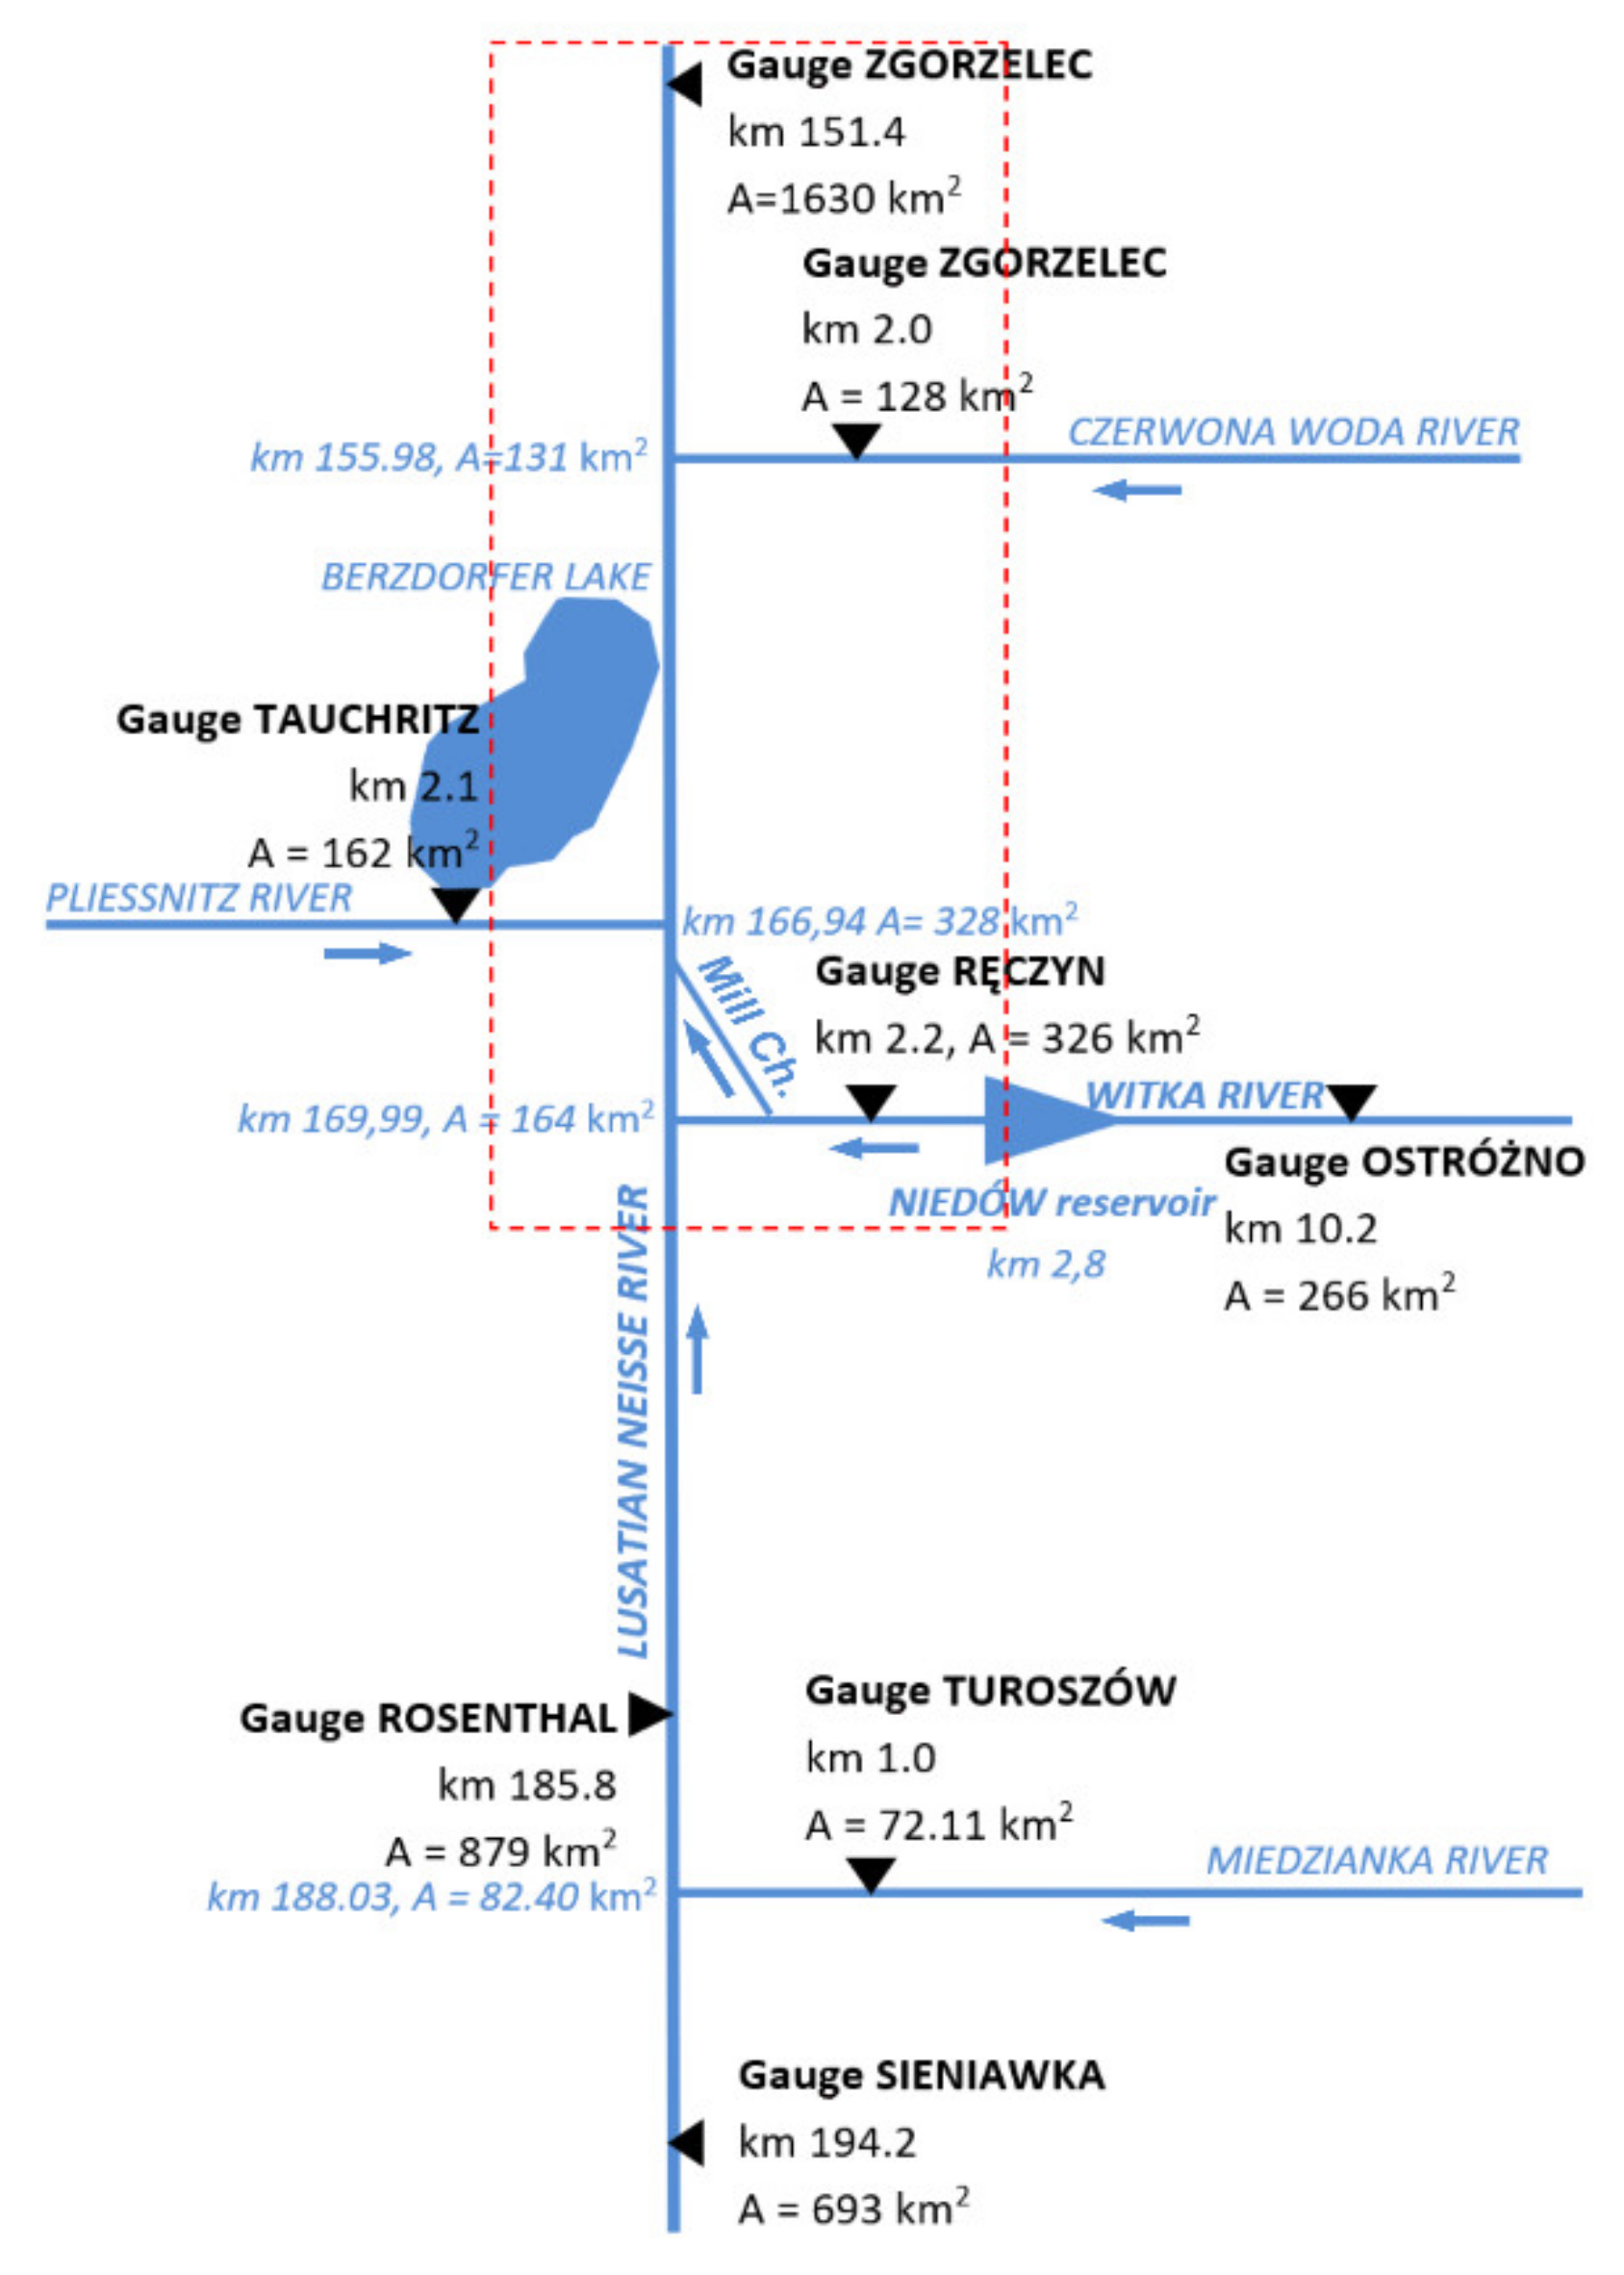
Figure 10.
Hydrological scheme for the modeled domain (the dashed line indicates part of the 2D model).
Figure 10.
Hydrological scheme for the modeled domain (the dashed line indicates part of the 2D model).

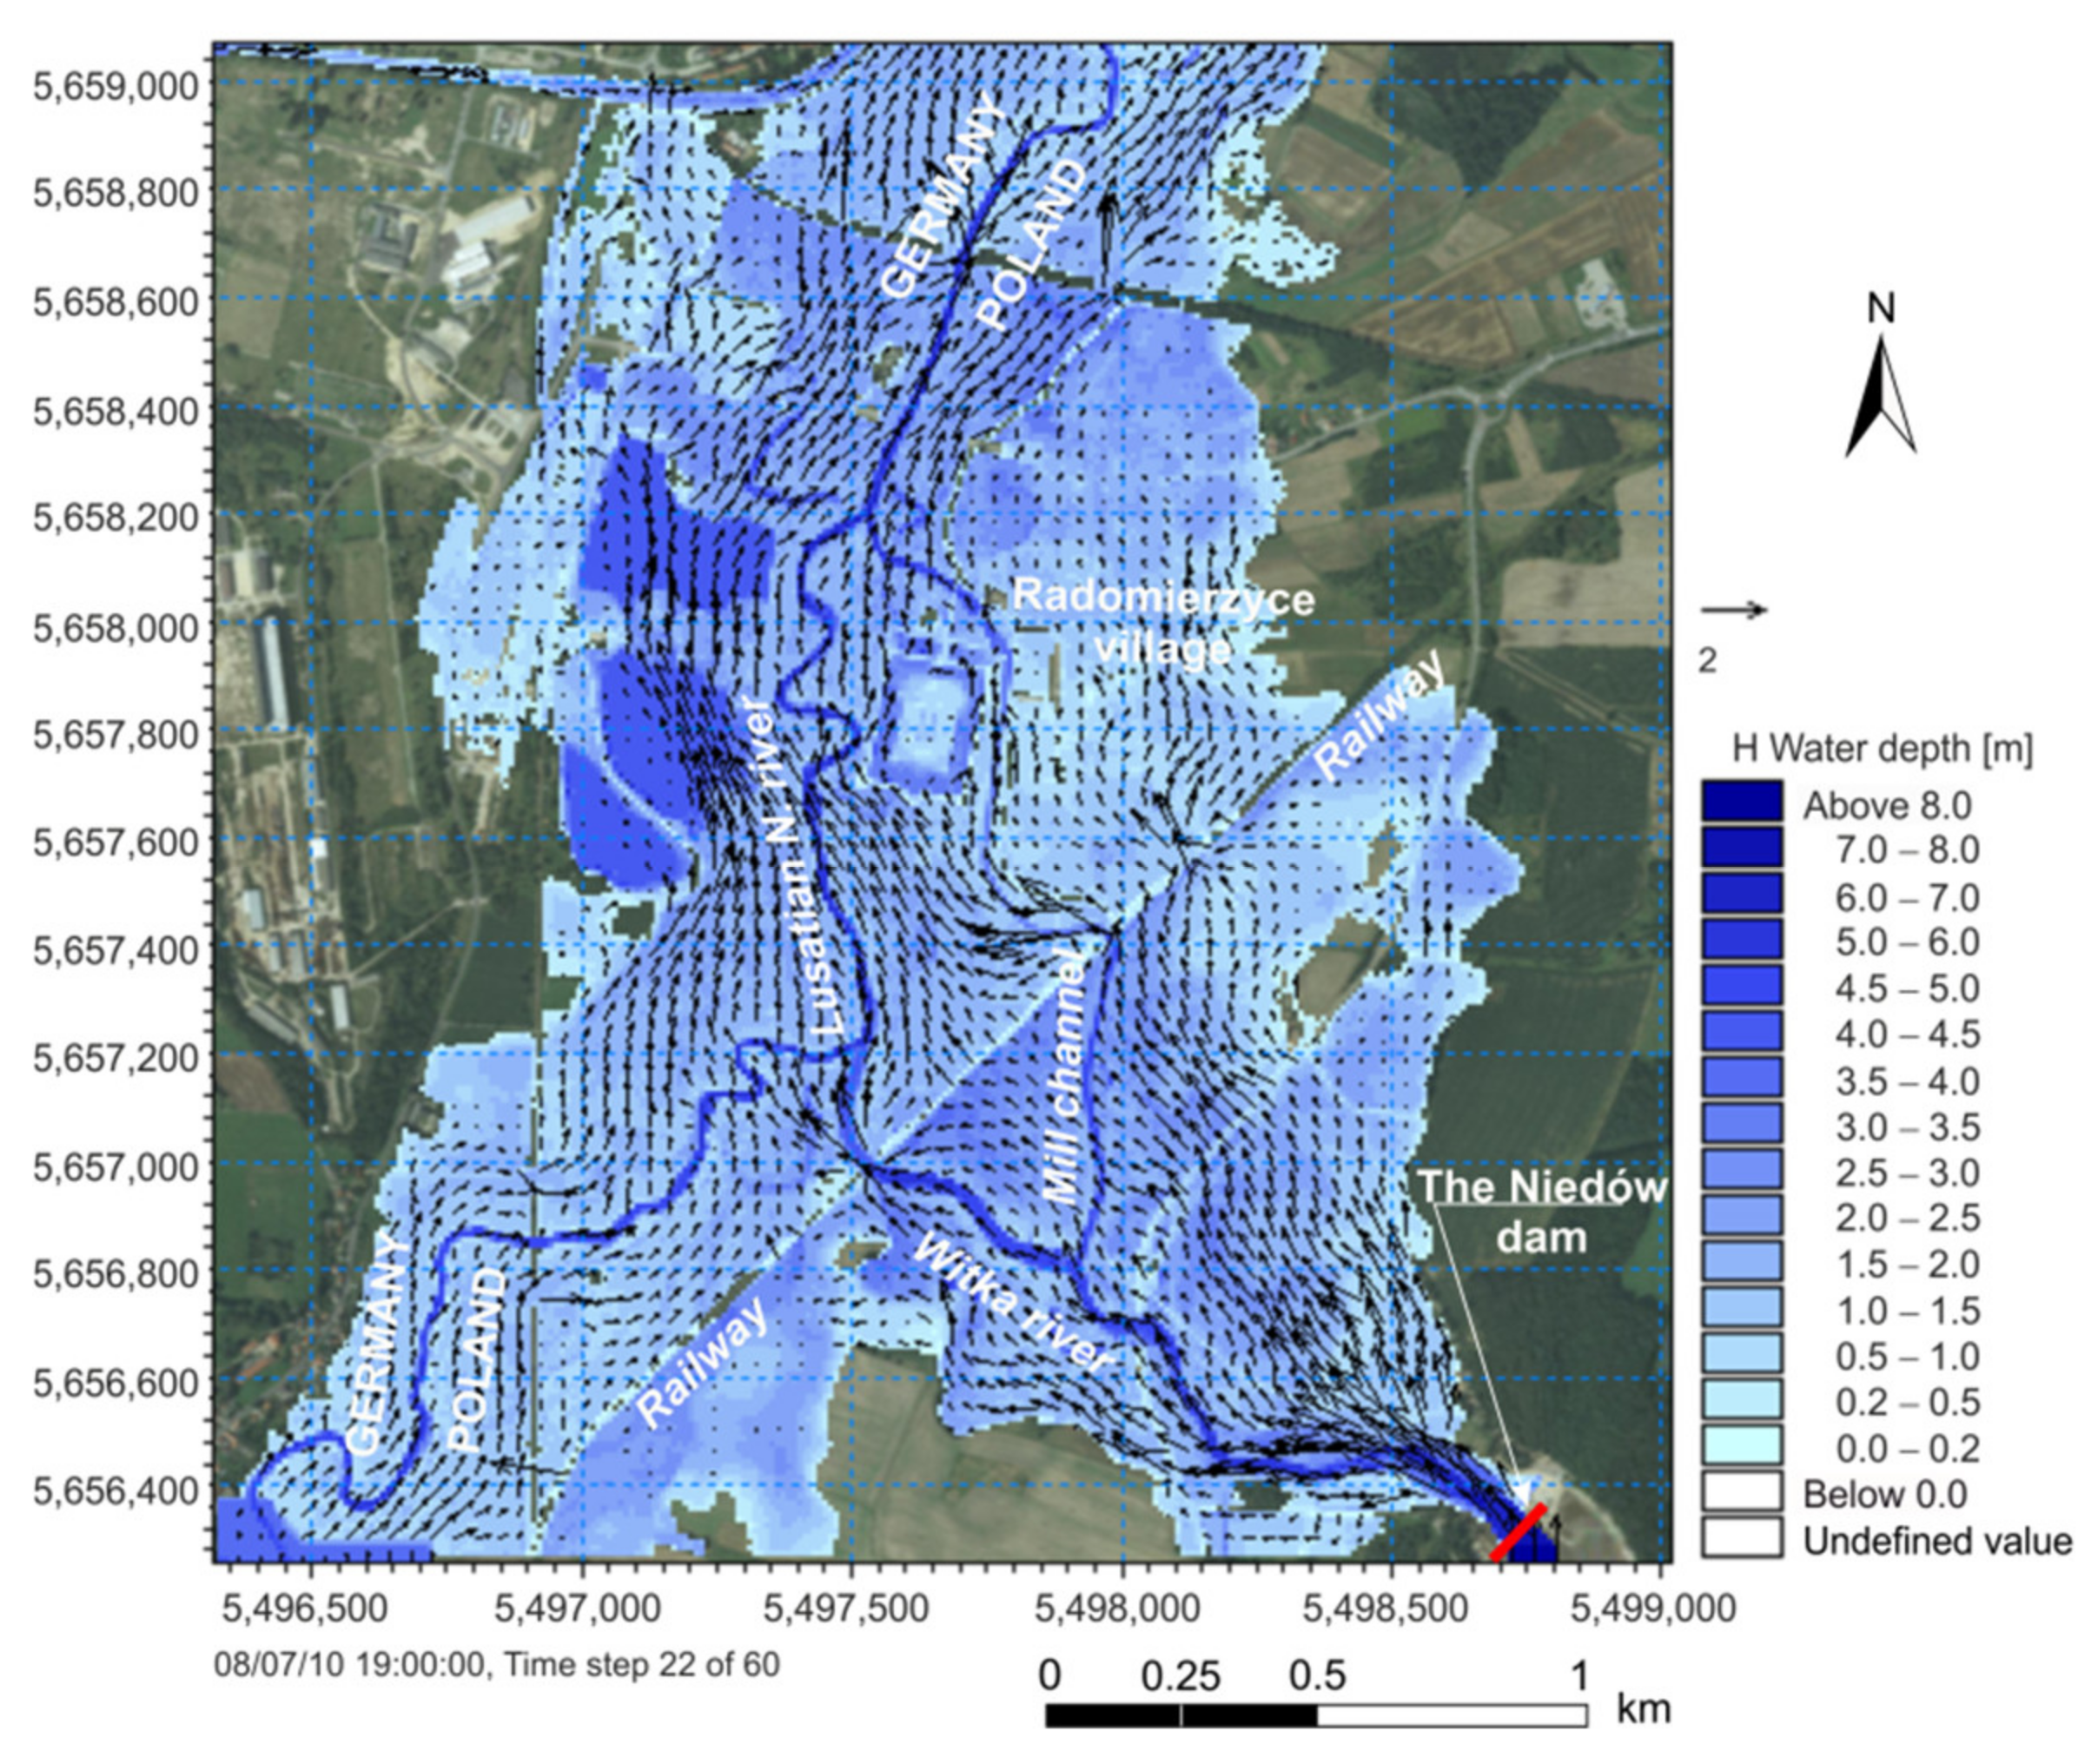
Figure 11.
Simulated water depth and flow velocity vectors downstream from the Niedów dam (Polish UWPP 2000 Reference system (m)). The flood wave hit first the railway embankment with two bridges (on the Witka river and the Mill channel) running diagonally, then the Radomierzyce village (in the village center is a castle surrounded by a moat).

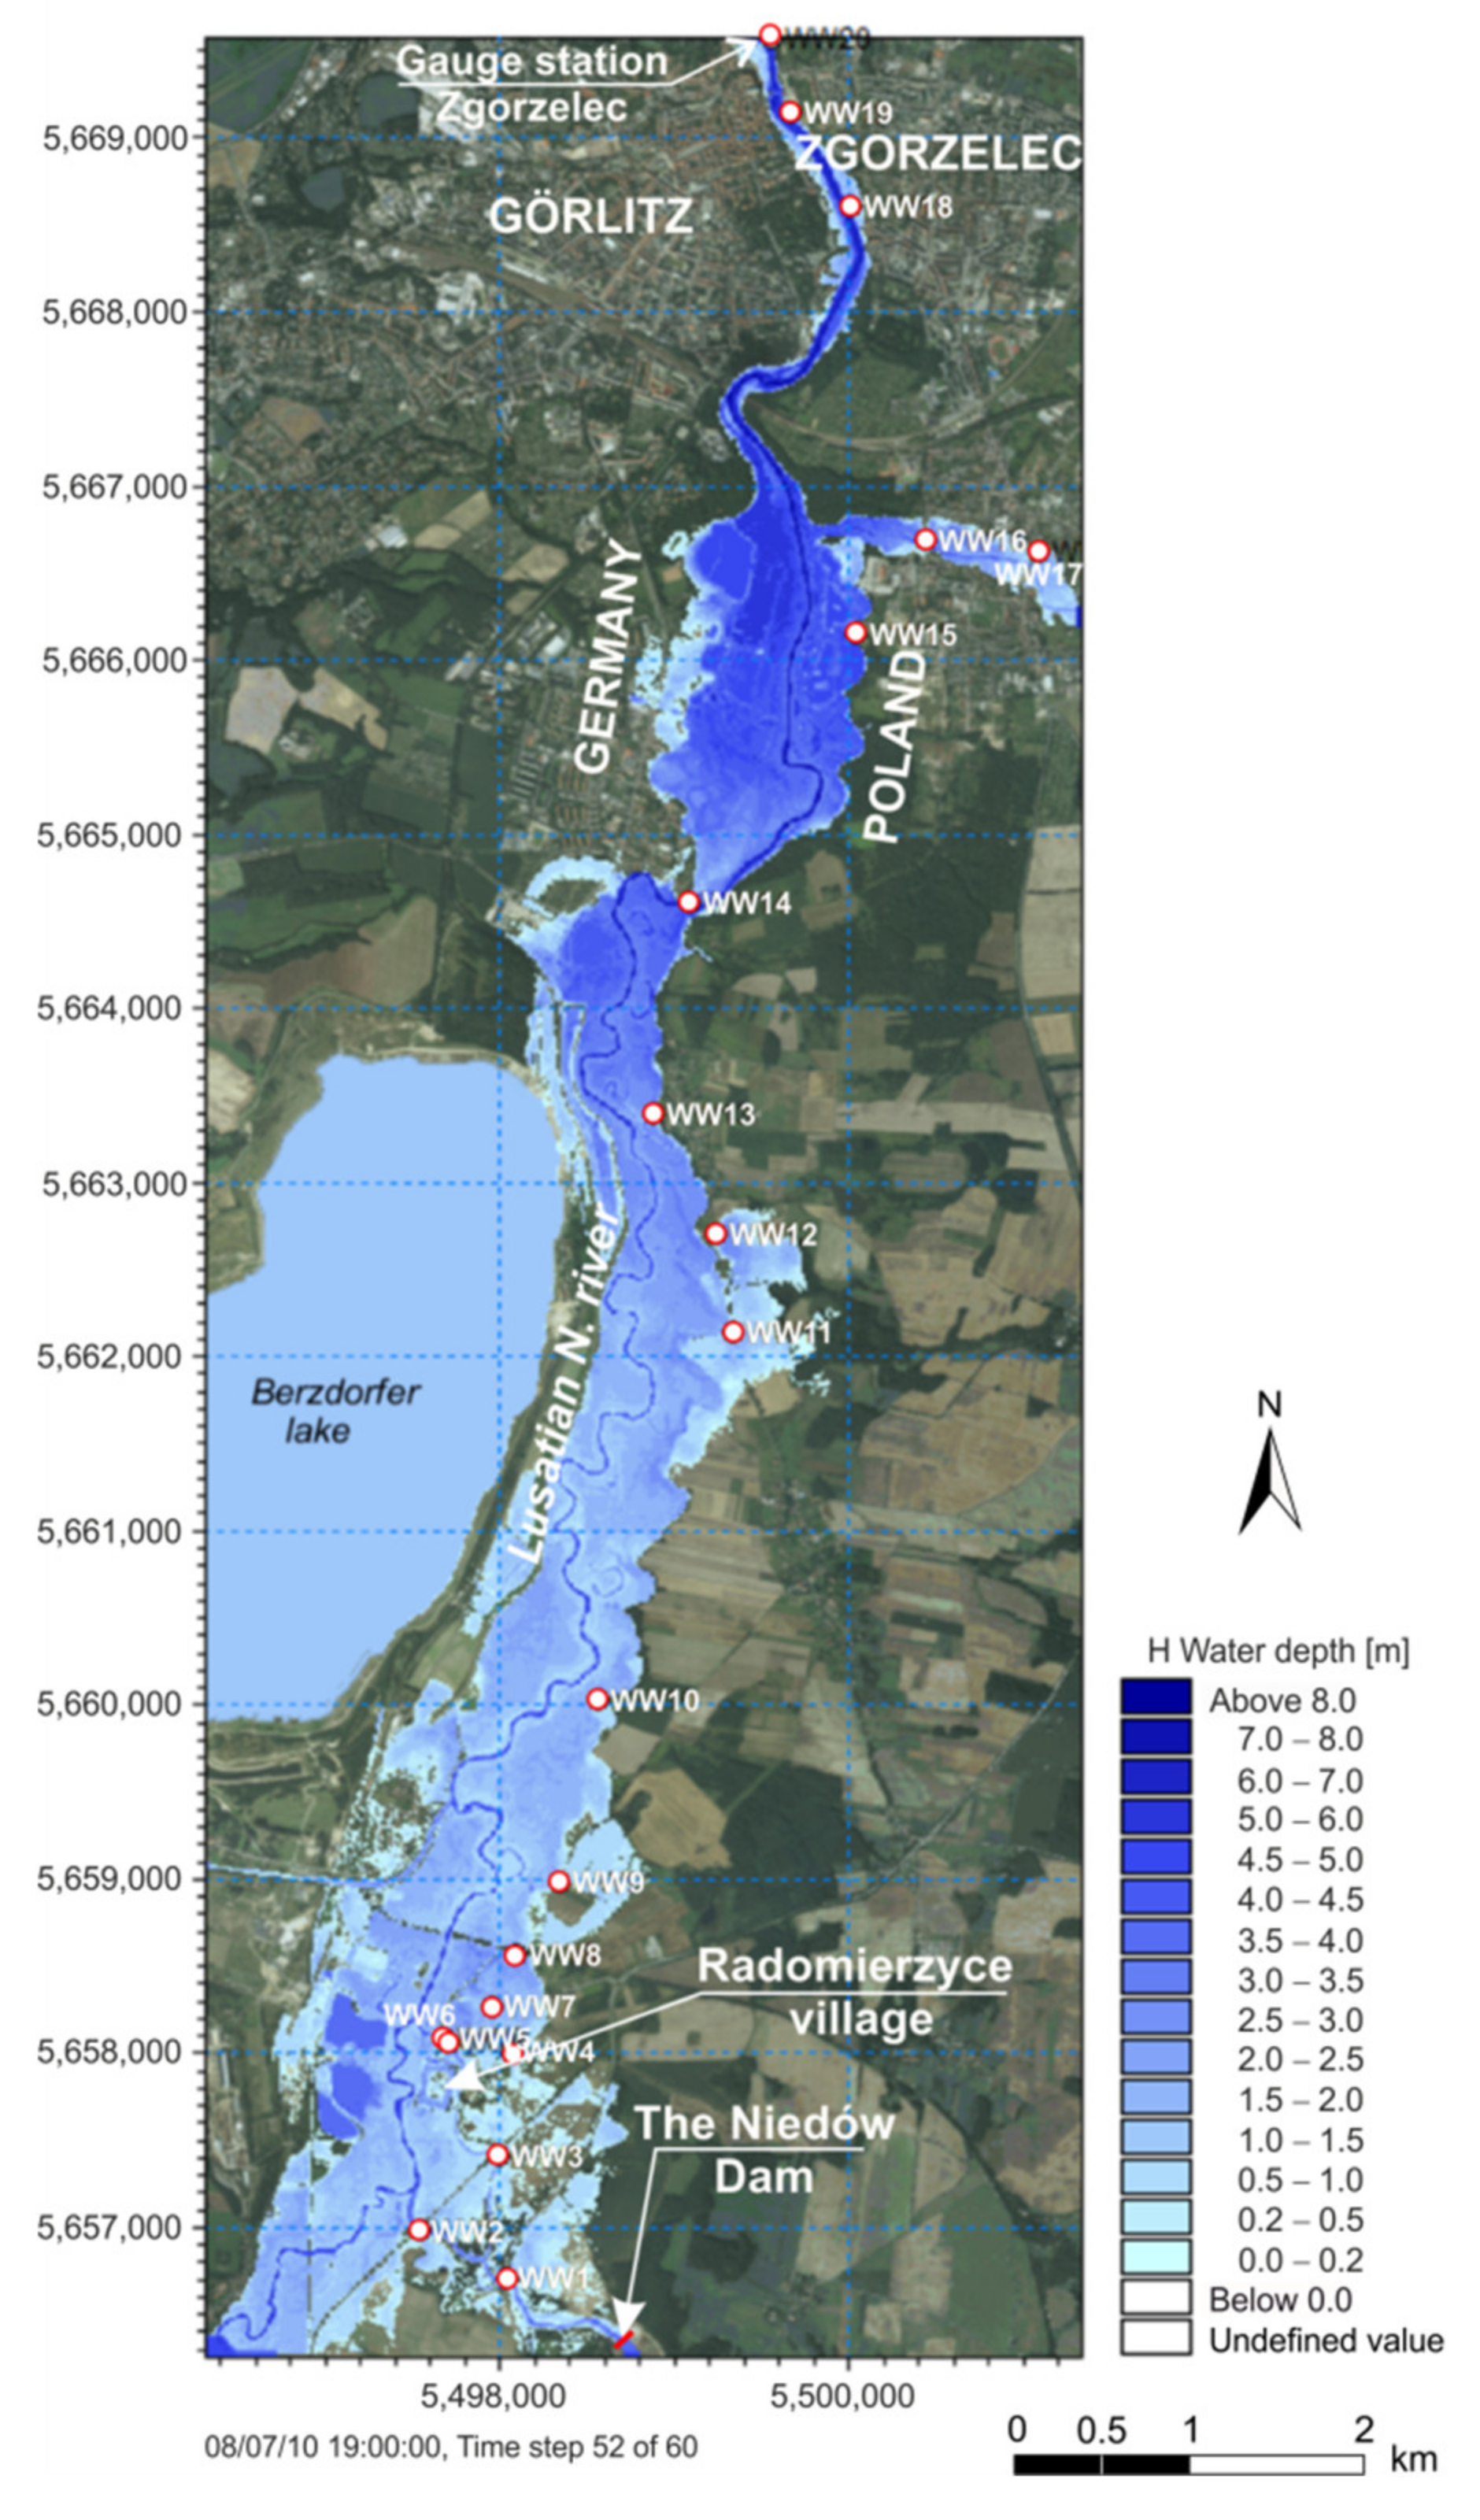
Figure 12.
2D simulation of the flood on the Lusatian Neisse in 2010. The flood wave peaked in the city of Zgorzelec, while it descended in the village of Radomierzyce, and the reservoir became empty.
Figure 12.
2D simulation of the flood on the Lusatian Neisse in 2010. The flood wave peaked in the city of Zgorzelec, while it descended in the village of Radomierzyce, and the reservoir became empty.

Figure 13.
Discharge hydrographs for the inflow to the reservoir and the outflow from the reservoir. The latter was the result of the dam’s failure, which was determined during 2D calculations. The vertical axis on the right shows the cumulated curve of the outflow from the reservoir—the final difference between the curves of both scenarios indicates the water retention in the reservoir under normal conditions.

Figure 14.
Hydrographs of discharges of the Witka and the Lusatian Neisse Rivers.

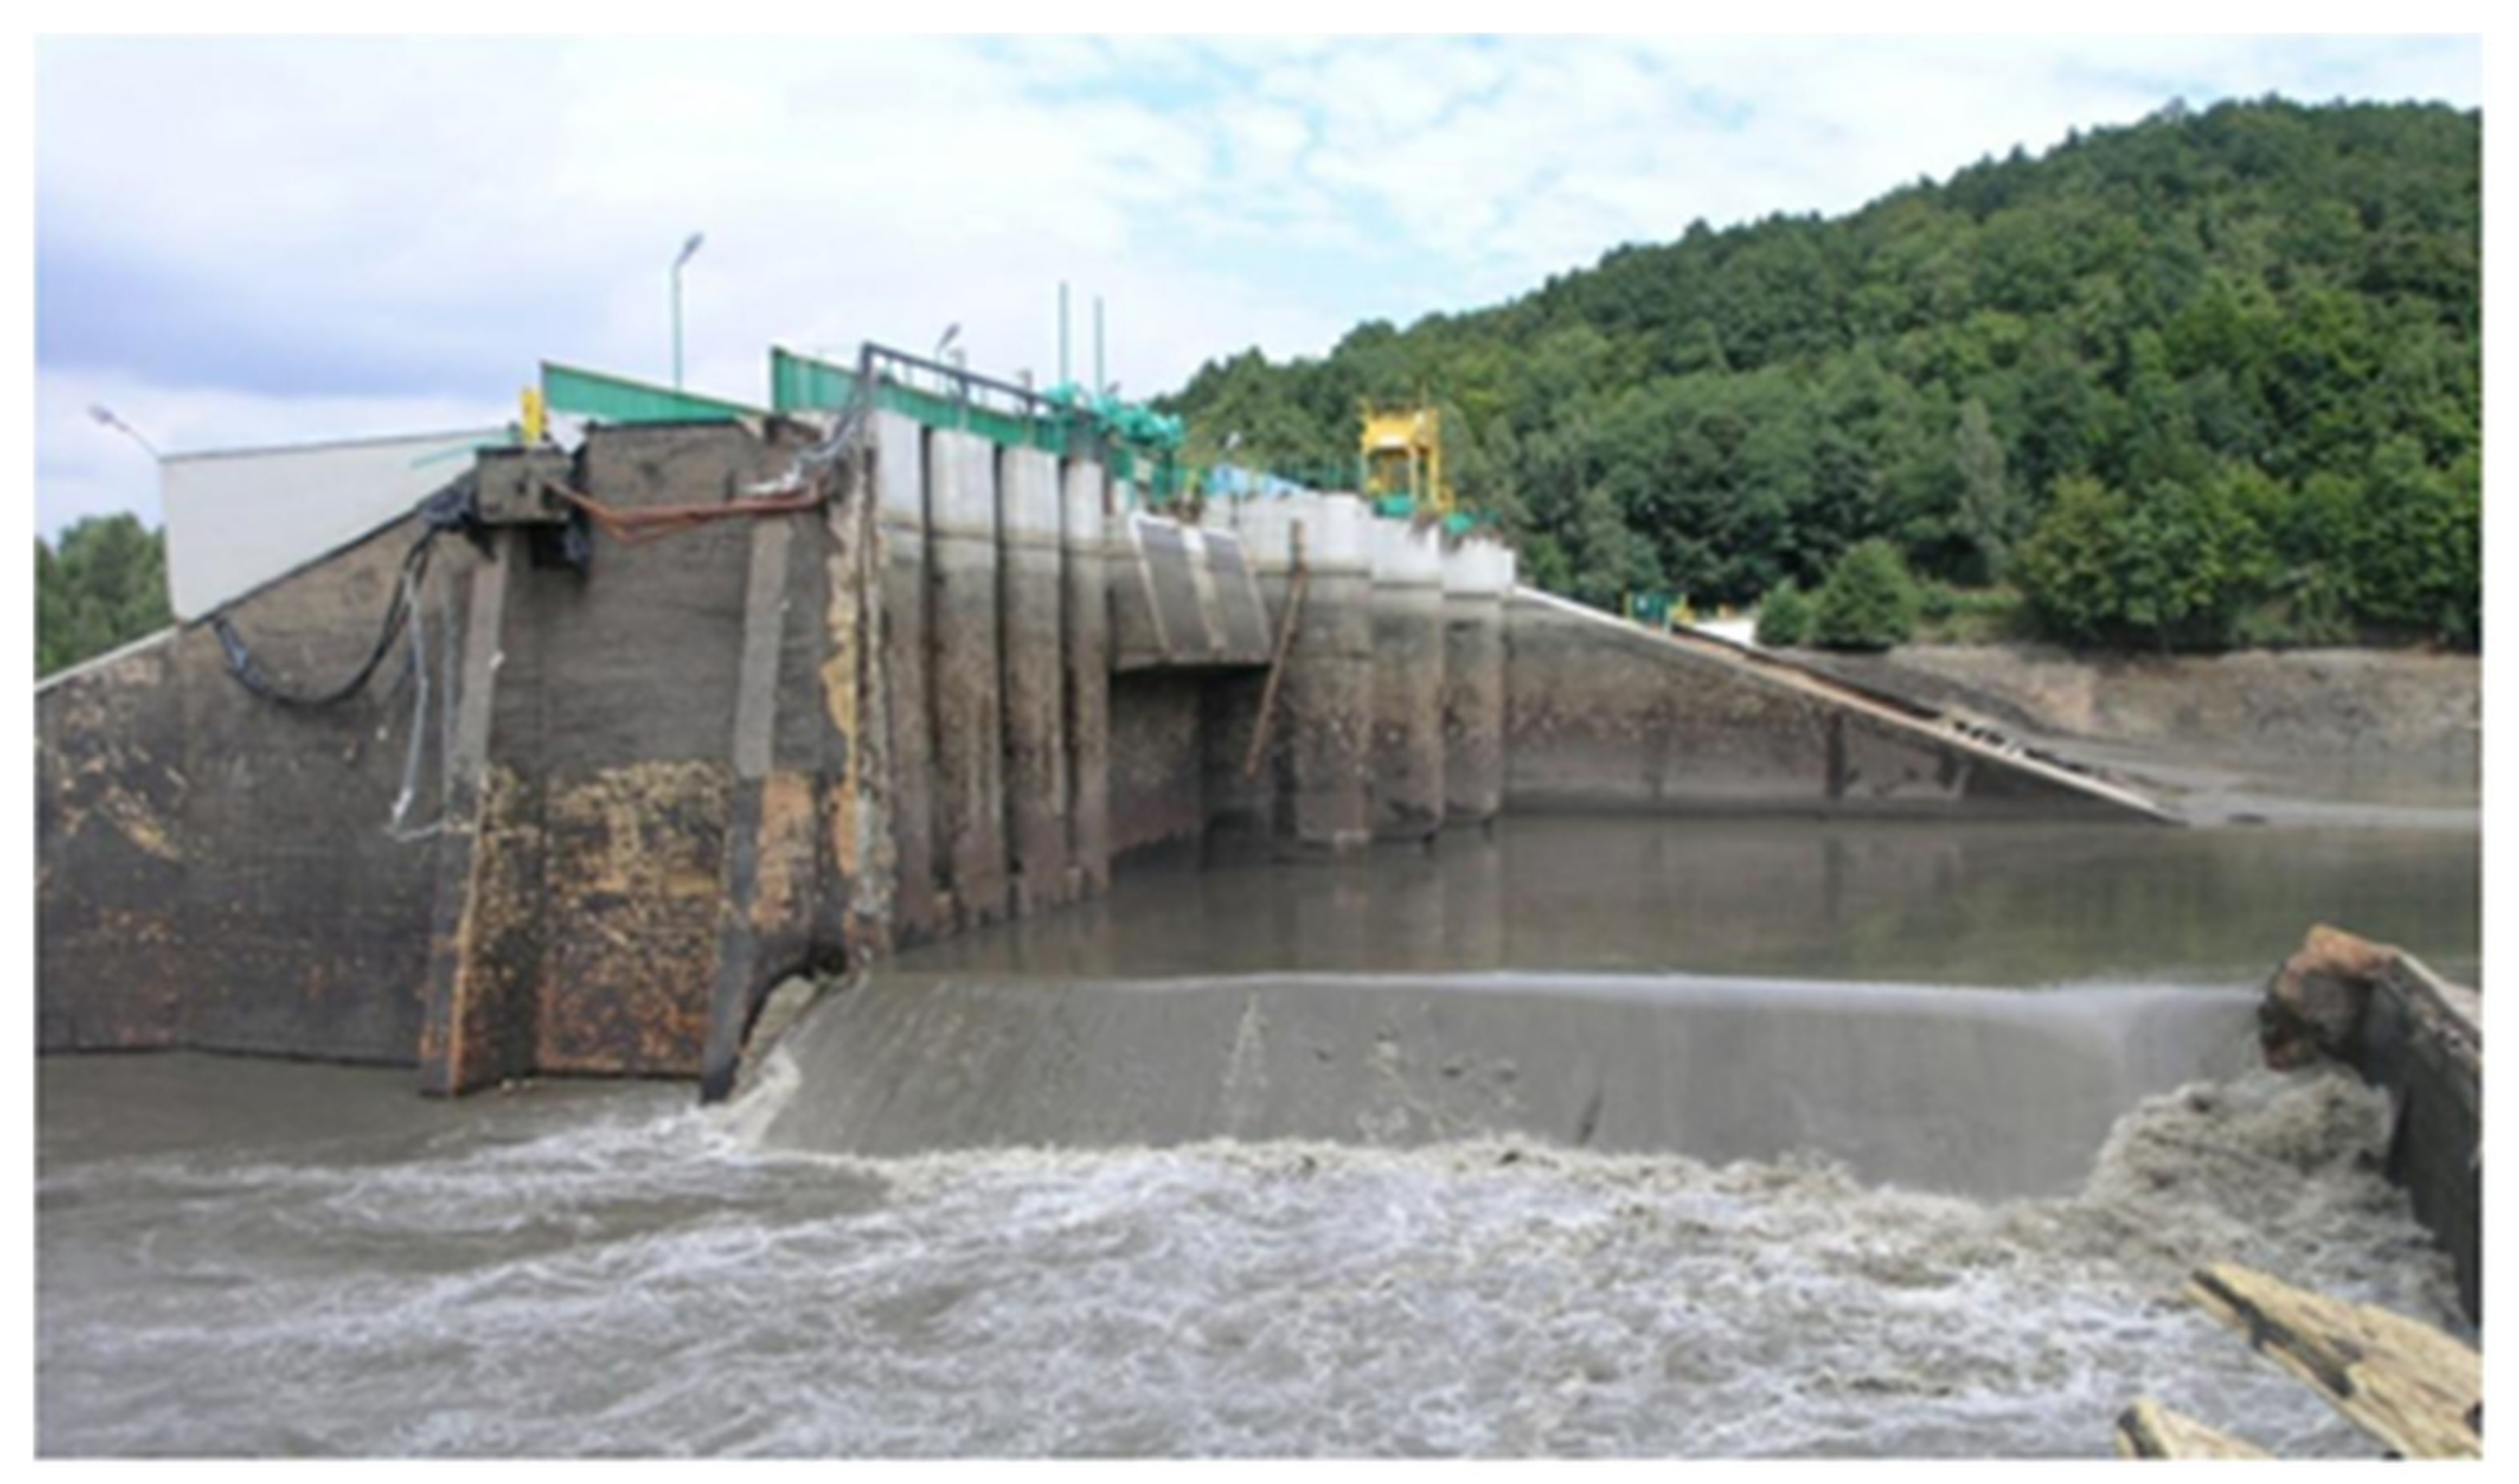
Figure 15.
The reconstructed Niedów dam (September 2016). A view of the labyrinth weir and the steel cofferdam, which will not be dismantled.
Figure 15.
The reconstructed Niedów dam (September 2016). A view of the labyrinth weir and the steel cofferdam, which will not be dismantled.


Table 1.
The development of the failure of the Niedów dam on 7 August 2010.
| Time | Development |
|---|---|
| 15:0 | Outflow from the reservoir–86.1 m3s−1, WL–210.02 m a.s.l., gates I, II, and III open 0.60, 0.61, 0.56 m, respectively. |
| 16:00 | Outflow from the reservoir–261.1 m3s−1, WL 210.21 m a.s.l., gates I, II, and III open 1.50, 1.70, 2.50 m, respectively. |
| 16:10 | A rapid rise in the water level in the reservoir. |
| 16:18 | Water inflow into the power plant and the control room, crew evacuation to the top of the dam, and continuation of manual opening of the gates. |
| 16:40 | The maximum water level at Ostróżno gauge station. |
| 17:00 | Beginning of the flow over the left dam, crew evacuated to the shore of the reservoir, gates I and III open 250 cm, II open 200 cm, outflow 352 m3s−1. |
| 17:15 | Beginning of the flow over the right dam. |
| 17:42 | Water level reaches a maximum of 212.05 m a.s.l. Washing-out of the lee side of the dam, destruction of the road on top of the dam with a length of 40 m on the left side and 30 m on the right side. |
| 18:10 | Water level at 211.60 m a.s.l. The breaching likely reached the dam floor. The collapse of the headwall of the left dam resulted in immense outflow through the breach. |
| 18:47 | The breach of the left dam is finished. The dam is washed out on a length of 106 m. |
| 18:56 | Water level-209.00 m a.s.l. The right dam continues breaching. |
| 19:25 | The breach of the right dam is complete. The dam is washed out with a width of 58 m. The reservoir releases the remaining water. |
| 21:00 | The reservoir became empty. |
Table 2.
Characteristics of the dam’s failure.
| Hydraulic Characteristics | ||||
|---|---|---|---|---|
| Reservoir Storage to the Crest Level | Surface Area to the Crest Level | Volume Stored Related to Hw | Depth behind Dam at Breach Inception | Peak Discharge |
| V | A | Vw | Hw | Qp |
| (million m3) | (m2) | (m3) | (m) | (m3s−1) |
| 8.310 | 1,900,000 | 8,541,000 | 11.70 | 1380 * |
| Embankment Dimensions | ||||
| Left Dam | Right Dam | |||
| Hd | m | 11.6 | 11.6 | |
| Crest width | Wc | m | 5.0 | 5.0 |
| Bottom width | Wb | m | 68.8 | 68.8 |
| Average width | Wavg | m | 43.5 | 57.25 |
| Upstream slope | Z:1 | - | 0.333 | 0.333 |
| Downstream slope | Z:1 | - | 0.4 | 0.4 |
| Breach Characteristics | ||||
| Left Dam | Right Dam | |||
| Depth above breach (max) | Hb | m | 11.6 | 11.6 |
| Hbavg | m | 6.0 | 9.7 | |
| Top width | Bt | m | 106.0 | 58.0 |
| Bottom width | Bb | m | 21.8 | 58.0 |
| Average width | Bavg | m | 64.0 | 58.0 |
| Eroded volume | Ver | m3 | 25,130 | 20,860 |
| Tf | h | 1.78 | 2.16 | |
| Te | h | 3.0 | 2.75 | |
a Difference between the lowest point of natural ground behind the dam and the dam crest level. b Average depth along the left and right dam axis, respectively. c Breach formation times provided by Froehlich, [13]. Considered “length of time needed for the final trapezoidal breach to form, which takes place after the breach initiation phase”. d Times from the overflow to the emptying of the reservoir. * Flood routing result (Section 4).
Table 3.
Comparison between the measured and calculated water levels (for location, see Figure 12).
Table 3.
Comparison between the measured and calculated water levels (for location, see Figure 12).
| Water Marks | H Measured (m) | H Calculated (m) | Difference (m) |
|---|---|---|---|
| WW1 | 200.73 | 200.656 | −0.074 |
| WW2 | 199.04 | 199.121 | 0.081 |
| WW3 | 199.63 | 199.539 | −0.091 |
| WW4 | 197.72 | 197.618 | −0.102 |
| WW5 | 198.03 | 197.470 | −0.56 |
| WW6 | 197.66 | 197.382 | −0.278 |
| WW7 | 197.56 | 197.383 | −0.177 |
| WW8 | 197.22 | 197.327 | 0.107 |
| WW9 | 195.17 | 195.09 | −0.08 |
| WW10 | 193.91 | 193.942 | 0.032 |
| WW11 | 191.53 | 191.312 | −0.218 |
| WW12 | 191.36 | 191.125 | −0.235 |
| WW13 | 190.22 | 190.008 | −0.212 |
| WW14 | 189.09 | 189.203 | 0.113 |
| WW15 | 188.31 | 188.466 | 0.156 |
| WW16 | 188.53 | 188.463 | −0.067 |
| WW17 | 188.77 | 188.727 | −0.043 |
| WW18 | 185.43 | 185.498 | 0.068 |
| WW19 | 184.79 | 184.658 | −0.132 |
| WW20 | 182.77 | 182.754 | −0.0 |
Publisher’s Note: MDPI stays neutral with regard to jurisdictional claims in published maps and institutional affiliations. |
© 2021 by the authors. Licensee MDPI, Basel, Switzerland. This article is an open access article distributed under the terms and conditions of the Creative Commons Attribution (CC BY) license (https://creativecommons.org/licenses/by/4.0/).
Share and Cite
MDPI and ACS Style
Kostecki, S.; Banasiak, R. The Catastrophe of the Niedów Dam—The Causes of the Dam’s Breach, Its Development, and Consequences. Water 2021, 13, 3254. https://doi.org/10.3390/w13223254
AMA Style
Kostecki S, Banasiak R. The Catastrophe of the Niedów Dam—The Causes of the Dam’s Breach, Its Development, and Consequences. Water. 2021; 13(22):3254. https://doi.org/10.3390/w13223254
Chicago/Turabian StyleKostecki, Stanisław, and Robert Banasiak. 2021. "The Catastrophe of the Niedów Dam—The Causes of the Dam’s Breach, Its Development, and Consequences" Water 13, no. 22: 3254. https://doi.org/10.3390/w13223254
Note that from the first issue of 2016, this journal uses article numbers instead of page numbers. See further details here.