Article

The Trend of Permeability of Loess in Yili, China, under Freeze–Thaw Cycles and Its Microscopic Mechanism

1
School of Geology and Mining Engineering, Xinjiang University, Urumqi 830046, China
2
State Key Laboratory for Geomechanics and Deep Underground Engineering, China University of Mining and Technology, Xuzhou 221116, China
3
Geological Environment Monitoring Institute of Xinjiang Uygur Autonomous Region, Urumqi 830091, China
4
The First Regional Geological Survey Brigade of Geological and Mineral Exploration and Development Bureau of Xinjiang Uygur Autonomous Region, Urumqi 830011, China
*
Author to whom correspondence should be addressed.
Water 2021, 13(22), 3257; https://doi.org/10.3390/w13223257
Submission received: 9 September 2021 / Revised: 13 November 2021 / Accepted: 15 November 2021 / Published: 17 November 2021
(This article belongs to the Section Hydrology)

Abstract

:
Loess landslides induced by the freeze–thaw effect frequently occur in Yili, China. Freeze–thaw cycles cause indelible changes in the soil microstructure, affecting its permeability. This study investigated the impacts of freeze–thaw cycles on the permeability of Yili loess using permeability tests on undisturbed (virgin, in situ) and remolded loess samples taken before and after freeze–thaw cycles. Scanning electron microscopy and nuclear magnetic resonance techniques were utilized to investigate the microscopic mechanism of the freeze–thaw process on the loess. Grey relation analysis (GRA) was employed to analyze the correlation between macroscopic permeability and microscopic parameters (maxi. radius, eccentricity, fractal dimension, directional probability entropy, and porosity). The results revealed that the permeability and all the microstructure parameters have roughly shown the same trend: “fluctuation–towards equilibrium–stability”. Firstly, the permeability coefficients of original and remolded loess experienced three and two peaked–trends, respectively, before 30 freeze–thaw cycles. The trends eventually stabilized within 30–60 freeze–thaw cycles. Increased number of freeze–thaw cycles disintegrated large particles in undisturbed loess into medium–sized particles, and particle shapes became more uncomplicated. Medium–sized particles in the remolded loess agglomerated to larger particles with more complex shapes. Furthermore, the overall porosity of the originally undisturbed loess decreased, and large and medium–sized pores transformed into small pores and micropores. In contrast, the overall porosity of remolded loess increased. Finally, the results revealed that permeability coefficients of the undisturbed and remolded loess became closely related with eccentricity and porosity, respectively. This study provides a reference for preventing and governing the loess landslides induced by the freeze–thaw cycles and permeability reduction in construction on loess in seasonally frozen areas in Yili.

1. Introduction

The effect of seasonal freeze–thaw significantly affects the stability of the loess slope in Yili, China, which is a typical seasonal freeze–thaw area that had experienced 380 landslides as of 2018. Specifically, 152 (40%) of the events occurred during the freeze–thaw period, and 79.95% of these were loess landslides [1]. Geological hazards caused by seasonal freeze–thaw cycles have been studied in several areas (e.g., Yili Basin, China, 2021; Loess Plateau, China, 2018; Canada, 1999; the Alps of Japan, 1999) [2,3,4,5]. These studies evaluated the impact of freeze–thaw on rock/soil mass strength, rock/soil mass permeability, and geotechnical engineering, especially soil permeability, and demonstrated the close relationship between soil permeability and its porosity [6]. The impact of freeze-thaw cycles is evaluated not only by geological engineering but also by soil science and hydraulics in the field [7]. Studies described that the permeability of loose and compacted soils will change by approximately 1 to 2 orders of magnitude after the freeze-thaw cycle [8,9]. The residual porosity of both loose and compacted soil could be stabilized after the freeze–thaw cycles, resulting in stabilized permeability coefficients [9,10,11]. Further, current studies on microstructural changes in loess under freeze–thaw cycles show that freeze–thaw cycles could lead to reduced and increased porosity of loose and compacted soil [6,12]; high porosity and poor cementation of soil particles in loess may cause the split–vulnerability and agglomeration of soil, along with the rearrangement of soil particles by gravity [13,14,15,16,17].
Macro– and microscale studies provide insights into the impact of microscale conditions, such as microscopic properties, the micro and fine mechanisms of complex macroscopic properties of geotechnical materials [18]. In 1982, Deng et al. proposed the concept of the grey system and established grey relation analysis (GRA) as one of the methods in grey system theory, which takes an uncertain system with “partly known information and partly unknown information” as the object of study; in the development process of the system, if the two factors change in a consistent trend, the degree of synchronous change is high, that is, the degree of correlation between the two is high [19]. GRA has been adopted to analyze the correlation between macroscopic properties and microstructure parameters of loess [20,21]; however, these studies focused on the mechanical strength of loess.
Although numerous studies on permeability changes and microstructure of loess under the action of freeze-thaw cycles have been carried out, the correlation between permeability and microstructural parameters, to date and to our knowledge, is still a research gap. In this study, we analyzed the trend of permeability and quantified the changes of the microstructure of the loess in Yili, China, under freeze–thaw cycles. GRA was used to analyze the relevance between macroscopic permeability and microstructural parameters of loess to identify the main factors influencing the permeability. The results may serve as additional guidance for researchers and engineers making decisions on the prevention of loess landslides induced by the freeze-thaw effect in Yili and other areas with similar climates.

2. Test Scheme

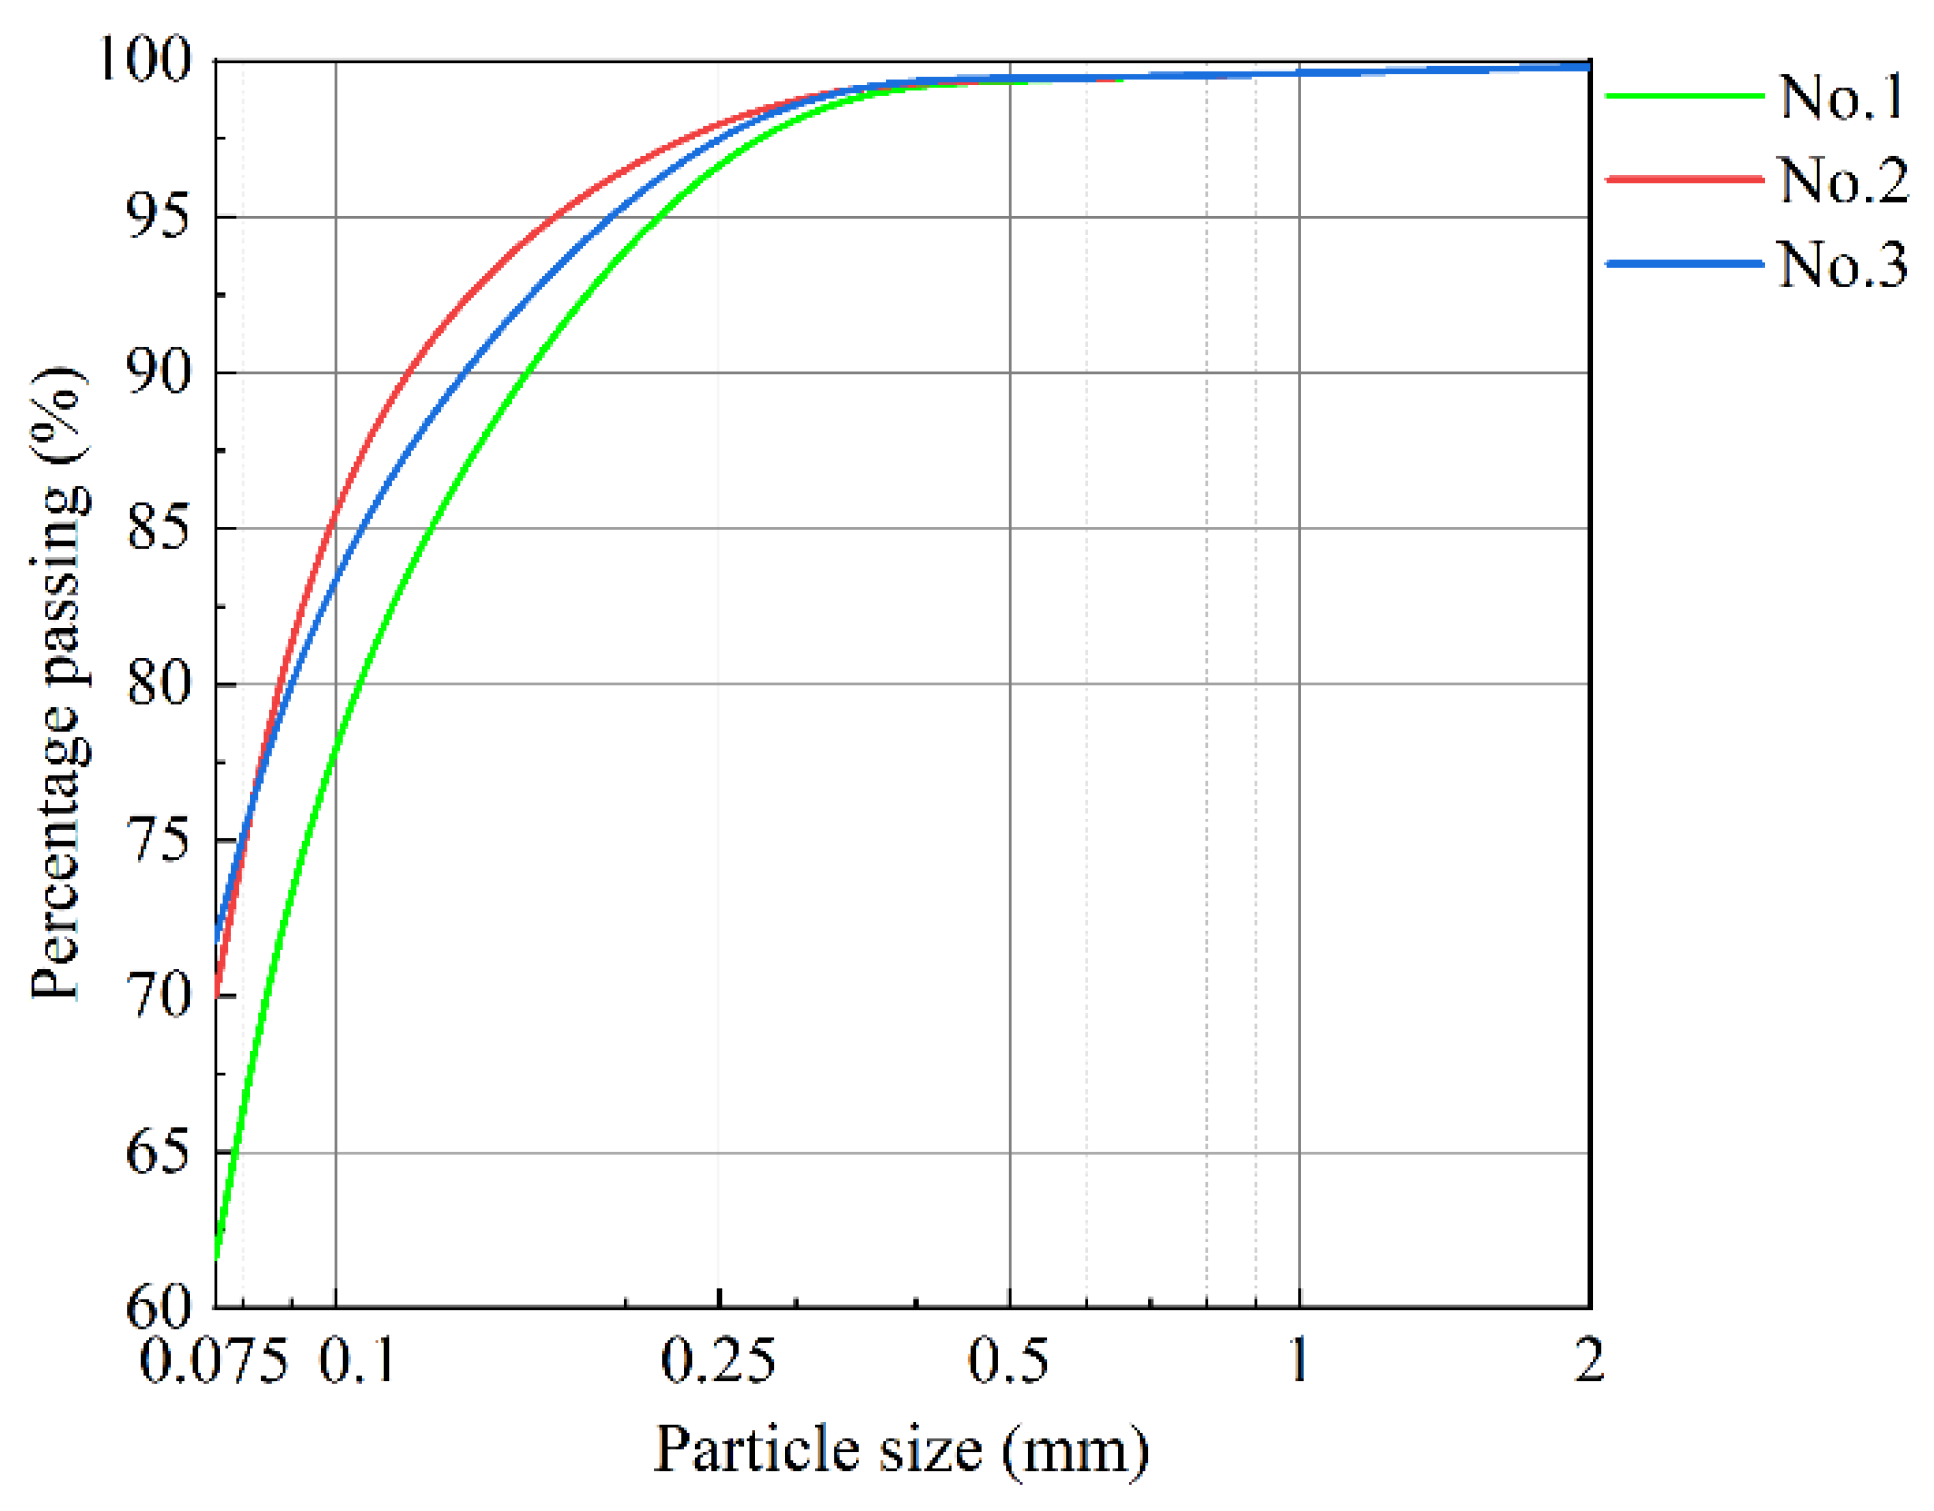
2.1. Materials and Methods

Soil samples were collected from Xinyuan County in Yili, and the particle size distribution of the original loess is shown in Figure 1. According to the Standard for Soil Test Methods, both undisturbed and remolded samples were collected, transported, and prepared [22]. In the process of undisturbed sample preparation, the samples were vertically and carefully cut by a ring knife to maintain the natural structure and to avoid the gap which may take place between the sample and the ring knife. In order to test the remolded samples in optimal conditions, they were prepared with the optimum water content (17.40%) and maximum dry density (1.86 g/cm3), which were tested by a compaction test. In order to make the remolded samples more uniform, the crushed air-dried loess was screened by a 2 mm sieve in succession before preparation by spray and compaction methods.

2.2. Freeze–Thaw Test

Freeze–thaw tests used a humidity chamber (JW–2000, with an accuracy of 0.1 °C). According to the local meteorological data over the past decade (Table 1), the freezing temperature and duration of the freeze period were −20 °C and 15 h, respectively, while thawing temperature and duration of the thaw period were 15 °C and 9 h, respectively. Thus, each freeze–thaw cycle lasted for 24 h. Therefore, the number of freeze–thaw cycles was 0–60.

2.3. Permeability Test

A head infiltration experiment was implemented to test the permeability of soil samples in this study. First, soil samples that had experienced 0, 1, 3, 5, 7, 10, 15, 20, 25, 30, 45, and 60 freezing and thawing cycles were loaded into the infiltration instrument. The hydraulic head of the sample was saturated by the head device, and the air at the bottom of the infiltration container was excluded until no bubble overflow existed. Specifically, the head difference was set as 1 m according to the observation of the sampling site. Further, the hydraulic head associated with time steps was measured after the hydraulic head was stabilized, and the test was repeated 3–4 times. The test results were finally calculated according to the permeability coefficient formula (Equation (1)) considered [22].
K = 2.3 a L A t log h 1 h 2
where 2.3 is the conversion factor of ln to log, a is the cross–section area of variable–head pipe (cm2), L is the sample height (cm), A is the cross–section area of the sample (cm2), t is the time (s), h1 is the initial head (cm), and h2 is the final head (cm).

2.4. Characterization by Scanning Electron Microscope (SEM)

Samples after freeze–thaw cycles were carefully cut into 10 × 10 × 5 (L × W × H) mm pieces for SEM investigation. The freeze–thaw cycle numbers of the test samples were 0, 5, 7, 10, 20, 30, 45, 60. A Bruker energy–dispersive X-ray spectrometer (EDX) with an electron beam was employed as the light source. The electron beam passes through three electromagnetic lenses with the accelerating voltage. Under the effect of the upper scanning coil of the final lens, the electron beam executes raster scanning on the sample surface, and soil physical properties (e.g., secondary electrons, backscattered electrons) can be obtained. In this study, scanning electron microscope tests (50, 200, 400, and 800 times) were selected to characterize horizons.
It is necessary to binarize the SEM images before pore identification and parameter extraction; this can be achieved with the MATLAB program. A gray value named the threshold divided the image into two parts; the pixels greater than the threshold were displayed in black, and the others were displayed in white. The threshold value was determined by iterative debugging based on specific SEM images. Then the binarized images were used to quantitatively analyze the microstructure of soil particles with Image–Pro Plus.

2.5. Characterization by Nuclear Magnetic Resonance (NMR)

2.5.1. Porosity

We used a medium–sized magnetic resonance imaging (MRI) analyzer (MesoMR23–60H–I) to determine the porosity. Under constant test parameters, NMR signal intensity was proportional to the moisture content of the sample. Therefore, a curve of moisture content of sample vs. NMR signal intensity was developed with calibration using reference samples with known moisture contents (Figure 2), enabling the determination of moisture content of any sample based on the measured signal intensity. In this way, the amount of water contained in the sample can be found by taking the measured signal from the test sample into the equation of the curve and dividing it by the volume of the sample to obtain the sample porosity [23].

2.5.2. Pore Size Distribution

After saturation using a vacuum saturator for 12 h, the pore size distributions were tested using a medium–sized magnetic resonance imaging (MRI) analyzer (MesoMR23–60H–I). A series of spin echoes, which generate original NMR data, were produced using the CPMG sequence. The attenuation amplitude of the spin–echo string was obtained through the sum of exponential decay curves, each of which has its respective attenuation constant. The sum of all attenuation constants reflects the T2 distribution. For porous mediums such as loess, the relaxation time of water in pores is proportional to pore sizes. Therefore, the position and area of peaks in the T2 curve are related to pore size and pore quantity.
As a porous medium, the internal pore structure, the movement of molecules in the pores, the reaction process, and other phenomena of the loess are important topics in the field of porous media research. Fluids in pores are exposed to three relaxation mechanisms, namely free relaxation, surface relaxation, and diffusion relaxation [24]:
1 T 2 = 1 T 2 f r e e + 1 T 2 s u r f a c e + 1 T 2 d i f f u s i o n
where T2 is the transversal relaxation time of fluids in pores collected by CPMG sequence, T2free is the transversal relaxation time of fluids in pores in a sufficiently large container (such that the effects of the container are negligible), T2surface is the transversal relaxation time induced by surface relaxation, and T2diffusion is the transversal relaxation time of fluids in pores induced by diffusion under magnetic gradient.
If short TE (the echo time interval) is employed and pores contain moisture only, surface relaxation dominates, while free and diffusion relaxations are negligible. In other words, T2 is proportional to pore sizes [24]:
1 T 2 1 T 2 s u r f a c e = ρ 2 ( S V ) p o r e
where ρ2 is the surface relaxation rate and S/V is the specific surface area of pores.
Assuming that pores are tubes with a radius of r, S/V = 2/r, and T2 curves are related to pore size distribution, pore conversion of T2 curves was completed using Equation (4) [25]:
r = ρ 2 × T 2 × a
where a = 2 and ρ2 = 300 µm/s (it can be measured by the mercury press test).

2.6. Grey Relation Analysis

Grey relation analysis includes four steps: determination of analysis sequence, dimensionless variables, calculation of correlation coefficient, and calculation of correlation coefficient.

2.6.1. Determination of Analysis Sequence

GRA involves the determination of elements of two systems. The reference sequences are the data sequences that reflect the behavior characteristics of the system; they are regarded as X0 = {x0(1), x0(2), …, x0(n)}. Data sequences consisting of factors affecting system behaviors are regarded as the comparison sequences Xi = {xi (1), xi (2), …, xi(n)} (i = 1, 2, …, m). In this study, the permeability of loess samples was regarded as the reference sequences. Microstructure parameters were the comparison sequences.

2.6.2. Dimensionless Variables

Data in different factor sequences may have different dimensionalities in grey systems, making data comparison challenging or misleading. To guarantee the reliability of GRA results, the data were normalized before GRA.
{ x ˜ 0 ( k ) = x 0 ( k ) min ( x 0 ) max ( x 0 ) min ( x 0 ) + 1 x   i ( k ) = x i ( k ) min ( x i ) max ( x i ) min ( x i ) + 1
where max(x0) and min(x0) are the max. and min. values in the reference sequences; max(xi) and min(xi) are the max. and min. values in the ith column of comparison sequences.

2.6.3. Calculation of Correlation Coefficient

The differences between comparison and reference systems were calculated (similarity = ∆i(k)).
Δ i ( k ) = | x ˜ i ( k ) x ˜ 0 ( k ) |
The maximum and minimum similarities of comparison systems were identified and calculated using the equation of correlation coefficient; the equation is shown in Equation (7).
ξ i ( k ) = min i min k Δ i ( k ) + ρ max i max k Δ i ( k ) Δ i ( k ) + ρ max i max k Δ i ( k )

2.6.4. Calculation of Correlation Coefficient

The correlation coefficients obtained are multiple values as they are essentially relational grades of reference and comparison sequences at different sites. The overall relational grade can be obtained based on the mean of these values.
γ i = 1 n k = 1 n ξ i ( k ) , k = 1 , 2 , n
The grey relational grades of different microstructural parameters and permeability coefficients were calculated using Equation (8). If ρ = 0.5, γ i 0.6 and γ i < 0.6 indicate strong and weak correlations of different factors, respectively.

3. Results

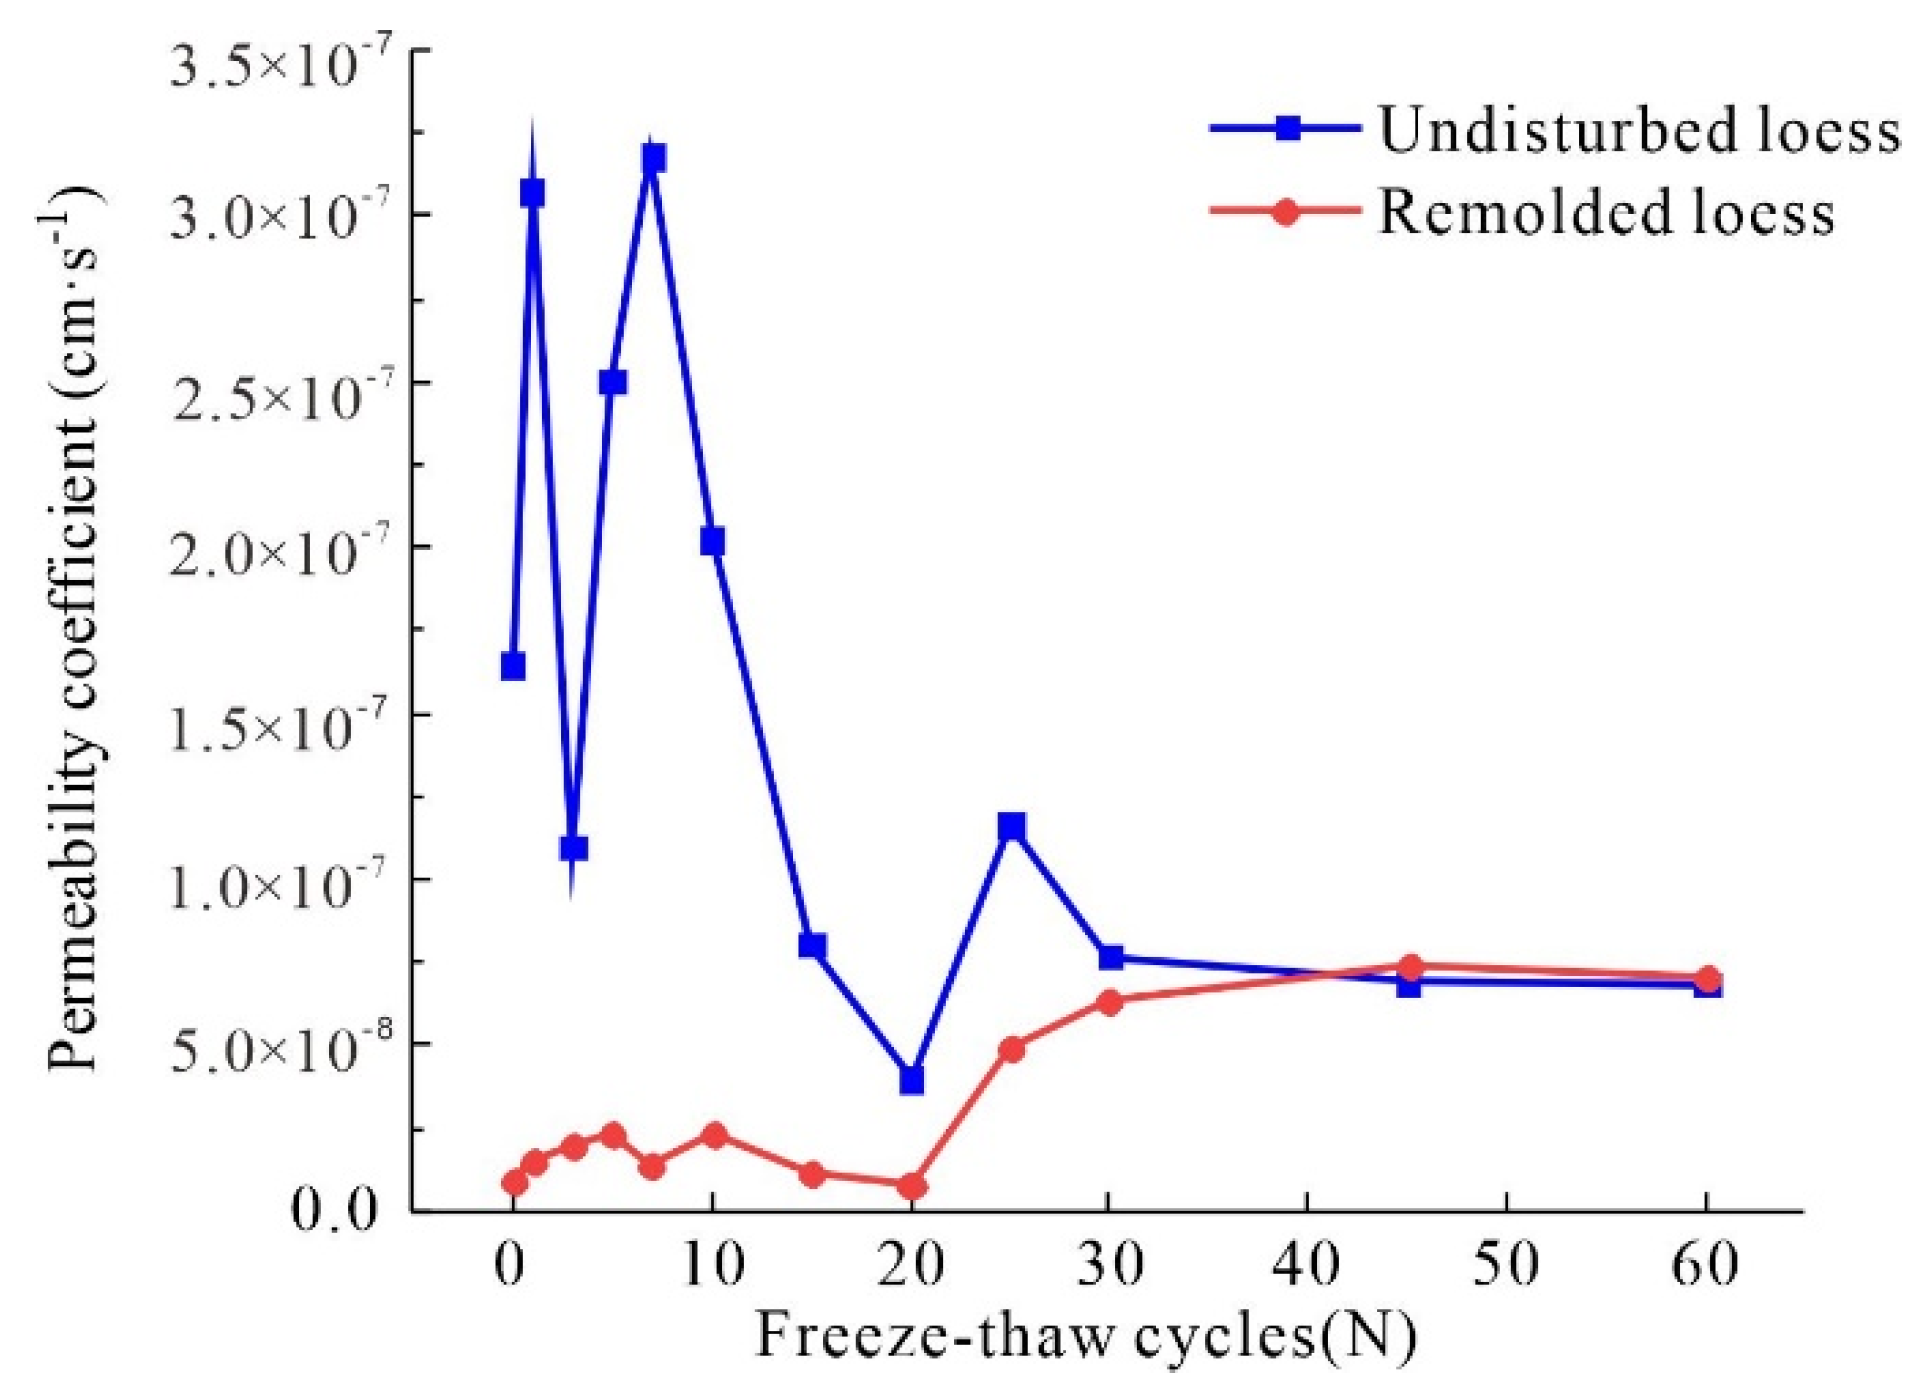
3.1. Trend of Loess Permeability

Figure 3 shows the permeabilities of loess after freeze–thaw cycles. The permeability coefficient of undisturbed loess was initially 1.65 × 10⁻⁷ cm/s and exhibited three peaked–trends between 60 freeze-thaw cycles. The permeability coefficient of the undisturbed loess was maximized (3.18 × 10⁻⁷ cm/s) at the seventh cycle, decreased and fluctuated in a section (6.34 × 10⁻⁸ to 7.36 × 10⁻⁸ cm/s) after 30 cycles, and eventually stabilized at 6.83 × 10⁻⁸ cm/s after 60 cycles. The permeability coefficient of remolded loess was initially 9.31 × 10⁻⁹ cm/s and exhibited two peaked–trends before 60 freeze–thaw cycles. The permeability coefficient of undisturbed loess was minimized (7.63 × 10⁻⁹ cm/s) at the 20th cycle, increased and fluctuated in a section (6.34 × 10⁻⁸ to 7.36 × 10⁻⁸ cm/s) after 30 cycles, and eventually stabilized at 7.36 × 10⁻⁸ cm/s after 45 cycles. The results of the permeability show the same trend: “fluctuation–towards equilibrium–stability”.

3.2. Structure of Loess Microparticles

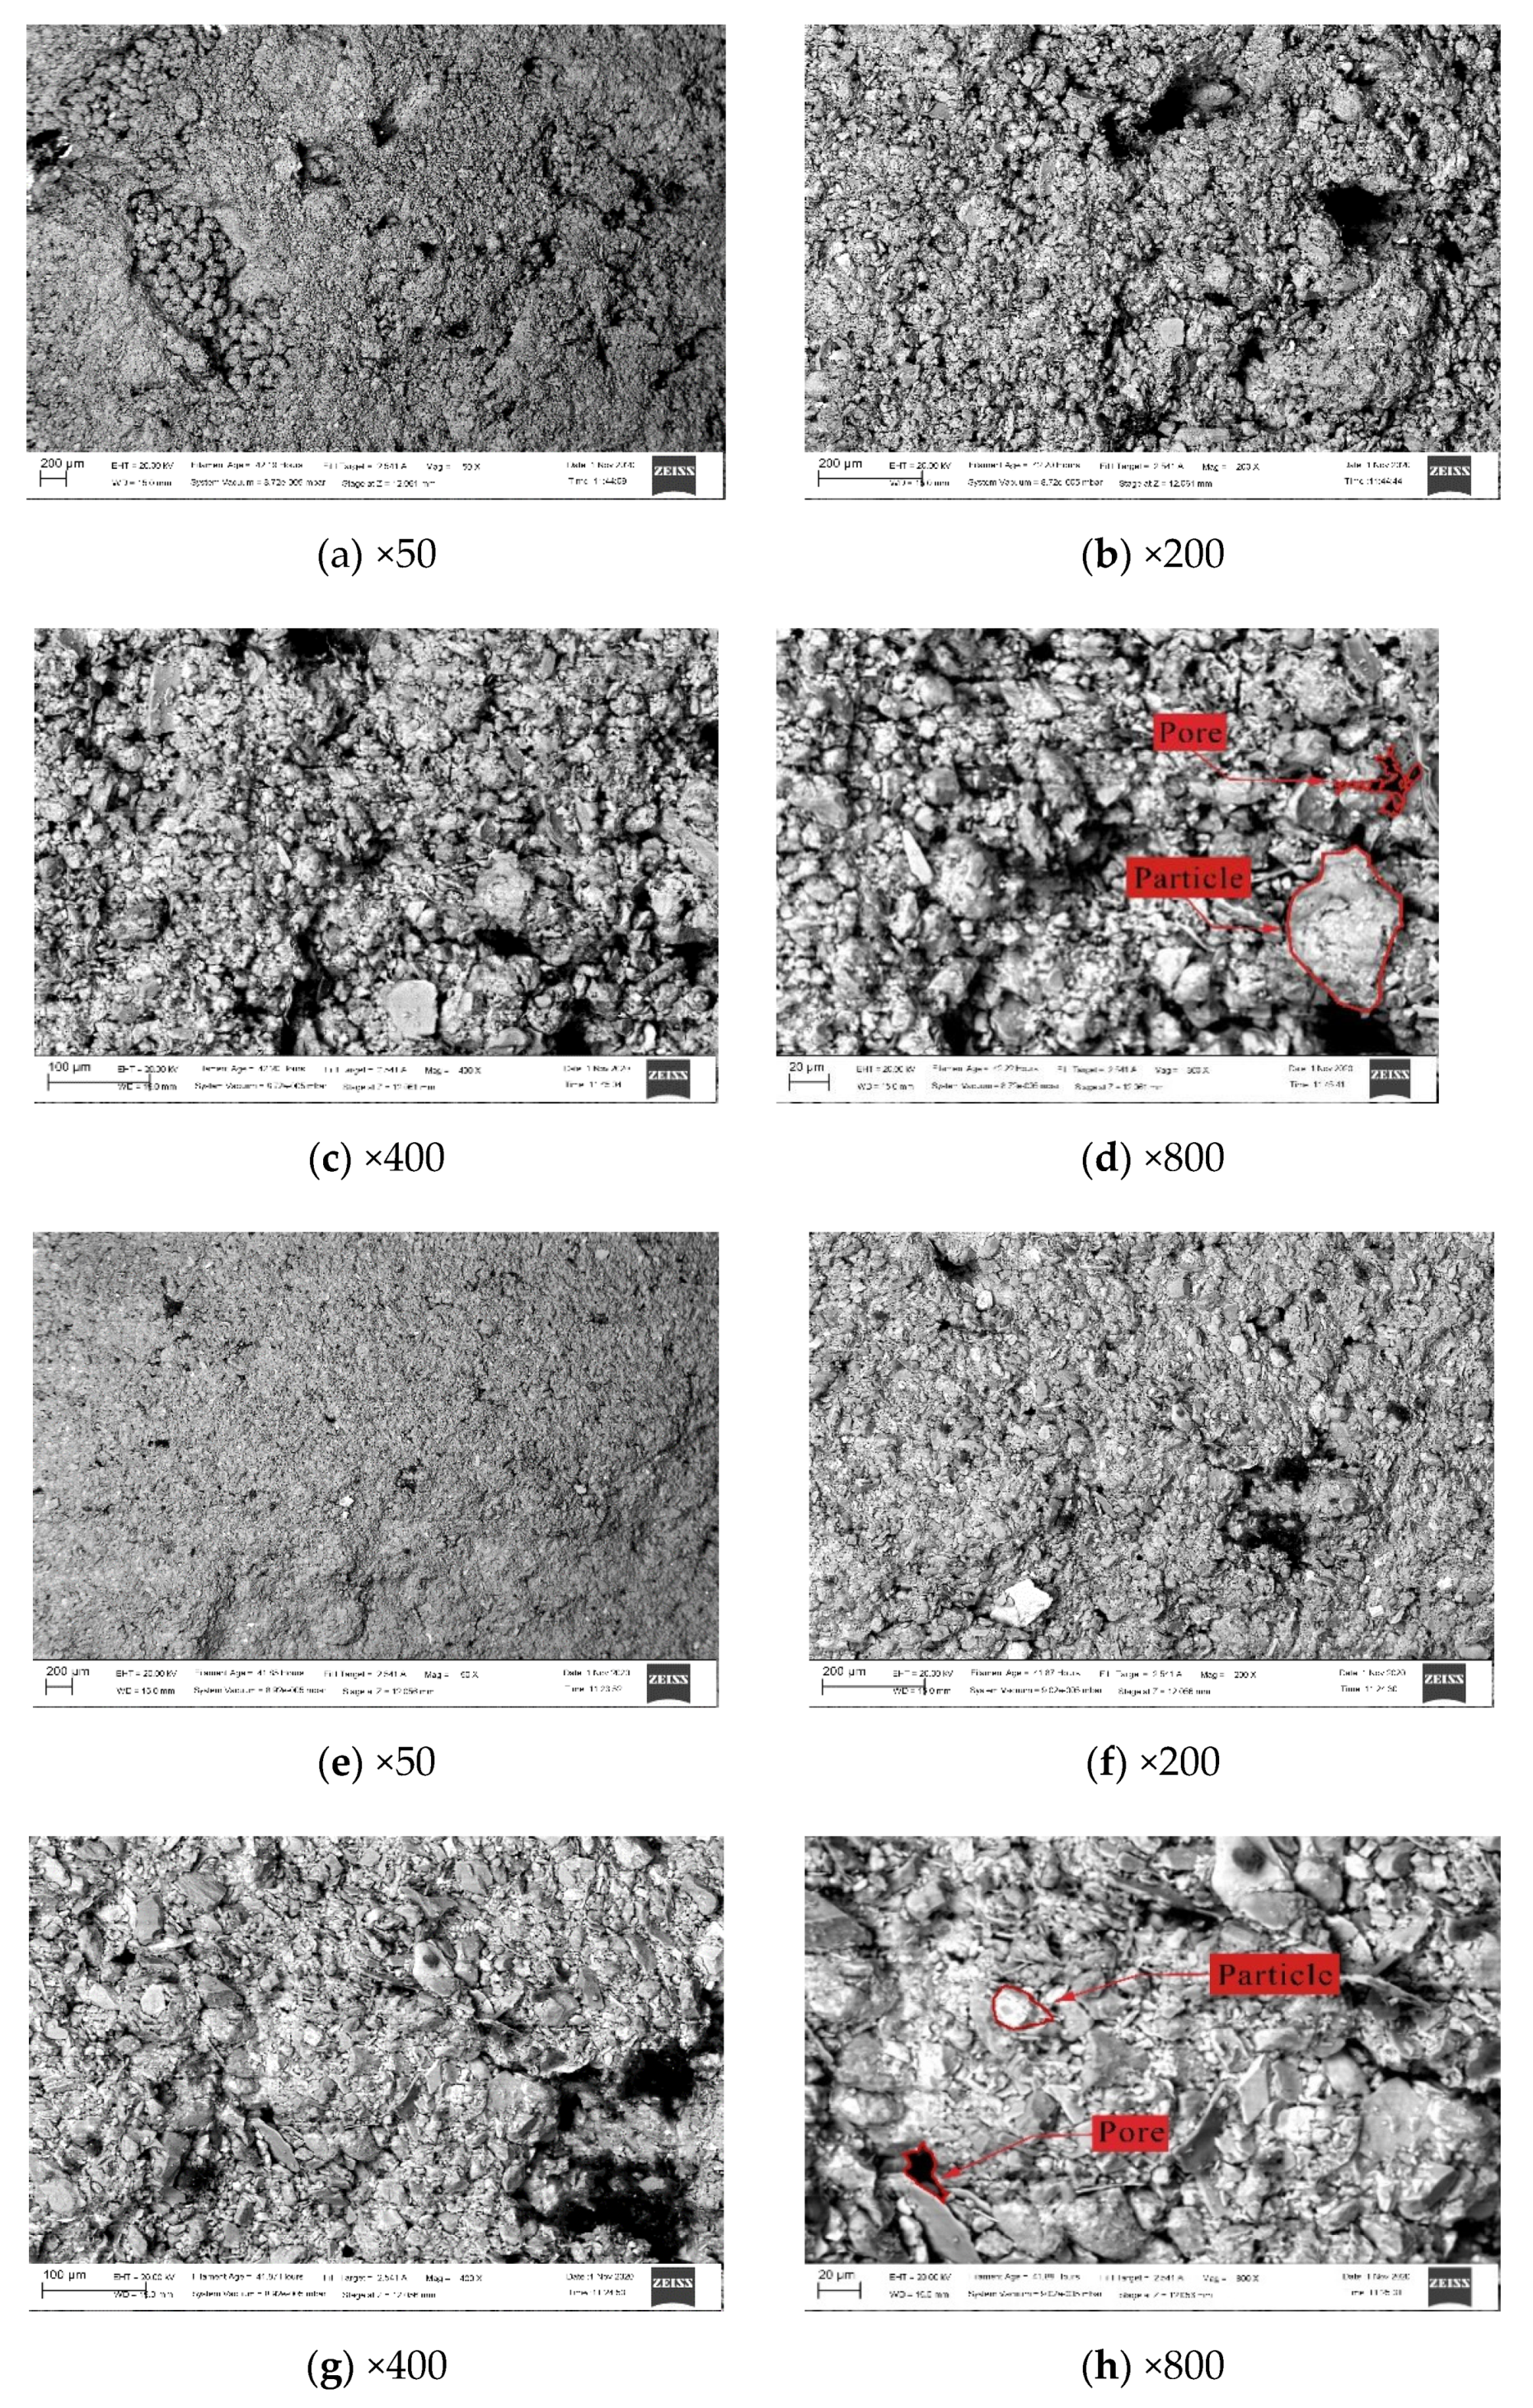
3.2.1. Image Collection

Figure 4 shows SEM images of undisturbed and remolded loess samples before freeze–thaw cycles. The 800× images were selected to analyze the structure.

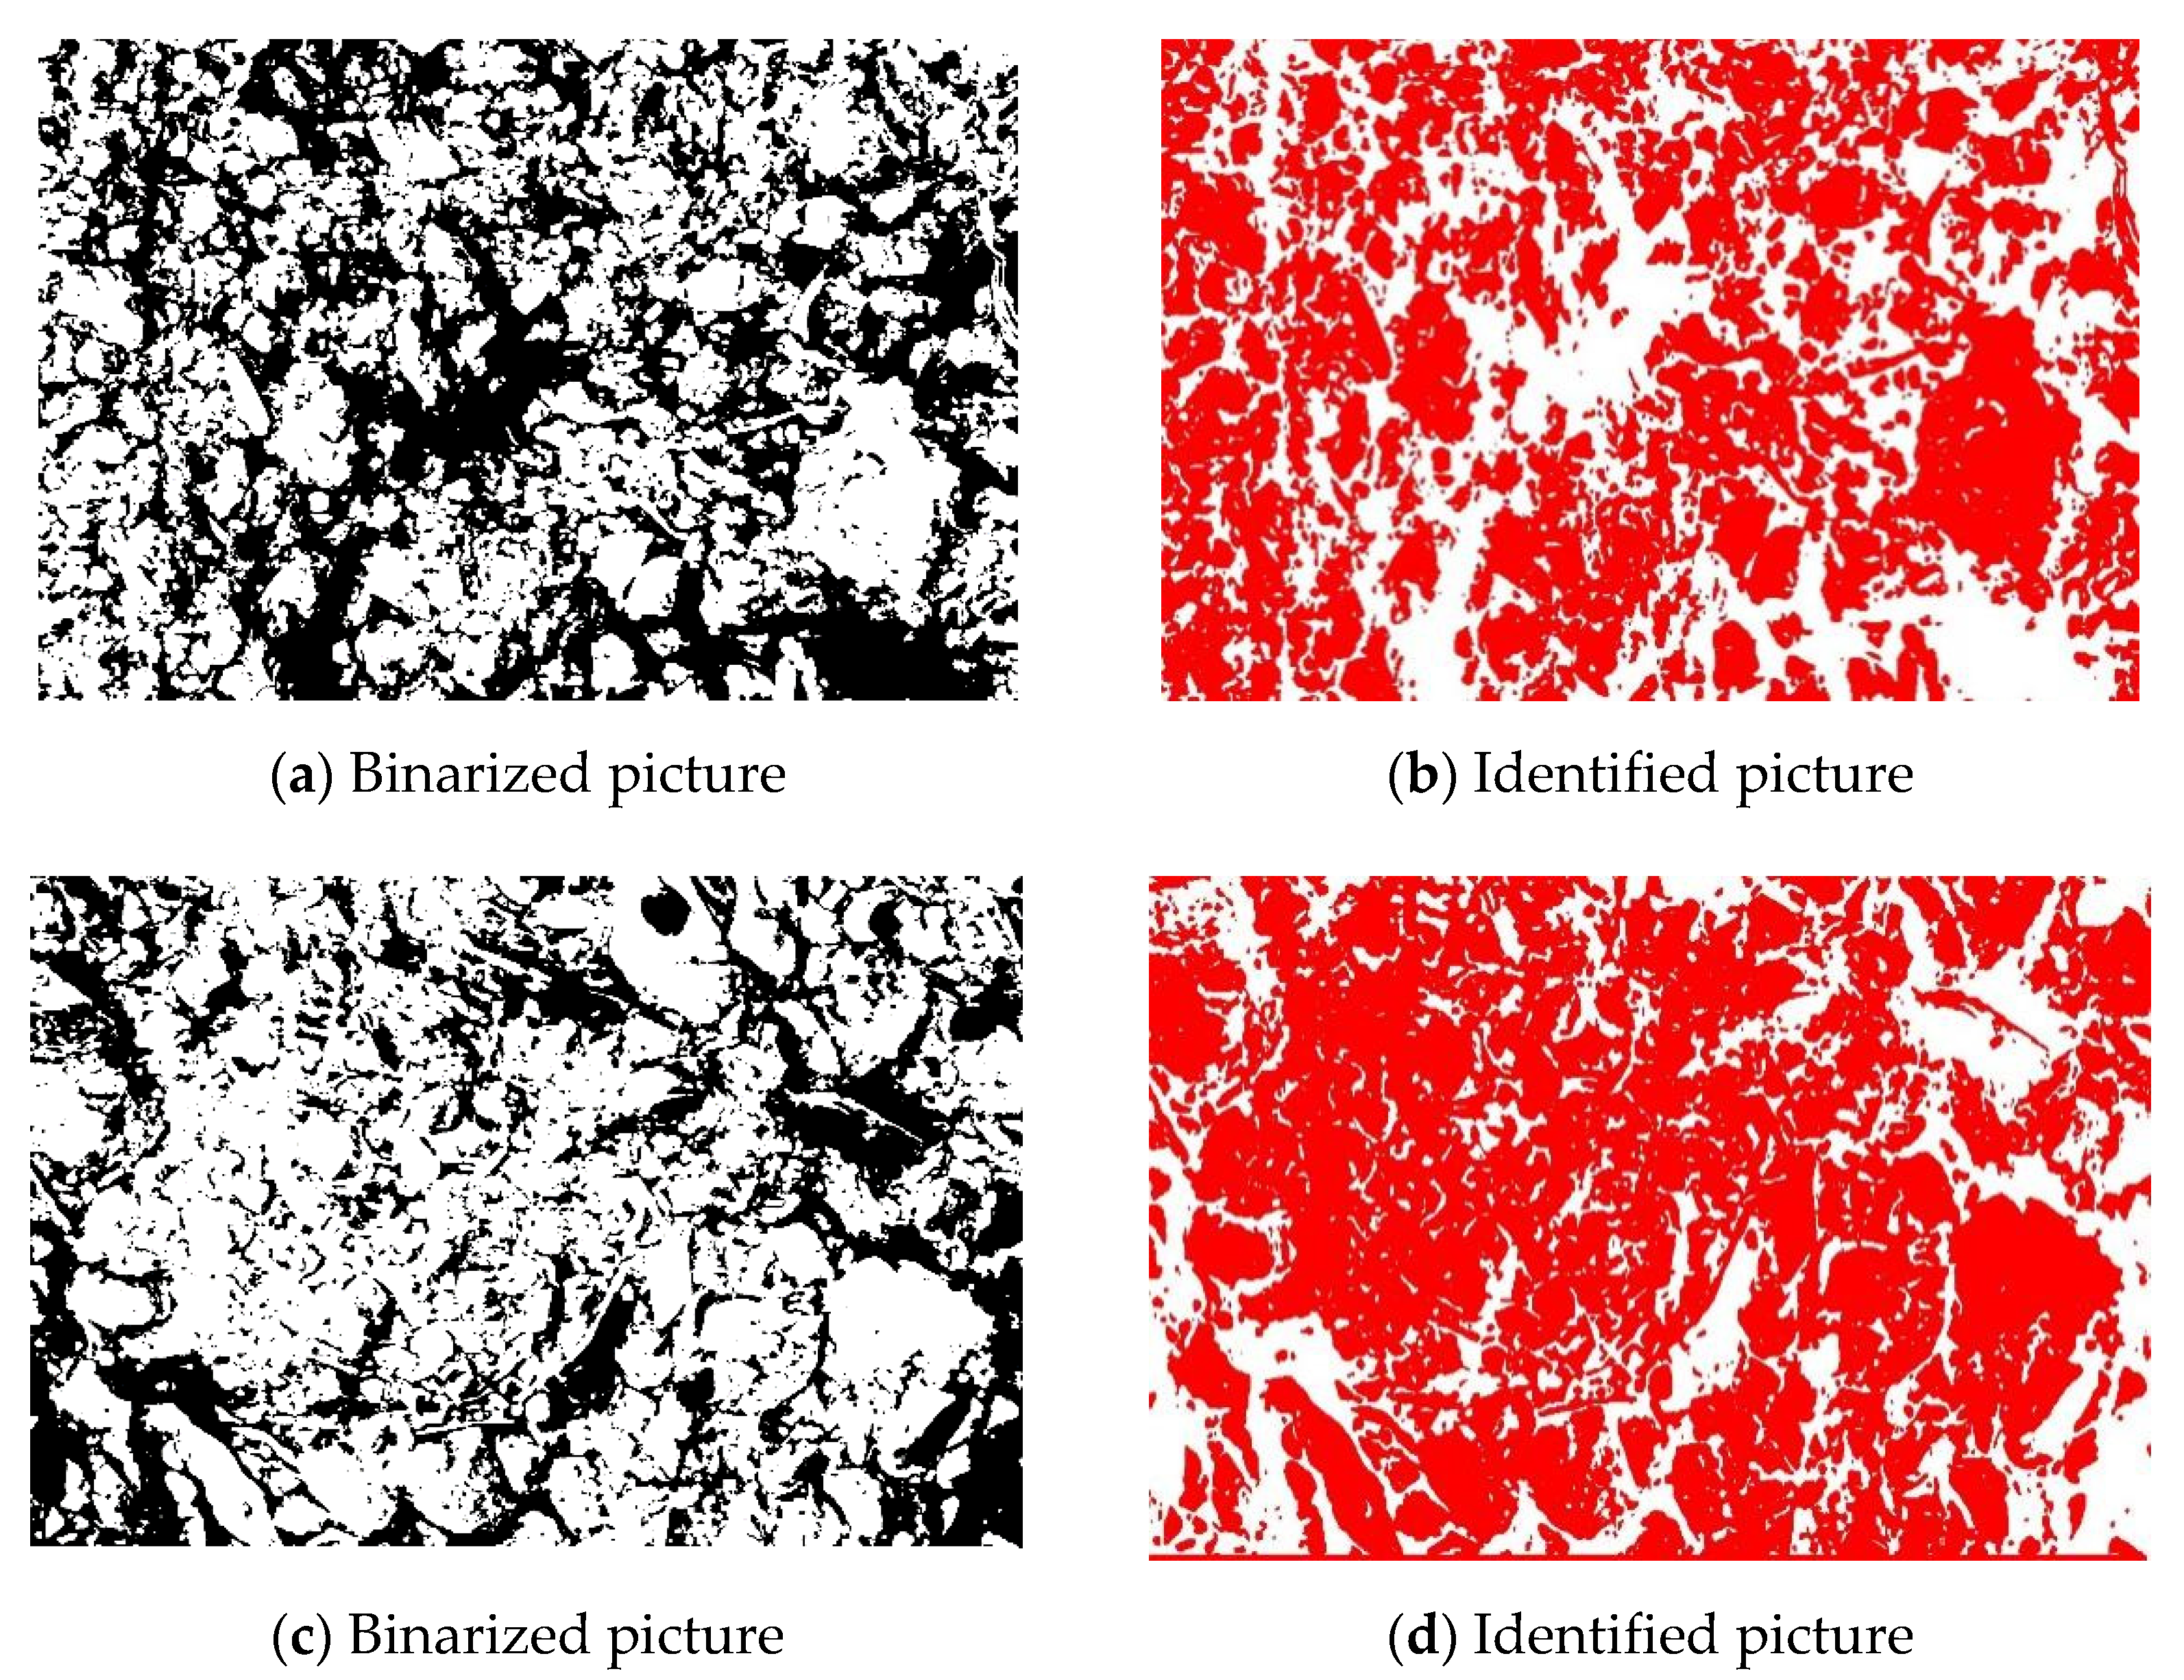
3.2.2. Image Processing and Parameter Extraction

SEM images were binarized by the MATLAB program in this study. The images were determined through iterative debugging; all the thresholds of images obtained in this experiment were 128, and the resolution was 2048 (high) × 1536 (width). The black and white shown in the binarized images are pores and particles, respectively (Figure 5a,c). The red shown in the identified images is particles (Figure 5b,d). Image–Pro Plus provides various parameters of measurement objects, from which users can select accordingly. This study employed four fundamental parameters of a particle: the maximum radius, eccentricity, fractal dimension, and directional probability entropy. Once the measurement object and its parameters have been selected on the binary diagram, the particles can be analyzed quantitatively.
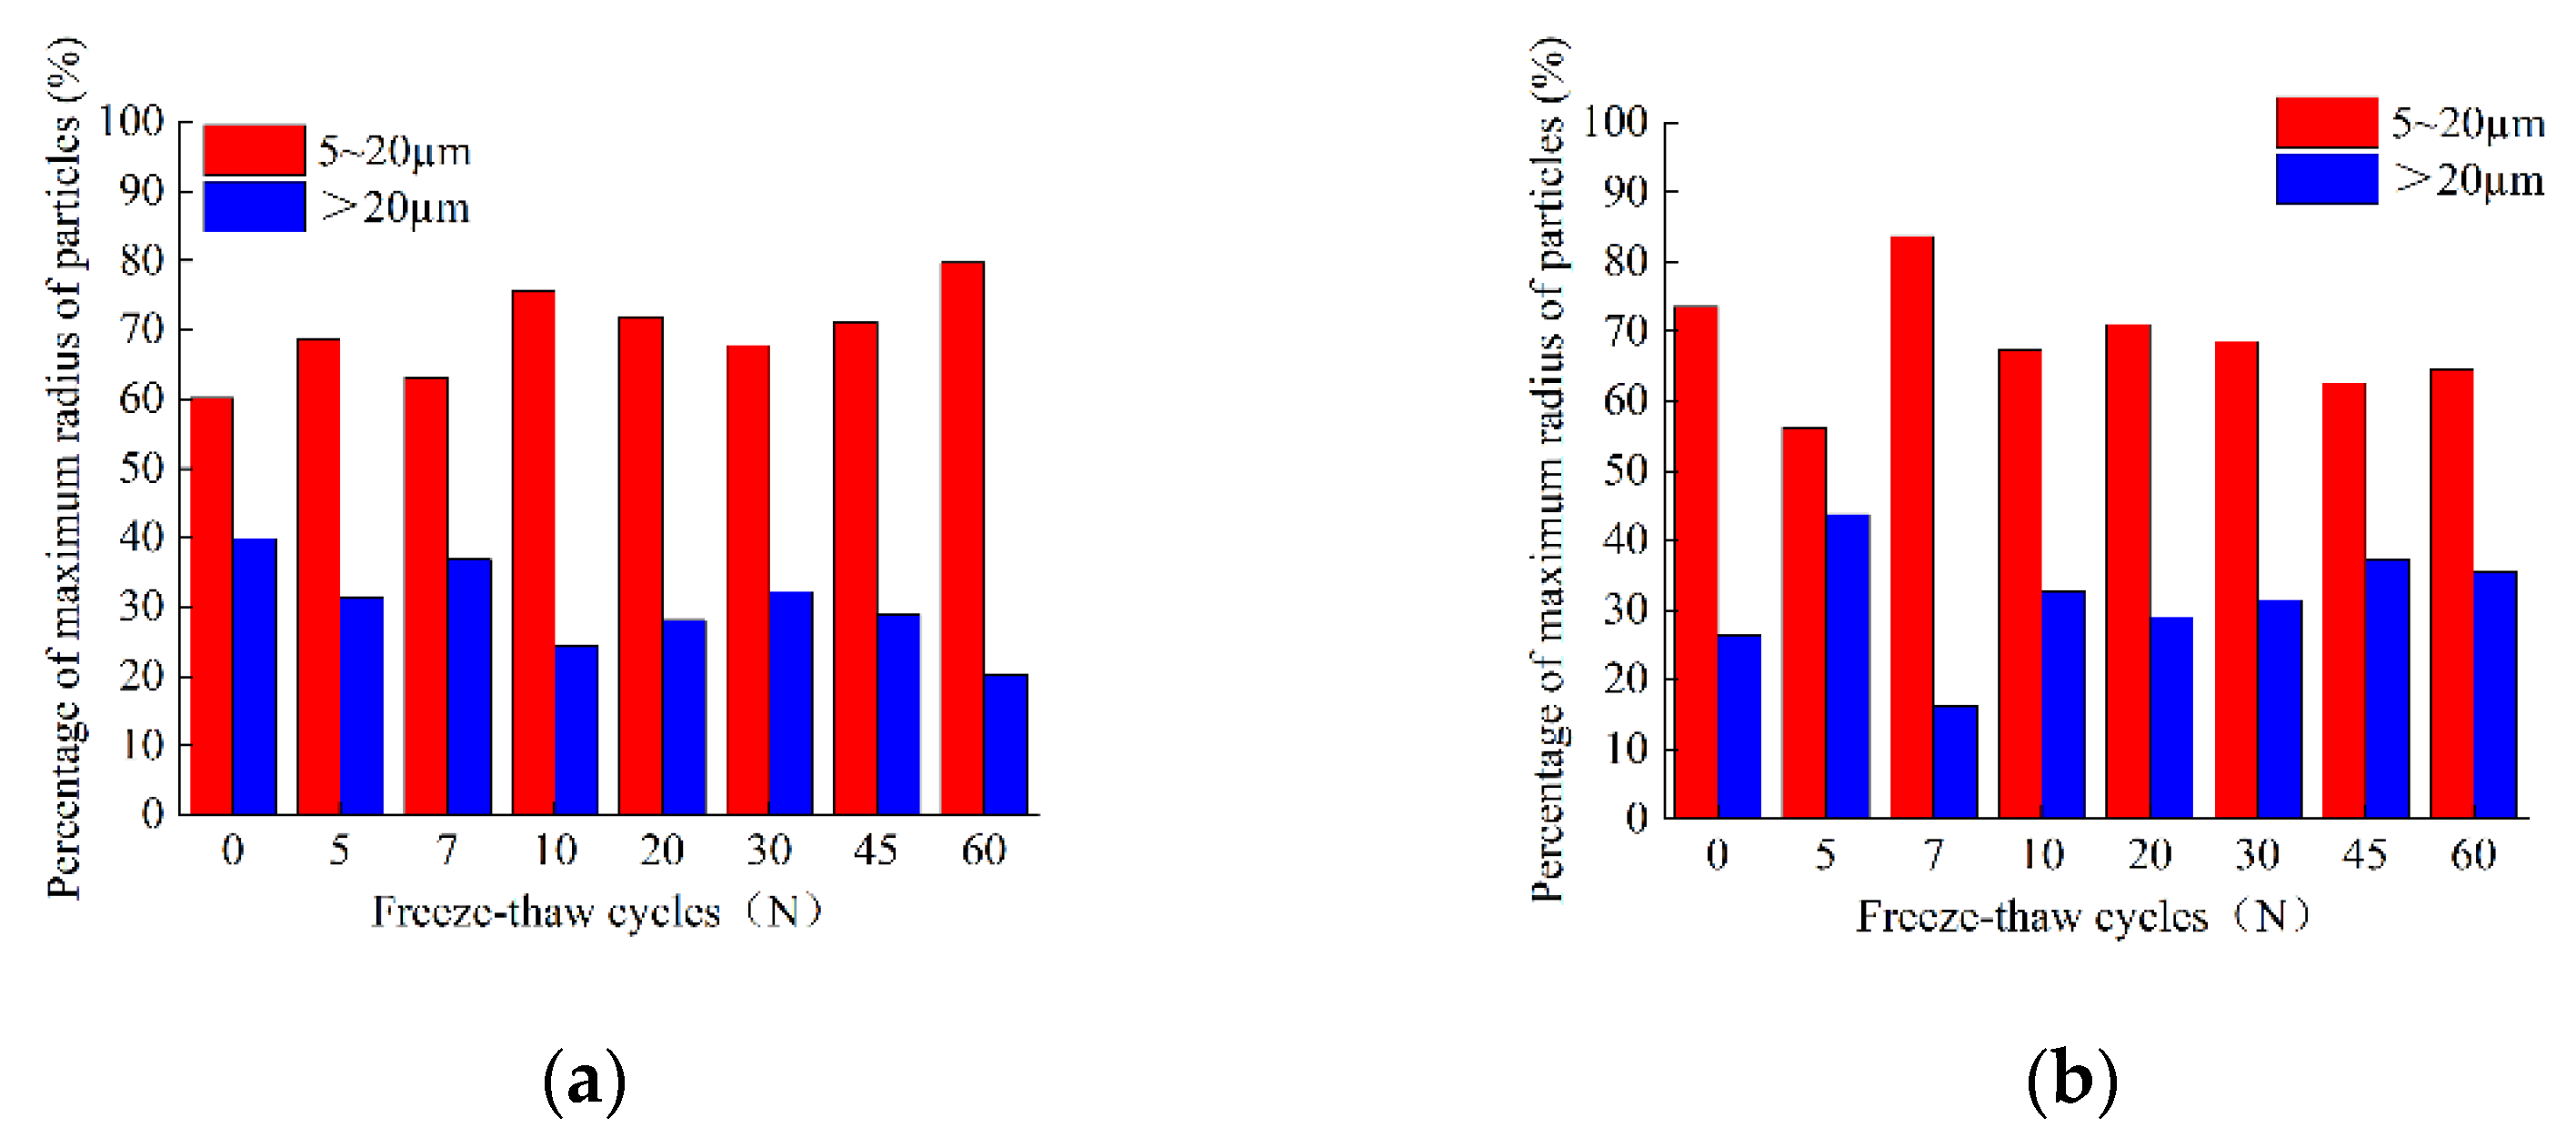
  • The max. radius is the longest distance between the position of the measured object’s center and its profile. Soil particles were classed into groups of <2 µm, 2~5 µm, 5~20 µm, and >20 µm [26].
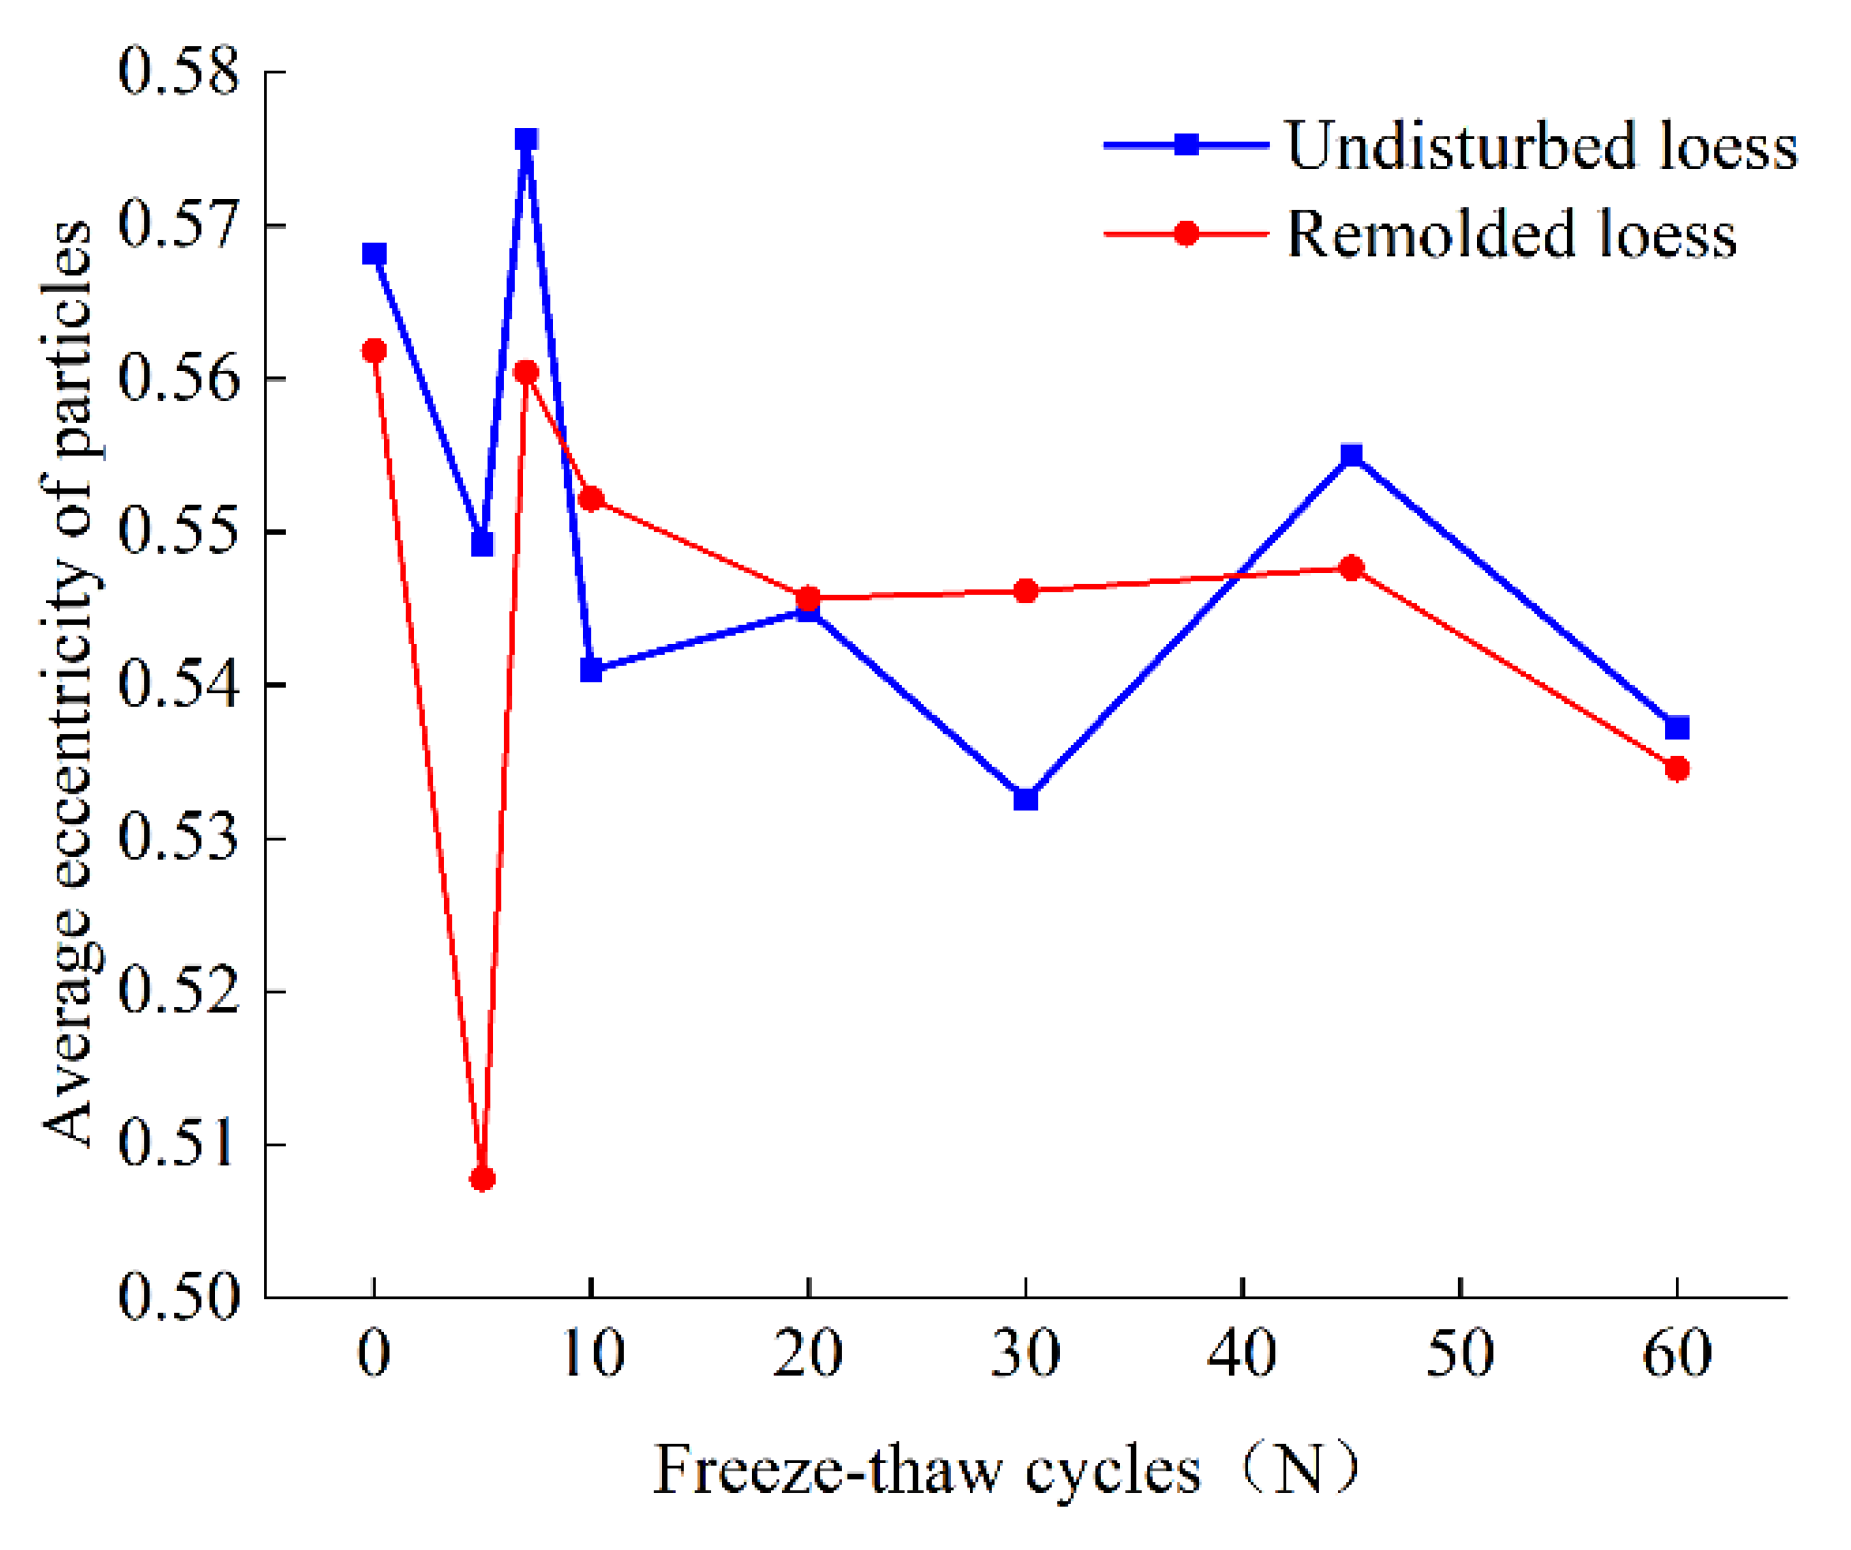
  • The eccentricity represents the geometry of particles in a two–dimensional plane, reciprocal of the ratio of the lengths of major and minor axes.
  • Fractal dimension is a particle’s contour line; it can be calculated by the step–size method.
    log ( P e r i m e t e r ) = ( 1 D ) log ( ε ) + C
    where Perimeter is a particle’s approximation of circumference, D is the fractal dimension of a particle, ε is the counted step–size, and C is the fitting constant.
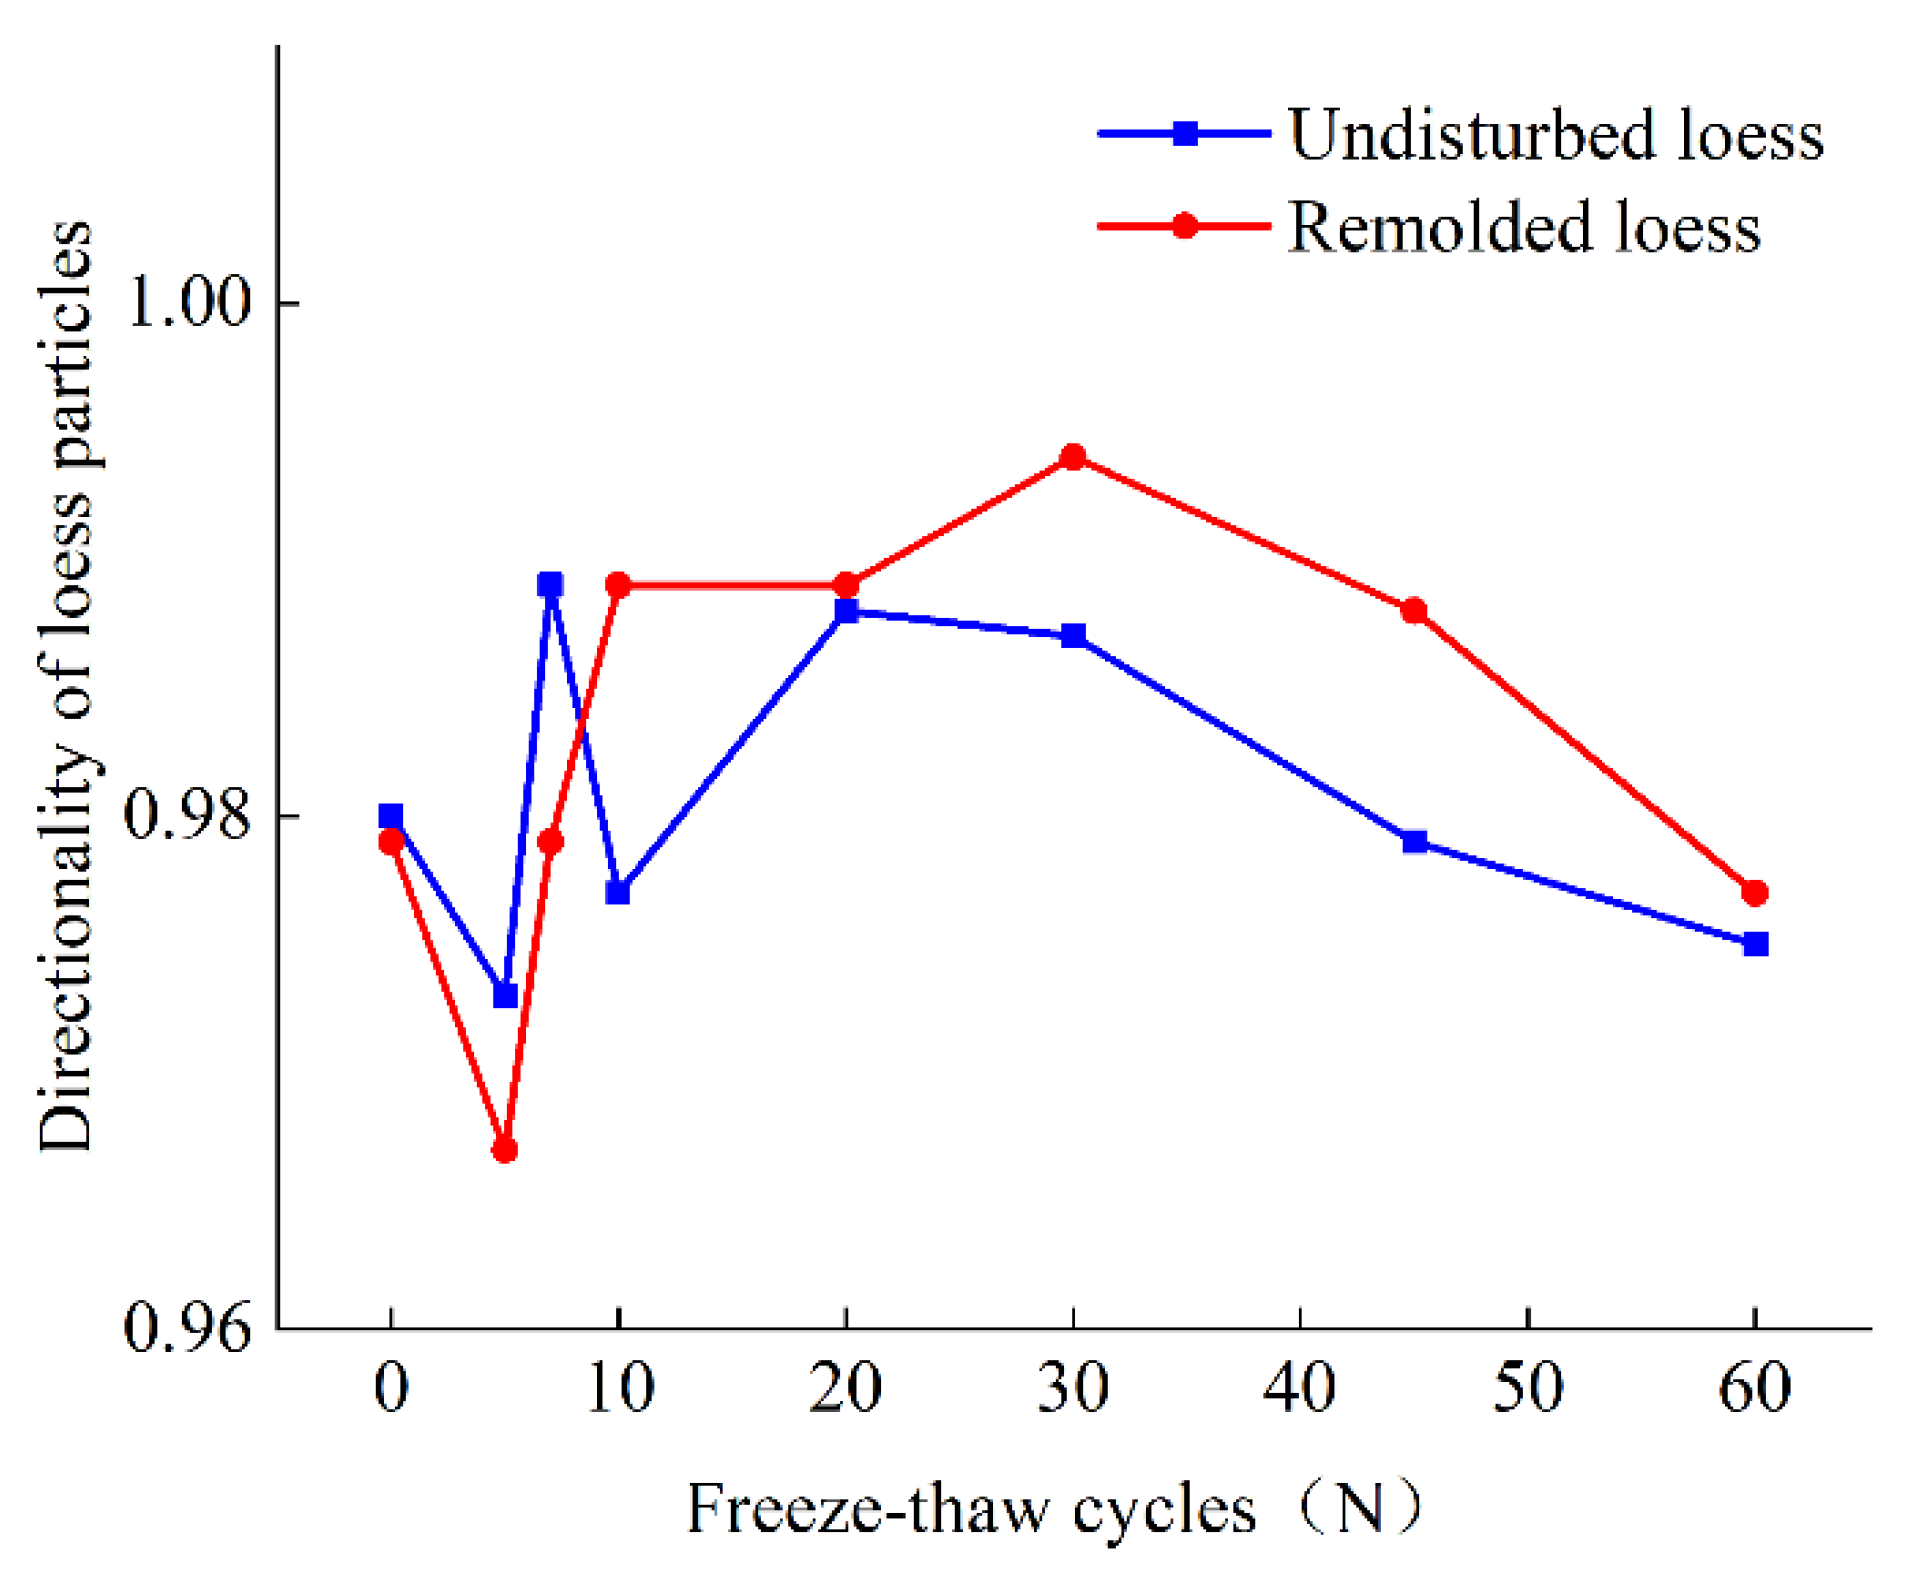
  • Directional probability entropy is an interval classification of the orientation angle of the particles by 18 equal divisions, each of which covers 10°. The directional probability entropy is the frequency of orientation of particles per interval.

3.2.3. Experimental Results

The partial results of measurement for microstructural parameters are shown in Table 2.
  • Percentages of loess particles with different maximum radii corresponding to different numbers of freeze-thaw cycles
Loess particles were placed in five groups according to the maximum radius, and the percentages of different groups were then calculated as shown in Figure 6. Both the undisturbed and remolded loess were dominated by particles with a maximum radius of 5–20 µm, followed by those with a maximum radius > 20 µm. The sum of these two groups exceeded 90%. For original loess, large particles decreased, while medium–sized particles increased slightly as the number of freeze–thaw cycles increased, indicating that the freeze–thaw effect alters coupling of particles in the undisturbed loess due to expansive or wedge–shaped force induced by water icing, which disintegrates large particles. For the remolded loess, large particles increased slightly, while medium–sized particles decreased somewhat as the number of freeze–thaw cycles increased. This is consistent with the conclusion that the permeability coefficient of remolded loess increases as the number of freeze–thaw cycles increases. Agglomeration of medium-sized particles into large particles leads to enhanced pore connectivity and thus enhanced permeability.
2.
Average eccentricity of loess particles corresponding to different numbers of freeze-thaw cycles
Figure 7 illustrates the average eccentricity of loess particles corresponding to different numbers of freeze–thaw cycles. Before freeze–thaw cycles, the average eccentricity of loess particles was 0.565, demonstrating the dominance of elliptical particles. However, under freeze–thaw cycles, the average eccentricity of particles in both undisturbed and remolded loess decreased, indicating the decreasing percentage of near–equiaxed particles in Yili loess. Thus, disintegration and agglomeration of loess particles were continuously observed under freeze–thaw cycles.
3.
Fractal dimensions of loess particles corresponding to different numbers of freeze-thaw cycles
Under freeze–thaw effect, loess particles faced expansive or wedge–shaped forces induced by water icing, resulting in edges and corners. As a result, particle shape and its fractal dimension may have been altered. Figure 8 lists the average fractal dimensions of particles in original and remolded loess corresponding to different numbers of freeze–thaw cycles. As shown in the figure, the average fractal dimension of particles in the undisturbed loess decreased as the number of freeze–thaw cycles increased. This demonstrates that the undisturbed loess particles tend to have simple shapes under freeze–thaw cycles; the average fractal dimension of particles in remolded loess increased slightly after two peaked–trends, indicating that remolded loess particles tend to have complicated shapes under freeze–thaw cycles. However, the magnitude of this change is not obvious, which shows the freeze–thaw cycles have a weak effect on the loess profile.
4.
Directionality of loess particles corresponding to different numbers of freeze–thaw cycles
Figure 9 illustrates directional probability entropies of loess particles corresponding to different numbers of freeze–thaw cycles. Under freeze–thaw cycles, soil particles were susceptible to disintegration and agglomeration due to the presence of ice and salt crystals. In this case, soil particles were prone to dislocations and varied particle orientation. Here, directional probability entropy reflected particle directionality. Specifically, particle directionality is negatively related to the directional probability entropy. As shown in Figure 9, directional probability entropies of both original and remolded loess experienced peaked trends under freeze–thaw cycles. Before 30 freeze–thaw cycles, directional probability entropy of loess particles increased, indicating degrading directionality of loess particles. Under 30–60 cycles, directional probability entropy of loess particles decreased.

3.3. Structure of Micropores in Loess

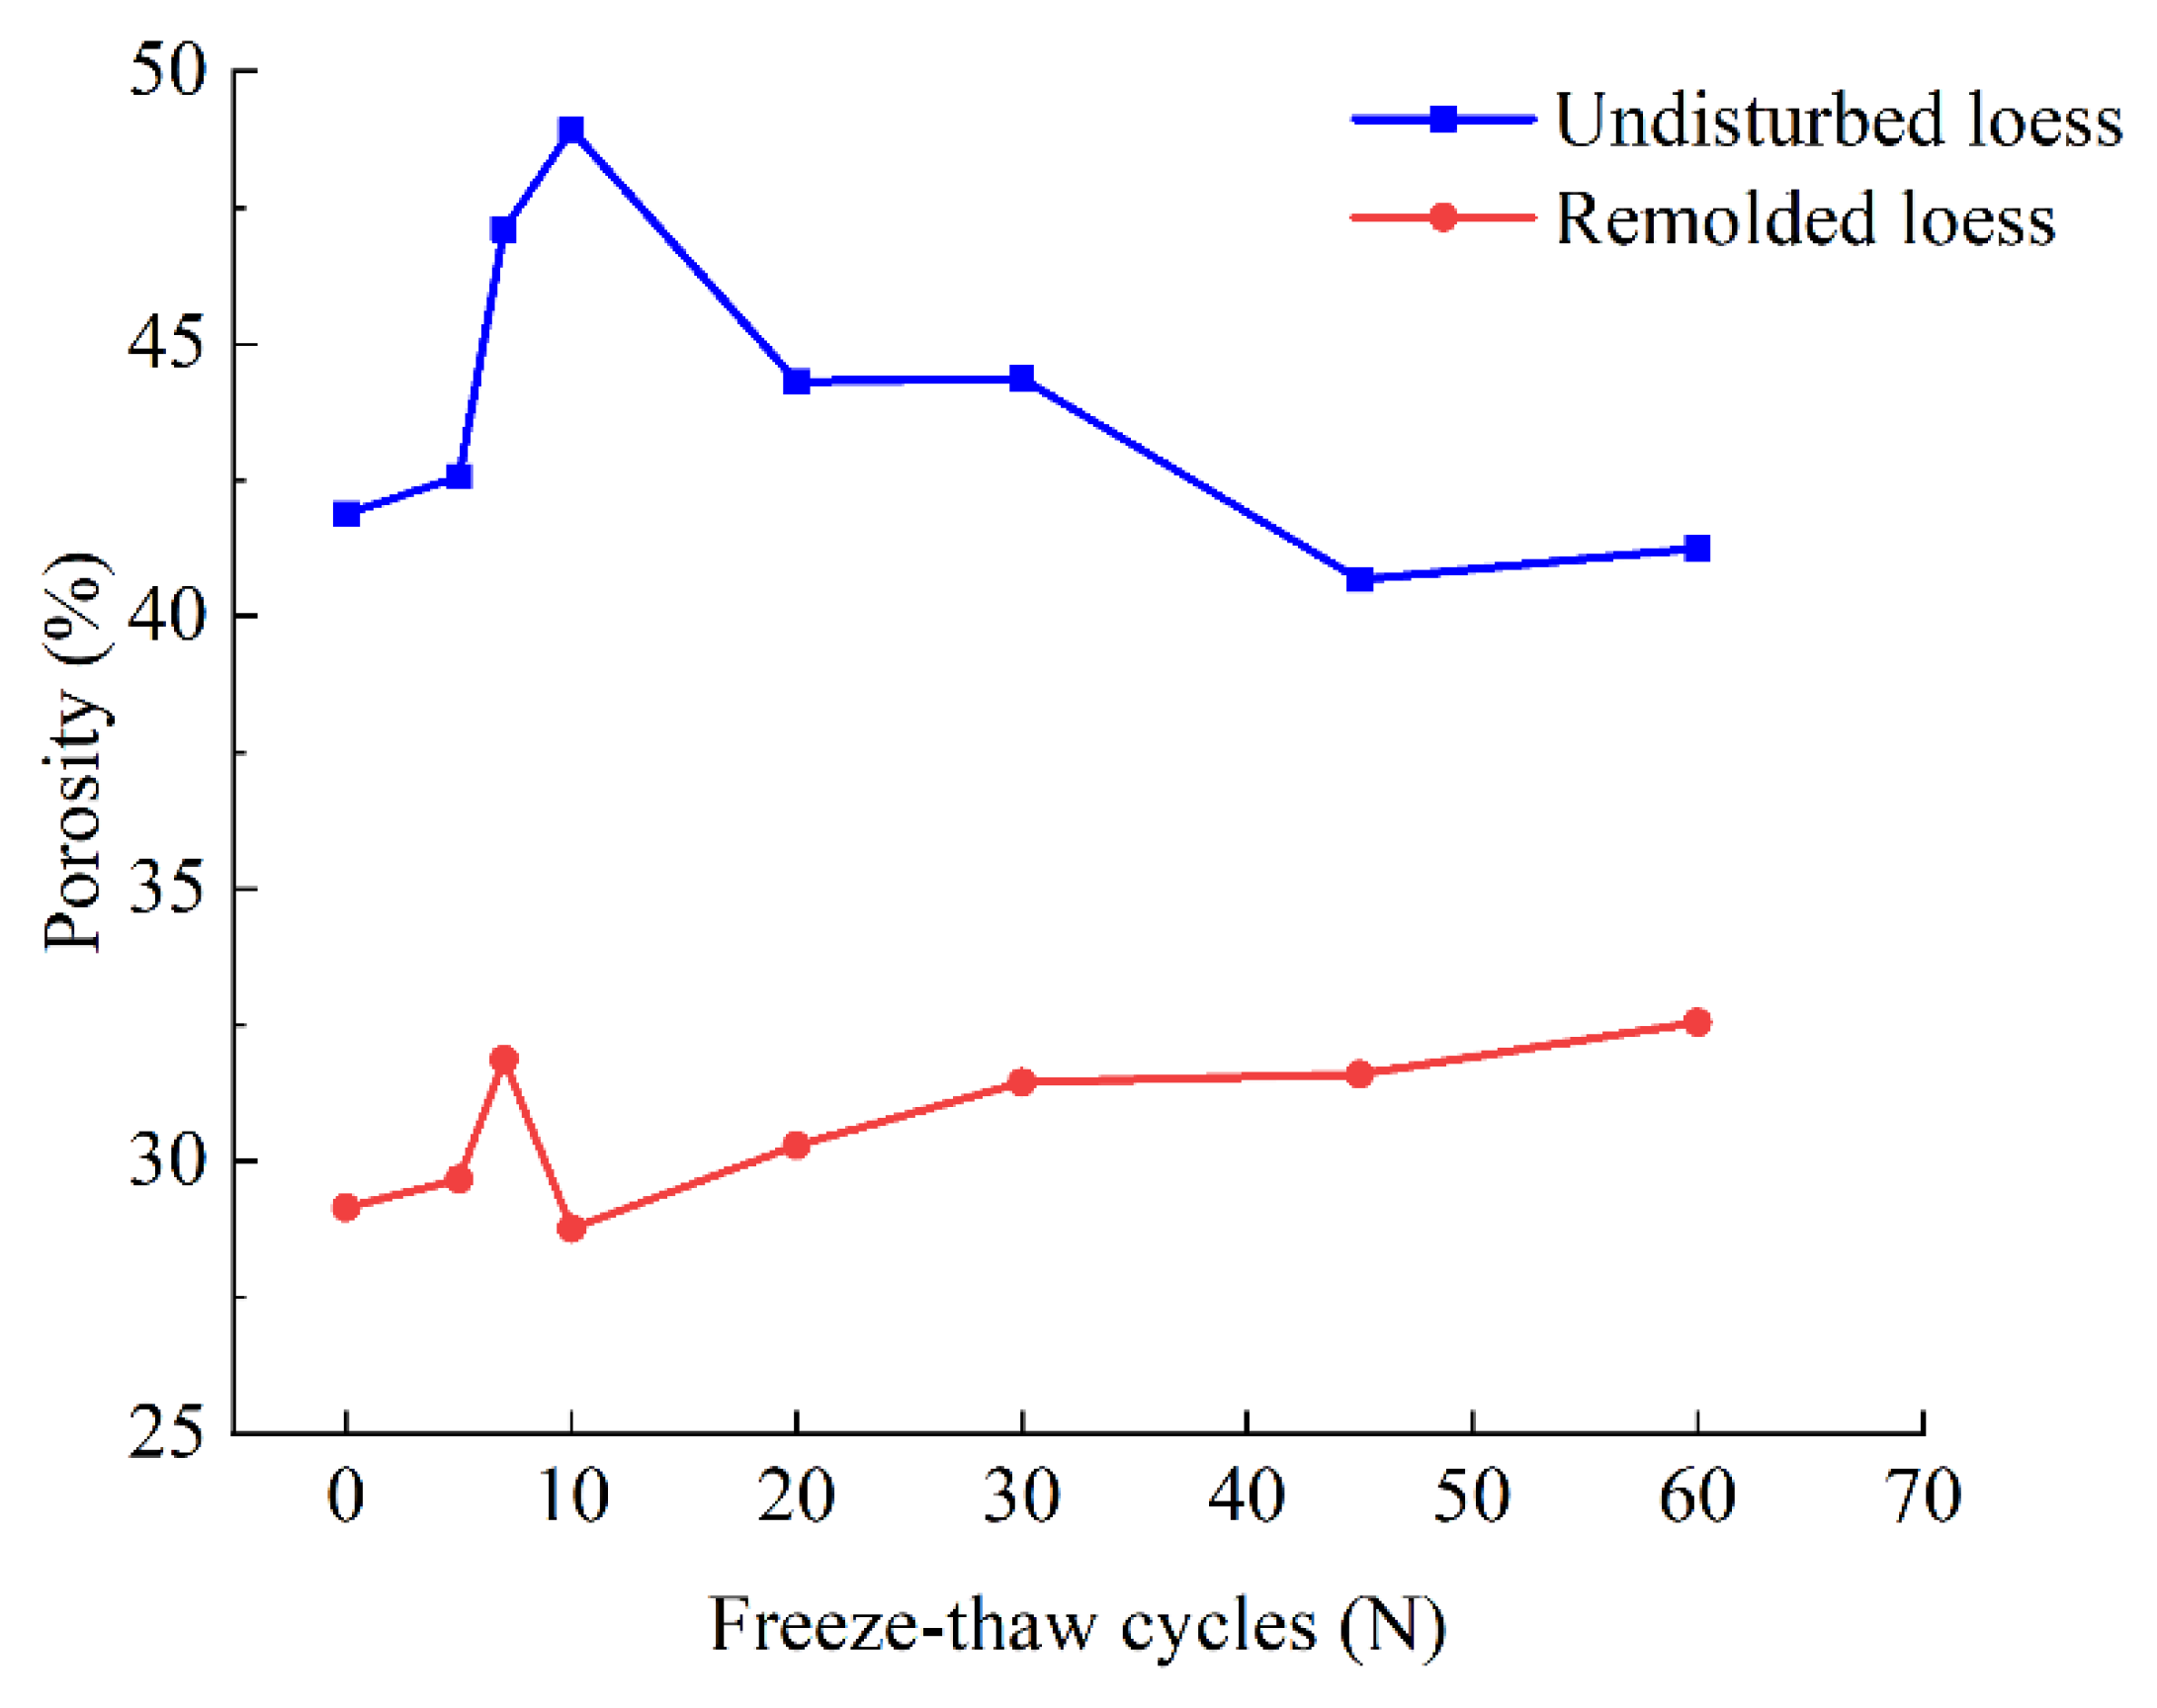
3.3.1. Trend of Porosity

Figure 10 shows sample porosity determined by NMR. There is a sharp increase in the beginning, and then everything relaxes back to the original. The porosity of original loess samples was initially 41.88% and exhibited peaked trends before 60 freeze–thaw cycles. It was maximized (48.93%) at the 10th cycle. Under freeze–thaw effect, overall pore quantity in original loess decreased. The porosity of remolded loess samples was initially 29.15% and increased with the number of freeze–thaw cycles. The trend of porosity was consistent with the results of the permeability test. Additionally, the total number of pores in remolded loess increased after freeze–thaw cycles.

3.3.2. Pore Size Distribution

Figure 11 shows the T2 curves of saturated samples after freeze–thaw cycles. For undisturbed loess samples, three peaks were observed, indicating that pores in the samples were distributed in three size ranges. The first peak dominates, and the relaxation time is mainly distributed in 0.5–10 ms. As the number of freeze–thaw cycles increased, the peak intensity and NMR signal amplitude decreased slightly, suggesting a reduced number of pores in samples after freeze–thaw cycles. For remolded loess samples, two peaks are observed, and the relaxation time corresponding to the first peak was mainly distributed in 0.1~10 ms. As the number of freeze–thaw cycles increased, the peak intensity and NMR signal amplitude increased. At the same time, the curves shifted to the right, demonstrating that the total number of pores in remolded loess increased after freeze–thaw cycles.
In this study, loess pores were divided as micropores (<1 µm), small pores (1–4 µm), medium pores (4–16 µm), and large pores (>16 µm) [27]. The results are shown in Figure 12. As the number of freeze–thaw cycles increased, micropores and small pores in original loess samples decreased and then increased, while medium pores and large pores increased and then decreased. As the number of freeze–thaw cycles increased, micropores in remolded loess samples decreased, while small, medium, and large pores in remolded loess samples increased slightly.

3.4. Grey Relation Analysis

3.4.1. Determination of Analysis Sequence

Macroscopic and microscopic parameters of undisturbed and remolded loess under freeze–thaw cycles are shown in Table 3 and Table 4.

3.4.2. Dimensionless Variables

The dimensionless data of undisturbed and remolded loess under freeze–thaw cycles are shown in Table 5 and Table 6. X0–X5 denote permeability, average max. radius, average eccentricity, fractal dimension, directionality probability entropy, and porosity with permeability, respectively.

3.4.3. Calculation of Correlation Coefficient

The results are summarized in Table 7 and Table 8, where ξ 1 ξ 4 refer to correlation coefficients of the average max. radius, average eccentricity, fractal dimension, directionality probability entropy, and porosity with permeability, respectively.

3.4.4. Calculation of Correlation Coefficient

The results of correlation coefficients are shown in Table 9 and Table 10.
As shown in Table 9, correlations of the five microscopic parameters with the permeability of original loess follow the sequence of average eccentricity > fractal dimension > directional probability entropy > porosity > average maximum radius. Correlations of all microscopic parameters with the permeability of the original loess exceed 0.6, indicating strong correlations.
As shown in Table 10, correlations of the five microscopic parameters with the permeability of remolded loess follow the sequence of porosity > average maximum radius > directional probability entropy > average eccentricity > fractal dimension. Specifically, the correlation of porosity with the permeability of remolded loess exceeds 0.6, representing a constant factor influencing the permeability of remolded loess. Additionally, the average maximum radius, directional probability entropy, average eccentricity, and fractal dimension with the permeability of remolded loess were below 0.6.

4. Discussion

4.1. Effects of Freeze–Thaw Cycles on Soil Permeability

There are not only similarities but also differences in the effects of freeze–thaw cycles on the permeability of undisturbed and remolded loess. The similarity is that both undisturbed and remolded loess show the same trend: “fluctuation-towards equilibrium–stability”. Before 30 freeze–thaw cycles, permeability coefficients of both undisturbed and remolded loess vary significantly. Under 30–60 freeze–thaw cycles, variation of permeability coefficients as a function of freeze–thaw cycles was reduced, indicating stabilization of loess permeability. The permeability of undisturbed and remolded loess changed by approximately 1 to 2 orders of magnitude in 0–60 freeze–thaw cycles. This is consistent with previous research findings [8,9]. The difference is that the undisturbed loess was strengthened, while remolded loess was weakened.
Effect of frozen stagnant water in the vadose zone and surface layer freeze–thaw cycle are the two main forms of freeze–thaw cycle action on loess slopes [28]. Seasonal freezing and thawing could lead to a constant change in dynamic and hydrostatic groundwater pressure over time, which directly affects the stress state and stability of the loess slope [29,30]. The permeability coefficient of in situ loess may decrease approximately by 1 order of magnitude after freeze–thaw cycle action. The reduced permeability coefficient hinders the exchange of groundwater between the interior and exterior of the slope, thus blocking the water drainage channels. Then, the groundwater gradually flows downward and enriches the lower and middle parts of the slope, leading to an increase in water levels. When the lower part of the loess is saturated in the beginning, high hydrostatic pressure will be generated along with static liquefaction. The static liquefaction will occur consequently, which could reduce the strength of the slope. In succession, slope deformation takes place, and a geological hazard is finally formed.

4.2. Effects of Freeze–Thaw Cycles on Soil Microstructure

The experimental results for the effects of freeze–thaw cycles on soil microstructure are consistent with variations of soil permeability: the microstructure parameters could comply with the “fluctuation–towards equilibrium–stability” trend. The results could be inevitably influenced by various factors in the quantitative analysis based on SEM images. First of all, since the area range observed by microscope is limited, choosing the right scanning area has always been a challenge in SEM tests. In consideration of SEM image research implications, this study first took the approach of finding feature areas and then expanding the range of SEM images. In addition, when microstructural parameters are determined using binarized SEM images in Image–Pro Plus, the results are strongly influenced by the setting of thresholds on the SEM images during the process of binarization. This test was conducted by iterative debugging and comparison to determine the most reasonable threshold value to avoid errors.
There also is an advantage in using NMR for quantitative pore analysis because it is a nondestructive test, which significantly improves the accuracy and range in the process of measurement.

4.3. The Correlation of Permeability with Microstructure

To date, the investigation of the correlation between permeability and microstructure parameters of soil is limited, especially in Yili, China. The results of this research show that the coefficient of permeability is mostly and strongly correlated with eccentricity in the undisturbed loess and with porosity in the remolded loess.
Consideration can be given to how to change the eccentricity of loess particles when preventing and governing geological hazards of surface deformation caused by freeze–thaw action. Future research could focus on changing the porosity of loess when solving the problem of impermeability in the construction of loess projects in Yili. The results of this study may serve as an additional reference for the prevention and governance of loess landslides induced by the freeze–thaw cycles and permeability reduction in construction on loess in seasonally frozen areas in Yili.

5. Conclusions

In this study, the impacts of freeze–thaw cycles on the permeability of Yili loess were investigated using permeability tests on undisturbed (virgin, in situ) and remolded loess samples taken before and after freeze–thaw cycles. Scanning electron microscopy and nuclear magnetic resonance techniques were utilized to investigate the microscopic mechanism of the freeze–thaw process on the loess. Grey relation analysis (GRA) was employed to analyze the correlation between macroscopic permeability and microscopic parameters (maxi. radius, eccentricity, fractal dimension, directional probability entropy, and porosity). The conclusions are as follows:
  • Before 30 freeze–thaw cycles, the permeability coefficient of the original loess indicated three peaked–trends and reached 7.70 × 10⁻⁸ cm/s, while that of remolded loess exhibited two peaked–trends and reached 6.34 × 10⁻⁸ cm/s. Under 30–60 freeze–thaw cycles, permeability coefficients of both original and remolded loess fluctuated in the range of 6.83 × 10⁻⁸ to 7.07 × 10⁻⁸ cm/s. Variations of both permeability coefficients decreased as the number of freeze–thaw cycles increased (approached 0 eventually). The results suggest that loess permeability of loess in Yili is stabilized as the number of freeze–thaw cycles increases. This was because of the degradation effect of the freeze–thaw cycles on soil body and particle sizes, and soil was stabilized as the number of freeze–thaw cycles increased.
  • Quantitative analysis of SEM images of loess after freeze–thaw cycles revealed that large particles decreased and medium–sized particles increased in original loess, freeze–thaw cycles increased. On the other hand, large particles increased, and medium–sized particles decreased in remolded loess as the number of freeze–thaw cycles increased. The average eccentricity of particles in both original and remolded loess decreased from 0.565 to 0.535. The average fractal dimension of particles in the original loess decreased as the number of freeze–thaw cycles increased. In contrast, that of particles in remolded loess increased slightly after two peaked–trends. The directional probability entropy of particles in both original and remolded loess exhibited peaked trends under freeze–thaw cycles. Specifically, under 0–30 freeze–thaw cycles, arrangements of loess particles were in disorder and order under 0–30 and 30–60 freeze–thaw cycles, respectively.
  • The porosity of original loess samples was initially 41.88% and exhibited peaked trends before 60 freeze–thaw cycles. It was maximized (48.93%) at the 10th cycle. Under freeze–thaw effect, overall pore quantity in undisturbed loess decreased. The porosity of remolded loess samples was initially 29.15% and increased with the number of freeze–thaw cycles. The trend of porosity was consistent with the results of the permeability test. Additionally, the total number of pores in remolded loess increased after freeze–thaw cycles.
  • NMR results revealed that the porosity of original loess samples was initially 41.88% and exhibited peaked trends before 60 freeze–thaw cycles. As the number of freeze–thaw cycles increased, the porosity of original loess samples was stabilized at 41.25%. The porosity of remolded loess samples was initially 29.15% and increased with the number of freeze–thaw cycles. The porosity of remolded loess samples was 32.55% after 60 freeze–thaw cycles. In undisturbed loess samples, micropores and small pores decreased and then increased, while medium pores and large pores increased and then decreased as the number of freeze–thaw cycles increased. In remolded loess samples, micropores decreased, while small, medium, and large pores increased slightly as the number of freeze–thaw cycles increased.
  • GRA results indicated that average eccentricity, fractal dimension, directional probability entropy, and porosity have strong correlations with the permeability of original loess; porosity strongly correlates with the permeability of remolded loess, while the other parameters have weak correlations with the permeability of remolded loess.

Author Contributions

Conceptualization, Q.L.; methodology, Q.L.; validation, Z.Z., T.Z., Z.G., X.H., R.H. and J.Z.; formal analysis, Q.L.; investigation, T.Z., Z.G. and R.H.; resources, Z.Z.; data curation, Q.L.; writing–original draft preparation, Q.L.; writing–review and editing, Q.L. and T.L.; visualization, Z.Z.; supervision, Z.Z. and J.Z.; project administration, Z.Z.; funding acquisition, Z.Z. All authors have read and agreed to the published version of the manuscript.

Funding

This research was funded by the National Natural Science Foundation of China, grant number 41967036; Xinjiang Uygur Autonomous Region Special Program for Key R&D Tasks, grant number 2021B03004–1; State Key Laboratory for GeoMechanics and Deep Underground Engineering, China University of Mining & Technology, grant number SKLGDUEK2028; 2021 Xinjiang Uygur Autonomous Region Postgraduate Education Innovation Programme Project; and Xinjiang University Student Innovation Training Programme.

Data Availability Statement

The data used to support the findings of this study are included within the manuscript.

Conflicts of Interest

The authors declare that there are no conflict of interest.

References

  1. Zhu, S.; Yin, Y.; Wang, W.; Wei, Y.; Shao, H.; Huang, Z.; Zhuang, M.; Shi, A. Mechanism of freeze-thaw loess landslide in Yili River Valley. Xinjiang. Acta Geosci. Sin. 2019, 40, 339–349. [Google Scholar]
  2. Zhuang, M.; Gao, W.; Zhao, T.; Hu, R.; Wei, Y.; Shao, H.; Zhu, S. Mechanistic Investigation of Typical Loess Landslide Disasters in Ili Basin, Xinjiang, China. Sustainability 2021, 13, 635. [Google Scholar] [CrossRef]
  3. Wu, Y.; Ouyang, W.; Hao, Z.; Yang, B.; Wang, L. Snowmelt water drives higher soil erosion than rainfall water in a mid-high latitude upland watershed. J. Hydrol. 2018, 556, 438–448. [Google Scholar] [CrossRef]
  4. Woo, M.; Marsh, P.; Pomeroy, J. Snow, frozen soils and permafrost hydrology in Canada, 1995–1998. Hydrol. Process. 2000, 14, 1591–1611. [Google Scholar] [CrossRef]
  5. Norikazu, M.; Hiroaki, S. Rockfall activity from an alpine cliff during thawing periods. Geomorphology 1999, 3, 309–328. [Google Scholar]
  6. Chamberlain, E.J.; Gow Anthony, J. Effect of Freezing and Thawing on the Permeability and Structure of Soils; Elsevier: Amsterdam, The Netherlands, 1979; Volume 13, pp. 1–4. [Google Scholar]
  7. Qi, J.; Ma, W. State-of-art of research on mechanical properties of frozen soils. Rock Soil Mech. 2010, 31, 133–143. [Google Scholar]
  8. Chamberlain, E.J.; Iskander, I.; Hunsiker, S.E. Effect of freeze-thaw cycles on the permeability and macrostructure of soils. In Proceedings of the International Symposium on Frozen Soil Impacts on Agricultura, Range and Forest Lands, Spokane, WA, USA, 21–22 March 1990; pp. 145–155. [Google Scholar]
  9. Viklander, P. Permeability and volume changes in till due to cyclic freeze thaw. Can. Geotech. J. 1998, 35, 471–477. [Google Scholar] [CrossRef]
  10. Xiao, D.; Feng, W.; Zhang, Z.; Ming, J.; Wang, Q. Research on the Lanzhou loess’s permeabilities changing with freezing-thawing cycles. J. Glaciol. Geocryol. 2014, 36, 1192–1198. [Google Scholar]
  11. Lan, J.; Zhang, A.; Guo, M.; Dong, X. Influence of iterative freezing-thawing on void ratio and permeability coefficient of loess. Yangtze River 2010, 41, 55–58. [Google Scholar]
  12. Li, G.; Ma, W.; Mu, Y.; Wang, F.; Fan, S.; Wu, Y. Effects of freeze-thaw cycle on engineering properties of loess used as road fills in seasonally frozen ground regions, North China. J. Mt. Sci. 2017, 14, 356–368. [Google Scholar] [CrossRef]
  13. Xu, J.; Wang, Z.; Ren, J.; Wang, S.; Jin, L. Mechanism of slope failure in loess terrains during spring thawing. J. Mt. Sci. 2018, 15, 845–858. [Google Scholar] [CrossRef]
  14. Edwin, J.; Anthon, Y. Effect of freezing and thawing on the permeability and structure of soils. Eng. Geol. 1979, 13, 73–92. [Google Scholar]
  15. Qi, J.; Zhang, J.; Zhu, Y. Influence of freezing-thawing on soil structure and its soil mechanics significance. Chin. J. Rock Mech. Eng. 2003, S2, 2690–2694. [Google Scholar]
  16. Ni, W.; Shi, H. Influence of freezing-thawing cycles on micro-structure and shear strength of loess. J. Glaciol. Geocryol. 2014, 36, 922–927. [Google Scholar]
  17. Zhang, Z.; Ma, W.; Qi, J. Influence of freezing-thawing on soil structure and its soil mechanics significance. J. Jilin Univ. (Earth Sci. Ed.) 2013, 43, 1904–1914. [Google Scholar]
  18. Jiang, M. New paradigm for modern soil mechanics: Geomochanics from micro to macro. Chin. J. Geotech. Eng. 2019, 2, 195–254. [Google Scholar] [CrossRef]
  19. Deng, J. Overview of Grey Systems. World Sci. 1983, 7, 1–5. [Google Scholar]
  20. Zhao, Y.; Liu, G.; Mao, J. Sensitivity Analysis for the Stability of Loess Slope Based on Grey Correlation Degree. J. Yangtze River Sci. Res. Inst. 2015, 32, 94–98. [Google Scholar]
  21. Xue, L.; Hai, M.I.; Fang, X.U. Sensitivity and Regression Analysis of Instable Factors of High Slope of Loess under Rainfall Infiltration. J. Gansu Sci. 2010, 22, 143–148. [Google Scholar]
  22. GB/T 50123-1999. Geotechnical Test Method Standards; People’s Republic of China: Beijing, China, 1999.
  23. Xu, J.; Li, Y.; Ren, C.; Ren, C.; Lan, W. Damage of saline intact loess after dry-wet and its interpretation based on SEM and NMR. Soils Found. 2020, 60, 911–928. [Google Scholar] [CrossRef]
  24. Coates, G.; Xiao, L.; Prammer, M. NMR Logging Principles and Applications; Petroleum Industry Press: Beijing, China, 2007. [Google Scholar]
  25. Liu, Y.; Li, Z.; Guo, L.; Kang, W.; Zhou, Y. Pore characteristics of soft soil under triaxial shearing measured with NMR. Chin. J. Rock Mech. Eng. 2018, 37, 1924–1932. [Google Scholar]
  26. Cheng, Q. Study on the Mechanical Properties and Structure Changes in Microscale and Mesoscale of Loess in Heifangtai under Freeze-thaw Action; China University of Geosciences: Beijing, China, 2018. [Google Scholar]
  27. Lei, X. Pore types and collapsibility of loess in China. Sci. China (Ser. B Chem. Biol. Agron. Med. Geosci.) 1987, 17, 1309–1318. [Google Scholar]
  28. Wang, N.; Yao, Y. Characteristics and Mechanism of Landslides in Loess during Freezing and Thawing Periods in Seasonally Frozen Ground Regions. J. Disaster Prev. Ention. Mitig. Eng. 2008, 28, 163–166. [Google Scholar]
  29. Cuituoweiqi, H.A. Mechanics of Frozen Ground; Science Press: Beijing, China, 1985. [Google Scholar]
  30. Govi, M.; Pasuto, A.; Silvano, S.; Siorpaes, C. An example of a low-temperature-triggered landslide. Eng. Geol. 1993, 36, 53–65. [Google Scholar] [CrossRef]
Figure 1. Particle grading curve of soil samples (all three samples were taken from Yili, China).
Water 13 03257 g001
Figure 2. Fitting curve and regression equation of water content and NMR signal.
Water 13 03257 g002
Figure 3. The coefficient of permeabilities under freeze–thaw cycles.
Water 13 03257 g003
Figure 4. The SEM images of remolded loess sample under 0 cycles. (ad) The SEM images of undisturbed loess under 0 cycles; (eh) remolded loess under 0 cycles.
Water 13 03257 g004
Figure 5. The parts of SEM images were binarized and identified. (a,b) The picture of undisturbed loess under 0 cycles; (c,d) remolded loess under 0 cycles.
Water 13 03257 g005
Figure 6. Percentages of loess particles with different maximum radii corresponding to different numbers of freeze–thaw cycles. (a) Undisturbed loess; (b) remolded loess. (There is no particle with a maximum radius <2 µm or 2–5 µm.)
Water 13 03257 g006
Figure 7. The average eccentricity of loess particles corresponding to different numbers of freeze-thaw cycles.
Water 13 03257 g007
Figure 8. Fractal dimensions of loess particles corresponding to different numbers of freeze–thaw cycles.
Water 13 03257 g008
Figure 9. Directionality of loess particles corresponding to different numbers of freeze–thaw cycles.
Water 13 03257 g009
Figure 10. Porosity under freeze-thaw cycles.
Water 13 03257 g010
Figure 11. T2 curves of saturated samples after freeze–thaw cycles. (a) Undisturbed loess; (b) remolded loess.
Water 13 03257 g011aWater 13 03257 g011b
Figure 12. The pore distribution of each group under freeze–thaw cycles. (a) Undisturbed loess; (b) remolded loess.
Water 13 03257 g012
Table 1. Average temperature during freezing and thawing period from 2009 to 2018 (from the local meteorological office).
Year2009201020112012201320142015201620172018
Month23232323232323232323
Max. Temp. (°C)2811306−17114−41041041529114
Min. Temp. (°C)−18−6−20−7−7−3−10−2−82−13−1−50−63−70−82
Table 2. The part of results after binarization and microstructural parameter measurement.
Sample NumberParticle NumberMax. Radius (µm)EccentricityFractal DimensionAngle (°)
Undisturbed loess
under 0 cycles
132.581.771.1789.66
2388.403.771.27178.05
374.343.441.1830.09
4356.692.121.33162.88
526.361.261.16104.70
616.301.751.0724.13
772.701.551.2166.55
8102.052.001.2494.02
98.612.071.07100.55
1058.672.301.0788.11
Table 3. Macroscopic and microscopic parameters of undisturbed loess under freeze–thaw cycles.
Freeze-Thaw Cycle0571020304560
Reference sequencePermeability (cm/s)1.65 × 10−73.07 × 10−71.10 × 10−72.50 × 10−73.18 × 10−72.03 × 10−78.01 × 10−84.00 × 10−8
Comparison sequenceAverage max. radius (µm)37.57122.79125.86016.90823.81916.26319.87617.642
Eccentricity0.5680.5490.5760.5410.5450.5330.5550.537
Fractal dimension1.1091.1021.0961.0941.0931.1061.0931.089
Directional probability entropy0.9800.9730.9890.9770.9880.9870.9790.975
Porosity (%)41.8842.5647.148.9244.3144.3640.6741.25
Table 4. Macroscopic and microscopic parameters of remolded loess under freeze–thaw cycles.
Freeze-Thaw Cycle0571020304560
Reference sequencePermeability9.31 × 10−91.47 × 10−81.93 × 10−82.29 × 10−81.39 × 10−82.35 × 10−81.17 × 10−87.63 × 10⁻⁹
Comparison sequenceAverage max. radius (µm)21.23830.01214.72423.54523.94020.73728.07420.293
Eccentricity0.5620.5080.5600.5520.5460.5460.5480.535
Fractal dimension1.0881.1101.0891.1021.0931.1021.1021.102
Directional probability entropy0.9790.9670.9790.9890.9890.9940.9880.977
Porosity (%)29.1529.6731.8728.7730.2931.4531.632.55
Table 5. The dimensionless data of undisturbed loess under freeze–thaw cycles.
X0X1X2X3X4X5
1.4482.0001.8262.0001.4381.147
1.7561.3061.3861.6501.0001.229
2.0001.4502.0001.3502.0001.779
1.5851.0301.1951.2501.2592.000
1.0001.3551.2871.2001.9051.441
1.1331.0001.0001.8501.8741.447
1.1051.1701.5201.2001.3811.000
1.1021.0651.1081.0001.1171.070
Table 6. The dimensionless data of remolded loess under freeze–thaw cycles.
X0X1X2X3X4X5
1.0251.4262.0001.0001.4561.101
1.2312.0001.0002.0001.0001.238
1.0951.0001.9741.0451.4641.820
1.2401.5771.8211.6361.8361.000
1.0001.6031.7011.2271.8351.402
1.8461.3931.7101.6362.0001.709
2.0001.8731.7381.6361.7961.749
1.9561.3641.4951.6361.3762.000
Table 7. The correlation coefficients between permeability and microscopic parameters of undisturbed loess.
ξ1ξ2ξ3ξ4ξ5
0.4510.5450.4510.5710.600
0.5020.5500.4650.4090.462
0.4521.0000.3630.3340.672
0.4490.5370.4360.4800.522
0.5610.6120.6540.8300.506
0.7730.7730.7280.9430.590
0.8760.5220.9500.9740.811
0.9240.9860.8410.9710.934
Table 8. The correlation coefficients between permeability and microscopic parameters of remolded loess.
ξ1ξ2ξ3ξ4ξ5
0.5560.3380.7770.4790.878
0.3930.6870.3930.3351.000
0.8480.3620.8480.5540.408
0.6000.4620.5980.4110.679
0.4530.4160.4860.3890.555
0.5260.7920.4620.6610.791
0.8040.6590.6590.5020.669
0.4580.5210.4420.6670.930
Table 9. The average correlation coefficient between permeability and microscopic parameters of undisturbed loess.
Comparison SequenceGrey Relational Grade
Permeability
Average max. radius0.623
Eccentricity0.691
Fractal dimension0.654
Directional probability entropy0.689
Porosity0.637
Table 10. The average correlation coefficient between permeability and microscopic parameters of remolded loess.
Comparison SequenceGrey Relational Grade
Permeability
Average max. radius0.580
Eccentricity0.530
Fractal dimension0.573
Directional probability entropy0.500
Porosity0.739
Publisher’s Note: MDPI stays neutral with regard to jurisdictional claims in published maps and institutional affiliations.

