
Sorption of Ce(III) by Silica SBA-15 and Titanosilicate ETS-10 from Aqueous Solution
by
 , , , ,
Inga Zinicovscaia
1,2,* ,
,
Nikita Yushin
1,
Doina Humelnicu
3 ,
,
Dmitrii Grozdov
1,
Maria Ignat
3,
Stefan Demcak
1 and 
Ionel Humelnicu
3 1
Department of Nuclear Physics, Joint Institute for Nuclear Research, Joliot-Curie Str., 6, 1419890 Dubna, Russia
2
Department of Nuclear Physics, Horia Hulubei National Institute for R&D in Physics and Nuclear Engineering, 30 Reactorului Str. MG-6, 76900 Bucharest-Magurele, Romania
3
Department of Chemistry, Faculty of Chemistry, Alexandru Ioan Cuza University of Iasi, Bld. Carol I, 11, 700506 Iasi, Romania
*
Author to whom correspondence should be addressed.
Water 2021, 13(22), 3263; https://doi.org/10.3390/w13223263
Submission received: 26 October 2021
/
Revised: 7 November 2021
/
Accepted: 15 November 2021
/
Published: 17 November 2021
(This article belongs to the Special Issue Wastewater Treatment: Membranes and Adsorptive Processes)
Abstract
:The adsorption capacity of two sorbents, silica SBA-15 and titanosilicate ETS-10, toward Ce(III) was tested. The obtained sorbents were characterized using X-ray diffraction, nitrogen adsorption-desorption, Scanning electron microscopy, and Fourier-transform infrared spectroscopy. The effects of solution acidity, cerium concentration, time of contact, and temperature on Ce(III) sorption were investigated. The maximum Ce(III) removal by silica SBA-15 was achieved at pH 3.0 and by titanosilicate ETS-10 at a pH range of 4.0–5.0. The Freundlich, Langmuir, and Temkin isotherm models were applied for the description of equilibrium sorption of Ce(III) by the studied absorbents. Langmuir model obeys the experimentally obtained data for both sorbents with a maximum sorption capacity of 68 and 162 mg/g for silica SBA-15 and titanosilicate ETS-10, respectively. The kinetics of the sorption were described using pseudo-first- and pseudo-second-order kinetics, Elovich, and Weber–Morris intraparticle diffusion models. The adsorption data fit accurately to pseudo-first- and pseudo-second-order kinetic models. Thermodynamic data revealed that the adsorption process was spontaneous and exothermic.
1. Introduction
In recent years, a large volume of rare-earth elements (REEs) has entered the environment due to the rapid increase of REE resources exploitation and their wide applications [1]. Cerium is the most abundant rare earth element, which due to its unique physicochemical properties; it is used in the production of glass polishing powders, mischmetal, magnets, alloys, fluorescent powders, pigments, and catalysts [2,3]. The wide consumption of cerium during the last decades resulted in environmental pollution (Zhao et al. 2019). Taking into account the accumulation properties of cerium and its application in the nuclear industry, it is necessary to find an environmentally safe and economical method for Ce-containing solutions’ treatment [1,4].
Ion exchange, chemical precipitation, solvent extraction, adsorption, and reverse osmosis are the most common methodologies applied for the recovery of REEs from various matrices [3,5]. However, high reagents and energy consumption, low selectivity, generation of secondary pollution, and by-products are serious limitations of the mentioned techniques [3,6]. Physical adsorption has great prospects owing to its effectiveness, environmental safety, and feasible operation [7]. The key role in the adsorption process belongs to the adsorbent. Activated carbon, a traditionally used sorbent, is expensive, while biological sorbents have low sorption capacity for some metals and low resistance to regeneration by acids.
Mesoporous material is a class of materials with high specific surface area, low relative density, high porosity, continuously adjustable pore size in a certain range, and good hydrothermal stability, which can be applied for metal removal from wastewater [7]. ETS-10 is a microporous titanosilicate which, by contrast with zeolites, consists of SiO4 tetrahedra, TiO6 octahedra bridged by oxygen atoms, and exchangeable charge-balancing cations (K and Na) [8,9]. Several studies demonstrated the applicability of ETS-10 for metal ions removal. The sorption capacity of microporous titanosilicate ETS-10 toward lead ions was tested by Zhao and coauthors. The maximum adsorption capacity of lead on ETS-10 was 1.12 mmol/g [6]. Lv and co-authors [8] applied ETS-10 for lead, copper, and cadmium removal from binary and ternary systems. ETS-10 was successfully used to remove copper, cobalt, zinc, and manganese ions [10].
SBA-15 is one of the most promising silica mesophases due to its large surface area, narrow pore size distribution, high hydrothermal, and mechanical stability [11]. The maximum adsorption capacity of Na-mesoporous silica SBA-15 toward cadmium was 9.84 mg/g [7]. N-Propylsalicylaldimino-functionalized SBA-15 mesoporous silica was applied for Cu2+, Co2+, Ni2+, and Zn2+ sorption [12]. Mesoporous silica SBA–15 modified with trithiane allowed to remove 85% of mercury ions from solution [13]. SBA-15 functionalized with 3-aminopropyl trimethoxy-silane allowed removal of more than 95% of Cd, Co, Cu, Zn, Pb, Ni, Al, and Cr ions [11].
Although both sorbents were successfully used for the removal of heavy metals, the information about their use for rare earth elements sorption is very limited [14,15].
In the present study, the sorption of Ce(III) at different pH, cerium concentrations, contact time, and temperature onto silica SBA-15 and titanosilicate ETS-10 sorbents was investigated. The equilibrium, kinetics, and thermodynamics of the sorption process are described.
2. Materials and Methods
2.1. Adsorbents Synthesis
2.1.1. Silica SBA-15
In the synthesis of SBA-15 silica, the amphiphilic triblock copolymer poly(ethylene glycol)-block-poly(propylene glycol)-block-poly(ethylene glycol) (Pluronic P123-EO20PO70EO20; Sigma Aldrich, Iasi, Romania) was used as a soft template. The synthesis procedure has been reported elsewhere [16]. Thus, 4 g of Pluronic P123 were dissolved in 150 mL of 2 M HCl aqueous solution and stirred for 5 h allowing the formation of surfactant micelles. Thereafter, silica source–9 g of TEOS (tetraethyl orthosilicate, Sigma Aldrich) was added dropwise to the prepared mixture under continuum stirring. The resulting gel was aged at 40 °C for 24 h and subsequently at 100 °C for 48 h, under continuum stirring. The molar ratio used in the synthesis was: 1 TEOS:0.017 P123:5.68 HCl:197 H2O. The white precipitate was recovered by filtration, washed multiple times with distilled water, and dried overnight in an oven at 100 °C. The solid was then calcined in a muffle furnace at 550 °C under air for 6 h at a heating rate of 1 °C/min.
2.1.2. Titanosilicate ETS-10
In the synthesis procedure of titanosilicate ETS-10 the gel composition 3.4Na2O:1.5K2O:TiO2:5.5SiO2:150H2O has been considered and the corresponding amounts of precursors have been calculated and used [17]. Accordingly, 1.62 g of NaCl (Sigma Aldrich) and 2.48 g of KCl (Sigma Aldrich, Iasi, Romania) were dissolved using ultrapure water (Elga PURELAB®, Lane End, UK) in a high-density polyethylene bottle. Afterwards, under continuum handshaking (about 10 min), 9.41 mL of sodium silicate (extra pure from Merk, Iasi, Romania) were added dropwise into the aqueous salt solution, resulting in the Si precursor solution (solution A). In another beaker, the Ti source suspension was prepared, using 0.88 g of commercial TiO2 (Degussa-P25, Sigma Aldrich, Iasi, Romania) and 7.8 mL of H2SO4 (9%) aqueous solution (solution B). The solution B was hand-shaken vigorously for 5 min while pouring the solution A into the Si precursor solution, resulting in a viscous solution that was hand-shaken further for another 5 min. The resulting gel was transferred into a Teflon-lined stainless-steel autoclave and placed for 72 h in the oven at 230 °C. Afterwards, the reaction mixture was left to cool down at room temperature, then centrifuged and washed several times with ultrapure water, and lastly dried overnight at 50 °C. The white ETS-10 powder has been obtained.
2.1.3. Sorption Procedure
The solutions with desired Ce(III) concentrations were prepared by dissolving a suitable amount of Ce(NO3)3·6H2O (Sigma Aldrich, Darmstadt, Germany). To study the effect of pH on Ce(III) sorption, 20 mg of sorbent were added to 10 mL of solution with Ce(III) concentration 10 mg/L, and the pH of solution varied from 2.0 to 6.0. The solution with initial pH was adjusted to desired pH values using NaOH or HCl. For isotherm experiments, the procedure described above was used, except that the cerium concentrations in solution varied in the range of 10–100 mg/L at the optimal pH values. Kinetic and thermodynamic experiments were carried in the same way, except that the samples were collected at different time intervals (1–45 min) and the temperature of solution ranged from 20 to 50 °C. All experiments were performed in duplicates.
The Ce(III) adsorption q was calculated according to the equation:
and the adsorption removal efficiency, R (%), from the equation:
where q is the content of adsorbed metal, mg/g; V is the volume of solution, R, Ci and Cf are initial and final concentrations of metal in mg/L, and m is the mass of sorbent, g.
2.2. Methods
The N2 adsorption/desorption isotherms were recorded on a NOVA 2200e (Quantachrome Instruments, Boynton Beach, FL, USA). Adsorbents surface characterization was done using the S3400N Scanning Electron Microscope (Hitachi, Waltham, MA, USA) equipped with an energy-dispersive X-ray spectroscope. X-ray Diffraction patterns were recorded on a Shimadzu LabX XRD-6000 device (Shimadzu Co., Kyoto, Japan) with a scanning rate of 0.02°/min, using CuKα radiation (λ = 1.5406 Å). Cerium concentrations in solution were determined using ICP-AES (Analytik Jena, Jena, Germany). Infrared spectra were recorded employing a Bruker Alpha Platinum-ATR spectrometer (Bruker Optics, Ettingen, Germany). Thermal gravimetric analysis (TGA, NETZSCH TG 209 F1 Libra TGA209F1E-0199-L, Selb, Germany) was performed to determine the thermal stability of sorbents.
2.3. Sorbents Regeneration
To evaluate the possibility of sorbent use for several adsorption cycles, 20 mg of sorbent were added to 10 mL of solution with a Ce(III) concentration of 10 mg/L at optimal pH values for each sorbent. After 30 min of sorbent–sorbate interaction, the sorbent was separated from the solution and 10 mL of 0.01 M HNO3 were added to the sorbent. The desorption experiment lasted for 30 min, after which sorbent was separated from the solution, neutralized by 0.01 M NaOH, washed with double distilled water, and added to Ce(III) solution. The procedure was repeated for two more cycles.
3. Results and Discussion
3.1. Adsorbents’ Characterization
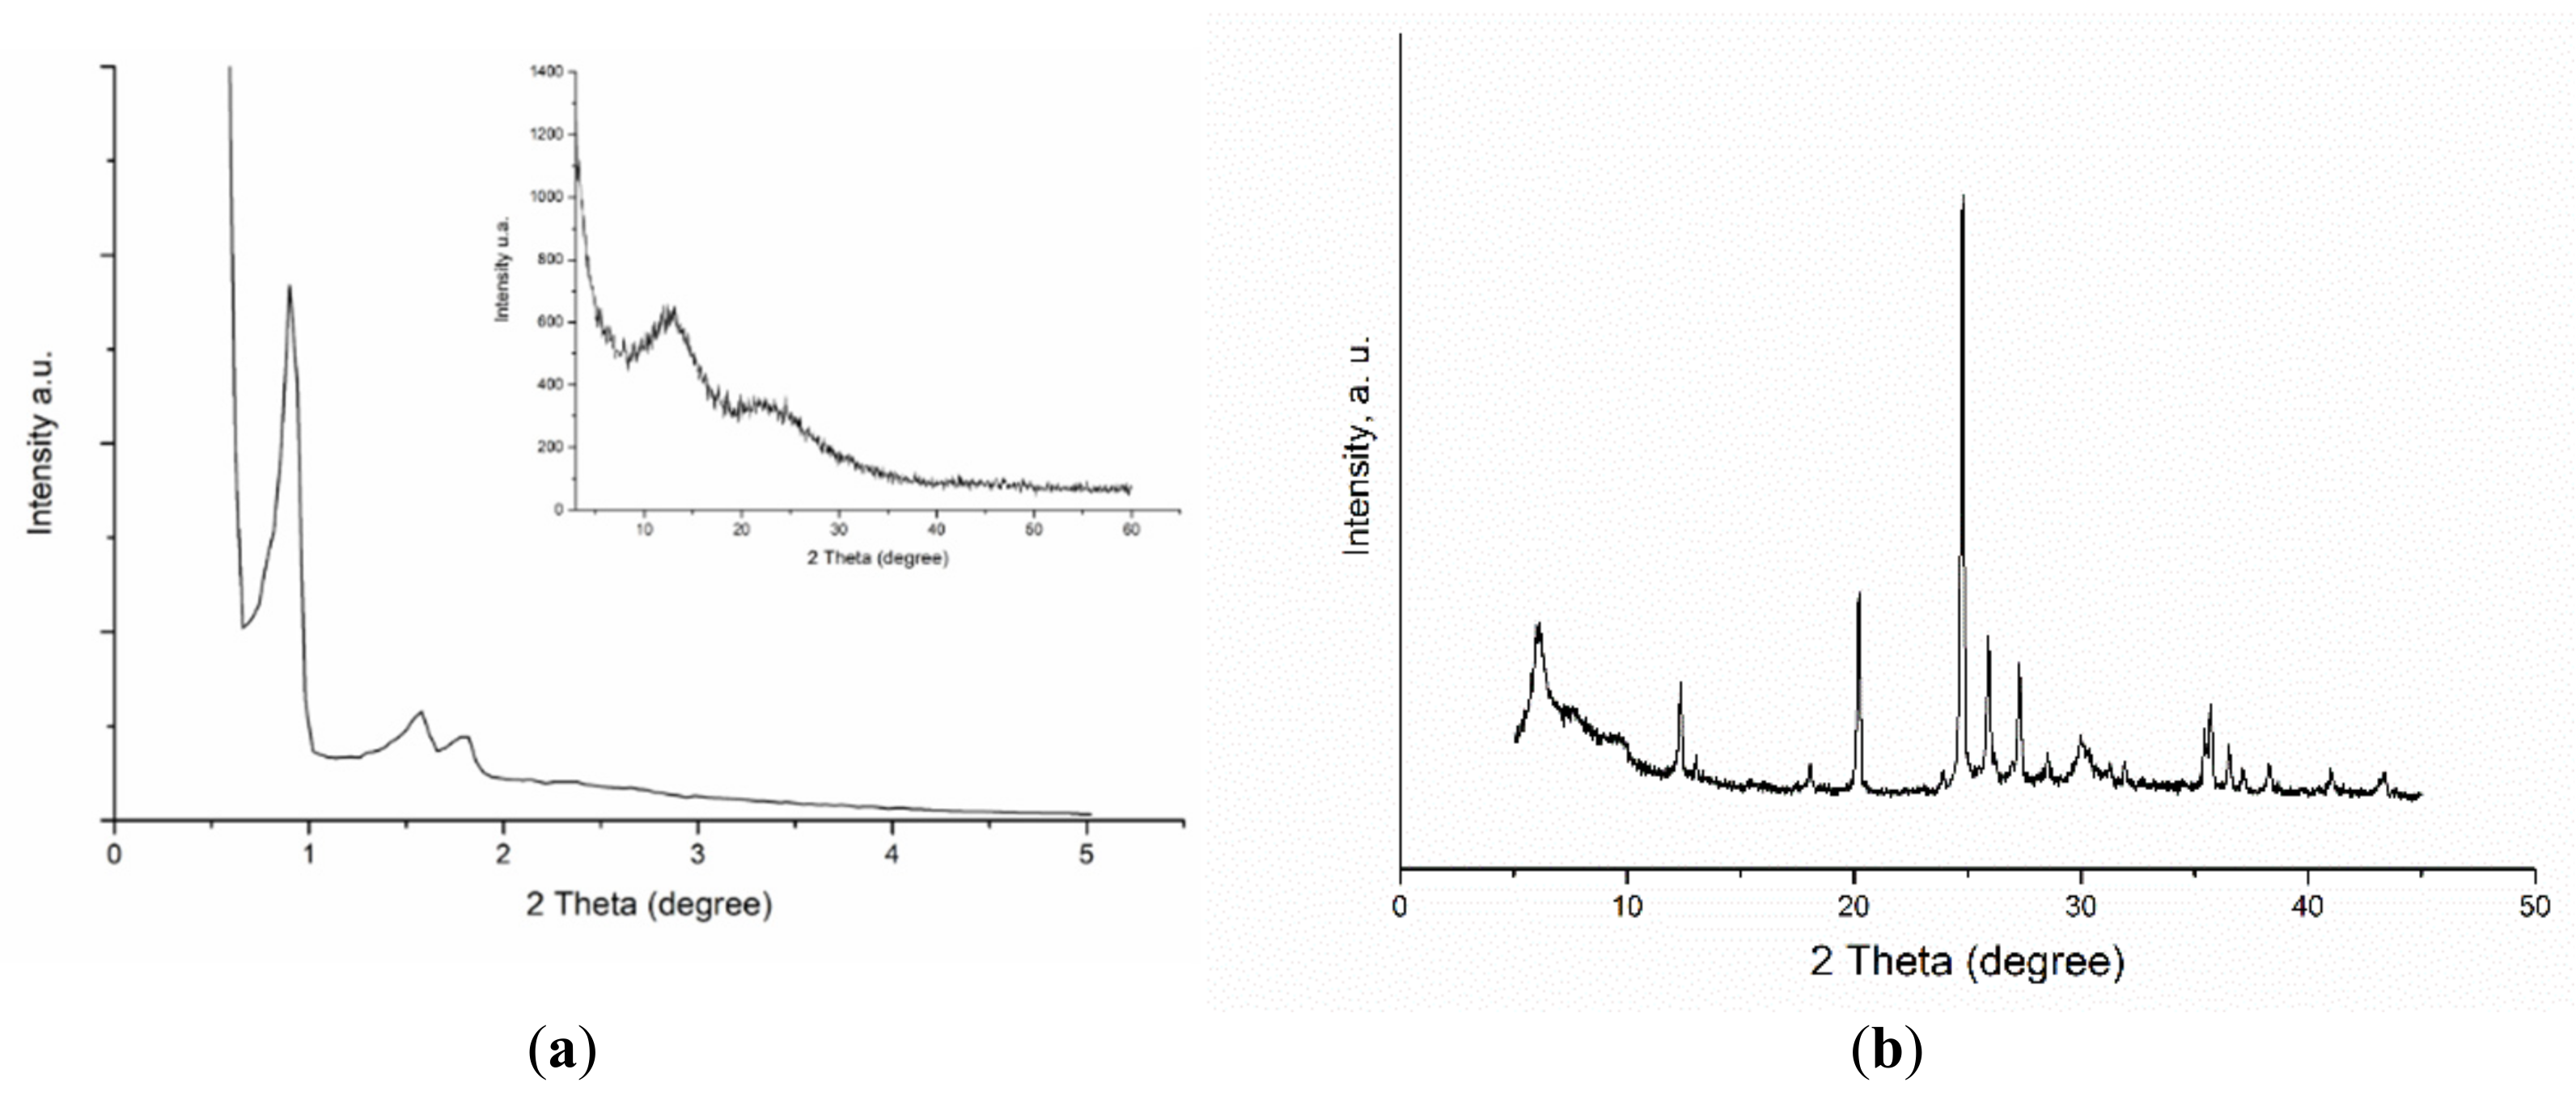
Figure 1 depicts the XRD pattern of spectra of the silica SBA-15 and titanosilicate ETS-10 used in this study. The measurements confirmed the SBA-15 structure (Figure 1a) for synthesized SBA-15 material [12]. The XRD pattern of titanosilicate ETS-10 is identical to that of ETS-10 materials reported previously [6,18]. In the XRD spectrum of ETS-10 material (Figure 1b), both board and narrow reflections are presented indicating high crystalline but disordered material [18].
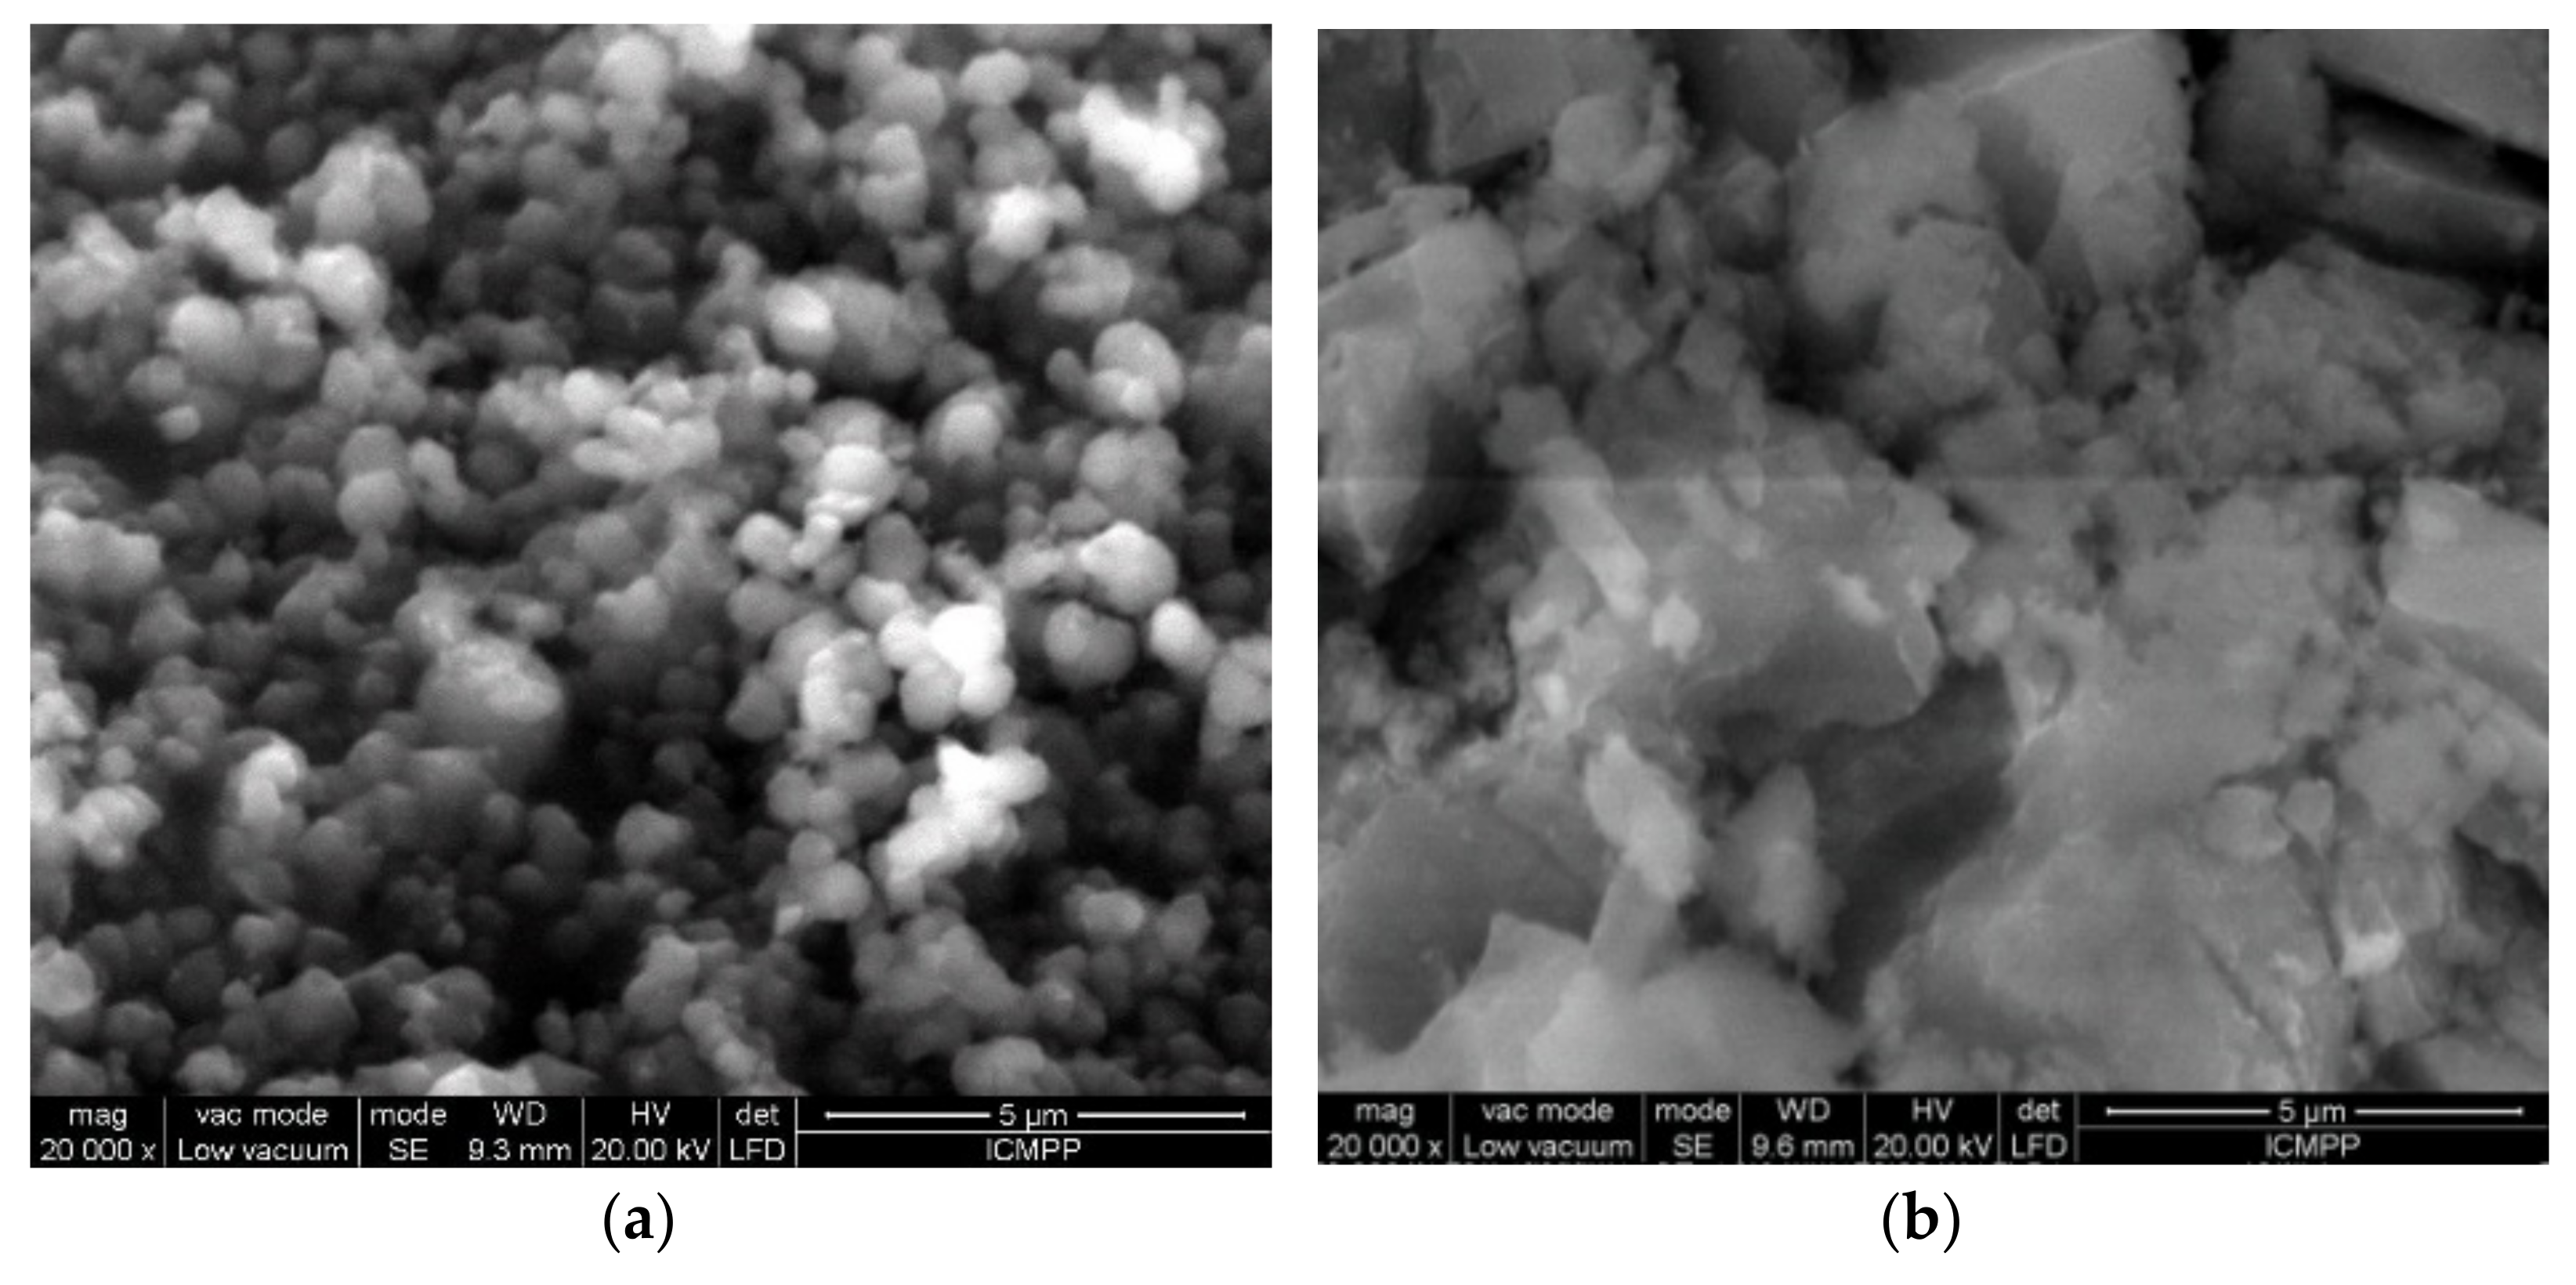
The SEM image of the synthesized silica SBA-15 (Figure 2a) shows characteristic spherical particle morphologies of 400–500 nm in diameter, which are agglomerated. Each particle is characterized by a mesoporosity, as N2-measurements proved. The synthesized ETS-10 material shows a morphology consisting of agglomerated quasi-cubic crystals as observed in Figure 2b.
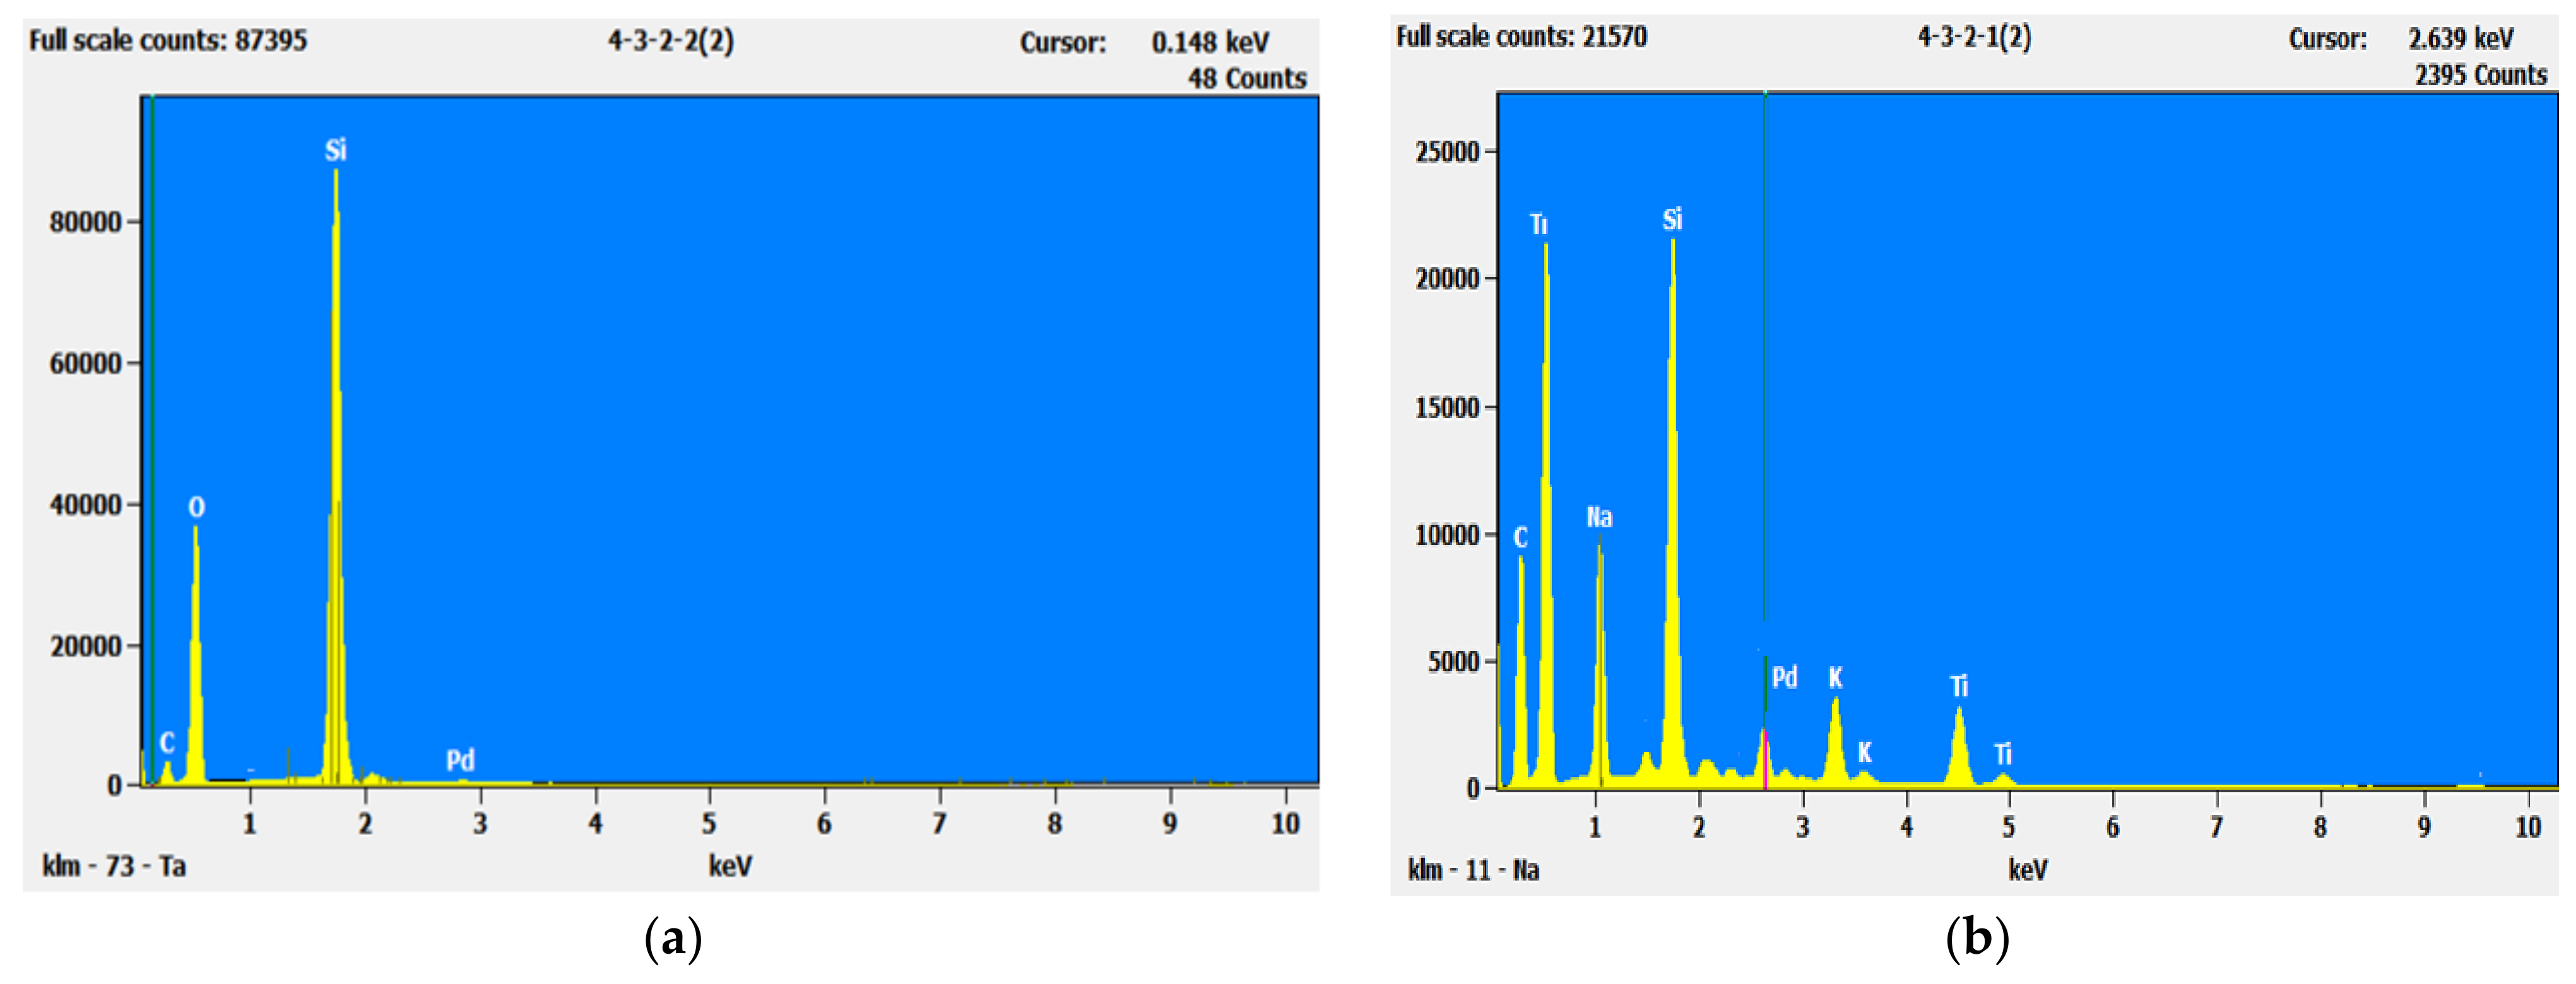
Using energy-dispersive X-ray spectroscopy (EDX), the elemental profile of the analyzed sorbents was determined (Figure A1). The EDX spectrum of silica SBA-15 sorbent showed only silicon and oxygen; consequently, the sample can be considered chemically pure. The EDX spectrum obtained for titanosilicate ETS-10 qualitatively confirmed the presence of Ti, Si, Na, and K in the sorbent, indicating its purity. The Na+/K+ ratio in ETS-10 of 2.8 was very close to the value reported by Rocha and Anderson [19]. The Na2O/SiO2 and SiO2/TiO2 molar ratios of 2.5 and 4.9, respectively, calculated for ETS-10 were close to theoretical values [17].
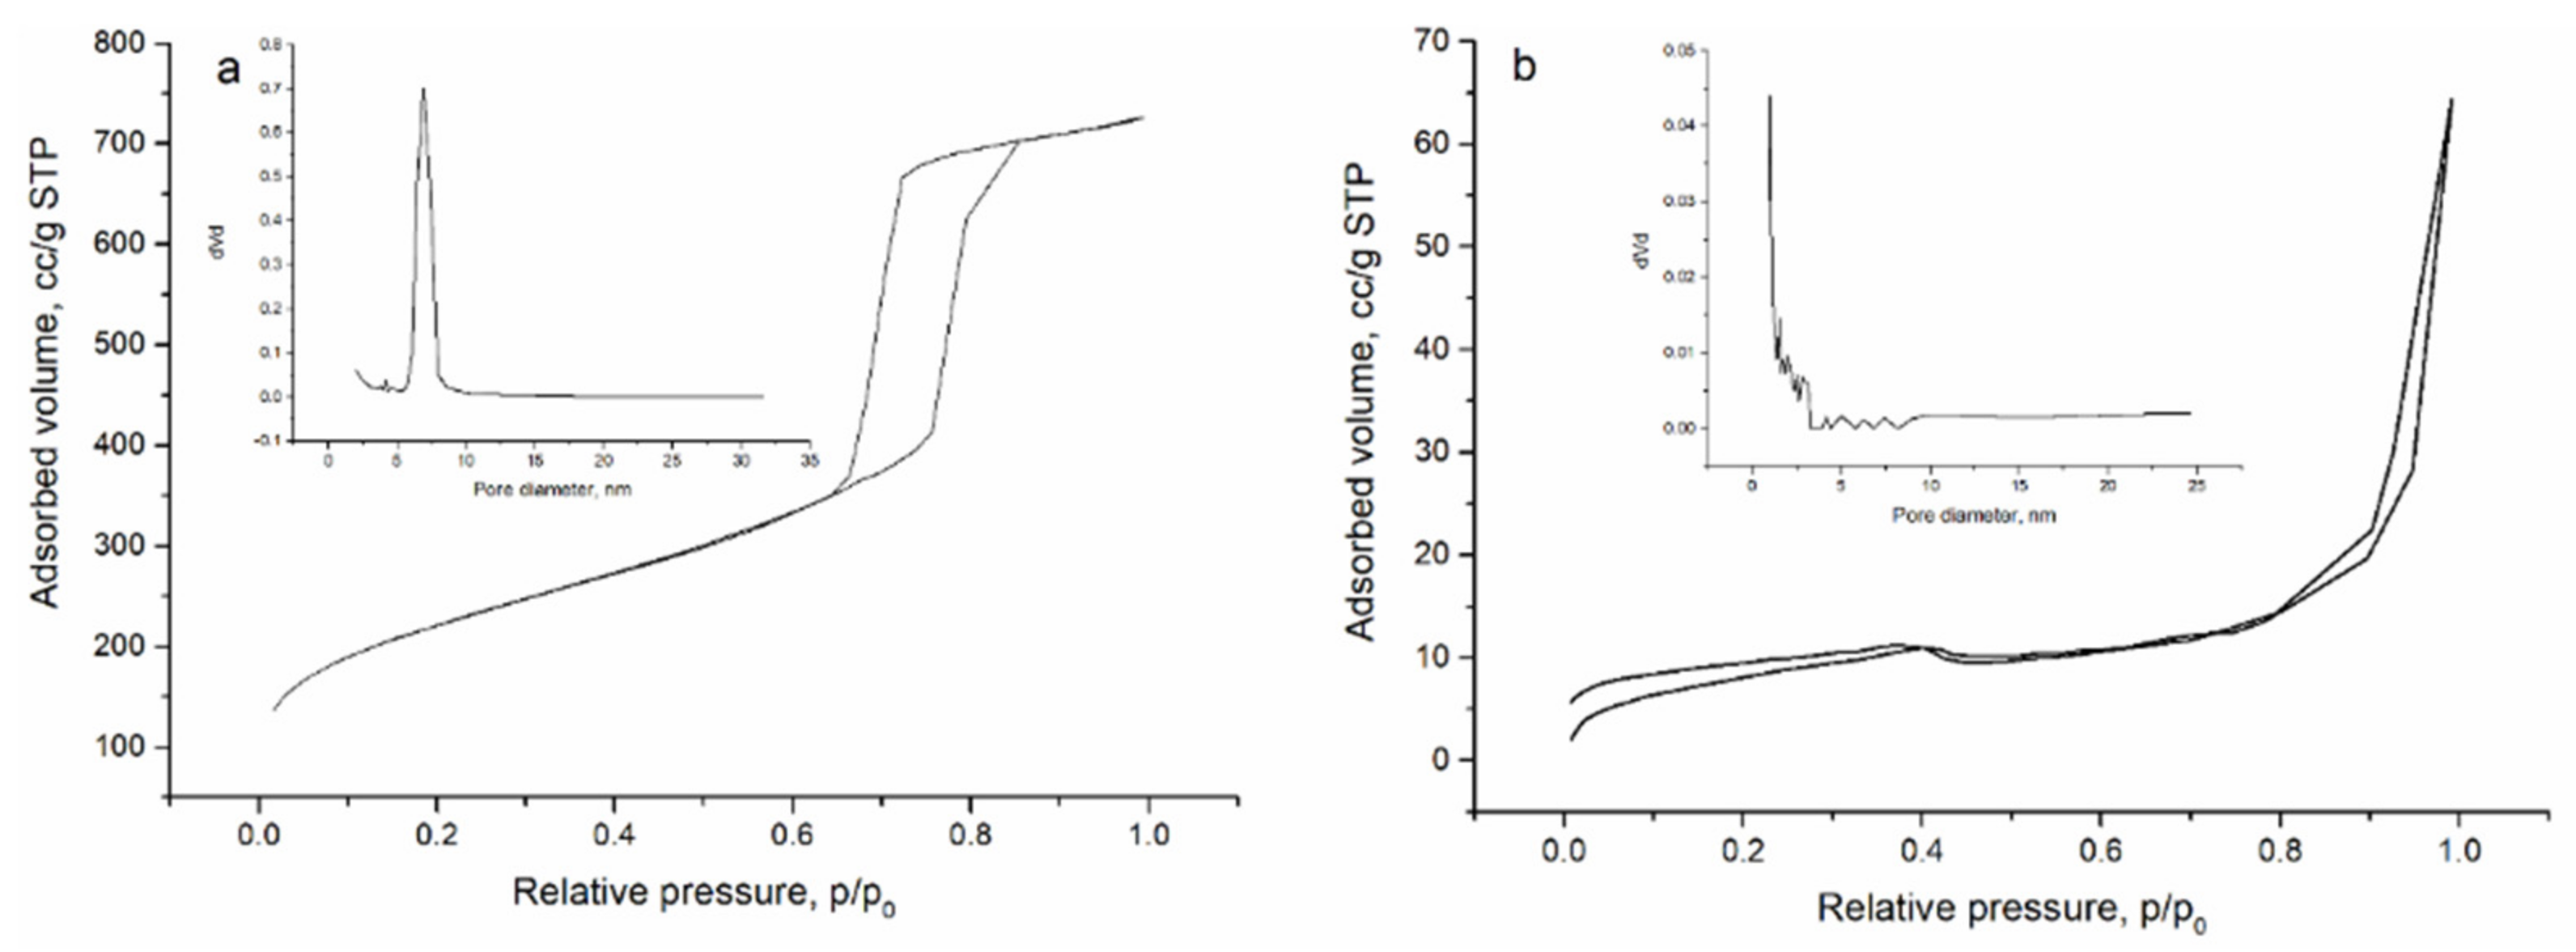
According to IUPAC classification [20], the obtained isotherms belong to the type IV (for SBA-15) and type II (for ETS-10) isotherms, which indicates the availability of mesopores in the structure of the adsorbents (Figure 3a) and pores with a diversity of sizes (Figure 3b). The BET surface area is 802.493 m2/g for silica SBA-15 and 31.473 m2/g for titanosilicate ETS-10, respectively. The SBA-15 silica material exhibits cylindrical pores, given by isotherm shape. The corresponding pore size distribution is narrow and almost symmetrical, with the mean pore diameter centered at 9 nm. At the opposite pole, the ETS-10 material exhibits a small hysteresis loop at relative pressure between 0.4 and 1.0, leading to a very broad pore size distribution [9], which is due to the packing of crystallites forming slit-shaped pores with various diameters macropores which are not fully completed with pore condensate.
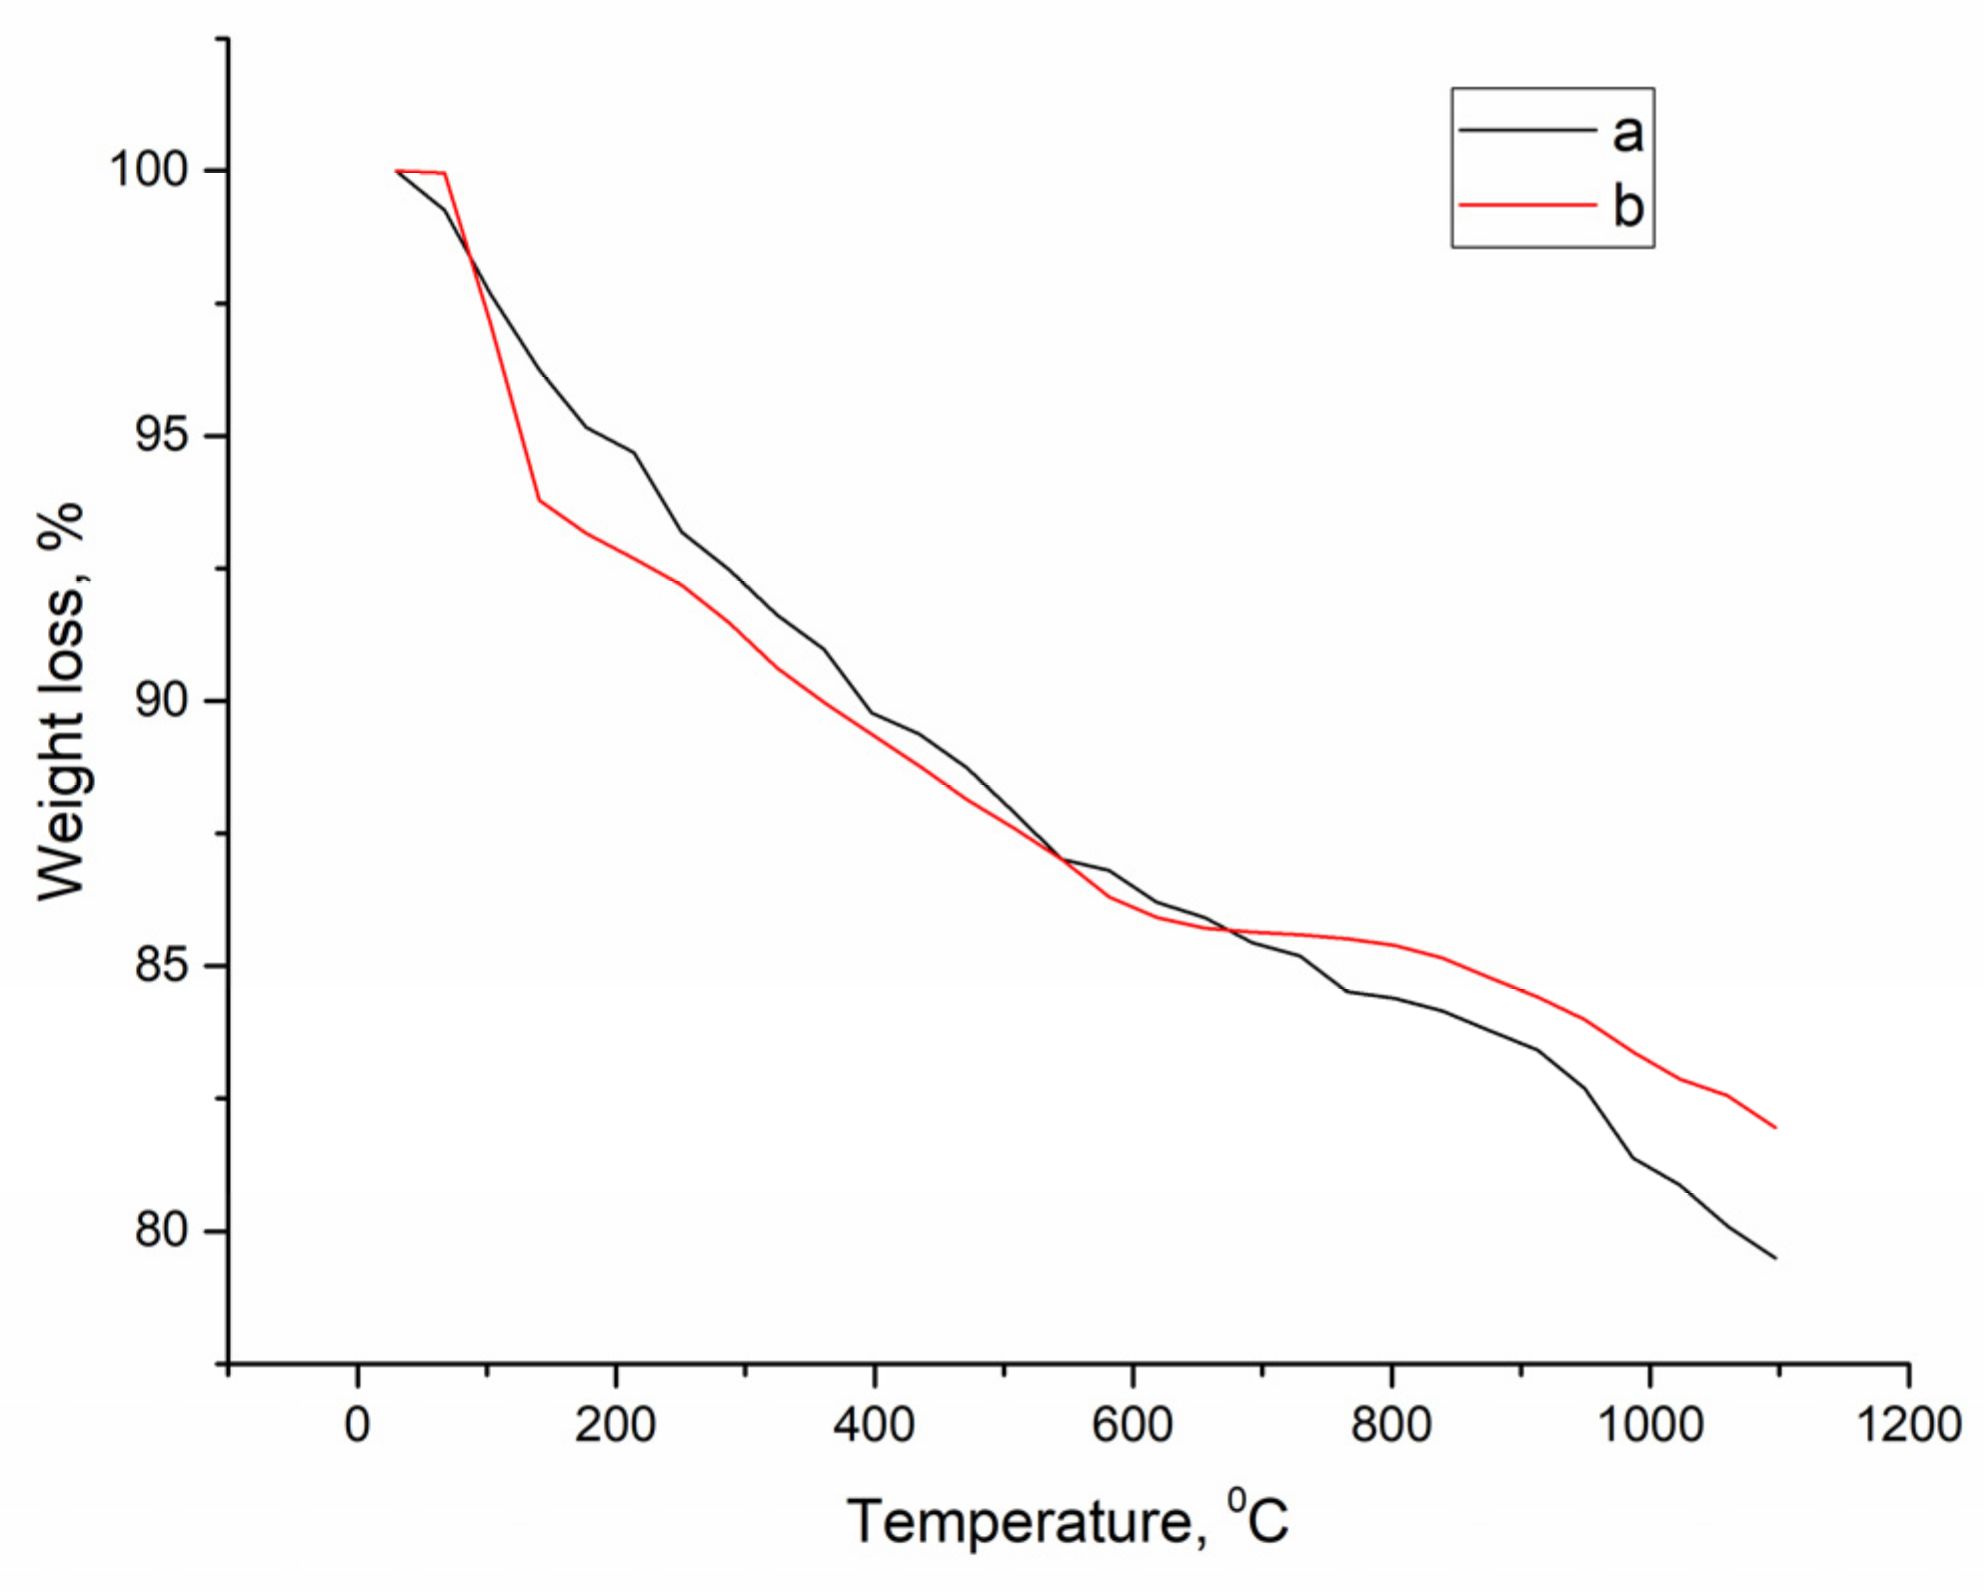
Figure 4 shows the TGA curves of the analyzed sorbents.
Both samples showed a slight mass reduction (by approximately 3%) when the material was heated to 100 °C, which is explained by the loss of water. An increase of temperature up to 500 °C resulted in 13% of weight loss. At a temperature of 1100 °C, the percentage of weight loss was approximately 20% for both sorbents. In the SBA-15 sorbent, shallow endothermic peaks in the region of 200–400 °C and in ETS-10 sorbent at 180 °C could be explained by the removal of the hydration H2O present on the surface and inside the pores [21]. A sharp endotherm observed at 770 °C in ETS-10 sorbent indicates the melting or phase transformation of sorbent [22]. According to Kruk and co-authors [23], the weight loss in SBA-15 can be explained, firstly, by the decomposition and desorption of the polymeric template, and secondly, by the evaporation of water. The obtained data are in agreement with previously published works [21,22,23].
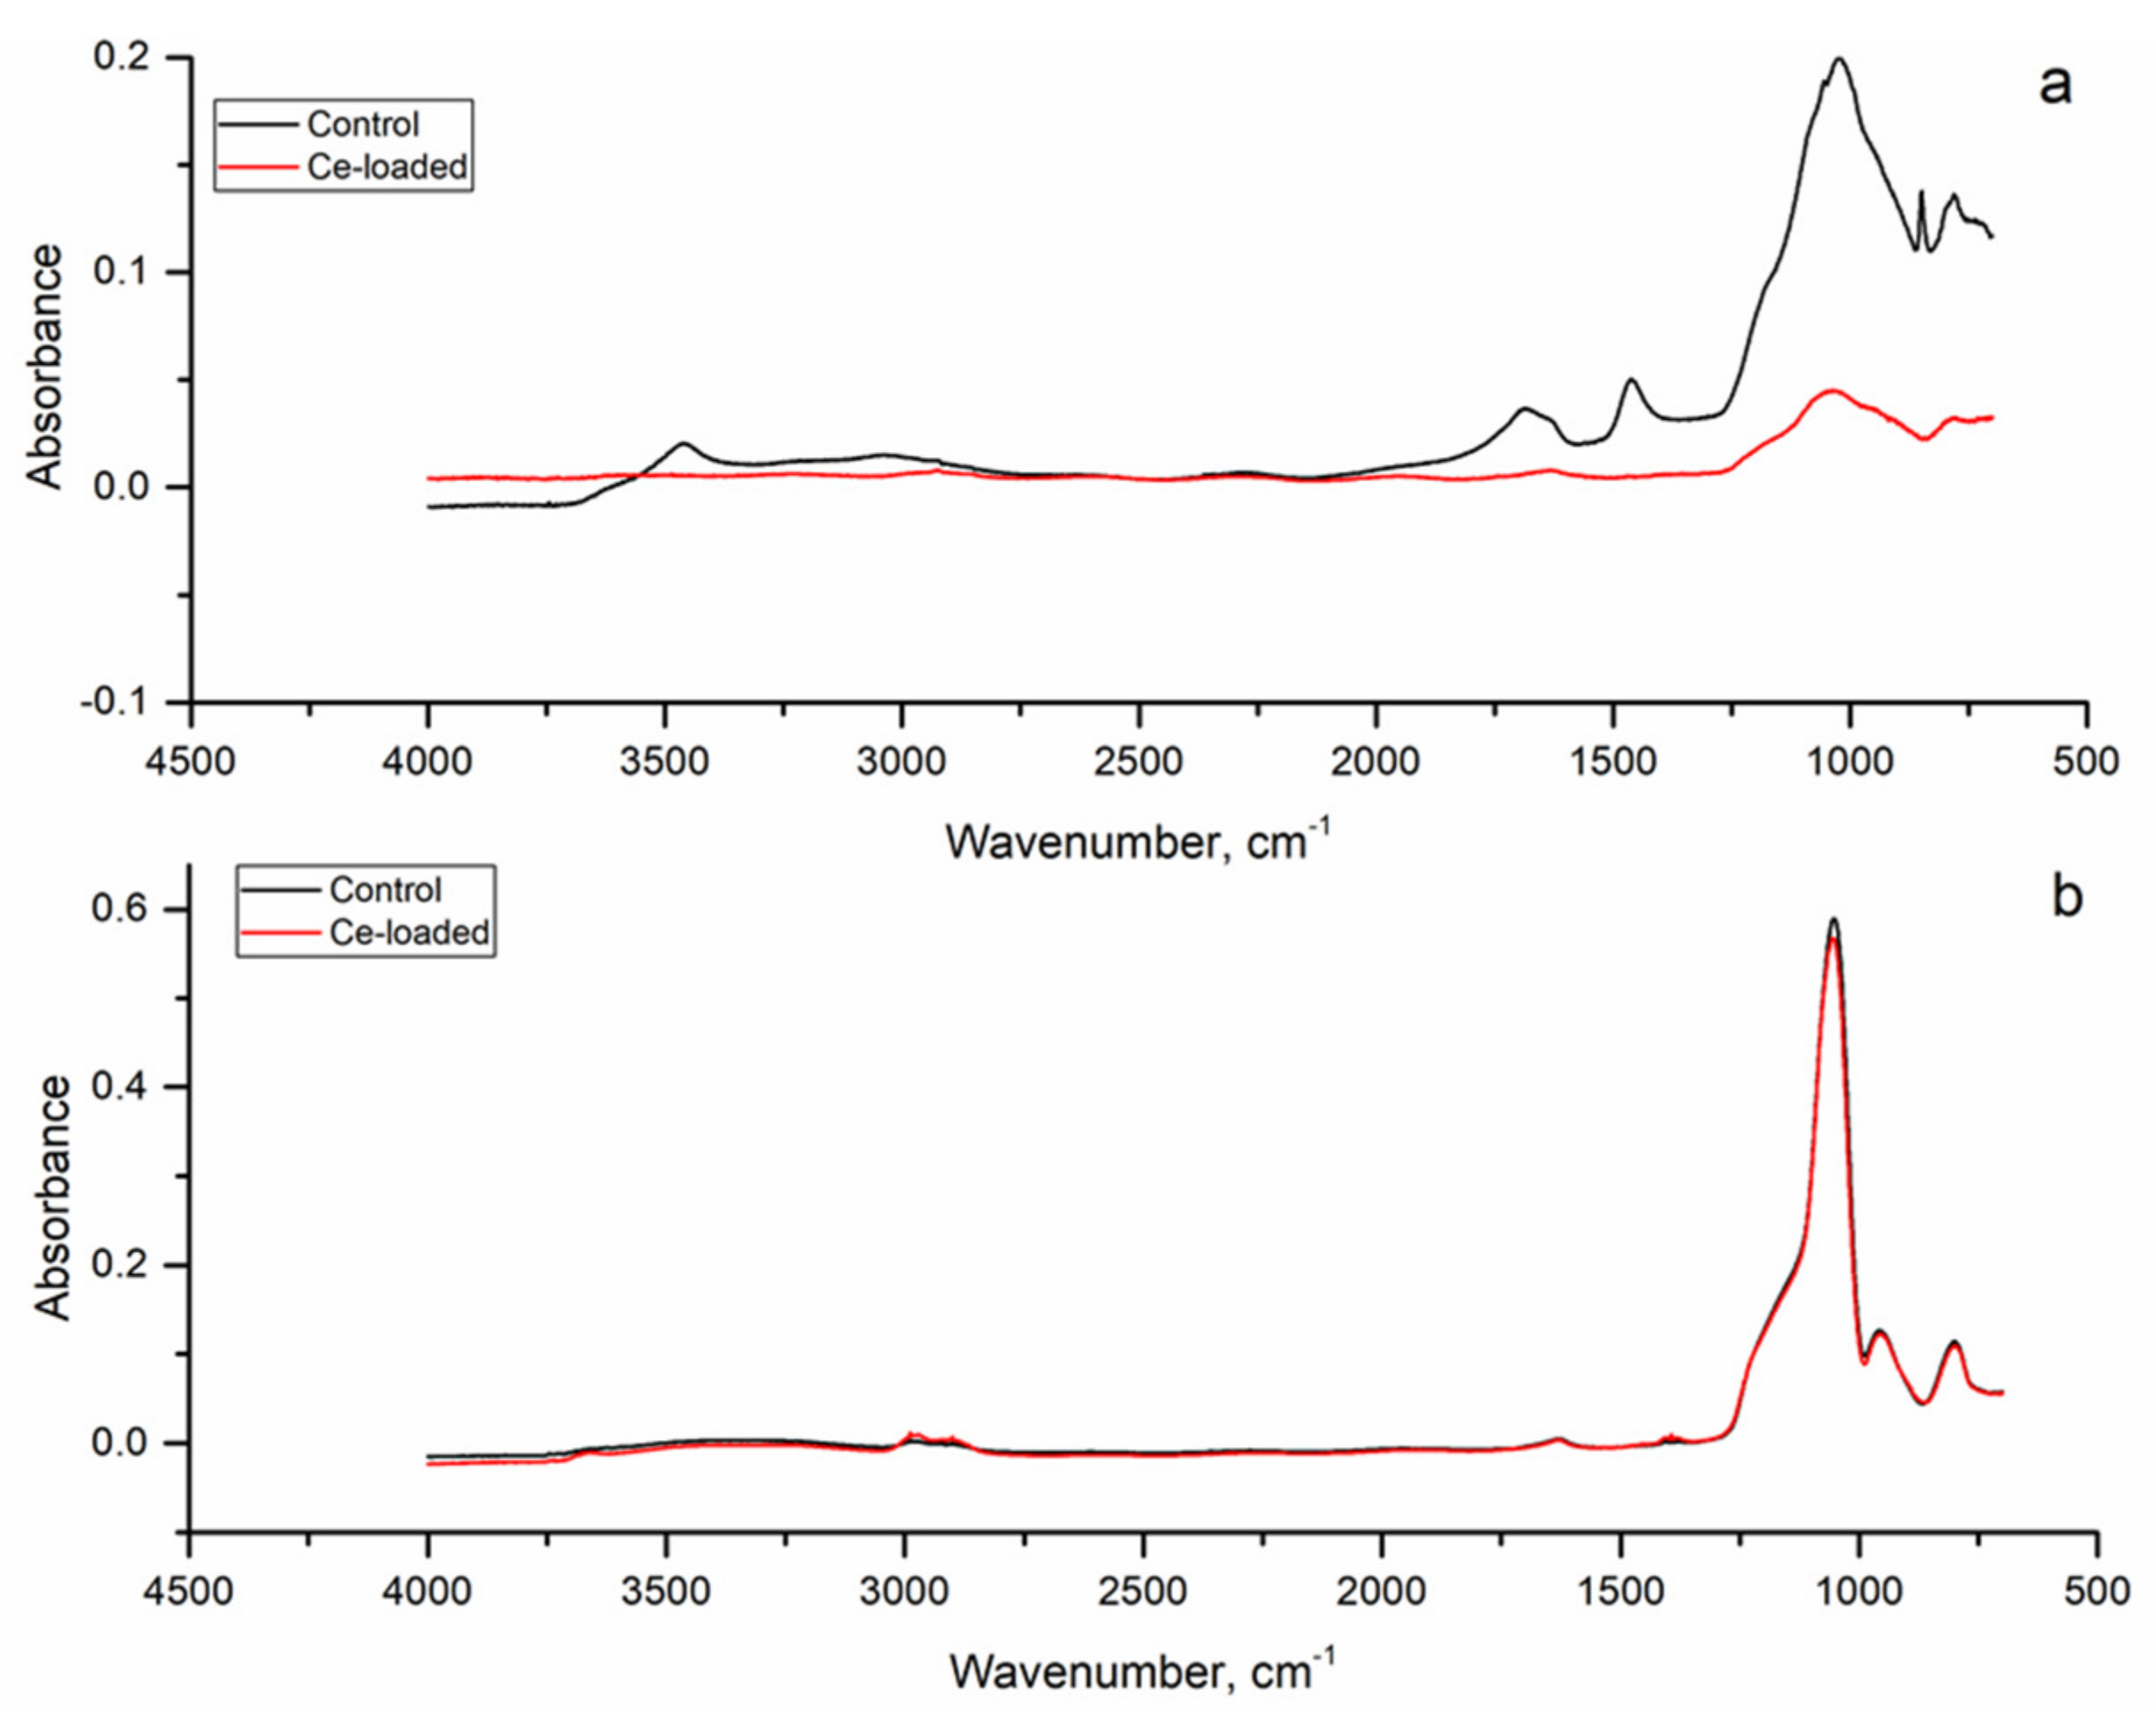
The FT-IR spectra of silica SBA-15 before and after Ce(III) adsorption are shown in Figure 5a. The FT-IR spectrum of silica SBA-15, a band at about 1000 cm−1, is attributed to the asymmetric stretching vibration of Si–O–Si in the siliceous framework. The symmetric stretching bond Si–O–Si (800 cm−1) and the bending vibration, Si–O–Si (500 cm−1) of the silica were present in the spectrum. In addition, the narrowband at 950 cm−1 corresponds to the asymmetric vibration of the Si-OH bond. The broadband at wavenumber about 3400 cm−1 could be present as a result of stretching vibration of the physically bounded water in a mesoporous matrix as silanol functional (Si–O–H). The ramp of this broad band can be attributed to –NH2 functional groups from aminopropyl groups. The modifications and polymerization of the silica were represented by the appearance of characteristic bands in the spectrum. The spectra reveal the bands of the stretching C–H vibrations at 3000–2850 cm−1 and vibrations of C–H groups at about 1470 cm−1 which are caused by the formation of the Schiff base ligands on the modified silica surface. The stretching vibration of carboxylic functional group C=O at 1720 cm−1 was observed. The adsorption deformation in the range of 1600–1500 cm−1 could be attributed to vibrations of the aromatic rings [24]. Ce(III) adsorption caused a reduction in the intensity of the functional groups associated with the silica modification. In the infrared spectrum, only the deformation bands in the area characteristic for Si–O–Si remained visible.
The influence of the Ti/Si ratio on the structure can be observed for titanosilicate ETS-10 (Figure 5b). The FTIR spectra revealed a deformation that could be caused by Ti/Si ratio in the narrowband present at a wavenumber around 3650–3500 cm−1, characteristic for OH groups. The bands related to the presence of bending vibrations of O–H groups appear around 1645 cm−1 [25]. Sharp peaks at a range from 3000 to 2850 observed in both spectra could be attributed to N–H and different C–H stretching vibrations, respectively, as remains of calcination products from the template diamine [26]. These bonds are still reflected in the spectra of the other two minor deformations. The adsorption band at wavenumber of about 1420 cm−1 is assigned to stretching vibrations of the C–O bond of carbonate. It could be caused by the creation of a small carbonate coat, due to the interaction of hydroxides/hydrates with atmospheric CO2. Adsorption band at wavenumber about 1380 cm−1 can be assigned to nitrates ions that are present in the interlayer space because of the preparation method of titanosilicate [25].
For titanosilicates, the most important bands are Si–O–Si and Si–O–Ti bonds. Absorption bands at region 1300–850 cm−1 are assigned to the asymmetric stretching vibration of Si–O–Si and Si–O–Ti bonds. Some relationship of shifting band position influenced by Ti/Si ratio was observed compared to silicate. Titanium ions affect the structure that is visible due to the widening of absorption bands at the wavenumber range of 1300–850 cm−1. These changes could be explained by the partial substitution of Si–O–Si bonds by Si–O–Ti bonds. Bands at wavenumbers 943 cm−1 and 880 cm−1 may be assigned to Si–O− respectively Ti–O− terminal bonds forming. Si–O stretching modes were observed on the surface as an intensive broad band at wavenumber 1064 cm−1 that refers to the asymmetric modes, and a small band at 800 cm−1 is associated with the symmetric stretching modes of Si–O bonds [25,26,27].
Comparison of the spectra before and after loading of titanosilicate with Ce(III) did not bring visible changes in the surface structures. However, changes in the intensities of the deformation peaks and the name shifts in the area of the reference peaks after adsorption/ion exchange processes can be seen.
3.2. Adsorption Experiment
3.2.1. Solution Acidity
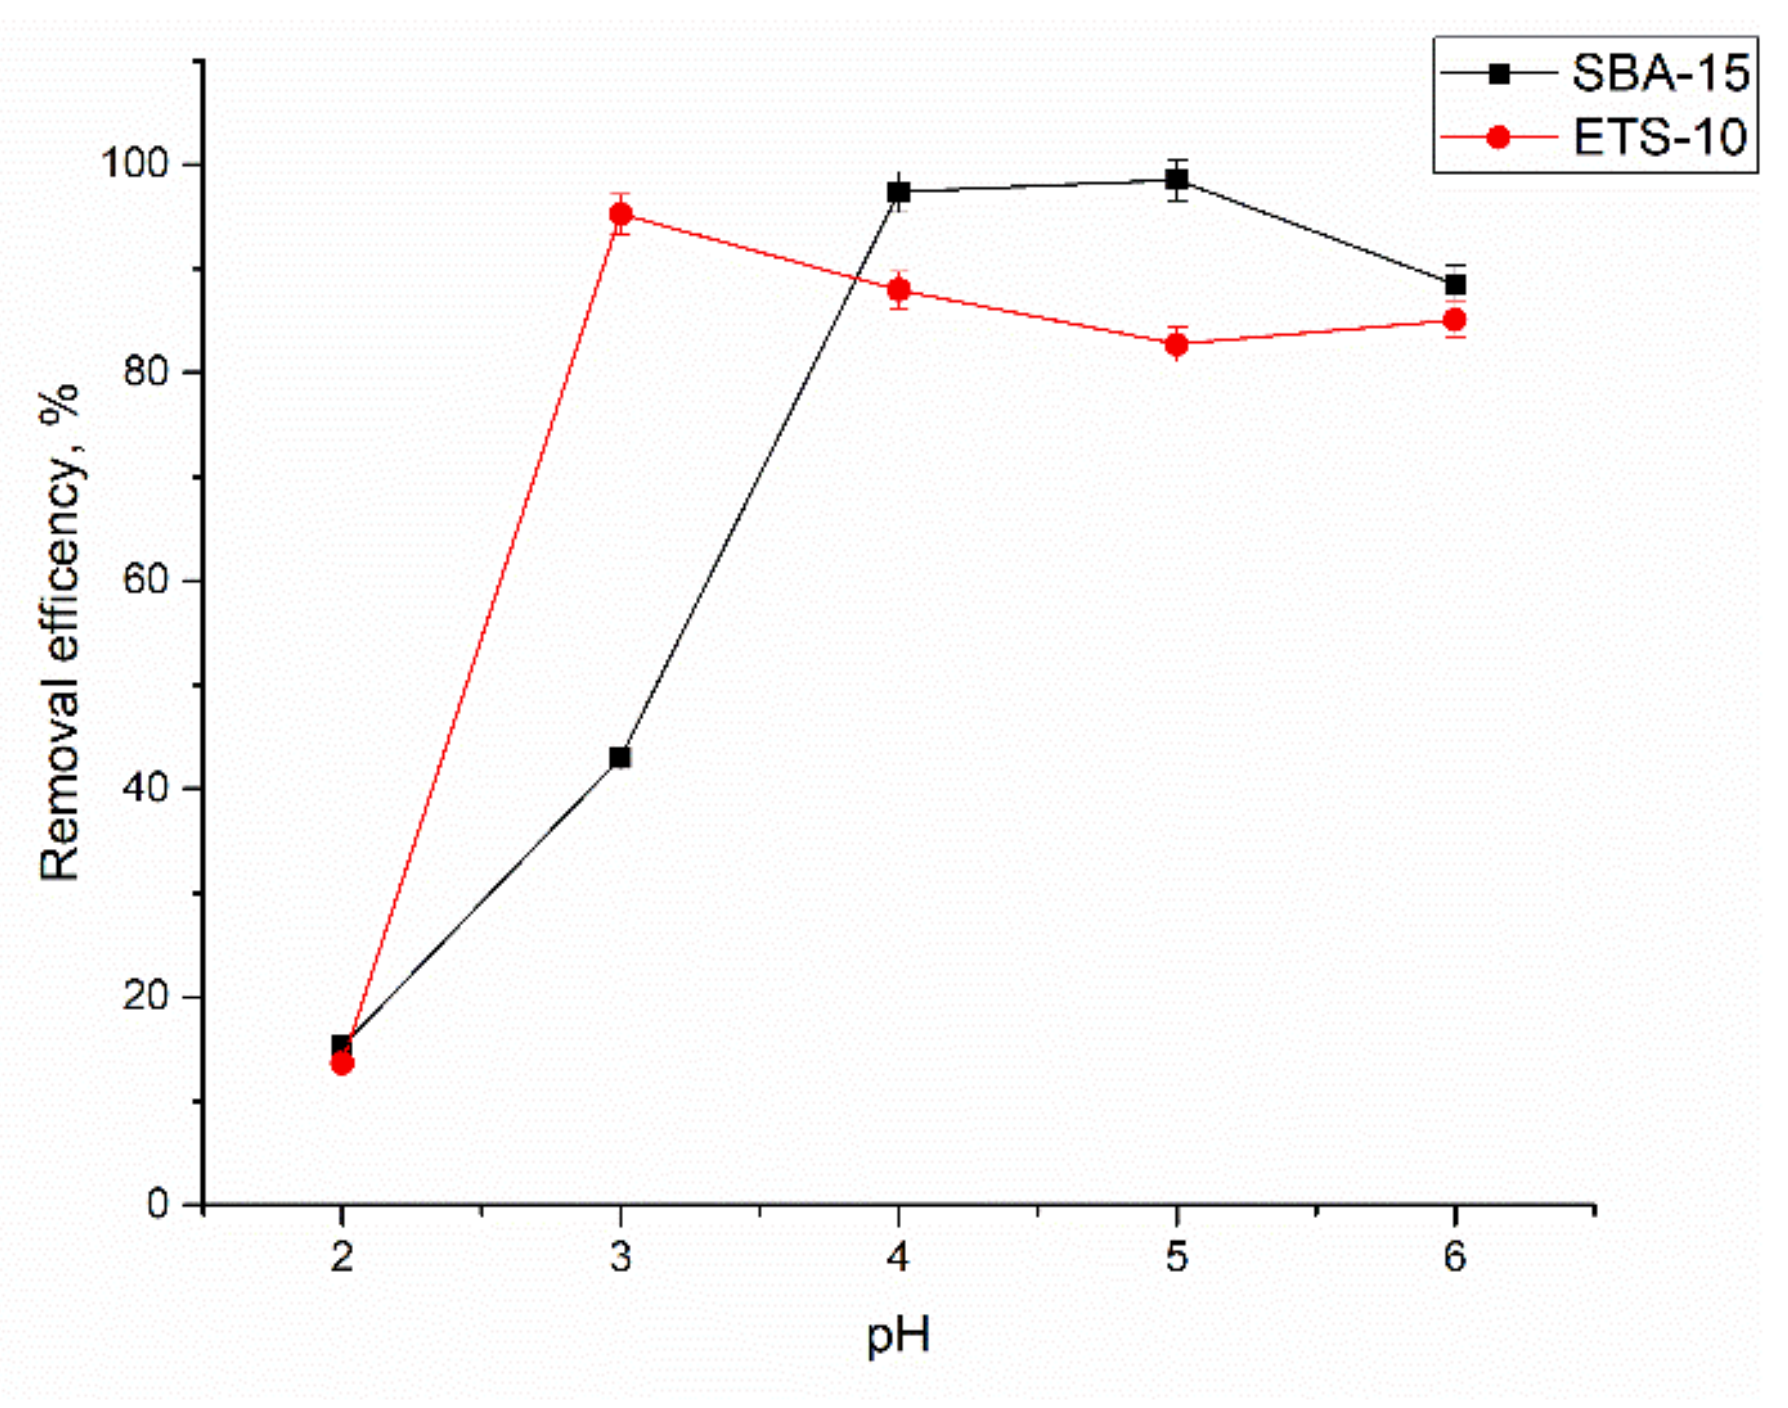
The pH is one of the critical parameters which need to be controlled in the adsorption experiments since it affects the speciation of the metal ion present in the aqueous solution and surface charge of the adsorbent [2]. The pH of the solutions ranged from 2.0 to 6.0 (Figure 6). The effect of higher pH values was not studied, since at pH > 6.0, Ce(III) precipitation takes place with the formation of the insoluble hydroxide [28]. For both sorbents, the lowest efficiency of removal was attained at pH 2.0: 15.2% for silica SBA-15 and 13.6% for titanosilicate ETS-10. Low Ce(III) sorption at pH 2.0 can be explained by a high concentration of H+ ions and their predominant adsorption [5]. As it was shown in [29], at pH 2.0, protons can also participate in exchange with the alkali metal ions, reducing the adsorption capacity of ETS-10 toward Ce(III).
Adsorption of Ce(III) by titanosilicate ETS-10 sorbents was more favorable at acidic pH values, maximum adsorption was attained at pH 3.0 (95%), and then it slightly decreased with the increase of pH, but by no more than by 10%. For the silica SBA-15 sorbent, the optimum pH range for Ce(III) sorption was 4.0–5.0 when 97–98% of ions were removed from the solution. High Ce(III) sorption at pH 3.0–6.0 is explained by its presence in the solution in the form of Ce3+, Ce(OH)22+ and Ce(OH)3+ [2,30]. Maximum efficiency of Ce(III) removal by SBA-15-BSEA-Fe3O4-NPs at pH 5.0 was shown by Dashtian and Zare-Dorabei [31]. The authors suggested that, at pH 5.0, deprotonating of surface groups leads to increase in their mass transfer, and consequently in the increase of metal removal.
For sorbents with different matrices, maximum removal of Ce(III) was attained ad different pH values. Thus, the maximum removal of Ce(III) by HKUST-1 was reached at pH = 6.0 [32]. The highest biosorption efficiency of leaf powder of Pinus brutia for Ce(III) was obtained at pH 5.0 [33], and for optical conjugate adsorbent at pH 3.5 [28]. Further experiments were performed at optimal pH values for each sorbent.
3.2.2. Initial Cerium Concentration and Equilibrium Studies
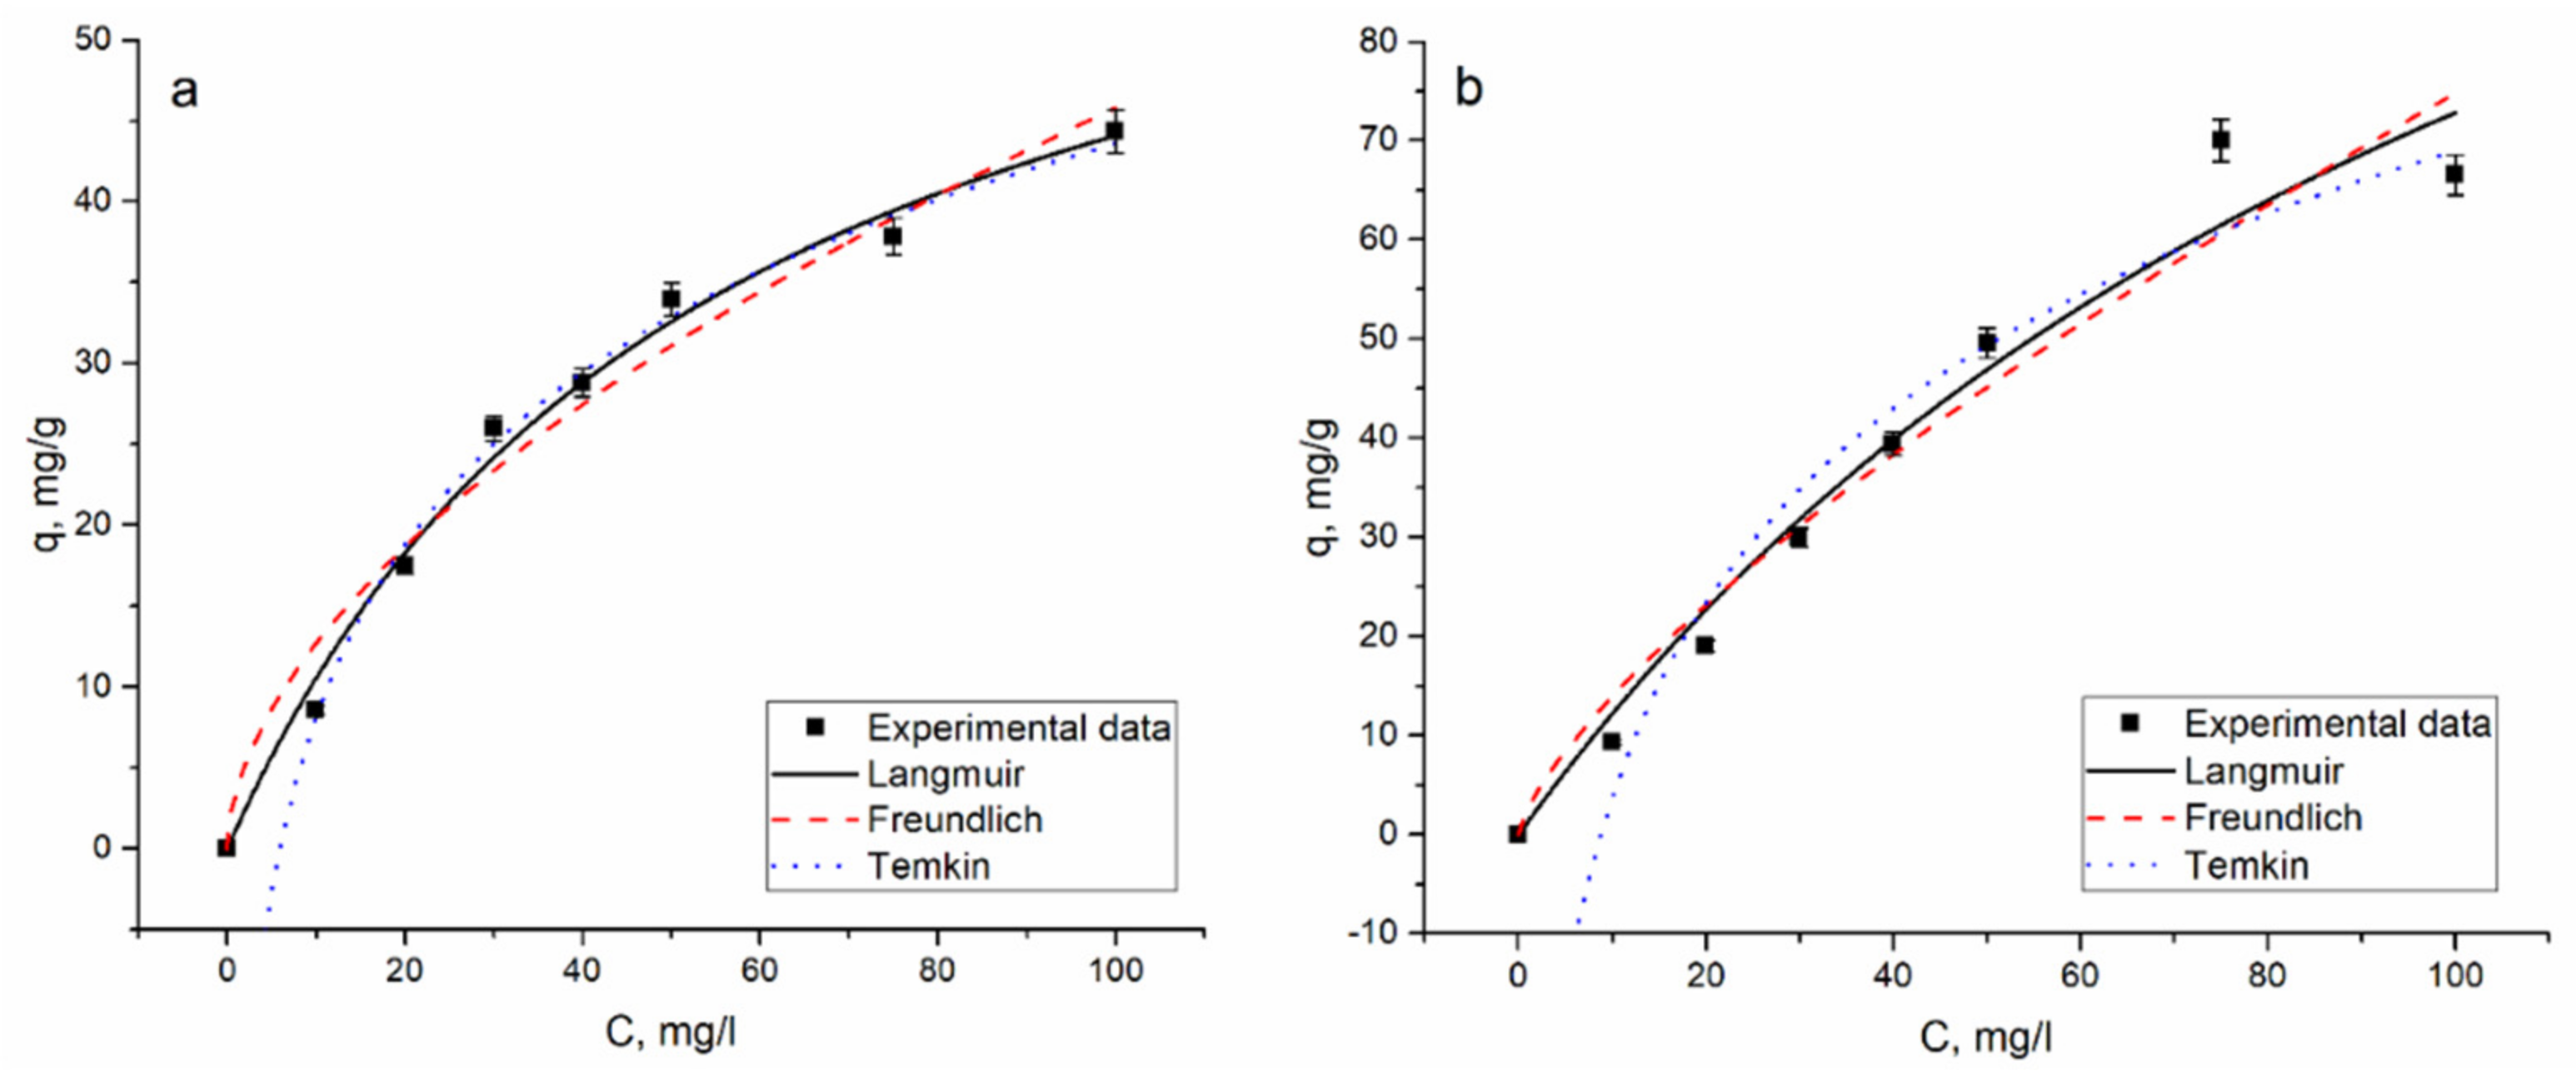
The initial Ce(III) concentration can significantly affect the adsorption capacity of analyzed sorbents. The effect of initial concentrations of Ce(III) was studied by varying its concentration in solution from 10 to 100 mg/L at optimum pH value for each adsorbent. Typically, the adsorption capacity increases with increasing the initial cerium concentration in the solution [2]. This fact was proved in the present study as well. An increase of Ce(III) concentration in solution resulted in the increase of silica SBA-15 adsorption capacity from 8.6 to 44.3 mg/g and of titanosilicate ETS-10 from 9.3 to 66.5 mg/g (Figure 7). The adsorption capacity of HKUST-1 has reached 353 mg/g when the Ce(III) initial concentration was 1000 mg/L [31]. The decrease of the Ce(III) removal efficiency with the rise of its concentration in solution for both sorbents was observed: from 91 to 44% for silica SBA-15 and from 98 to 66% for titanosilicate ETS-10. The decline of the removal efficiency is associated with the saturation of the adsorption sites [2].
Data obtained experimentally were fitted with Langmuir, Freundlich, and Temkin isotherm models (3–5). Langmuir isotherm provides information about the monolayer formation on the homogeneous surface [34]. Freundlich model is applied to describe adsorption on heterogeneous surfaces (multilayer adsorption) [35].
where Ce metal concentration at equilibrium (mg/L), qm is maximum adsorption capacity (mg/g), b (L/mg), KF, n, and aT are Langmuir, Freundlich, and Temkin equation constants, 1/bT shows the sorption potential of the sorbent, R is the universal gas constant (8.314 J K−1 mol−1), and T is the temperature (K) [36,37].
Separation factor RL was calculated by Equation (6).
An RL values less than unit adsorption is favorable and adsorption and RL values higher than unit adsorption is unfavorable [5].
The description of experimental data is presented in Figure 7 and calculated parameters are listed in Table 1.
Comparing three isotherm models described above, Langmuir isotherm were shown to be more suitable to describe Ce(III) adsorption on both sorbents, suggesting that Ce(III) is adsorbed in the form of a monolayer coverage on the surface of the sorbents [5]. The correlation coefficients obtained for the Freundlich model were lower than for the Langmuir one for both sorbents. The Temkin model, which implies that the adsorption heat of all molecules existing in the layer as a function of temperature decreases due to the surface coverage increase [38], fitted well the data obtained for both sorbents. The high coefficient of correlation values obtained for several models indicates the possibility of heterogeneous binding sites and multilayer adsorption [39].
The theoretical maximum adsorption capacity, qm, predicted by the Langmuir isotherm followed the trend: ETS10 > SBA-15 (Table 1). It is worth mentioning that the maximum value of adsorption capacity obtained experimentally for ETS10 (70 mg/g) was almost 1.5 times higher than the value obtained for silica SBA-15 (44 mg/kg). The higher adsorption capacity of ETS-10 is also supported by the greater Langmuir adsorption constant (b), which indicates the affinity of ETS-10 toward the Ce(III). High Ce(III) adsorption onto ETS-10 is also explained by its large ionic radius. According to Lv et al. [29], the larger the ionic radius is, the greater its affinity of ETS-10 to chemical elements is. The RL values obtained for both sorbents were less than 1.0, indicating that the adsorption of Ce(III) was highly favorable.
The adsorption capacity of SBA-15 silica was significantly higher than that of mesoporous silica with trithiane used for mercury removal [13] and of N-Propylsalicylaldimino-functionalized SBA-15 mesoporous silica used for Cu2+, Zn2+, Ni2+, and Co2+ [12]. Biosorption of Ce3+ ion onto Spirulina biomass was described by Freundlich and Langmuir models [3].
Table 2 presents the comparison of the sorption capacity of silica SBA-15 and titanosilicate ETS-10 sorbents for Ce(III) with data reported by other authors. The adsorption capacity of the analyzed sorbents was comparable with synthetically produced sorbents and higher than that of biological sorbents.
3.2.3. Contact Time and Kinetic Studies
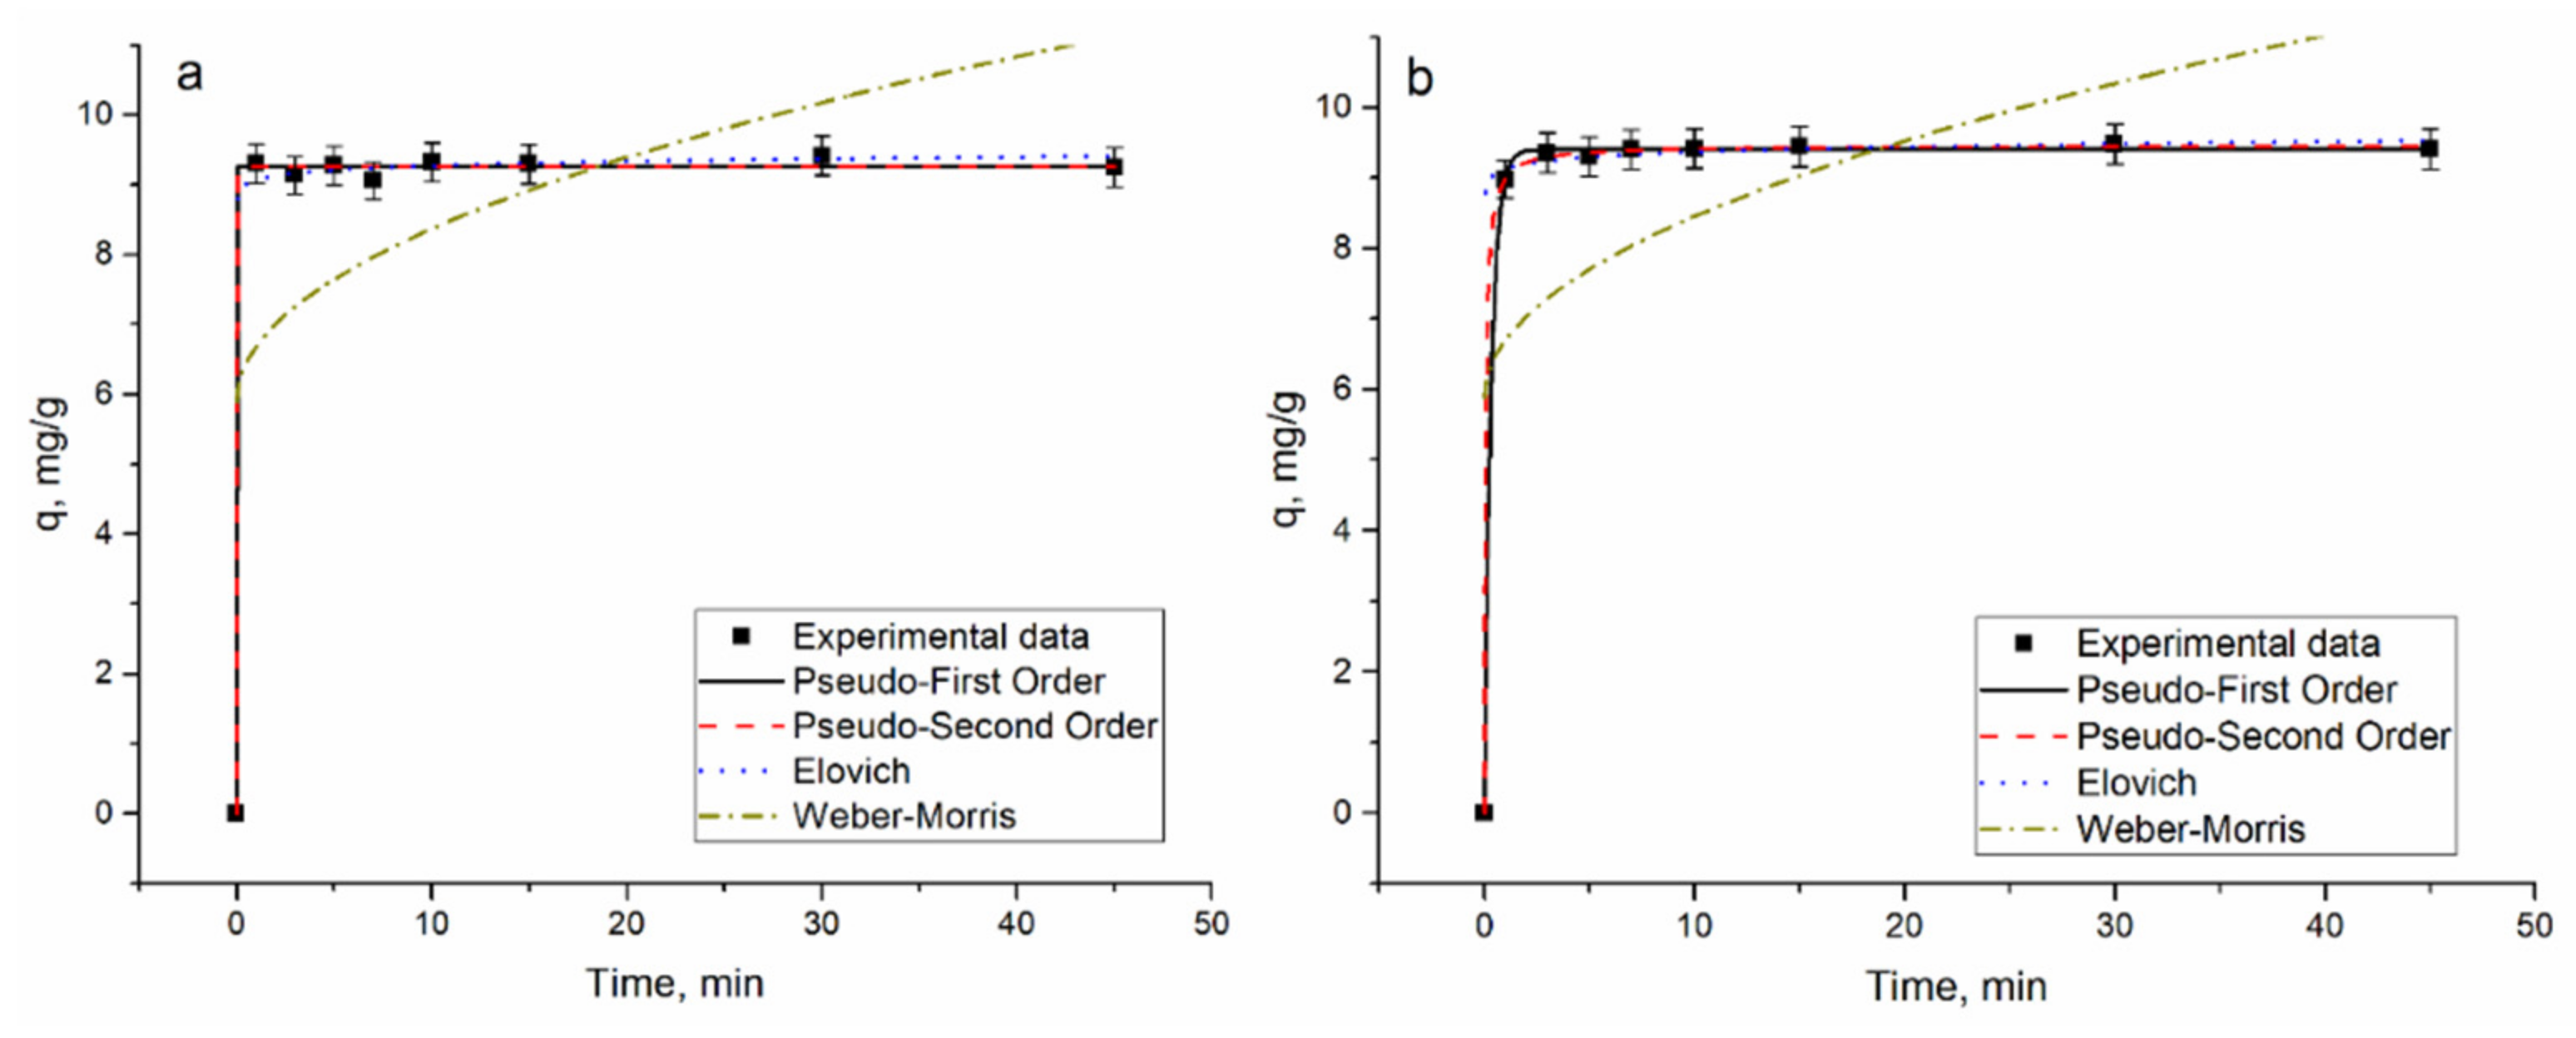
Contact time plays a critical role in the adsorption process. Metal biosorption by different sorbents can be described as a two-step process, in which the first quick stage gives way to the slow stage and equilibrium achievement. A high rate of metal ions sorption in the first stage is possible due to the availability of a large number of binding sites [2]. Removal of Ce(III) from solutions was a very quick process, in one minute of sorbent interaction with solution, 97.4% of Ce(III) were removed by silica SBA-15 sorbent and 93.9% by titanosilicate ETS-10 sorbent. During 7 min, the equilibrium for both sorbents was established (Figure 7). The equilibrium in analyzed sorbents–sorbate systems was achieved significantly faster than for other sorbents used for Ce(III) removal. Thus, Ce(III) sorption on grapefruit peel reached equilibrium in 60 min [5], on modified sawdust in 120 min [40], and leaf powder of Pinus brutia in 15 min [32]. At the same time, the adsorption rate of Pb2+ on microporous titanosilicate ETS-10 0 was extremely rapid: less than 5 s was required to attain maximum adsorption capacity [6].
In order to examine the controlling mechanism of the adsorption process, four kinetic models were applied.
The pseudo-first-order model (PFO):
The pseudo-second-order model (PSO):
The Elovich model (EM):
The Weber and Morris intraparticle diffusion model (IPM):
where qe and qt are Ce(III) content adsorbed at equilibrium, (mg/g), and k1 (1/min) and k2 (g/mg·min) are the pseudo-first-order and the second-order models constants, α (g/mg∙min) and β (g/mg) are Elovich model constants, kdiff is a rate parameter (mg/g·min1/2), and Cint is the intercept [33,34].
The kinetic model constants, along with the correlation coefficient are given in Table 3, while the graphical representation of models is presented in Figure 8.
According to coefficients of correlation values, the sorption of Ce(III) on silica SBA-15 and titanosilicate ETS-10 sorbents is well described by PFO and PSO models. For both models, theoretically calculated and experimentally obtained values of adsorption capacity were in good agreement. The pseudo-second-order model suggests that the main mechanism of adsorption is chemisorptions [43]. Applicability of the PFO model shows that the rate-determining step of the process is the diffusion of Ce(III) through the boundary layer at the adsorbent layer at the sorbent surface [1].
The coefficient of correlation obtained for the EM and IPM model was significantly lower, indicating their inconsistency for the description of experimentally obtained values.
In general, the adsorption of metal ions onto mesoporous adsorbents includes two steps: (a) movement of the ions bulk solution to the boundary layer surrounding the mesoporous matrice and (b) adsorption based on the trapping of metal ions to the active sites of the adsorbent [36]. The removal of Ce(III) by SBA-15 is possible due to the trapping of Ce(III) ions to the –O–H, –C–H, –C=O, and –NH2 groups and diffusion of metal ions into the pore framework [44]. Dashtian and Zare-Dorabei [31] explained high removal of Ce(III) by SBA-15-BSEA-Fe3O4-NPs composite by the presence of functional groups such as nitrogen atoms, imine, and hydroxyl.
One of the main mechanisms of metal removal by ETS-10 can be considered ion-exchange since Na and K are the main exchangeable cations in the ETS-10 [10]. The presence of Na and K in ETS-10 was confirmed by EDX.
The pseudo-second-order model was suitable to describe the Ce(III) biosorption by both endemic and commercial spirulina biomass [3] and leaf powder of Pinus brutia [32]. The process of Ce(III) sorption on the brown marine alga Turbinaria conoides was described well by a pseudo-first-order model [1].
3.2.4. Temperature and Thermodynamic Study
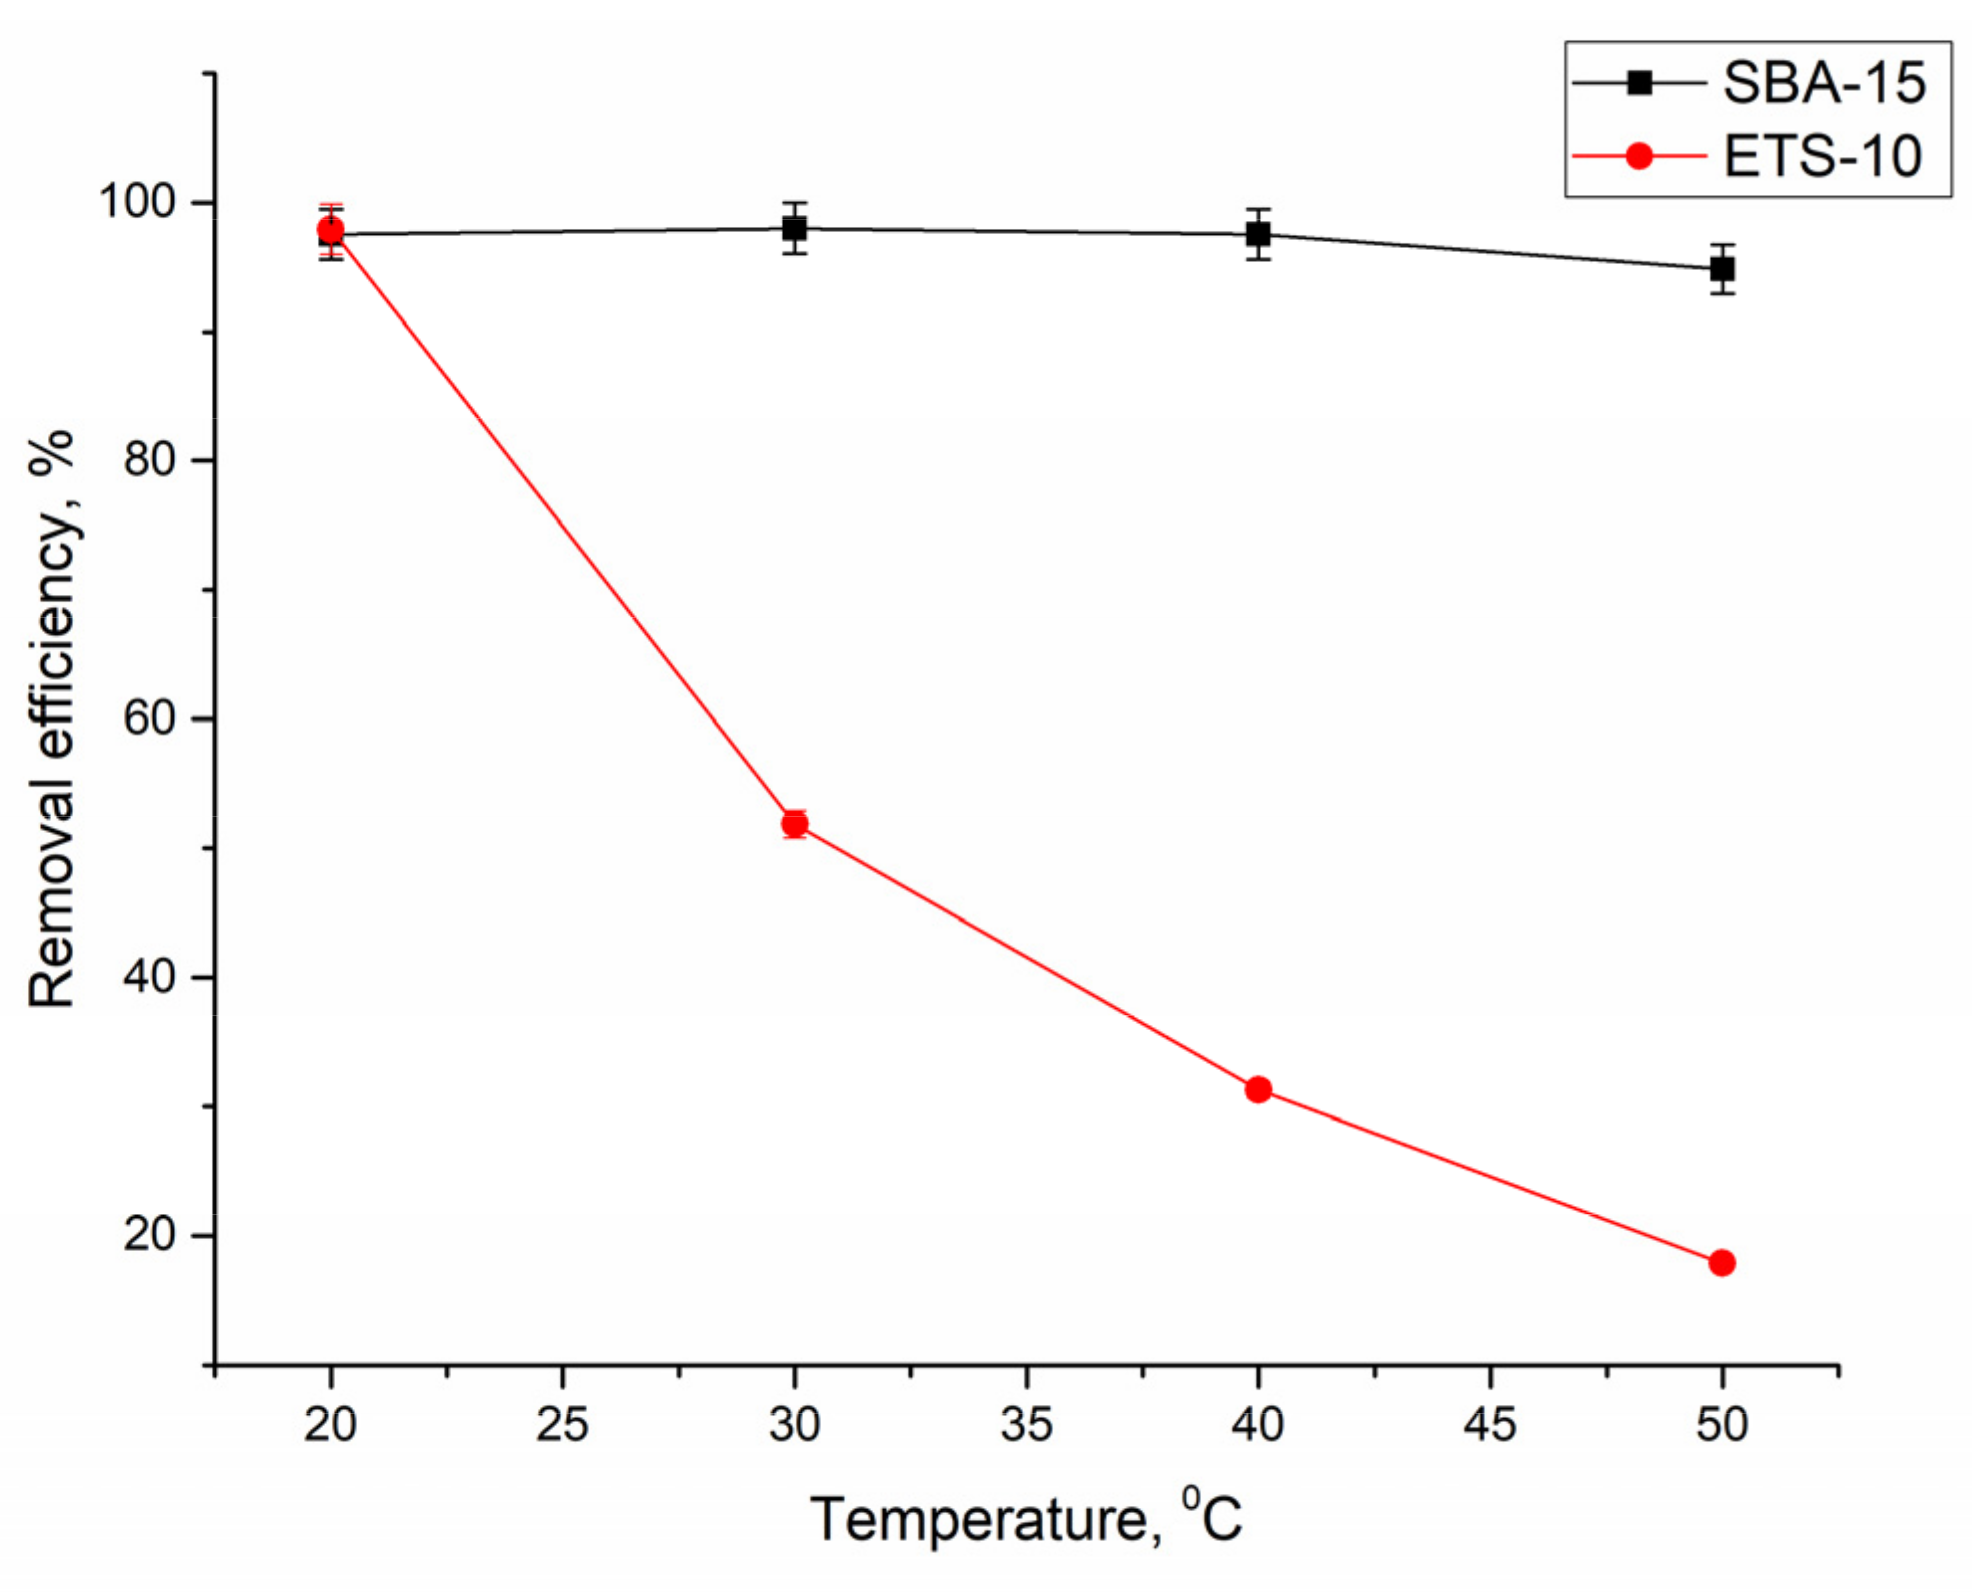
Temperature influences Ce(III) adsorption, because it is directly attributable to the kinetics of the sorption [38]. The temperature growth growth did not influence the removal of Ce(III) by silica SBA-15 sorbent; the removal efficiency was on the level of 95–98% at the studied temperature range. The picture was completely different in the case of titanosilicate ETS-10 sorbent; the rise of temperature up to 50 °C led to a decrease of sorbent removal efficiency from 98 to 18% (Figure 9). Since the adsorption capacity decreases with increasing temperature, the process of Ce(III) removal is exothermic.
The thermodynamic parameters ΔG°, ΔH°, and ΔS° were computed from Equations (11) and (12):
The distribution coefficient Kd is was calculated by the Equation (13):
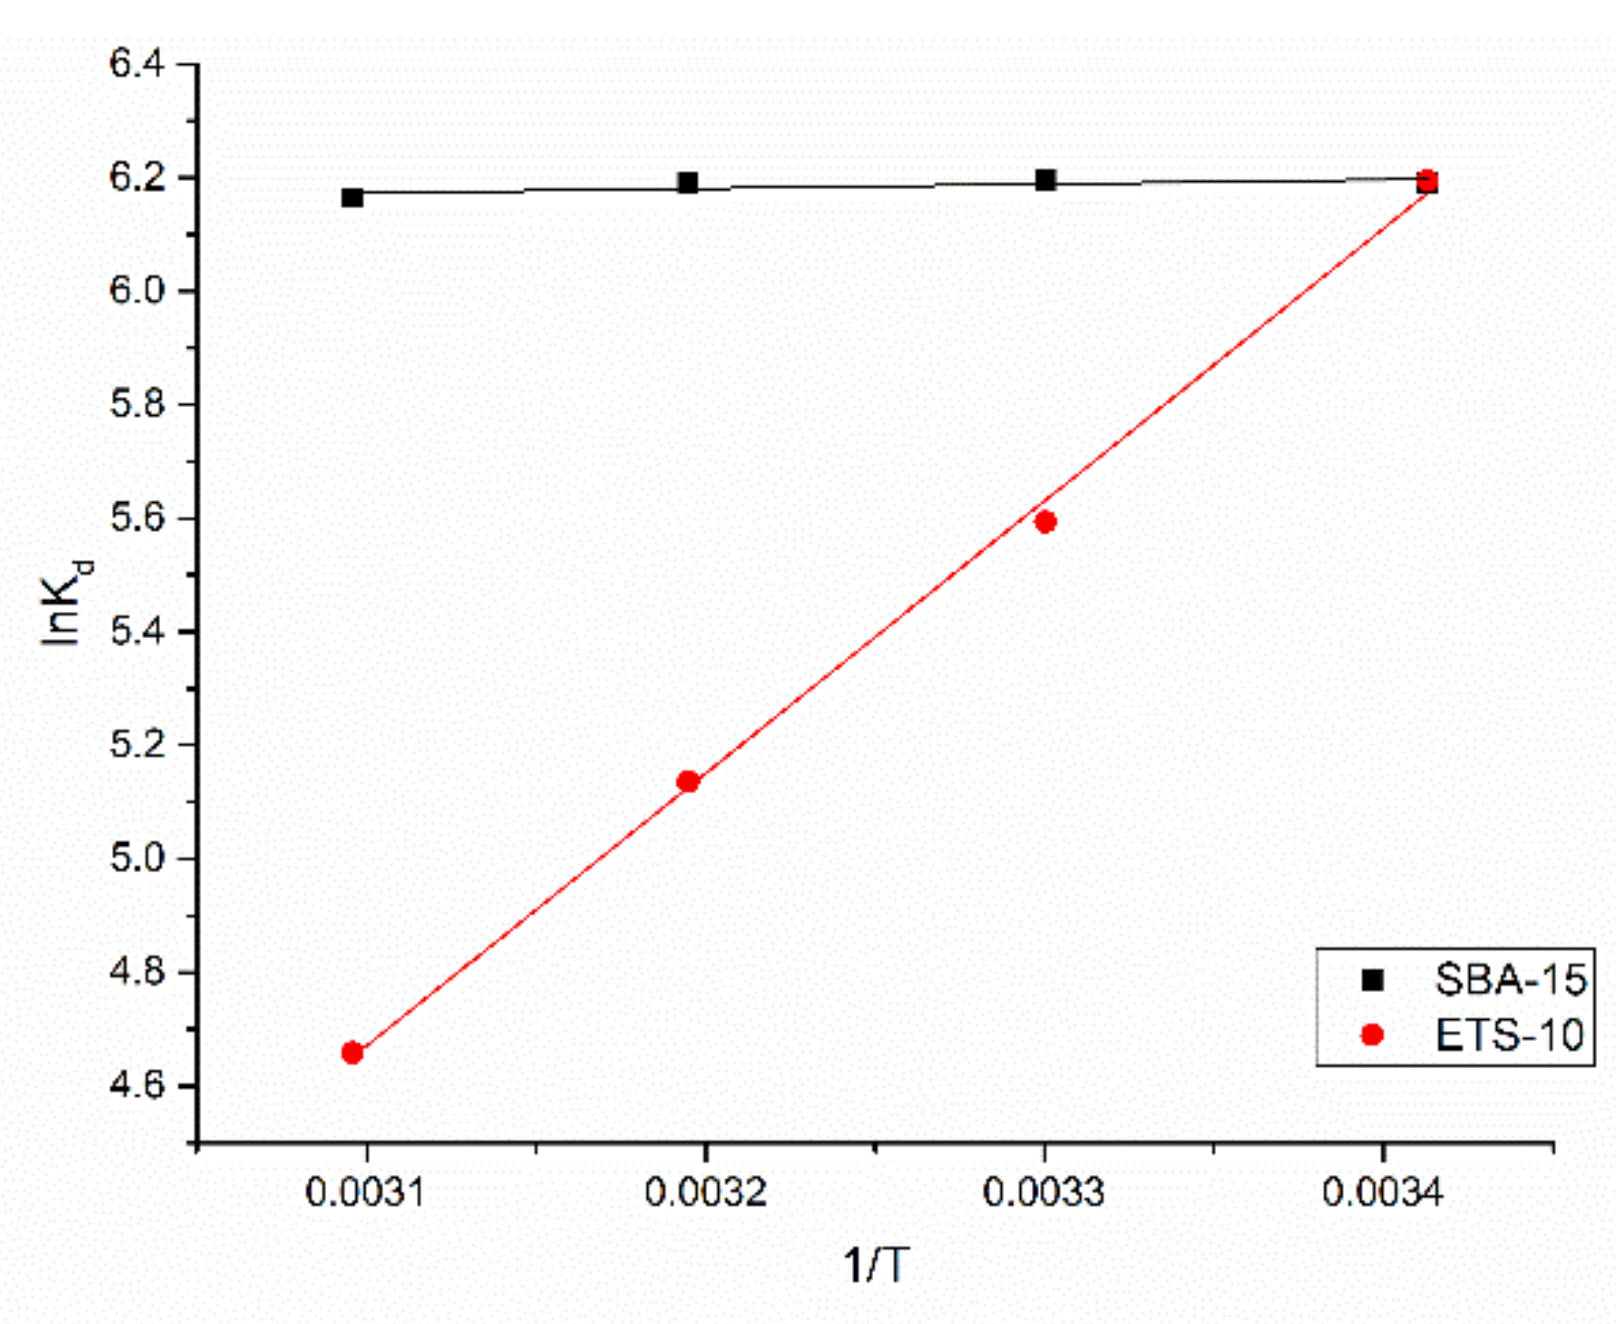
The enthalpy and entropy values given in Table 4 were obtained from the lnKd versus 1/T plot (Figure A2). The negative ΔG° values point at the spontaneous nature of the adsorption process. The exothermic nature of the process for both sorbents was confirmed by the negative ΔH° values. The positive ΔS° values obtained for silica SBA-15 sorbent point at the affinity of the sorbent for Ce(III) and an increase in randomness at the solid/liquid interface during the sorption process [45]. For titanosilicate ETS-10 sorbent, the negative ΔS° value was obtained pointing at the decrease of the randomness of the system during adsorption [46]. Since ΔH° values were less than 40 kJ/mol, Ce(III) sorption may be regarded as physical adsorption [47].
3.3. Sorbents Regeneration
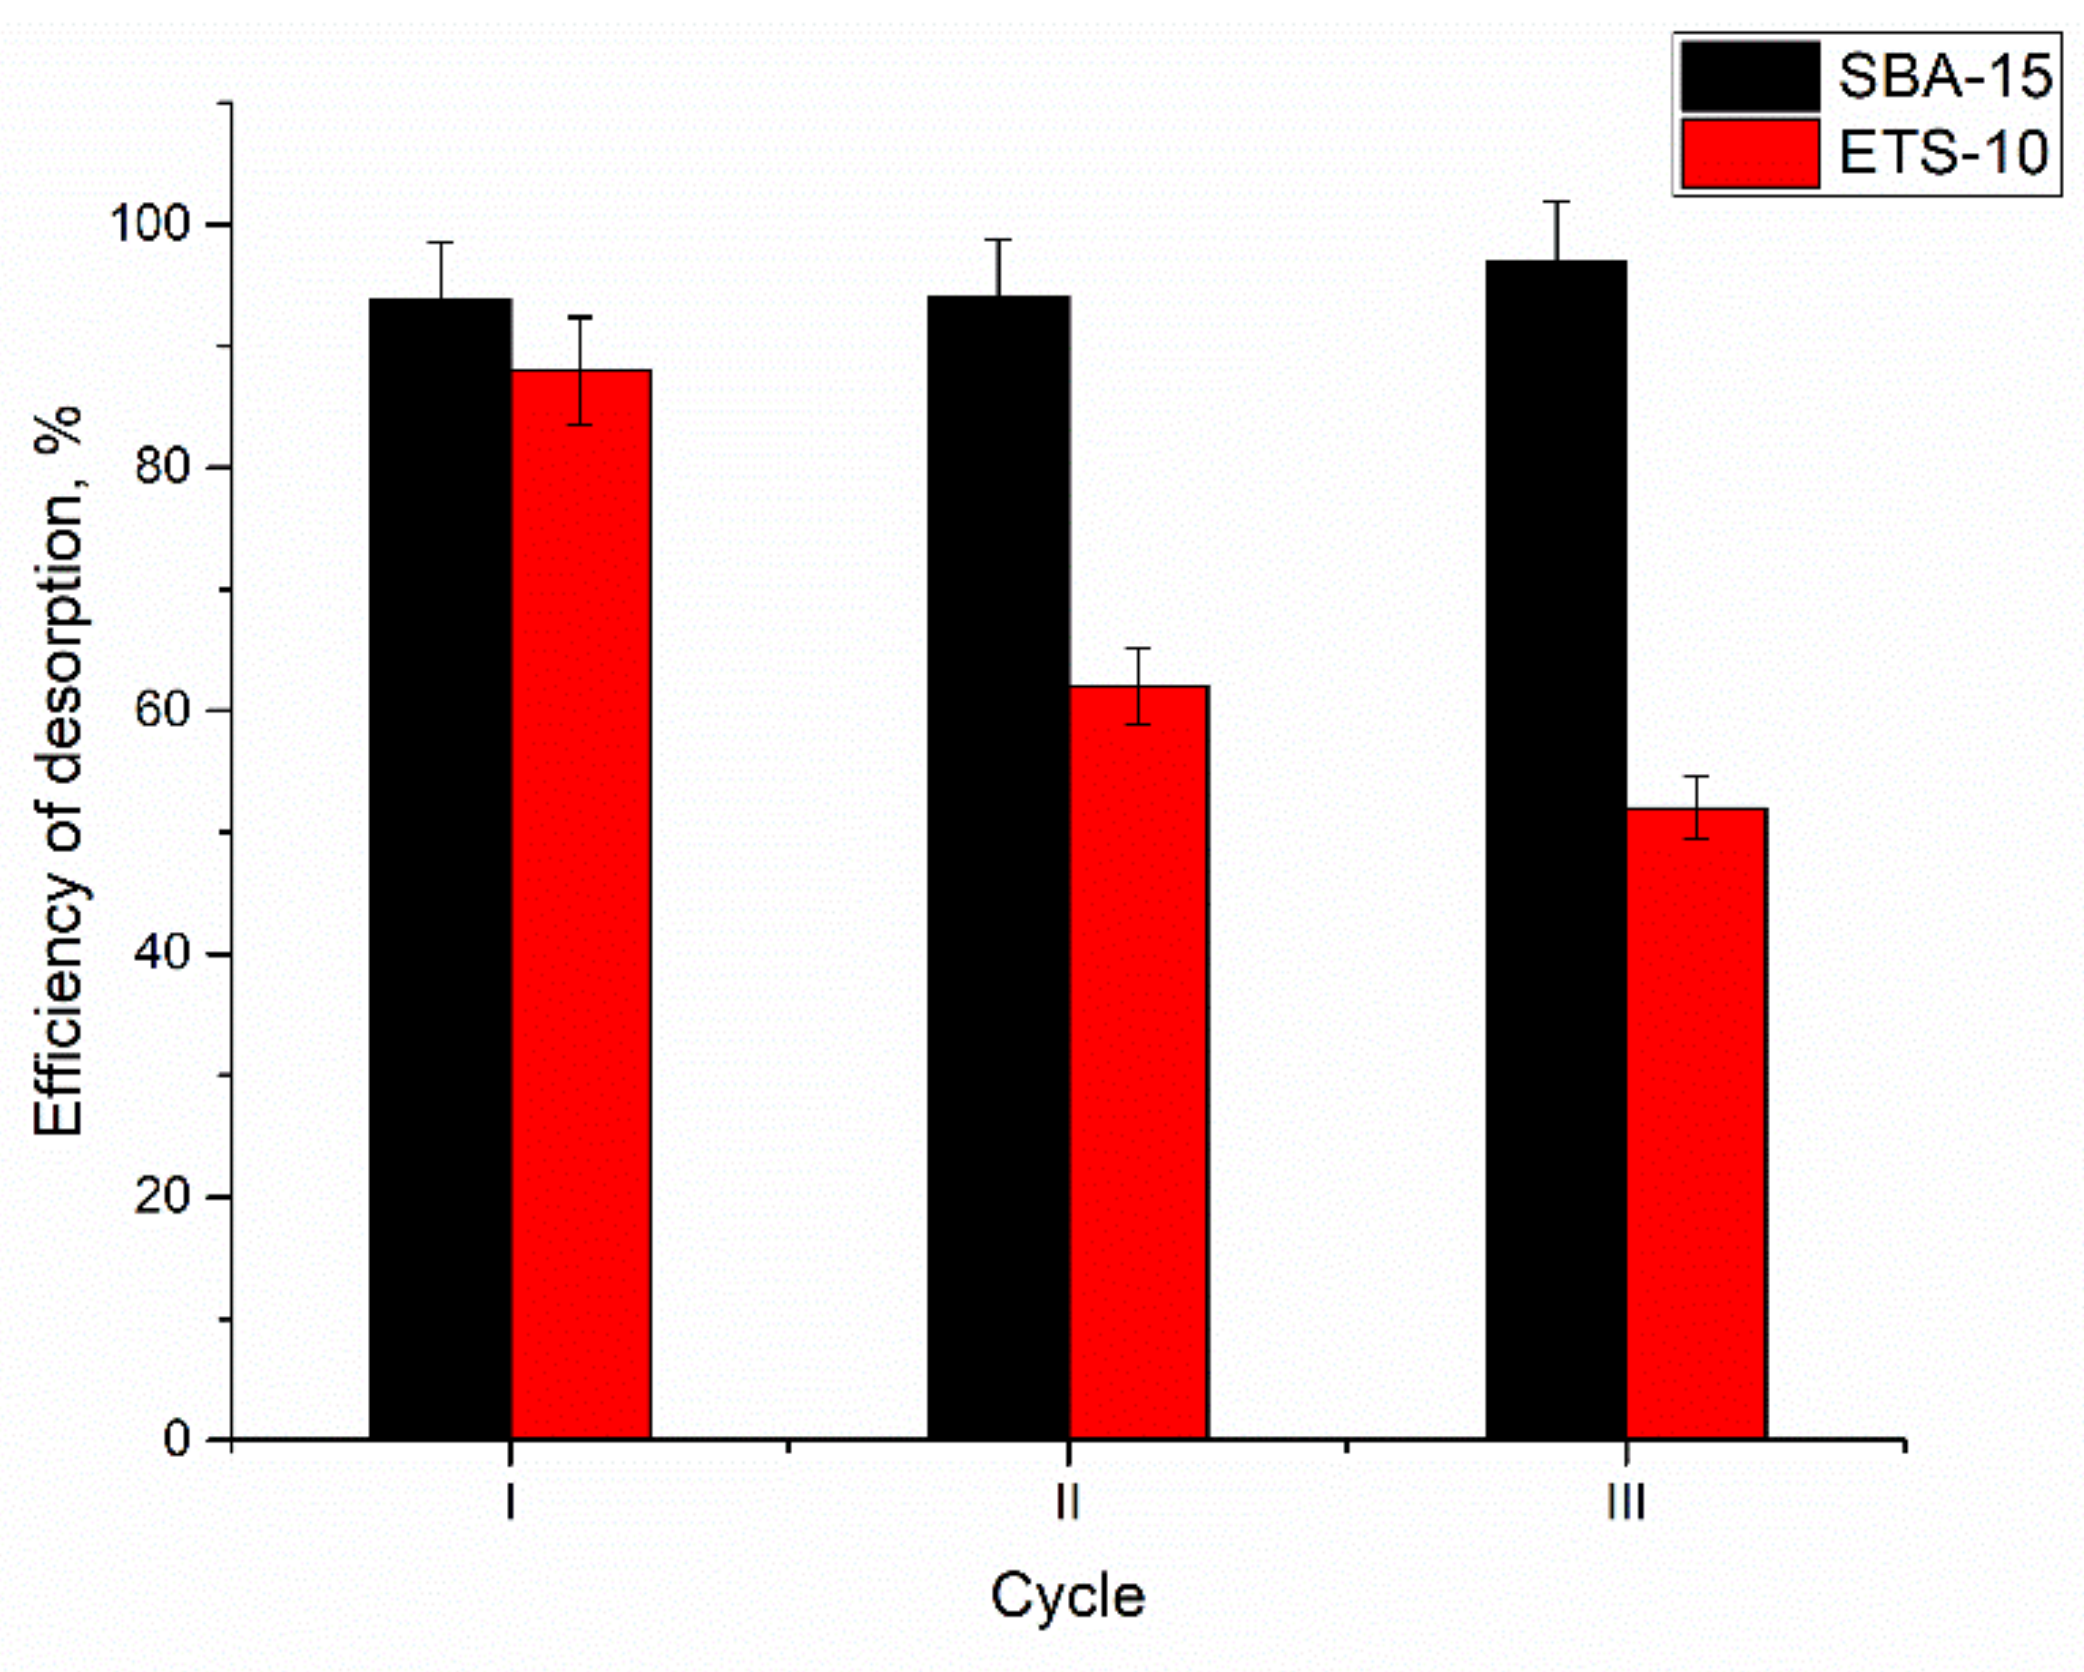
According to adsorption–desorption experiments (Figure 10), silica SBA-15 can be successfully reused in the adsorption process. This is in agreement with Dashtian et al.’s study [31]. In three cycles, the desorption of Ce(III) was on the level of 94–97%, which indicates that it is a highly recoverable and reusable adsorbent. At the same time, the desorption efficiency of the titanosilicate ETS-10 sorbents decreased from 88% in the first cycle to 52% in the third cycle. It should be mentioned that both sorbents maintained high Ce(III) removal efficiency during three cycles (93–96%).
4. Conclusions
Silica SBA-15 and titanosilicate ETS-10 were shown to be suitable adsorbents for Ce(III) removal from aqueous solutions. Maximum removal efficiency for silica SBA-15 was achieved at pH 3.0, contact time 5 min, and sorbent dose of 20 mg. In the case of titanosilicate ETS-10, maximum Ce(III) removal was attained at pH 4.0–5.0, contact time 7 min, and sorbent dosage 20 mg. The adsorption process was followed by pseudo-first- and pseudo-second-order kinetic models. The Langmuir model was applicable to describe the adsorption data for both adsorbents, while the Temkin model fit well the data for silica SBA-15. Maximum adsorption capacity calculated from the Langmuir model for titanosilicate ETS-10 (162 mg/g) was 2.4 times higher than for silica SBA-15 (68 mg/g). Negative ΔG° and ΔH° values showed the spontaneous, exothermic nature of the sorption. High Ce(III) recovery under the optimal conditions was achieved during three cycles by silica SBA-15 adsorbent.
Author Contributions
Conceptualization, I.Z., D.H. and N.Y.; methodology, I.Z., D.H., N.Y., D.G., M.I. and I.H.; software, D.G.; validation, D.G., I.Z. and D.H.; formal analysis, I.Z., D.H. and N.Y.; investigation, I.Z., D.H., N.Y., D.G., M.I. and I.H.; writing—original draft preparation, I.Z. and S.D.; data curation, S.D.; writing—review and editing, all authors; project administration, I.Z. and D.H.; funding acquisition, I.Z. and D.H. All authors have read and agreed to the published version of the manuscript.
Funding
This research was funded by JINR-Romania Plenipotentiary grant number № 366 from 11.05.2021, item 74.
Institutional Review Board Statement
Not applicable.
Informed Consent Statement
Not applicable.
Data Availability Statement
The date presented in this study are available on request from the corresponding author.
Conflicts of Interest
The authors declare no conflict of interest.
Appendix A
Figure A1.
EDX spectra of (a) silica SBA-15 and (b) titanosilicate ETS-10.

Figure A2.
lnKd versus 1/T.

References
- Vijayaraghavan, K.; Sathishkumar, M.; Balasubramanian, R. Biosorption of lanthanum, cerium, europium, and ytterbium by a brown marine alga, turbinaria conoides. Ind. Eng. Chem. Res. 2010, 49, 4405–4411. [Google Scholar] [CrossRef]
- Allahkarami, E.; Rezai, B. Removal of cerium from different aqueous solutions using different adsorbents: A review. Process Saf. Environ. Prot. 2019, 124, 345–362. [Google Scholar] [CrossRef]
- Sadovsky, D.; Brenner, A.; Astrachan, B.; Asaf, B.; Gonen, R. Biosorption potential of cerium ions using Spirulina biomass. J. Rare Earths 2016, 34, 644–652. [Google Scholar] [CrossRef]
- Ahmed, I.M.; Gamal, R.; Helal, A.A.; Abo-El-Enein, S.A.; Helal, A.A. Kinetic sorption study of Cerium (IV) on magnetite nanoparticles. Part. Sci. Technol. 2017, 35, 643–652. [Google Scholar] [CrossRef]
- Torab-Mostaedi, M.; Asadollahzadeh, M.; Hemmati, A.; Khosravi, A. Biosorption of lanthanum and cerium from aqueous solutions by grapefruit peel: Equilibrium, kinetic and thermodynamic studies. Res. Chem. Intermed. 2015, 41, 559–573. [Google Scholar] [CrossRef]
- Zhao, G.X.S.; Lee, J.L.; Chia, P.A. Unusual adsorption properties of microporous titanosilicate ETS-10 toward heavy metal lead. Langmuir 2003, 19, 1977–1979. [Google Scholar] [CrossRef]
- Zhai, Q.-Z.; Li, X.-D. Efficient removal of cadmium(II) with SBA-15 nanoporous silica: Studies on equilibrium, isotherm, kinetics and thermodynamics. Appl. Water Sci. 2019, 9, 143. [Google Scholar] [CrossRef] [Green Version]
- Lv, L.; Hor, M.P.; Su, F.; Zhao, X.S. Competitive adsorption of Pb2+, Cu2+, and Cd2+ ions on microporous titanosilicate ETS-10. J. Colloid Interface Sci. 2005, 287, 178–184. [Google Scholar] [CrossRef]
- Nandanwar, S.U.; Coldsnow, K.; Utgikar, V.; Sabharwall, P.; Aston, D.E.; Zhang, Y. Synthesis and characterization of ETS-10: Supported hollow carbon nano-polyhedrons nanosorbent for adsorption of krypton at near ambient temperatures. Adsorption 2016, 22, 129–137. [Google Scholar] [CrossRef]
- Choi, J.H.; Kim, S.D.; Kwon, Y.J.; Kim, W.J. Adsorption behaviors of ETS-10 and its variant, ETAS-10 on the removal of heavy metals, Cu2+, Co2+, Mn2+ and Zn2+ from a waste water. Microporous Mesoporous Mater. 2006, 96, 157–167. [Google Scholar] [CrossRef]
- Da’na, E.; Sayari, A. Adsorption of heavy metals on amine-functionalized SBA-15 prepared by co-condensation: Applications to real water samples. Desalination 2012, 285, 62–67. [Google Scholar] [CrossRef]
- Mureseanu, M.; Reiss, A.; Stefanescu, I.; David, E.; Parvulescu, V.; Renard, G.; Hulea, V. Modified SBA-15 mesoporous silica for heavy metal ions remediation. Chemosphere 2008, 73, 1499–1504. [Google Scholar] [CrossRef] [PubMed]
- Bidhendi, M.E.; Nabi Bidhendi, G.R.; Mehrdadi, N.; Rashedi, H. Modified Mesoporous Silica (SBA-15) with Trithiane as a new effective adsorbent for mercury ions removal from aqueous environment. J. Environ. Health Sci. Eng. 2014, 12, 100. [Google Scholar] [CrossRef] [PubMed] [Green Version]
- Ryu, S.; Fonseka, C.; Naidu, G.; Loganathan, P.; Moon, H.; Kandasamy, J.; Vigneswaran, S. Recovery of rare earth elements (Lu, Y) by adsorption using functionalized SBA-15 and MIL-101 (Cr). Chemosphere 2021, 281, 130869. [Google Scholar] [CrossRef]
- Thakkar, J.; Wissler, B.; Dudenas, N.; Yin, X.; Vailhe, M.; Bricker, J.; Zhang, X. Recovery of Critical Rare-Earth Elements Using ETS-10 Titanosilicate. Ind. Eng. Chem. Res. 2019, 58, 11121–11126. [Google Scholar] [CrossRef]
- Hartmann, M.; Vinu, A. Mechanical stability and porosity analysis of large-pore SBA-15 mesoporous molecular sieves by mercury porosimetry and organics adsorption. Langmuir 2002, 18, 8010–8016. [Google Scholar] [CrossRef]
- Lv, L.; Su, F.; Zhao, X.S. A reinforced study on the synthesis of microporous titanosilicate ETS-10. Microporous Mesoporous Mater. 2004, 76, 113–122. [Google Scholar] [CrossRef]
- Anderson, M.W.; Terasaki, O.; Ohsuna, T.; Philippou, A.; MacKay, S.P.; Ferreira, A.; Rocha, J.; Lidin, S. Structure of the microporous titanosilicate ETS-10. Nature 1994, 367, 347–351. [Google Scholar] [CrossRef]
- Rocha, J.; Anderson, M.W. Microporous titanosilicates and other novel mixed octahedral-tetrahedral framework oxides. Eur. J. Inorg. Chem. 2000, 2000, 801–818. [Google Scholar] [CrossRef]
- Donohue, M.D.; Aranovich, G.L. Classification of Gibbs adsorption isotherms. Adv. Colloid Interface Sci. 1998, 76–77, 137–152. [Google Scholar] [CrossRef]
- Gobara, H.M.; Elsalamony, R.A.; Hassan, S.A. Sonophotocatalytic degradation of eriochrome black-T dye in water using Ti grafted SBA-15. J. Porous Mater. 2016, 23, 1311–1318. [Google Scholar] [CrossRef]
- Das, T.K.; Chandwadkar, A.J.; Budhkar, A.P.; Sivasanker, S. Studies on the synthesis of ETS-10: II. Use of organic templates. Microporous Mater. 1996, 5, 401–410. [Google Scholar] [CrossRef]
- Kruk, M.; Jaroniec, M.; Ko, C.H.; Ryoo, R. Characterization of the porous structure of SBA-15. Chem. Mater. 2000, 12, 1961–1968. [Google Scholar] [CrossRef]
- Halamová, D.; Badaničová, M.; Zeleňák, V.; Gondová, T.; Vainio, U. Naproxen drug delivery using periodic mesoporous silica SBA-15. Appl. Surf. Sci. 2010, 256, 6489–6494. [Google Scholar] [CrossRef] [Green Version]
- Kapeluszna, E.; Kotwica, Ł.; Różycka, A.; Gołek, Ł. Incorporation of Al in C-A-S-H gels with various Ca/Si and Al/Si ratio: Microstructural and structural characteristics with DTA/TG, XRD, FTIR and TEM analysis. Constr. Build. Mater. 2017, 155, 643–653. [Google Scholar] [CrossRef]
- Bhaumik, A.; Samanta, S.; Mal, N.K. Highly active disordered extra large pore titanium silicate. Microporous Mesoporous Mater. 2004, 68, 29–35. [Google Scholar] [CrossRef]
- Liu, Y.; Du, H.; Xu, Y.; Ding, H.; Pang, W.; Yue, Y. Synthesis and characterization of a novel microporous titanosilicate with a structure of penkvilksite-1M. Microporous Mesoporous Mater. 1999, 28, 511–517. [Google Scholar] [CrossRef]
- Awual, M.R.; Yaita, T.; Shiwaku, H. Design a novel optical adsorbent for simultaneous ultra-trace cerium(III) detection, sorption and recovery. Chem. Eng. J. 2013, 228, 327–335. [Google Scholar] [CrossRef]
- Lv, L.; Tsoi, G.; Zhao, X.S. Uptake equilibria and mechanisms of heavy metal ions on microporous titanosilicate ETS-10. Ind. Eng. Chem. Res. 2004, 43, 7900–7906. [Google Scholar] [CrossRef]
- Pourbaix, M. Atlas of Electrochemical Equilibria in Aqueous Solutions; Pergamon Press: New York, NY, USA, 1966. [Google Scholar]
- Dashtian, K.; Zare-Dorabei, R. Synthesis and characterization of functionalized mesoprous SBA-15 decorated with Fe3O4 nanoparticles for removal of Ce(III) ions from aqueous solution: ICP–OES detection and central composite design optimization. J. Colloid Interface Sci. 2017, 494, 114–123. [Google Scholar] [CrossRef]
- Zhao, L.; Azhar, M.R.; Li, X.; Duan, X.; Sun, H.; Wang, S.; Fang, X. Adsorption of cerium (III) by HKUST-1 metal-organic framework from aqueous solution. J. Colloid Interface Sci. 2019, 542, 421–428. [Google Scholar] [CrossRef]
- Kütahyali, C.; Şert, S.; Çetinkaya, B.; Inan, S.; Eral, M. Factors affecting lanthanum and cerium biosorption on Pinus brutia leaf powder. Sep. Sci. Technol. 2010, 45, 1456–1462. [Google Scholar] [CrossRef]
- Jabeen, S.; Khan, M.S.; Khattak, R.; Zekker, I.; Burlakovs, J.; Dc Rubin, S.S.; Ghangrekar, M.M.; Kallistova, A.; Pimenov, N.; Zahoor, M.; et al. Palladium-supported zirconia-based catalytic degradation of rhodamine-b dye from wastewater. Water 2021, 13, 1522. [Google Scholar] [CrossRef]
- Umar, A.; Khan, M.S.; Alam, S.; Zekker, I.; Burlakovs, J.; Dc Rubin, S.S.; Bhowmick, G.D.; Kallistova, A.; Pimenov, N.; Zahoor, M. Article synthesis and characterization of Pd-Ni bimetallic nanoparticles as efficient adsorbent for the removal of acid orange 8 present in wastewater. Water 2021, 13, 1095. [Google Scholar] [CrossRef]
- Zinicovscaia, I.; Yushin, N.; Abdusamadzoda, D.; Grozdov, D.; Shvetsova, M. Efficient removal of metals from synthetic and real galvanic zinc-containing effluents by Brewer’s yeast Saccharomyces cerevisiae. Materials 2020, 13, 3624. [Google Scholar] [CrossRef]
- Zinicovscaia, I.; Yushin, N.; Grozdov, D.; Vergel, K.; Popova, N.; Artemiev, G.; Safonov, A. Metal removal from nickel-containing effluents using mineral–organic hybrid adsorbent. Materials 2020, 13, 4462. [Google Scholar] [CrossRef]
- Al-Ghouti, M.A.; Da’ana, D.A. Guidelines for the use and interpretation of adsorption isotherm models: A review. J. Hazard. Mater. 2020, 393, 122383. [Google Scholar] [CrossRef] [PubMed]
- Dudarko, O.; Kobylinska, N.; Mishra, B.; Kessler, V.G.; Tripathi, B.P.; Seisenbaeva, G.A. Facile strategies for synthesis of functionalized mesoporous silicas for the removal of rare-earth elements and heavy metals from aqueous systems. Microporous Mesoporous Mater. 2021, 315, 110919. [Google Scholar] [CrossRef]
- Gao, S.; Luo, T.; Zhou, Q.; Luo, W. A novel and efficient method on the recovery of nanosized CeO2 in Ce3+ wastewater remediation using modified sawdust as adsorbent. J. Colloid Interface Sci. 2018, 512, 629–637. [Google Scholar] [CrossRef]
- Farahmand, E. Adsorption of Cerium (IV) from Aqueous Solutions Using Activated Carbon Developed from Rice Straw. Open J. Geol. 2016, 6, 189–200. [Google Scholar] [CrossRef] [Green Version]
- Fakhri, H.; Mahjoub, A.R.; Aghayan, H. Effective removal of methylene blue and cerium by a novel pair set of heteropoly acids based functionalized graphene oxide: Adsorption and photocatalytic study. Chem. Eng. Res. Des. 2017, 120, 303–315. [Google Scholar] [CrossRef]
- Ho, Y.S.; McKay, G. The kinetics of sorption of basic dyes from aqueous solution by sphagnum moss peat. Can. J. Chem. Eng. 1998, 76, 822–827. [Google Scholar] [CrossRef]
- Betiha, M.A.; Moustafa, Y.M.; El-Shahat, M.F.; Rafik, E. Polyvinylpyrrolidone-Aminopropyl-SBA-15 schiff Base hybrid for efficient removal of divalent heavy metal cations from wastewater. J. Hazard. Mater. 2020, 397, 122675. [Google Scholar] [CrossRef] [PubMed]
- Botelho Junior, A.B.; Pinheiro, É.F.; Espinosa, D.C.R.; Tenório, J.A.S.; Baltazar, M.d.P.G. Adsorption of lanthanum and cerium on chelating ion exchange resins: Kinetic and thermodynamic studies. Sep. Sci. Technol. 2021. [Google Scholar] [CrossRef]
- Wang, J.; Liu, G.; Li, T.; Zhou, C. Physicochemical studies toward the removal of Zn(ii) and Pb(ii) ions through adsorption on montmorillonite-supported zero-valent iron nanoparticles. RSC Adv. 2015, 5, 29859–29871. [Google Scholar] [CrossRef]
- Inyinbor, A.A.; Adekola, F.A.; Olatunji, G.A. Kinetics, isotherms and thermodynamic modeling of liquid phase adsorption of Rhodamine B dye onto Raphia hookerie fruit epicarp. Water Resour. Ind. 2016, 15, 14–27. [Google Scholar] [CrossRef] [Green Version]
Figure 1.
Low-angle XRD pattern of silica SBA-15 (a) and XRD) pattern of titanosilicate ETS-10 (b).

Figure 2.
SEM microphotographs of (a) silica SBA-15 and (b) titanosilicate ETS-10.

Figure 3.
Nitrogen adsorption isotherms and pore size distributions for the (a) silica SBA-15 and (b) titanosilicate ETS-10.
Figure 3.
Nitrogen adsorption isotherms and pore size distributions for the (a) silica SBA-15 and (b) titanosilicate ETS-10.

Figure 4.
Thermal gravimetric analysis (TGA) diagram of (a) silica SBA-15 and (b) titanosilicate ETS-10.
Figure 4.
Thermal gravimetric analysis (TGA) diagram of (a) silica SBA-15 and (b) titanosilicate ETS-10.

Figure 5.
FTIR spectra of (a) silica SBA-15 and (b) titanosilicate ETS-10.

Figure 6.
Effect of pH on the adsorption of Ce(III) on analyzed sorbents (Ci 10 mg/L, time 1 h, temperature 23 °C).
Figure 6.
Effect of pH on the adsorption of Ce(III) on analyzed sorbents (Ci 10 mg/L, time 1 h, temperature 23 °C).

Figure 7.
The isotherms describing Ce(III) ion sorption on (a) silica SBA-15 and (b) titanosilicate ETS-10 sorbents.
Figure 7.
The isotherms describing Ce(III) ion sorption on (a) silica SBA-15 and (b) titanosilicate ETS-10 sorbents.

Figure 8.
Kinetics of Ce(III) sorption on (a) silica SBA-15 and (b) titanosilicate ETS-10 sorbents.

Figure 9.
Influence of temperature on Ce(III) removal by silica SBA-15 and titanosilicate ETS-10 sorbents.
Figure 9.
Influence of temperature on Ce(III) removal by silica SBA-15 and titanosilicate ETS-10 sorbents.

Figure 10.
Desorption efficiency of silica SBA-15 and titanosilicate ETS-10 sorbents.


Table 1.
Equilibrium isotherms parameters for the sorption of Ce(III) on silica SBA-15 and titanosilicate ETS-10 sorbents.
Table 1.
Equilibrium isotherms parameters for the sorption of Ce(III) on silica SBA-15 and titanosilicate ETS-10 sorbents.
| Model | Parameters | Silica SBA-15 | Titanosilicate ETS-10 |
|---|---|---|---|
| Langmuir | qm, mg/g | 68 | 162 |
| b, L/mg | 0.018 | 0.008 | |
| RL | 0.35–0.84 | 0.55–0.92 | |
| R2 | 0.99 | 0.96 | |
| Freundlich | KF, mg/g | 3.5 | 2.5 |
| 1/n | 0.55 | 0.72 | |
| R2 | 0.97 | 0.94 | |
| Temkin | aT, L/g | 0.16 | 0.09 |
| bT, kJ/mol | 0.15 | 0.17 | |
| R2 | 0.99 | 0.95 |
Table 2.
The sorption capacity of analyzed sorbents along with literature data.
| Sorbent | q, mg/g | Reference |
|---|---|---|
| Silica SBA-15 | 68 | Present study |
| Titanosilicate ETS-10 | 162 | Present study |
| Fe3O4 | 160 | [4] |
| Fe3O4/HA | 260 | [4] |
| Grapefruit peel | 159.30 | [5] |
| Spirulina biomass endemic | 18.1 | [3] |
| Spirulina biomass commercial | 38.2 | [3] |
| modified sawdust | 153.9 | [40] |
| Activated Carbon Developed from Rice Straw | 4.13 | [41] |
| Functionalized graphene oxide compounds | 96.15 and 90.90 | [42] |
Table 3.
Parameters of the applied kinetic models for the sorption of Ce(III).
| Parameter | Silica SBA-15 | Titanosilicate ETS-10 | |
|---|---|---|---|
| qexp, mg/g | 9.2 | 9.4 | |
| PFO | qe,cal, mg/g | 9.25 | 9.4 |
| k1, min−1 | 0.5 | 3.1 | |
| R2 | 0.97 | 0.99 | |
| PSO | qe,cal, mg/g | 9.26 | 9.46 |
| k2, g/mg·min | 3.82 | 2 | |
| R2 | 0.99 | 0.99 | |
| EM | α, mg/g·min | 1.06 | 2.6 |
| β, g/min | 11.2 | 9.4 | |
| R2 | 0.89 | 0.88 | |
| IPM | kdiff | 0.78 | 0.81 |
| Cint | 5.9 | 5.4 | |
| R2 | 0.19 | 0.2 |
Table 4.
Thermodynamic parameters of Ce(III) on studied sorbents.
| Sorbent | ∆G°, kJ/mol | ∆H°, kJ/mol | ∆S°, J/mol·K | R2 | |||
|---|---|---|---|---|---|---|---|
| 293 K | 303 K | 313 K | 323 K | ||||
| Silica SBA-15 | −15.0 | −15.5 | −16.0 | −16.5 | −0.7 | 49 | 0.93 |
| Titanosilicate ETS-10 | −15.1 | −14.2 | −13.4 | −12.5 | −39.9 | −84 | 0.99 |
Publisher’s Note: MDPI stays neutral with regard to jurisdictional claims in published maps and institutional affiliations. |
© 2021 by the authors. Licensee MDPI, Basel, Switzerland. This article is an open access article distributed under the terms and conditions of the Creative Commons Attribution (CC BY) license (https://creativecommons.org/licenses/by/4.0/).
Share and Cite
MDPI and ACS Style
Zinicovscaia, I.; Yushin, N.; Humelnicu, D.; Grozdov, D.; Ignat, M.; Demcak, S.; Humelnicu, I. Sorption of Ce(III) by Silica SBA-15 and Titanosilicate ETS-10 from Aqueous Solution. Water 2021, 13, 3263. https://doi.org/10.3390/w13223263
AMA Style
Zinicovscaia I, Yushin N, Humelnicu D, Grozdov D, Ignat M, Demcak S, Humelnicu I. Sorption of Ce(III) by Silica SBA-15 and Titanosilicate ETS-10 from Aqueous Solution. Water. 2021; 13(22):3263. https://doi.org/10.3390/w13223263
Chicago/Turabian StyleZinicovscaia, Inga, Nikita Yushin, Doina Humelnicu, Dmitrii Grozdov, Maria Ignat, Stefan Demcak, and Ionel Humelnicu. 2021. "Sorption of Ce(III) by Silica SBA-15 and Titanosilicate ETS-10 from Aqueous Solution" Water 13, no. 22: 3263. https://doi.org/10.3390/w13223263
Note that from the first issue of 2016, this journal uses article numbers instead of page numbers. See further details here.