
Impact of Island Urbanization on Freshwater Lenses: A Case Study on a Small Coral Island

1
College of Hydrology and Water Resources, Hohai University, Nanjing 210098, China
2
State Key Laboratory of Hydrology-Water Resources and Hydraulic Engineering, Hohai University, Nanjing 210098, China
3
Jinan Hydrological Center, Jinan 250014, China
*
Author to whom correspondence should be addressed.
Water 2021, 13(22), 3272; https://doi.org/10.3390/w13223272
Submission received: 18 October 2021
/
Revised: 16 November 2021
/
Accepted: 16 November 2021
/
Published: 18 November 2021
(This article belongs to the Special Issue Coastal Aquifers: Seawater/Saltwater Intrusion)
Abstract
:Freshwater resources on small coral islands mainly exist in the form of freshwater lenses. The freshwater lens is highly vulnerable to salinization due to natural recharge variations and urbanization construction. However, it is unclear how a freshwater lens evolves under the influence of urbanization construction and which factors control its evolution. Based on the hydrogeological data of a small coral island in China, a corresponding 3D numerical model was established by the Visual MODFLOW software to investigate the formation and evolution of freshwater lenses under natural conditions. Thereby, the island reclamation scenario and impermeable surface scenario were set up and the changes in morphology and volume of the freshwater lens were analyzed. The results show the following: (1) After island reclamation and island building, the freshwater lens would reach a stable state after 25 years and the freshwater lens would also appear in the newly added part of the island with a thickness of 9.5 m, while the volume of the total freshwater lens would increase to 1.22 times that of the original island. (2) When the impermeable surface is built at different positions of the island, the reduction in the volume of the freshwater lens, in the order from large to small, is Scenario B (northeast side), Scenario A (southwest side) and Scenario C (central); with the increase in the impermeable surface area, the volume of the freshwater lens would gradually decrease and the volume of the freshwater lens would decrease by more than 50% with the impermeable surface exceeding 30% of the island area. The study has important implications for the conservation and rational development of subsurface freshwater resources on islands.
1. Introduction
Freshwater lenses, also called as the “Ghyben–Herzberg” lenses, were first discovered by Ghyben [1] and Herzbrg [2] in a separate study of freshwater problems in coastal Europe. The freshwater lens is a freshwater body shaped as a convex lens that is formed on top of saltwater due to the difference in density between subsurface freshwater and underlying seawater [3]. The rational development of freshwater lenses is an important foundation for the utilization of island water resources and sustainable development [4,5,6]. However, the freshwater lens is highly sensitive to the effects of climate change, natural disasters and human factors [7,8,9].
Experts and scholars have conducted further studies on the formation mechanism of freshwater lenses, e.g., Hubbat (1953), Clumbus (1956), Henry (1959), Glover (1964) and Kaskef (1967) [10], who, respectively, used the conformal mapping method, the hydrodynamic method, the velocity vector-end curve method and the Dupuit hypothesis approximation method to simulate the saline and freshwater sharp interfaces under a steady state based on laboratory and field experimental studies. In 1992, Vacher [11] used the Dupuit–Ghyben–Herzberg (DGH) formula to calculate the analytical solutions of several infinite islands (if the island aspect ratio is greater than 4.4, it can be regarded as infinite); through the analysis of homogeneous rectangular islands, it is found that the difference of K (hydraulic conductivity) and α (precipitation infiltration recharge coefficient) at different locations of the island leads to the asymmetry of the shape of the freshwater lens. Henry and Barbara [12] conducted a field investigation of a freshwater lens on Long Island, New York, using electrical methods and the observation of groundwater levels. The results of the study showed that, when treating the transition zone between salt and fresh water as a sharp interface, the thickness of the freshwater lens calculated under hydrostatic equilibrium conditions is larger than the actual thickness and the evaluation of the total subsurface freshwater resources of the island is overestimated. Zhou [13,14] studied the formation and dynamic process of the freshwater lens on a coral island by using the Visual MODFLOW numerical model and put forward the reasonable development and protection strategy of freshwater lenses. Since then, many scholars have studied the formation, evolution and internal hydrodynamics of freshwater lenses by means of physical experiments and numerical simulations [15,16].
Freshwater lenses of islands have been affected by increasing urban construction in recent years and many scholars have carried out relevant studies. In 2010, White et al. [17] found that coastal erosion due to sand and gravel mining in Pacific islands has reduced the thickness of soil above the water table, making the freshwater lens more vulnerable to contamination by biochemicals, such as septic tanks, waste disposal areas, fertilizers and agrochemicals, posing serious health risks. Huizer et al. [18] performed a calculation simulation of a sand dike constructed along the Dutch coast and the results showed that the freshwater lens under the sand dike was mainly determined by groundwater recharge and was affected, to a minor extent, by geomorphic changes, while storm surges caused a wide range of surface inundation and seawater infiltration, leading to salinization of most fresh groundwater in the inundation zone. In 2018, Vincent et al. [19] investigated the small atoll of Bonriki and found that storm surges and over-pumping would cause seawater intrusion; the freshwater lens of Bonriki Island is still shrinking after 27.5 years of pumping, where a thinner freshwater lens increases the salinity of the water supply. This means that it may take at least 20 years for even a permeable island such as Bonriki to reach equilibrium conditions again. At the same time, the limited island area limits freshwater storage.
Some scholars have enhanced the deep understanding of the formation and evolution of freshwater lenses. Wallace et al. [20] developed a 3D model to study the relationship between freshwater lenses and the main geohydrological factors and found that the maximum thickness of the lenses can be estimated just based on the island’s width, while the volume of freshwater lenses depends strongly on the orientation and geometry of the atoll. Underwood et al. [21] concluded that the oscillating vertical flow due to tidal fluctuations affects the vertical permeability and vertical longitudinal diffusion, which controls the mixing of fresh and salt water. Schneider et al. [22] found that the morphology of freshwater lenses on carbonate atolls and islands is largely controlled by hydraulic conductivity K, which inhibits deeper freshwater lens’ development by limiting the vertical flow. However, few works have been conducted on studying the effects of island urbanization construction on the volume and morphology of freshwater lenses. Long-term studies on exploring the comprehensive effects of urbanization construction are necessary in order to better analyze and predict the evolution of freshwater lenses.
Here, we present a study of the freshwater lens on a small coral island of Sansha City, Hainan Province, China. The island is flat with an average elevation of 5 m and the highest point is only 8.3 m. The island is surrounded by sand dikes and has a low-lying central zone, which is formed by the drying of a lagoon. In terms of size, the study island is the largest island of the Xisha Islands, but has an area of under 5 km2. In order to extend land surface for urban development (e.g., industrial sites, recreational and commercial sites, or residential areas) and to meet the living requirements of local residents, the study island carried out reclamation activities. Much of the island’s land was used for roads, buildings and airports, etc., which inevitably resulted in an increase in impermeable surface coverage on the island. The island is the economic, military and political center of the three islands of Xisha Islands, Nansha Islands and Zhongsha Islands. Therefore, the island has an important strategic position [23]. In order to protect the national maritime security and strengthen the sea defense force, the military, Sansha City Government and municipal units are stationed on the island. However, the current water resource situation on the island is not optimistic. The islanders rely on rainwater collection and purification for their daily water supply, which is more expensive and complicated than groundwater extraction. With the development of the island and the increase in the number of islanders, the demand for industrial water and domestic water is gradually increasing. Developing a suitable water management plan as well as a groundwater extraction plan is challenging. Therefore, it is essential to determine the sustainable yield of the freshwater lens. However, there is a lack of numerical models that take into account the impact of urban construction to predict the freshwater resources of the study islands over a long time series.
The purpose of the present study is to simulate and predict the effects of urbanization (island reclamation and impermeable surfaces) on the freshwater lens. Back in the 1970s, the government organized a geological team to drill some exploratory holes in the study island and the drilling data revealed the geological structure of the island, which is a typical system of dual-aquifer carbonate island [24]. Dual-aquifer carbonate island means that the upper aquifer of the island consists of Holocene sands with low hydraulic conductivity and the lower aquifer consists of Pleistocene coral reef deposits with good permeability [25]. Examples of similar islands include those in the Bonriki Island, Tongatapu island, as well as Florida Keys (Dog Island and St George Island). A three-dimensional numerical model of variable density flow and solute transport was developed for the study island with the main objectives to (1) describe the dynamic mechanisms and formation process of the freshwater lens for the study island, (2) assess the impact of island reclamation and urbanization construction on the evolutionary process of the freshwater lens and (3) quantify the amount of available freshwater resources on the island.
2. Study Area
Small Coral Island is located in Sansha City, Hainan Province, China. The island has a tropical maritime monsoon climate. Compared with the mainland at the same latitude, this region usually faces problems such as heavy precipitation, strong evaporation and poor groundwater storage conditions, with almost non-existent surface water resources. The average annual temperature of the coral island is above 26 °C and the average annual precipitation is over 1400 mm; the rainy season is from June to November, with total precipitation accounting for about 87% of the yearly precipitation, over 1280 mm; the dry season is from December to May, with total precipitation accounting for only 13% of the yearly precipitation, less than 200 mm. The study island is a lime-sand island piled up on the reef plate, which can be divided into several geomorphic sedimentary zones, such as, in the order from outside to inside, reef pads, beaches, sand dikes, mat-like sand (sand mats) and depressions.
The geological structure can be broadly divided into Holocene and Pleistocene strata; freshwater lenses are mainly located in the Holocene strata. The changes in land use of the study island are mainly the reduction in reefs, grasslands and woodlands and the increase in buildings and roads. Among them, the reef plate area decreased from 4.63 km2 to 3.26 km2; the area of buildings and roads increased from 0.33 km2 to about 1.70 km2.
3. Materials and Methods
3.1. Conceptual and Mathematical Models
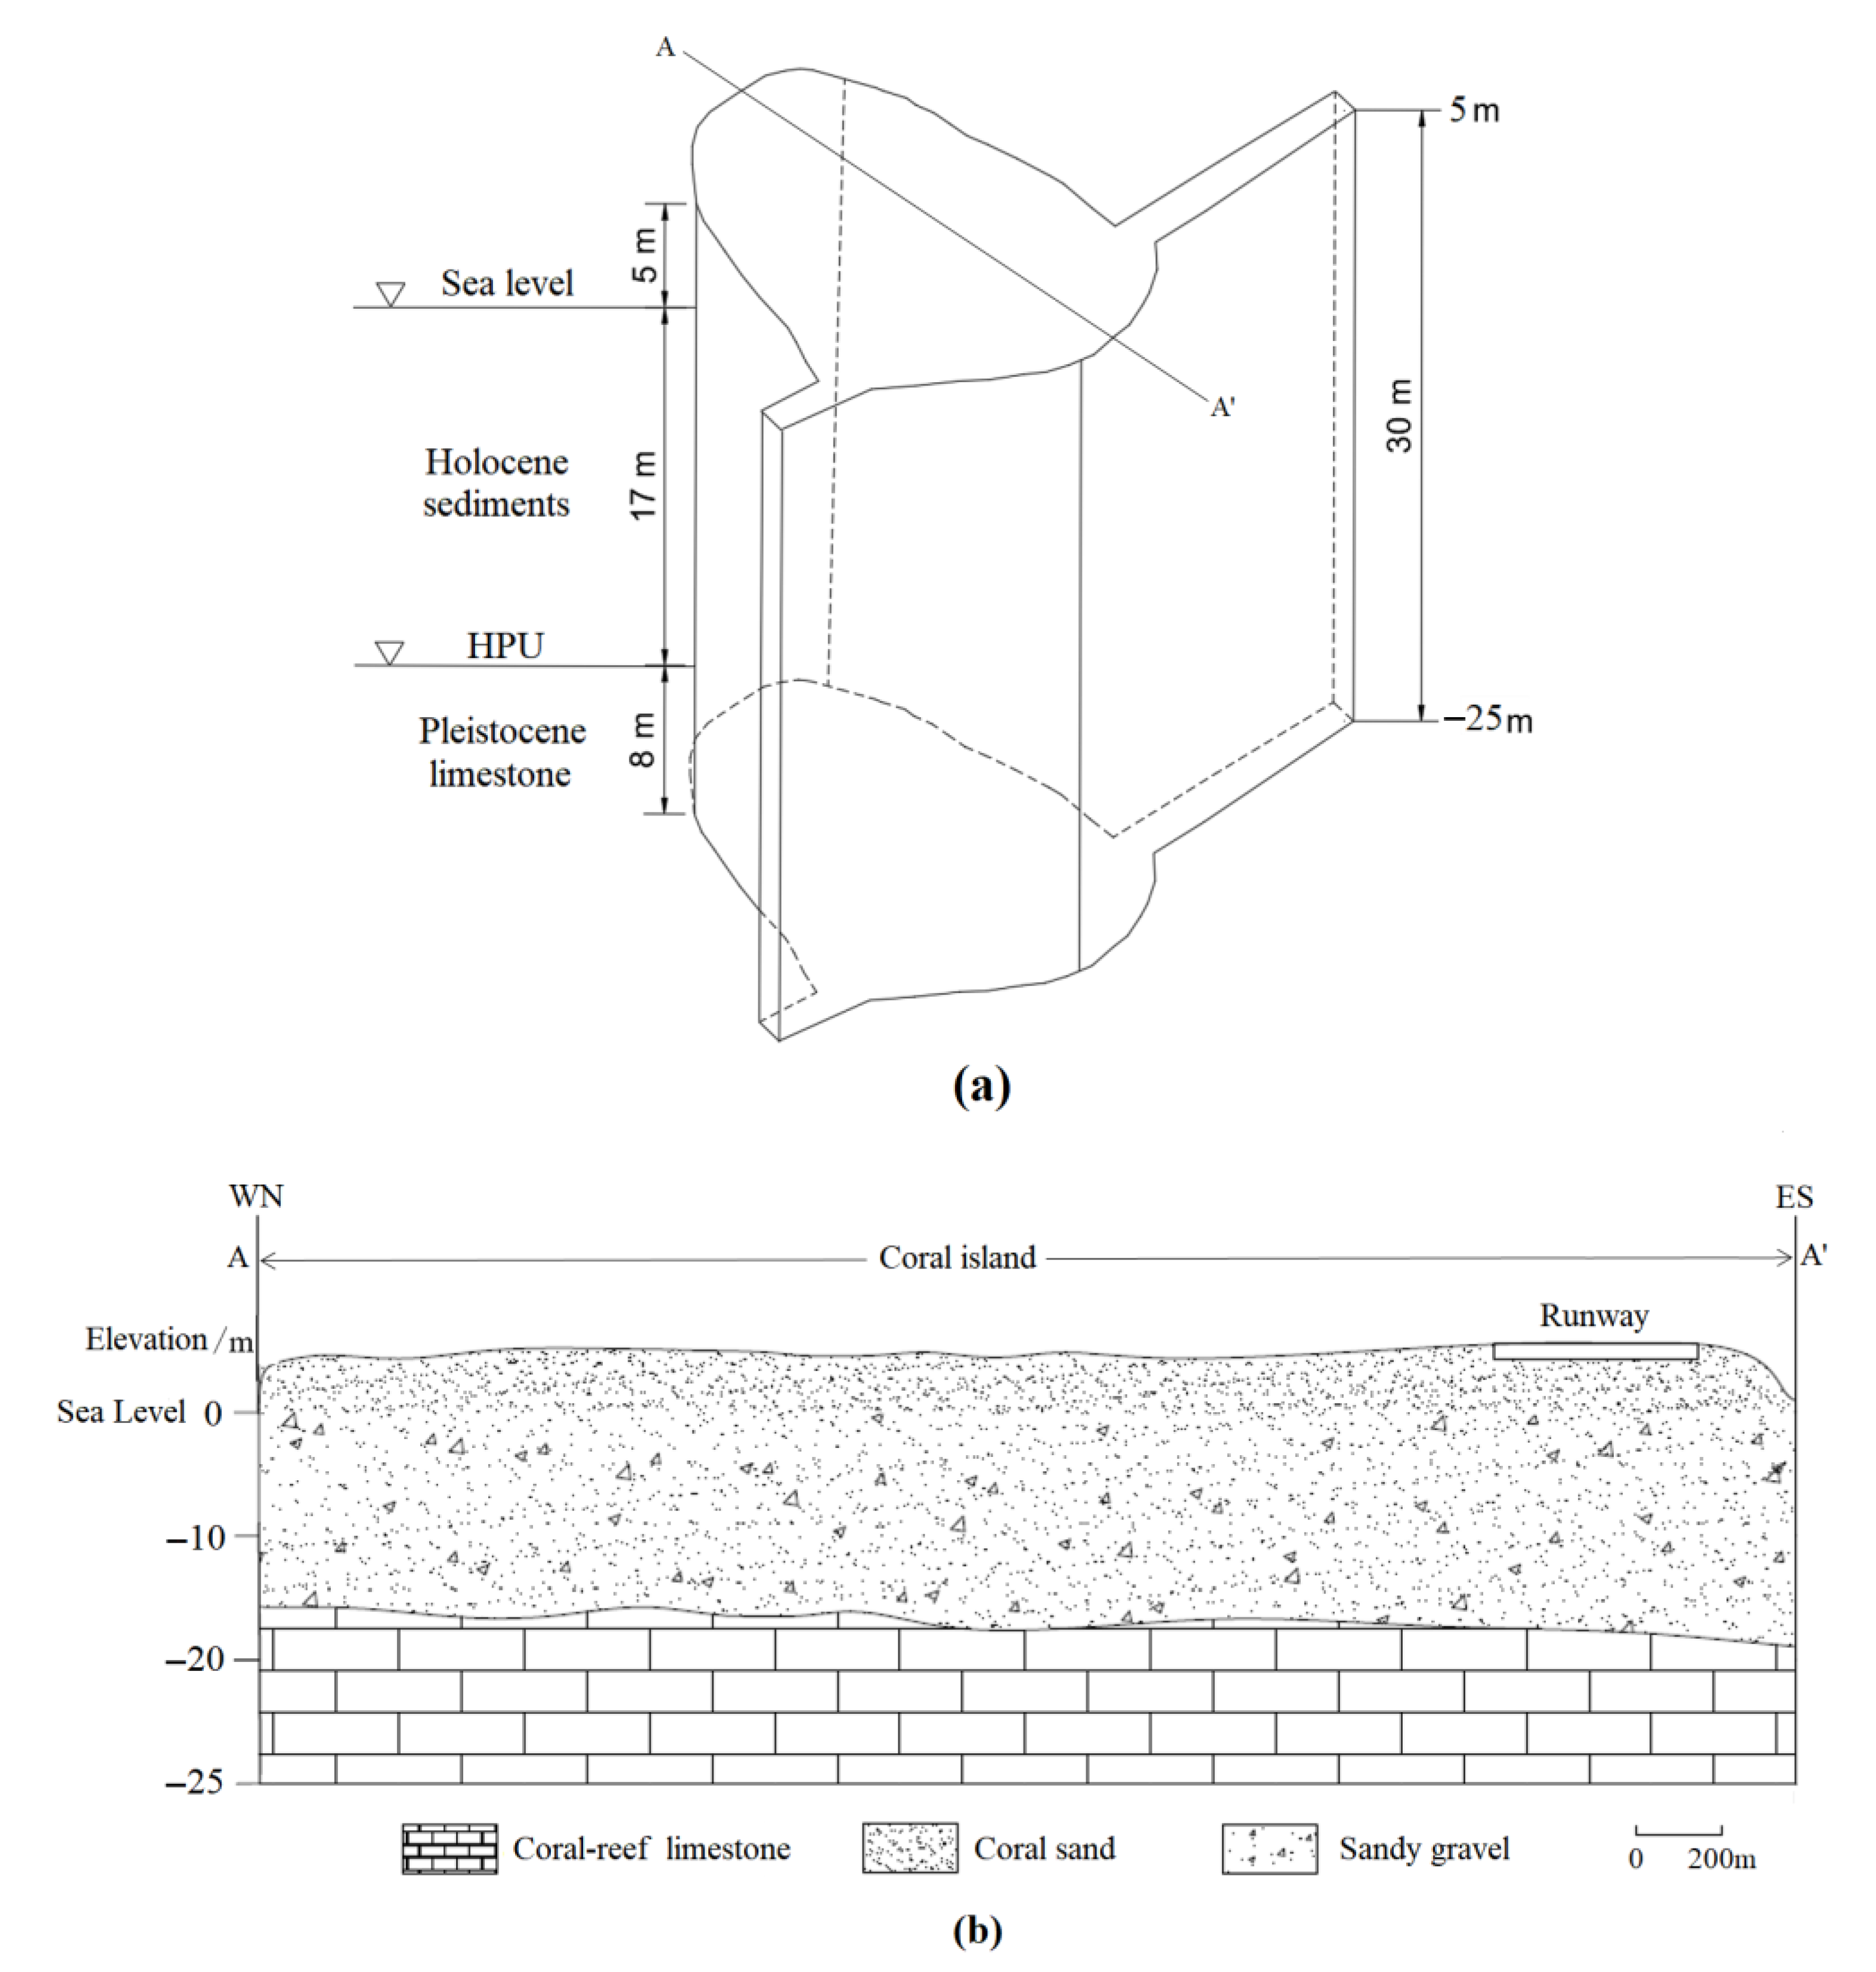
The coral island is elliptical above sea level, with a length of 1.928 km from east to west, a width of 1.380 km from south to north and an area of 2.1 km2. The island sits on a late Precambrian granite gneiss substrate. To ensure the integrity of the model, the maximum depth of the model was taken to 25 m below the surface and the island elevation above sea level was set at 5 m. Approximately 17 m below sea level is the junction of the two strata, which is called “Thurber discontinuity” or “Holocene–Pleistocene unconformity” (HPU) [26]. The top layer (0–5 m) consists of plain fill and coral medium sand; above HPU is the Holocene coral shell sedimentary layer, which is mainly formed by the accumulation of coral shell debris, other biological skeletons and gravel; the layer below HPU is composed of Pleistocene limestone with well-developed karstification. As there is virtually no surface runoff from the study island, the major recharge source of groundwater is atmospheric precipitation infiltration. Based on the above hydrogeological conditions, the generalized model of the island’s hydrogeology is shown in Figure 1.
Most of the freshwater lenses are found in the upper medium of islands [27]. Precipitation infiltrate downwards due to gravity and is constantly mixed with seawater. Under the influence of the density difference between saltwater and freshwater, freshwater floats above the saltwater to form freshwater lenses. The theoretical basis for this process includes Darcy’s law, the Dupuit hypothesis and the G-H approximation theory. The hydrodynamic dispersion between miscible solutions should be considered and the process is described by a set of equations, including the three-dimensional variable density groundwater flow equation and the solute transport equation. The three-dimensional variable density groundwater flow equations are shown below.
where is the hydraulic conductivity (m/d), is the piezometric head (m), C is solute concentration (g·L−1), is the water storage rate (m−1), t is time (d), n is the medium’s porosity; is the density coupling coefficient (kg·m−3), is the mixed fluid density (kg·m−3), is the freshwater density (kg·m−3) and is the volume of source and sink items entering unit volume aquifer in unit time (d−1).
The variable density groundwater flow equation contains a partial differential term for the change in groundwater solute concentration over time; therefore, groundwater flow causes changes in aquifer concentration, which, in turn, causes changes in the flow field. The solute transport equation is as follows:
where is the infiltration direction (m), is the hydrodynamic dispersion coefficient tensor (m2·d−1) and is the flow velocity (m/d), is the solute lost from unit volume of medium per unit time.
In the SEAWAT module, the variable density groundwater flow equation is coupled with the solute transport equation. The fluid density is considered to be linearly related to the solute concentration, while the effects of temperature and pressure are ignored. Therefore, a linear equation is established as follows:
where is the ratio of density to concentration.
where f (x,y,z) are known head values (m), qn is the flow perpendicular to unit area (m³·s−1) and is a given concentration value that varies along the boundary.
where H0 is the known head at the initial moment (m) and C0 is the known concentration at the initial moment (mg·L−1).
3.2. Numerical Model Setting
Numerical simulations were carried out using the SEAWAT module of the Visual MODFLOW software. This module is used to solve the model by running MODFLOW 2000 coupled with MT3DMS. The whole simulation process consists of three main cycles: the stress period cycle, the time step cycle and the coupled solution cycle [28].
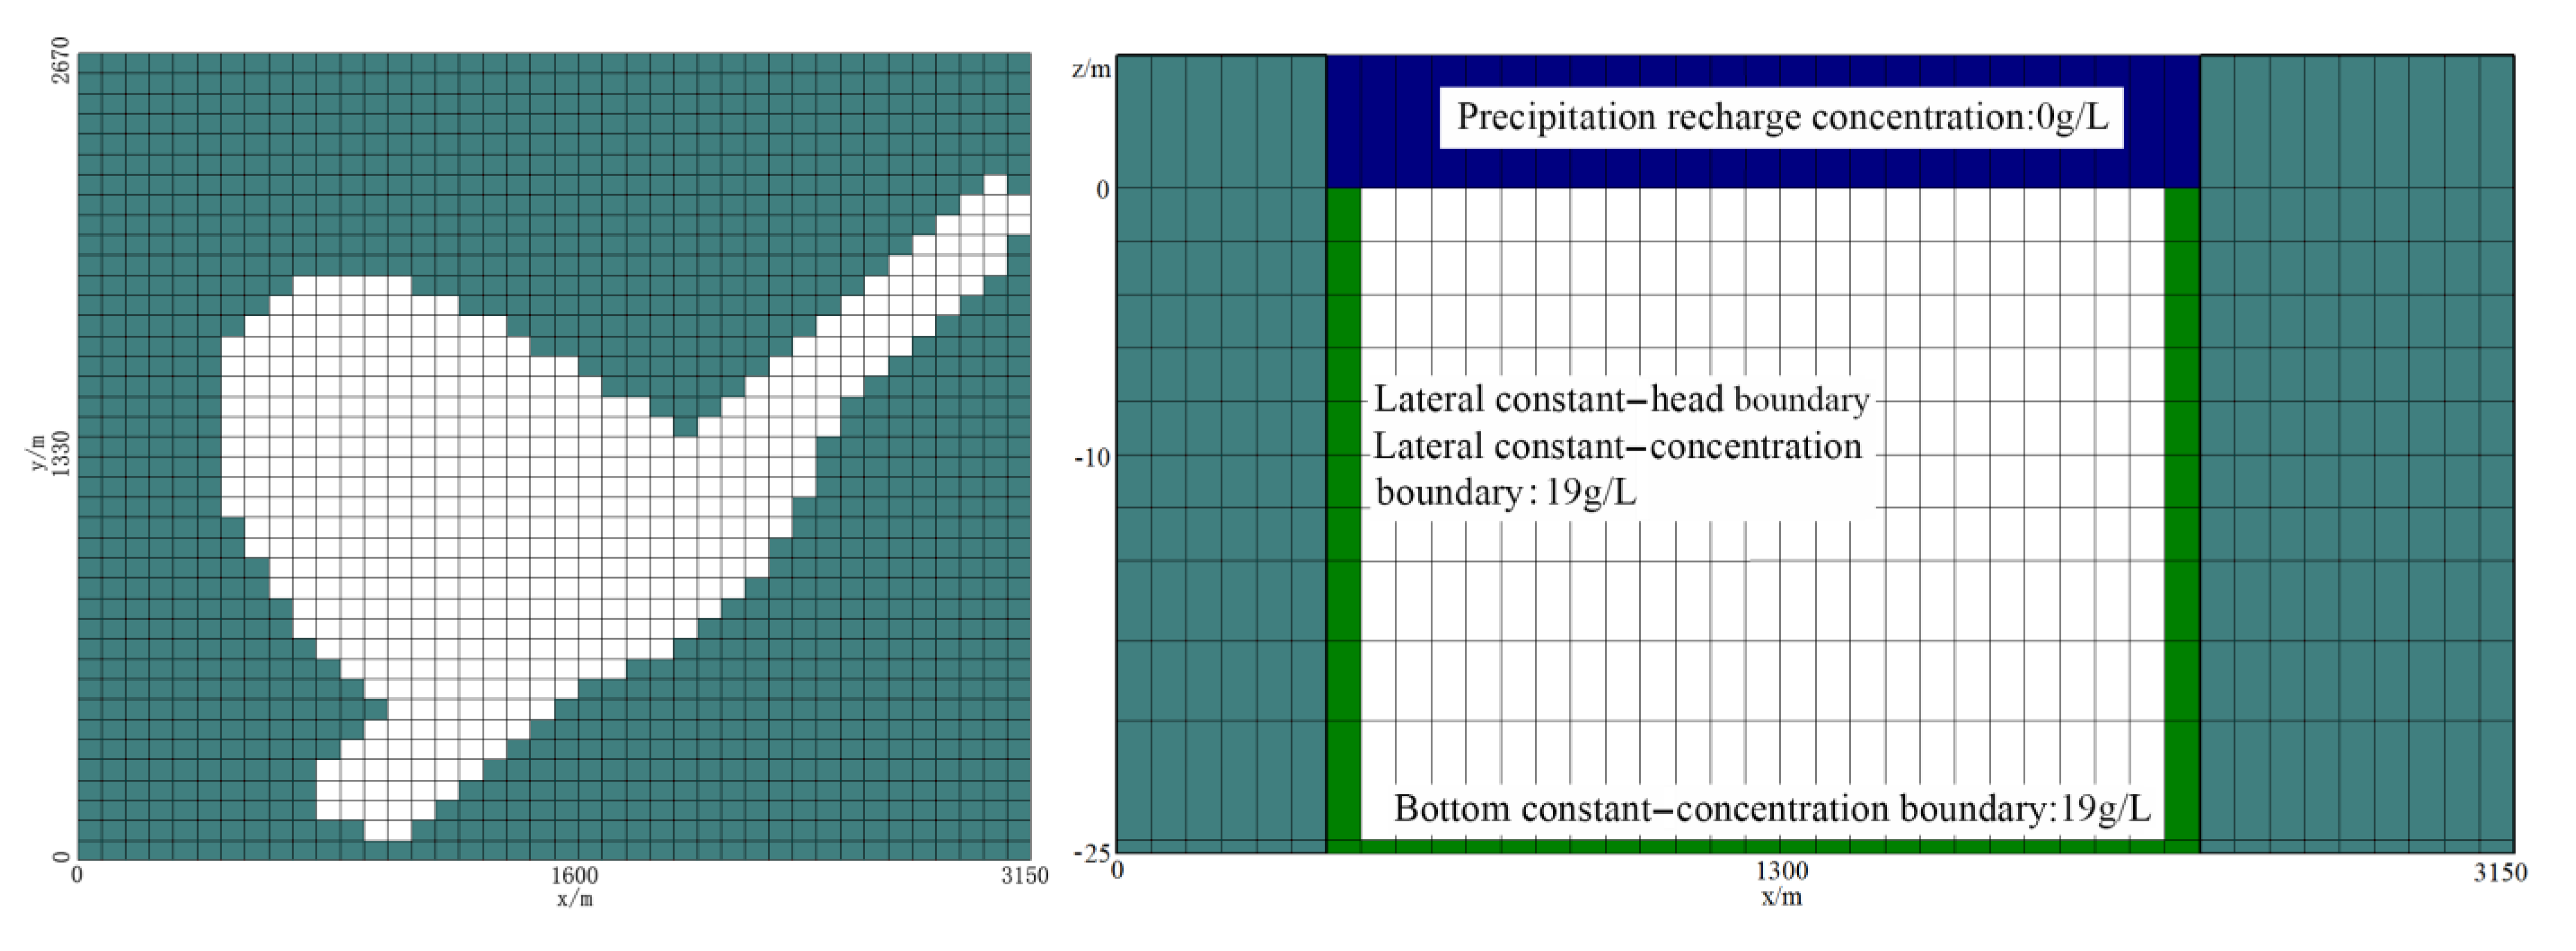
The basic model of the study area was established and discretized in space (Figure 2), obtaining a 3D model with the x-axis oriented to the east in the coordinate range 0–3150 m, the y-axis oriented to the north in the coordinate range 0–2670 m and the z-axis oriented to the upward in the coordinate range −25–5 m. The study region was discretized into 40 rows and 40 columns and divided vertically into 12 layers, with the part above sea level of 5 m being 1 layer, the part above HPU divided into 8 layers and the part below HPU divided into 3 layers. There were 19,200 grids in the model, of which 5460 were active. The model was also discretized in time; the basic model had a time step of days and a total simulation time of 50 years. The upper boundary of the model was a given flux recharge boundary and the recharge intensity was taken as the multi-year average monthly rainfall. The lateral boundary of the model was a constant head boundary, which represented the sea level around the island. Based on the previous literature [29], the parameters of the basic model were set (Table 1) as follows: the initial hydraulic conductivity (K1) was 50 m/d for the part above sea level; above the HPU, there was the Holocene stratigraphy, consisting of coral debris sand, with an initial hydraulic conductivity (K2) of 60 m/d; below the HPU, there was the Pleistocene stratigraphy composed of highly permeable coral reef limestone and well-developed caves, with an initial hydraulic conductivity (K3) of 500 m/d. The porosity of the three media was set at 0.3, 0.32 and 0.35, respectively, while the specific yield was 0.15 and the specific storage (Ss) was 10−5 m−1.
The model was calibrated and validated. The validation results for the groundwater level and the freshwater lens thickness are shown in the Supplementary Materials.
4. Results
4.1. Formation of Freshwater Lens under Natural Conditions
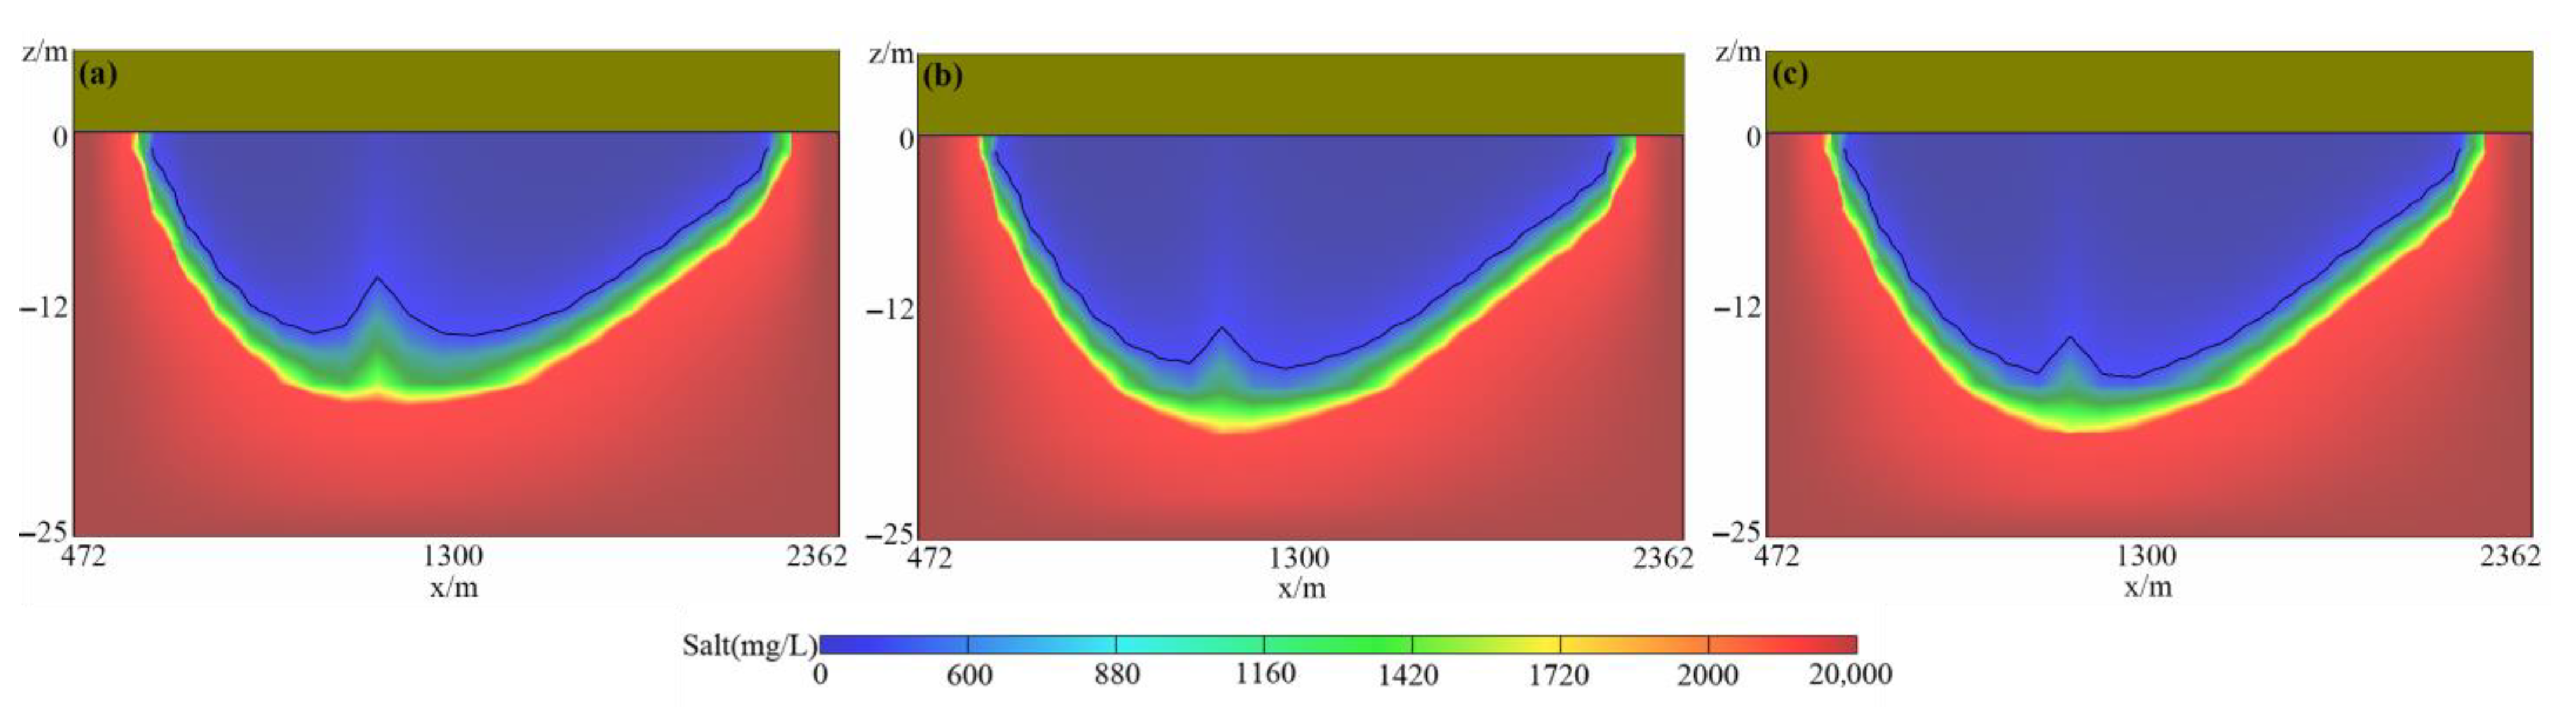
According to the drinking water standards set by the World Health Organization (WHO), the chloride (Cl−) ion concentration should not exceed 600 mg/L. Therefore, the chloride (Cl−) concentration contour of 600 mg/L was chosen as the division between available freshwater resources and saltwater. The formula for calculating the volume of freshwater lens is shown below.
where s is the area of each grid in the model (m2) and hf,i,j is the thickness of the freshwater lens corresponding to grid (i,j) (m).
The simulation results show that the freshwater lens would begin to develop after the salinity of the original groundwater under the island is washed and diluted, which takes about 4–5 years. Figure 3 shows the morphological changes in the freshwater lens in sections at about 10 years, 20 years and 50 years, which indicates that the thickness of the freshwater lens would increase over time, with an overall morphological characteristic of “thick in the middle and thin at the edge”. The central maximum thickness of the freshwater lens would be shifted towards the west, due to the fact that the west side of the study island has a larger north–south span and receives a wider range of rainfall infiltration recharge, while the east side is narrower.
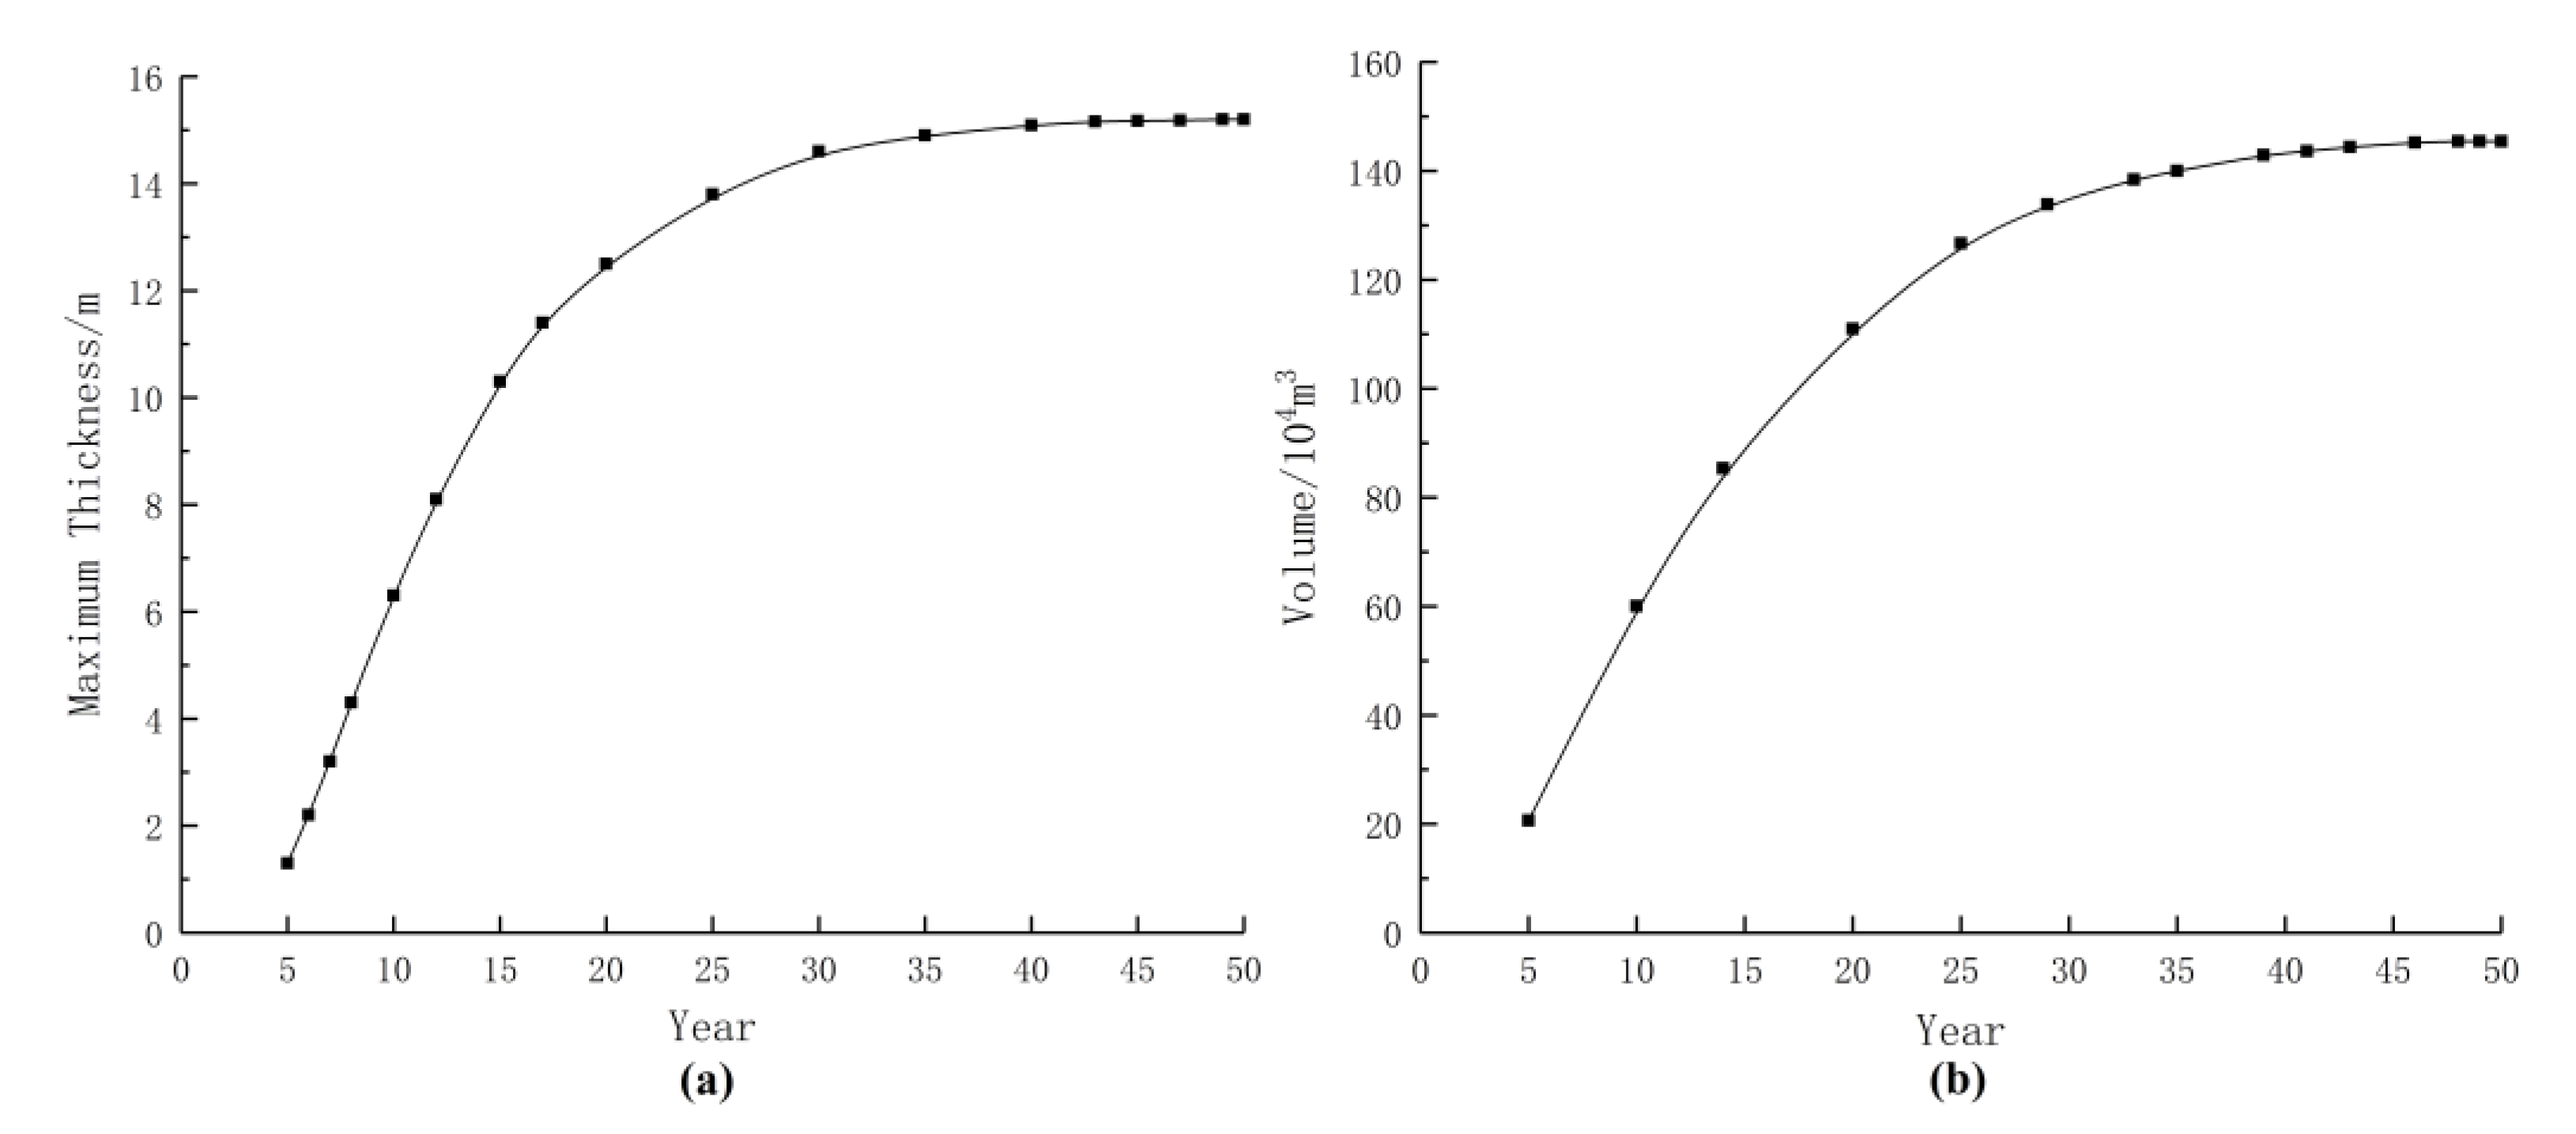
Figure 4 shows the curves of the maximum thickness (a) and volume (b) of the freshwater lens as a function of time. Both curves follow the same trend, with the growth rate increasing rapidly at the beginning of the formation of the freshwater lens, slowing down after about 10 years and reaching stability at about 45 years, with the maximum thickness and volume of the freshwater lens getting close to 15.2 m and 145.4 × 10⁴ m³, respectively. The simulation results of the basic model are similar to those of Zhou and Fang [30].
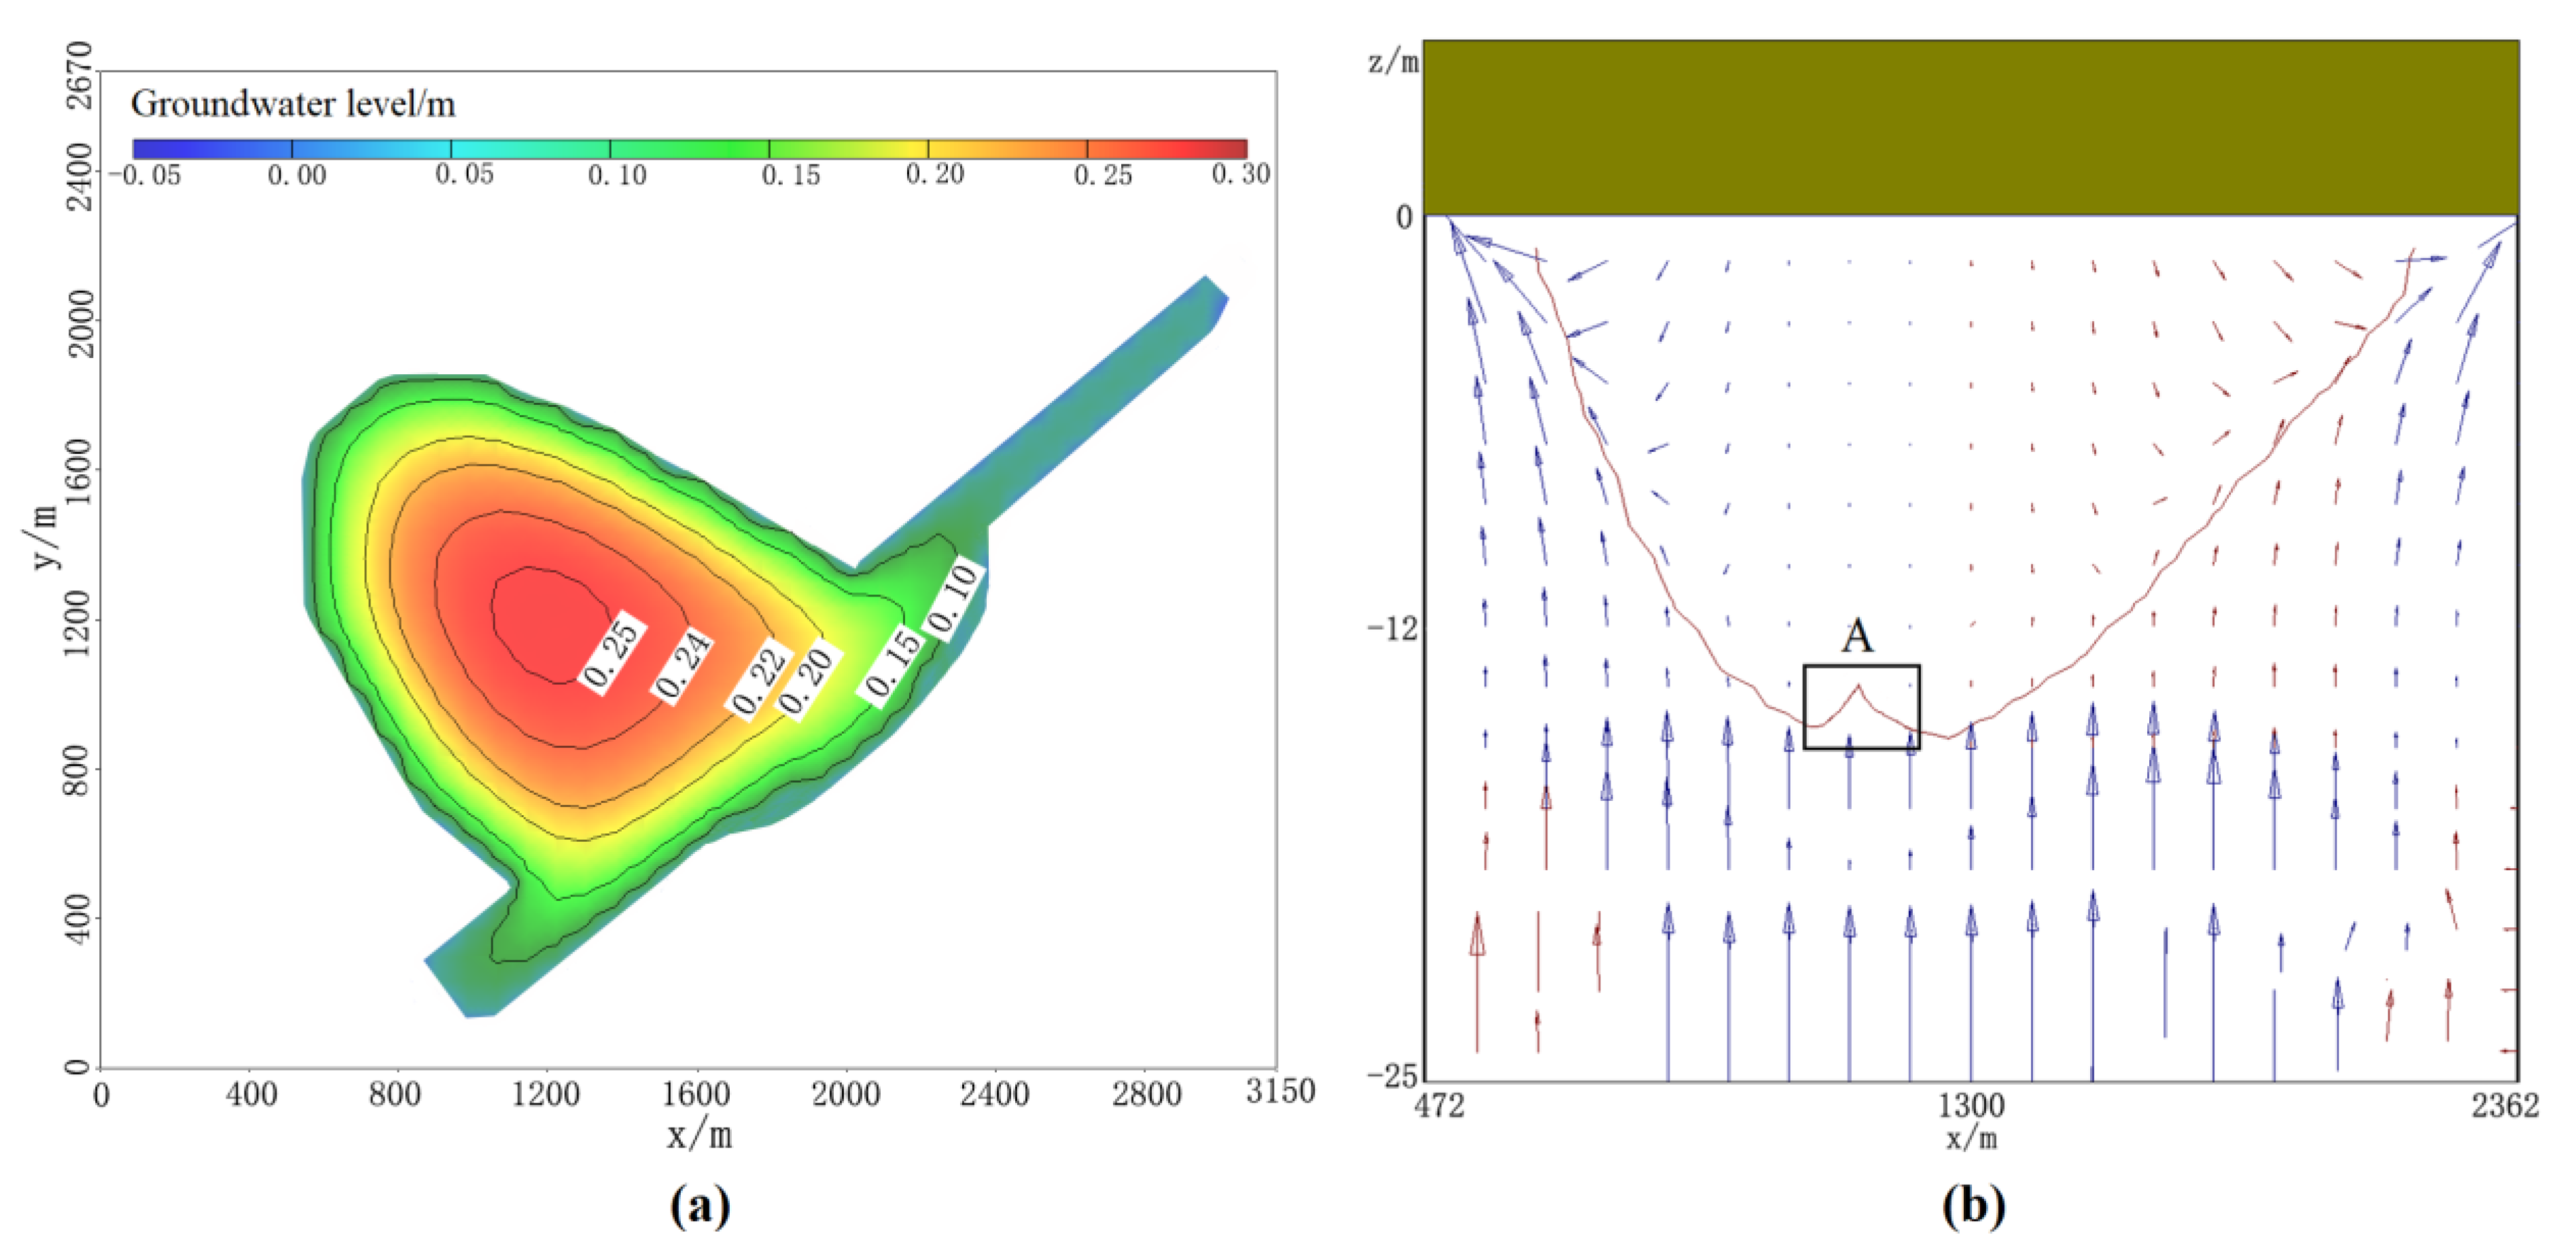
At the steady state, the water head distribution above sea level of the island and the groundwater flow rate are shown in Figure 5. It can be seen, from the Figure 5a, that the water head distribution presents the morphological characteristics of “high in the middle and low around”, forming a hydraulic gradient from the center to the periphery, which can ensure that the freshwater is continuously discharged into the sea from the thickest part of the lens body. The maximum water head, in the center of the island, can reach 0.252 m a.s.l. and the water head on the west side of the island is relatively high due to the larger recharge area. The water within the freshwater lens flows from the center of island to the sea, due to the density difference between seawater and freshwater, the seawater moves upwards to ‘lift’ the freshwater lens and float it within the island, leaving the whole groundwater system of the island in a dynamic equilibrium. The center of the freshwater lens has the lowest flow velocity, forming a stagnant zone (area A), and the closer it is to the boundary of the lens, the greater the flow velocity is. Therefore, due to the density difference between seawater and fresh water, the fresh water in the central part of the lens is more affected by buoyancy and the geometric boundary bulges upward [31].
4.2. The Effect of Island Reclamation on Freshwater Lens
The main part of the island was formed in a natural state. Since the 1990s, the island reclamation project has been gradually carried out and part of the artificial island was formed next to the main island; therefore, compared with other islands, this study island has greater research value. The material used for the reclamation part is the original coral sand medium of the island, so the media parameters of the new island in the model setup remain the same as those of the original island and the total area of the island has been increased by approximately 40%. The specific operation in the model is setting the inactive cells in the newly added area as active state and the final stable state of the basic model was used as the initial state of the model after island reclamation, with a run time of 30 years.
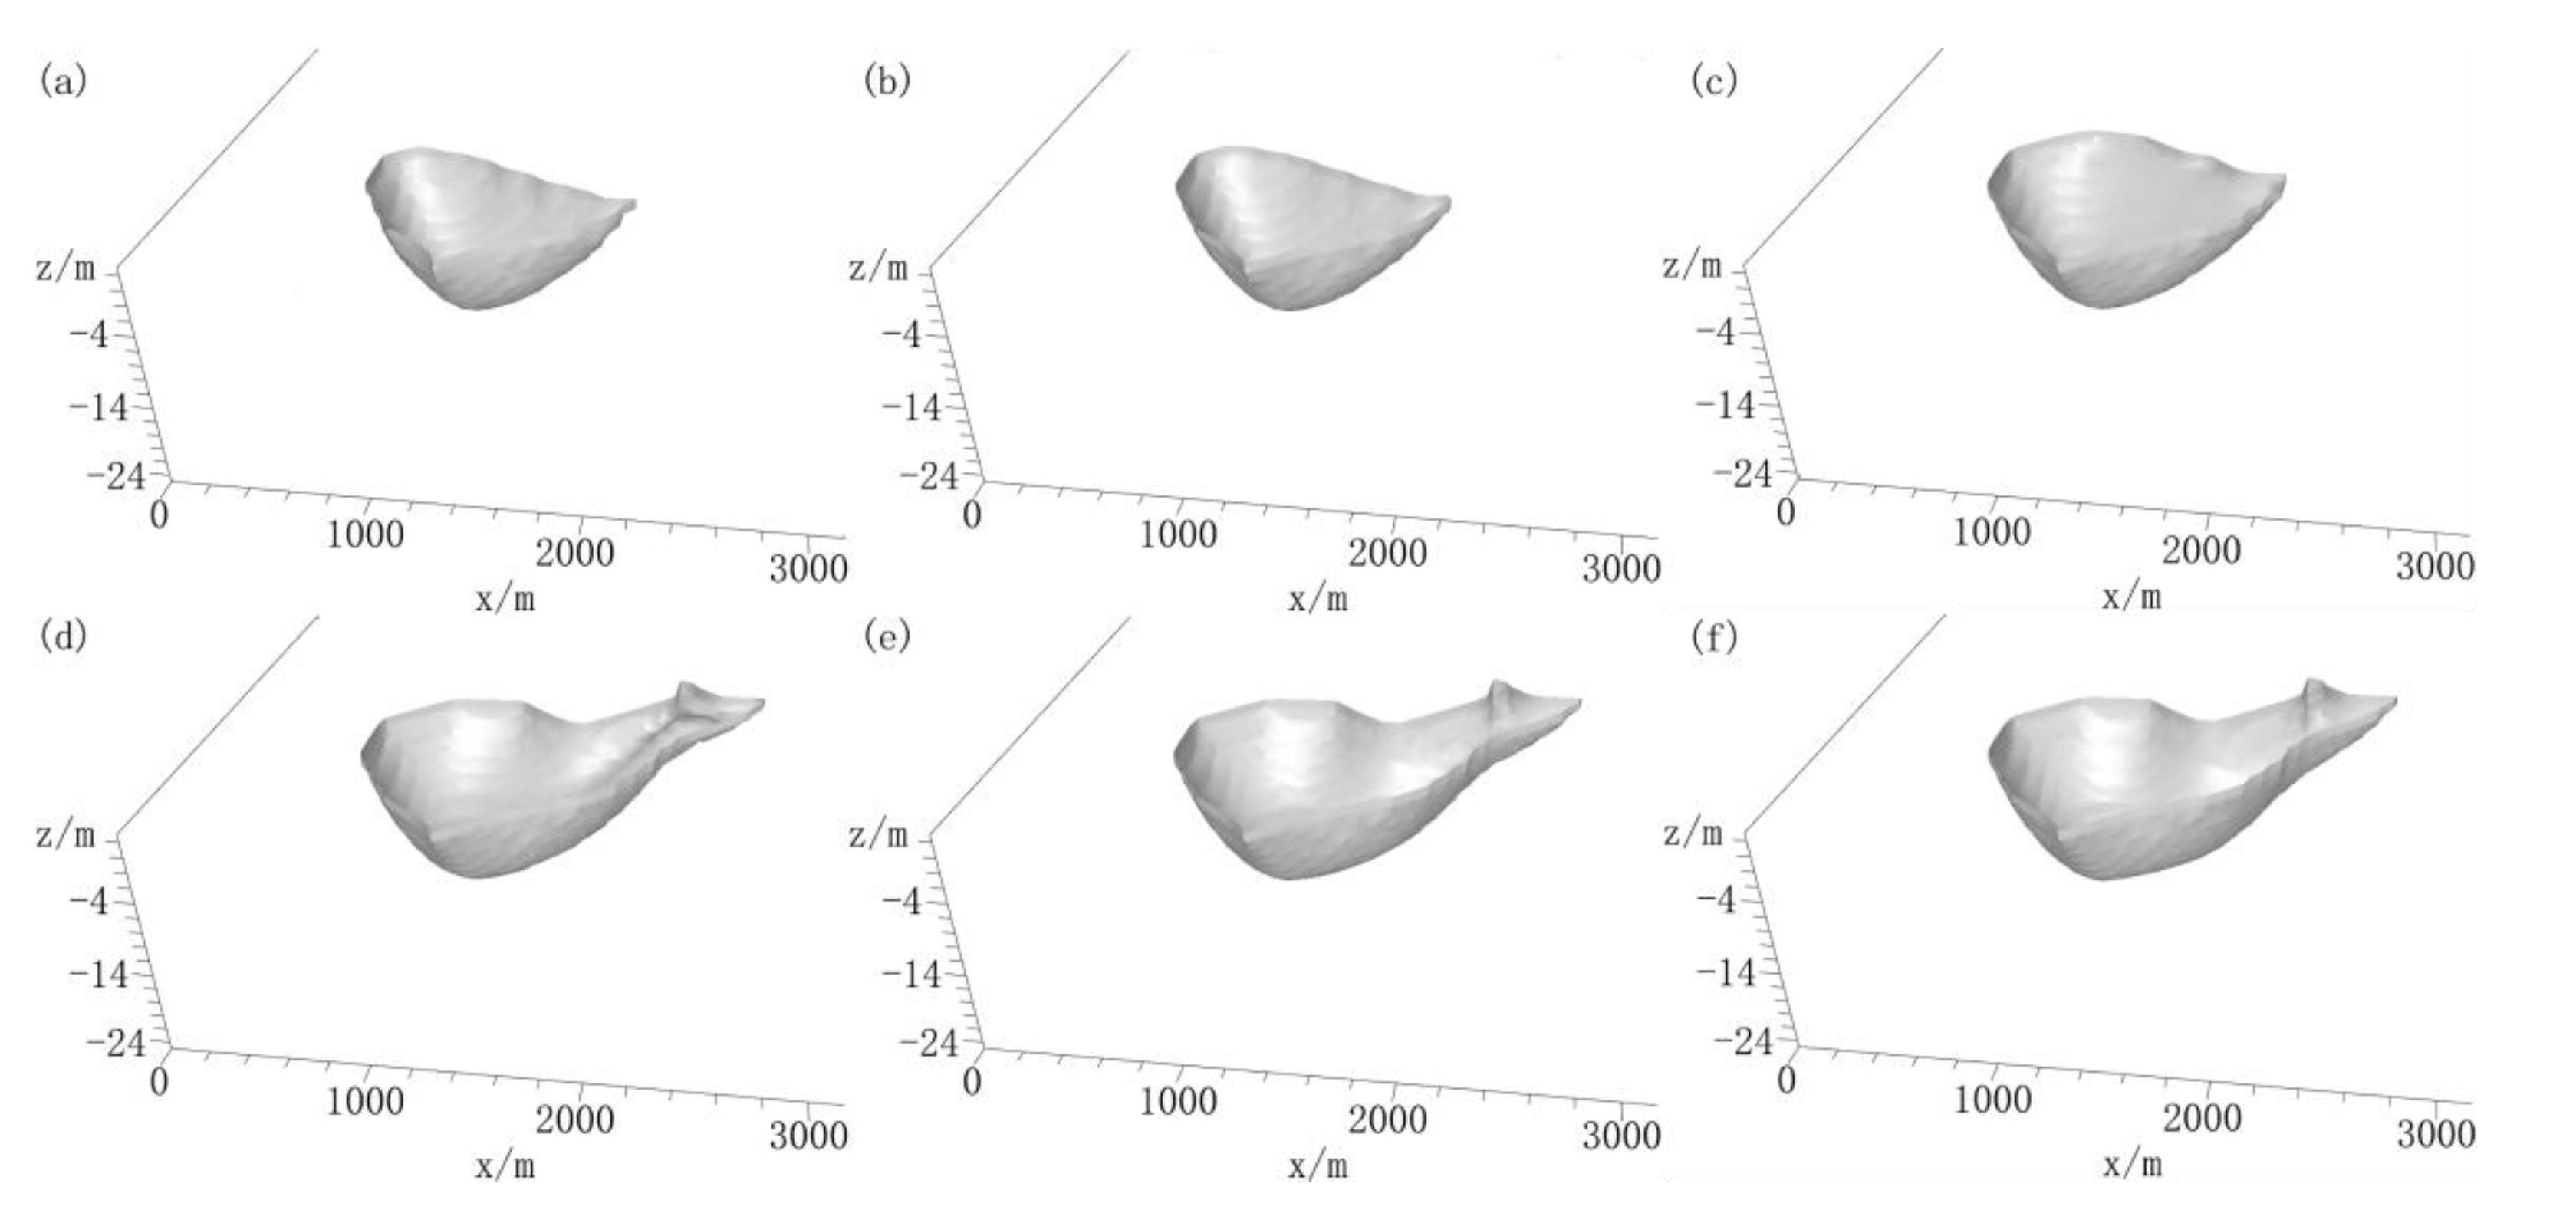
The evolution of the freshwater lens over time after reclamation is shown in Figure 6. Over a period of five years, no obvious freshwater lens would form in the subsurface of the new island, while the thickness and extent of the freshwater lens in the original island would increase. During this time, the saltwater in the subsurface of the new island would be continuously desalinated due to the infiltration of rainfall, laying the foundation for the subsequent formation of freshwater lenses. After about 25 years, the model would reach a stable state again, with the maximum thickness of the freshwater lens reaching 9.5 m on the new part of island and the thickness of the freshwater lens increasing to 16.6 m on the original island. The main reason for this is that the additional part of the island is smaller and receives less precipitation recharge, while the width is only 680 m; therefore, the freshwater infiltrating into the subsurface rapidly drains away around the lens. Therefore, the overall freshwater lens is asymmetric, with the southwest side thicker than the northeast side.
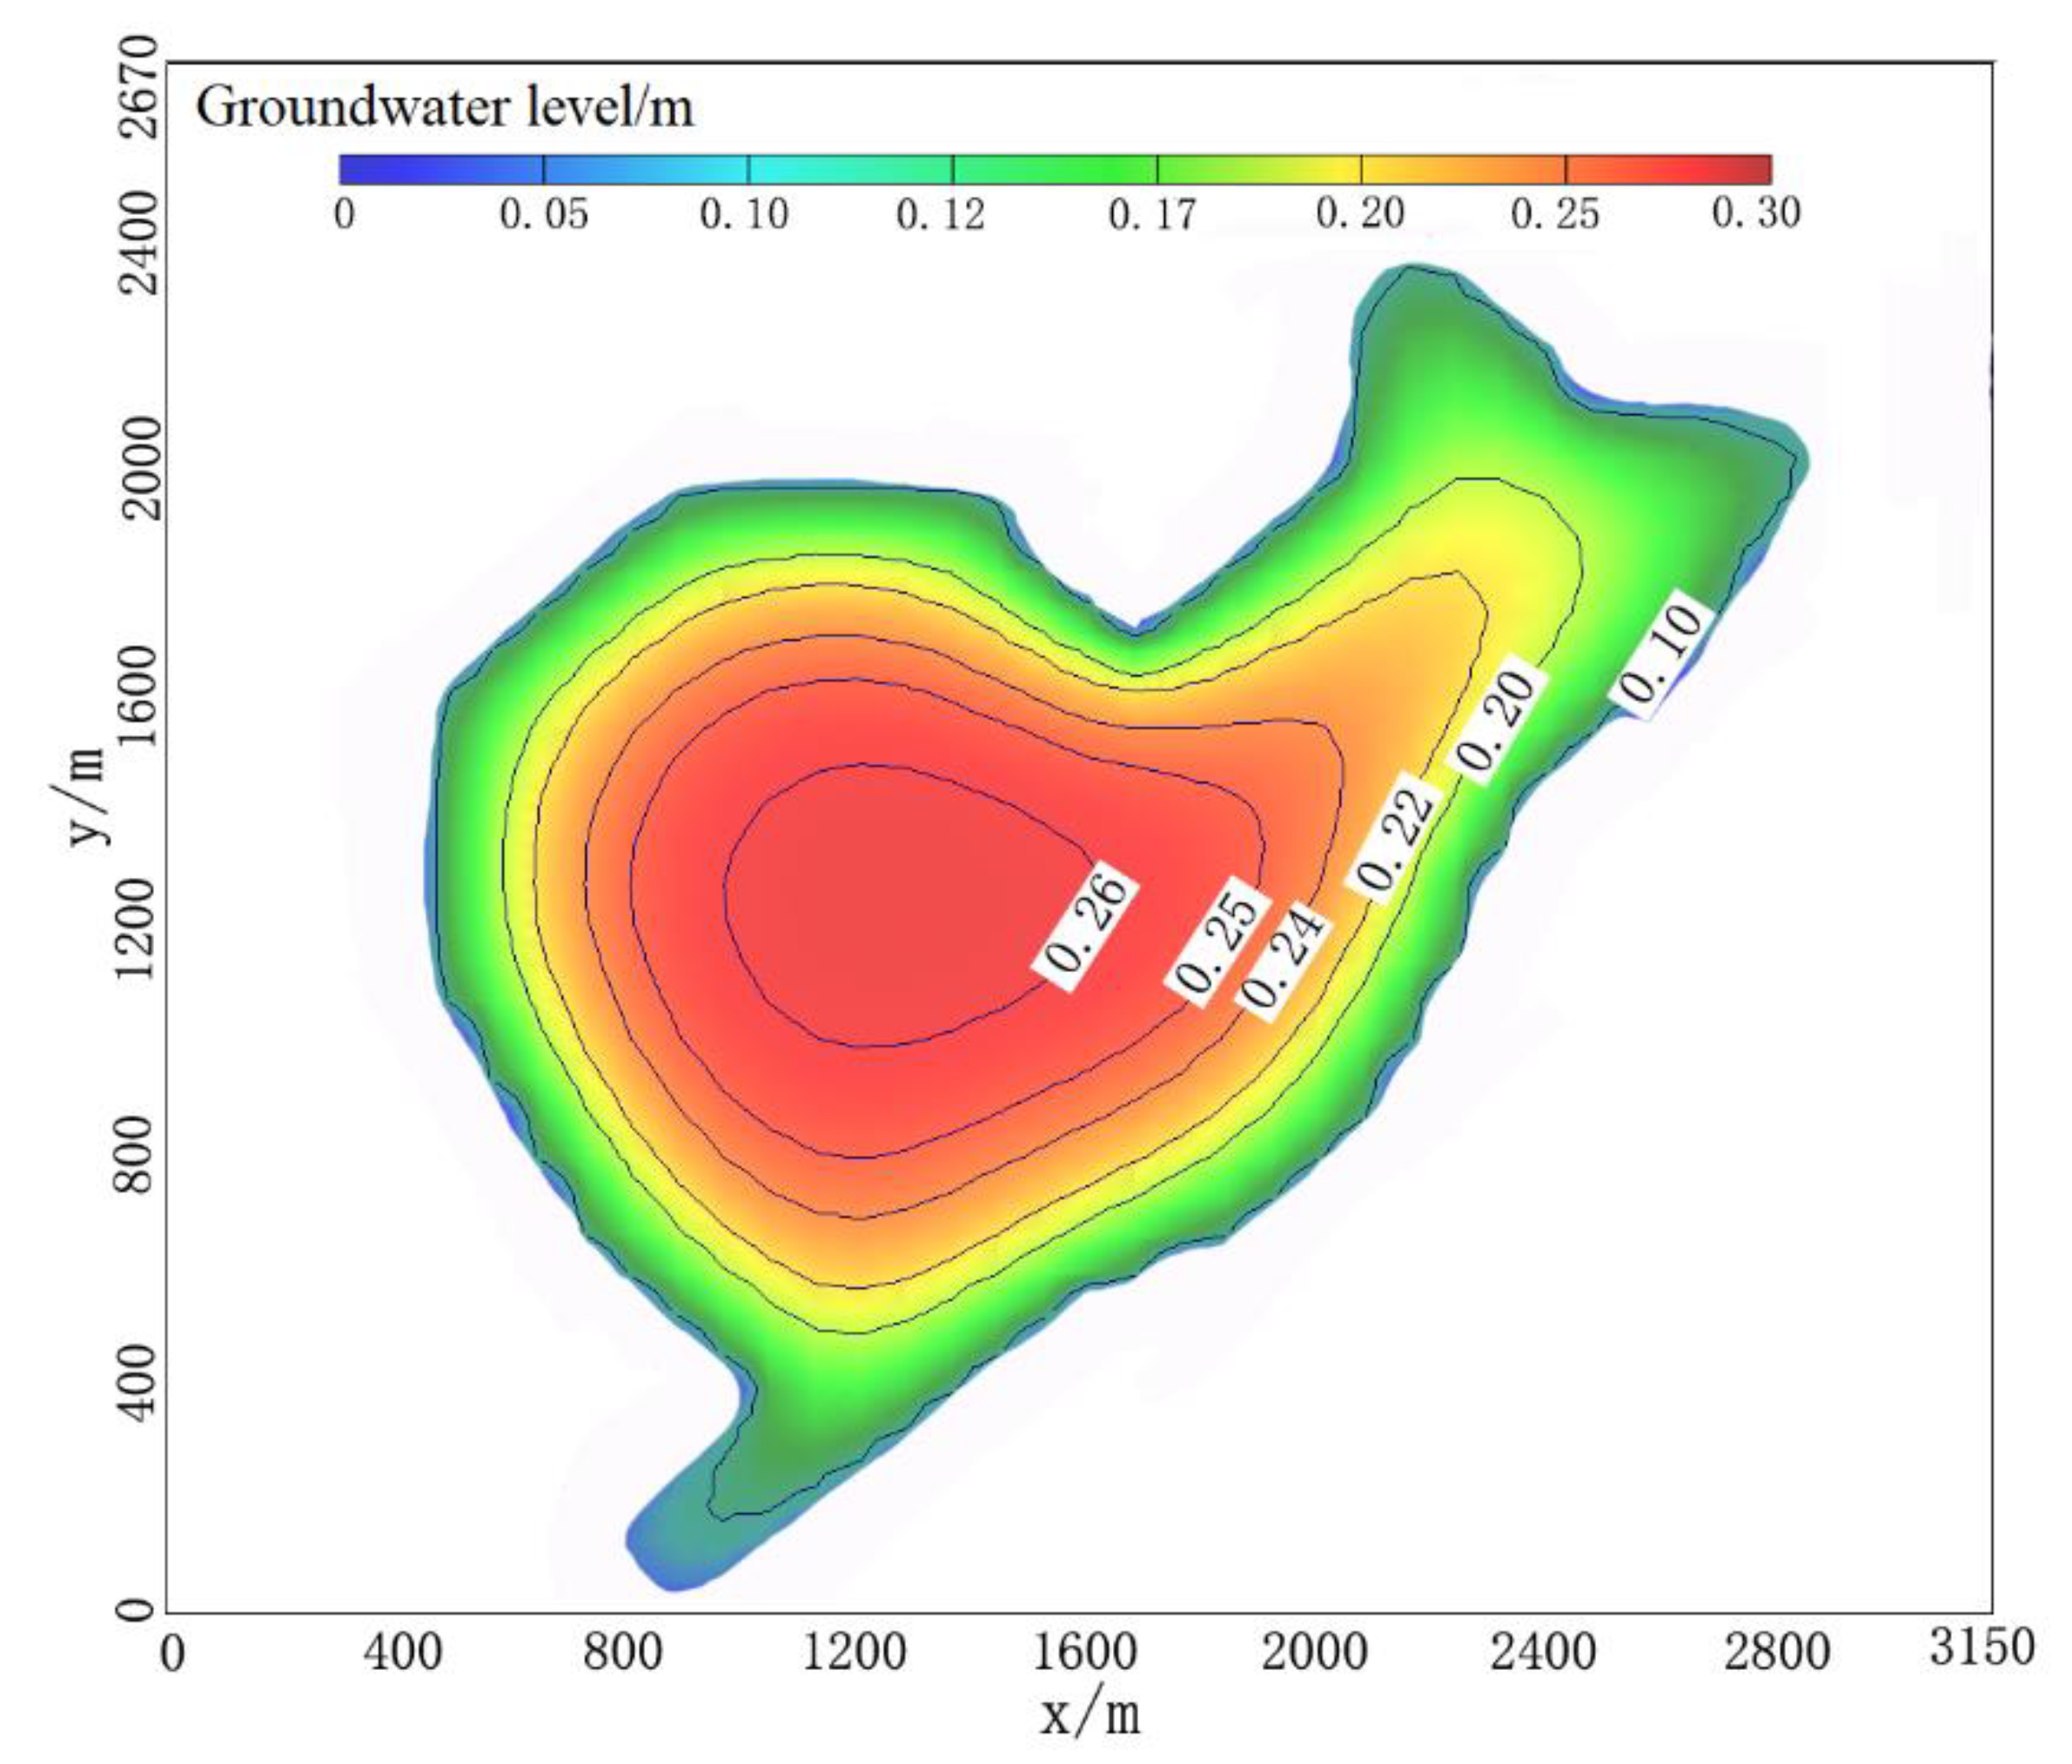
Figure 7 shows the head distribution above sea level of the island when the model becomes stable again. This suggests that, compared to the head distribution of the original island (Figure 5a), the head values after reclamation would become larger and the maximum value of the head at the center of the island would exceed 0.26 m, which is 0.01 m higher than the maximum head before island reclamation. The calculation result shows that the volume of freshwater lens would increase to 323.67 × 10⁴ m³. The newly added fresh water would mainly come from the newly formed freshwater lens on the northeast side and the increase in the thickness of the freshwater lens on the original island would also correspondingly increase the freshwater storage. The previous research studies did not consider the reclaimed part in the numerical simulation calculation of the island, which would underestimate the calculated thickness, volume and groundwater level of the freshwater lens, so the results of this study are more consistent with the semi-natural and semi-man-made situation of the island.
4.3. Effect of Impermeable Surfaces on the Freshwater Lens
4.3.1. Effect of Different Locations of Impermeable Surface
The land-use changes on the study island include a decrease in the area of woodland, grassland and bare land and an increase in the area of buildings and roads [31]. The development and utilization of the island started mainly on southwest side and the bare land on the reclaimed northeast part of the island was gradually covered by buildings during construction. The central part of the island is mostly woodland, which is more difficult to develop than grassland and bare land and is not yet fully developed.
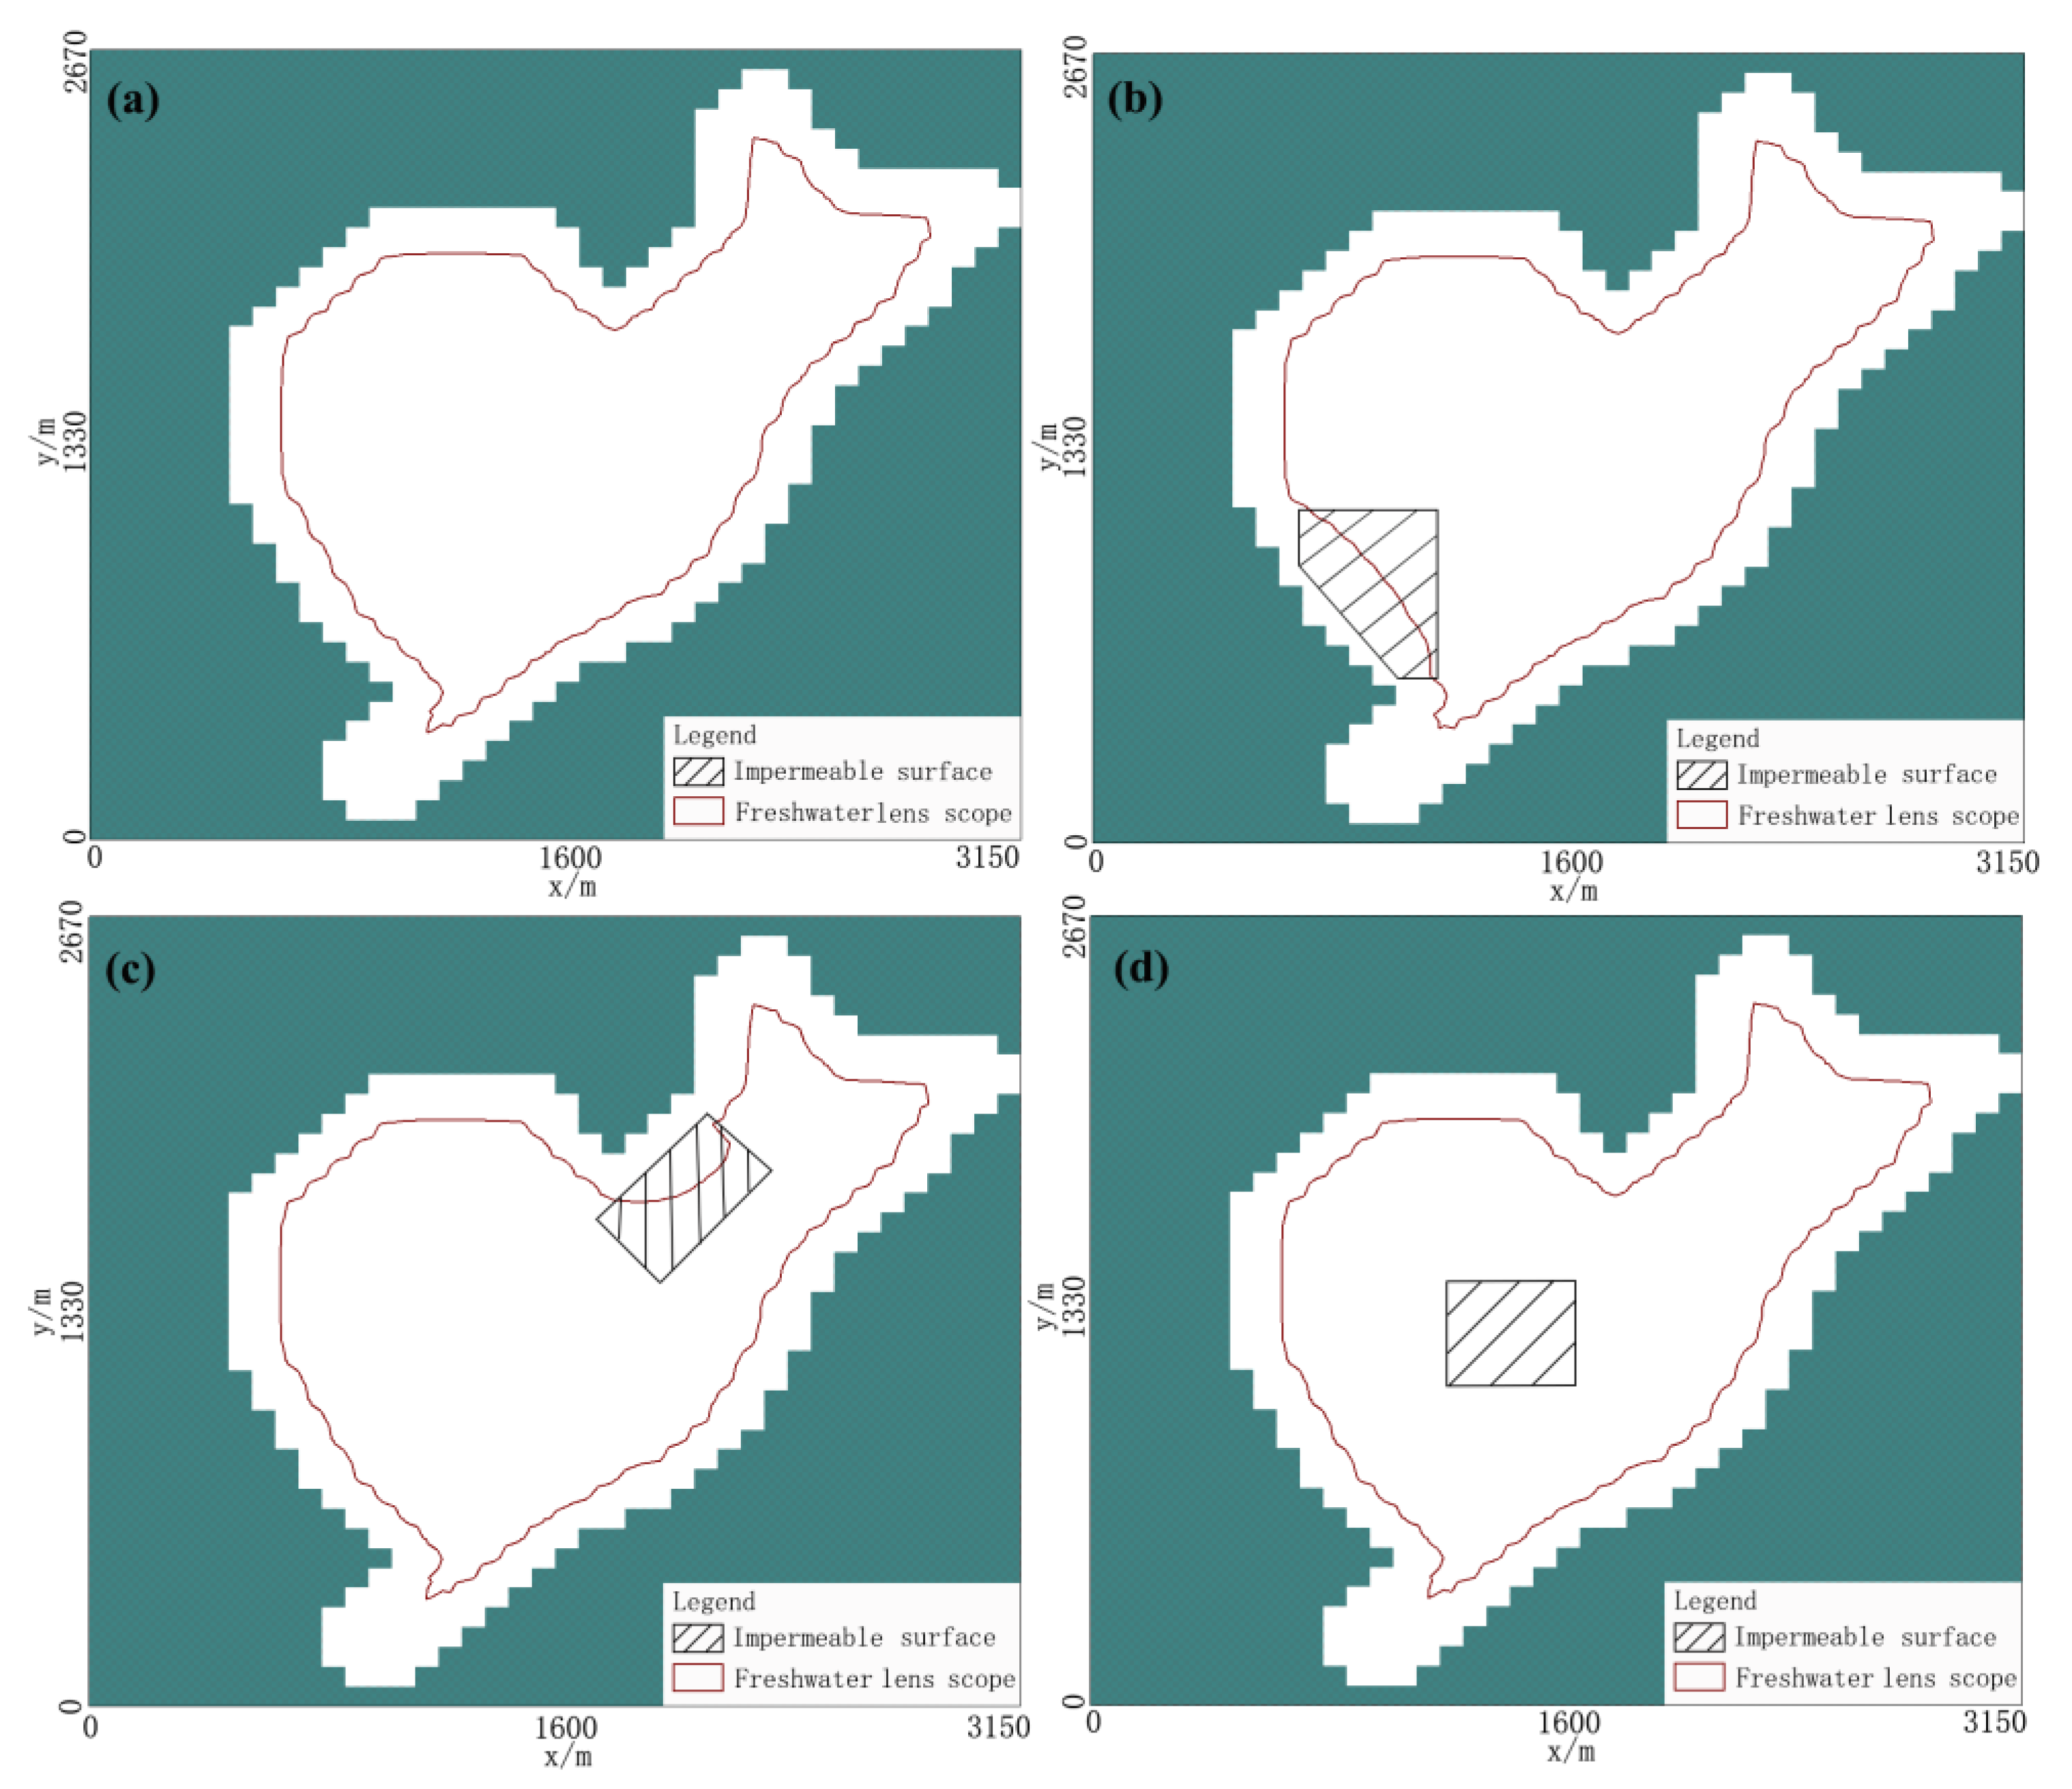
The change in the underlying surface of the island increases the surface impermeability and destroys the relatively stable recharge and discharge state of the island groundwater resources. Therefore, in order to explore the influence of the impermeable surface on the freshwater lens in different positions of the island, three simulation scenarios were created, setting the impermeable surfaces in the southwest, northeast and middle of the island (Figure 8). In order not to be disturbed by other factors, the impermeable surface area was ensured to be comparable for all three scenarios, occupying 36 grids, with an area of 0.19 km2. The results of the model, which reached the stable state again after reclamation, were taken as the initial conditions of the three simulation scenarios for re-simulation.
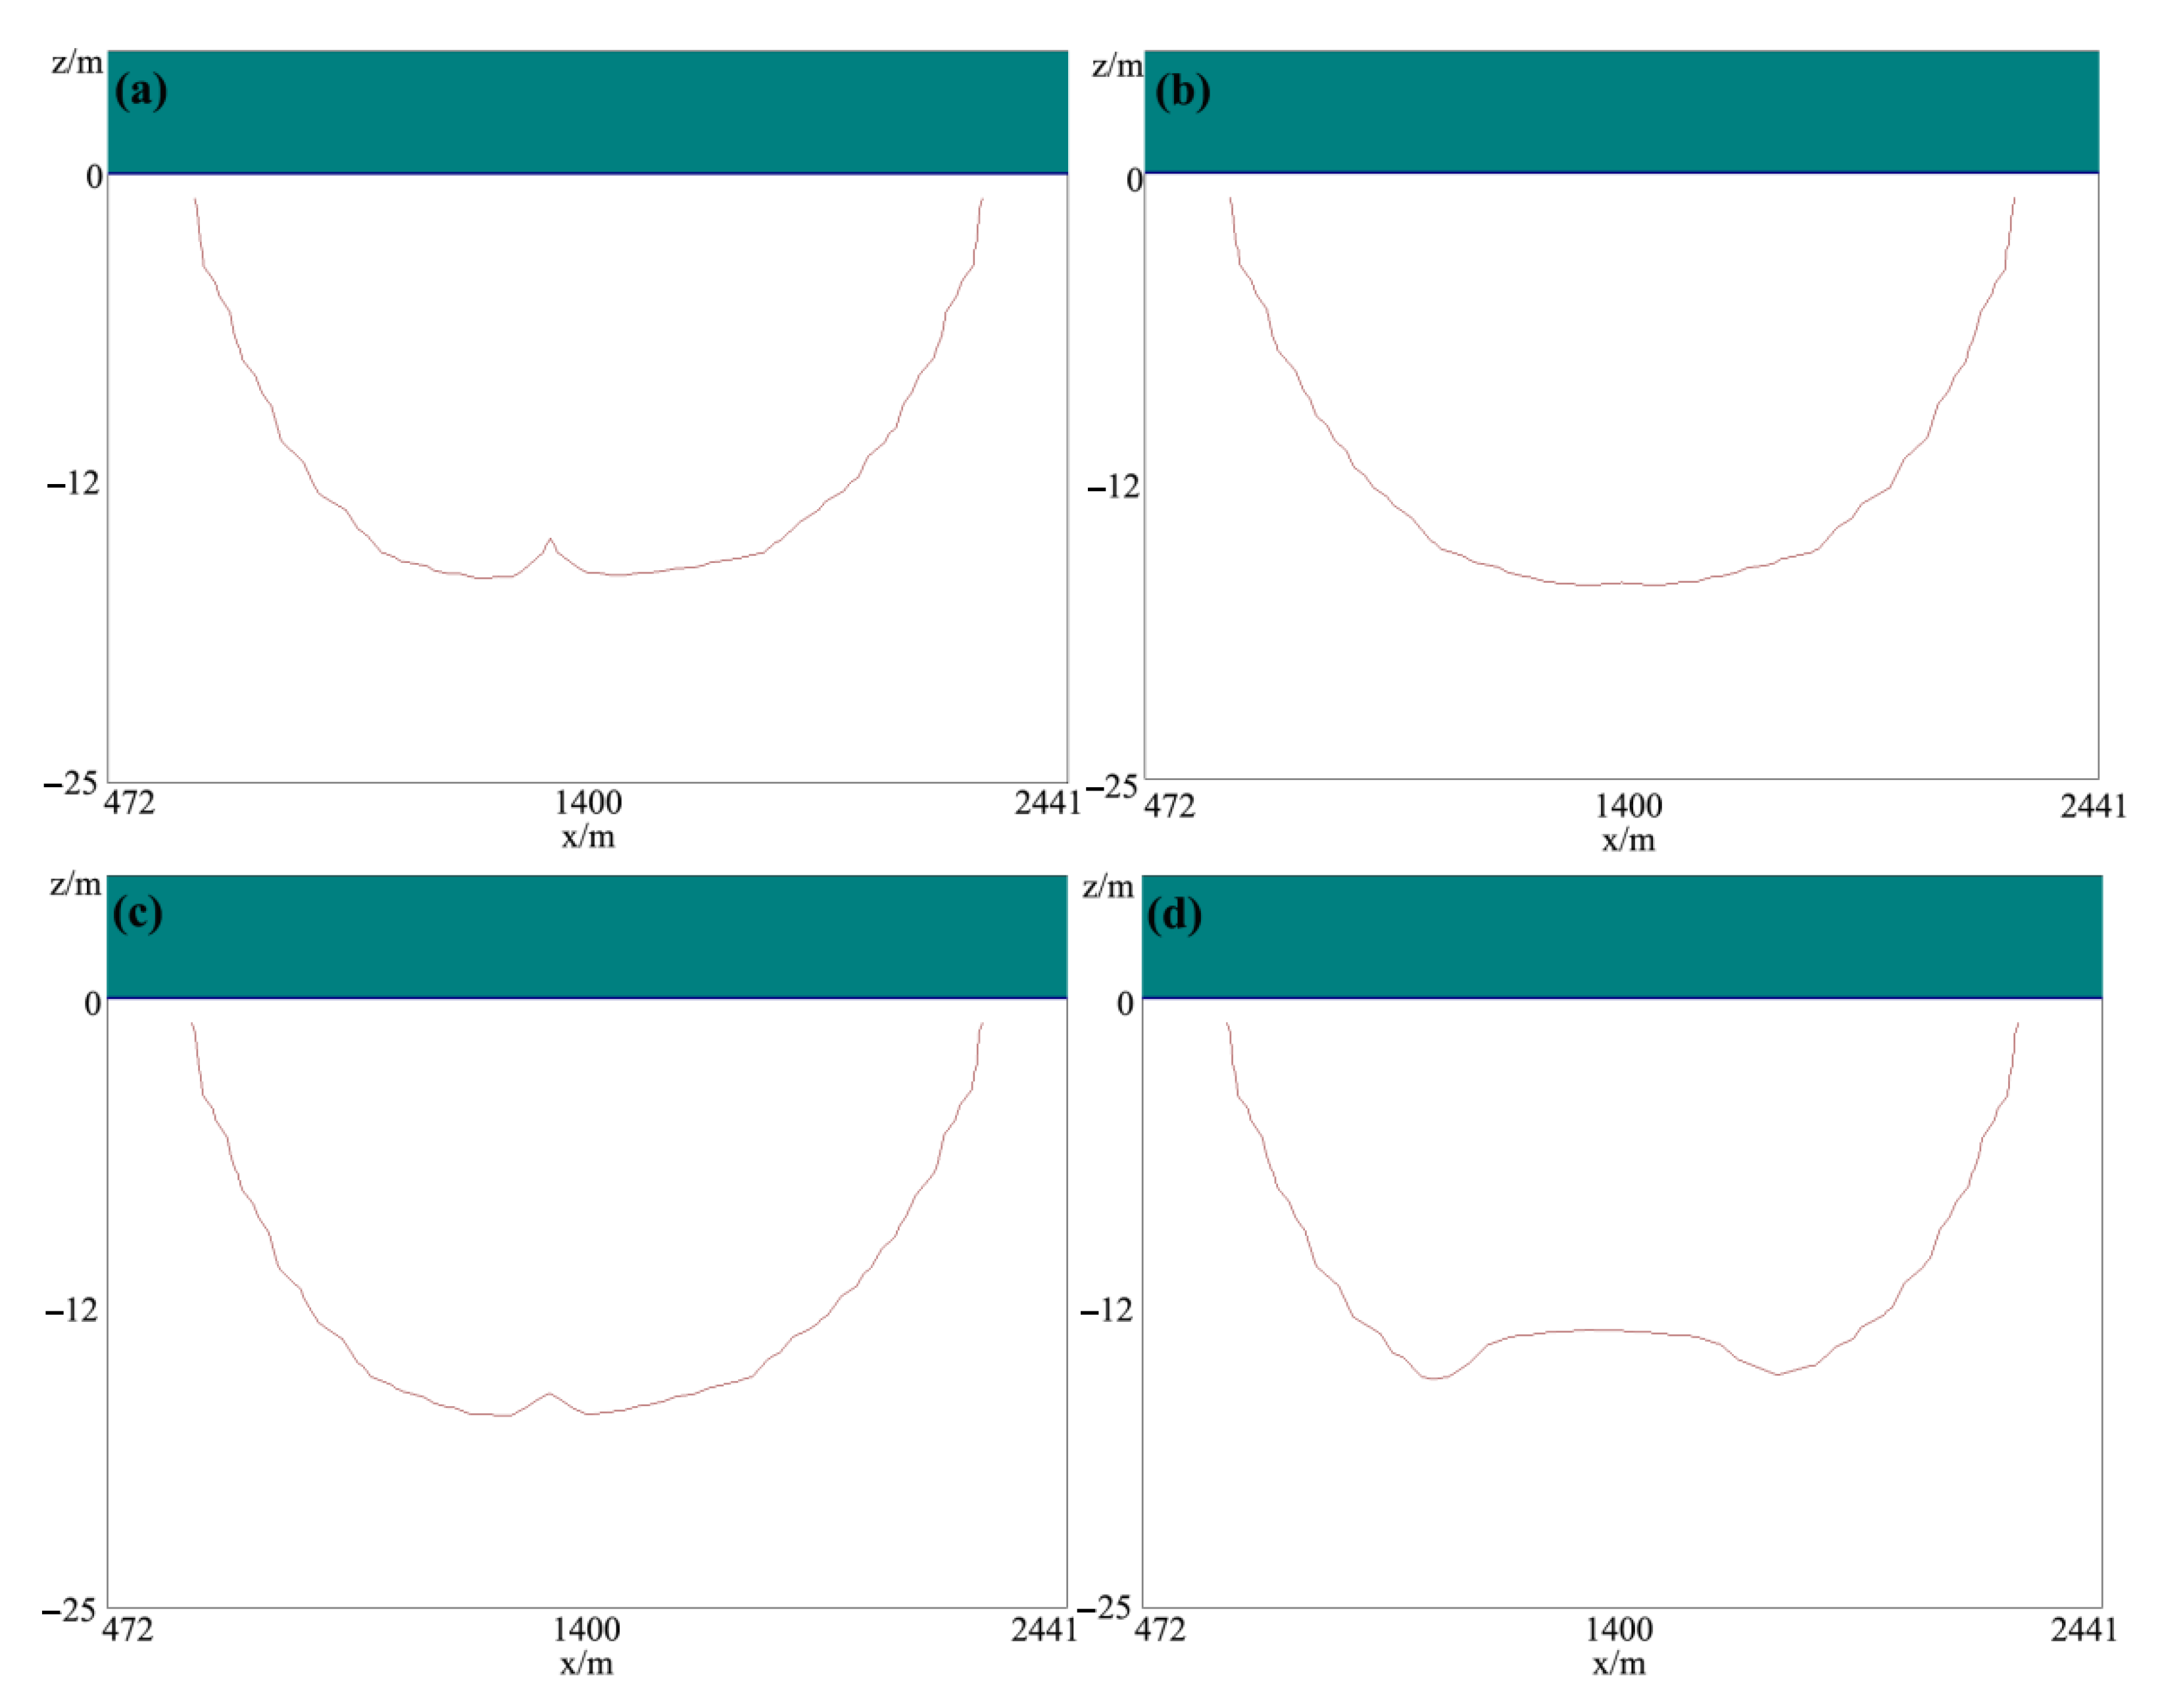
Figure 8 shows the scope of the freshwater lens on the island for different scenarios and it can be seen that the scope of the freshwater lens would extend to the edge of the island with a long distance of 100 m. Re-running the model after setting the impermeable surface, the model would reach stability again after approximately 15 years. As shown in Figure 8b,c, freshwater lenses would almost not change in size with the impermeable surface set on the southwest and northeast sides of the island, whereas the outline of freshwater lenses on the island covered by the impermeable surface would be concave inward. The volume of the freshwater lens would reduce to 308.1 × 10⁴ m³ and 306.2 × 10⁴ m³, respectively, on the southwest side of the island, a decrease of 4.82% and 5.41% compared to the original.
Figure 8d shows that the scope of the freshwater lens would remain almost unchanged after setting the impermeable surface in the middle of the island; therefore, row 21 of the model was selected to observe the change in the profile of the freshwater lens (Figure 9). Figure 9b,c manifest that setting impermeable surfaces on the southwest or northeast side of the island would have almost no effect on the thickness of the freshwater lens and the maximum thickness of the freshwater lens would even increase slightly. Figure 9d shows that, after setting impermeable surfaces in the center of the island, the bottom profile of the freshwater lens would bulge upwards in a trapezoidal shape, the maximum thickness would reduce to 13.7 m and the volume of the freshwater lens would reduce to 314.5 × 10⁴ m³, a decrease of 2.8% compared to the original.
To sum up, the same area of impermeable surface at different locations of the island would have different effects on the freshwater lens. The volumes of freshwater lens under the three scenarios are shown in Table 2; the reduction in volume, in order from the largest to the smallest, is Scenario B (northeast side), Scenario A (southwest side) and Scenario C (central). That is, urbanization on the margin of the island would make the seawater intrusion more serious, resulting in a greater reduction in freshwater resources underground.
In this study, the impermeable surface was set as a water barrier and many cities are currently using ecological permeable concrete to pave roads. In the model conceptualization of realistic issues, different hydraulic conductivities can be set according to the permeability of different areas to simulate the evolution of freshwater lenses. Due to the change in precipitation recharge capacity in different regions, the thickness of the freshwater lens also changes accordingly. Therefore, in the development and utilization of water resources in specific island areas, selecting the appropriate location of groundwater extraction is a complex work, which needs targeted analyses.
4.3.2. Effect of Impermeable Surface Area
Once destroyed, freshwater lenses experience difficulty in recovering under natural conditions and the recovery time can be several years or even decades [32]. Thus, groundwater extraction is not appropriate when the thickness or volume of the freshwater lens is small. Precipitation infiltration recharge is the main factor affecting the volume and thickness of freshwater lenses and the different areas of impervious surface affect the infiltration capacity. From the previous study, it is clear that the existence of impermeable surfaces in the middle of the island has the least effect on the freshwater lens; therefore, in this section, the different impermeable surface areas in the middle of the island is chosen and their effect on the freshwater lens is analyzed.
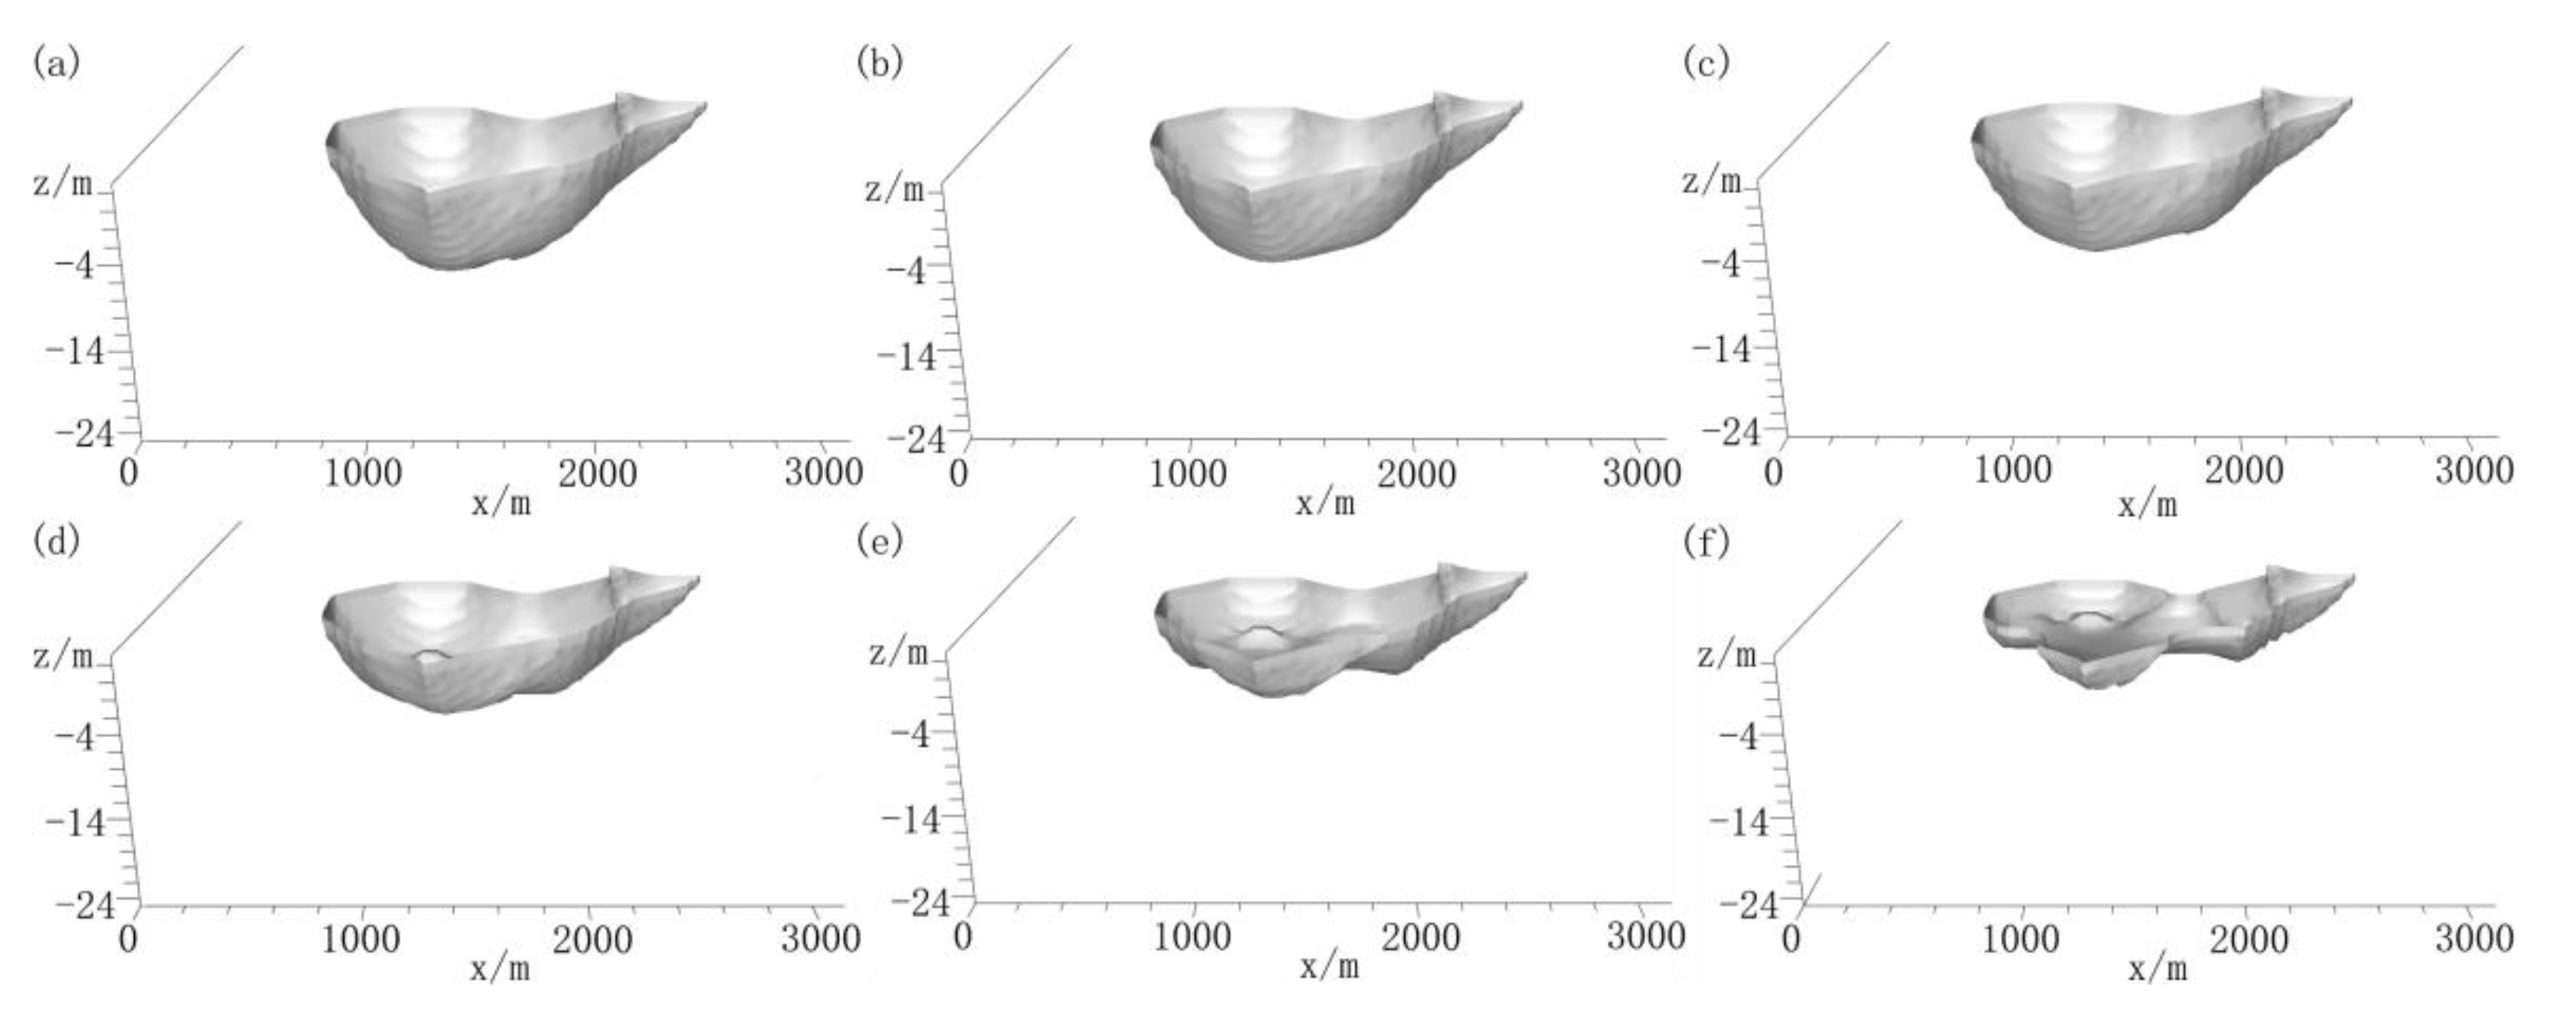
Different impermeable surface areas were set in the model and the number of occupied profile grids were 16, 36, 64, 100, 144 and 196, with areas of 0.084, 0.189, 0.336, 0.525, 0.756 and 1.029 km2, respectively, as shown in Figure 10a–f. Moreover, the model results in the steady state after reclamation of the island were used as the initial condition input model. It can be seen, from Figure 10, that the volume of the freshwater lens would gradually decrease in thickness with the increase in the impermeable surface area.
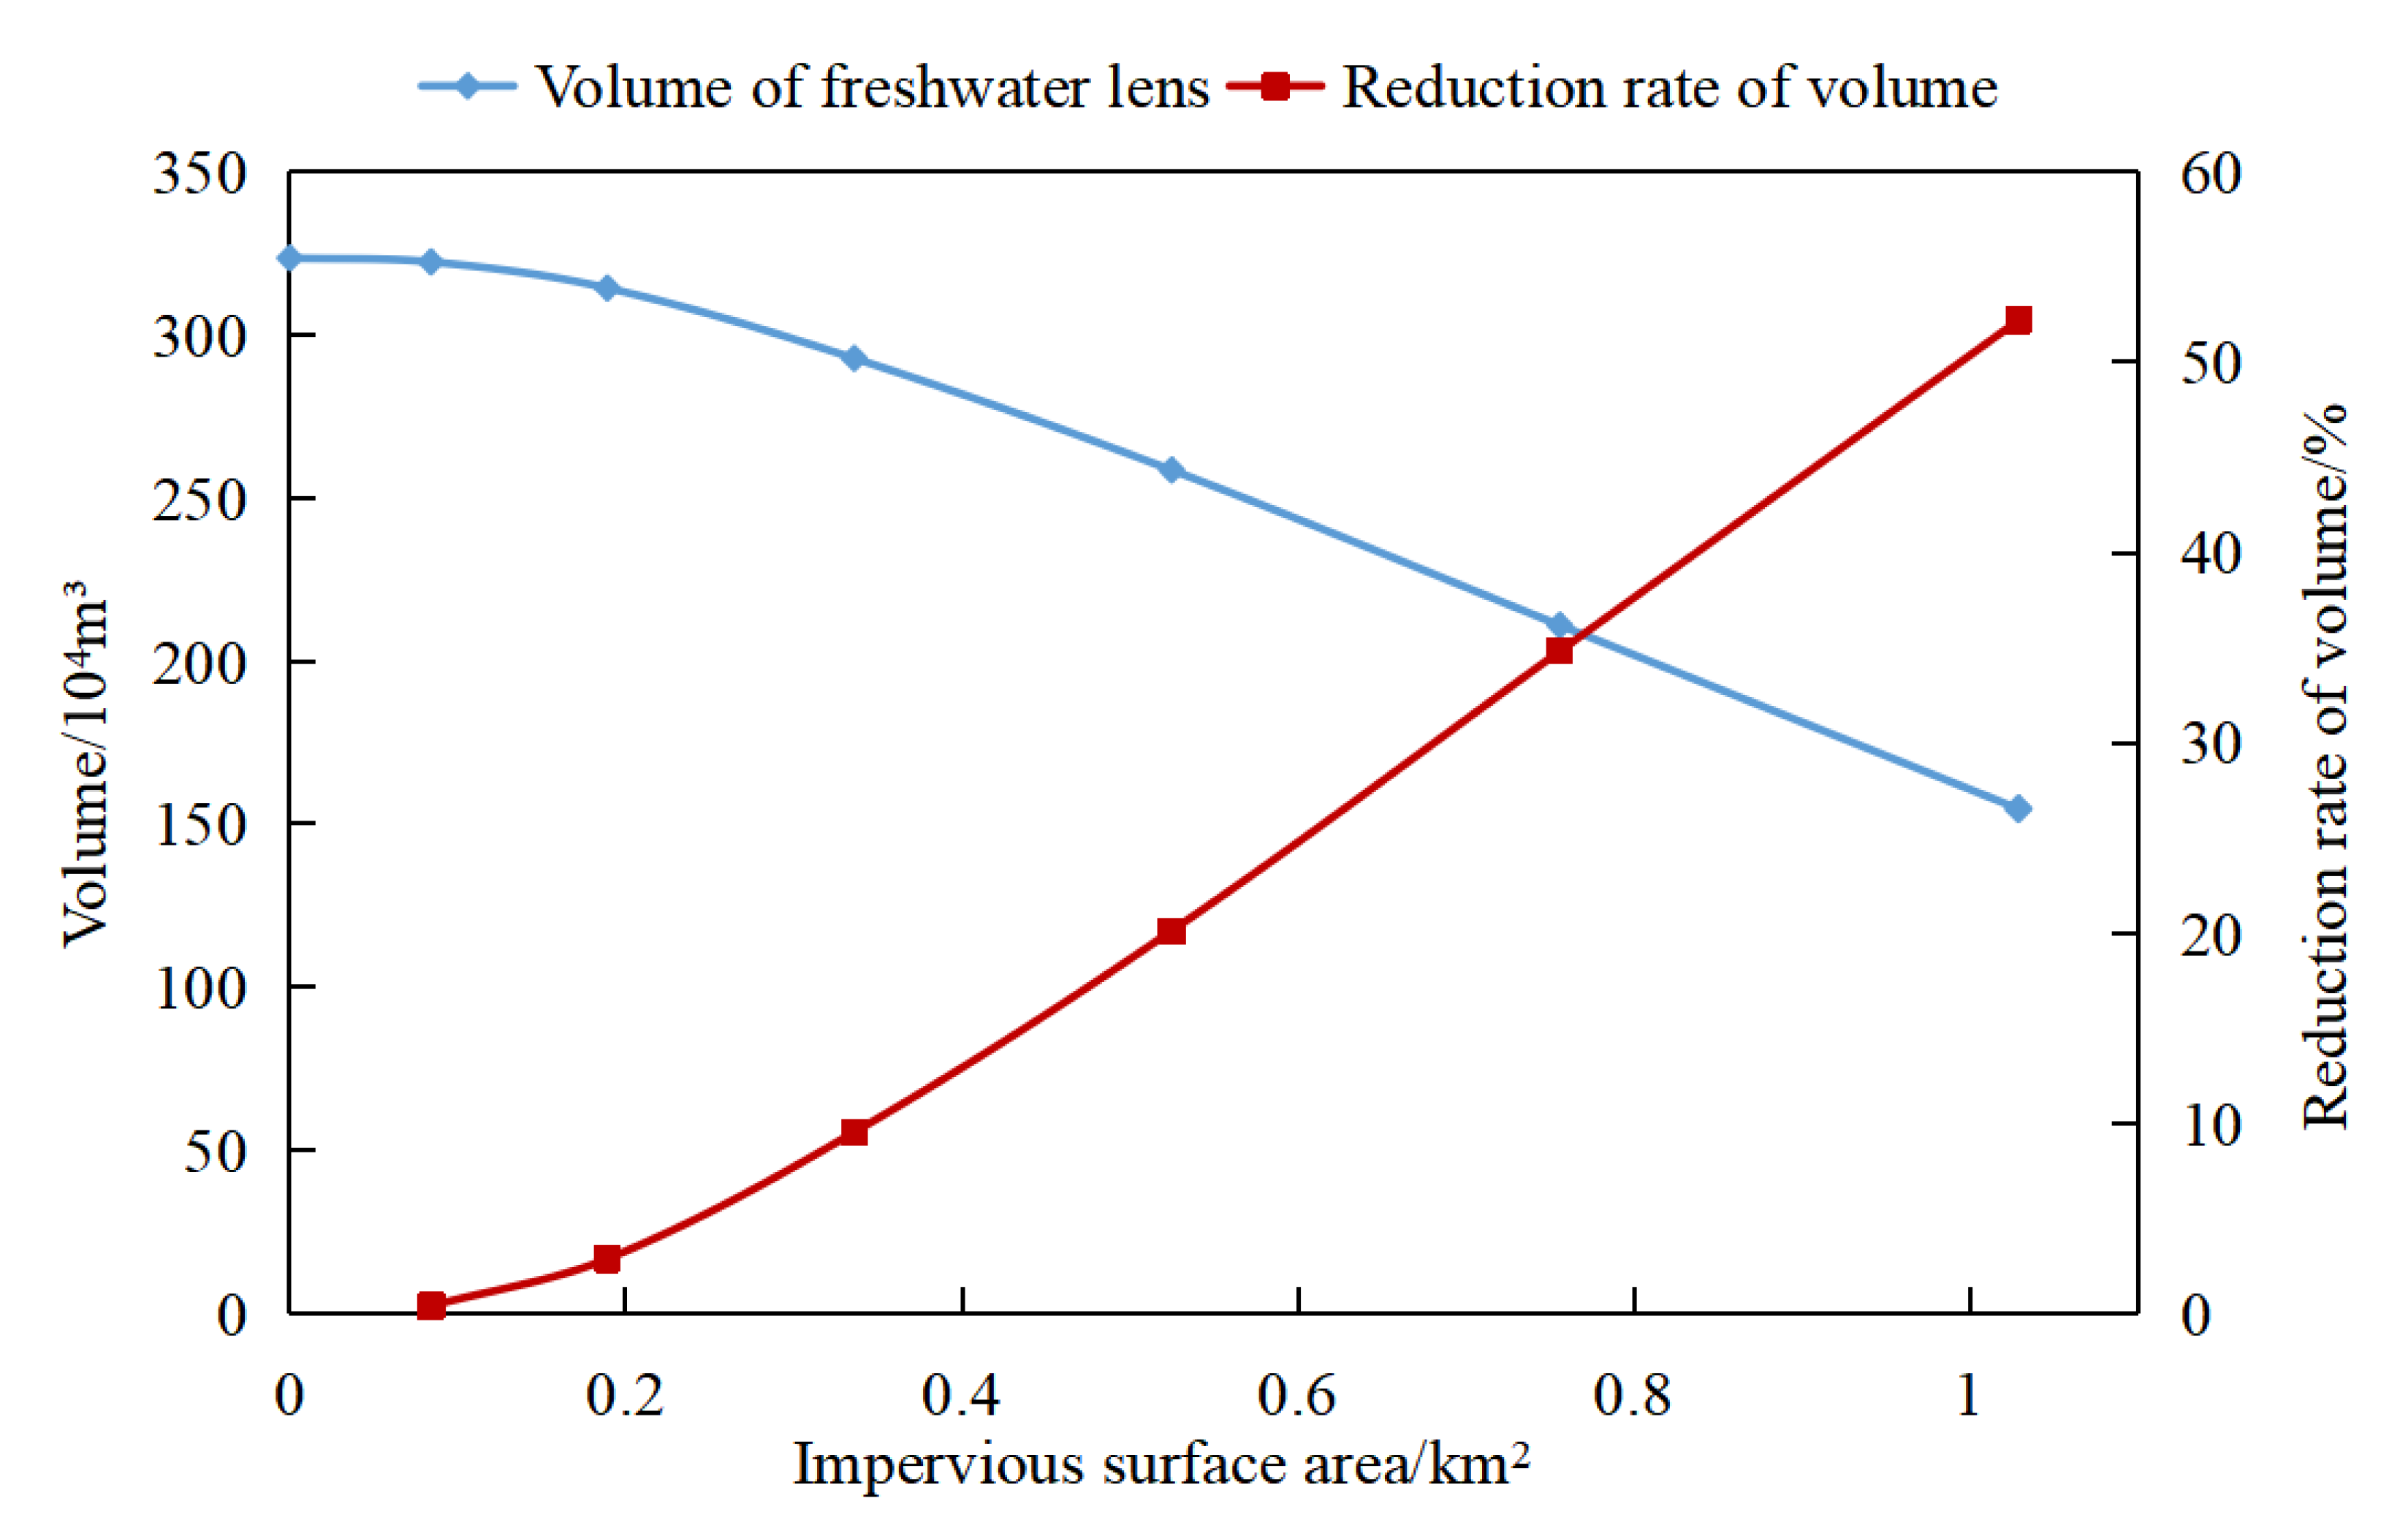
Figure 11 shows the changes in freshwater lens volume and volume reduction rate for different impermeable surface areas. The reduction rate of the freshwater lens volume would gradually accelerate with the increase in the impermeable surface area. With the impermeable surface area exceeding 100 grids (more than 15% of the whole island area), the volume of freshwater lens would show a linear negative correlation with the impermeable surface area. With the impermeable surface area exceeding 200 grids (more than 30% of the whole island area), the volume of the freshwater lens body would decrease to less than 50% of the original volume, which is only 155 × 104 m³.
With the increase in the impermeable surface area, the damage to the freshwater lens would become more and more severe. If the existing pumping scheme is not changed in time, it will lead to seawater intrusion and even prevent the freshwater lens from returning to its original state. With the increasing degree of development and construction on the island, rainwater harvesting and artificial recharge can be taken into consideration for the restoration of the freshwater lens.
5. Discussion
Compared with the mainland at the same latitude, island areas usually face problems such as high precipitation, strong evaporation, little runoff and poor groundwater storage conditions. Surface water resources are almost non-existent in most of the islands and freshwater resources are generally stored underground in the form of freshwater lenses. The island under examination can be classified as a “very small island” [33] and the assessment, exploitation and management of water resources in these islands require specific analyses of the characteristics of small islands, rather than directly adopting the general approach used in large-size islands or archipelagos. The model we developed provides a reliable tool for the investigation of other similar “very small islands” around the world relatively to the behavior of freshwater lenses, especially under various urbanization construction scenarios. While previous studies have mostly focused on the formation of freshwater lenses under natural conditions, the effects of climate and groundwater extraction, etc., the application of our model provides a new direction for the study of freshwater lenses, which can be meaningful for managing small coral islands and understanding island groundwater systems. For example, the importance of the selection of urbanization construction locations and construction land areas is found to be evident from the comparison between model simulations with and without impermeable surfaces. It is a supplement to previous research on the evolution of freshwater lenses that did not take into account the increase in island area and the presence of impermeable surfaces. Indeed, the volume and thickness of freshwater lenses simulated by numerical models are usually much larger compared to the actual measurement data, in that the change in underlying surface after the urbanization and construction of the islands is not considered in the simulation.
The numerical model presented here is comparable to that of the freshwater lens on Yongshu Island of the Nansha Islands by Chong Sheng et al. [34], in terms of hydrogeological conditions, climatic conditions, formation mechanism of freshwater lens and spatial scale. Unlike the “semi-natural and semi-artificial” island we studied, Yongshu Island is a completely artificial island; the study focused on the formation of freshwater lenses after the artificial island had been built. Moreover, their conclusion also confirms our simulation results; the new freshwater lens would form under the reclaimed part of the island. Cozzolino et al. [35] monitored and sampled groundwater in coastal dunes in northern Italy, where the typical bush or sand cover was replaced by the pine forest land cover, which intercepted precipitation and consequently led to a reduction in net infiltration and freshwater storage. This discovery also verified the results of our study, in that the presence of impermeable surfaces prevents the infiltration of precipitation and disrupts the relatively stable recharge–discharge state of the island groundwater system.
Although the salinity of water supply on the island has not exceeded the standard in recent years, the variation tendency observed from the model manifests the necessity of appropriate adjustments to the exploitation of groundwater and the layout of future urbanization of the island. The simulation results show that our model can help policy makers to design the extraction and construction schemes with the least damage to the freshwater lens. For the current trend of thinning or shrinking of the freshwater lens, alternative freshwater sources such as rainwater harvesting and desalinated seawater could be considered as a priority, or we could restore the freshwater lens through artificial recharge. Although our model does not take into account environmental factors such as tides and natural disasters, the model is useful in predicting long-term trends of the volume of the freshwater resource in small coral island areas; thus, it can be an important tool to support local water managers in making decisions about freshwater resource development.
6. Conclusions
In this study, we establish a three-dimensional numerical groundwater model to study the formation of the freshwater lens on a coral island. A reclaimed island was set up in the model to assess the morphological characteristics and volume changes in the freshwater lens. Different impermeable surface area scenarios were designed to assess the evolution process and maximum volume of the freshwater lens under the influence of urbanization construction. The main conclusions are explained below.
(1) The freshwater lens of the small coral island gradually forms with the continuous infiltration of fresh water. This process can be divided into three stages. In the first stage, the generation stage (approximately 4–5 years), the island continuously receives precipitation infiltration recharge, which lays the foundation for the formation of a freshwater lens. The second stage is the evolution stage (approximately 5–10 years); in this stage, the thickness and volume of the freshwater lens grow continuously at a fast rate. The third stage is the stabilization stage (approximately 10–40 years). The growth rate of the freshwater lens slows down and reaches stability in about 45 years; the maximum thickness and volume of freshwater lens are, respectively, 15.2 m and 145.4 × 10⁴ m³; the freshwater lens is thick in the middle and thin on the margin and the highest head is 0.252 m above sea level.
(2) The changes in the freshwater lens after reclamation of the island were predicted by converting inactive grids into active grids. The results show that it would take about 25 years for the freshwater lens to reach a stable state again after reclamation, which is less than the time under the natural condition. The freshwater lens would also appear in the subsurface of the additional part of the island, with a thickness of 9.5 m. The thickness of the freshwater lens in the subsurface of the main island part would also increase by 9% to 16.6 m and the volume of the freshwater lens would increase to 1.22 times that of the original island.
(3) Setting the same area of impervious surface in the southwest, northeast and middle of the island, the model would reach a stable state after 15 years. In Scenarios A and B, the scope of freshwater lenses would change and the contours of the part of lenses covered by the impermeable surface would be concave inward, while, in Scenario c, the central thickness of the freshwater lens would be significantly reduced. The reduction in freshwater lens volume in the three scenarios, in the order from the largest to the smallest, is Scenario B (northeast side), Scenario A (southwest side) and Scenario C (central part); therefore, it can be inferred that urbanization on the margin of the island would cause more serious damage to underground freshwater resources.
(4) Impermeable surfaces of six different areas were set in the model for analyzing the variation law of volume of the freshwater lens. The results show that the volume of freshwater lenses would gradually decrease with the increase in the impermeable surface area and the rate of decrease would gradually accelerate; these two values would gradually have a linear relationship with the increase in the impermeable surface area to 15.6% of the island area. With the impermeable surface exceeding 30% of the island area, the volume of the freshwater lens would decrease by more than 50%.
The above conclusions show that freshwater lenses are valuable freshwater resources in island areas, are greatly stable under natural conditions and can be used for water supply. In the urbanization process of small coral islands, the government should not only consider economic benefits, but also focus on the protection of freshwater lenses, which requires the reasonable selection of construction sites and construction area, as well as the use of building materials with good permeability in the process of island construction, with the intention of ensuring a certain green area to achieve an ecological city. On the issue of underground freshwater resources development and utilization, it is necessary to choose the appropriate pumping sites according to the characteristics of the island itself and adjust the pumping plans in time according to the development of the island. Residents on the island should prioritize the use of rainwater and water transported by ships. Research on an optimal groundwater pumping plan, the selection of optimal reclamation plans and construction materials for the island construction is recommended for future directions.
Supplementary Materials
The following are available online at https://www.mdpi.com/article/10.3390/w13223272/s1, Table S1: Comparison of simulated and measured values of groundwater level [36], Table S2: Comparison of simulated and measured values of freshwater lens thickness [36].
Author Contributions
This paper was composed with the collaboration of all authors. Conceptualization, Z.L. and Y.S.; methodology, Z.L. and Y.L.; software, Z.L. and R.W.; formal analysis, Z.L.; writing—original draft preparation, Z.L.; writing—review and editing, Z.L., R.W. and L.S.; supervision, L.S.; project administration, L.S.; funding acquisition, L.S. All authors have read and agreed to the published version of the manuscript.
Funding
This research project was funded by the Central University Project “Risk Analysis of the Development and Utilization of Island Freshwater Lenses” (No. B200203046), Postgraduate Scientific Research and Innovation Plan of Jiangsu Provence (No. kycx20_0461).
Institutional Review Board Statement
Not applicable.
Informed Consent Statement
Not applicable.
Data Availability Statement
Data are contained within the article.
Acknowledgments
All authors sincerely thank the anonymous reviewers and the editors for their helpful and constructive comments.
Conflicts of Interest
The authors declare no conflict of interest.
References
- Ghyben, B.W. Nota in Verband met de Voorgenomen Putboring nabij Amsterdam. Tijdschr. Kon. Inst. Ing. 1888, 9, 8–22. [Google Scholar]
- Herzberg, A. Die Wasserversorgung einiger Nordseebader. J. Gasbeleucht. Wasserversorg. 1901, 44, 842–844. [Google Scholar]
- Yoshimoto, S.; Ishida, S.; Kobayashi, T. Using hydrogeochemical indicators to interpret groundwater flow and geochemical evolution of a freshwater lens on Majuro Atoll, Republic of the Marshall Islands. Hydrogeol. J. 2020, 28, 1053–1075. [Google Scholar] [CrossRef] [Green Version]
- Fetter, C.W. Position of the saline water interface beneath oceanic islands. Water Resour. 1972, 8, 1307–1315. [Google Scholar] [CrossRef]
- UNESCO. Small Island Developing States—UNESCO’s Action Plan; Ikhlef, K., Nakashima, D., Eds.; United Nations Educational, Scientific and Cultural Organization: Paris, France, 2016; p. 32. [Google Scholar]
- Li, Y.X.; Shu, L.C.; Zhen, L.; Li, H.; Wang, R.; Opoku Portia, A. Laboratory Physical Experiments on the Saltwater Upconing and Recovery of Island Freshwater Lenses: Case Study of a Coral Island, China. Water 2021, 13, 1137. [Google Scholar] [CrossRef]
- Igel, J.; Günther, T.; Kuntzer, M. Ground-penetrating radar insight into a coastal aquifer: The freshwater lens of Borkum Island. Hydrol. Earth Syst. Sci. 2013, 17, 519–531. [Google Scholar] [CrossRef] [Green Version]
- Mitchelltapping, H.J. Hydrogeological concept of vertical coupling in a freshwater lens. Gulf Coast Assoc. Geol. Soc. 1994, 44, 499–506. [Google Scholar]
- Röper, T.; Kröger, K.F.; Meyer, H.; Sültenfuss, J.; Greskowiak, J.; Massmann, G. Groundwater ages, recharge conditions and hydrochemical evolution of a barrier island freshwater lens (Spiekeroog, Northern Germany). J. Hydrol. 2012, 454–455, 173–186. [Google Scholar] [CrossRef] [Green Version]
- Larabi, A.; de Smedt, F. Numerical solution of 3-D groundwater flow involving free boundaries by a fixed finite element method. J. Hydrol. 1997, 201, 161–182. [Google Scholar] [CrossRef]
- Vacher, H.L.; Wallis, T.N. Comparative hydrogeology of fresh-water lenses of Bermuda and Great Exuma Island, Bahamas. Ground Water 1992, 30, 15–20. [Google Scholar] [CrossRef]
- Bokuniewicz, H.; Pavlik, B. Groundwater seepage along a Barrier Island. Biogeochemistry 1990, 10, 257–276. [Google Scholar] [CrossRef]
- Zhou, C.Z. Simulation and Exploitation of the Freshwater Lens in Coral Island. J. Logist. Eng. Univ. 2016, 32, 1–10. (In Chinese) [Google Scholar]
- Zhou, C.Z.; He, L.; Yang, Q. Three-dimensional numerical simulation of freshwater lenses in coral islands. J. Hydraul. Eng. 2010, 5, 560–566. (In Chinese) [Google Scholar]
- Zhen, L.; Zhou, C.Z.; Shu, L.C.; Cao, Y.J.; Geng, H.T. Laboratory Simulation Experiment of Evolution of Island Freshwater Lens. J. Jilin Univ. (Earth Sci. Ed.) 2008, 30, 81–85. (In Chinese) [Google Scholar]
- Stoeckl, L.; Houben, G. Flow dynamics and age stratification of freshwater lenses: Experiments and modeling. J. Hydrol. 2012, 458, 9–15. [Google Scholar] [CrossRef]
- White, I.; Falkland, T. Management of freshwater lenses on small Pacific islands. Hydrogeol. J. 2010, 18, 227–246. [Google Scholar] [CrossRef]
- Huizer, S.; Karaoulis, M.C.; Essink, G.H.P.O.; Bierkens, M.F.P. Monitoring and simulation of salinity changes in response to tide and storm surges in a sandy coastal aquifer system. Water Resour. Res. 2017, 53, 6487–6509. [Google Scholar] [CrossRef]
- Post, V.E.; Bosserelle, A.L.; Galvis, S.C.; Sinclair, P.J.; Werner, A.D. On the resilience of small-island freshwater lenses: Evidence of the long-term impacts of groundwater abstraction on Bonriki Island, Kiribati. J. Hydrol. 2018, 564, 133–148. [Google Scholar] [CrossRef]
- Wallace, C.D.; Bailey, R.T. Geohydrologic factors governing atoll island groundwater resources. J. Hydrol. Eng. 2017, 22, 05017004. [Google Scholar] [CrossRef]
- Underwood, M.R.; Peterson, F.L.; Voss, C.I. Groundwater lens dynamics of Atoll Islands. Water Resour. Res. 1992, 28, 2889–2902. [Google Scholar] [CrossRef]
- Schneider, J.C.; Kruse, S.E. A comparison of controls on freshwater lens morphology of small carbonate and siliciclastic islands: Examples from barrier islands in Florida, USA. J. Hydrol. 2003, 284, 253–269. [Google Scholar] [CrossRef]
- Zhao, H.T.; Song, C.J.; Yu, K.F.; Yuan, J.Y. Nature and development of yongxing island and shi island of xisha islands. Mar. Sci. Bull. 1994, 13, 44–56. (In Chinese) [Google Scholar]
- Wang, G.Z.; Lu, B.Q.; Quan, S.Q. The sedimentary environments and characteristics of the coral reef of the yongxing island. Oceanol. Limnol. Sin. 1986, 1, 36–44. (In Chinese) [Google Scholar]
- Vacher, H.L. Introduction: Varieties of Carbonate Islands and a Historical Perspective. Dev. Sedimentol. 2004, 54, 1–33. [Google Scholar]
- Werner, A.D.; Sharp, H.K.; Galvis, S.C. Hydrogeology and management of freshwater lenses on atoll islands: Review of current knowledge and research needs. J. Hydrol. 2017, 551, 819–844. [Google Scholar] [CrossRef]
- White, I.; Falkland, T.; Perez, P. Challenges in freshwater management in low coral atolls. J. Clean. Prod. 2007, 15, 1522–1528. [Google Scholar] [CrossRef]
- Langevin, C.D.; Shoemaker, W.B.; Guo, W.W. MODFLOW-2000, The US Geological Survey Modular Ground-Water Model–Documentation of the SEAWAT-2000 Version with the Variable-Density Flow Process (VDF) and the Integrated MT3DMS Transport Process (IMT); US Geological Survey Open: Reston, VA, USA, 2003; p. 43.
- Sheng, C.; Xu, H.H.; Zhang, Y.F. Hydrological properties of calcareous sands and its influence on formation of under-ground freshwater lens on islands. J. Jilin Univ. (Earth Sci. Ed.) 2020, 50, 1127–1138. (In Chinese) [Google Scholar]
- Zhou, C.Z.; Fang, Z.D.; Liang, H.G. Numerical simulation of freshwater lens on coral island. Mar. Sci. 2004, 28, 77–80. (In Chinese) [Google Scholar]
- Yao, Y.Y.; Andrews, C.; Zheng, Y.; He, X.; Babovic, V.; Zheng, C.M. Development of fresh groundwater lens in coastal reclaimed islands. J. Hydrol. 2019, 573, 365–375. [Google Scholar] [CrossRef]
- Holding, S.; Allen, D.M. Wave overwash impact on small islands: Generalised observations of freshwater lens response and recovery for multiple hydrogeological settings. J. Hydrol. 2015, 529, 1324–1335. [Google Scholar] [CrossRef]
- Falkland, A.; Custodio, E.; Arenas, A.D.; Simler, L. Hydrology and water resources of small islands: A practical guide. Stud. Rep. Hydrol. 1991, 49, i–xiii. [Google Scholar]
- Sheng, C.; Han, D.; Xu, H.; Li, F.; Shen, Y. Evaluating dynamic mechanisms and formation process of freshwater lenses on reclaimed atoll islands in the South China Sea. J. Hydrol. 2020, 584, 124641. [Google Scholar] [CrossRef]
- Davide, C.; Nicolas, G.; Marco, A.; Giambastiani, B. Natural and anthropogenic factors affecting freshwater lenses in coastal dunes of the adriatic coast. J. Hydrol. 2017, 551, 804–818. [Google Scholar]
- Zhou, C.Z.; Fang, Z.D.; Wei, Y.; Feng, X.J. Development and Utilization of the Freshwater Lens on a Coral Island; Chongqing University Press: Chongqing, China, 2017; Volume 8. [Google Scholar]
Figure 1.
Hydrogeological conceptual model: (a) Schematic diagram of model simulation range; (b) hydrogeological structure of profile A–A’.
Figure 1.
Hydrogeological conceptual model: (a) Schematic diagram of model simulation range; (b) hydrogeological structure of profile A–A’.

Figure 2.
Basic model grid and boundary conditions.

Figure 3.
Sectional views of freshwater lenses in 10 years (a), 30 years (b) and 50 years (c).

Figure 4.
(a) Variation curve of max. thickness of freshwater lens; (b) variation curve of volume of freshwater lens.
Figure 4.
(a) Variation curve of max. thickness of freshwater lens; (b) variation curve of volume of freshwater lens.

Figure 5.
(a) Water head distribution above sea level of the island; (b) velocity and direction of groundwater on the island.
Figure 5.
(a) Water head distribution above sea level of the island; (b) velocity and direction of groundwater on the island.

Figure 6.
The freshwater lens formation process after island reclamation. The freshwater lens of initial island (a); freshwater lenses at 1, 5, 10, 15 and 25 years, respectively, after island reclamation (b–f).
Figure 6.
The freshwater lens formation process after island reclamation. The freshwater lens of initial island (a); freshwater lenses at 1, 5, 10, 15 and 25 years, respectively, after island reclamation (b–f).

Figure 7.
Head distribution above sea level on reclaimed islands.

Figure 8.
Scope of the freshwater lens in original condition (a); scope of the freshwater lens in three simulation scenarios, setting impermeable surfaces in the southwest, northeast and middle of the island (b–d).
Figure 8.
Scope of the freshwater lens in original condition (a); scope of the freshwater lens in three simulation scenarios, setting impermeable surfaces in the southwest, northeast and middle of the island (b–d).

Figure 9.
Sectional views of the freshwater lens: (a) original condition; (b–d) impermeable surfaces set in the southwest, northeast and middle of the island, respectively.
Figure 9.
Sectional views of the freshwater lens: (a) original condition; (b–d) impermeable surfaces set in the southwest, northeast and middle of the island, respectively.

Figure 10.
Freshwater lenses under different impermeable surface areas. (a–f) the impermeable surface areas are 0.084, 0.189, 0.336, 0.525, 0.756 and 1.029 km2, respectively.
Figure 10.
Freshwater lenses under different impermeable surface areas. (a–f) the impermeable surface areas are 0.084, 0.189, 0.336, 0.525, 0.756 and 1.029 km2, respectively.

Figure 11.
Variation in volume and volume reduction rate of the freshwater lens with the impermeable surface area.
Figure 11.
Variation in volume and volume reduction rate of the freshwater lens with the impermeable surface area.


Table 1.
Parameter values used in the basic model.
| Settings | Parameter | Units | Value |
|---|---|---|---|
| Model basic setting | Island width | m | 1980 |
| Thickness | m | 35 | |
| Grid | \ | 40 × 40 | |
| Simulated time step | d | 18,250 | |
| Flow module | Recharge | mm/y | Annual average monthly precipitation |
| K1 (strata above sea-level) | m/d | 50 | |
| K2 (Holocene strata) | m/d | 60 | |
| K3 (Pleistocene strata) Porosity | m/d \ | 500 0.3, 0.32, 0.35 | |
| Specific yield | \ | 0.15 | |
| Transport module | Longitudinal dispersivity | m | 5 |
| Horizontal dispersivity | m | 0.5 | |
| Seawater concentration (Cl−) | mg/L | 19,000 | |
| Precipitation concentration (Cl−) | mg/L | 0 | |
| Density-dependent module | Reference fluid density (Freshwater) | kg/m3 | 1000 |
| Seawater density | kg/m3 | 1025 |
Table 2.
Volume of the freshwater lens and its reduction rate under different conditions compared to the initial scenario.
Table 2.
Volume of the freshwater lens and its reduction rate under different conditions compared to the initial scenario.
| Location of Impermeable Surface | Volume of Freshwater Lens (104 m3) | Reduction Rate of Volume |
| Southwest | 308.1 | 4.82% |
| Northeast | 306.2 | 5.41% |
| Middle | 314.5 | 2.8% |
Publisher’s Note: MDPI stays neutral with regard to jurisdictional claims in published maps and institutional affiliations. |
© 2021 by the authors. Licensee MDPI, Basel, Switzerland. This article is an open access article distributed under the terms and conditions of the Creative Commons Attribution (CC BY) license (https://creativecommons.org/licenses/by/4.0/).
Share and Cite
MDPI and ACS Style
Ling, Z.; Shu, L.; Sun, Y.; Wang, R.; Li, Y. Impact of Island Urbanization on Freshwater Lenses: A Case Study on a Small Coral Island. Water 2021, 13, 3272. https://doi.org/10.3390/w13223272
AMA Style
Ling Z, Shu L, Sun Y, Wang R, Li Y. Impact of Island Urbanization on Freshwater Lenses: A Case Study on a Small Coral Island. Water. 2021; 13(22):3272. https://doi.org/10.3390/w13223272
Chicago/Turabian StyleLing, Zihan, Longcang Shu, Ying Sun, Ran Wang, and Yuxi Li. 2021. "Impact of Island Urbanization on Freshwater Lenses: A Case Study on a Small Coral Island" Water 13, no. 22: 3272. https://doi.org/10.3390/w13223272
Note that from the first issue of 2016, this journal uses article numbers instead of page numbers. See further details here.