Article

Hydrostratigraphic Framework and Physicochemical Status of Groundwater in the Gioia Tauro Coastal Plain (Calabria—Southern Italy)

1
Department of Biology, Ecology and Earth Sciences (DIBEST), University of Calabria, Via Ponte Bucci 4, Cubo 15B, 87036 Rende, Italy
2
E3 (Earth, Environment, Engineering) Soc.Coop. (University of Calabria), Via Ponte Bucci, Cubo 15B, 87036 Rende, Italy
3
Department of Earth Sciences, University of Florence, Via G. La Pira 4, 50121 Firenze, Italy
4
CNR-IGG Institute of Geosciences and Earth Resources, Via G. La Pira 4, 50121 Firenze, Italy
5
Istituto Nazionale di Geofisica e Vulcanologia, Via di Vigna Murata 605, 00143 Rome, Italy
6
CNR-IRPI, National Research Council, Research Institute for Hydrogeological Protection, Via Amendola 122 I, 70126 Bari, Italy
*
Author to whom correspondence should be addressed.
Water 2021, 13(22), 3279; https://doi.org/10.3390/w13223279
Submission received: 21 October 2021 / Revised: 15 November 2021 / Accepted: 16 November 2021 / Published: 19 November 2021

Abstract

:
In this study, we analysed the Gioia Tauro Plain (Tyrrhenian coast, southern Italy) in terms of hydrostratigraphy and the physicochemical status of groundwater. We investigated the hydrostratigraphic framework of the area identifying a deep aquifer (made by late Miocene succession), an aquitard (consisting of Pliocene clayey and silty deposits) and a shallow aquifer (including Late Pleistocene and Holocene marine and alluvial sediments) using subsoil data (boreholes and geophysics). Our reconstruction showed that the structural geology controls the spatial pattern of the aquitard top and the shallow aquifer thickness. Furthermore, we evaluated the hydraulic conductivity for the shallow aquifer using an empirical method, calibrated by slug tests, obtaining values ranging from 10−4 to 10−5 m/s with a maximum of 10−3 m/s located close to inland dune fields. The piezometric level of the shallow aquifer recorded a significant drop between the 1970s and 2021 (−35 m as the worst value). It is the effect of climate and soil use changes, the latter being the increased water demand for kiwi cultivation. Despite the overexploitation of the shallow aquifer, shallow groundwater is fresh (736 µS/cm as mean electrical conductivity) except for a narrow coastal area where the electrical conductivity is more than 1500 µS/cm, which can be due to the seawater intrusion. What was more complex was the physicochemical status of the deep aquifer characterised by high temperature (up to 25.8 °C) and electrical conductivity up to 10,520 µS/cm along the northern and southern plain boundaries marked by tectonic structures. This issue suggested the dominant role of the local fault system that is likely affecting the deep groundwater flow and its chemical evolution.

1. Introduction

The sustainable development and management of coastal plains have received significant attention worldwide during the last few decades (see, e.g., [1,2,3,4]). However, coastal areas and coastal plains suffer the adverse consequences of geological processes and climate change hazards, including rises in sea level [5]. Moreover, the increasing human-induced pressure worsens the impact of land-use and hydrological changes, including reclamation works, embankments, dams, and groundwater overexploitation [6]. The latter is a key issue in coastal governance, since it must face growing population demand. Thus, salinisation processes, subsidence, and/or flood damages are favoured [7,8,9,10,11,12], and in this respect, the Mediterranean coastal areas are prone to seawater intrusions [13,14,15,16,17].
The study of the underground relationships among fresh and salt water, groundwater flow, and geological and aquifer features is still a scientific methodological issue to be improved for a wide range of coastal plains and coastal aquifers. Therefore, this study aims to offer a contribution, based on hydrogeological and geochemical data, to investigate a geologically complex coastal plain located in Southern Italy with a multidisciplinary approach.
The Gioia Tauro Plain (GTP) is positioned along the Tyrrhenian coast of the Calabria Region. GTP is an important industrialised and coastal agricultural area of about 500 km2. The harbour of Gioia Tauro is one of the most important container traffic hubs in the Mediterranean basin and the largest transhipment terminal in Italy. According to [18], about 160,000 inhabitants live in this area. However, the Plain still presents portions completely devoid of basic services, such as sewers or connections to aqueducts for domestic use. The lack of such infrastructures increases the overexploitation of groundwater. Due to well-developed anthropic activities and the absence, in some areas, of primary services, the GTP groundwater resources are constantly at risk of depletion and quality degradation.
Furthermore, GTP is characterised by a very articulated geological and structural framework that, mainly along with the bound areas, favours the development of water chemistry not fully explainable by simple water–rock interaction processes occurring in the sedimentary aquifers, and seawater intrusion. As a result, warm and saline waters were observed close to the northern and southern boundaries of GTP [19,20]. In addition to the ongoing anthropic pressure (mainly due to intensive farming), this issue makes the GTP groundwater system of high interest.
The main aim of the work is the definition of the hydrostratigraphic framework and the physicochemical status of GTP groundwater. We provide a detailed characterisation in terms of the hydrogeological framework, hydraulic properties, and geochemical processes occurring in the study area.

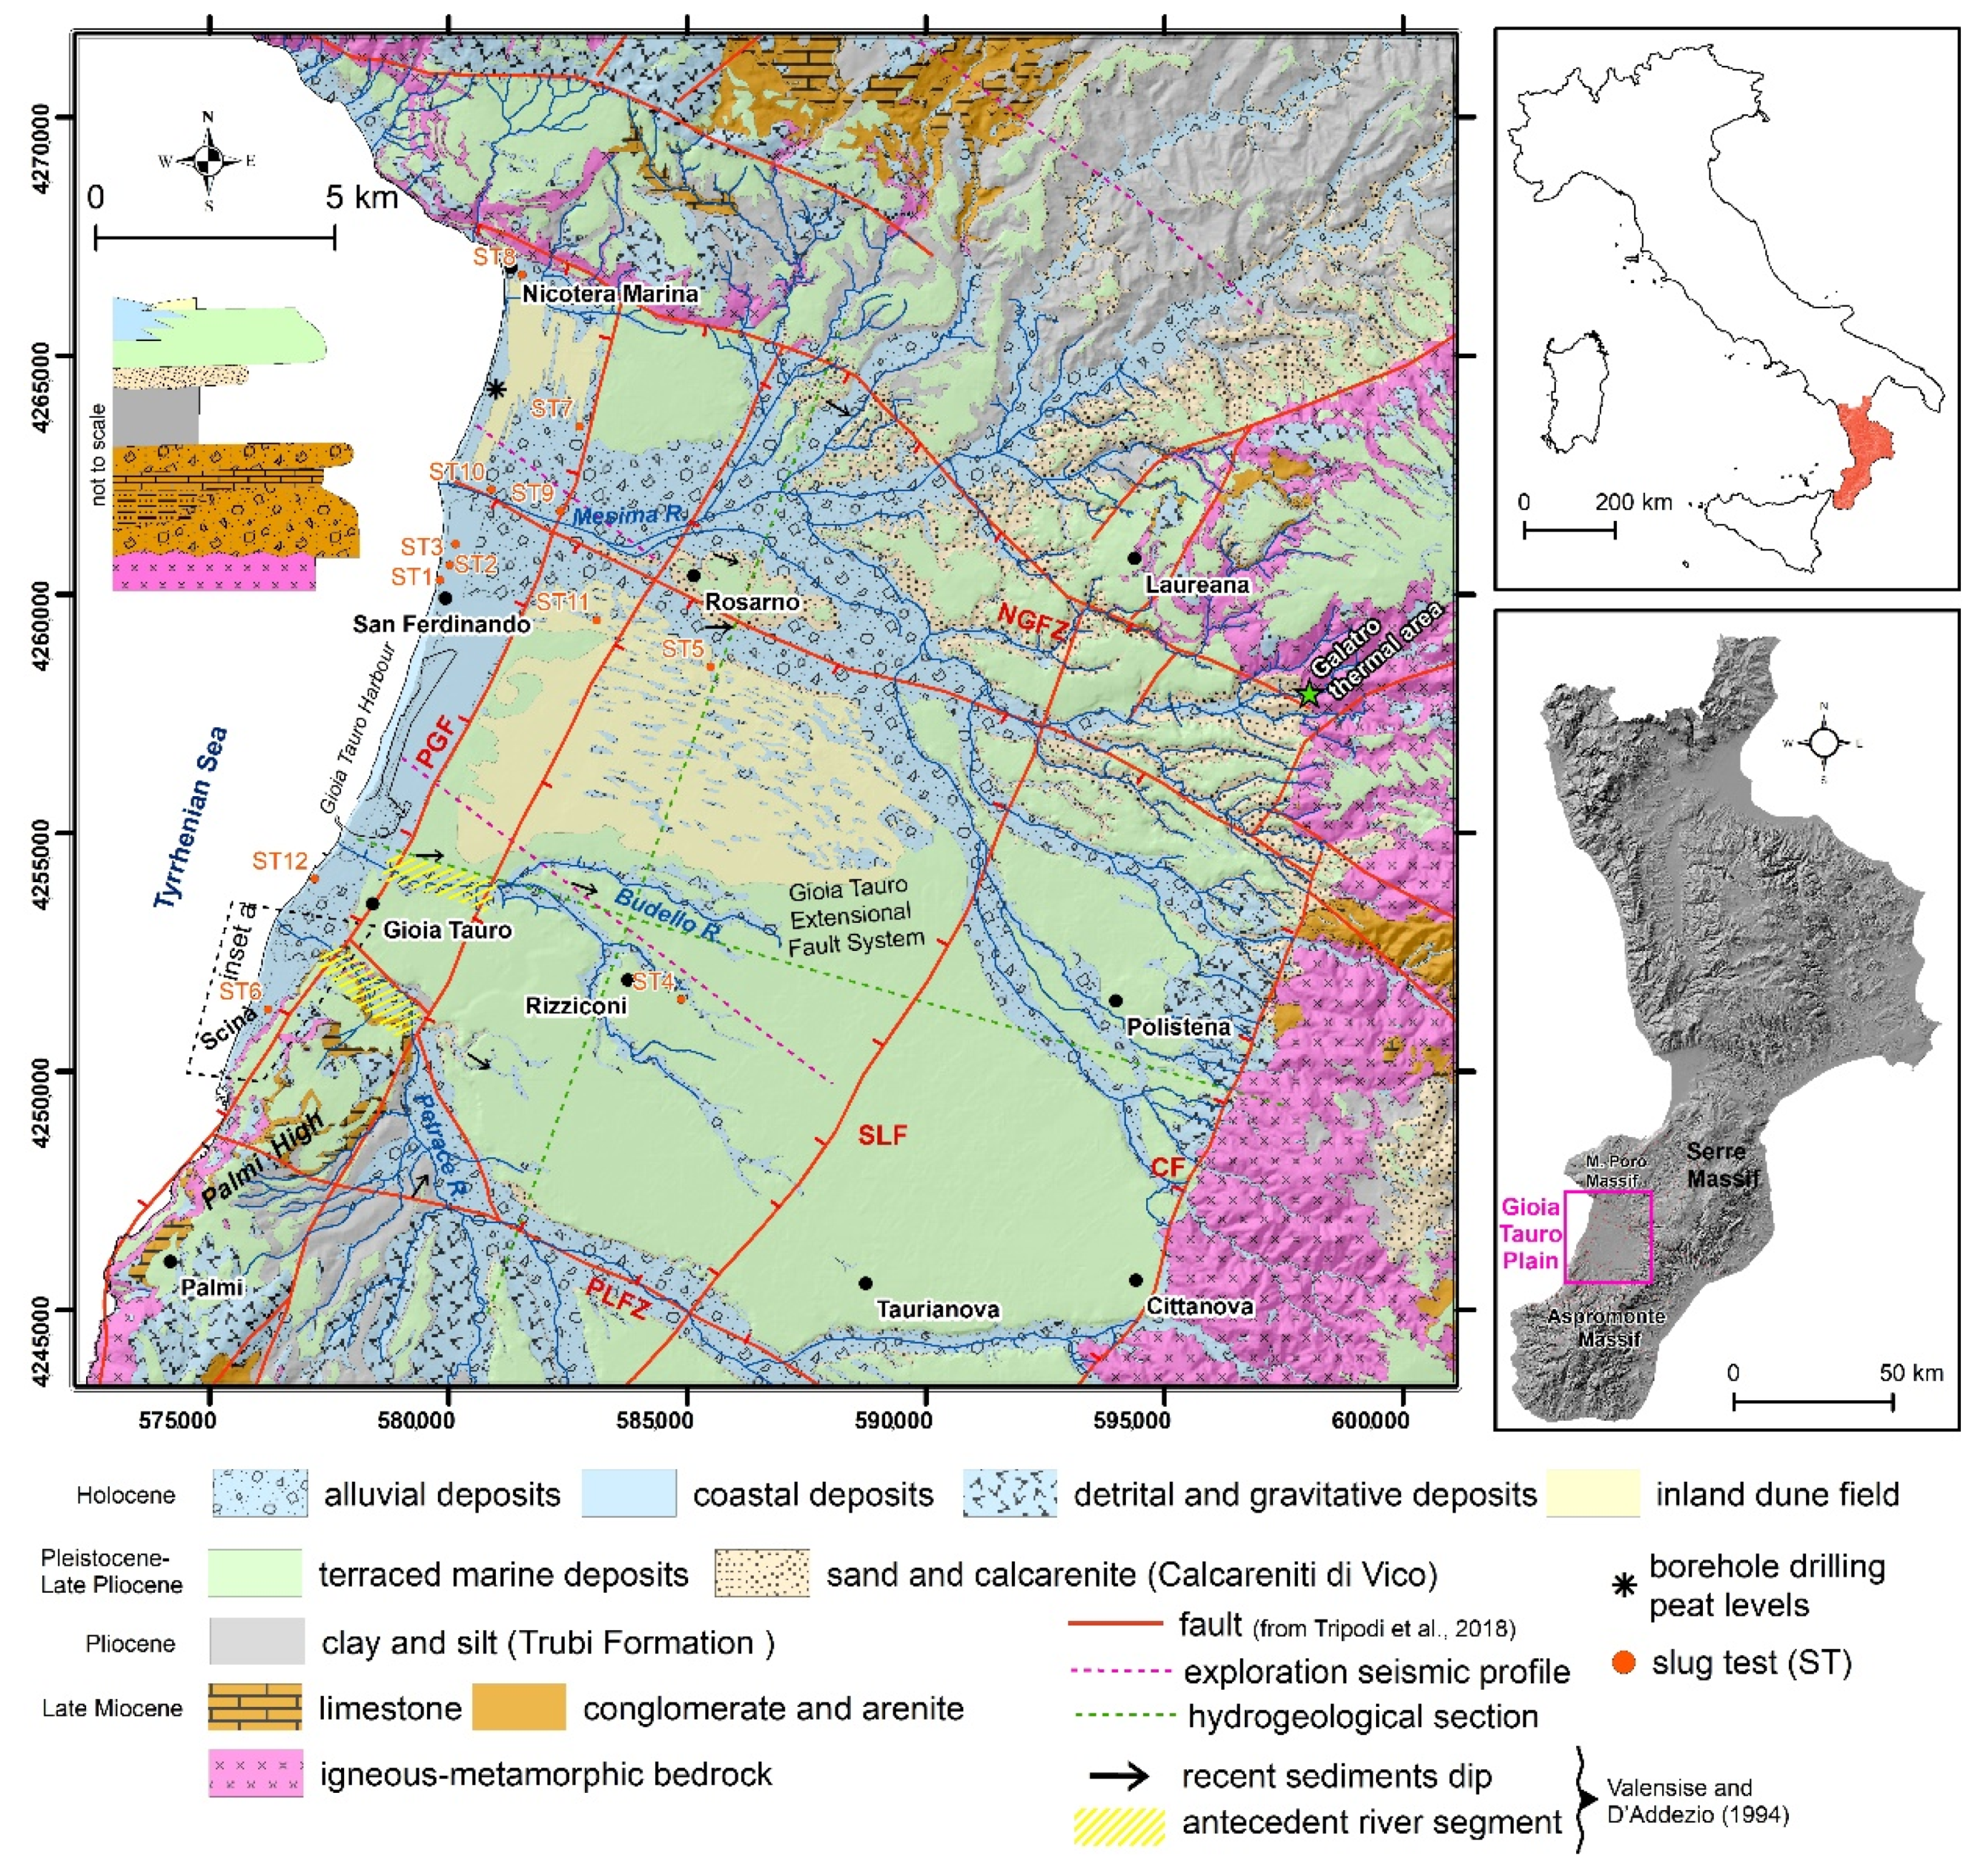
2. Geological and Hydrogeochemical Background

From a geological point of view, GTP is an Upper Pliocene-Pleistocene NNE-SSW oriented half-graben [21]. Three main fault systems mark the boundaries: (i) the NW-SE striking Nicotera-Gioiosa fault zone (NGFZ) with right lateral kinematics to the north, (ii) the high-angle normal and active NNE-SSW Cittanova Fault (CF) to the east, and (iii) the NW-SE trending Palmi-Locri fault zone (PLFZ) with mainly strike-slip kinematics to the south [22]. Furthermore, toward the coastline, GTP is crossed by the Palmi-Gioia Tauro Fault (PGF), a high-angle NE-SW striking fault west-dipping, and another east-dipping parallel fault, whilst the NE-SW oriented Sant’Eufemia-Laureana Fault (SLF), west-dipping, cuts the middle sector of GTP (Figure 1) [22].
Along CF, the igneous-metamorphic bedrock, building the Aspromonte and Serre Massifs, is juxtaposed with the sedimentary infill of the GTP basin [22,23]. CF represents an active fault as testified by the fault rupture that caused catastrophic earthquakes in the 4th century AD and 1783 (Mw = 7.0) [24,25].
In the southernmost sector, GTP is bounded to the west by the Palmi high, made by igneous-metamorphic bedrock, uplifted and eastward-tilted [23]. The presence of a structural high in the GTP western sector is also testified by the mechanisms of antecedence visible in the terminal segment of the Petrace and Budello rivers. At the same time, the tilting toward the east of the GTP is highlighted by the east-dipping of the recent sediments (Figure 1) [26].
The igneous-metamorphic bedrock is unconformably covered by an upper Miocene siliciclastic (including both shallow- and deep-water marine sediments and fluvio-deltaic deposits) and carbonate (shallow marine) succession [27], which crops out mainly along the Palmi high. The GTP basin is filled by a 600 m thick Plio-Pleistocene marine sedimentary succession [23]. The bottom of this succession is made by Pliocene clayey and silty deposits (Trubi Formation in [27]), 100 m thick [23] with a pumice-rich horizon in the upper part [28]. Upward, cross-bedded sands and calcarenites (late Pliocene–Pleistocene Calcareniti di Vinco in [27]), representing the infill of the Siderno paleo-strait [29], cover, with a slight angular unconformity, the Trubi Formation [23,27]. In the eastern sector of GTP, the Calcareniti di Vinco are covered, along an erosive contact, by the Sintema di Taurianova (Late Pleistocene) consisting of gravelly and sandy alluvial fan deposits characterised by lateral and vertical heteropic facies [27]. Toward the top, the succession is closed by sandy to gravelly terraced marine deposits (Late Pleistocene–Holocene), up to 20 m thick aeolian inland dunes (Holocene) and recent alluvial (in the eastern and middle sector) and coastal (in the western sector) deposits [27,30].
From a geochemical point of view, previous surveys [19,20], with the aim of identifying possible implications for fluid-fault relationships, provided data about the geochemical characteristics of the GTP groundwater. As a result, different geochemical water types and important anomalies in terms of total dissolved solids (TDS) and temperatures in the northern portion of the GTP, at the intersection between the main fault systems, were recognised. As reported in Figure 2, the Refs. [19,20] identified five main hydrochemical facies in the GTP: Ca-HCO3, Na-HCO3, Ca-SO4, Na-Cl (high salinity and high temperature) and Ca-Cl. The authors attributed the presence of several water types to different processes: water rock interaction occurring in the sedimentary aquifers, Messinian halite dissolution, marine intrusion, and a prolonged time of water-rock interaction with the crystalline basement.

3. Methods

The hydrostratigraphic analysis was based on stratigraphic data integrated by field surveys. Borehole data (85 as total) were acquired from an open-access database of boring and well data [31], technical sheets of the analysed wells and scientific papers [28,32]. The open-access database and technical sheets supply, in addition to the stratigraphic information, the piezometric level and, in some cases, groundwater temperature.
The lithological information from boreholes was converted into hydrogeological units (HU), mainly in terms of grain size. The latter is defined as a geologically homogeneous unit (but not necessarily isotropic) with characteristic hydrodynamic properties [33].
Considering the good efficiency of the electrical geophysical prospecting in the reconstruction of the Quaternary sediment geometries (e.g., [34,35]), borehole data were integrated by 133 vertical electrical soundings (VES) inferred by SP26 [36]. Boreholes and VES data were used to define the top and bottom elevation of the Hus and referred to as meters above sea level (m asl).
According to static and dynamic piezometric levels available for 201 wells [31] (Table S1) and measured in 24 wells (in this work, Table S1), we obtained values of hydraulic conductivity (k) using an empirical method, which is a simplification of an analytical solution [37]. It uses the following equations:
T = 1.22 × Sc
Sc = Q / h
T = k × b ,
where T is the transmissivity (m2/s); Q is the well discharge (m3/s); Δh is the drawdown (m); Sc is the specific capacity (m2/s), equal to Q/Δh; and b is the saturated aquifer thickness, drilled by each well (m). To validate the k-values obtained by the empirical method, a slug test survey was realised using 12 selected wells (diameter between 0.25 and 0.40 m) with lithostratigraphic boring data. The slug test consists of a rapid increase (rising-head test) or decrease (falling-head test) of the static piezometric level into the low-diameter borehole, usually a piezometer; this effect is usually obtained by quickly adding/removing a volume of water or quickly throwing/removing a slug, respectively [38]. We realised that falling-head tests using a high-power submersible pump were able to produce a very quick drawdown (together with a sufficient withdrawal volume) beneath the static piezometric level. This modification of the common-used procedure was adopted to solve the practical problems due to the large diameter of the available boreholes; the pump usage was calculated to be very short and quick (less than 30 s). The following return of the water level to the initial position was monitored. We applied the Hvorslev method [38], measuring the maximum drop of the water level (H0) and the subsequent relative recovery (HU1, …, Hn).
The load ratio (H/H0) and the relative times, obtained by the tests, were plotted in a semi-log (ln) plot, and the tl (time lag) was taken as the time which corresponds to H/H0 = 0.37.
Considering that the volume (V) needed to balance the active load is:
V = A × h
tl = V Q = A × h F × K × h = A F × K
K = A F × tl
F, representing a shape factor, was calculated by the following equation, which complies with the condition of the tested wells characterised by filters distant from the aquifer bottom:
F = 2 × π × L ln ( L R + 1 + ( L R ) 2 )
where k is the hydraulic conductivity (m/s); h is the dynamic level (m); A is the basal area of the tested sector (m2); L is the length of the filters (m); R is the radius of the filters (m); tl is the time lag. The k-values obtained by the 12 slug tests and the relative values calculated by the empirical method are reported in Table 1.
The methodology of groundwater characterisation was based on groundwater level and physicochemical parameters, as described by the refs. [39,40]. The water level and temperature, pH, Eh, and electrical conductivity (at 25 °C) were measured during March–April 2021 sampling campaigns by a phreatimeter and multiparametric probe (Hanna Instruments—HI9828), respectively. In the phreatic wells, the physicochemical parameters were measured directly in situ. Two pH buffers, with nominal pH values of 4.01 and 7.01 at 25 °C, were used for pH calibration. In addition, ZoBell’s solution [41] was used to calibrate the mV-meter for Eh measurement. The survey consisted of 101 wells with depths ranging from 4 to 200 m: 83 wells from the shallow phreatic aquifer, and 18 wells from the deep confined aquifer. The main statistical values referring to groundwater physicochemical features of surveyed wells are listed in Table 2.
The water level measurements, carried out on the 88 selected wells representative of HU3, were elaborated together with a digital elevation model (DEM) and well geometrical features to obtain the piezometric head (m a.s.l.) of each sampling point.
In summary, the new investigations included: (1) hydrostratigraphic data acquisition; (2) water level measurements in 88 selected wells representative of the main phreatic aquifer; (3) 12 slug tests; (4) and physicochemical measurements carried out on 101 water samples.
Piezometric head, hydrostratigraphic, hydraulic and physicochemical data were processed using interpolation techniques to obtain a continuous spatial reconstruction. The method of spatial interpolation (Inverse Distance Weighting: IDW) was applied to produce a Digital Surface Model, and thickness, iso-concentration and iso-level maps. The IDW method estimates values of cells by weighting values (points) of geometric data in the proximity of each processed area (cell). The points closer to the cell centre weigh more in the process of weighting.

4. Results and Discussion

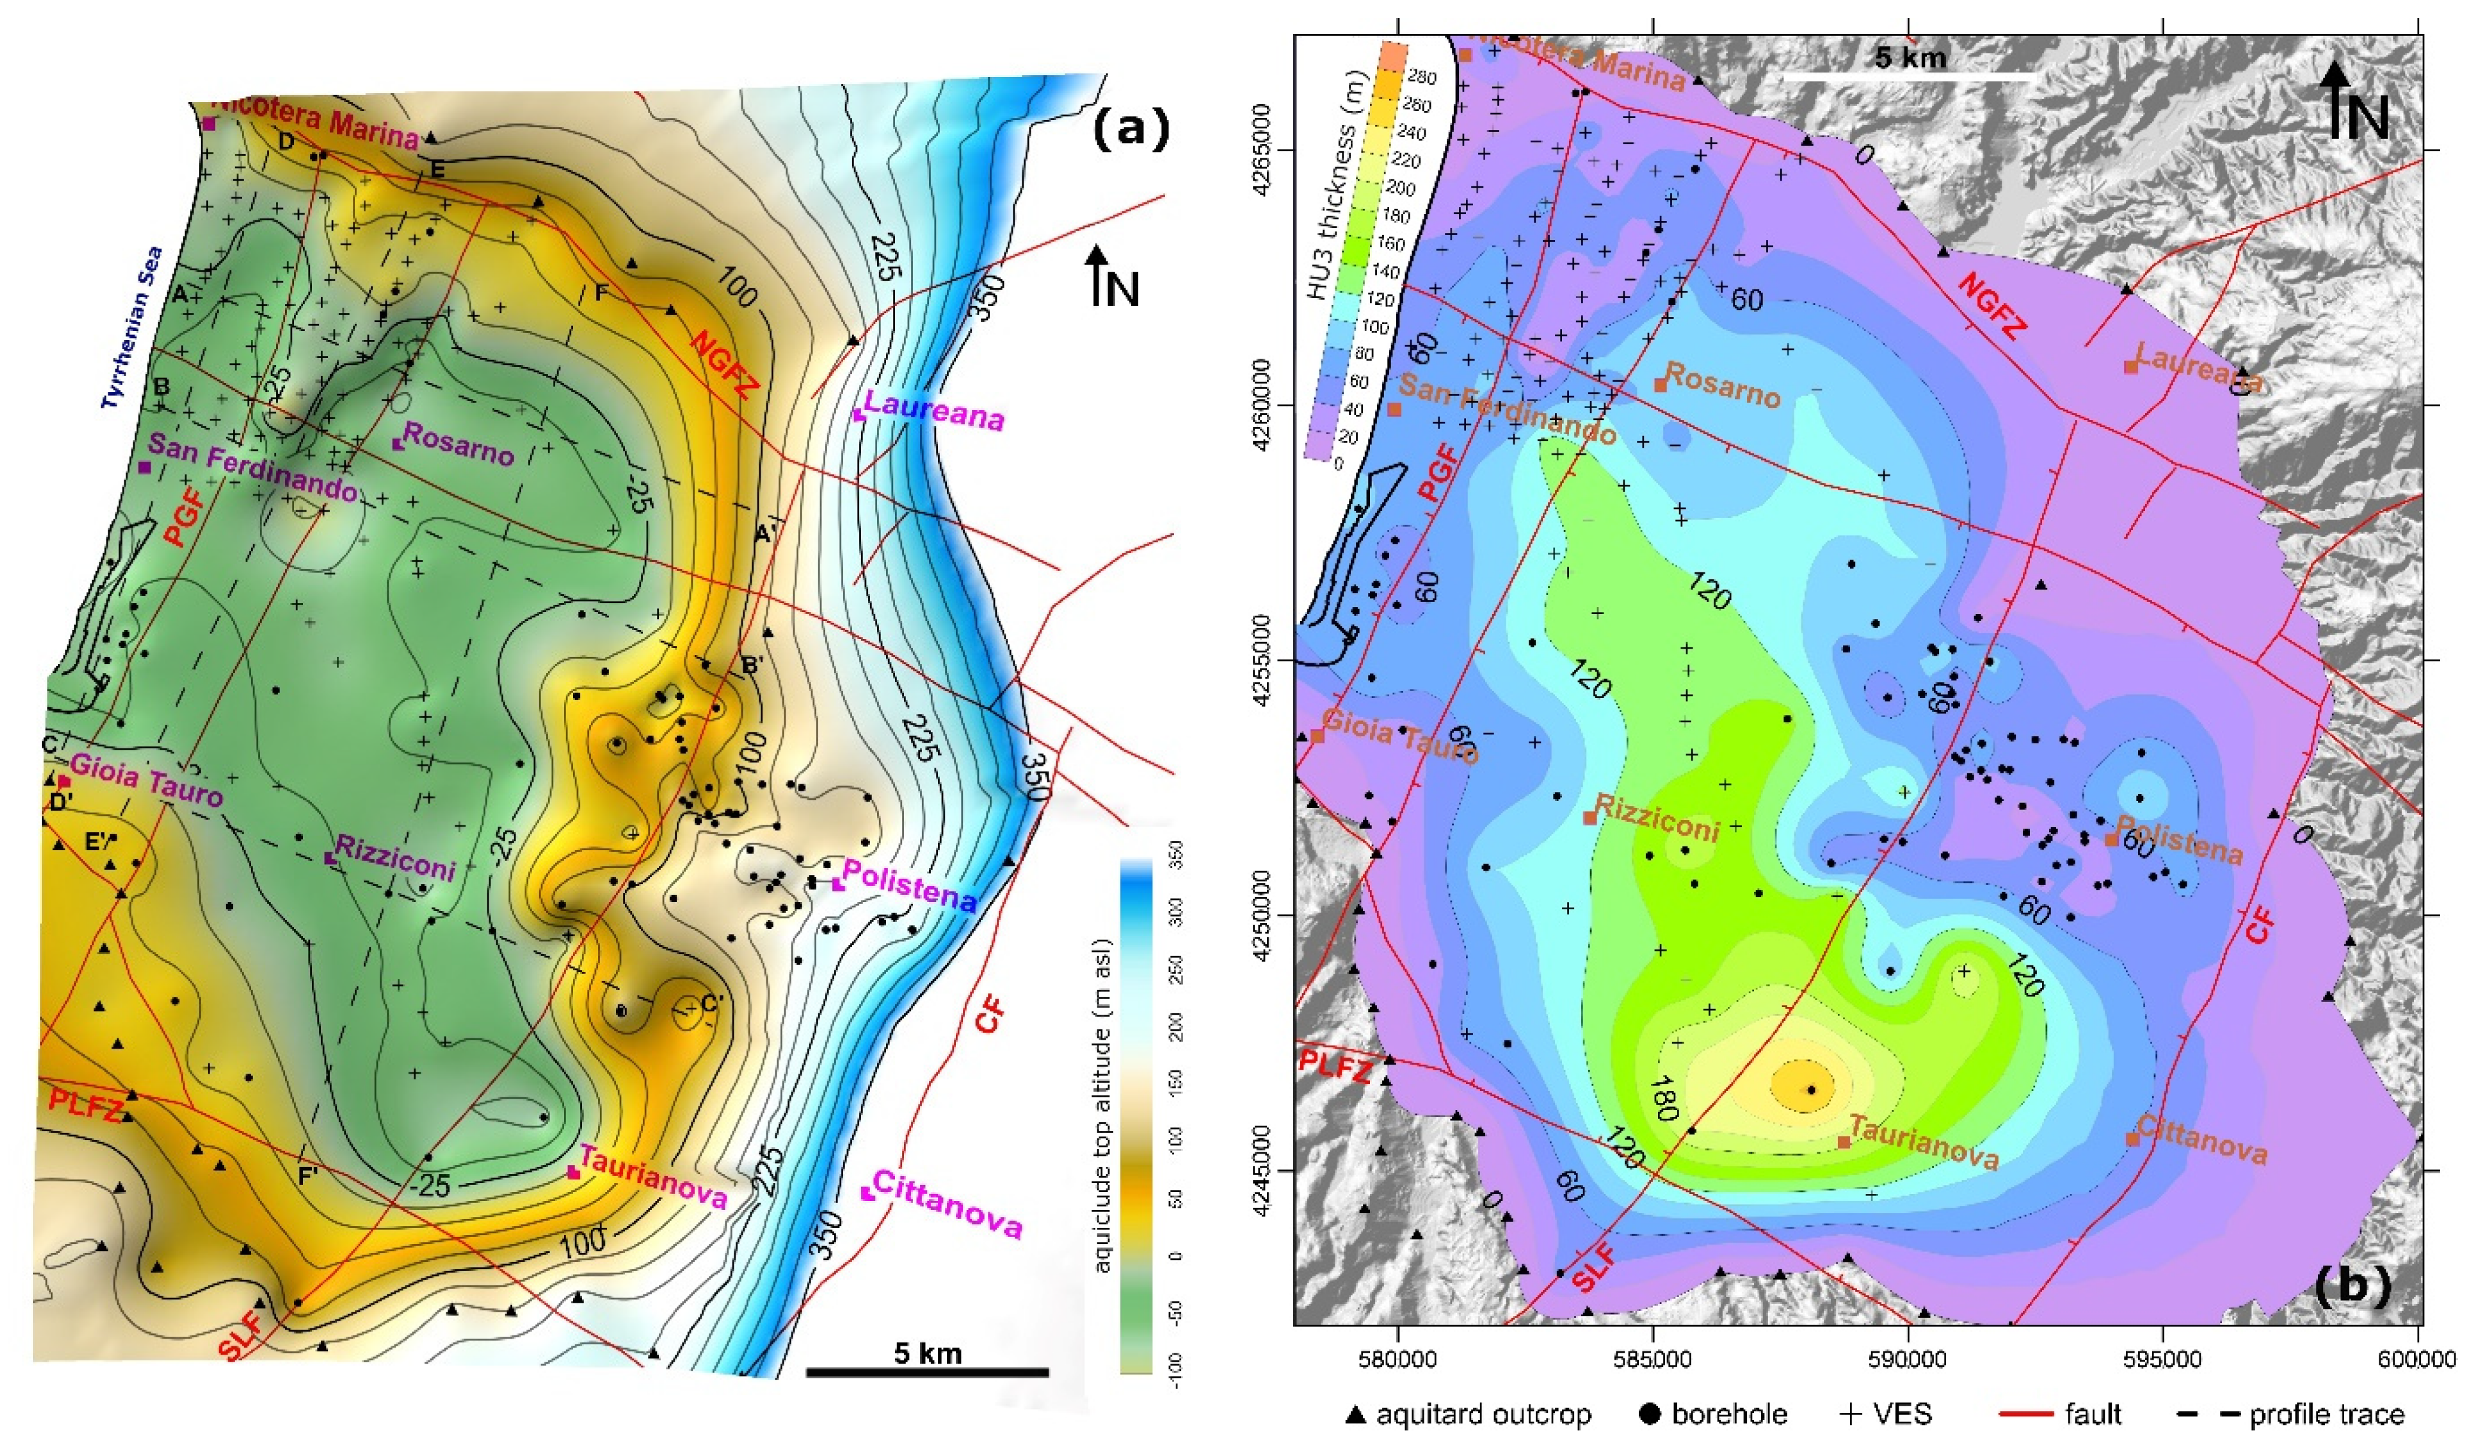
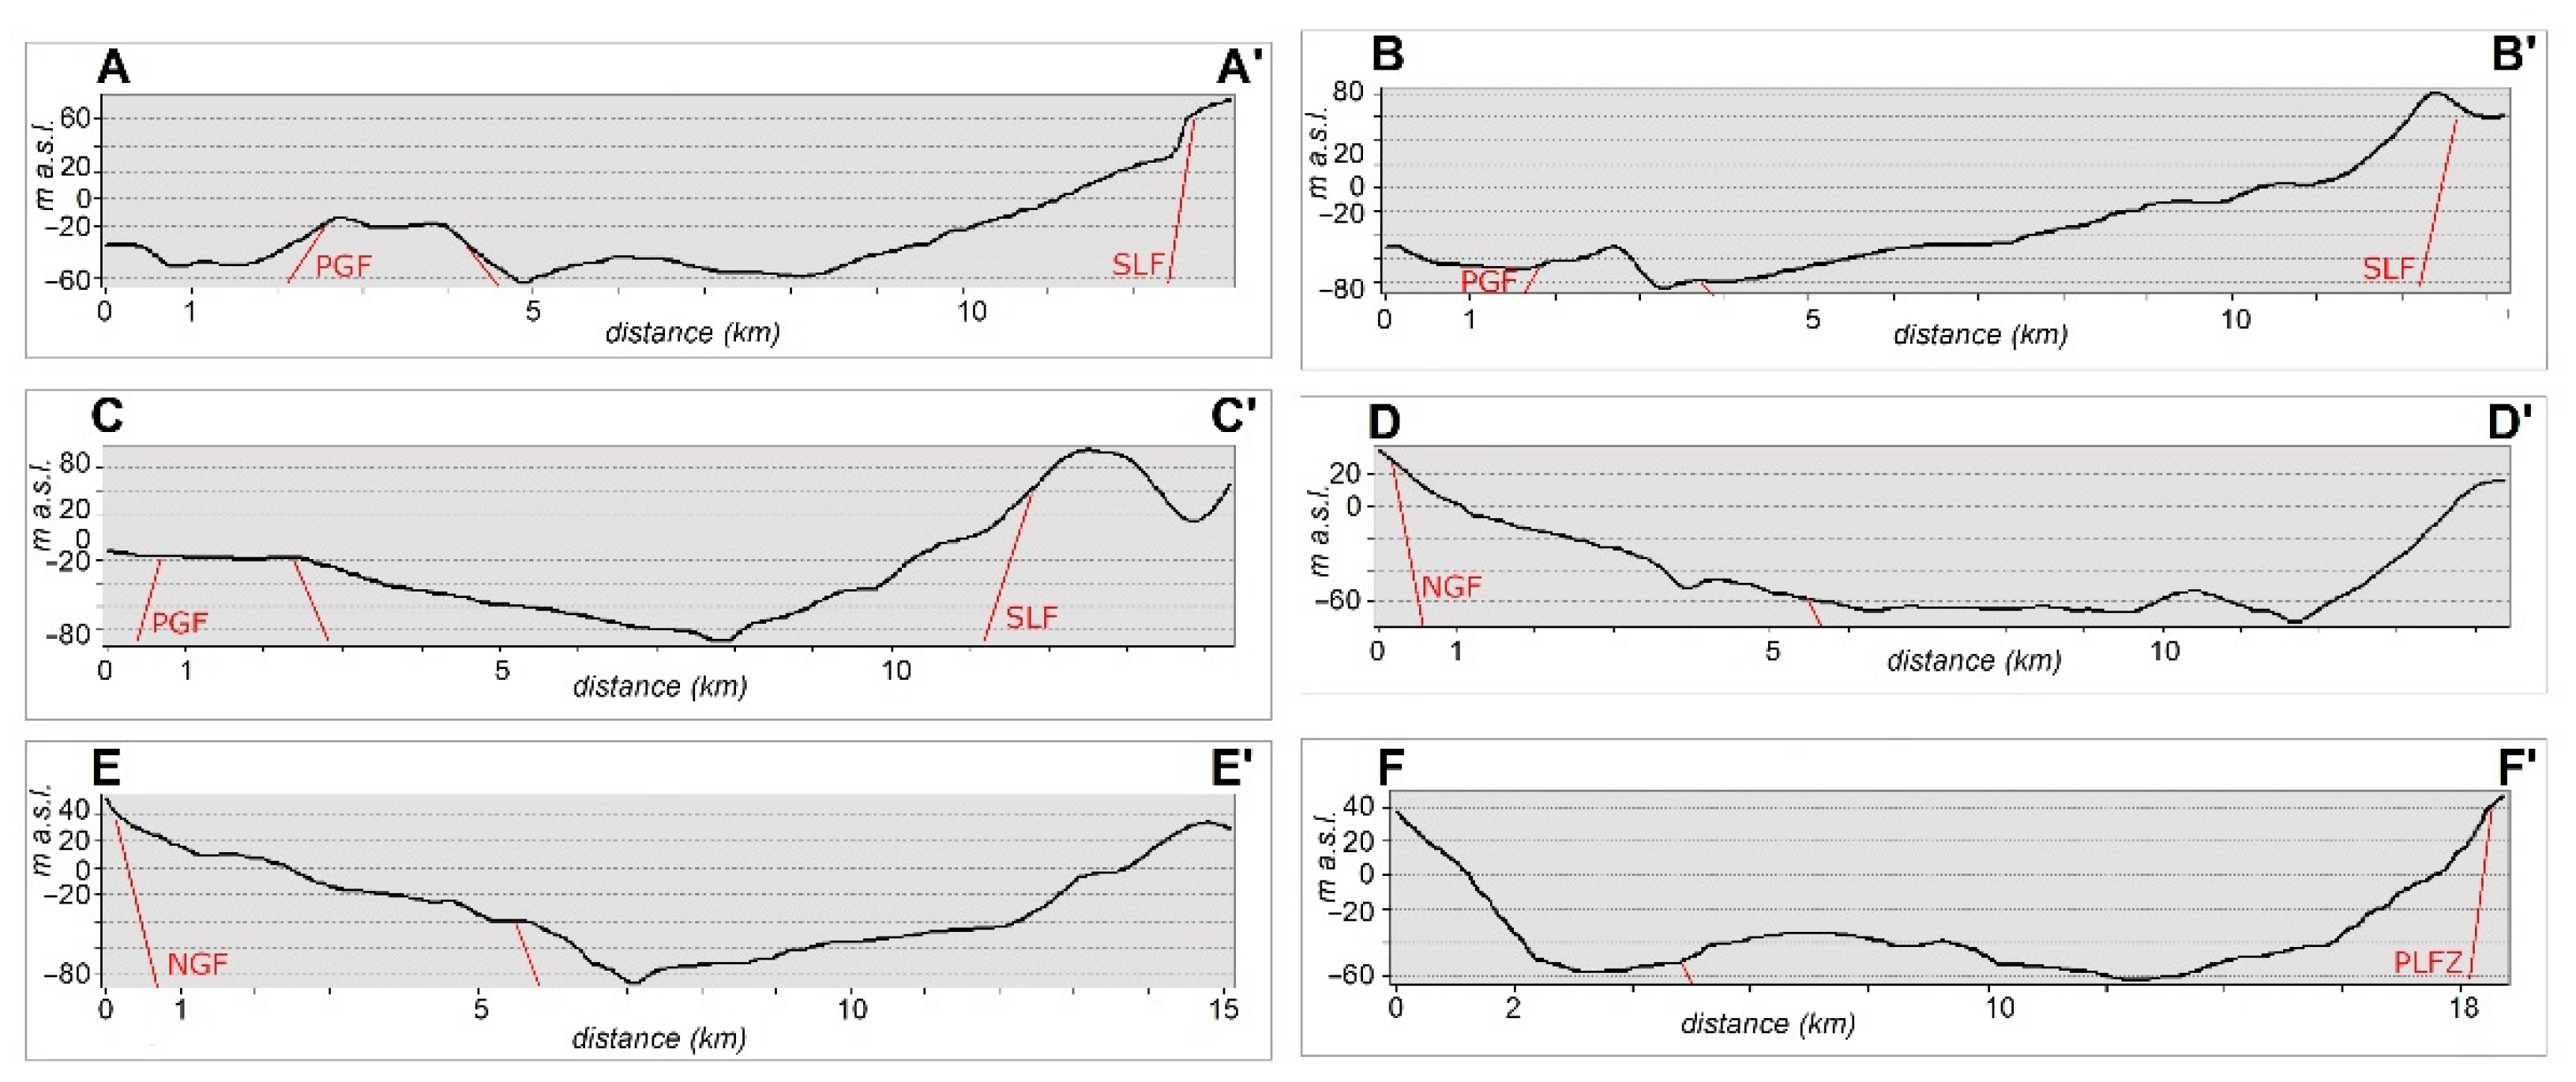
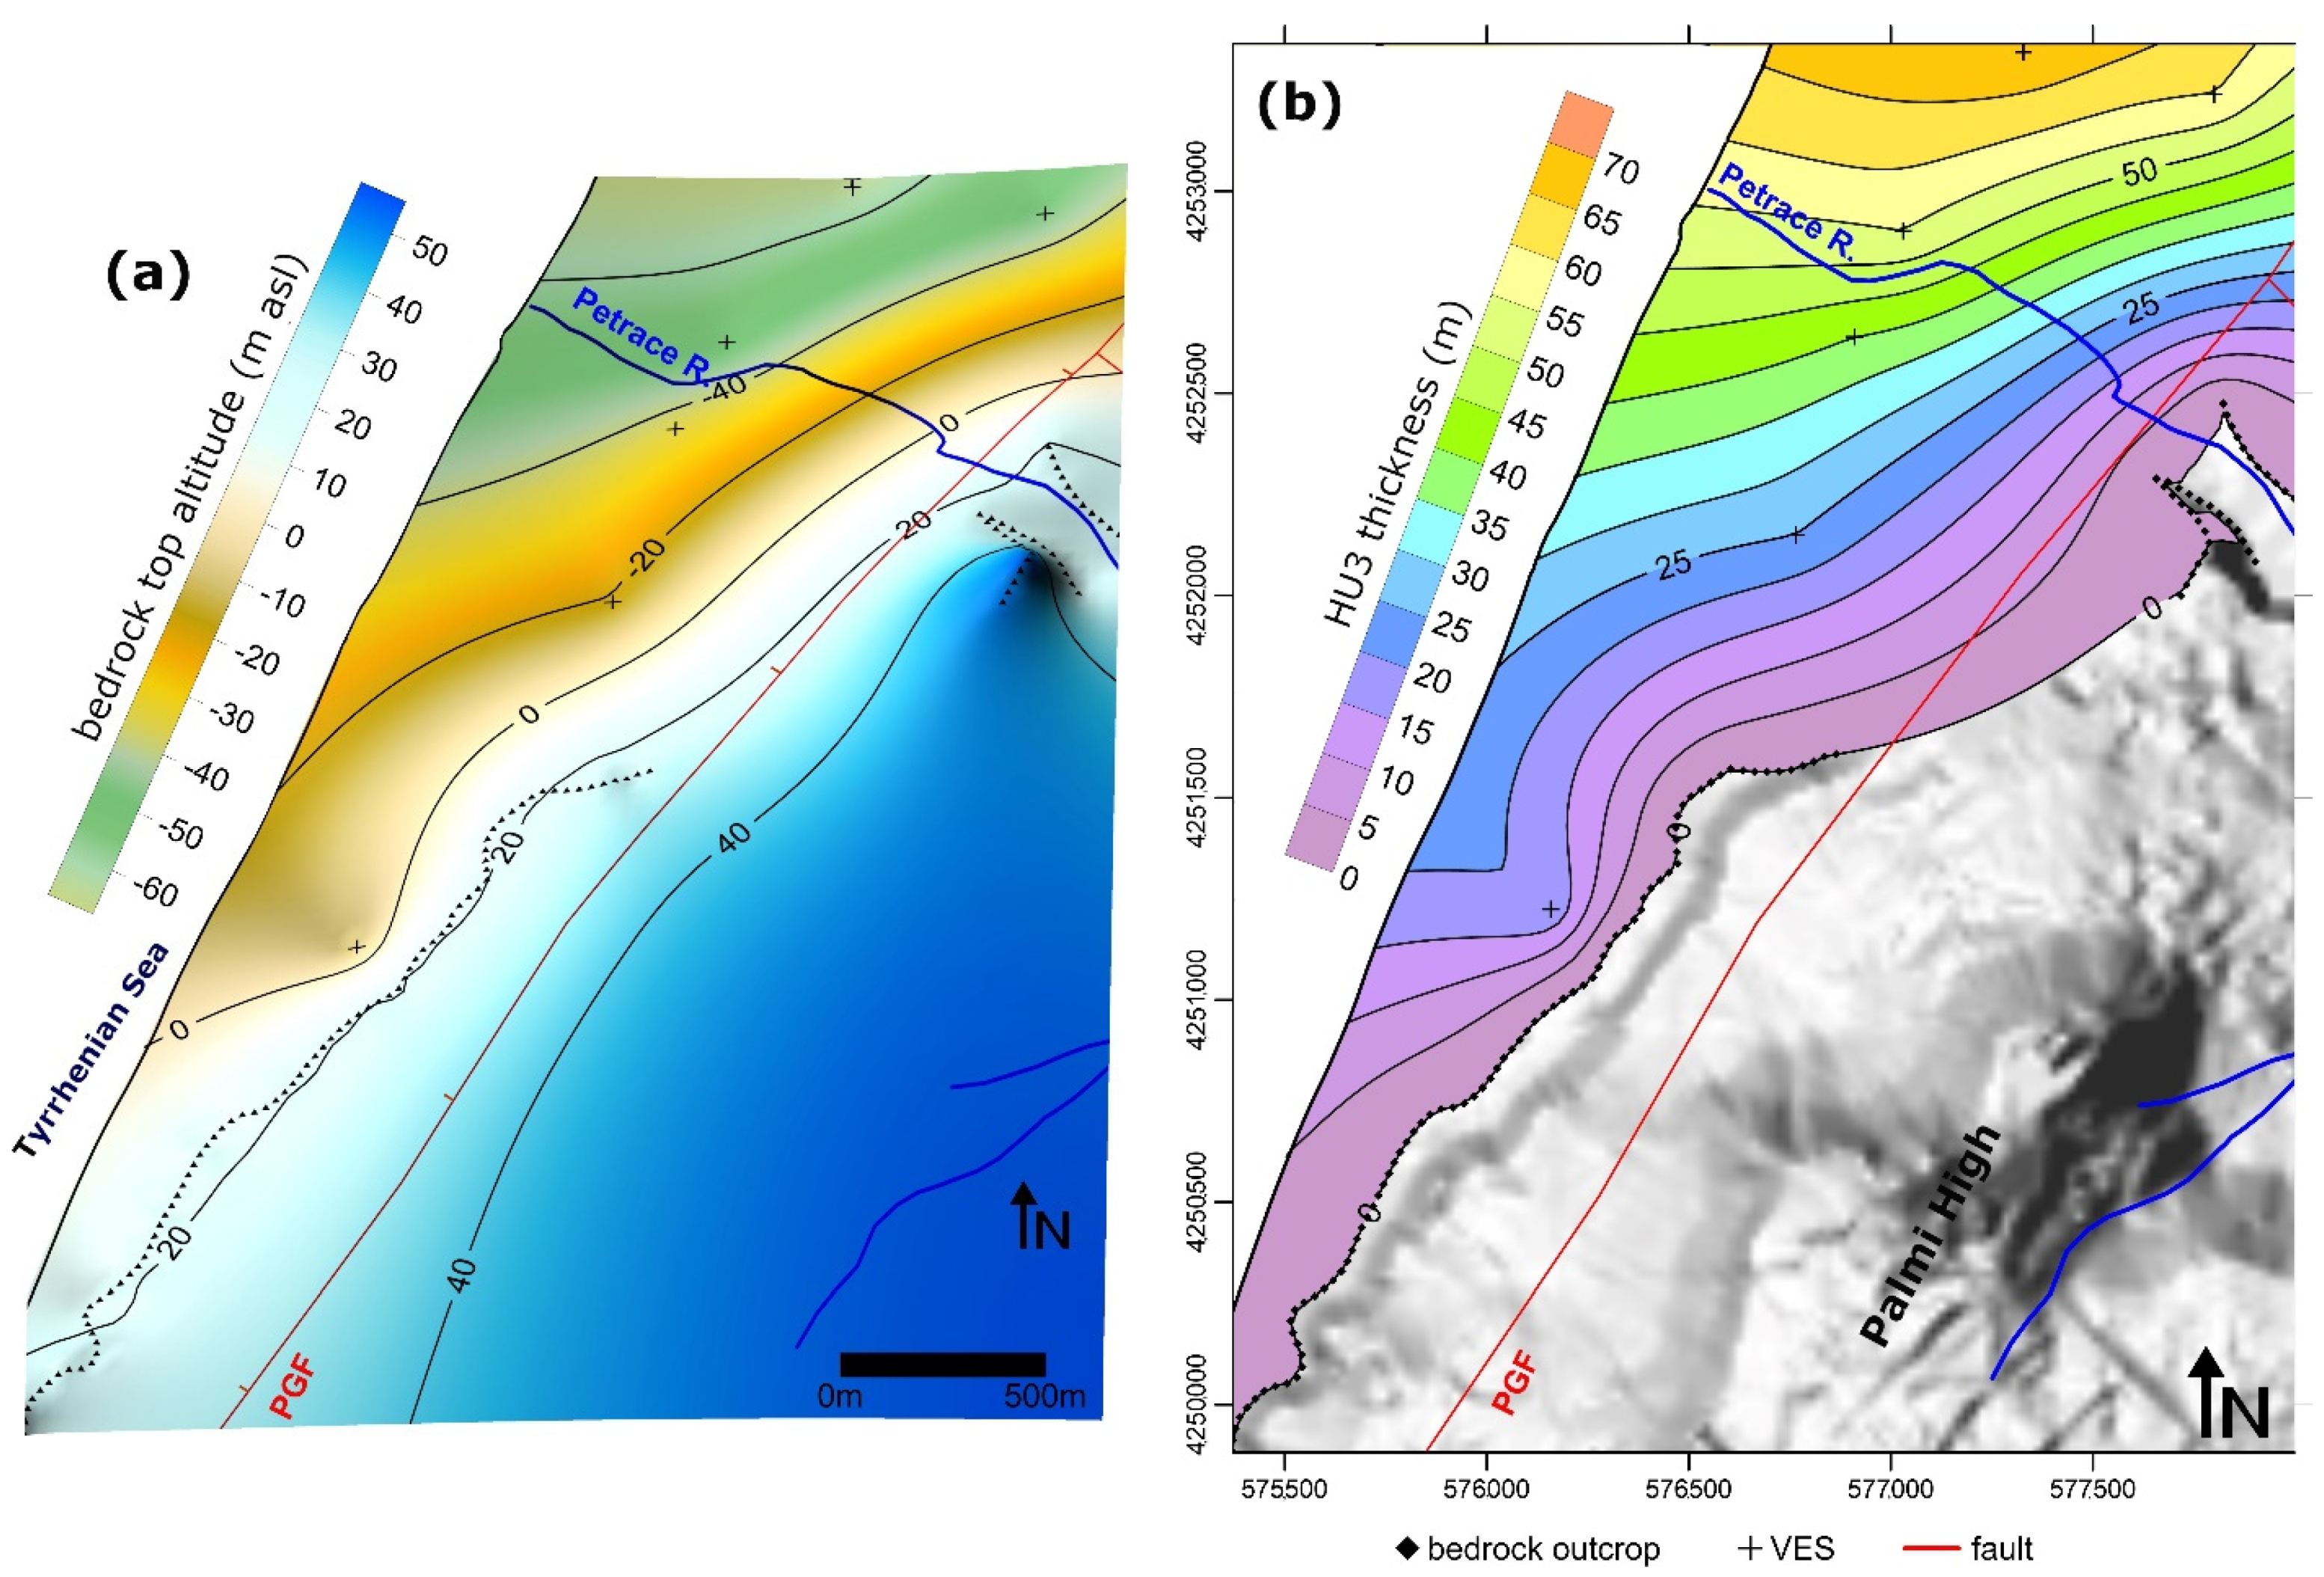
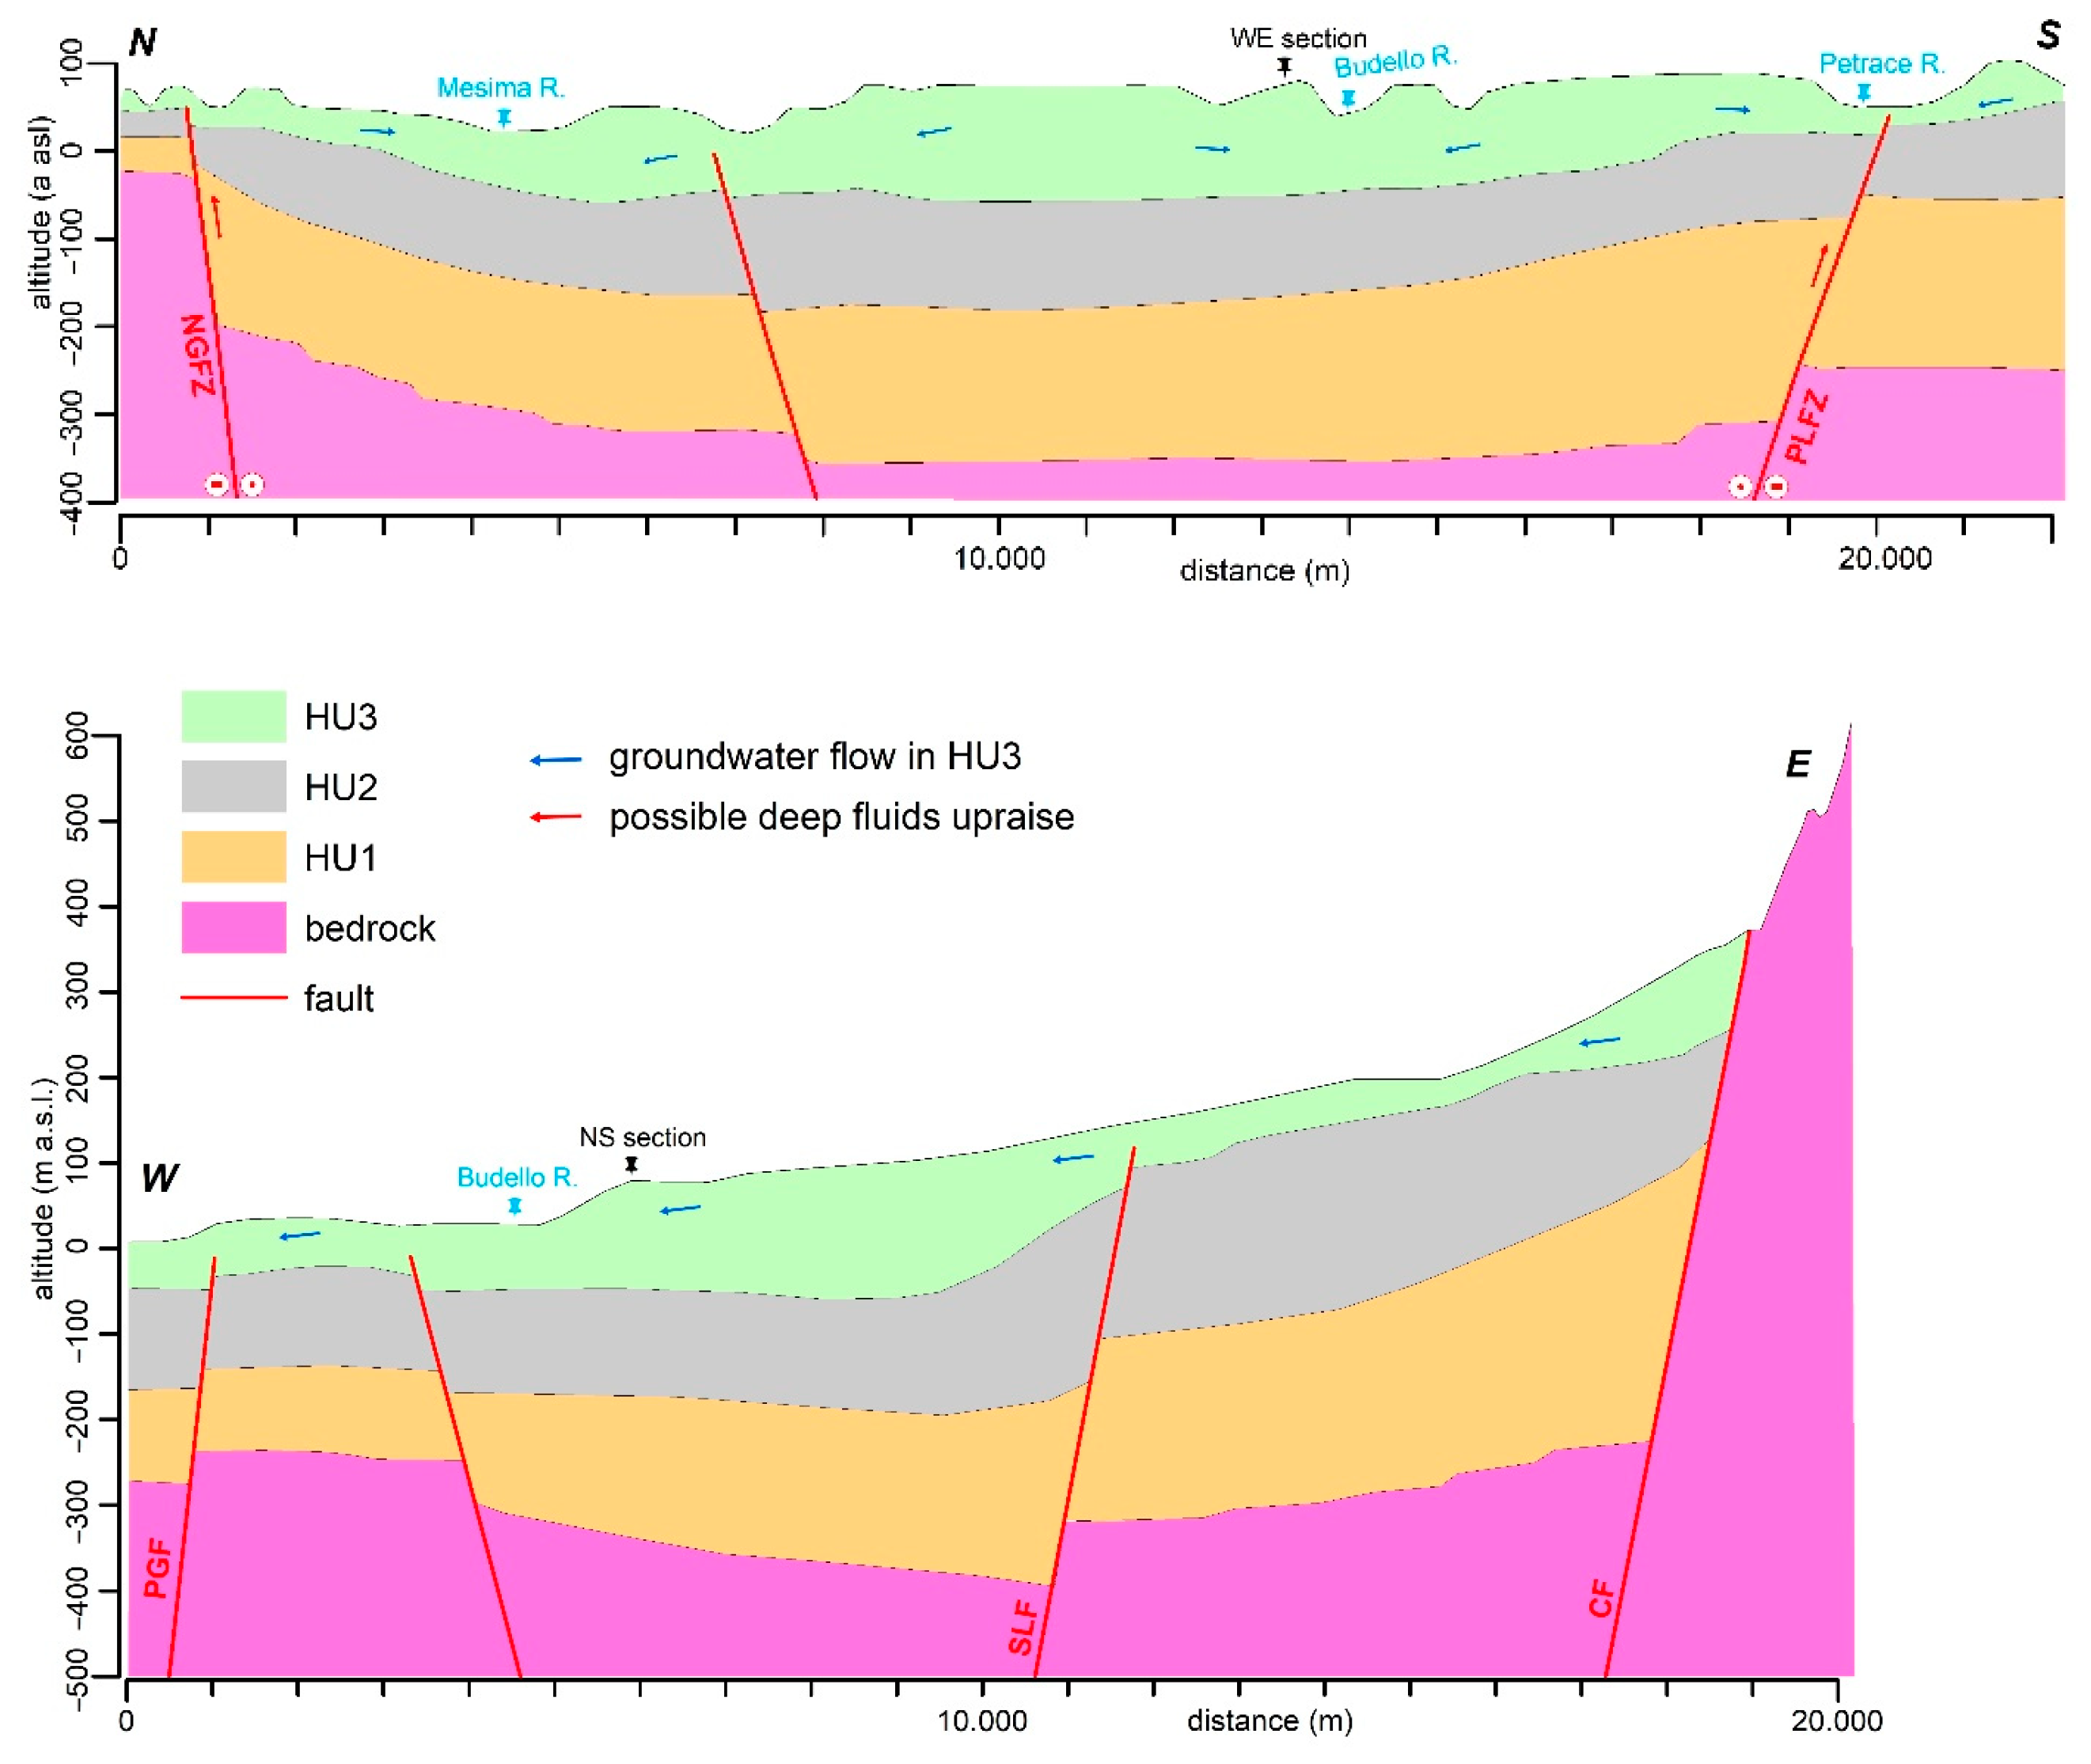
4.1. Lithology and Geometry of the Hydro-Stratigraphic Units

According to the geological data, the sedimentary sequences were divided into three hydrogeological units (HU1 to HU3, from bottom to top), derived from boreholes and in situ surveys. HU1 represents the deep aquifer hosted in Late Miocene siliciclastic deposits and limestones, which unconformably cover the igneous-metamorphic bedrock (mainly consisting of granitoids). The Late Miocene succession, mainly cropping out along the northern (Monte Poro massif) and southern (Palmi high) GTP boundaries, includes lithified arenites and conglomerates, and limestones (microbialites), all characterised by fracture permeability. The HU1 is lowered by the faults surrounding the plain, its top reaching a maximum depth of about 0.8 s of TWT (two-way travel time), as shown by exploration seismic profiles [22].
HU2 (aquiclude) comprises the Pliocene clayey and silty deposits of the Trubi Formation. The thickness of HU2 roughly ranges from 100 to 200 m. This unit crops out along the GTP boundaries and is lowered by the faults in the middle sector. The Digital Surface Model of the HU2 top (Figure 3a) highlights a complex pattern. In the northern sector, the Digital Surface Model (Figure 3a), and the AA’ and BB’ transversal profiles (Figure 4) show a depth of HU2 top between −60 and −40 m a.s.l. in the first 2 km eastward from the coastline, while it uplifts up to −20 m a.s.l. in the following 2 km. Proceeding eastward, the HU2 top reaches a maximum depth between −60 and −80 m a.s.l. Beyond this, it progressively uplifts up to 80 m a.s.l. in correspondence with the eastern GTP boundary. In the southern sector, the HU2 top is characterised by a deepening from the coastal to the middle sector (from −20 to −80 m a.s.l. in CC’ profile) and a subsequent uplift toward est. In the DD’, EE’ and FF’ longitudinal profiles (Figure 4), the deepening of the HU2 top (up to −80 m a.s.l.) can be recognised between the northern and southern GTP boundaries. The EE’ profile clearly shows a slope break of the HU2 top profile between 6 and 7 km from the north. At the whole plain scale, the Digital Surface Model of the HU2 top shows a main N-S striking depozone in the middle sector of the GTP.
The HU2 top deepening, from east to west, can be related to the CF and SLF, NE-SW striking, and WNW-dipping normal fault [22,23]. Furthermore, in our reconstruction, it is possible to observe an uplift of the HU2 top located between the NE-SW striking PGF and the parallel fault, respectively, with regard to the WNW- and ESE-dipping between the coastline and middle sector of the GTP. The presence of this structural high in the GTP, in continuity with the Palmi high, is in agreement with bibliographic sources [22,23,26,30]. The HU2 top deepening increases eastward again from PGF. In addition, in the southern GTP sector, the transversal profile CC’ (Figure 4) displays eastward tilting, which matches the geological cross-section proposed by the Reference [23]. Along the south of the GTP boundary, the Digital Surface Model shows a deepening of the HU2 top across PLFZ, a NW-SE striking and NE-dipping fault zone [22], while in the southwestern sector, the HU2 crops out on the Palmi High. According to our reconstruction, along the northern GTP boundary, the HU2 top deepening occurs in correspondence with the NGFZ NW-SE striking and SW-dipping main fault. Moreover, along a secondary fault (NW-SE striking and SW-dipping) of NGFZ, crossed by the Mesima River mouth [22], the Digital Surface Model and the longitudinal profiles (in particular, EE’) (Figure 4) record an additional deepening of the HU2 top toward the south.
The shallow and unconfined aquifer (HU3) groups the deposits from the Late Pliocene to Holocene. The HU3 bottom consists of the Calcareniti di Vinco (Late Pliocene-Pleistocene), including cross-bedded sands and calcarenites up to 70 m thick and locally cropping out along the GTP boundary. Upward, in the inner GTP sector, the HU3 includes the alluvial fan deposits (up to 30–35 m thick) of the Sintema di Taurianova (Late Pleistocene) made by clast-supported conglomerates, sands, and gravelly, silty and clayey sands. Instead, in the central portion of GTP, on top of the Calcareniti di Vinco, the HU3 continues with terraced marine deposits mainly composed of sand and silty sand with locally clayey silt intercalations (Middle-Upper Pleistocene) and terraced alluvial fan gravels (Late Pleistocene–Holocene). Finally, the HU3 top includes different Holocene deposits: coarse-grained alluvial sediments along the main rivers and streams, coarse aeolian sands of the two inland dune fields (located southward from the Nicotera Marina and Rosarno villages, respectively), modern coastal sediments, and detrital and gravitative deposits. Locally, in the sector northward of the Mesima mouth, the Holocene deposits are characterised by the presence of peat (recorded by boreholes, Figure 1).
The isopach map shows that HU3 (Figure 3b) is as thick as >100 m in a N-S striking area in the central part of GTP, while close to Taurianova, it reaches about 260 m. The HU3 depth is ca. 80 m around Polistena and close to Gioia Tauro’s harbour area, which is in the western-middle and eastern-middle sectors of the GTP, respectively.
We also investigated the spatial pattern of the HU3 thickness (Figure 5b), which was >100 m in the SE and middle sectors of GTP in correspondence to the depozone related to the so-called Gioia Tauro Extensional Fault System [22]. The maximum thickness, up to 260 m, was recorded on the hanging wall of CF between Taurianova and Polistena (Figure 1) where a negative Bouguer anomaly (−10 mGal) was shown by the Ref. [42]. Toward the coastline, high values (up to 100 m) were determined close to the Gioia Tauro harbour. In contrast, low values were observed in the surroundings of Gioia Tauro (20–40 m) and in the NW GTP sector (20–60 m) on the footwall of the NW-SE striking fault crossed by the Mesima River mouth.
In the area between the mouth of the Petrace River and Scinà (inset an in Figure 1), the hydrostratigraphic pattern differs from the rest of GTP, being characterised by HU3 and lying directly on the igneous-metamorphic bedrock. In this area, HU3 is hosted in fluvio-deltaic (mainly coarse-grained bedload) sediments at the mouth of the Petrace River and coastal deposits to the south. The Digital Surface Model of the bedrock top (Figure 5a) shows progressive deepening, up to about −65 m a.s.l., toward NW. In the isopach map (Figure 5b), the HU3 thickens up to 70 m along a prevalent SE-NW direction. In this area, the deepening toward NW of contact between the HU3 bottom and the igneous-metamorphic bedrock is clearly conditioned by NE-SW striking and WNW-dipping PGF. To summarise, our spatial reconstruction of the HU2 top depth shows a good correlation with the GTP structural setting.

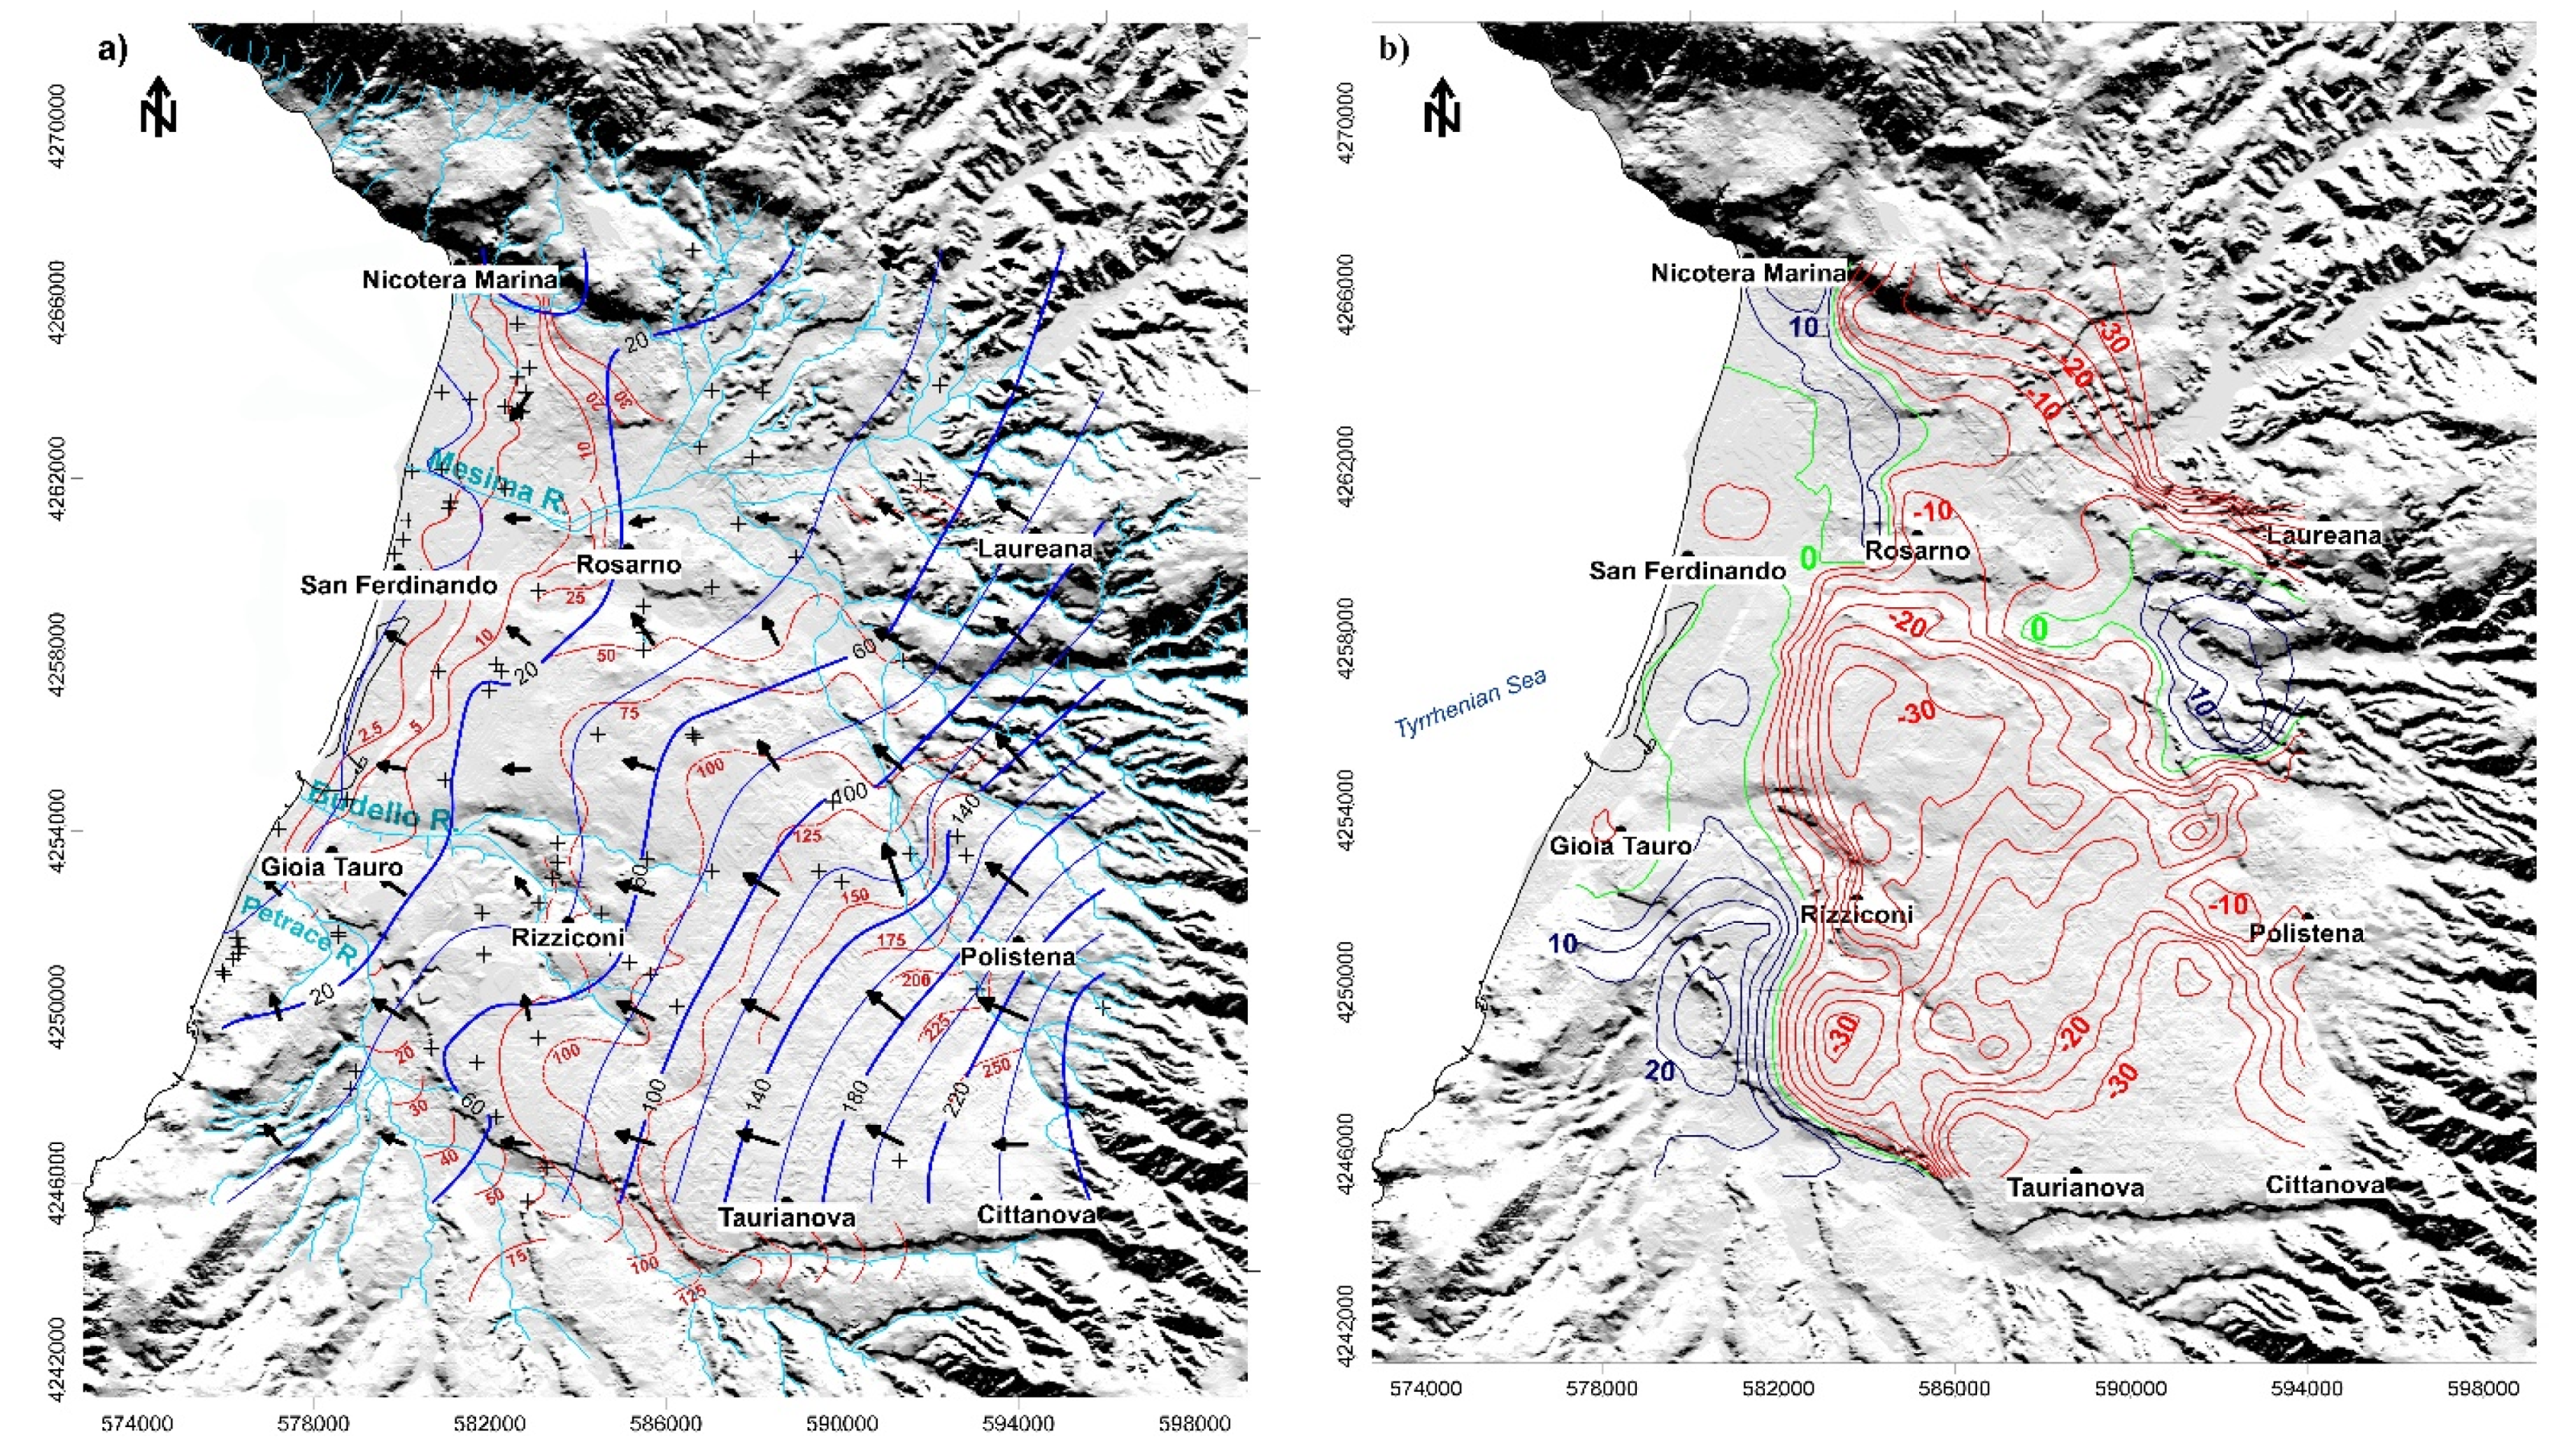
4.2. Hydrography and Groundwater Surface

The GTP hydrograph pattern shows a relatively simple structure characterised by three main sub-basins: (i) The Mesima basin located in the northern sector with a SW, W, and subordinately NW drainage direction; (ii) the Petrace basin, in the southern sector, showing a N and NW drainage direction; and (iii) the Budello basin positioned in the central portion showing W-NW drainage [26]. The three sub-basins show significant differences in terms of flow rates and morphological features. The central basin is represented almost exclusively by the Budello River, a torrential watercourse only fed during winter (November to March; [26]). The small size of the Budello River is due to the limited extent of its catchment. In fact, the watercourses draining the Aspromonte Massif, which should feed the Budello River, deviate towards NW and SW to the Mesima and Petrace basins, respectively. This evidence explains the absence of drainage in the central area whose extension is >50 km2. The Petrace sub-basin shows enrichment in branched waterways that become sub-parallels downstream. The waterways engrave the sediments converging then towards the Petrace River that cuts the northern portion of the Palmi High in the coast’s proximity. Finally, the Mesima Basin is characterised by the interaction with the medium-course drainage of the Mesima River, which flows for about 20 km towards SSW before reaching the coast. The Mesima River receives, close to Rosarno, the contribution of the Metramo River that flows behind (east side) the Budello basin (Figure 1).
The groundwater flow direction coincided with the hydrography, as shown in the iso-piezometric map constructed with the new data (Figure 6a). The well locations, final piezometric contour line map (blue lines), and relative flow directions are plotted in Figure 6a. The map shows a NW-SE-oriented prevalent flow direction along the eastern sector of GTP in the proximity of the recharge area (Aspromonte massif). During its migration towards the coast (NW), the flow separates into two main sub-flows that are W-E- and NW-SE-oriented, respectively, due to the presence of a wide watershed in the southern part of Rosarno. The W-E-oriented sub-flow feeds both the Budello and Petrace Basins, whereas the NW-SE-oriented one migrates northwards, feeding the Mesima Basin. By comparing the iso-piezometric maps reported in Figure 6a (new 2021 vs. 1970s [36] piezometric heads), the presence of comparable main flow directions can be highlighted.
As reported in Figure 6b, a substantial decrease in the overall piezometric level (up to −35 m from the 1970s to 2021) was observed in the middle sector of the plain among the urban centres of Rosarno, Rizziconi, Taurianova, Cittavova and Polistena. The main rise (up to 25 m from the 1970s to 2021) was recorded in correspondence with the Petrace River. A substantial unchanged level apparently characterises the coastal sector between Gioia Tauro and Nicotera Marina. The issue could be linked to, in addition to a general increase of the annual average temperatures, the continuous transformations in the last decades of GTP in terms of land use (e.g., change in crops: from olive and citrus groves to kiwi one) and urban growth, which produced an increase of groundwater overexploitation. Furthermore, the central portion of the plain, as reported above, is characterised by the presence of a wide watershed where the main flow undergoes the separation in two main sub-flows, respectively oriented as W-E and NW-SE. This asset could represent a further explanation of recorded decreases.

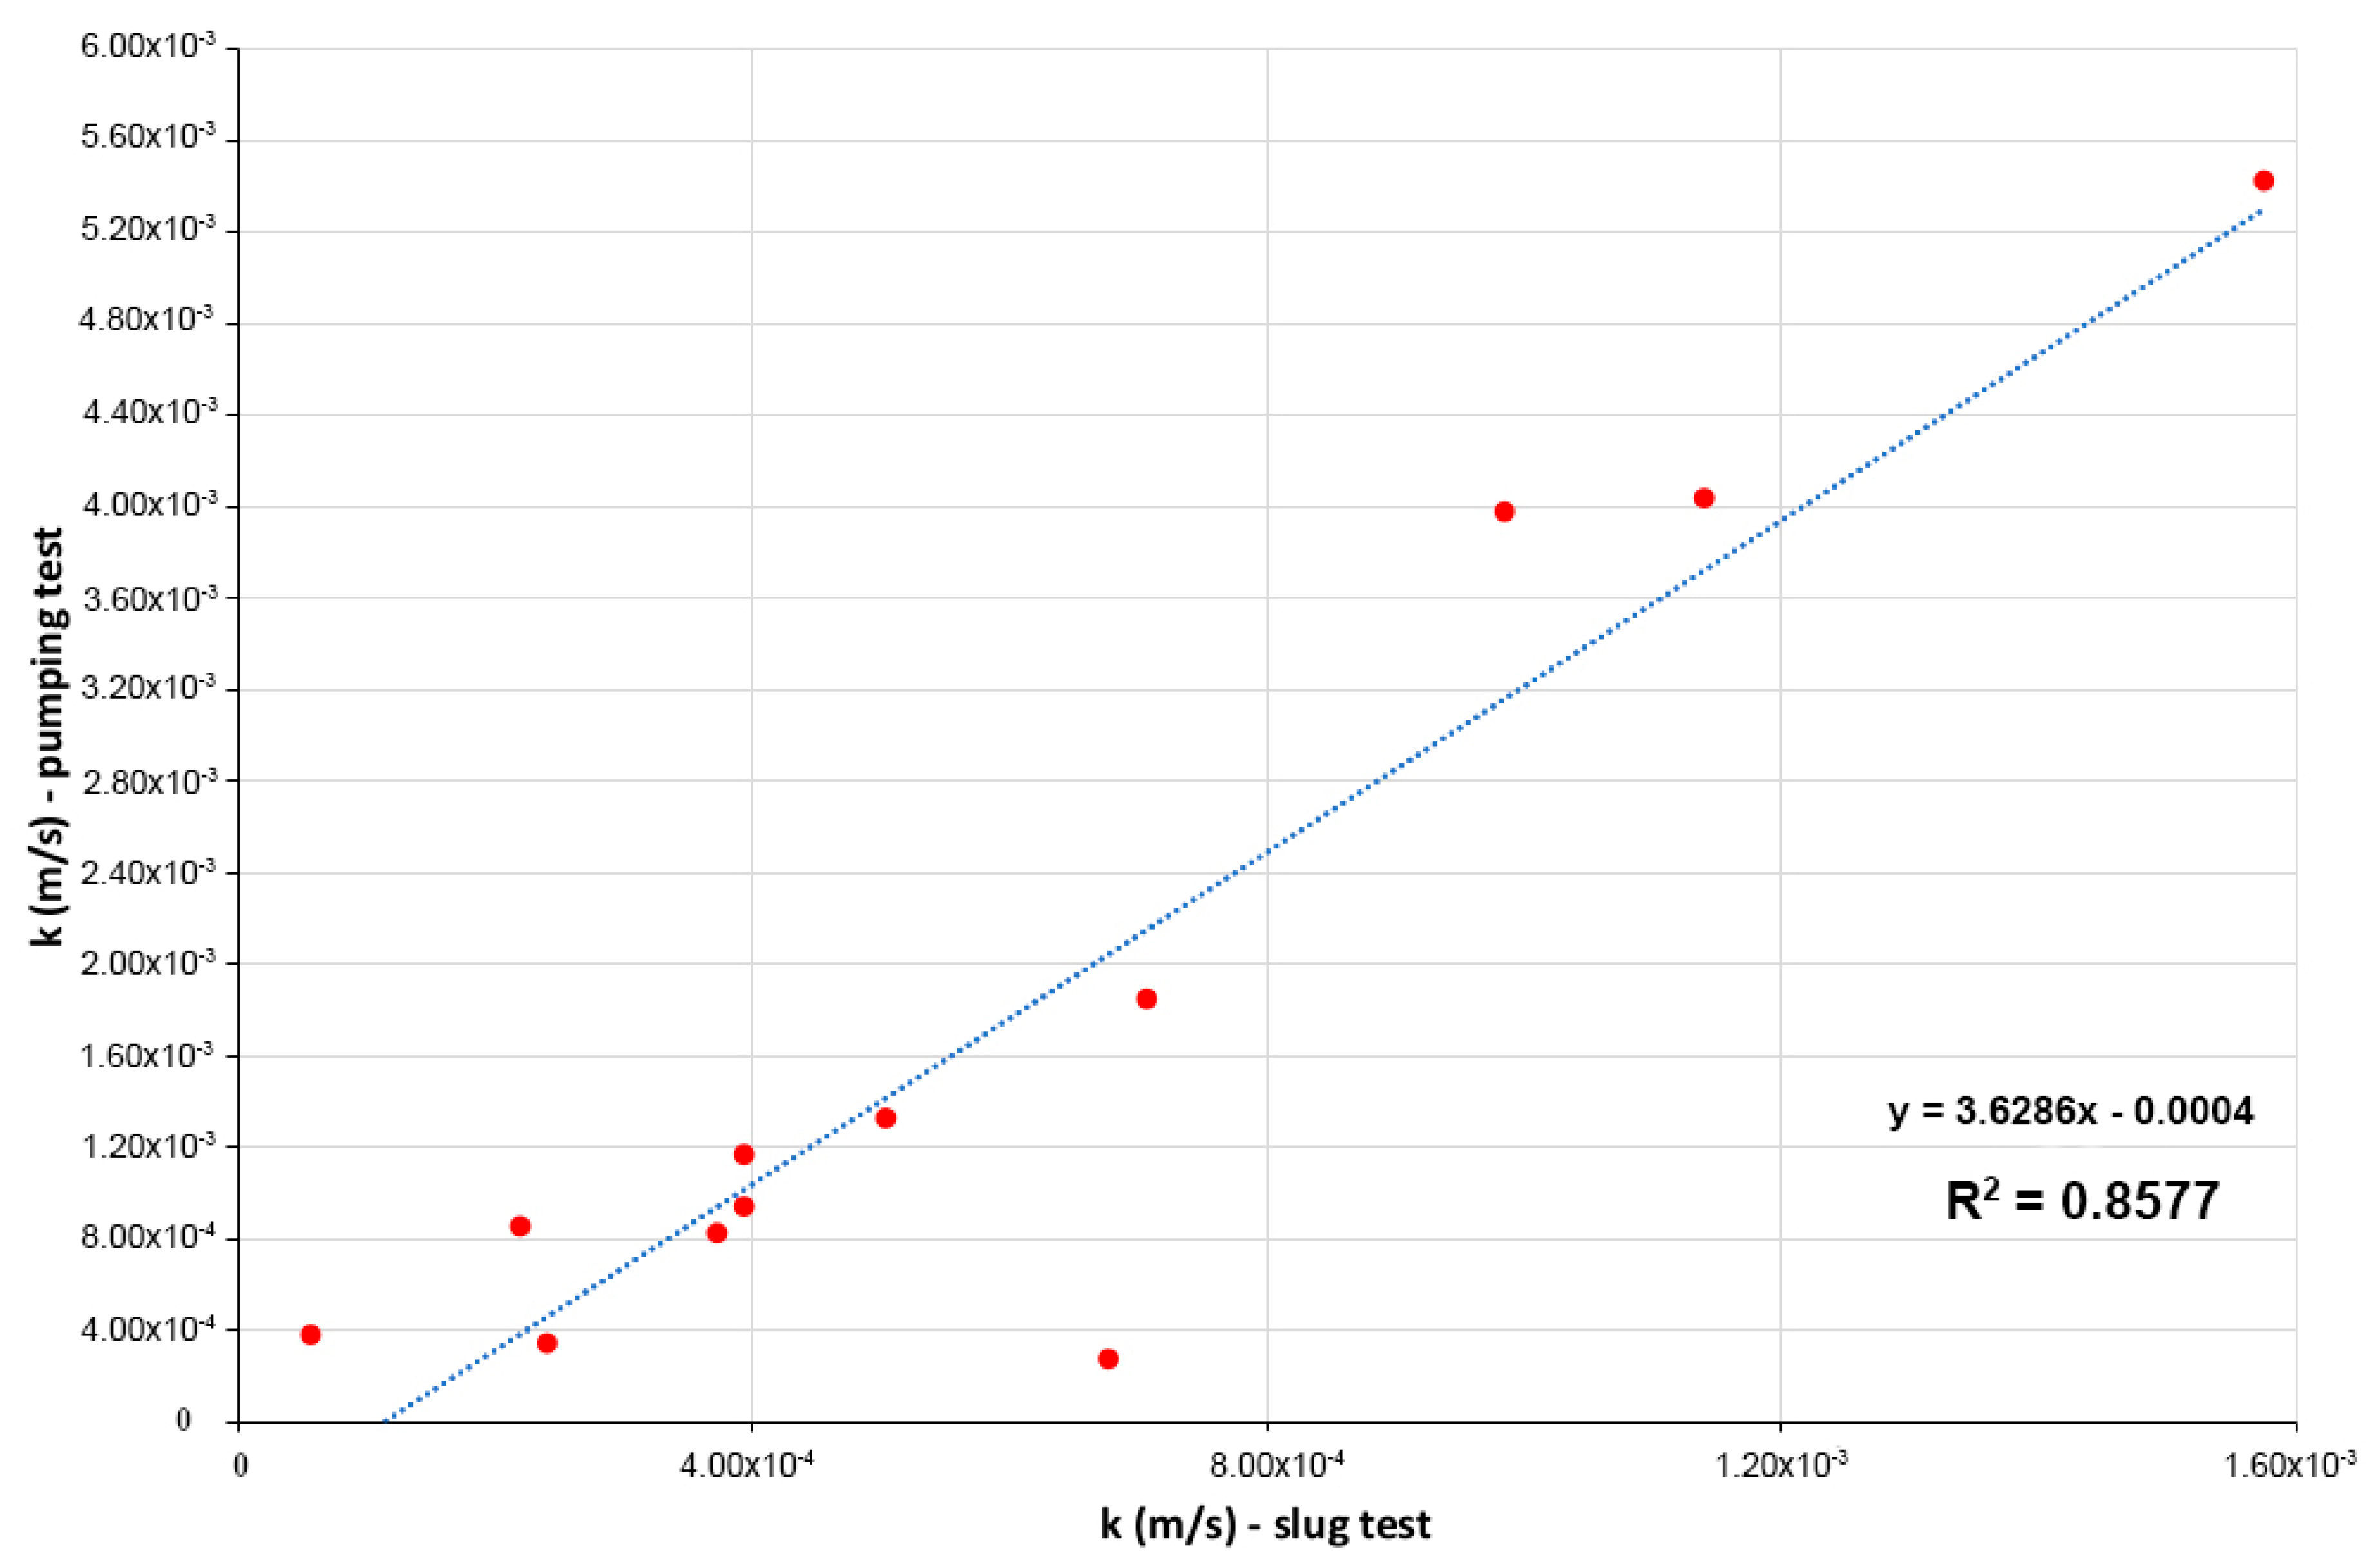
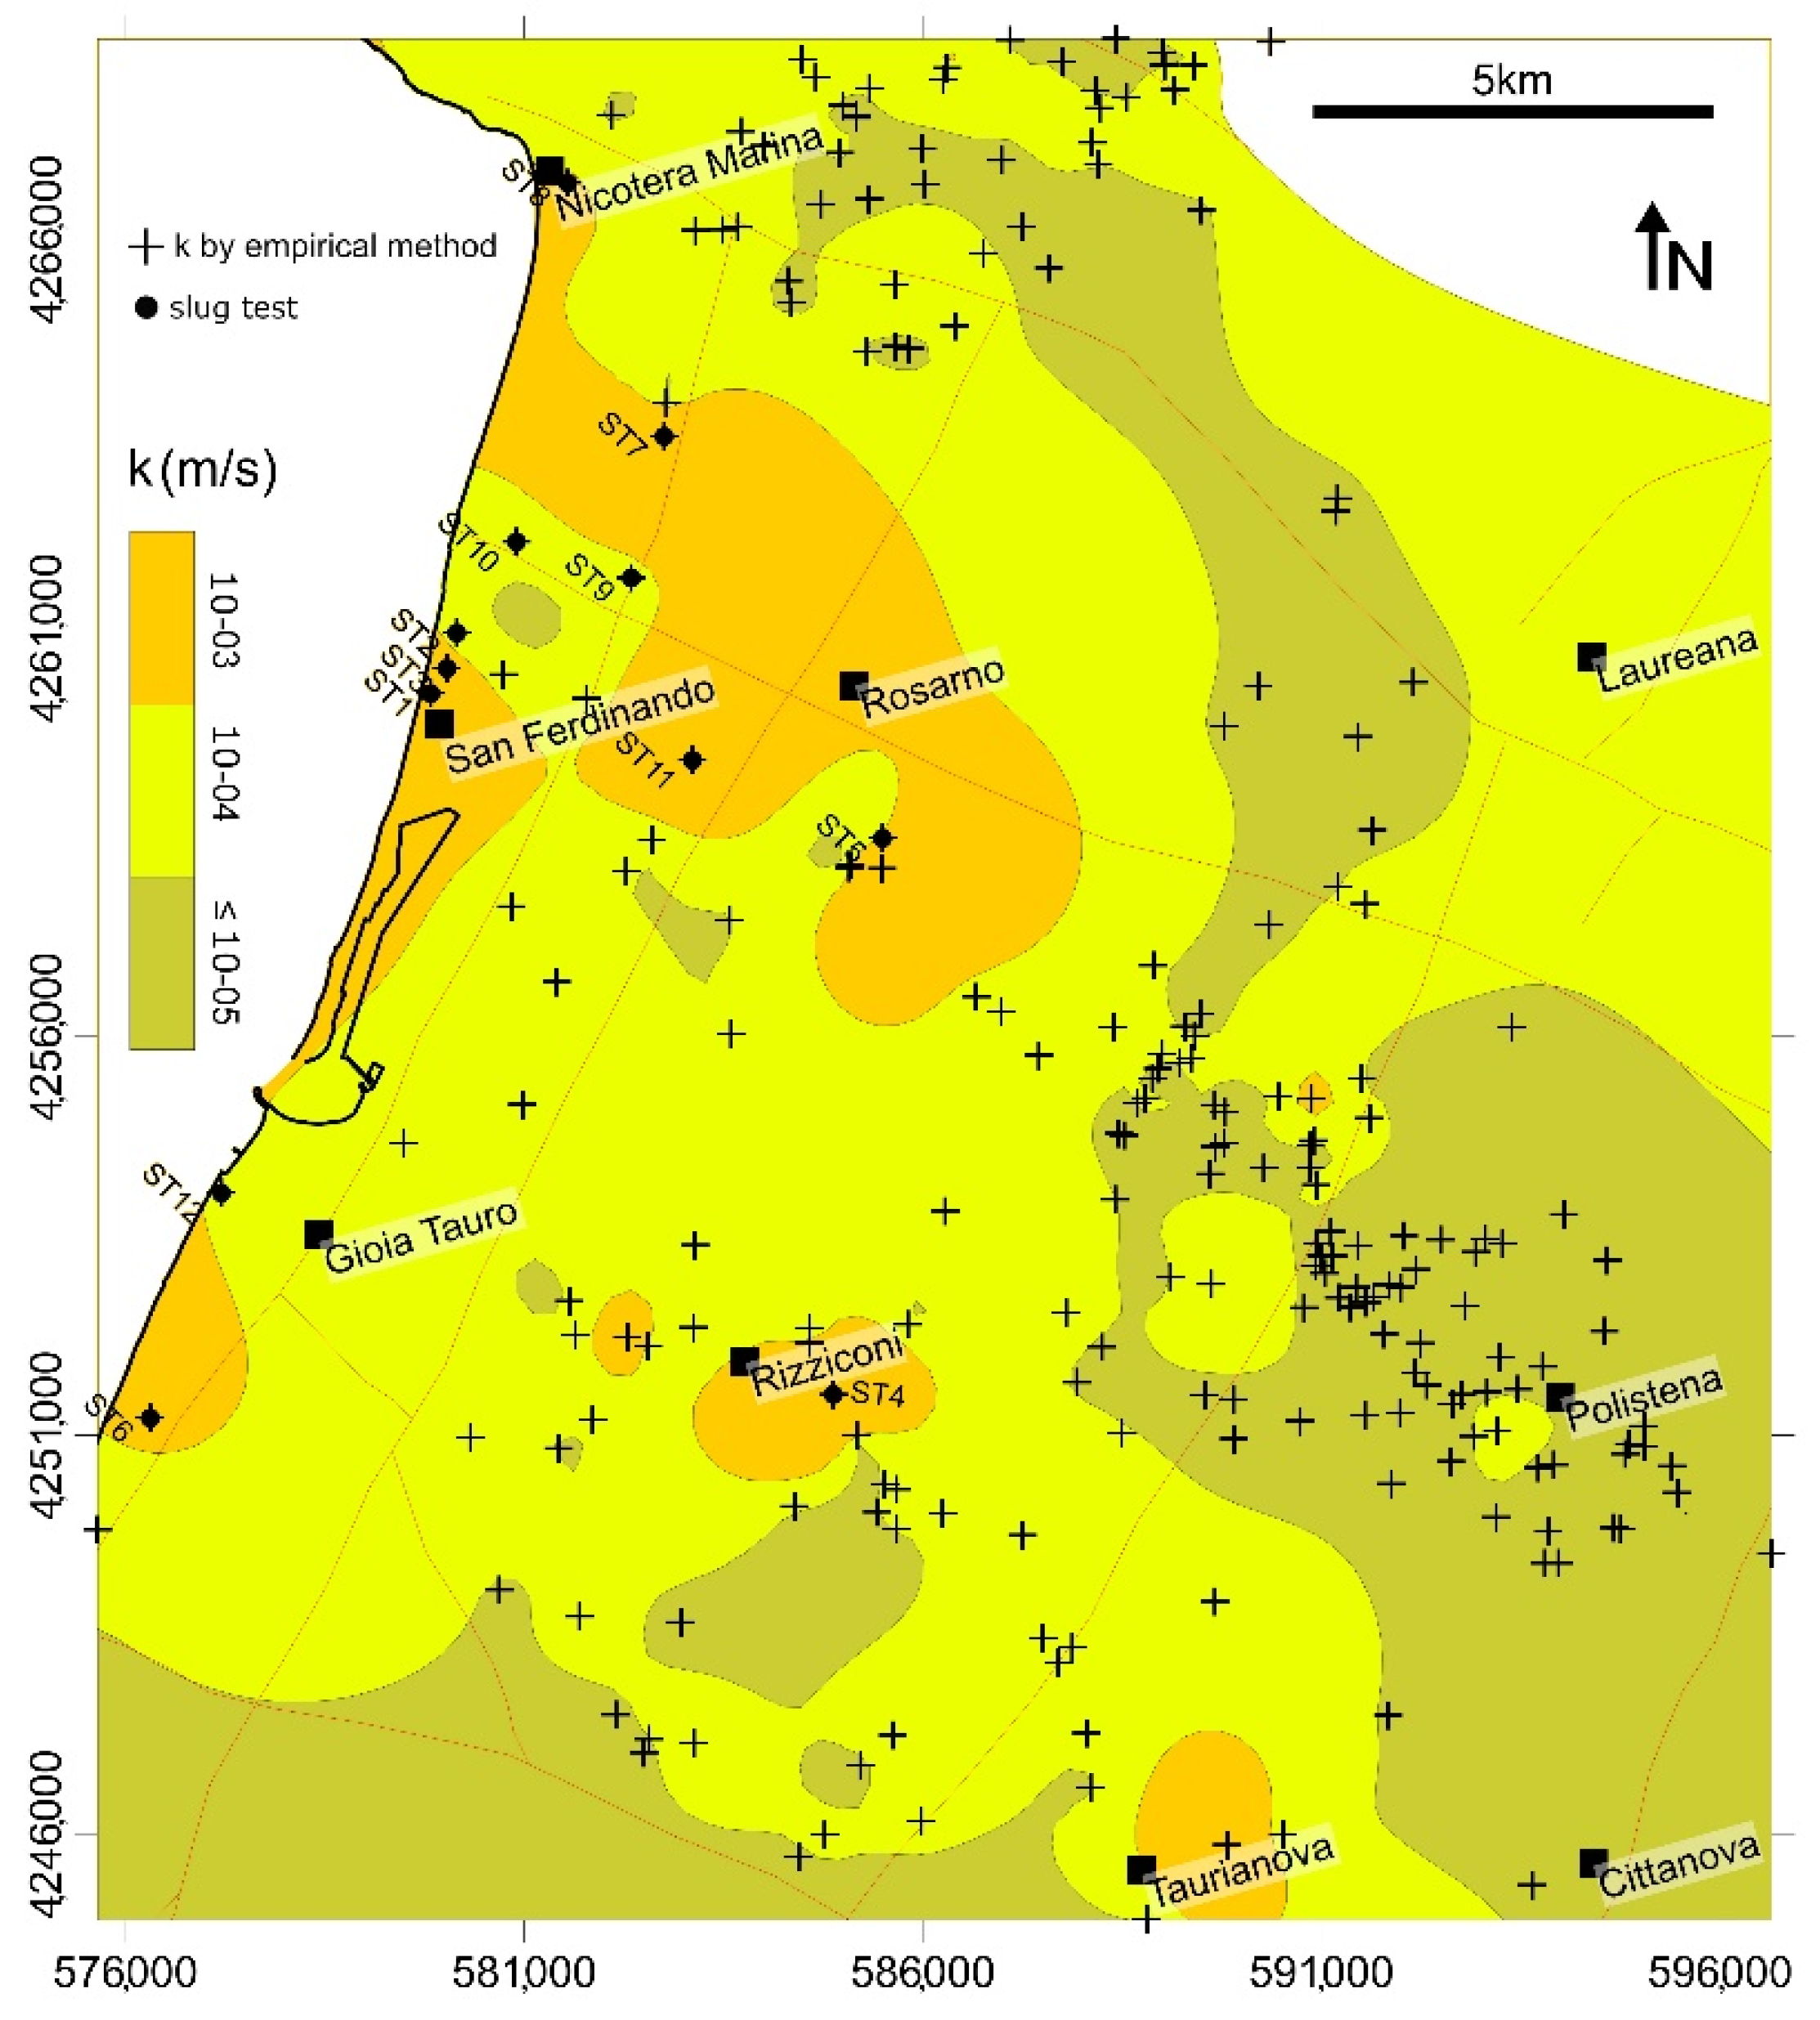
4.3. Hydraulic Properties of the Hydrogeological Aquifer Units

The hydraulic conductivity (k) of HU3 was calculated using 225 pumping test data. These data were validated by means of the values obtained through the slug test survey (Table 1). The k inferred by slug tests were mainly (9 out of 12) characterised by values of the order of magnitude of 10−4 m/s, two (ST7 and 11) of 10−3 m/s, and one (ST4) of 10−5. This variability is likely due to the different deposits hosting the upper part of HU3. The k-values of 10−4 m/s (ST1, 2, 3, 5, 6, 8, 9, 10, 12) were computed toward the coastline, where the top of HU3 consists of coastal (marine and aeolian) medium sands and alluvial (mainly sand and silty sand) deposits. On the other hand, the highest value of 10−3 m/s pertained to the inland dune fields, consisting of coarse-grained sands.
The lowest k-value of 10−5 characterises the central portion of GTP, close to Rizziconi (Figure 1), where the top of HU3 includes terraced marine deposits. The reliability of the k-values obtained in the present work is supported when compared with those reported by the Ref. [43] for the HU3 lithologies (Figure 7).
Considering this good correlation, we used the 225 empirical values to analyse the HU3 k spatial pattern at the GTP scale (Figure 8). The k-values are about 1 × 10⁻⁴ in the middle and coastal sectors, with local areas characterised by higher values (10−3), mainly found close to the inland dune fields. The lowest k-values (≤10−5) are observed in the eastern and northern GTP sectors.

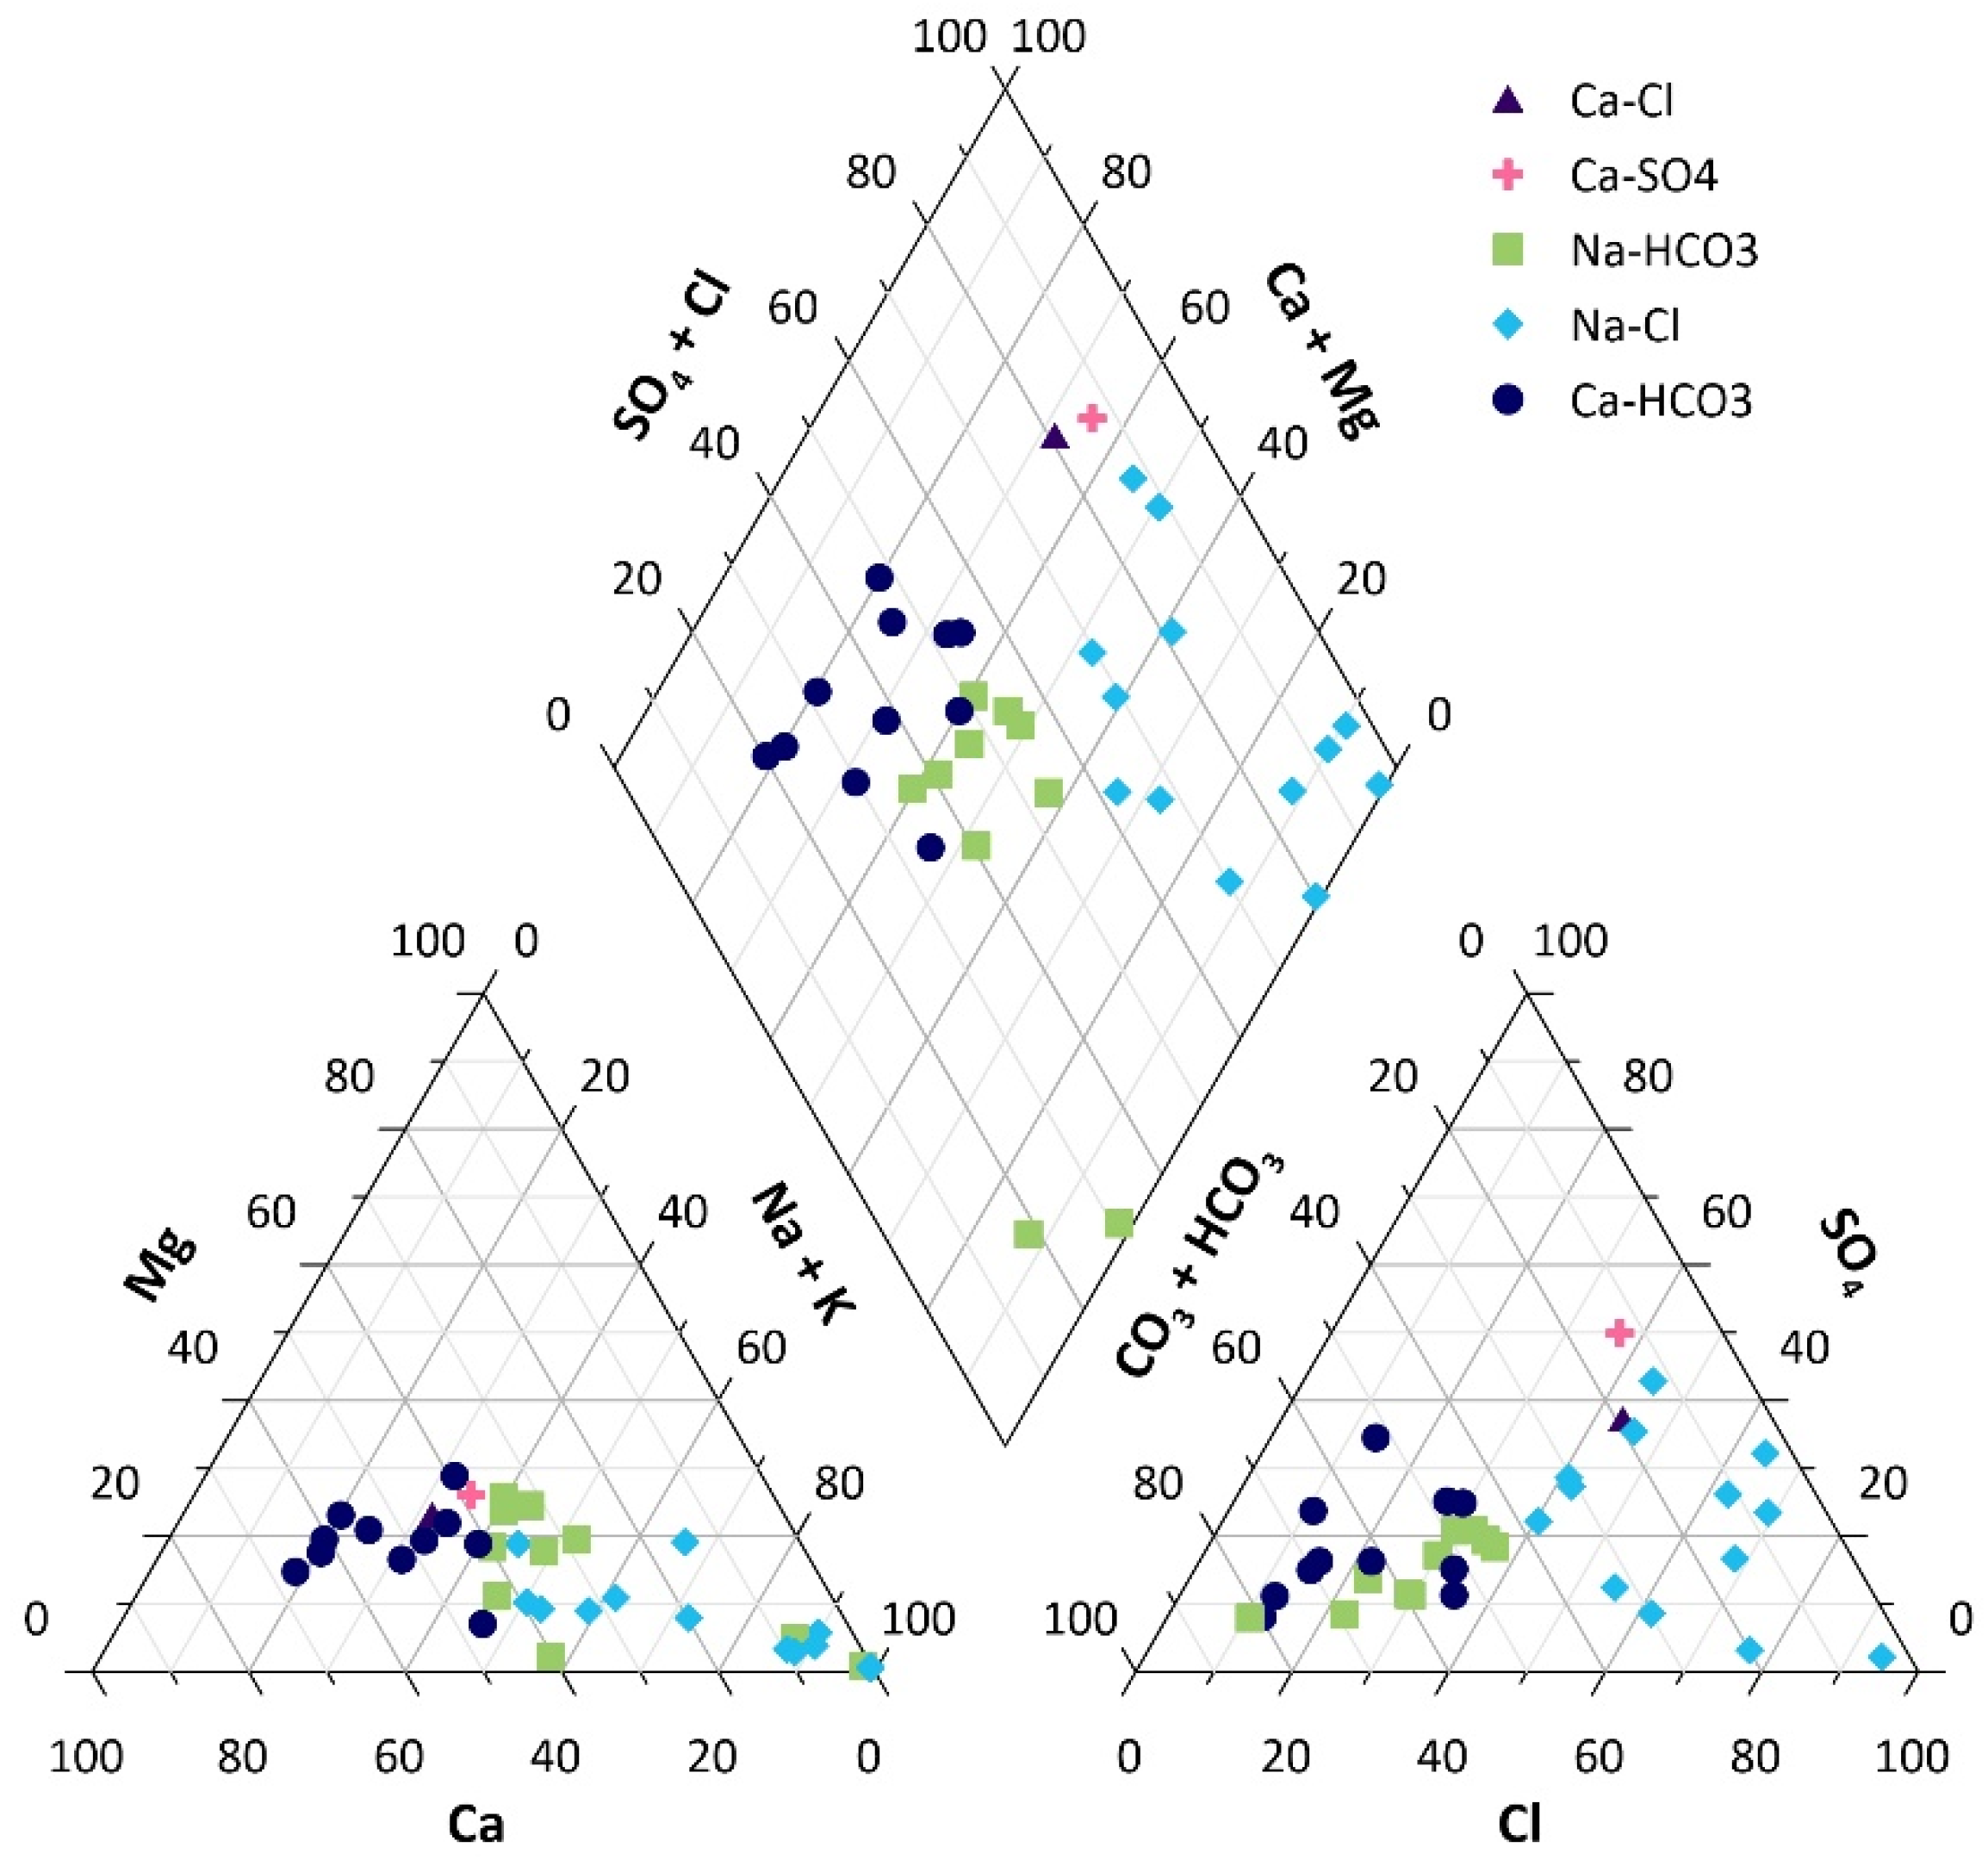
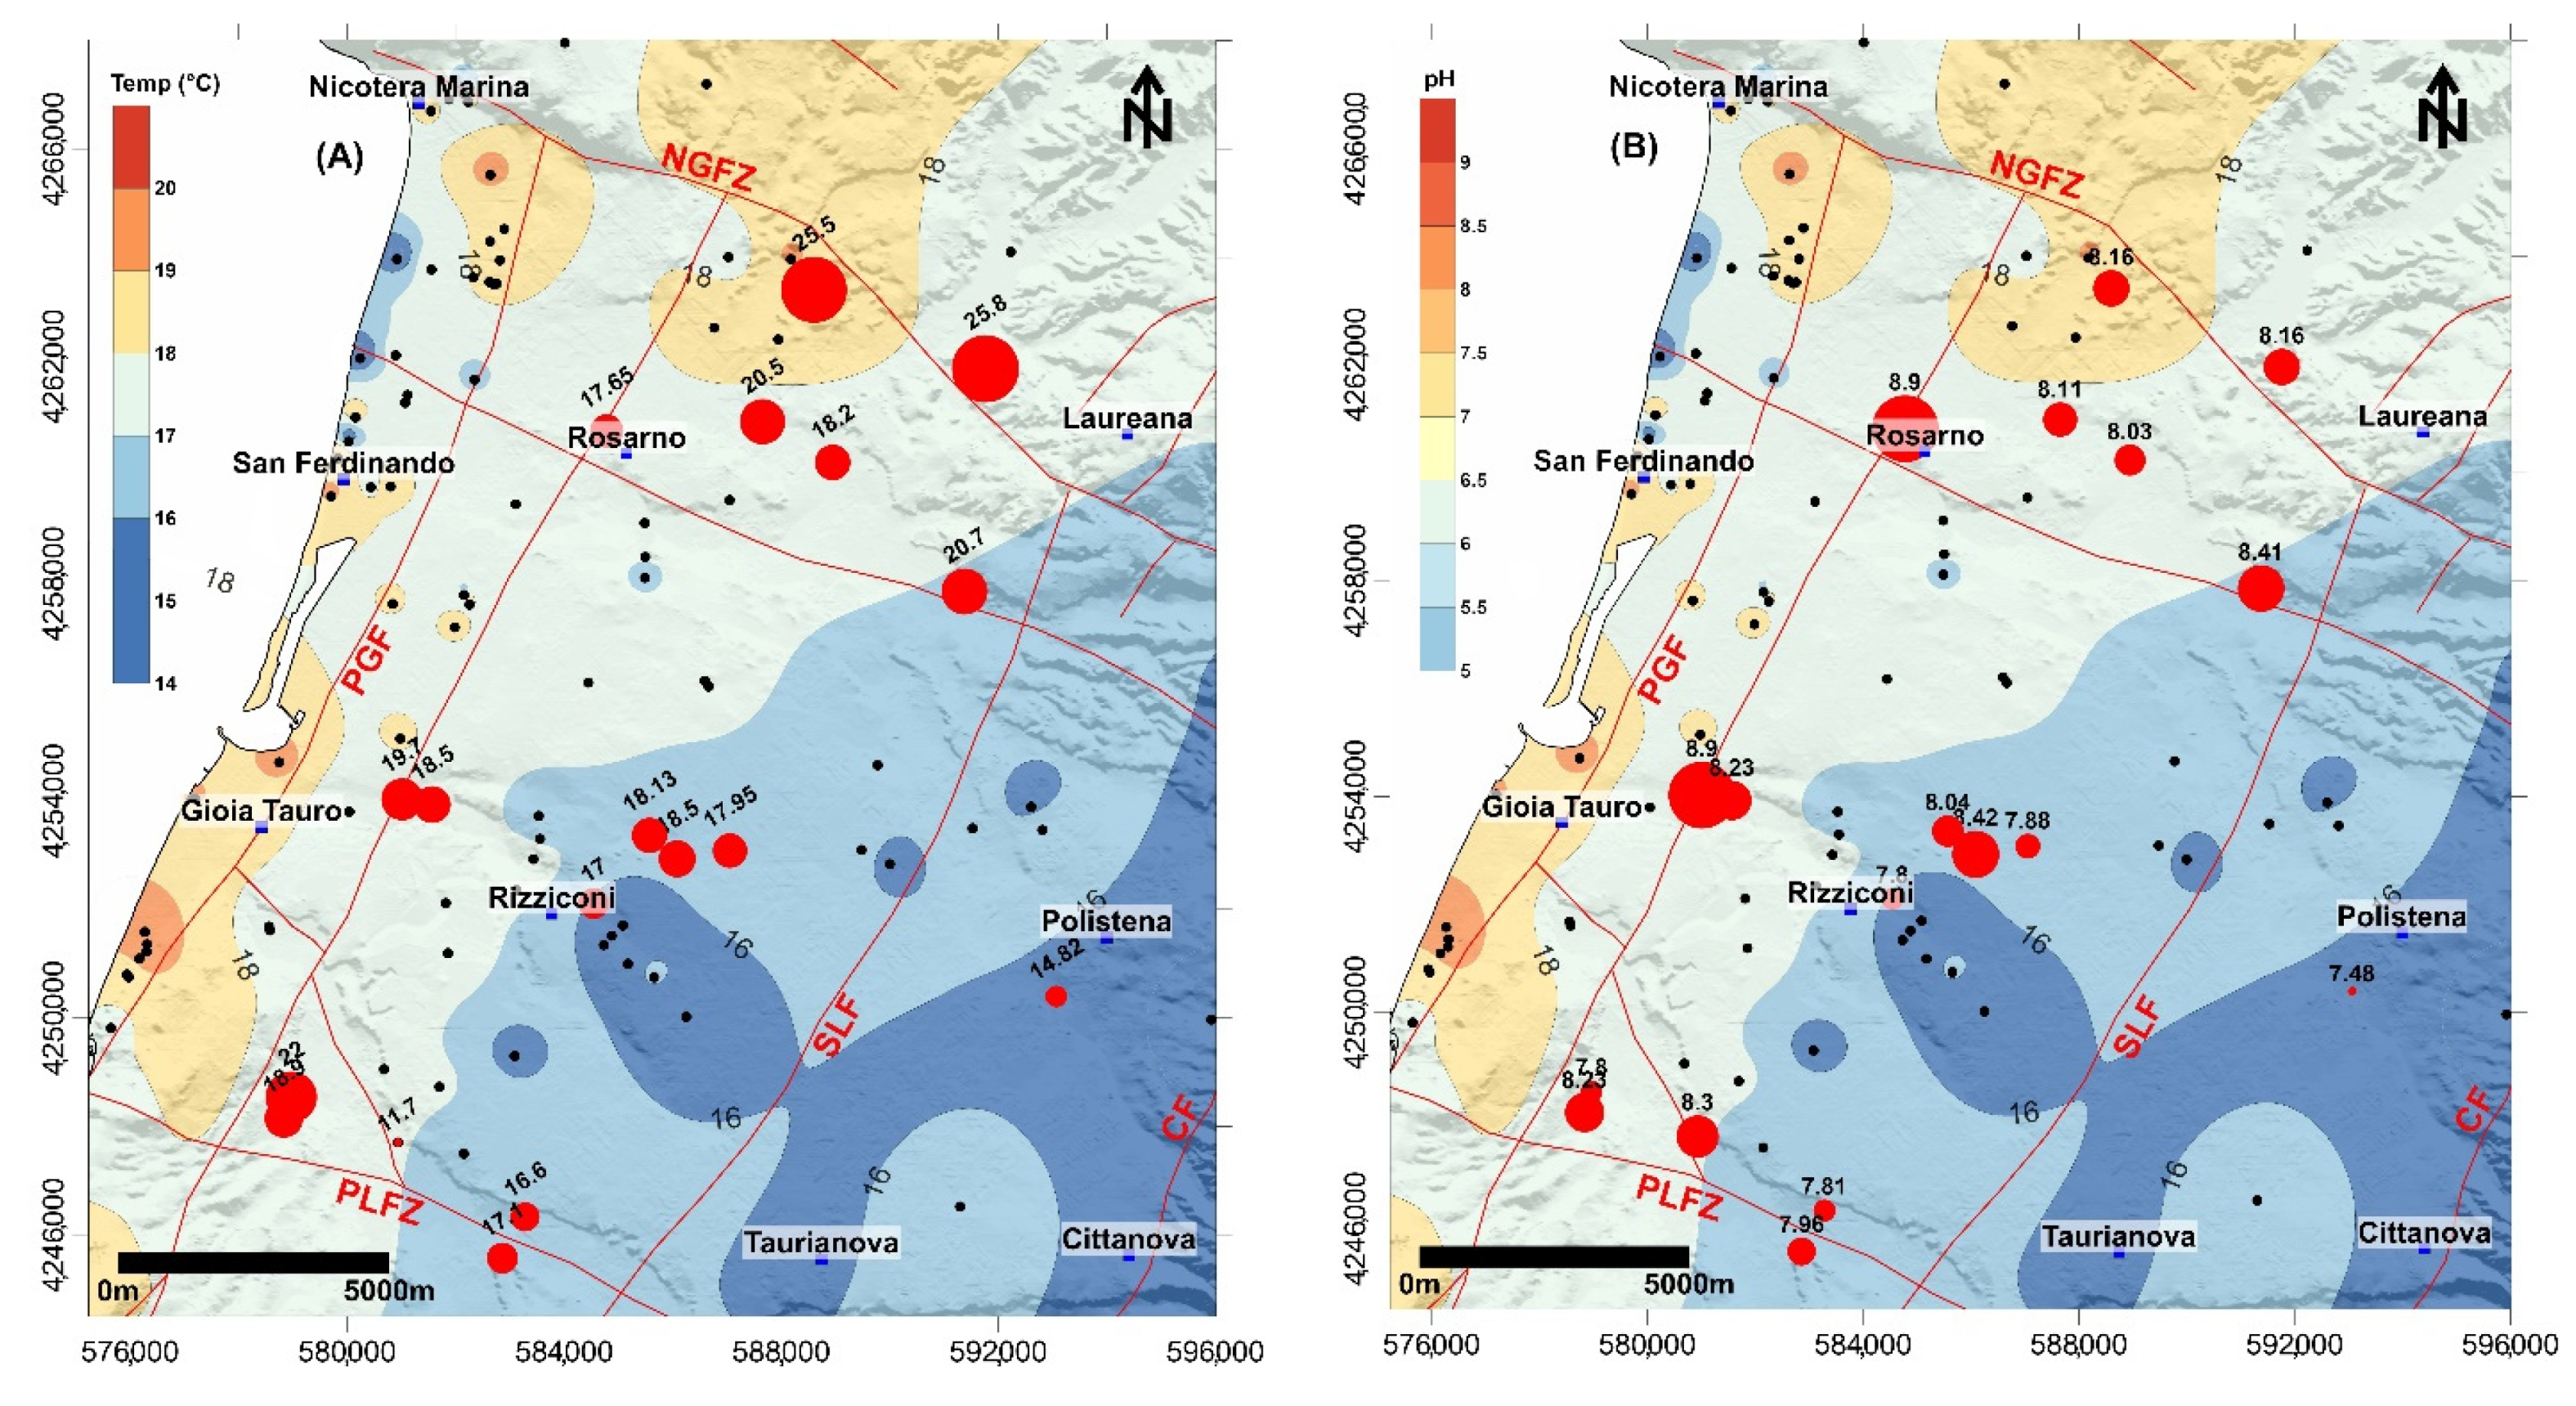
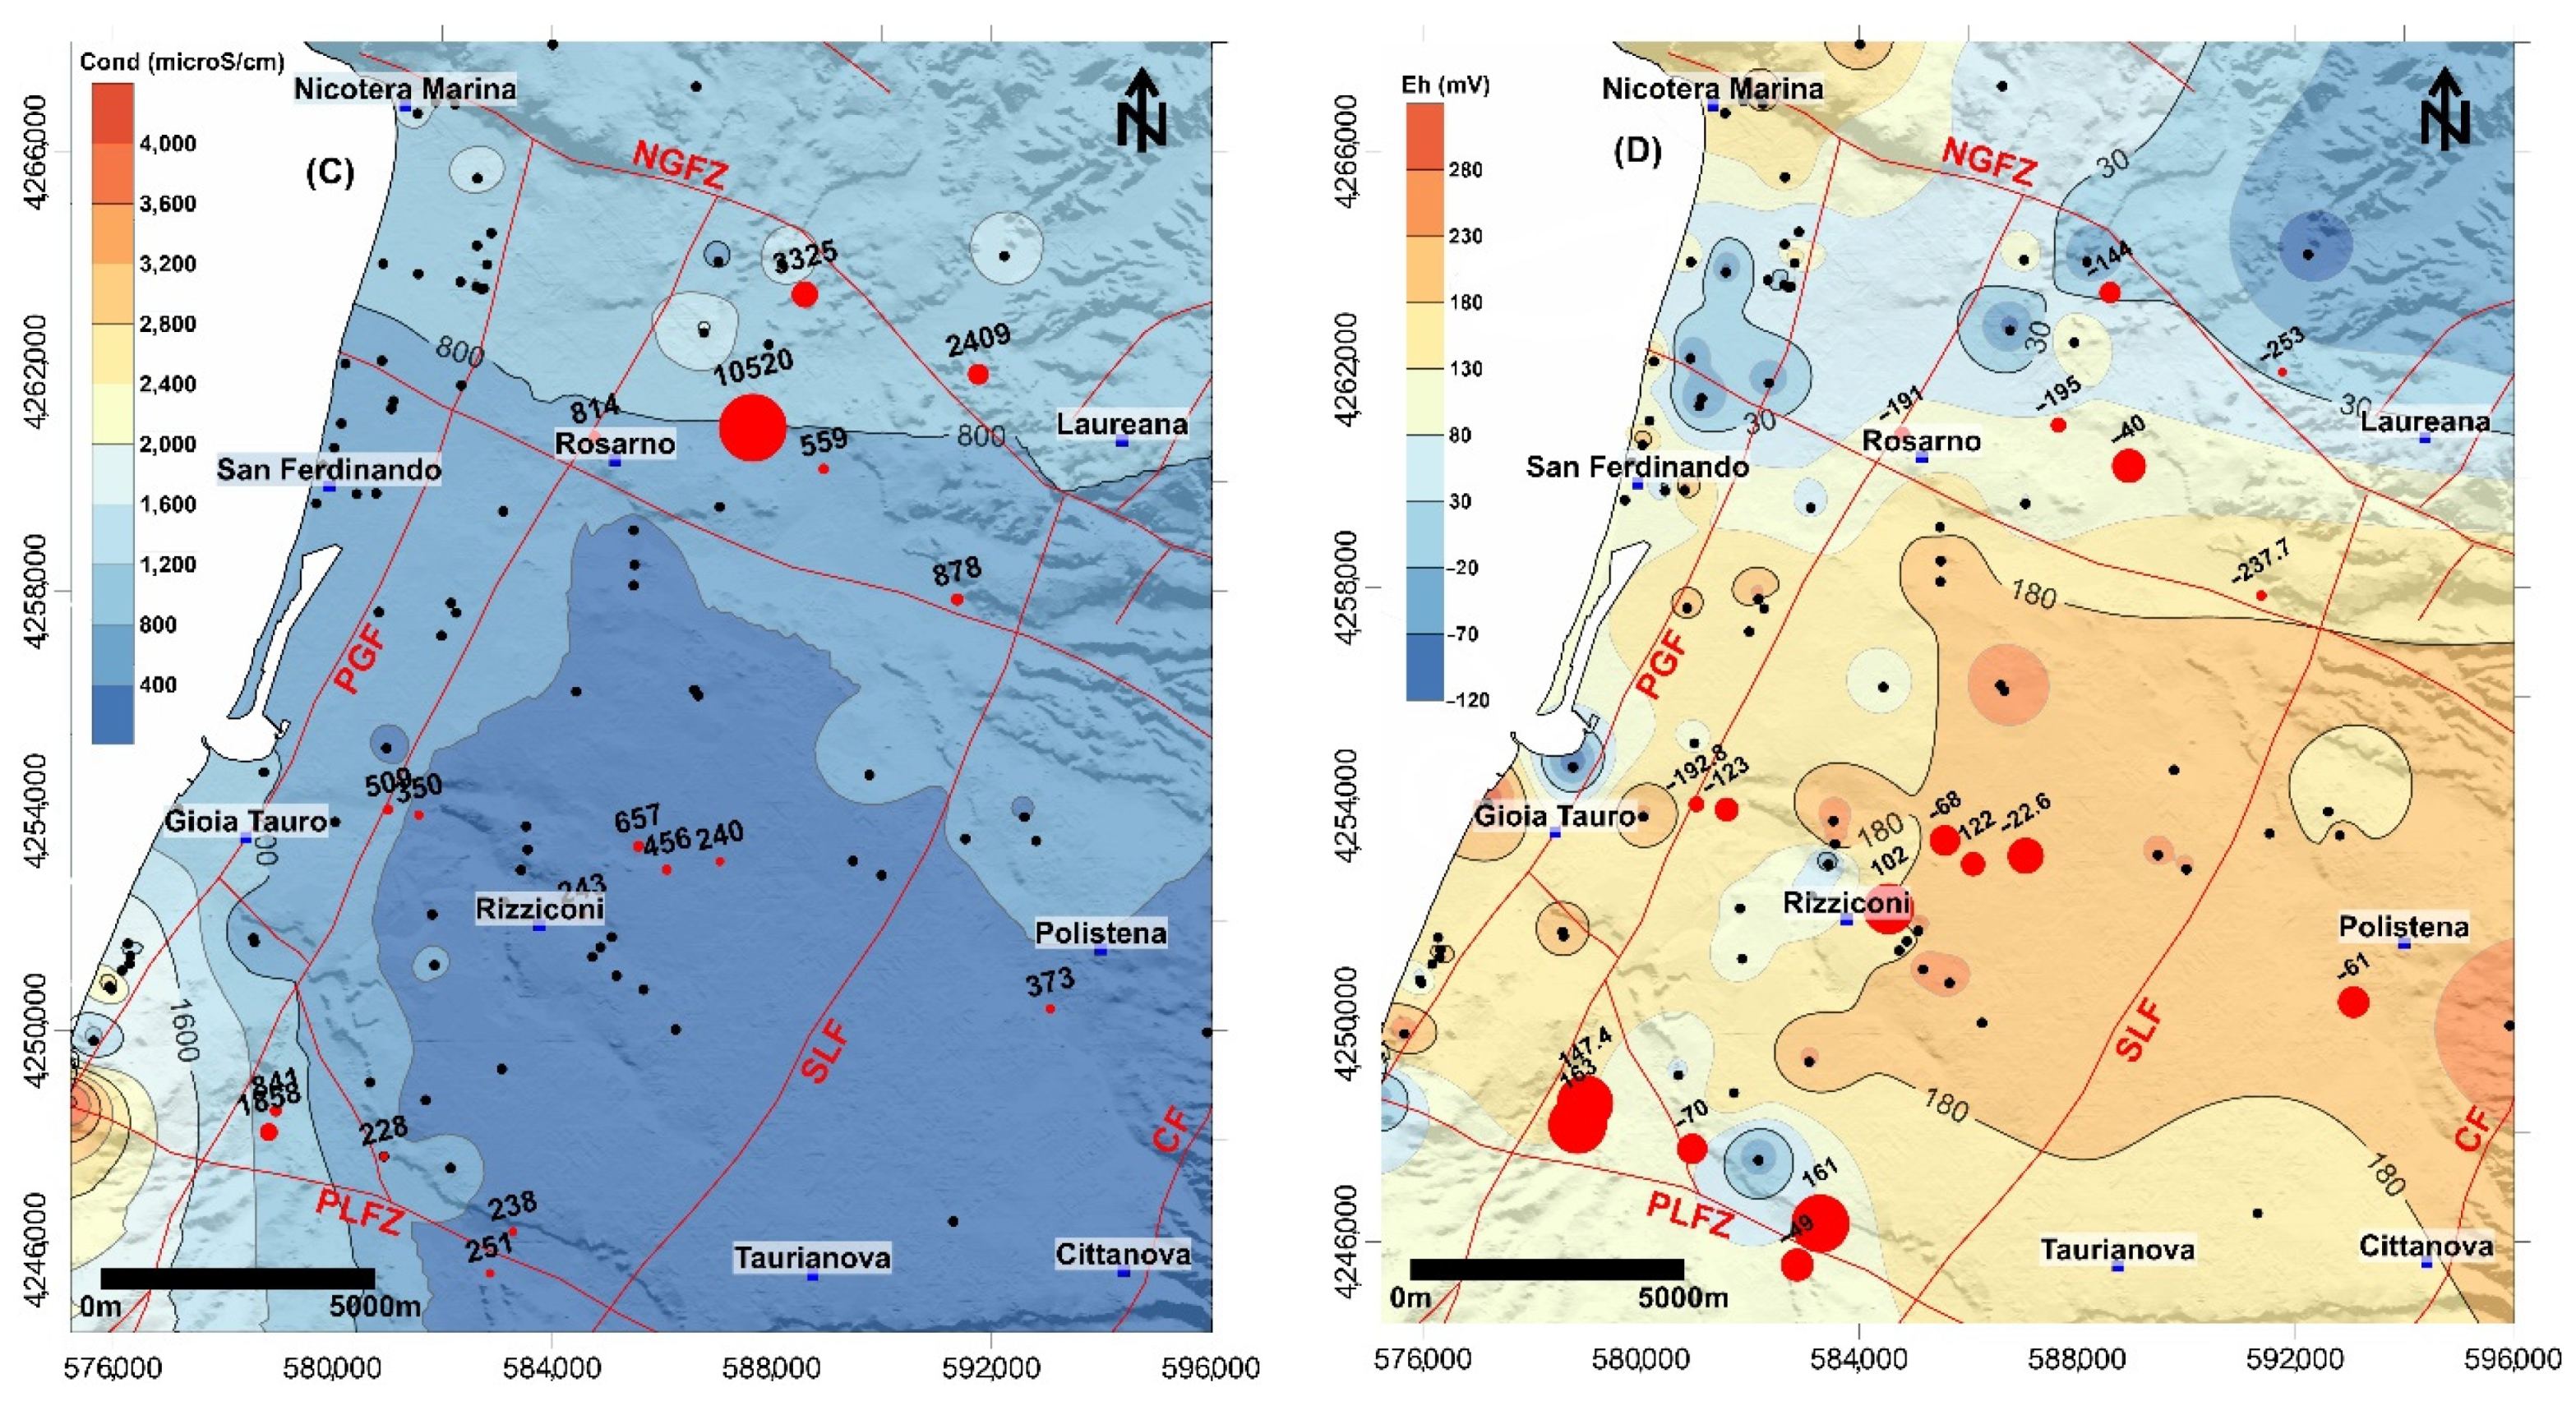
4.4. Groundwater Characterisation

In the study area, the water temperature varied from 14 to 25.8 °C. The pH and Electrical Conductivity (EC) values showed great variability. The former was comprised between 5.9 and 8.9, while EC ranged, according to the classification of [44], from very fresh (238 μS/cm) to very saline (10,520 μS/cm). The Eh values spanned from −253 mV to 303 mV (Table 2 and Figure 9).
From a general point of view, the main anomalies were recognised along the northern boundary of the Plain, in the proximity of one of the main fault zones (NGFZ). In this sector, the distribution maps of Figure 9 highlight a good correlation among temperature, pH, and EC (Figure 9). Furthermore, the northern sector recorded the most negative Eh values.
The southern portion of the Plain showed comparable values, with the central sector characterised by low EC (<1000 μS/cm) and positive Eh values and relatively low temperatures (<18 °C). Only one restricted area, along the coastline and confined by the Palmi high (at Scinà village, Figure 1), revealed anomalous EC values (>1500 μS/cm not associated with anomalous temperatures) for the HU3. In this sector, characterised by a peculiar hydrostratigraphic framework, the presence of a restricted recharge area and numerous water wells could favour seawater intrusion.
Analysing the two main aquifers separately (HU3 and HU1), they had slightly comparable spatial distribution in terms of physicochemical parameters but were probably attributable to different processes. In detail, the deep aquifer (HU1), whose features were provided by artesian wells (18 wells; Figure 9), highlighted the greater spatial heterogeneity. Waters hosted in HU1 showed the highest temperature (up to 25.8 °C), EC (mean value: 1375 μS/cm, up to 10,520 μS/cm), pH (>8), and negative Eh close to the north-eastern portion of the Plain that allows for the hypothesis of a dominant role of faults to the fluid’s circulation and evolution. These anomalies were not registered in the remaining artesian wells located in distal areas from the main faults. This evidence agrees with data provided by the ref. [19] who observed that the warmest and most saline waters (25 < T < 38 °C; TDS > 0.5 g/L, sometimes reaching 10–20 g/L) discharged preferentially along the WNW-ESE belt running from Nicotera to Galatro (northern sector of the Plain). The sector located near the Palmi High also showed anomalous, though lower, temperature and salinity values (maximum value of 1900 μS/cm and 22 °C, respectively). In this sector, the tectonic structure, represented by the PLFZ, is likely playing a decisive role in the circulation, with a mixing of deep and surface rates. Although the faults’ dominant role in circulation and chemical evolution of the deep systems is clear, the main processes that favour the formation of waters characterised by high temperatures and salinities still remain uncertain. The interaction with evaporitic successions, not present in the studied area, can be excluded, as well as a possible seawater intrusion considering the great distance of the wells from the coastline. Possible explanations are found in the presence of both “connate” waters and deep mature waters deriving from a long circulation path in the basal crystalline units, which likely originates high-salinity and NaCl-rich waters [45,46]. The well-developed fault systems could play an important role in the final circulation and rise to the surface of this type of water (e.g., [47]). Further studies should be carried out to provide more information about the ongoing geochemical processes.
As observed for HU1, in the northern portion of the plain (northward of the mouth of Mesima River), waters representative of the shallow HU3 showed relatively high EC (>1000 μS/cm) and slightly negative Eh values. The northern portion of the Plain is characterised by the presence of peat in the Holocene deposits that can favour anoxic conditions in groundwater. Furthermore, the complex structural setting located between the main faults of the NGFZ (the regional tectonic system along which is located the Galatro thermal area [48], green star in Figure 1) can favour a possible exchange between the two main aquifers [49,50]. Finally, the middle and inner portions of GTP (around Rizziconi, Taurianova and Polistena: Figure 1), as also observed for the deep HU1 aquifer, showed the lowest temperature and EC values.

5. Concluding Remarks

This study provided a detailed characterisation of the GTP groundwater’s hydrostratigraphic framework, hydraulic properties, and physicochemical status. The multidisciplinary approach allowed to provide a detailed reconstruction of the main hydrogeological asset of GTP consisting of shallow (HU3) and deep (HU1) aquifers separated by an aquitard (HU2) (Figure 10).
Furthermore, the direct influence of the structural setting on the HU3 thickness spatial pattern was observed. For the HU3, the hydraulic conductivity was calculated by an empirical method ranging from 10−4 and 10−5 m/s with peaks of 10−3 m/s in correspondence of inland Holocene aeolian deposits. The water level measurements allowed for identification of the main flow direction and estimation of the piezometric level variation from the 1970s to 2021, showing a general downwards trend with a maximum of up to −35 m.
The groundwater physicochemical parameters showed anomalous high values of temperature and electrical conductivity (up to 25.8 °C and 10,520 µS/cm, respectively) in the deep aquifer (HU1) along the main tectonic lineaments, which likely played a key role in fluid circulation and evolution (Figure 10). Conversely, shallow groundwater showed lower electrical conductivity (mean value of 736 µS/cm), except at Scinà village (also characterised by a peculiar hydrostratigraphic framework) where values > 1500 µS/cm were recorded and linked to the seawater intrusion.
The results achieved in the present study can be regarded as essential guidelines for optimum management of groundwater protection in the study area. Furthermore, the obtained results (representing a starting point) make the GTP groundwater system an example of interaction between shallow and deep waters, with an important role played by regional faults and the interaction of fault systems.
To improve the hydrostratigraphic reconstruction, passive seismic surveys and VES surveys will be realised where few borehole data and aquitard top depth data are available. In addition, new stratigraphic data are expected to help analyse the lateral variation of the shallow aquifer due to the heteropic facies typical of the alluvial environment. Major, minor and trace elements and water isotopes can also provide additional information for defining the main geochemical processes acting in the circulating waters and understanding the deep relationship between tectonic structures and geochemical features.

Supplementary Materials

The following are available online at https://www.mdpi.com/article/10.3390/w13223279/s1, Table S1: Geometry, screen intervals and depths of the wells.

Author Contributions

Conceptualisation, G.C. and G.V.; methodology, G.C. and G.V.; validation, R.D.R., O.V. and M.P.; formal analysis, G.C. and G.V.; investigation, G.C., G.V. and L.P.; resources, G.C., G.V., R.D.R., R.D. and C.A.; data curation, G.C., G.V., R.D., C.A., C.T. and F.C.; writing-original draft preparation, G.C. and G.V.; writing-review and editing, G.C., G.V., R.D., C.A., M.P., R.D.R., O.V., L.P., C.T. and F.C.; visualisation, G.C. and G.V.; supervision, R.D.R., O.V., M.P., C.A. and R.D.; project administration, G.C. and G.V.; funding acquisition, R.D.R., G.C. and G.V. All authors have read and agreed to the published version of the manuscript.

Funding

This research was funded by the POC-AIM: “Attraction and International Mobility”—Research and innovation, Line 1 (Mobility of researchers).

Institutional Review Board Statement

Not applicable.

Informed Consent Statement

Not applicable.

Data Availability Statement

Not applicable.

Acknowledgments

Giovanni Vespasiano and Giuseppe Cianflone are funded by the POC-AIM: “Attraction and International Mobility”—Research and innovation, Line 1 (Mobility of researchers). The authors wish to thank Giovanni Andiloro, Vincenzo Tripodi, Jasmine De Marco, Domenico Putrino, Rizziconi and Rosarno municipalities, and Sorical s.p.a. for field assistance and for their support during all work phases. Suggestions and critical comments by the Editor and two anonymous reviewers greatly helped to improve and clarify the paper.

Conflicts of Interest

The authors declare no conflict of interest. The funders had no role in the design of the study; in the collection, analyses, or interpretation of data; in the writing of the manuscript, or in the decision to publish the results.

References

  1. Boughriba, M.; Jilali, A. Climate change and modeling of an unconfined aquifer: The Triffa plain, Morocco. Environ. Dev. Sustain. 2018, 20, 2009–2026. [Google Scholar] [CrossRef]
  2. Matiatos, I.; Paraskevopoulou, V.; Lazogiannis, K.; Botsou, F.; Dassenakis, M.; Ghionis, G.; Alexopoulos, J.D.; Poulos, S.E. Surface–ground water interactions and hydrogeochemical evolution in a fluvio-deltaic setting: The case study of the Pinios River delta. J. Hydrol. 2018, 561, 236–249. [Google Scholar] [CrossRef]
  3. Gkiougkis, I.; Pouliaris, C.; Pliakas, F.; Diamantis, I.; Kallioras, A. Conceptual and Mathematical Modeling of a Coastal Aquifer in Eastern Delta of R. Nestos (N. Greece). Hydrology 2021, 8, 23. [Google Scholar] [CrossRef]
  4. Mastrocicco, M.; Colombani, N. The Issue of Groundwater Salinization in Coastal Areas of the Mediterranean Region: A Review. Water 2021, 13, 90. [Google Scholar] [CrossRef]
  5. Vousdoukas, M.I.; Mentaschi, L.; Voukouvalas, E.; Verlaan, M.; Feyen, L. Extreme Sea levels on the rise along Europe’s coasts. Earth’s Future 2017, 5, 304–323. [Google Scholar] [CrossRef]
  6. Petrucci, O.; Polemio, M. Flood risk mitigation and anthropogenic modifications of a coastal plain in southern Italy: Combined effects over the past 150 years. Nat. Hazards Earth Syst. Sci. 2007, 7, 361–373. [Google Scholar] [CrossRef] [Green Version]
  7. Sanford, W.; Langevin, C.; Polemio, M.; Povinec, P. A new focus on groundwater seawater interactions. In A New Focus on Groundwater-Seawater Interactions; Sanford, W., Langevin, C., Polemio, M., Povinec, P., Eds.; IAHS Press: Wallingford, UK, 2007; Volume 312, pp. V–VI. [Google Scholar]
  8. De Montety, V.; Radakovitch, O.; Vallet-Coulomb, C.; Blavoux, B.; Hermitte, D.; Valles, V. Origin of groundwater salinity and hydrogeochemical processes in a confined coastal aquifer: Case of the Rhone delta (Southern France). Appl. Geochem. 2008, 23, 2337–2349. [Google Scholar] [CrossRef]
  9. Haruyama, S. Introduction-overview of natural disasters and coastal landforms. In Natural Disaster and Coastal Geomorphology; Haruyama, S., Sugai, T., Eds.; Springer: Cham, Switzerland, 2016; pp. 1–13. [Google Scholar] [CrossRef]
  10. Cianflone, G.; Dominici, R.; Viscomi, A. Potential recharge estimation of the Sibari Plain aquifers (southern Italy) through a new GIS procedure. Geographia Techica 2015, 10, 8–18. [Google Scholar]
  11. Cianflone, G.; Tolomei, C.; Brunori, C.A.; Dominici, R. InSAR time series analysis of natural and anthropogenic coastal plain subsidence: The case of Sibari (Southern Italy). Remote. Sens. 2015, 7, 16004–16023. [Google Scholar] [CrossRef] [Green Version]
  12. Polemio, M.; Zuffianò, L.E. Review of Utilization Management of Groundwater at Risk of Salinization. J. Water Resour. Plan. Manag. 2020, 146, 20. [Google Scholar] [CrossRef]
  13. Polemio, M.; Petrucci, O. The occurrence of floods and the role of climate variations from 1880 in Calabria (Southern Italy). Nat. Hazards Earth Syst. Sci. 2012, 12, 129–142. [Google Scholar] [CrossRef] [Green Version]
  14. Polemio, M. Monitoring and management of karstic coastal groundwater in a changing environment (Southern Italy): A review of a regional experience. Water 2016, 8, 148. [Google Scholar] [CrossRef] [Green Version]
  15. Vespasiano, G.; Apollaro, C.; Marini, L.; Dominici, R.; Cianflone, G.; Romanazzi, A.; Polemio, M.; De Rosa, R. Hydrogeological and isotopic study of the multi-aquifer system of the Sibari Plain (Calabria, Southern Italy). Rend. Online Soc. Geol. It. 2015, 39, 134–137. [Google Scholar] [CrossRef]
  16. Vespasiano, G.; Cianflone, G.; Cannata, C.B.; Apollaro, C.; Dominici, R.; De Rosa, R. Analysis of groundwater pollution in the Sant’Eufemia Plain (Calabria—South Italy). Ital. J. Eng. Geol. Environ. 2016, 2, 5–15. [Google Scholar] [CrossRef]
  17. Vespasiano, G.; Cianflone, G.; Romanazzi, A.; Apollaro, C.; Dominici, R.; Polemio, M.; De Rosa, R. A multidisciplinary approach for sustainable management of a complex coastal plain: The case of Sibari Plain (Southern Italy). Mar. Pet. Geol. 2019, 109, 710–759. [Google Scholar] [CrossRef]
  18. ISTAT. Available online: http://demo.istat.it/bilmens/index02.php?anno=2020&lingua=ita (accessed on 2 September 2021).
  19. Pizzino, L.; Burrato, P.; Quattrocchi, F.; Valensise, G. Geochemical signatures of large active faults: The example of the 5 February 1783, Calabrian earthquake (southern Italy). J. Seismol. 2004, 8, 363–380. [Google Scholar] [CrossRef]
  20. Italiano, F.; Bonfanti, P.; Pizzino, L.; Quattrocchi, F. Geochemistry of fluids discharged over the seismic area of the Southern Apennines (Calabria region, Southern Italy): Implications for fluid-fault relationships. Appl. Geochem. 2010, 25, 540–554. [Google Scholar] [CrossRef]
  21. Monaco, C.; Tortorici, L. Active faulting in the Calabrian arc and eastern Sicily. J. Geodyn. 2000, 29, 407–424. [Google Scholar] [CrossRef]
  22. Tripodi, V.; Muto, F.; Brutto, F.; Perri, F.; Critelli, S. NeogenQuaternary evolution of the forearc and backarc regions between the Serre and Aspromonte Massifs, Calabria (southern Italy). Mar. Pet. Geol. 2018, 95, 328–343. [Google Scholar] [CrossRef]
  23. Jacques, E.; Monaco, C.; Tapponnier, P.; Tortorici, L.; Winter, T. Faulting and earthquake triggering during the 1783 Calabria seismic sequence. Geophys. J. Int. 2001, 147, 499–516. [Google Scholar] [CrossRef] [Green Version]
  24. Galli, P.; Bosi, V. Paleoseismology along the Cittanova fault: Implications for seismotectonics and earthquake recurrence in Calabria (southern Italy). J. Geophys. Res. 2002, 107, 2044. [Google Scholar] [CrossRef]
  25. Galli, P.; Peronace, E. Low slip rates and multimillennial return times for Mw 7 earthquake faults in southern Calabria (Italy). Geophys. Res. Lett. 2015, 42, 5258–5265. [Google Scholar] [CrossRef] [Green Version]
  26. Valensise, G.; D’Addezio, G. Il contributo della geologia di superficie all’identificazione delle strutture sismogenetiche della Piana di Gioia Tauro. In Internal Rep. 559; Ist. Naz. di Geofis.: Bologna, Italy, 1994; p. 21. [Google Scholar]
  27. ISPRA. Foglio 590-Taurianova. In Carta Geologica d’Italia Alla Scala 1:50.000; Istituto Superiore per la Protezione e la Ricerca Ambientale: Roma, Italy, 2016. [Google Scholar]
  28. De Rosa, R.; Dominici, R.; Donato, P.; Barca, D. Widespread syn-eruptive volcaniclastic deposits in the Pleistocenic basins of South-Western Calabria. J. Volcanol. Geotherm. Res. 2008, 177, 155–169. [Google Scholar] [CrossRef]
  29. Longhitano, S.G.; Chiarella, D.; Di Stefano, A.; Messina, C.; Sabato, L.; Tropeano, M. Tidal signatures in Neogene to Quaternary mixed deposits of southern Italy straits and bays. Sediment. Geol. 2012, 279, 74–96. [Google Scholar] [CrossRef]
  30. Borrelli, L.; Antronico, L.; Le Pera, E.; Pisano, B.; Sorriso-Valvo, M. Morphology, properties, and source of windblown sediments of the coastal dune field in the Gioia Tauro Plain, Calabria, southern Italy. Catena 2021, 201, 105193. [Google Scholar] [CrossRef]
  31. ISPRA-Indagini nel Sottosuolo (L.464/84). Available online: http://sgi.isprambiente.it/GMV2/index.html (accessed on 27 August 2021).
  32. Facciorusso, J.; Vannucchi, G. Liquefaction hazard maps of the harbour area of Gioia Tauro (Italy) by geo-statistical methods. In Proceedings of the 4th International Conference of Earthquake Engineering and Seismology, Tehran, Iran, 12–14 May 2003. [Google Scholar]
  33. Anderson, M.P.; Woessner, W.W. Applied Groundwater Modelling: Simulation of Flow and Advective Transport; Academic Press: London, UK, 1992. [Google Scholar]
  34. Bersezio, R.; Giudici, M.; Mele, M. Combining sedimentological and geophysical data for high-resolution 3-D mapping of fluvial architectural elements in the Quaternary Po plain (Italy). Sediment. Geol. 2007, 202, 230–248. [Google Scholar] [CrossRef]
  35. Cianflone, G.; Cavuoto, G.; Punzo, M.; Dominici, R.; Sonnino, M.; Di Fiore, V.; Pelosi, N.; Tarallo, D.; Lirer, F.; Marsella, E.; et al. Late quaternary stratigraphic setting of the Sibari Plain (southern Italy): Hydrogeological implications. Mar. Pet. Geol. 2018, 97, 422–436. [Google Scholar] [CrossRef]
  36. Casmez (Cassa Speciale per il Mezzogiorno). Progetto Speciale 26; CMP: Roma, Italy, 1987. [Google Scholar]
  37. Logan, J. Estimating transmissibility from routine production tests of waterwalls. Groundwater 1964, 2, 35–37. [Google Scholar] [CrossRef]
  38. Hvorslev, M.J. Time Lag and Soil Permeability in Ground-Water Observations. In Bull. No. 36 Waterways Exper. Sta. Corps of Engineers; U.S. Army: Vicksburg, MI, USA, 1951; pp. 1–50. [Google Scholar]
  39. Apollaro, C.; Vespasiano, G.; De Rosa, R.; Marini, L. Use of mean residence time and flowrate of thermal waters to evaluate the volume of reservoir water contributing to the natural discharge and the related geothermal reservoir volume. Appl. North. Thail. Hot Springs Geotherm. 2015, 58, 62–74. [Google Scholar]
  40. Vespasiano, G.; Marini, L.; Muto, F.; Auqué, L.F.; Cipriani, M.; De Rosa, R.; Critelli, S.; Gimeno, M.J.; Blasco, M.; Dotsika, E.; et al. Chemical, isotopic and geotectonic relations of the warm and cold waters of the Cotronei (Ponte Coniglio), Bruciarello and Repole thermal areas, (Calabria—Southern Italy). Geothermics 2021, 96. [Google Scholar] [CrossRef]
  41. Nordstrom, D.K. Thermochemical redox equilibria of ZoBell’s solution. Geochim. Cosmochim. Acta 1997, 41, 1835–1841. [Google Scholar] [CrossRef]
  42. Carrozzo, M.T.; Luzio, C.; Margotta, C.; Quarta, T. Gravity Map of Italy. Scale 1:500 000. In Progetto Finalizzato Geodinamica; Consiglio Nazionale delle Ricerche: Rome, Italy, 1986. [Google Scholar]
  43. Domenico, P.A.; Schwartz, F.W. Physical and Chemical Hydrogeology; John Wiley & Sons: New York, NY, USA, 1990; 824p. [Google Scholar]
  44. Phocaides, A. Water quality for irrigation. In Technical Handbook on Pressurized Irrigation Techniques, Ch. 7; FAO: Roma, Italy, 2000; pp. 79–97. [Google Scholar]
  45. Savage, D.; Edmunds, W.M. Geochemical characteristics of groundwater in granites and related crystalline rocks. In Applied Groundwater Hydrology; Downing, R.A., Wilkinson, W.B., Eds.; Oxford University: Oxford, UK, 1991. [Google Scholar]
  46. Stober, I.; Zhong, J.; Zhang, L.; Bucher, K. Deep hydrothermal fluid–rock interaction: The thermal springs of Da Qaidam, China. Geofluids 2016, 16, 711–728. [Google Scholar] [CrossRef]
  47. Curewitz, D.; Karson, J.A. Structural settings of hydrothermal outflow: Fracture permeability maintained by fault propagation and interaction. J. Volc. Geoth. Res. 1997, 79, 149–168. [Google Scholar] [CrossRef]
  48. Apollaro, C.; Tripodi, V.; Vespasiano, G.; De Rosa, R.; Dotsika, E.; Fuoco, I.; Critelli, S.; Muto, F. Chemical, isotopic and geotectonic relations of the warm and cold waters of the Galatro and Antonimina thermal areas, southern Calabria, Italy. Mar. Pet. Geol. 2019, 109, 469–483. [Google Scholar] [CrossRef]
  49. Bense, V.F.; Gleeson, T.; Loveless, S.E.; Bour, O.; Scibek, J. Fault zone hydrogeology. Earth-Sci. Rev. 2013, 127, 171–192. [Google Scholar] [CrossRef]
  50. Medici, G.; Smeraglia, L.; Torabi, A.; Botter, C. Review of modeling approaches to groundwater flow in deformed carbonate aquifers. Groundwater 2021, 59, 334–351. [Google Scholar] [CrossRef] [PubMed]
Figure 1. Simplified geological and structural map of the Gioia Tauro Plain. The map also reports a simplified stratigraphic column (not to scale) of the study area.
Water 13 03279 g001
Figure 2. Piper diagram showing the hydrochemical facies of the waters from the study area afterward [19,20].
Water 13 03279 g002
Figure 3. (a) Digital Surface Model of the aquiclude (HU2) top altitude (m a.s.l.). (b) Isopach map (m) of the shallow aquifer (HU3).
Water 13 03279 g003
Figure 4. Transversal (AA’, BB’ and CC’) and longitudinal (DD’, EE’ and FF’) profiles of the HU2 top (see Figure 3a for profile location).
Water 13 03279 g004
Figure 5. (a) Digital Surface Model (altitude in m a.s.l.) of contact between the bottom of HU3 and bedrock and (b) isopach map (m) of HU3 between the mouth of Petrace River and Scinà.
Water 13 03279 g005
Figure 6. (a) Piezometric map of the Gioia Tauro plain. In the figure are reported locations of each well, the current piezometric contour lines (blue) and flow directions (black arrows), and the 1970s piezometric lines (red) [36]. (b) Piezometric level variation map from the 1970s to 2021 (red line: level drop; green line: unchanged level; blue line: level rise).
Water 13 03279 g006
Figure 7. Binary plot showing the correlation (R2 = 0.86) between the k-values obtained by the slug test survey and the pumping test.
Water 13 03279 g007
Figure 8. Distribution map of k of the HU3 based on the values obtained through the pumping test for 225 wells.
Water 13 03279 g008
Figure 9. Iso-concentration maps of (A) temperature, (B) pH, (C) conductivity and (D) Eh reconstructed for the HU3 shallow aquifer by using the Inverse Distance Weighting (IDW) as spatial interpolation method. Red line, black and red circles represent the main faults, phreatic and artesian wells (HU1 aquifer), respectively. For each artesian well, the respective physical-chemical value measured in the field is reported (dot size increases with the parameter value).
Water 13 03279 g009aWater 13 03279 g009b
Figure 10. Hydrogeological cross-sections (NS and WE) of the Gioia Tauro Plain (vertical scale ×10; see Figure 1 for the profile location).
Water 13 03279 g010
Table 1. K-values obtained using slug test and pumping test data in correspondence to the same wells.
Slug Testk (m/s)k (m/s)
Pumping Test
ST19.85 × 10−43.98 × 10⁻³
ST23.73 × 10−48.27 × 10⁻⁴
ST37.07 × 10−41.85 × 10⁻³
ST45.70 × 10−53.82 × 10⁻⁴
ST52.20 × 10−48.56 × 10⁻⁴
ST65.04 × 10−41.33 × 10⁻³
ST71.58 × 10−35.43 × 10⁻³
ST83.94 × 10−41.17 × 10⁻³
ST92.41 × 10−43.46 × 10⁻⁴
ST106.77 × 10−42.76 × 10⁻⁴
ST111.14 × 10−34.04 × 10⁻³
ST123.94 × 10−49.43 × 10⁻⁴
Table 2. The main statistical features of the physicochemical parameters of groundwater belonging to the main aquifers (83 and 18 wells for HU3 and HU1, respectively) characterising the GTP. EC: electrical conductivity; TDS: Total Dissolved Solids; p.s.u.: practical salinity unit (as ‰).
TpHEC (25 °C)EhTDSSalinity
(°C) μS/cmmVppmp.s.u.
HU1Min14.87.5230−2531150.1
Max25.88.910,52023852645.9
Median18.28.16509−682540.25
Mean19.18.21375−49.36860.7
St. Dev.2.90.42436152.112191.4
HU3Min11.75.9228−1061140.1
Max19.78.9404930320252.2
Median17.557.04509.5153.6254.50.25
Mean17.37.17361263710.4
St. Dev.1.40.55951122980.3
Publisher’s Note: MDPI stays neutral with regard to jurisdictional claims in published maps and institutional affiliations.

