
Study on the Impact of Land-Use Change on Runoff Variation Trend in Luojiang River Basin, China


Henan Key Laboratory of Water Resources Conservation and Intensive Utilization in the Yellow River Basin, School of Water Resources, North China University of Water Resources and Electric Power, Zhengzhou 450011, China
*
Author to whom correspondence should be addressed.
Water 2021, 13(22), 3282; https://doi.org/10.3390/w13223282
Submission received: 1 October 2021
/
Revised: 9 November 2021
/
Accepted: 11 November 2021
/
Published: 19 November 2021
(This article belongs to the Section Hydrology)
Abstract
:To reveal the influence process of land use changes on runoff variation trends, this paper takes the Luojiang River of China as the study area, and the Soil and Water Assessment Tool (SWAT) model was constructed to quantitatively analyze the impact of different land uses on runoff formation in the watershed, and used the Cellular Automata-Markov (CA-Markov) model to predict future land use scenarios and runoff change trends. The results show that: (1) the SWAT model can simulate the runoff in the Luojiang River basin; (2) the runoff in the Luojiang River basin has a decreasing trend in recent 10 years, caused by the decrease of rainfall and runoff due to changes in land use; (3) the forecast shows that the land-use changes in the basin will lead to an increase in runoff coefficient in 2025. The increase of the runoff coefficient will bring some adverse effects, and relevant measures should be taken to increase the water storage capacity of urban areas. This study can help plan future management strategies for the study area land coverage and put forward a preventive plan for the possible adverse situation of runoff variation.
1. Introduction
As the link between the atmosphere and the geosphere, the hydrological cycle is subject to climatic and human factors [1,2,3]. The terrestrial branch in the hydrological cycle is the key to flow generation and convergence mechanisms [4]. Global warming is currently the most crucial feature of climate factors [2]. Temperature warming has caused frequent extreme precipitation events in many regions of the world [2], which changes the hydrological cycle rate and flow generation process in these regions [1]. Land-use change is one of the most intuitive manifestations of human factors, and it is also the main driving factor affecting the natural surface environment [2]. Land use is a crucial parameter affecting hydrological cycle simulation. The change of land use patterns affects infiltration, interception, evapotranspiration, groundwater, and surface water recharge in the land branch cycle, and then directly affects the runoff process [1,2,5,6]. Therefore, using reasonable land-use methods to grasp the changing trend of the impact of land-use changes on the hydrological cycle can provide a strong scientific basis for water resource management [4].
Compared with the watershed comparative experiment method [7] and the hydrological characteristic parameter method [8], the SWAT model [9,10] considers natural and social factors more comprehensively. The model can effectively simulate the relationship between runoff, land-use, and climate change and visualize the output [11,12]. Deng et al. [13] established a simulation model of watershed land-use change coupled with Cellular Automata and Artificial Neural Networks in the upper reaches of the Hanjiang Basin in China, which provided a new method for potential allocation of land use types and runoff prediction in the future. Ayivi et al. [14] analyzed the changes of hydrology and runoff in the North Carolina basin in the southeast of the United States through the SWAT model. They predicted the water balance and water yield, which can support the realization of sustainable management of water resources in the region. Shrestha et al. [15] used the SWAT model to analyze the single and comprehensive impacts of climate and land-use changes on runoff and nitrate–nitrogen loads in the Songkram River Basin in Thailand. The results showed that nitrate–nitrogen loads in this region showed a decreasing trend. Xin et al. [16] combined the dynamic hydrological response units with a coupled SWAT-MODFLOW, which can reflect actual land cover changes in the basin, to simulate the vegetation change in the Bayin River basin, an arid inland river in China. The results can assist in ensuring revegetation sustainability and rationally allocating water resources in arid areas. Urgessa et al. [17] studied the hydrological responses to land-use changes in Ethiopia Fincha’a watershed based on the SWAT model. The results can provide theoretical for future land use planning in African countries. Hazhir et al. [18] used the CA–Markov model to monitor and predict land use/land cover changes in Iran’s Ravansar Country. The results showed that due to urbanization and the development of agricultural areas, the area of construction land and agricultural land increased significantly, and that this trend would continue. In addition, the SWAT model is often combined with the CA–Markov model in future runoff prediction research to compare the impact of land-use change on runoff through land-use scenario settings, or to study the relationship between land use change and runoff through land use maps of different periods in the study area [19].
Based on the existing research, this paper takes the Luojiang River Basin in China as the study area, develops a SWAT model, quantitatively analyzes the impact of different land use on runoff formation in the basin, and predicts the change of land use scenarios and runoff variation trends in 2025 by the CA–Markov model. This research can help plan future management strategies of the study area land coverage and put forward a preventive plan for the possible adverse situation of runoff variation.
2. Materials and Methods
2.1. Study Area
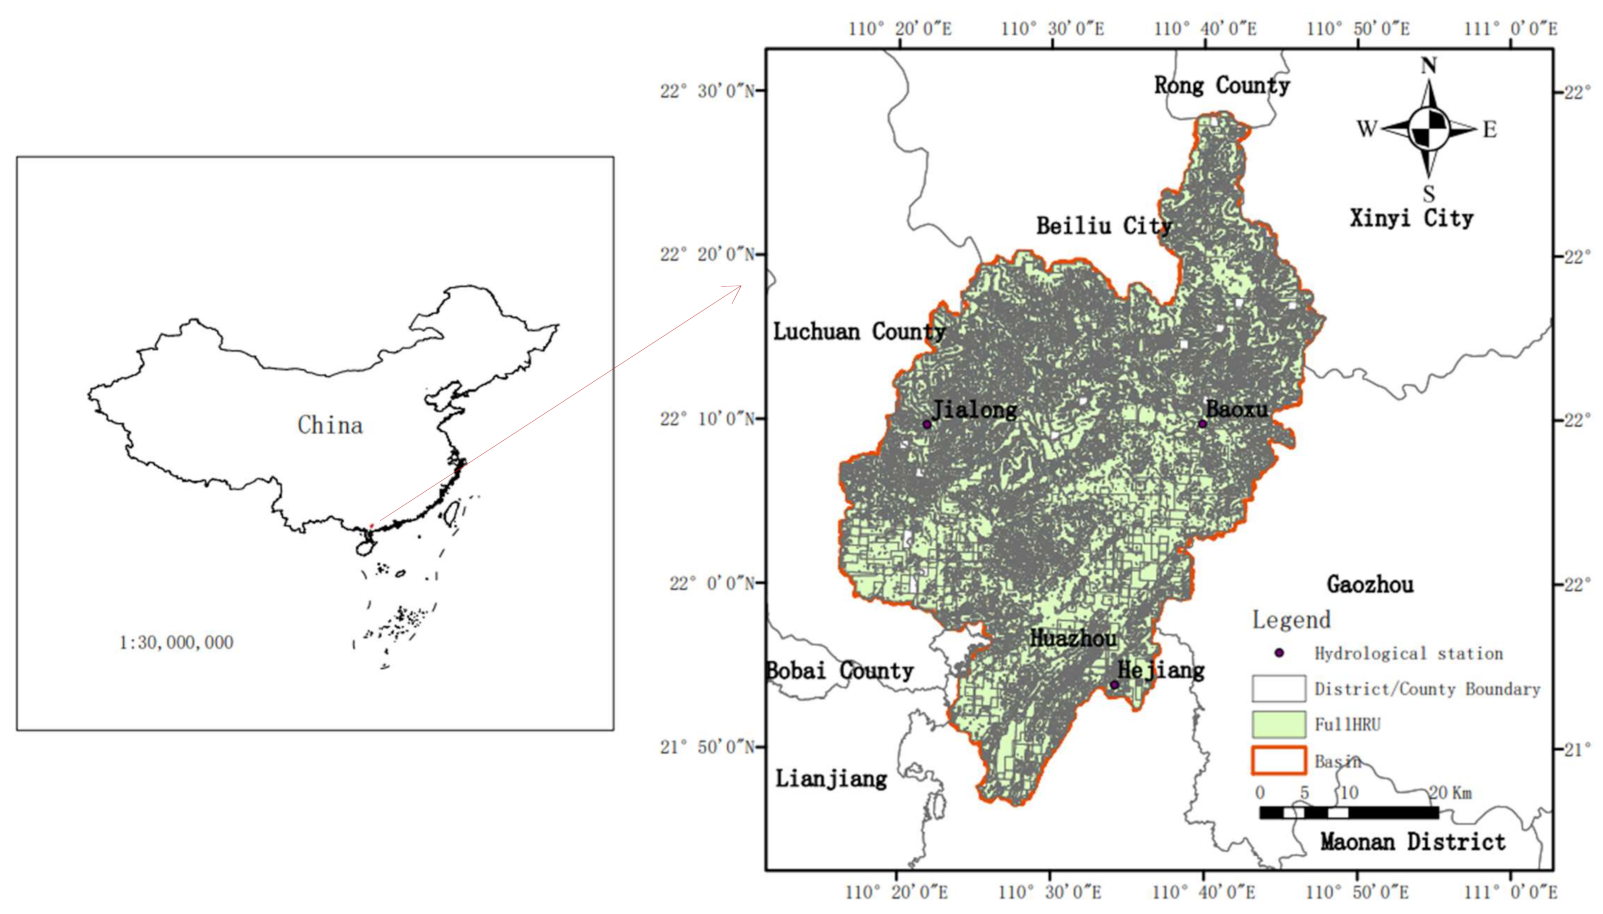
The Luojiang Riveris located between 110° 10′ E~110° 50′ E, 21° 30′ N~22° 30′ N in the low-latitude region south of the Tropic of Cancer (Figure 1), mostly in Huazhou, Maoming city, Guangdong Province, China. It is the largest first-class tributary of the Jianjiang River. Luojiang originates from Wangjiang of Xinyi City, and flows into Guangxi northward to the southwest of Goujidong first. After that, it flows through Huazhou Baowei, Yinyang, Nawu to Hejiang and Ping Dingshui confluence, and then flows into Jianjiang River in Huazhou County by Jianghu, Linchen, Guanqiao and other places. The Luojiang River has a total length of 143 km, and the controlled watershed area above the Hejiang Hydrology station is 2055.067 km2, with an average riverbed slope of 0.64‰. The region belongs to the South Asian tropical monsoon climate, with an annual average temperature between 22.2 °C~23.9 °C and abundant rainfall. The annual average rainfall is 1890 mm, but the rainfall distribution is extremely uneven in time and space. The yearly rainfall is mainly concentrated in May to September, accounting for 75% of the total rainfall. The basin is a hilly region, and the middle and lower reaches are gentle slopes and plains [20,21,22].
2.2. Data Source
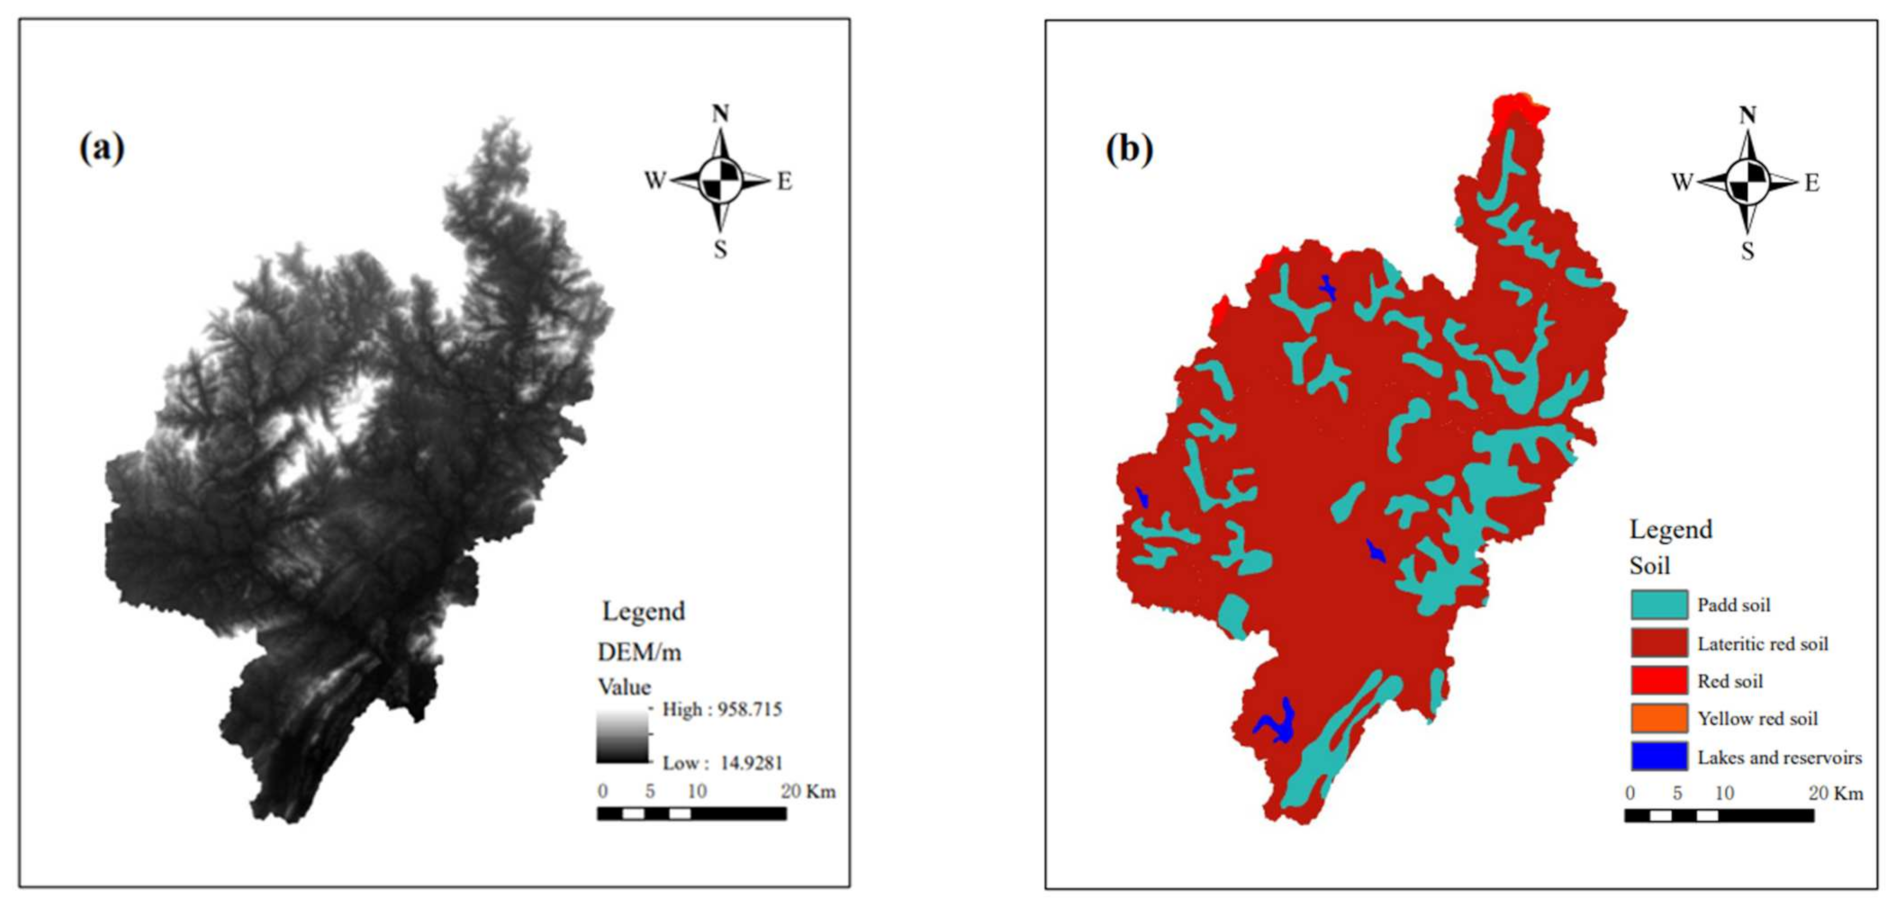
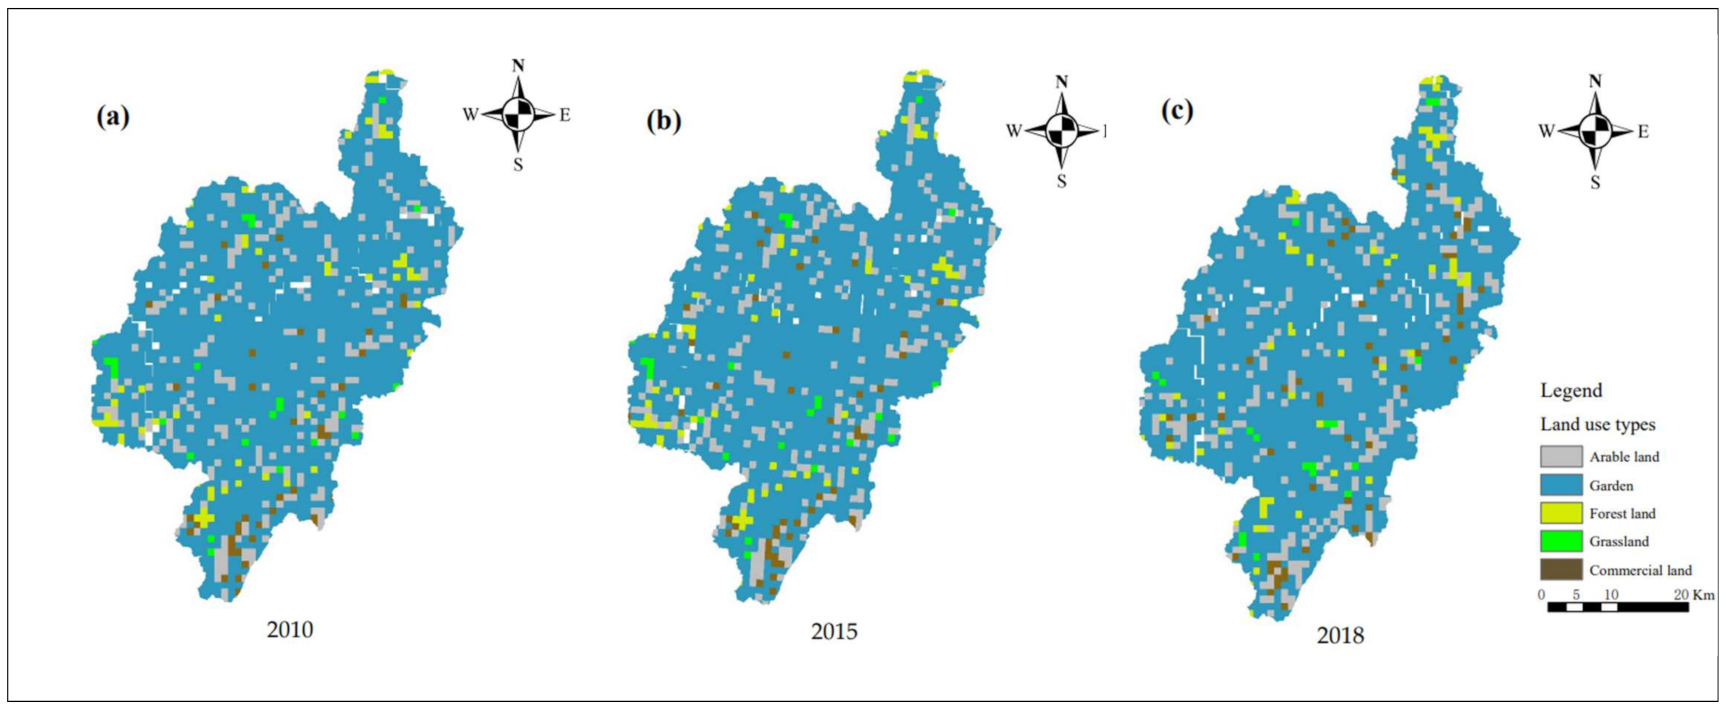
The data required by the research includes digital elevation data, soil type, land use type data in 2010, 2015, and 2018, hydrological and meteorological data, and so forth. The description, pretreatment, and sources of all kinds of data are shown in Table 1. Digital elevation data are shown in Figure 2a, soil type data in Figure 2b, land use type in three years in Figure 3.
2.3. Mann–Kendall (MK) Trend Test
The MK non-parametric test is used to judge the upward or downward trend of the series through the positive or negative of statistic Z, which is often used for trend analysis of natural events in time series such as precipitation and runoff. This method does not require a specific distribution test for the data series and allows missing values in the data series. Therefore, it can effectively avoid the influence of undetected values or detected outliers on trends [26], which has been recommended by the World Meteorological Organization and widely used [26,27,28,29]. This paper set up the test of significance of the confidence level of 95% (). Namely, when , sequence significantly increased; when, the sequence decreases significantly. Specific calculation steps refer to reference [26,29].
2.4. SWAT Model Construction and Evaluation
The SWAT model is a semi-distributed hydrological model constructed and developed by DILE et al. [30] based on ArcGIS software. Firstly, the model divides the whole basin into several sub-basins based on DEM data. Then, the sub-basin is classified into several hydrological response units (HRU) according to soil type, land-use type, and slope grade. The hydrological behavior of this type of HRU is considered the same in the sub-basin [31]. Finally, the runoff simulation of the basin is realized by combining precipitation, air temperature, wind speed, and other meteorological data. In this study, surface runoff was calculated using the runoff curve number method SCS. The river confluence process is calculated by the water balance principle. Sub-watershed division is based on a digital elevation model and adopts "Burn-in" algorithm [32]. The total area of the simulated watershed is 2055.067km2, which is divided into 27 sub-basins and 178 hydrological response units.
The simulation effect of the SWAT model can be evaluated by the deterministic coefficient R2, Nash coefficient NSE and bias percentage PBIAS.
2.5. CA–Markov Model
The Cellular Automata model is a discontinuous time-space dynamic simulation model [35], which can effectively characterize the rules of cellular unit interaction in landscape change. Its principle is to predict the state transformation in the next period with specific transformation rules through the current state of the cell and its neighborhood state [36,37]. The expression is:
where S stands for cellular state; t, t + 1 represents a certain time; represents cellular neighborhood; f represents transformation rules for cells.
The Markov model is a common method to predict the occurrence probability of events based on Markov chain theory [38]. When it is applied to land-use change, the change between different regions is regarded as a Markov process. The conversion of a certain land type at a certain moment is regarded as a possible state in the Markov process. It is only related to the land type at the previous moment, and the amount of area converted between different regions is the Markov transfer probability [39]. Its expression is:
where represents the ground class state of ; is the probability transition matrix.
The CA-Markov model not only has the quantitative prediction advantage of Markov model, but also integrates the simulation ability of the CA model in complex space. The coupling of the two models can simulate and predict land-use change more accurately from both quantitative and spatial aspects [40, 41].
In this study, the CA-Markov model was used to predict future land use pattern changes in Luojiang Basin, and the Kappa coefficient was used to test the simulation results:
where is the correct proportion of simulation; s the correct proportion simulated under the random condition of the model; is the correct proportion simulated under ideal classification. When it indicates that the simulation error is small; when it indicates that the simulation error is large.
3. Results and Analysis
3.1. Mann–Kendall Trend Analysis
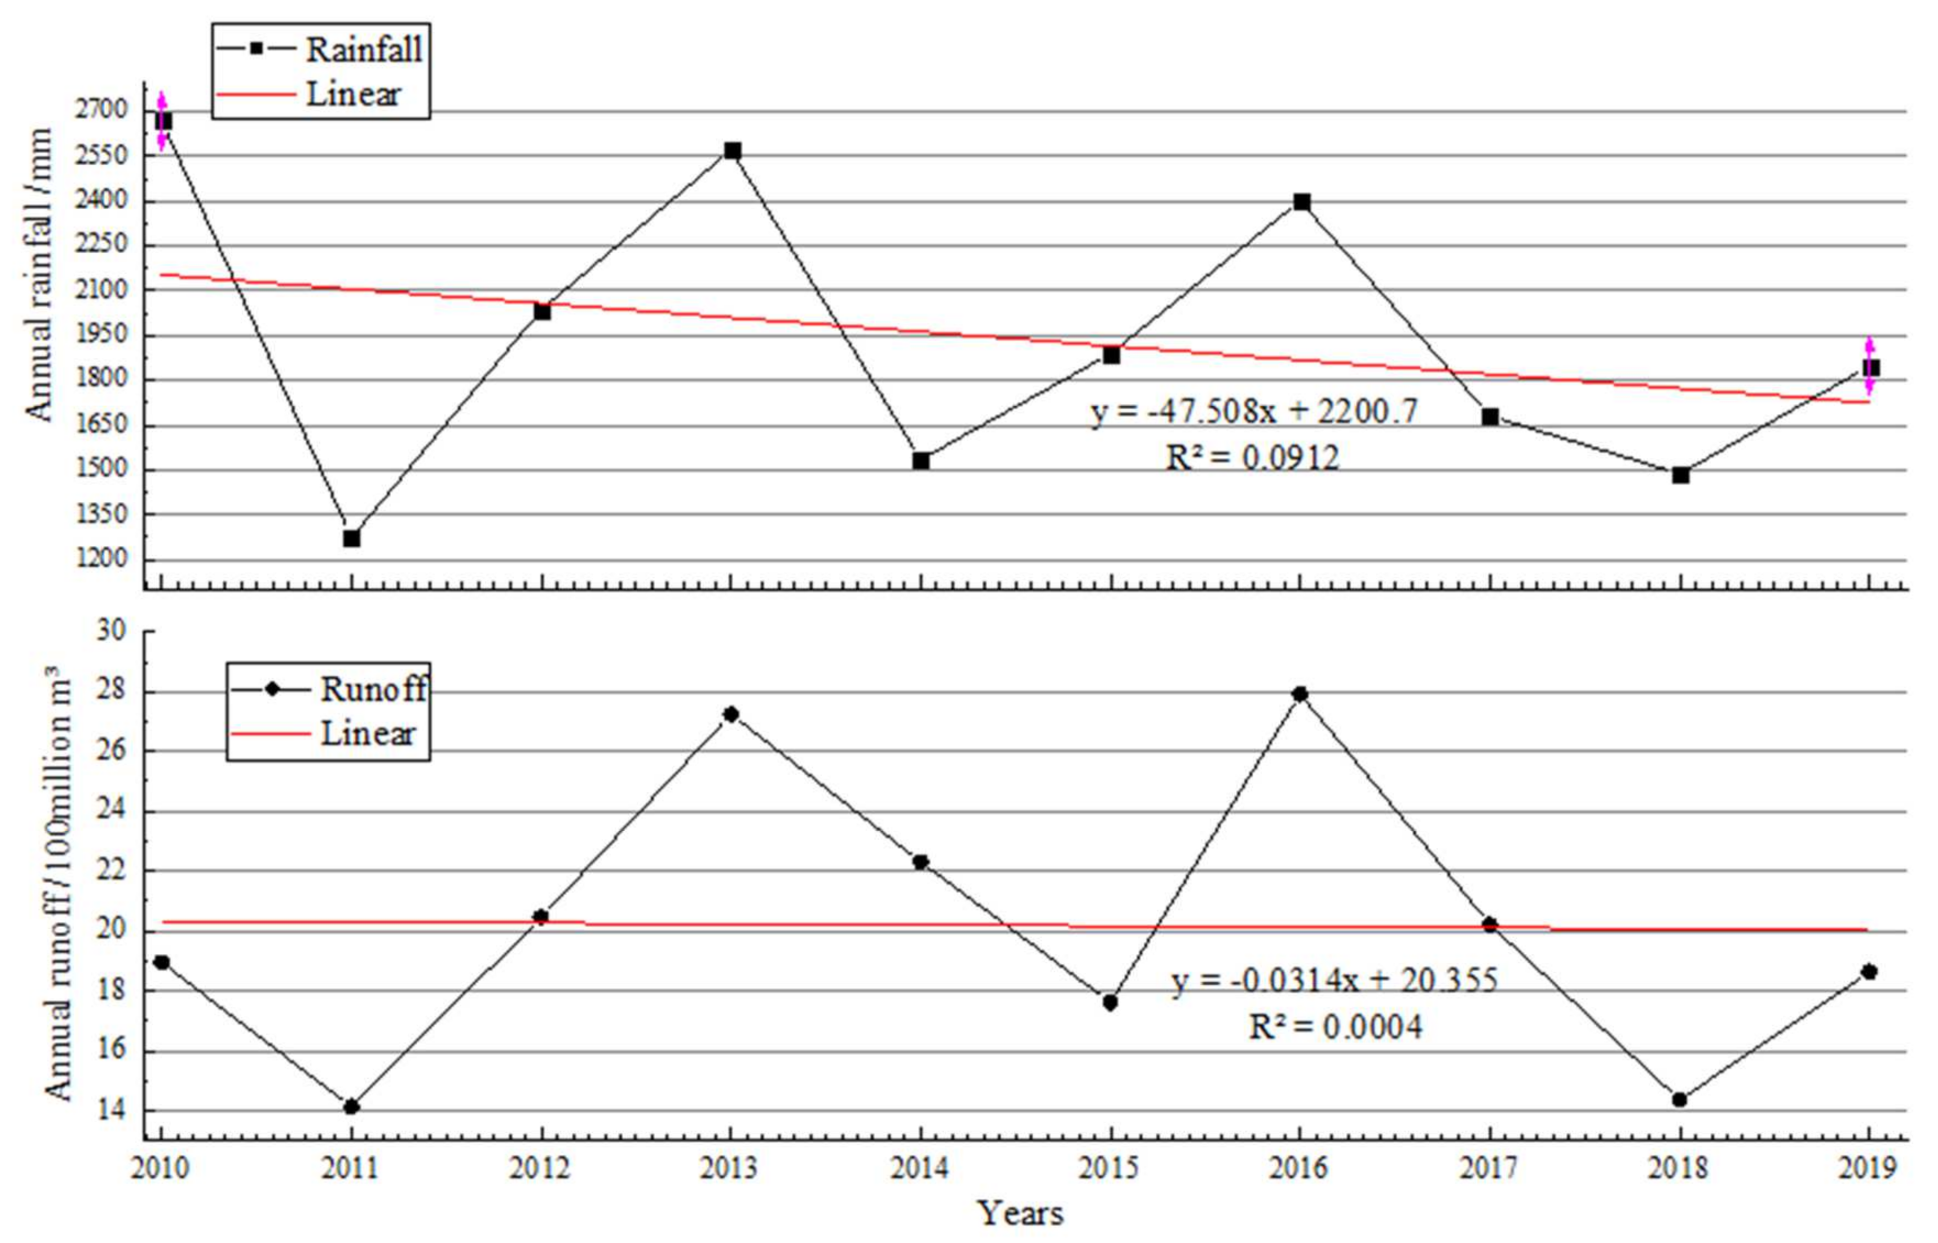
According to the Mann–Kendall trend analysis (Figure 4), the rainfall and runoff in the Luojiang Basin showed a downward trend from 2010 to 2019, and the decline in annual runoff has a more gradual decline. The maximum yearly rainfall was 2669.5 mm in 2010. The maximum yearly runoff occurred in 2016, which was 2.79 billion m3. Rainfall and runoff maxima appear in different years and deviate greatly. The minimum annual rainfall and annual runoff occurred in 2011, 1274.5 mm and 1.41 billion m3, respectively. The annual precipitation and annual runoff changed synchronously in the other years, except that the annual precipitation delayed the annual runoff in 2014–2015.
3.2. SWAT Model Calibration and Verification
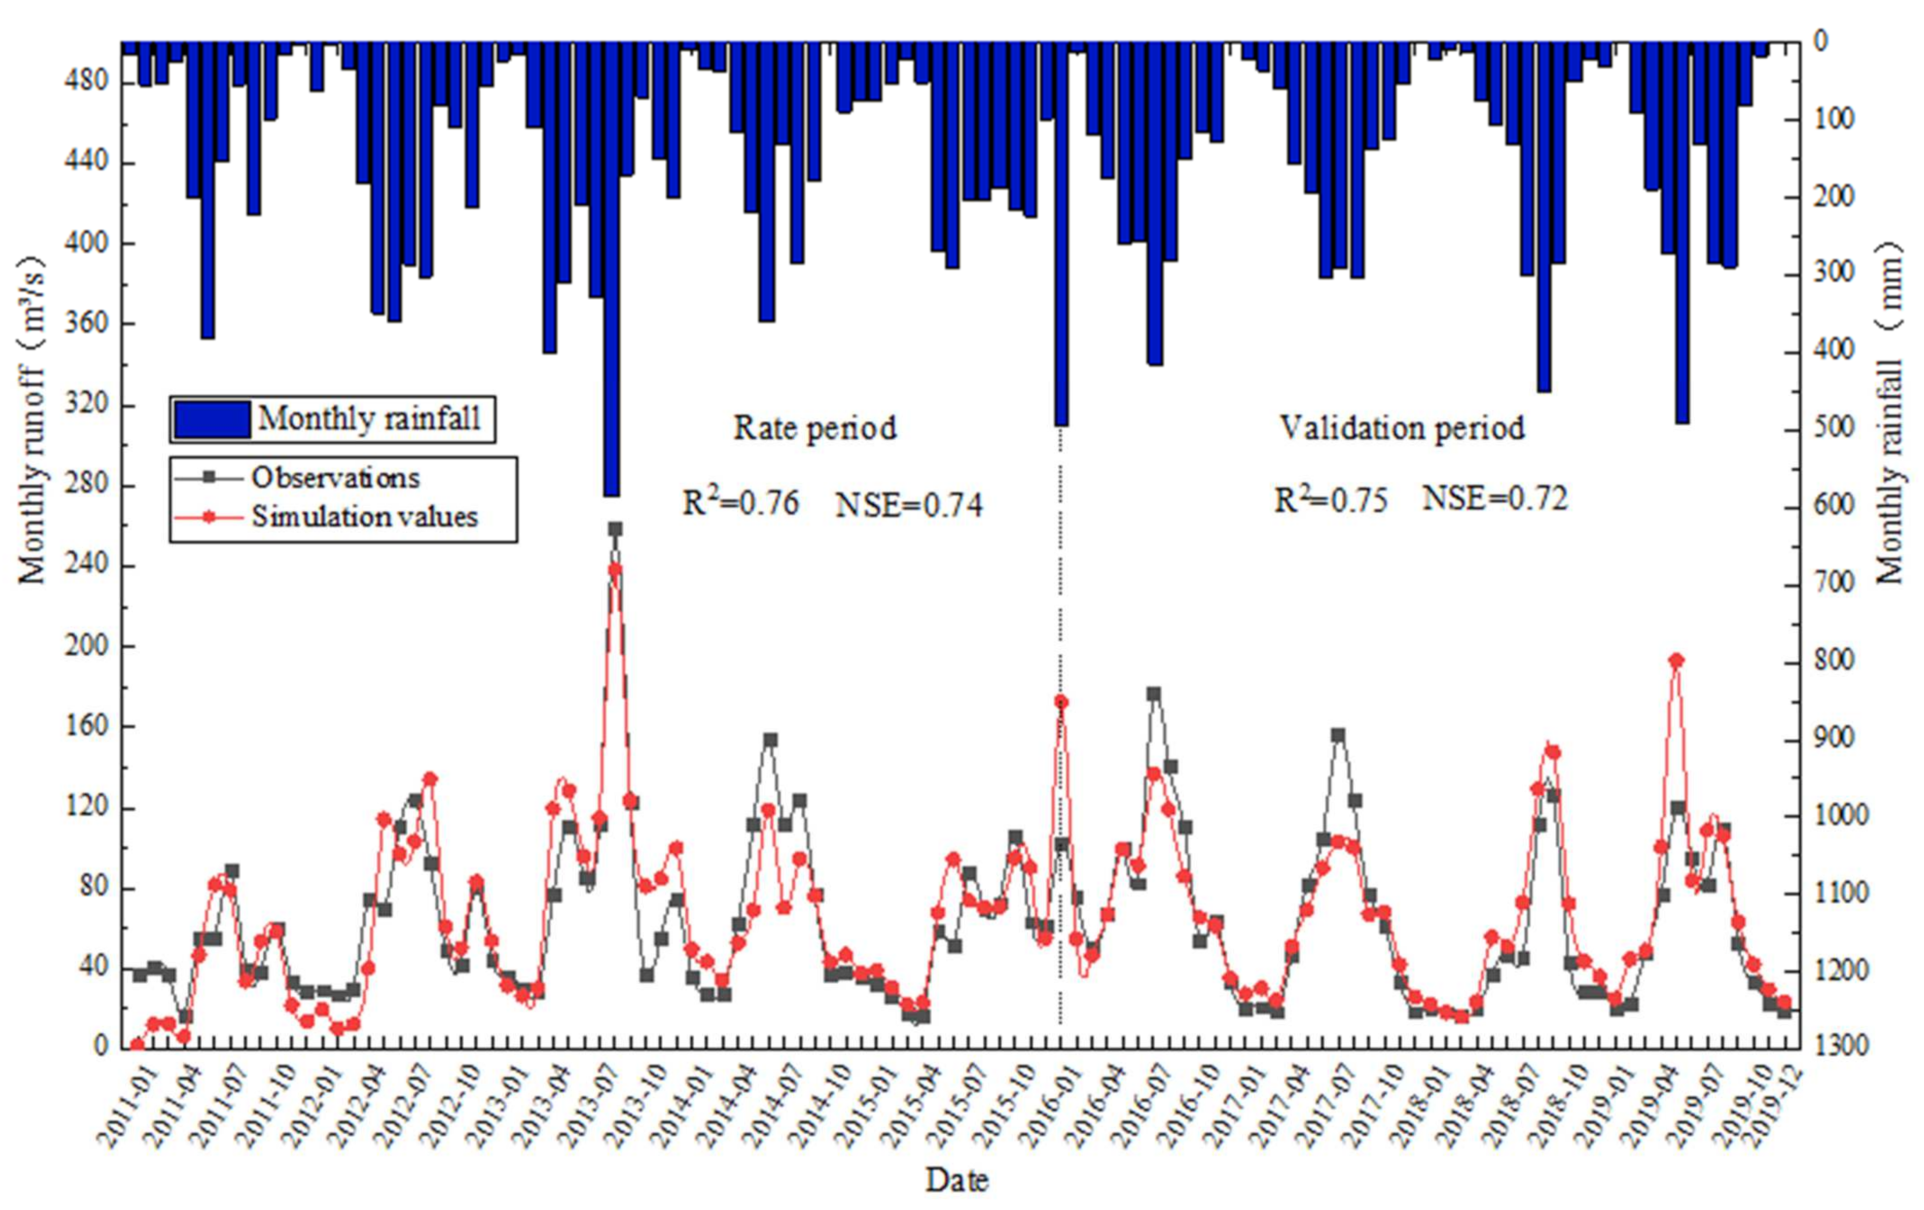
Set 2009–2010 as the warm-up period, 2011–2015 as the regular rate, and 2016–2019 as the verification period. Taking land-use in 2018 as the background, combined with soil type data and measured precipitation data, the construction of the SWAT model was completed. Through parameter sensitivity analysis [7], 13 sensitivity parameters were selected (Table 2). Parameter calibration was carried out with the help of the SUFI-2 algorithm in SWAT-CUP, and the simulation results met the requirements (Table 3). The simulated values of the periodic rate and each month of the verification period fit well with the measured flow process line, as shown in Figure 5.
3.3. Analysis of Land Use Change
We used IDRISI and ArcGIS software to analyze the land use area of the river basin in 2010, 2015, and 2018. The results are shown in Table 4. Meanwhile, land use transfer matrices from 2010 to 2015 and 2015 to 2018 can be listed, as shown in Table 5 and Table 6. As can be seen from Table 4, the main types of land use in all calculated years are garden land, which accounts for more than 80% of the total area, followed by arable land, while grassland use is relatively small, which accounts for less than 1.5% of the total area. In three analysis years, the order of land use type area was Garden land > Arable land > Forest land > Commercial land > Grassland. As can be seen from Table 5, from 2010 to 2015, there was neither an increase nor decrease of grassland, the area of garden land decreased slightly, and was transformed into forest land, commercial land, and arable land, of which the forest land area was most transferred. As can be seen from Table 6, from 2015 to 2018, all kinds of land use types underwent complex bidirectional conversion, in which the area of grassland, forest, and garden decreased by 6.144 km2, 9.198 km2, and 5.145 km2, respectively, while the area of commercial land increased by 8.963 km2, followed by the area of arable land, which increased by 6.609 km2.
3.4. Impact of Land-Use Change on Runoff
To study the impact of land use change on runoff formation, the land-use data of 2010 and 2015 were used to replace the land use data of 2018 under the same conditions as other data. The SWAT model was used to analyze the runoff response of land-use changes.
3.4.1. Effects of Land-Use Change on Annual Runoff
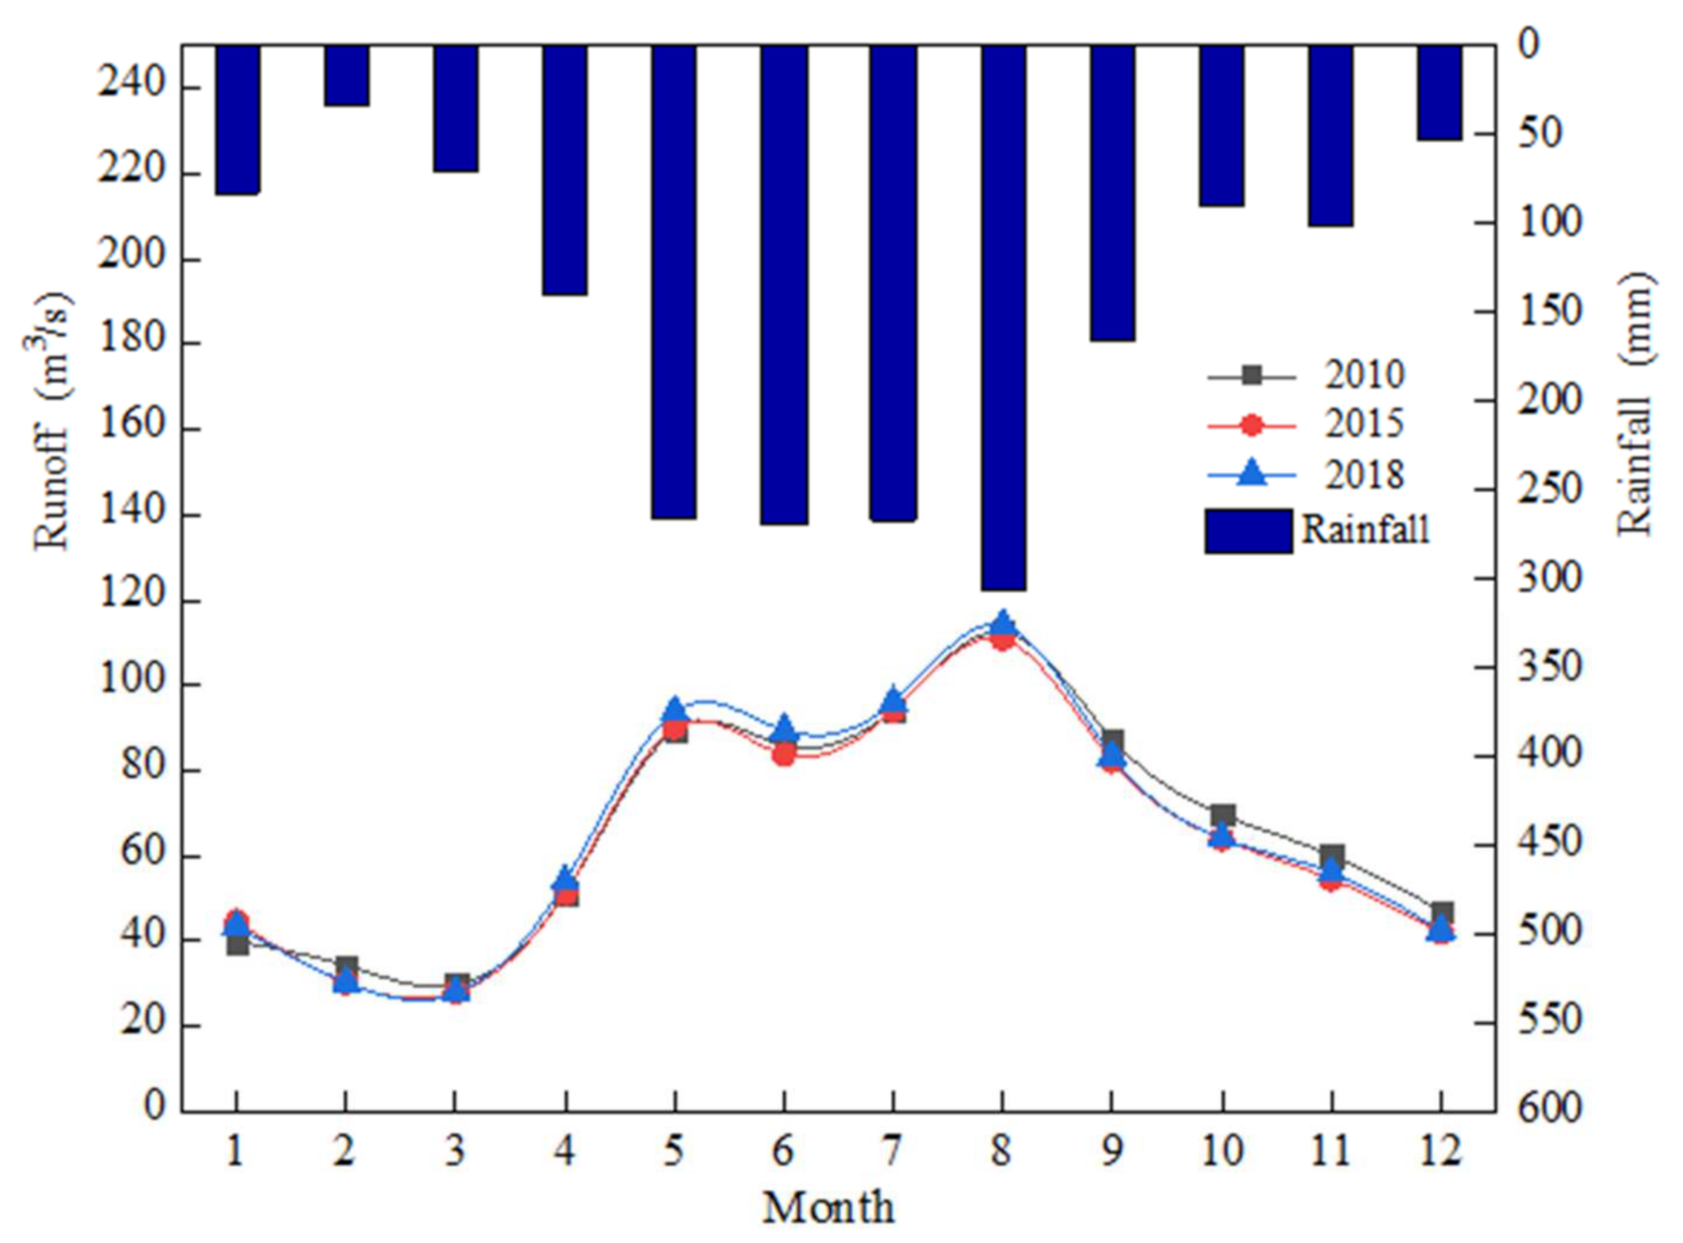
This paper analyzes the impact of land-use changes on the annual change of runoff through the yearly change of average monthly runoff under three land-use scenarios. To increase the representativeness of simulation results, rainfall data from the regular period and validation period of 9 years (2011–2019) were selected for monthly scale simulation. The simulation results of the monthly average runoff are shown in Figure 6.
The analysis shows that the trend of the monthly average runoff simulated under the three land-use scenarios is basically the same. The overall runoff was first reduced and then increased. The runoff is concentrated from May to August each year, accounting for about 48.69% of the annual total. In March, the runoff reached its lowest value, and then it began to increase significantly. In June, the runoff declined, but the decline was not obvious, and the runoff reached its maximum in August. Thus, the runoff in this area is mainly recharged by precipitation.
Compared with the runoff under the background of land use in 2010, the simulated monthly average runoff under the background of land use in 2015 was reduced by 2.179 m3/s. According to the land transfer matrix from 2010 to 2015, the garden area decreased, while the forest area increased in 2015. The increase of forest area can improve the interception rate of precipitation and make surface runoff difficult to form, thus reducing the runoff.
Compared with the land-use background in 2015, the monthly average runoff under the land-use background in 2018 increased by 1.596 m3/s. According to the land transfer matrix from 2015 to 2018, the area of arable land and commercial land increased significantly in 2018. With the increase of cultivated land, the retention effect and water retention of the underlying surface decreased, which promoted runoff confluence. The substantial increase of commercial land area greatly increases the area of regional hardening, which changes the original permeability characteristics of the region. In addition, the surface vegetation is less, and the interception rate of precipitation is low. The occurrence rate of runoff generation and overland flow is relatively fast, which leads to the increase of surface runoff [42].
3.4.2. Spatial Impact of Land-Use Change on Runoff
The runoff coefficient is often regarded as an important index reflecting runoff production, comprehensively reflecting the relationship between rainfall and runoff. The larger the runoff coefficient is, the more difficult the rainfall is to be absorbed by the soil [43], and the more likely surface runoff is to occur. In this paper, runoff coefficient is used to analyze the characteristics of runoff generation in each sub-basin:
where α is runoff coefficient; R is the perennial runoff depth, mm; P is the average annual rainfall of the basin, mm.
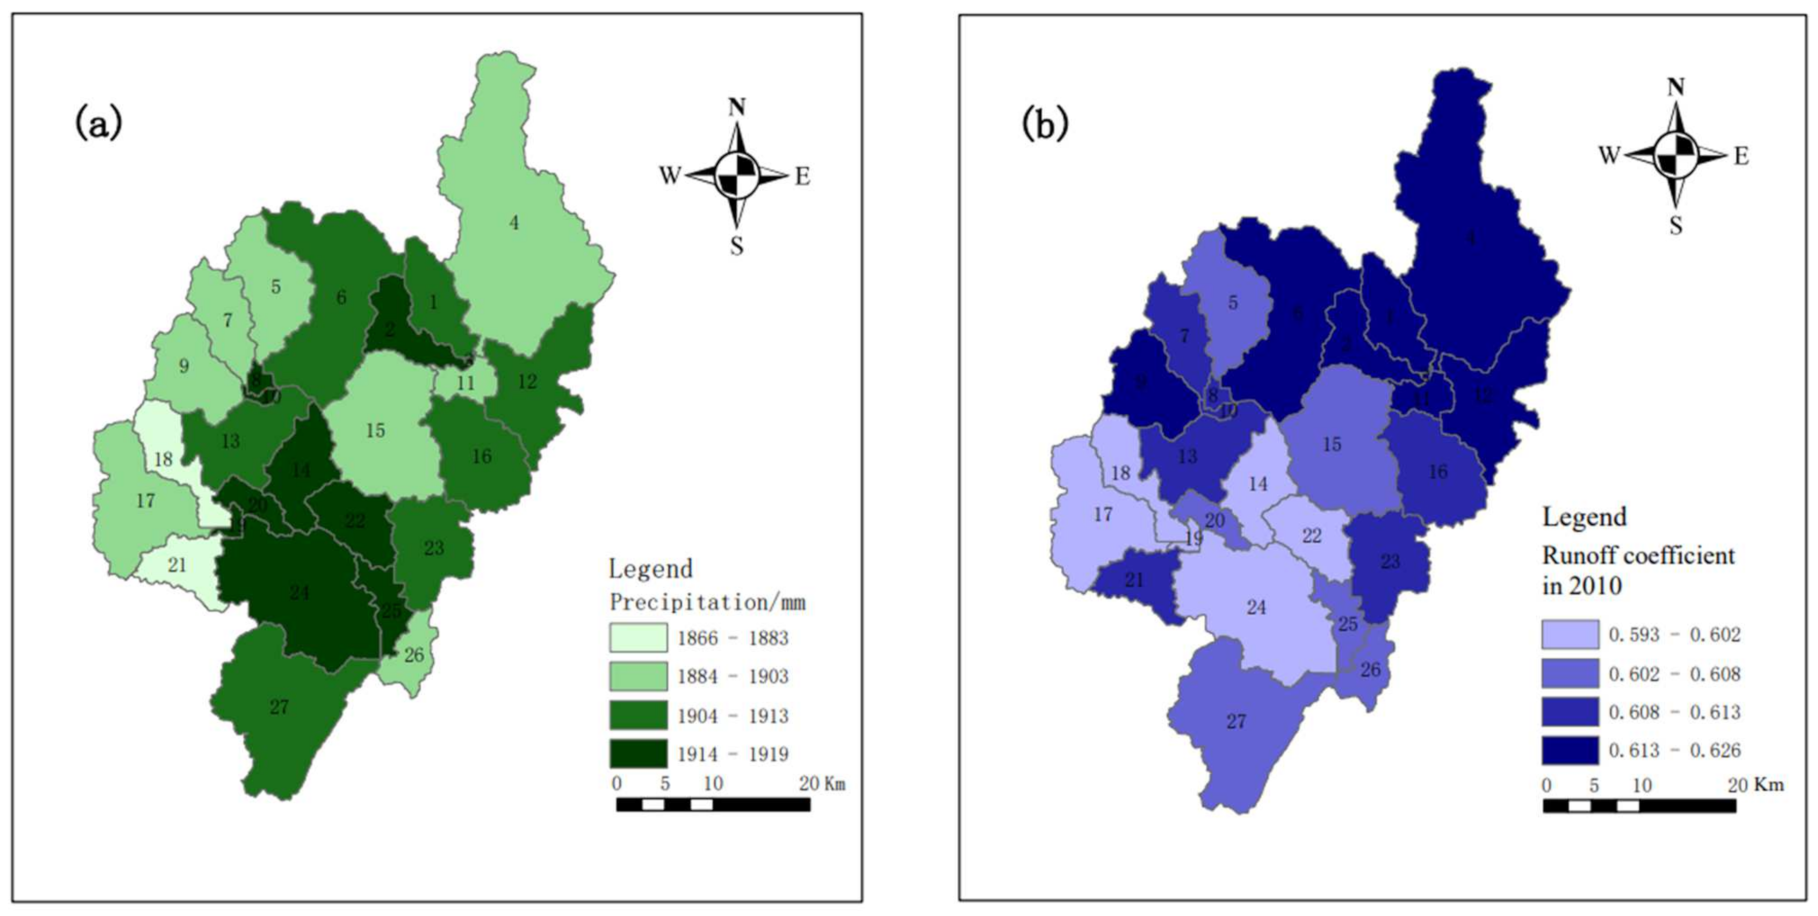
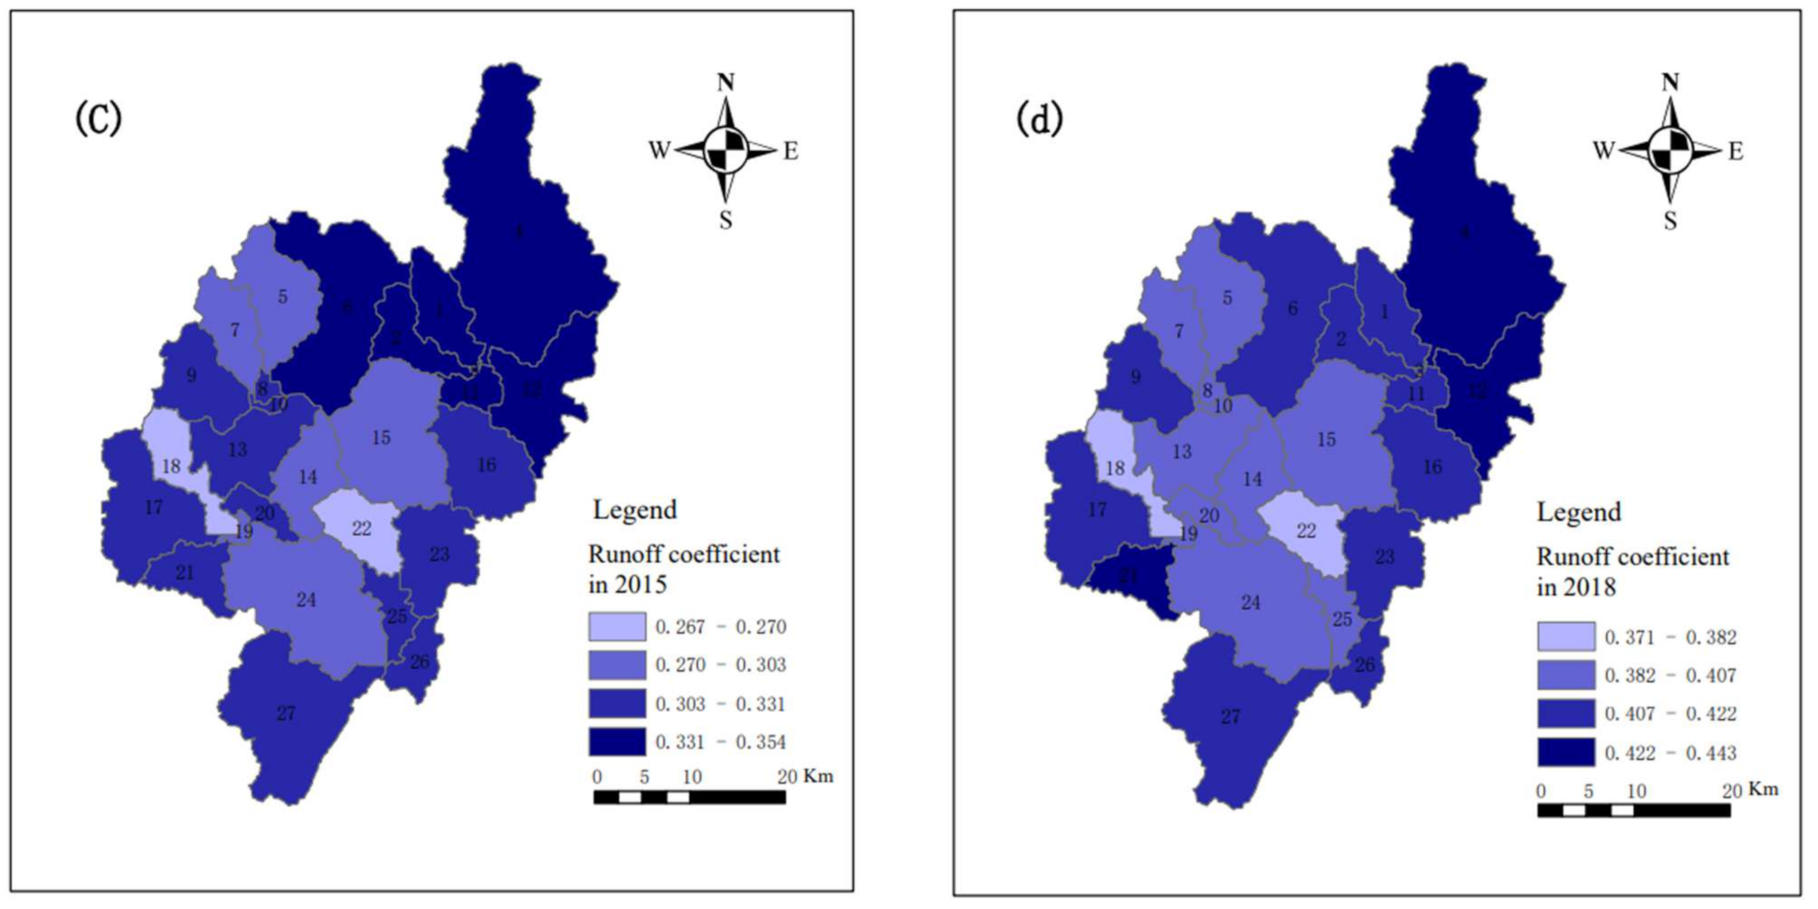
The simulation of runoff from 2011 to 2019 under three land-use backgrounds in 2010, 2015 and 2018 is illustrated as an example. The distribution map of multi-year average precipitation in each sub-basin (Figure 7a). The distribution map of runoff coefficient under three land-use conditions, are shown in Figure 7b,c,d.
The comparison shows that under the land-use scenario in 2015, the runoff coefficient of the whole basin is the smallest, and the runoff coefficient of each sub-basin is between 0.267 and 0.354. Under the land-use scenario in 2010, the runoff coefficient of the basin as a whole was relatively the largest, and the runoff coefficient of each sub-basin ranged from 0.593 to 0.626. Under the three land use conditions, the runoff coefficients of each sub-basin in the northeast were larger than those in central and southern regions. The main reason is that the cultivated type in the northeast of the basin covers more area, while the grassland is mainly concentrated in the middle and south of the basin. The grassland has a stronger retention effect on runoff and a more significant effect on water conservation, so the runoff coefficient is lower.
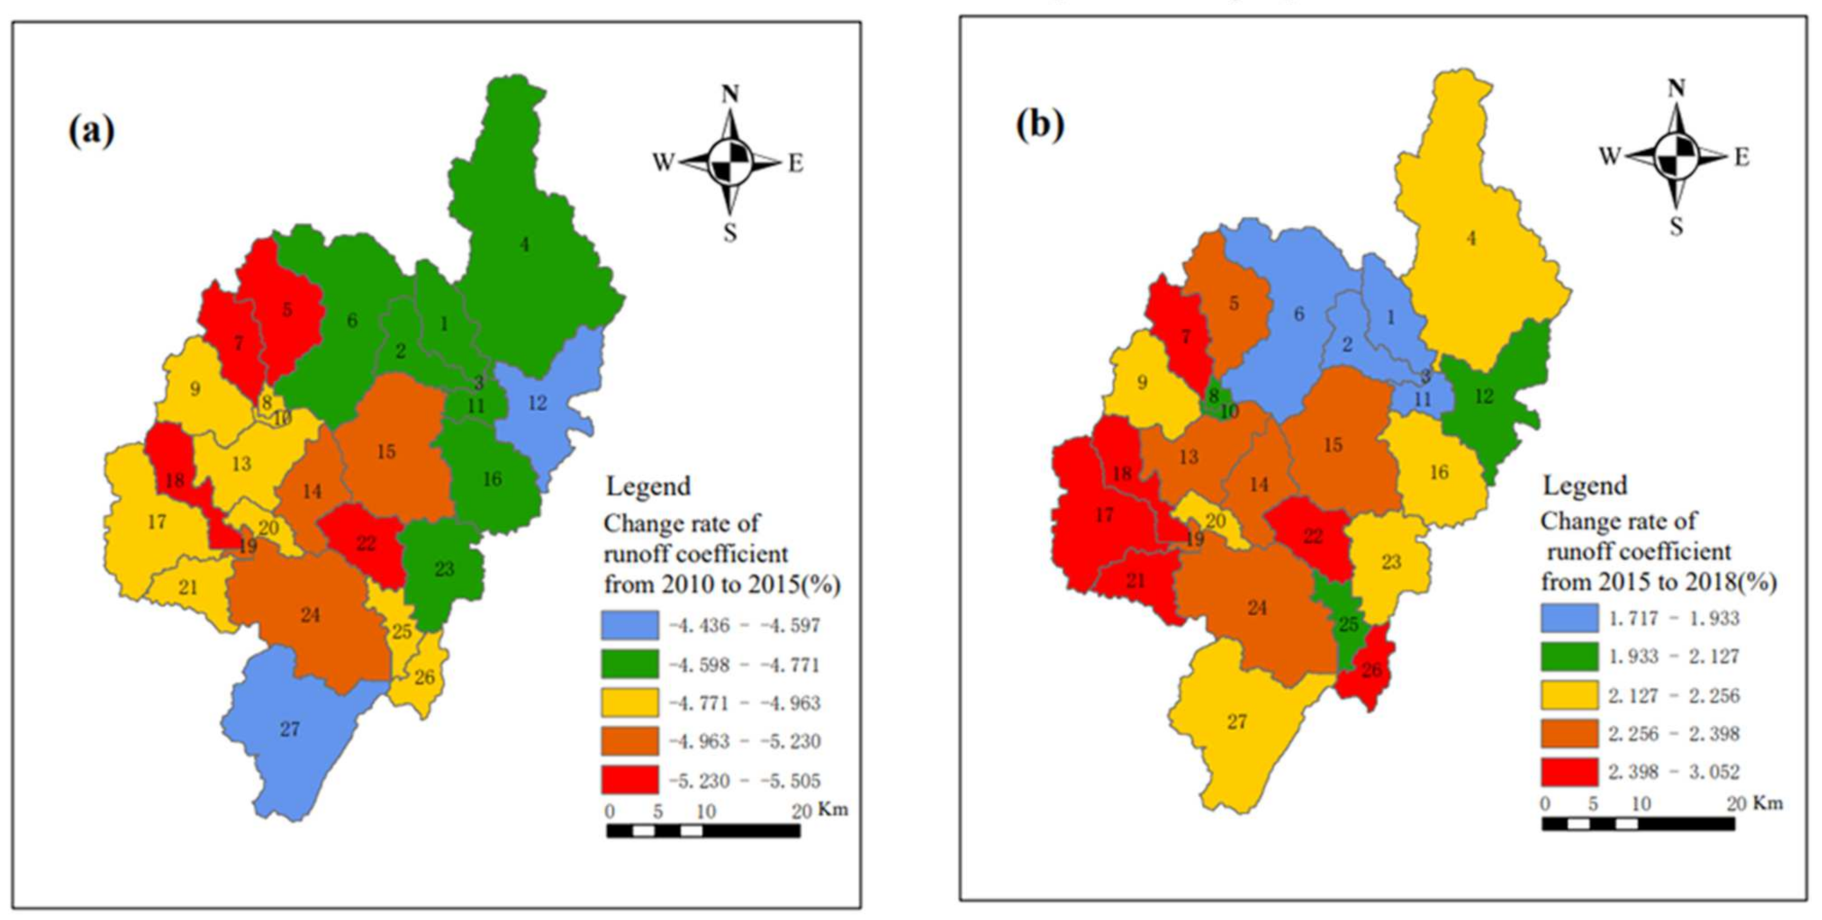
Based on the runoff coefficient distribution maps corresponding to the three land use types, the change rate distribution maps of the runoff coefficient of different land types in the basin can be calculated (Figure 8). Under land use conditions, the average runoff coefficient of each sub-basin decreased in 2015 compared with that of 2010, and the most significant decrease was in sub-basins 5, 7, 18, and 22, which were all more than 5.230%. However, the variation of the runoff coefficient was relatively small in most of the northeastern basins and the most southern sub-basin no. 27, with a decrease of 4.436% to 4.597%. The average runoff coefficient of each sub-basin increased in 2018 compared with 2015, and the southwest of the basin and sub-basin 7, 22, and 26 had the most significant increase, with a change rate of 2.398%. In the northern part of the basin, sub-basins 1, 2, 3, 6, and 11 had the smallest increase rate, with the change rate ranging from 1.717% to 1.933%.
Sub-basins 7, 18, and 22 with the most significant runoff coefficient variation are the main objects for land-use change analysis (Table 7). Compared with 2010, the garden area of the basin decreased in 2015, while the forest area increased, which led to the decrease of the average runoff and runoff coefficient under the background of land use in 2015. In 2018, the area of arable land decreased compared with 2015, which led to a decrease in average runoff and a decrease in runoff coefficient in the context of land use in 2018. However, the reduction effect is not obvious because of the small change.
3.5. Prediction of Runoff Variation Trend in the Future
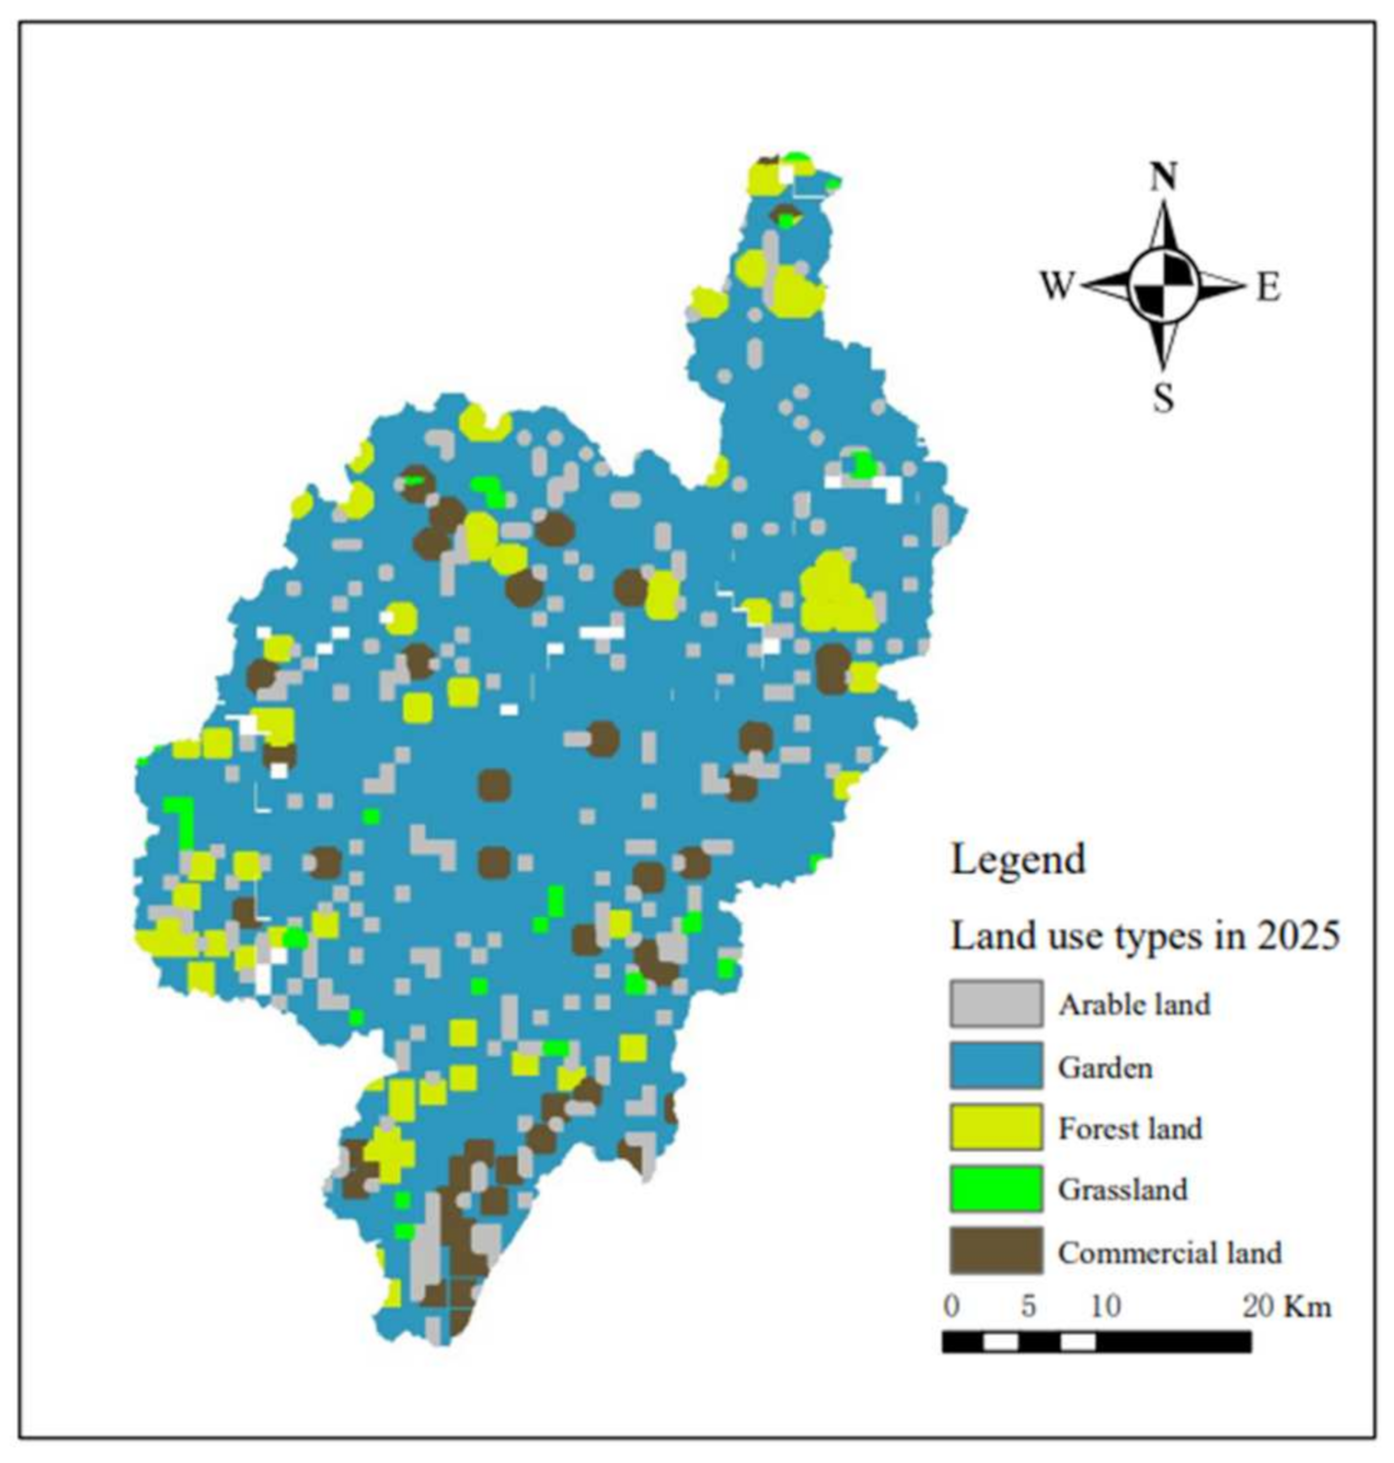
Using the CA–Markov model, the land use type maps of 2005 and 2010 were used to simulate the map of 2015. We imported the land use type maps in 2005 and 2010 into IDRISI software to obtain the land use transfer area matrix from 2005 to 2010. The suitability atlas of slope, altitude, and geomorphic elements was made, and the transition area matrix was used as the transition rule to participate in the simulation and prediction of land use in 2015. The 5 × 5 mole field was used as the filtering parameter of CA–Markov model, and the iteration cycle was 5 years, then the prediction map of spatial distribution of land use in 2015 was obtained. Analyzed the similarity between the actual land use type map in 2015 and the predicted results, the Kappa coefficient is 0.9271, and the simulated value is very similar to the actual value. Therefore, this model can be used to map the land use type in 2025 under natural ecological variation (Figure 9).
Compared with the land-use scenario in 2018 (Table 8), the land-use situation in the basin will change significantly in 2025. The arable land and garden land will be converted to commercial land, grassland, and forest land. The increase of commercial land area and the decrease of garden land area are the most significant, 58.680 km2 and 83.432 km2 respectively, while the change of forest land-use type is the least, which is 1.43%.
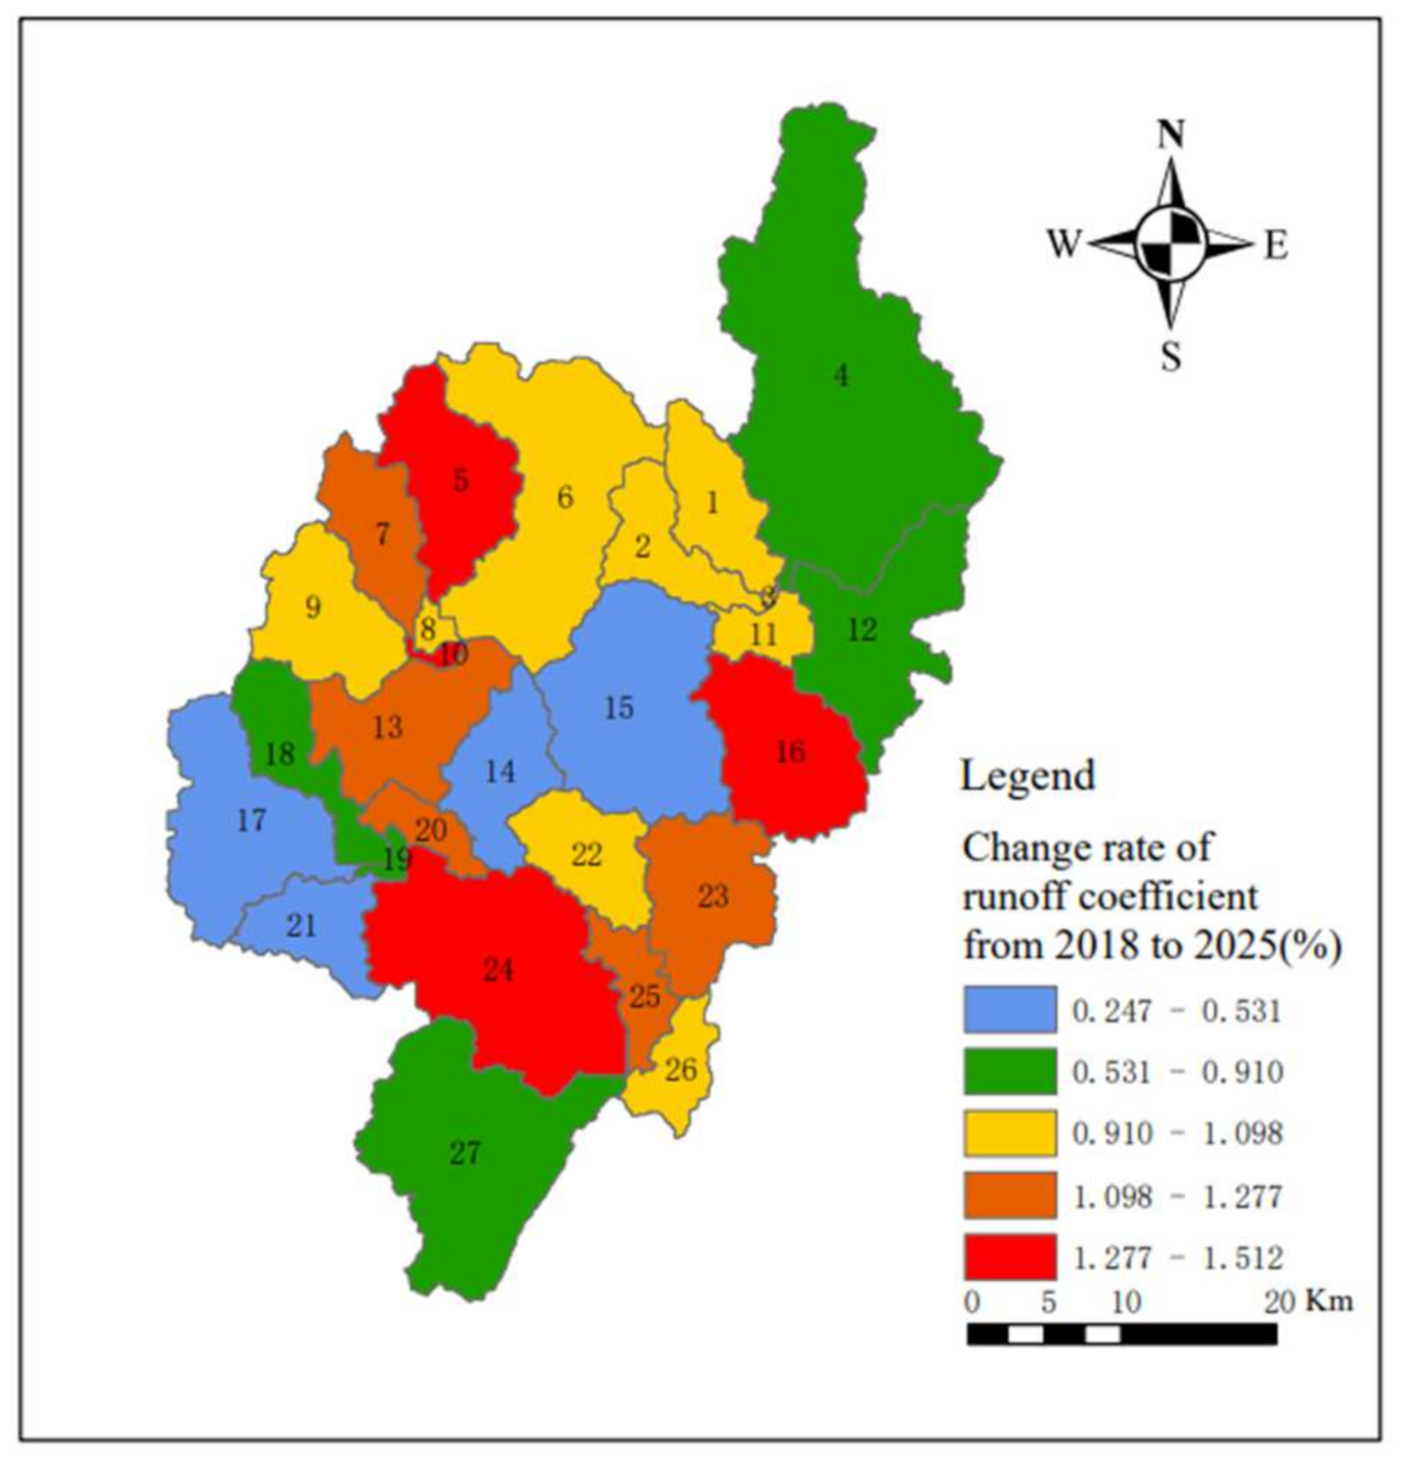
The predicted land use type map was used as the land-use background to simulate the runoff from 2011 to 2019 and compare it with the runoff process under the land-use scenario in 2018. We calculated the change rate of the runoff coefficient under the two land-use scenarios, as shown in Figure 10. It can be seen from the figure that the runoff coefficient will increase under the land-use scenario in 2025. Among them, sub-basins no. 5, 10, 16, and 24 had the most significant increase, between 1.277% and 1.512%, while the northeastern sub-basins no. 4 and 12, the southernmost sub-basin no. 27, and the southwest and central sub-basins NO.17, 21, 18, 14, and 15 had a relatively small increase, between 0.247% and 0.910%.
4. Discussions
4.1. Impact of Land Use Change on Runoff
Through the simulation analysis of the runoff generation under two land-use scenarios in 2010 and 2015, it can be seen that in 2015, compared with the background of land use in 2010, the runoff coefficient of the watershed decreased, and the average monthly runoff decreased by 2.179 m3/s. Combined with the 2010–2015 land use transfer matrix, it can be seen that the main reason for this is that the area of gardens in the study area has decreased, while the area of forest has increased. According to the simulation analysis of two land-use scenarios in 2015 and 2018, the runoff coefficient of the basin under the background of land use in 2018 has increased, and the annual average monthly runoff has increased by 1.596 m3/s. Based on the land use transfer matrix from 2015 to 2018, the main reason is the increase of arable land and commercial land areas. However, the decreased degree of runoff coefficient caused by land-use conversion from 2010 to 2015 exceeds the increased degree of the average runoff coefficient caused by land-use conversion from 2015 to 2018.
Combined with the above analysis, the Mann–Kendall trend analysis shows that the runoff in Luojiang River Basin had a decreasing trend in recent 10 years. The reasons are as follows: firstly, the rainfall is decreasing; secondly, the change of land use also leads to the decrease of runoff coefficient.
4.2. Reflection on Future Land Use Type Change
Combining the SWAT model and the CA–Markov model can predict future land use types and simulate the runoff variation trend. Based on the land use scenario in 2015 and the CA–Markov model, this paper predicts the land use scenario in 2025, and simulates the runoff process from 2011 to 2019. The results show that compared with the 2018 land use scenario, the runoff coefficient of the whole basin has increased. The main reasons are that the urbanization construction rate will accelerate in the future, the area of arable land and garden will decrease, the area of commercial land will continue to expand, and the surface infiltration capacity will weaken, leading to an increase in the runoff coefficient.
4.3. Recommendations
The increase of urban land leads to the increase of runoff coefficient, which is the decline of regional water conservation capacity and increases the flood control pressure of downstream channels. Urbanization is a trend of regional development. Under this premise, it is necessary to increase water storage engineering measures in urban areas to reduce the above-mentioned adverse effects. For example, sponge city projects are built in urban areas to enhance water storage capacity in urban areas and realize comprehensive utilization of water resources in rainy and flood periods.
5. Conclusions
In this paper, the Luojiang River Basin was taken as a research area. The main content of the research included three aspects: Analyzing the trend of rainfall and runoff in the past 10 years by using the Mann–Kendall test; according to the land-use scenarios in 2010, 2015, and 2018, using the SWAT model to study the impact of land-use change on runoff, where the CA–Markov model predicted the future land use situation; and analyzing the future flow situation based on the land-use scenario. The main conclusions are as follows:
- (1)
- The R2 and NSE of the constructed SWAT model can reach more than 0.70 in both periodic and validation periods. The deviation coefficient PBIAS is less than 20%, which can better simulate the flow yield situation in the Luojiang River Basin.
- (2)
- The Mann–Kendall trend analysis shows that the runoff in the Luojiang River Basin has a decreasing trend in the past 10 years. The reason for this lies in two aspects: first, rainfall presents a downward trend; second, the change of land use also leads to the decrease in the runoff coefficient. The area of the orchard in the study area has decreased, and the increase of woodland area leads to the decrease of the runoff coefficient, while the increase of the cultivated land and commercial land area leads to the increase of the runoff coefficient. The general trend is that the runoff coefficient increases.
- (3)
- The CA–Markov model is used to simulate the 2025 land-use type, and the prediction shows that the garden area will decrease and the commercial area will increase greatly in 2025, which will lead to an increase of the runoff coefficient in the future. The increase of the runoff coefficient will bring some adverse effects, and relevant measures should be taken to increase water storage capacity in urban areas.
Author Contributions
J.H. was responsible for the original concept and writing the paper. Y.-R.W. and W.-C.W. processed the data and conducted the program design. H.-T.C. revised the manuscript and shared numerous comments and suggestions to improve the study quality. All authors have read and agreed to the published version of the manuscript.
Funding
This research was funded by the project of key science and technology of the Henan province (No: 202102310259) (2020.1~2021.12), and the Henan province university scientific and technological innovation team (No: 18IRTSTHN009) (2017.1~2019.12).
Institutional Review Board Statement
Not applicable.
Informed Consent Statement
Not applicable.
Data Availability Statement
Not Applicable.
Acknowledgments
The authors are grateful to the project of key science and technology of the Henan province (No: 202102310259), and the Henan province university scientific and technological innovation team (No: 18IRTSTHN009).
Conflicts of Interest
The authors declare that they have no conflict of interest.
References
- Jing, T.; Shenglian, G.; Dedi, L.; Qihui, C.; Qiang, W.; Jiabo, Y.; Xushu, W.; Shaokun, H. The impact of climate and land use changes on runoff in the Hanjiang River Basin. Acta Geogr. Sin. 2020, 75, 2307–2318. [Google Scholar] [CrossRef]
- Xinping, M.; Tao, W.; Yuyang, Y. Research on the Runoff Scenario Prediction of the Upper Hanjiang River Basin Based on the SWAT Model. Remote Sens. Land Resour. 2021, 33, 174–182. [Google Scholar] [CrossRef]
- Aboelnour, M.; Gitau, M.W.; Engel, B.A. A Comparison of Streamflow and Baseflow Responses to Land-Use Change and the Variation in Climate Parameters Using SWAT. Water 2020, 12, 191. [Google Scholar] [CrossRef] [Green Version]
- Zhang, D.; Liu, X.; Liu, C.; Bai, P. Responses of runoff to climatic variation and human activities in the Fenhe River, China. Stoch. Environ. Res. Risk Assess. 2013, 27, 1293–1301. [Google Scholar] [CrossRef]
- Ya, W.; Jijun, M. Spatiotemporal analysis of hydrological effects of land use change in the middle reaches of the Heihe River based on InVEST model. Acta Sci. Nat. Univ. Pekin. 2015, 51, 1157–1165. [Google Scholar] [CrossRef]
- Jiahu, W.; Yang, H.; Jonathan, G.; Pardeep, A.; Li, L.; Fengge, S. Quantitative assessment of climate change and human impacts on long-term hydrologic response: A case study in a sub-basin of the Yellow River, China. Int. J. Climatol. 2010, 30, 2130–2137. [Google Scholar] [CrossRef]
- Yingxue, L.; Changchun, X.; Qiuping, Y.; Yuanyuan, Y.; Jinxia, Z. The impact of future land use changes on runoff in the upper Kaidu River based on the SWAT model. J. Irrig. Drain. 2019, 38, 100–108. [Google Scholar] [CrossRef]
- Peili, S.; Wenhua, L. The effect of forest vegetation change on hydrological process and runoff. J. Nat. Resour. 2001, 16, 481–487. [Google Scholar] [CrossRef]
- Qian, L.; Jing, Z.; Huili, G. Hydrological simulation and parameter uncertainty analysis of Guishui River Basin based on SUFI-2 algorithm and SWAT model. Hydrology 2015, 35, 43–48. [Google Scholar] [CrossRef]
- Lei, W.; Huan, D.; Jianzhi, X. Runoff simulation of Zhangjiakou Qingshui River Basin based on SWAT model. J. Water Ecol. 2020, 41, 34–40. [Google Scholar] [CrossRef]
- Cheng, C. The impact of land use, land cover change and climate change on runoff in Yuanjiang Basin based on SWAT model. China Sci. Soil Water Conserv. 2020, 18, 52–59. [Google Scholar] [CrossRef]
- Wei’an, T.; Hong, T.; Yanyu, L.; Wusan, X.; Sheng, W. The impact of precipitation and land use changes on the runoff in the upper and middle reaches of the mainstream of the Huaihe River from 1961 to 2010. J. Ecol. Environ. 2015, 24, 1647–1653. [Google Scholar] [CrossRef]
- Deng, Z.; Zhang, X.; Li, D.; Pan, G. Simulation of land use/land cover change and its effects on the hydrological characteristics of the upper reaches of the Hanjiang Basin. Environ. Earth Sci. 2015, 73, 1119–1132. [Google Scholar] [CrossRef]
- Ayivi, F.; Jha, M.K. Estimation of water balance and water yield in the Reedy Fork-Buffalo Creek Watershed in North Carolina using SWAT. Int. Soil Water Conserv. Res. 2018, 6, 203–213. [Google Scholar] [CrossRef]
- Shrestha, S.; Bhatta, B.; Shrestha, M.; Shrestha, P.K. Integrated assessment of the climate and landuse change impact on hydrology and water quality in the Songkhram River Basin, Thailand. Sci. Total Environ. 2018, 643, 1610–1622. [Google Scholar] [CrossRef] [PubMed]
- Ijn, X.; Jin, Y.; Mao, X.; Zhai, J.; Fu, D. Modeling the Impact of vegetation Change on Hydrological Processes in Bayin River Basin, Northwest China. Water. 2021, 13, 2787. [Google Scholar] [CrossRef]
- Kenea, U.; Adeba, D.; Regasa, M.S.; Nones, M. Hydrological Responses to Land Use Land Cover Changes in the Fincha’a Watershed, Ethiopia. Land 2021, 10, 916. [Google Scholar] [CrossRef]
- Karimi, H.; Jafarnezhad, J.; Khaled, J.; Ahmadi, P. Monitoring and prediction of land use/land cover changes using CA-Markov model: A case study of Ravansar County in Iran. Arab. J. Geosci. 2018, 11, 592. [Google Scholar] [CrossRef]
- Chun, F.; Anqi, M. Temporal and Spatial Response of Fuhe River Basin Runoff to Land Use Change. Resour. Environ. Yangtze River Basin. 2021, 30, 342–350. [Google Scholar] [CrossRef]
- Zhiming, H. Analysis of the “2010.07” storm flood on the Luojiang River. Water Sci. Technol. Econ. 2011, 17, 61–62. [Google Scholar] [CrossRef]
- Wenju, D.; Qingqing, L.; Ye, Z.; Weiqiu, L.; Bo, Z.; Jun, D.; Jiong, C.; Nanrong, D. Study on the Utilization and Quality of Newly Increased Cultivated Land in Huazhou City. Guangdong Agric. Sci. 2013, 40, 193–196. [Google Scholar] [CrossRef]
- Liang, G.; Liuqian, D.; Dongya, S.; Changjun, L.; Bingshun, H.; Ronghua, L. Key technologies for preventing mountain flood disasters in China. J. Hydraul. Eng. 2018, 49, 1123–1136. [Google Scholar] [CrossRef]
- Dejuan, J.; Qiong, W.; Ruize, L.; Hua, Z. Simulation of total nitrogen output in Xiaoqing River Basin based on SWAT model. J. Water Resour. Water Eng. 2017, 28, 1–7. [Google Scholar] [CrossRef]
- Dongmei, X.; Hao, H.; Wenchuan, W.; Huimin, L. Research on localization of SWAT model soil physical properties database. J. North China Univ. Water Conserv. Hydroelectr. Power (Nat. Sci. Ed.) 2018, 39, 36–41. [Google Scholar] [CrossRef]
- Fanghua, H.; Xuesong, Z.; Zhifeng, Y. A distributed non-point source pollution model:calibration and validation in the Yellow River Basin. J. Environ. Sci. (Engl. Ed.) 2004, 16, 646–650. [Google Scholar] [CrossRef]
- Zhiliang, W.; Ranran, S.; Haitao, C.; Mingwei, M. Analysis of water quality change trend of Yiluo River based on Kendall test method. J. Noth China Univ. Water Resour. Electr. Power (Nat. Sci. Ed.) 2021, 42, 17–23. [Google Scholar] [CrossRef]
- Chow, M.F.; Lai, C.-C.; Kuo, H.-Y.; Lin, C.-H.; Chen, T.-Y.; Shiah, F.-K. Long Term Trends and Dynamics of Dissolved Organic Carbon (DOC) in a Subtropical Reservoir Basin. Water 2017, 9, 545. [Google Scholar] [CrossRef]
- Zhang, A.; Gao, R.; Wang, X.; Liu, T.; Fang, L. Historical Trends in Air Temperature, Precipitation, and Runoff of a Plateau Inland River Watershed in North China. Water 2020, 12, 74. [Google Scholar] [CrossRef] [Green Version]
- Patakamuri, S.K.; Muthiah, K.; Sridhar, V. Long-Term Homogeneity, Trend, and Change-Point Analysis of Rainfall in the Arid District of Ananthapuramu, Andhra Pradesh State, India. Water 2020, 12, 211. [Google Scholar] [CrossRef] [Green Version]
- Dile, Y.T.; Daggupati, P.; George, C.; Srinivasan, R.; Arnold, J. Introducing a new open source GIS user interface for the SWAT model. Environ. Model. Softw. 2016, 85, 129–138. [Google Scholar] [CrossRef]
- Wenjun, Y.; Zhuotong, N.; Yanbo, Z.; Shuo, L. Research on the Improvement and Application of the Snow Melting Module of SWAT Model. Acta Ecol. Sin. 2013, 33, 6992–7001. [Google Scholar] [CrossRef]
- Wei, G.; Chen, X.-W.; Bingqing, L. The response of model parameters to land use changes and their impact on runoff simulation at different time scales. Ecol. Sin. 2021, 41, 1–11. [Google Scholar] [CrossRef]
- Muibra, Z.; Qingdong, S.; Mohtal, P.; Run, Z. The impact of land use and climate change on runoff in the upper Urumqi River based on the SWAT model. Acta Ecol. Sin. 2018, 38, 5149–5157. [Google Scholar] [CrossRef]
- Sheng, H.; Mingming, C.; Haijun, Q.; Jinxi, S.; Wu, J.; Yu, G.; Jingzhong, L.; Kehong, S. Applicability Evaluation of CFSR Meteorological Data in Watershed Hydrological Simulation—Taking Bahe River Basin as an Example. Acta Geogr. Sin. 2016, 71, 1571–1586. [Google Scholar] [CrossRef]
- Marzieh, M.; Reza, P.H.; Ming, H.; Huichun, Z. Determining and forecasting drought susceptibility in southwestern Iran using multi-criteria decision-making (MCDM) coupled with CA-Markov model. Sci. Total Environ. 2021, 781, 146703. [Google Scholar] [CrossRef]
- Halmy, M.W.A.; Gessler, P.E.; Hicke, J.A.; Salem, B.B. Land use/land cover change detection and prediction in the north-western coastal desert of Egypt using Markov-CA. Appl. Geogr. 2015, 63, 101–112. [Google Scholar] [CrossRef]
- Chenxing, Z.; Jingjing, X.; Jing, W.; Xinbing, Y.; Jiahuan, W.; Bo, Z. Research on landscape dynamics of Baiyangdian watershed based on CA-Markov model and MCE constraints. J. Agric. Resour. Environ. 2021, 38, 655–664. [Google Scholar] [CrossRef]
- Jun, W.; Youlong, Y.; Jinman, W.; Lingxiao, Y.; Qian, T. Study on the characteristics and prediction of temporal and spatial evolution of habitat quality in Minjiang River Basin. Ecol. Sin. 2021, 41, 5837–5848. [Google Scholar] [CrossRef]
- Ruishen, X.; Qigang, Z. Ecological space prediction simulation based on Ann-CA-Markov model: A case study of Wanzhou District, Chongqing City. J. Ecol. Rural Environ. 2021, 37, 740–750. [Google Scholar] [CrossRef]
- Dibaba, W.T.; Demissie, T.A.; Miegel, K. Watershed Hydrological Response to Combined Land Use/Land Cover and Climate Change in Highland Ethiopia: Finchaa Catchment. Water 2020, 12, 1801. [Google Scholar] [CrossRef]
- Hyandye, C.; Martz, L.W. A Markovian and cellular automata land-use change predictive model of the Usangu Catchment. Int. J. Remote Sens. 2017, 38, 64–81. [Google Scholar] [CrossRef]
- Guan, D.J.; Li, H.F.; Inohae, T.; Su, W.C.; Nagaie, T.; Hokao, K. Modeling urban land use change by the integration of cellular automaton and Markov model. Ecol. Model. 2011, 222, 3761–3772. [Google Scholar] [CrossRef]
- Yangxu, S.; Youjing, Z.; Xinchuan, L.; Junwei, S. The influence of the characteristics of the underlying surface of the watershed on the multi-year average runoff coefficient. J. Northwest Sci-Tech Univ. Agric. For. (Nat. Sci. Ed.) 2017, 45, 138–147+154. [Google Scholar] [CrossRef]
Figure 1.
Location of the study area.

Figure 2.
Digital elevation data (a), and soil type data (b).

Figure 3.
Land use type data in 2010 (a), 2015 (b), and 2018 (c).

Figure 4.
Trend analysis of rainfall and runoff.

Figure 5.
Comparison of measured and simulated runoff at periodic and validation periods.

Figure 6.
Simulation results of monthly average runoff, under three land use scenarios.

Figure 7.
Annual precipitation distribution (a), and runoff coefficient distribution map in 2010 (b), 2015 (c), 2018 (d).
Figure 7.
Annual precipitation distribution (a), and runoff coefficient distribution map in 2010 (b), 2015 (c), 2018 (d).


Figure 8.
(a): Variation of runoff coefficient from 2010 to 2015. (b): Variation of runoff coefficient from 2015 to 2018.
Figure 8.
(a): Variation of runoff coefficient from 2010 to 2015. (b): Variation of runoff coefficient from 2015 to 2018.

Figure 9.
Land use map in 2025.

Figure 10.
Runoff coefficient variation map from 2018 to 2025.


Table 1.
Data description and preprocessing.
| Data Type | Data Description | Data Source | Data Processing |
|---|---|---|---|
| DEM | Digital elevation model, resolution 30 m × 30 m | Geospatial data cloud website http://www.gscloud.cn (accessed on 24 March 2021) | Projection transformation, flow direction analysis, watershed extraction |
| Land Use | Land use type maps of 2010, 2015 and 2018 with a resolution of 1 km × 1 km | Data Center for Resources and Environmental Sciences, Chinese Academy of Sciences http://www.resdc.cn (accessed on 30 March 2021) | Projection conversion, splicing, reclassification, calibration with actual data |
| Soil data | Soil database of China, resolution 1:1,000,000 | Nanjing Institute of Soil Sciences, Chinese Academy of Sciences http://vdb3.soil.csdb.cn (accessed on 25 March 2021) | Projection conversion, splicing, vector output GRID, American system conversion [23,24] |
| Hydrological data | Monthly runoff at the Hejiang Station from 2011 to 2019 | Guangdong Hydrology and Water Resources Monitoring Center Maoming Branch | Data extraction, correlation analysis, missing data filling [25] |
| Meteorological data | Daily precipitation at Jialong, Baowei and Hejiang stations from 1970 to 2019 | Maoming Hydrology Sub-bureau of Guangdong Hydrology Bureau |
Table 2.
Results of parameter sensitivity analysis.
| Parameter Name➀ | Describe | Min Value | Max Value | Fitted Value | Sensitivity Order | |
|---|---|---|---|---|---|---|
| t Value➁ | p Value➂ | |||||
| R_CN2 | SCS runoff curve coefficient | 0.511 | 0.611 | 0.555 | −3.074 | 0.003 1 |
| V_ALPHA_BF | Base flow factor | 1.500 | 1.745 | 1.572 | −1.297 | 0.199 6 |
| V_GW_DELAY | Groundwater time lag | 207.696 | 335.202 | 270.538 | −0.586 | 0.559 9 |
| V_GWQMN | Water level threshold | 1.007 | 1.696 | 1.258 | −0.11 | 0.912 12 |
| V_GW_REVAP | Coefficient of re evaporation of shallow groundwater | 0.054 | 0.082 | 0.071 | 1.404 | 0.165 5 |
| V_ESCO | Soil evaporation compensation factor | 0.912 | 0.937 | 0.930 | 1.489 | 0.141 4 |
| V_CH_N2 | Main channel Manning coefficient | 0.250 | 0.293 | 0.271 | −1.169 | 0.247 7 |
| V_CH_K2 | Effective permeability coefficient | 62.281 | 104.042 | 66.159 | 0.050 | 0.960 13 |
| V__ALPHA_BNK | Base stream alpha factor regulated by riparian storage | −0.322 | −0.038 | −0.165 | 1.900 | 0.062 3 |
| R_SOL_AWC | Soil water availability | 0.006 | 0.166 | 0.119 | −0.522 | 0.603 10 |
| R_SOL_K | Saturated permeability coefficient of soil | −0.443 | −0.226 | −0.333 | 0.825 | 0.412 8 |
| R_SOL_BD | Dry volume quality of soil | 0.241 | 0.396 | 0.310 | −2.428 | 0.018 2 |
| V_SFTMP | Snow base temperature | −6.198 | −2.847 | −4.547 | 0.249 | 0.804 11 |
Note: ➀V_ (replace); Multiply (R_) by (1 + x); ➁t value indicates the sensitivity of the parameters, the larger |t| value the more sensitive the parameter; ➂p value represents the significance of t value, the smaller the p value is, the more sensitive the parameter is. This number is the Sensitivity Order, which is explained as “Sensitivity Order” at the head of the table.
Table 3.
Evaluation table of monthly runoff simulated by the SWAT model.
| Periods | R2 | NSE | PBIAS |
|---|---|---|---|
| Rate regular period (2011–2015) | 0.76 | 0.74 | 0.09% |
| Rate regular period (2011–2015) | 0.75 | 0.72 | −7.27% |
Table 4.
Statistical table of land-use types in different years.
| Land Type | 2010 | 2015 | 2018 | |||
|---|---|---|---|---|---|---|
| Area/km2 | Percentage/% | Area/km2 | Percentage/% | Area/km2 | Percentage/% | |
| Arable land | 272.20 | 13.40 | 272.21 | 13.40 | 278.82 | 13.77 |
| Garden | 1643.11 | 80.88 | 1627.75 | 80.12 | 1622.60 | 80.10 |
| Forest land | 53.97 | 2.66 | 62.34 | 3.07 | 53.14 | 2.62 |
| Grassland | 23.21 | 1.14 | 23.21 | 1.14 | 17.07 | 0.84 |
| Commercial land | 39.13 | 1.93 | 46.09 | 2.27 | 55.06 | 2.72 |
Table 5.
Land use transfer matrix of 2010–2015.
| Land Transfer | 2015 | ||||||
|---|---|---|---|---|---|---|---|
| Grassland | Arable Land | Forest Land | Commercial Land | Garden | Sum/km2 | ||
| 2010 | Grassland | 23.213 | 23.213 | ||||
| Arable land | 272.186 | 0.001 | 0.008 | 272.195 | |||
| Forest land | 53.965 | 53.965 | |||||
| Commercial land | 39.126 | 39.126 | |||||
| Garden | 0.026 | 8.375 | 6.971 | 1627.74 | 1643.112 | ||
| Sum/km2 | 23.213 | 272.212 | 62.342 | 46.097 | 1627.748 | 2031.611 | |
Table 6.
Land use transfer matrix of 2015–2018.
| Land Transfer | 2018 | ||||||
|---|---|---|---|---|---|---|---|
| Grassland | Arable Land | Forest Land | Commercial Land | Garden | Sum/km2 | ||
| 2015 | Grassland | 2.97 | 4.372 | 15.857 | 23.199 | ||
| Arable land | 3.474 | 58.42 | 5.341 | 15.495 | 189.129 | 271.859 | |
| Forest land | 0.306 | 6.19 | 13.397 | 1.092 | 40.508 | 61.493 | |
| Commercial land | 1.17 | 14.691 | 0.094 | 3.918 | 26.091 | 45.964 | |
| Garden | 9.149 | 195.148 | 34.312 | 34.555 | 1349.44 | 1622.603 | |
| Sum/km2 | 17.069 | 278.821 | 53.144 | 55.060 | 1621.025 | 2025.119 | |
Table 7.
Area ratio of land use types in sub-catchments.
| Proportion of Land Use Type (%). | Sub-Basin No. 7 | Sub-Basin No. 18 | ||||||||
|---|---|---|---|---|---|---|---|---|---|---|
| Arable Land | Garden | Forest Land | GRASSLAND | Commercial Land | Arable Land | Garden | Forest Land | Grassland | Commercial Land | |
| 2010 | 0.31 | 2.21 | 0.00 | 0.00 | 0.00 | 0.27 | 2.04 | 0.00 | 0.00 | 0.03 |
| 2015 | 0.31 | 2.19 | 0.02 | 0.00 | 0.00 | 0.27 | 1.93 | 0.09 | 0.00 | 0.05 |
| 2018 | 0.23 | 2.33 | 0.00 | 0.00 | 0.00 | 0.14 | 2.21 | 0.02 | 0.00 | 0.05 |
| 2010—2015 | 0.00 | −0.02 | 0.02 | 0.00 | 0.00 | 0.00 | −0.11 | 0.09 | 0.00 | 0.02 |
| 2015—2018 | −0.08 | 0.14 | −0.02 | 0.00 | 0.00 | −0.13 | 0.28 | −0.07 | 0.00 | 0.00 |
| Proportion of Land Use Type (%) | Sub-Basin No. 22 | |||||||||
| Arable Land | Garden | Forest Land | Grassland | Commercial Land | ||||||
| 2010 | 0.29 | 2.07 | 0.01 | 0.15 | 0.10 | |||||
| 2015 | 0.29 | 2.05 | 0.05 | 0.15 | 0.10 | |||||
| 0.25 | 2.07 | 0.01 | 0.10 | 0.15 | ||||||
| 0.00 | −0.02 | 0.04 | 0.00 | 0.00 | ||||||
| −0.04 | 0.02 | −0.04 | −0.05 | 0.05 | ||||||
Table 8.
Proportion of land use types in 2025.
| Land Type | 2018 | 2025 | |||
|---|---|---|---|---|---|
| Area/km2 | Percentage/% | Area/km2 | Percentage/% | Change/km2 | |
| Arable land | 278.82 | 13.77 | 239.85 | 11.82 | −38.97 |
| Garden | 1622.60 | 80.1 | 1539.17 | 75.82 | −83.43 |
| Forest land | 53.14 | 2.62 | 92.05 | 4.53 | 38.90 |
| Grassland | 17.07 | 0.84 | 46.06 | 2.27 | 28.99 |
| Commercial land | 55.06 | 2.72 | 113.74 | 5.60 | 58.68 |
Publisher’s Note: MDPI stays neutral with regard to jurisdictional claims in published maps and institutional affiliations. |
© 2021 by the authors. Licensee MDPI, Basel, Switzerland. This article is an open access article distributed under the terms and conditions of the Creative Commons Attribution (CC BY) license (https://creativecommons.org/licenses/by/4.0/).
Share and Cite
MDPI and ACS Style
He, J.; Wan, Y.-R.; Chen, H.-T.; Wang, W.-C. Study on the Impact of Land-Use Change on Runoff Variation Trend in Luojiang River Basin, China. Water 2021, 13, 3282. https://doi.org/10.3390/w13223282
AMA Style
He J, Wan Y-R, Chen H-T, Wang W-C. Study on the Impact of Land-Use Change on Runoff Variation Trend in Luojiang River Basin, China. Water. 2021; 13(22):3282. https://doi.org/10.3390/w13223282
Chicago/Turabian StyleHe, Ji, Yu-Rong Wan, Hai-Tao Chen, and Wen-Chuan Wang. 2021. "Study on the Impact of Land-Use Change on Runoff Variation Trend in Luojiang River Basin, China" Water 13, no. 22: 3282. https://doi.org/10.3390/w13223282
Note that from the first issue of 2016, this journal uses article numbers instead of page numbers. See further details here.