Article

Facile Synthesis of Cu-Zn Binary Oxide Coupled Cadmium Tungstate (Cu-ZnBO-Cp-CT) with Enhanced Performance of Dye Adsorption

1
Department of Chemistry, Jamia Millia Islamia, New Delhi 110025, India
2
Chemical Engineering Department, College of Engineering, King Khalid University, Abha 61411, Saudi Arabia
3
Department of Chemistry, Ramjas College, Delhi University, Delhi 110007, India
4
Department of Physics, Ramjas College, Delhi University, Delhi 110007, India
5
Department of Chemistry, DeshBandhu College, Delhi University, Delhi 110019, India
6
Department of Civil Engineering, Kyung Hee University, Yongin-si 17104, Gyeonggi-do, Korea
*
Author to whom correspondence should be addressed.
Equally contributed.
Water 2021, 13(22), 3287; https://doi.org/10.3390/w13223287
Submission received: 13 October 2021 / Revised: 14 November 2021 / Accepted: 17 November 2021 / Published: 20 November 2021
(This article belongs to the Section Wastewater Treatment and Reuse)

Abstract

:
This study reports the synthesis of copper–zinc binary oxide coupled cadmium tungstate through a simple bio-precipitation method followed by calcination at 600 °C and its adsorption application. The characterization analysis reveals that the prepared composite has low particles size (nano-range), high porosity, and functional groups on the surface. The calcination of sample at 600 °C causes some essential function groups to disappear on the surface. Prepared composite was found to be effective adsorptive material to treat Congo red dye in aqueous solution. 2.5 g L−1 dose of adsorbent could remove more than 99% Congo red dye from 10 mg L−1 solution and more than 80% Congo red dye from 60 mg L−1 aqueous solution. The maximum adsorption capacity of present adsorbent was calculated to be 19.6 mg Congo red per gram of adsorbent. Isotherms analysis suggested a physio-chemical adsorption process. Thermodynamic analysis revealed a exothermic and feasible adsorption process. Adsorption rate was well explained by pseudo second order kinetics. The rate determining step was intra-particle diffusion evaluated from the Weber-Morris plot. To assess the adsorption performance of present adsorbent for Congo red dye the partition coefficient and adsorption equilibrium capacity were compared with other adsorbents. The partition coefficient and adsorption equilibrium values for 10 mg L−1 aqueous solution were found to be approximately 83.3 mg g−1 µM−1 and 4.0 mg g−1 at 30 °C and 7.0 pH using 2.5 g L−1 adsorbent. The value of partition coefficient was found to be higher than previous reported zinc oxide coupled cadmium tungstate having partition coefficient = as 21.4 mg g−1 µM−1 at 30 °C and 7.0 pH using 2.0 g L−1 adsorbent. These results suggested that present adsorption technology is efficient for wastewater treatment.

1. Introduction

Congo red (CR), an azo dye, is widely used in many production industries such as textiles, papers, and cosmetics [1]. These industries release wastewater containing CR dye, which directly reaches the water supply without any proper treatment [2]. The mixing of CR dye containing wastewater in a clean water source contaminates such clean water. There is significant damage to the human body when it comes into contact with contaminated water [3]. Therefore, pre-treatment of such water is very important. Many techniques have been used for this purpose, in which an adsorption process using nanoscopic material (NMs) has proved to be the most useful [4]. The use of NMs is an integrated approach. The morphological and surface properties of NMs decide their application in a particular field [5]. These properties largely depend on the methods of preparation [6]. Green methods, particularly, using plant extract are one of the most attractive and cost effective methods to produce NMs with the desired morphological and surface properties [5]. Plant extracts have a number of phytochemicals which might provide functional groups to prepare NMs, acting as reducing and stabilizing agents [7]. Apart from these, phytochemicals also have other positive impacts on NMs such as low particle size, high surface area, and low toxicity of particles. So far, many NMs have been prepared via a green method (either using plant extract otherwise) and applied to wastewater treatment [8,9].
At present, the use of metal tungstate (MWO4) in wastewater treatment is considered very useful. Several types of MWO4, such as M = Co [10], Cd [8], Zn [11], and Cu [12], have been shown to act as photocatalysts, with CdWO4 being predominant [8]. Virgin CdWO4 photocatalyst has been used for the degradation of dyes such as CR and methyl orange [13].
In some studies, virgin CdWO4 has also been used as an adsorbent [8]; however, further study has hardly been reported. Cd is a very toxic element; however, in the bound state with another MO, its toxicity may reduce (e.g., zinc oxide coupled CdWO4) [14]. Hence, to make further advance and efficient virgin CdWO4, CdWO4 is mixed with several other metals [15], metal sulfides (MS) [16], and MO [14], of which the zinc oxide coupled CdWO4 is the only one which showed adsorption application [14]. This material was prepared with a green method using plant extract. The couplings of MS and MO with CdWO4 have shown advantageous properties (such as nominal cost and ease of production, environmentally benign, high surface properties, and narrow band gap) over other NMs and virgin CdWO4 [14,15,16,17]. All these materials prominently displayed photocatalytic properties and showed better ability than virgin. However, few reports are available on adsorption application (except for virgin CdWO4 and ZnO coupled CdWO4) [8,14]. As per results of previous research, this study is conducted to report on the synthesis of copper and zinc binary oxide coupled cadmium tungstate for adsorption application.
In a previous study, ZnO was coupled with CdWO4 through a bioprecipitation method using plant extract, and utilized for the adsorptive removal of CR dye from aqueous solution [14]. ZnO coupled CdWO4 possessed functional groups on its surface, very efficient for CR removal, and could reduce approximately 99% of dye concentration in 20 mg/L CR solution using 2.0 g/L amount of ZnO coupled CdWO4. The partition coefficient and adsorption capacity were reported as 21.4 mg g−1 μM−1 and 5 mg g−1, respectively (at an initial dye concentration of 10 mg/L), which suggested the high efficiency of ZnO coupled CdWO4 for CR removal.
In the present work, the coupling of CuO to the ZnO coupled CdWO4 and its effect on the adsorption performance of ZnO coupled CdWO4 (for CR dye) has been reported. With this aim, the green synthesis of Cu-Zn binary oxide coupled CdWO4 using aqueous extract of Brassica Rapa leaves is reported. Brassica Rapa leaves contain abundant phytochemicals, which have proved to be a great functionalizing agent [17].
Therefore, the aim of the present study can be classified into the following parts: (a) to synthesize the Cu-Zn binary oxide coupled CdWO4 composite, (b) to characterize prepared composite, (c) to investigate the effect of adsorbent dose, contact time, solution pH and temperature for adsorption of CR dye from lab prepared aqueous solution, (d) to investigate the initial concentration of CR on adsorption performance of composite, (e) to study the isotherms and thermodynamics in order to identify the adsorption mechanism, (f) to study the kinetics and rate determining step of adsorption, and (g) to analyze the true adsorption performance by partition coefficient. In a previous study, a photocatalytic application of copper oxide and zinc oxide coupled cadmium tungstate was reported for Congo red dye degradation [17]. This is the first reported work in which Cu-Zn binary oxide coupled CdWO4 has been investigated for CR dye removal through adsorption.

2. Experimental

2.1. Materials and Methods

2.1.1. Materials

For the preparation of composite materials, the following salts, copper acetate monohydrate (Cu(CO2CH3)2.2H2O; purity = 99.0%), cadmium iodide (CdI2; purity = 99.0%), sodium tungstate dihydrate (Na2WO4.2H2O; purity = 98.0%), and anhydrous zinc acetate (Zn(CH3CO2)2(H2O)2; purity = 99.9%) were purchased from Merck, India. To maintain the pH of reactions, acidic and basic solutions were used. To prepare these solutions, hydrochloric acid (HCl purity = 95.0–99.0%) and sodium hydroxide (NaOH; purity = 99.0%) were procured from Sigma Aldrich, India. To perform the adsorption experiments, Congo red dye (C32H22N6Na2O6S2; purity ≥ 95.0%) was purchased from Sigma Aldrich, India. To prepare the plant extract, leaves of the Brassica Rapa plant were collected from the local garden, Jamia Nagar, New Delhi, India.

2.1.2. Methods

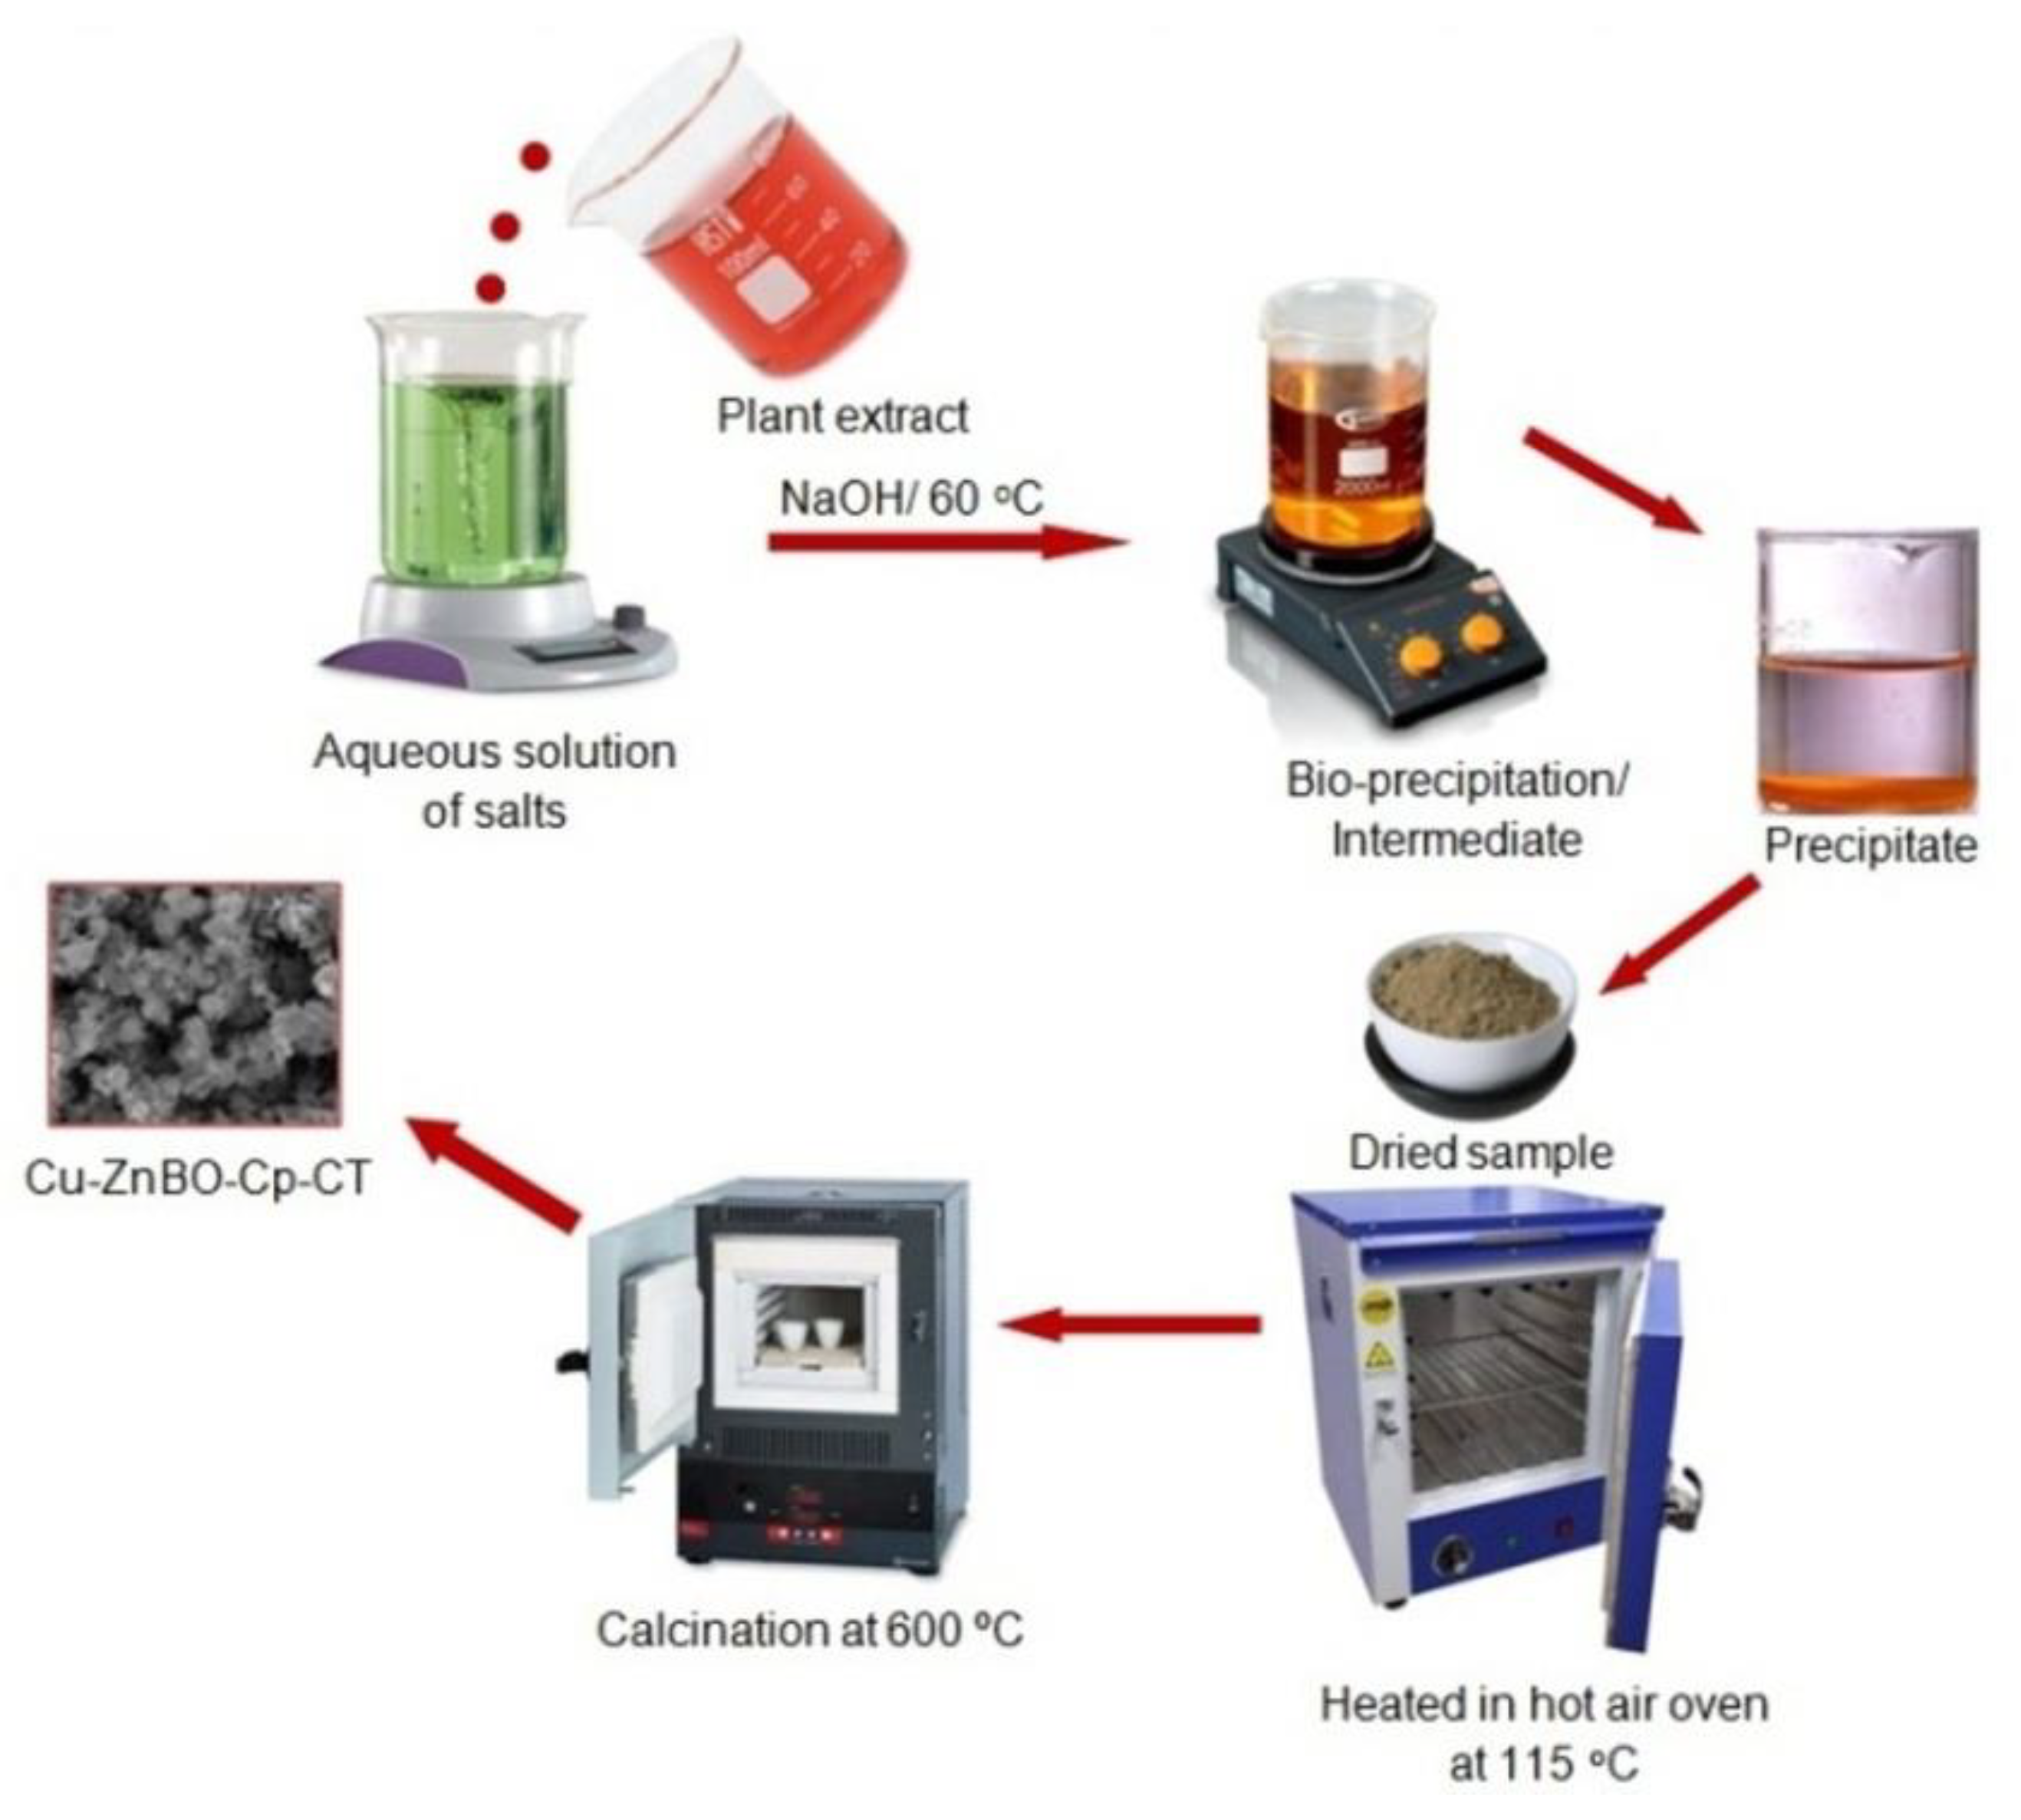
Green Synthesis of Adsorbent

For green synthesis, first the extract was prepared from fresh, washed, and dried leaves of Brassica Rapa plant. The dried leaves were converted into thick paste in a mixer grinder. Then, 10 g of fine paste was dissolved in 100 mL of distilled water followed by heating at 70 °C for 90 min on a magnetic stirrer at 600 rpm. Afterwards the prepared extract was filtered by Whatman@1 filter paper. The developed extract was cooled and stored at room temperature for further use.
As per our previous research [17], Cu-Zn binary oxide coupled CdWO4 nanocomposite was synthesized with slight modification in calcination temperature. Briefly, 100 mL of 0.4 mol L−1 Cu(CO2CH3)2.2H2O anhydrous aqueous solutions and 100 mL of 0.4 mol L−1 Zn(CH3CO2)2 (H2O)2 aqueous solutions were mixed, and then stirred at 60–70 °C at 850 rpm for 45 min on a magnetic stirrer. To this mixture, 100 mL of 0.1 mol L−1 Na2WO4·2H2O and 0.11 mol L−1 CdI2 aqueous solutions were added. Afterwards, the 100 mL of prepared extract was added to the above mixture and the pH of mixture was adjusted to the 10.0 by slowly adding 4M NaOH under continues stirring. The temperature of the mixture was then maintained at 60 °C for 60 min under continues stirring. Then the mixture was kept in the oven at 115 °C for 6 h. At this condition, the mixture was precipitated into a dark brown color. Obtained precipitate was then washed several times with distilled water (DW) and ethanol, and then dried in an oven at 60 °C for 24 h. The dried precipitate was further converted into fine powder by mortar and pestle and then kept in the muffle furnace at 600 °C for 6 h for the calcination. The calcined material was labeled as Cu-ZnBO-Cp-CT (copper-zinc binary oxide coupled cadmium tungstate) (Figure A1). Biogenic Cu-ZnBO-Cp-CT was used for the physicochemical characterization and its adsorption application.

Physicochemical Characterization of Prepared Composite

The calcined sample was characterized for its physiochemical properties. To investigate the functional properties of the prepared material, Fourier-transform infrared spectroscopy (FT-IR) analysis was carried out. FT-IR spectrum was recorded on a Perkin Elmer FT-IR spectrometer, MA, USA in a range from 4000 cm−1 to 400 cm−1. For analysis of crystal structure and phase of the prepared material, its X-Ray diffraction (XRD) pattern was studied. The XRD analysis was carried out by using a Philips PW-3710 X-ray diffractometer, Amsterdam, The Netherlands (using Cu-filter (λ = 0.154 nm), operating at 40 kV generator voltage and 30 mA current, and a proportional counter detector). The morphology of the prepared material was investigated by scanning electronic microscope (FESEM JSM-6510, Joel, Japan) equipped with Energy-dispersive X-ray (EDAX) spectrometer (Bruker 127 eV) and tunneling electron microscope (FEI Tecnai TF 20, Hillsboro, OR, USA). To investigate the adsorption performance of the prepared material, absorbance data were recorded on a Lambda 950 Perkin Elmer UV/Vis-NIR spectrophotometer, USA.

Preparation of CR Stock Solutions and Colorimetric Analysis

A stock solution of CR dye at 1000 ppm (parts per million) was prepared by dissolving 1.0 g of CR dye in 1000 mL of double-distilled (DD) water and further diluted by dilution law as per requirements. The calibration curve for the absorbance of the standard CR solutions was measured at concentrations in the range of 10.0–60.0 mg L−1, using a UV-Visible spectrophotometer at λmax value of 500 nm. These obtained data showed the high accuracy of the calibration curves based on the validity of the Beer-Lambert law. The initial concentration of dye in the solution was measured using the calibration curve.

Adsorption Studies

The adsorption performance of Cu-ZnBO-Cp-CT for CR dye solution was evaluated in a batch manner in terms of removal efficiency (adsorption %), equilibrium adsorption capacity (Qe), and partition coefficient (PC).
The removal efficiency (%) of Cu-ZnBO-Cp-CT for CR dye was optimized at various amounts of nanocomposite (NC) in dye solution (1.0 to 3.5 g L−1), dye solution concentrations (10 to 60 mg L−1), pHs (2 to 12), agitation time (15 to 180 min), and solution temperature (30 to 50 °C) in the OVAT (one variable change at a time) manner.
All these experiments were performed in triplicate and the mean values of Ce (final concentrations of CR in the solution after experiment) were used in Equations (1) and (2) to measure the removal efficiency (%) and equilibrium adsorption capacity (Qe) [8]. The final concentrations of CR in the solutions (Ce) were measured spectrophotometrically using a UV-Visible spectrophotometer at λmax value of 500 nm.
Removal   efficiency   ( % ) = ( ( C o C e ) / C o ) 100
Uptake   capacity   ( Q e ) = ( C o C e ) V / m
Here, Co and Ce are initial (calculated from calibration curve) and final concentrations of CR, Qe is the amount of CR adsorbed onto the unit mass of Cu-ZnBO-Cp-CT at equilibrium, m is the mass of Cu-ZnBO-Cp-CT and V is the volume of CR solution.
To show the uncertainty in reported measurements, error bars on each graph were applied.
Obtained adsorption equilibrium data were further investigated for thermodynamics, isotherms, and kinetics to describe the mechanism involved in the CR adsorption onto the Cu-ZnBO-Cp-CT. The details of the formulation are given below in the respective sections.

3. Results and Discussions

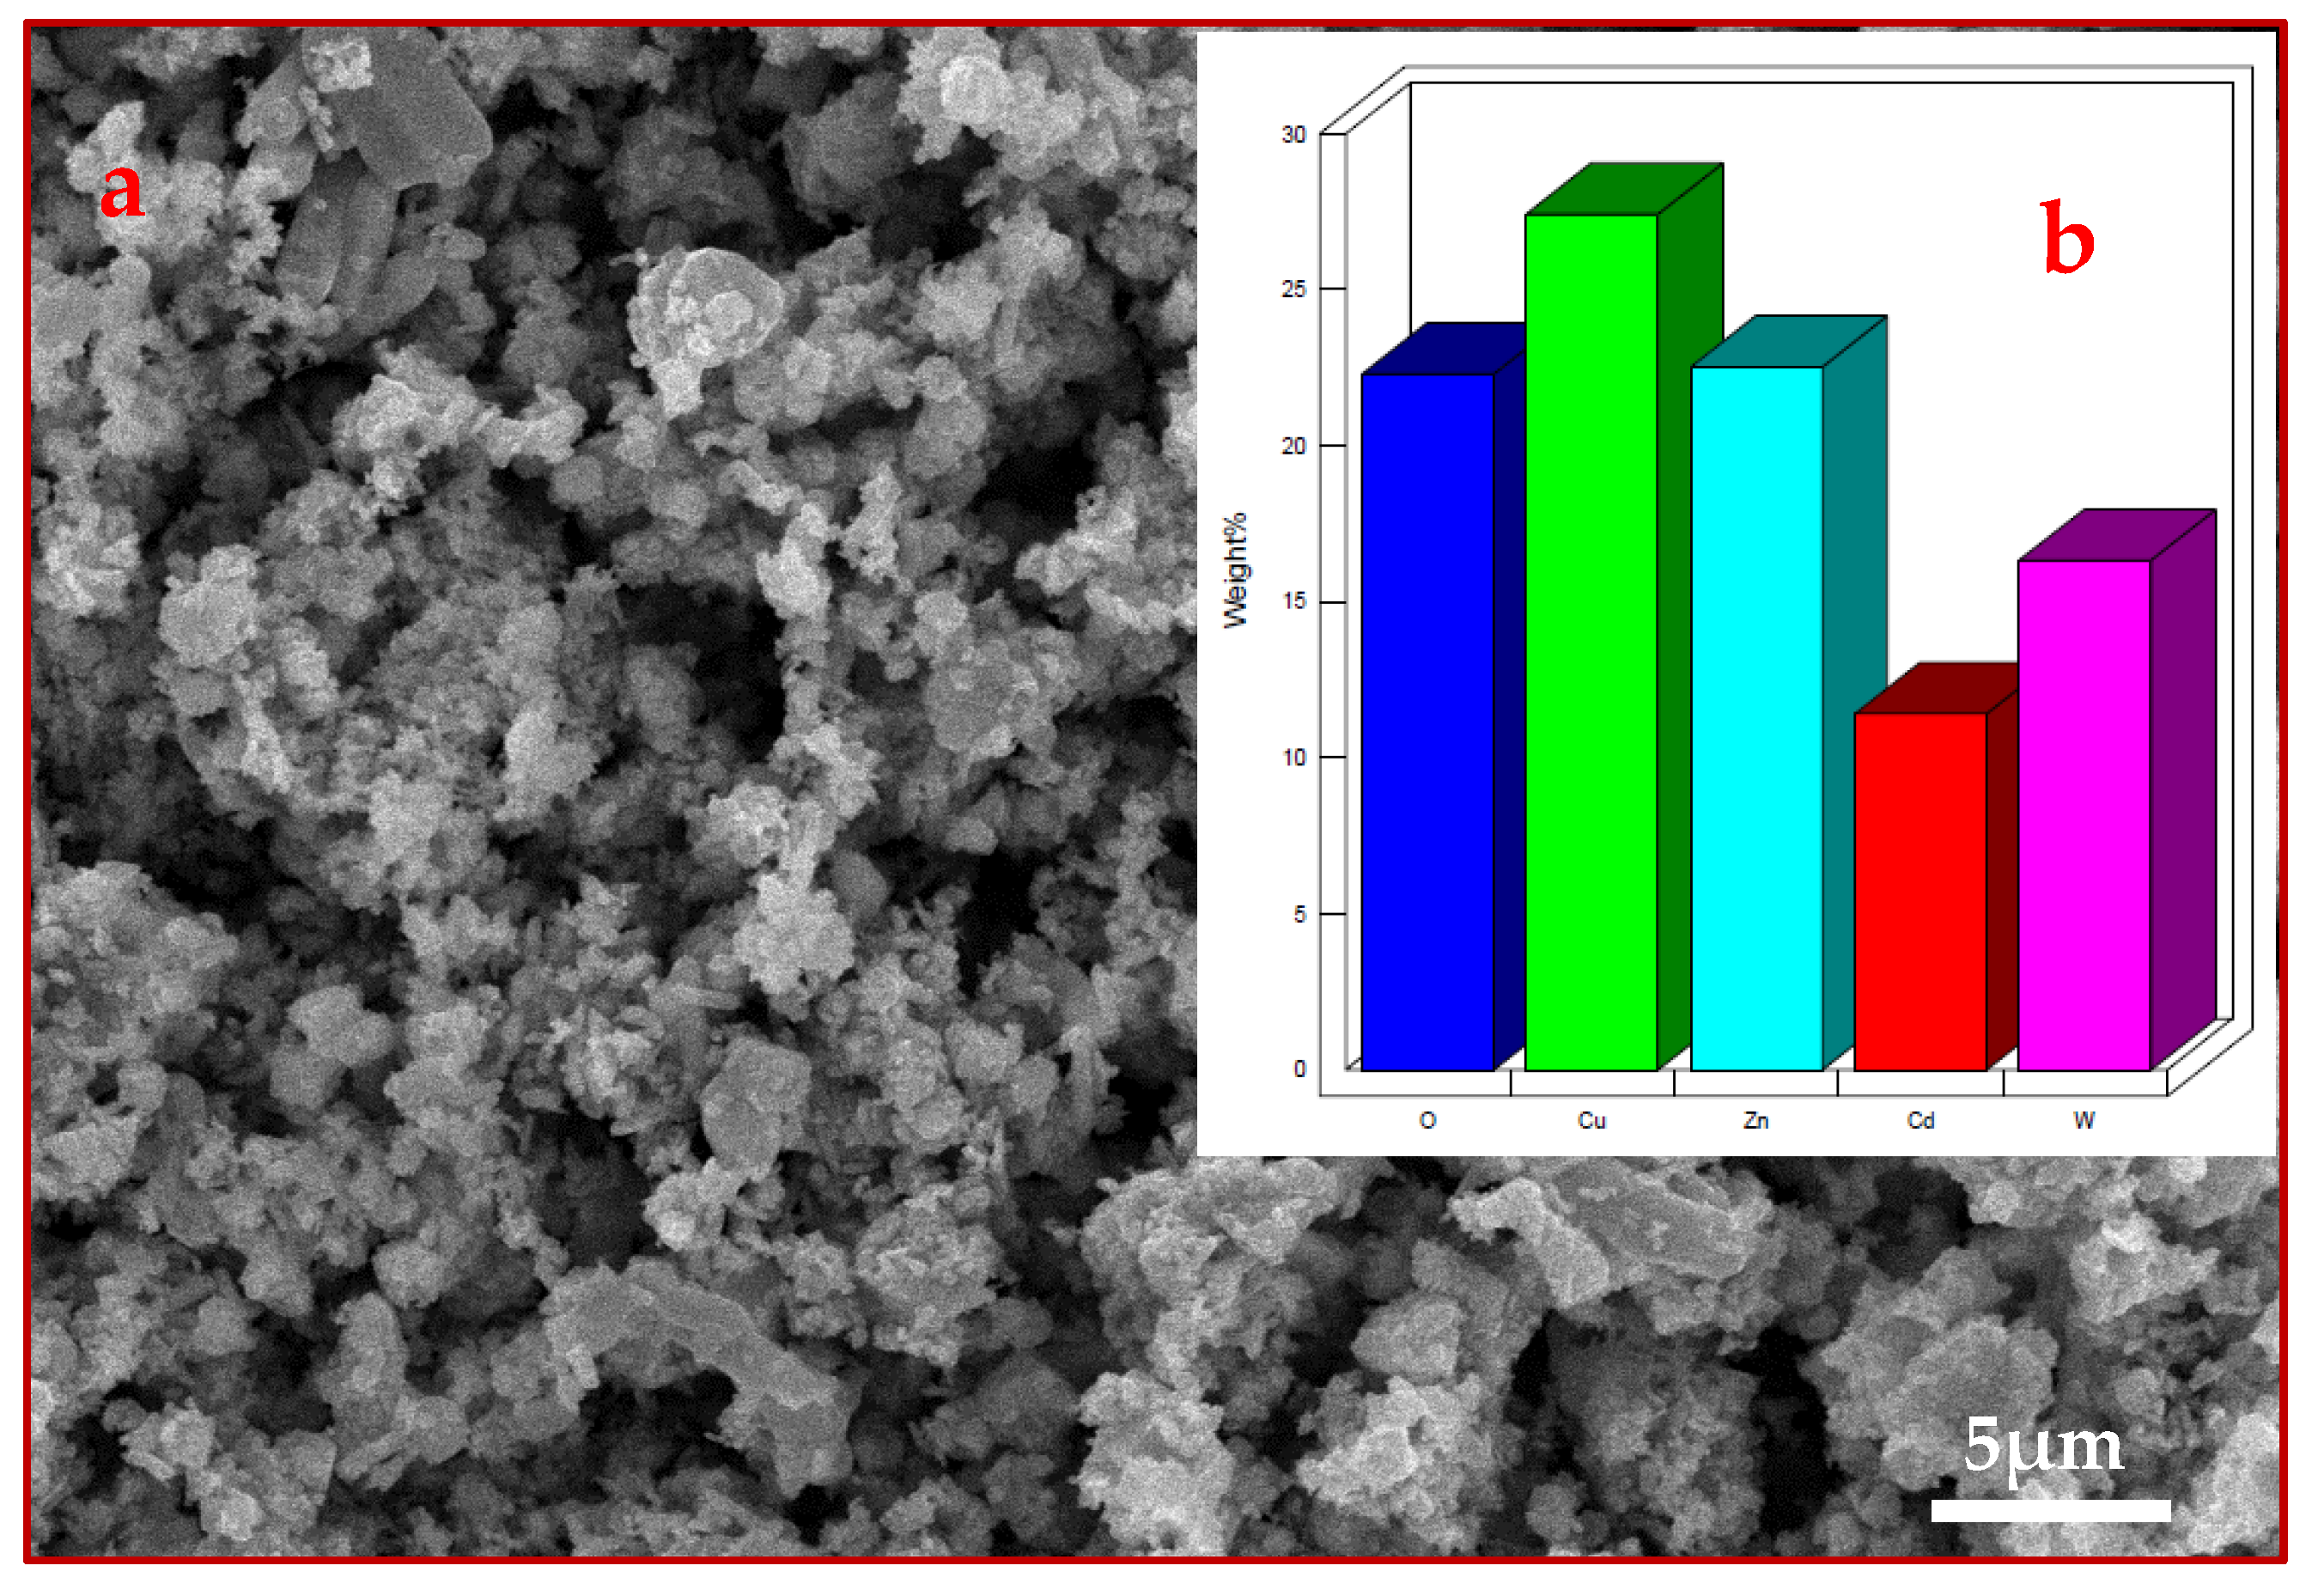
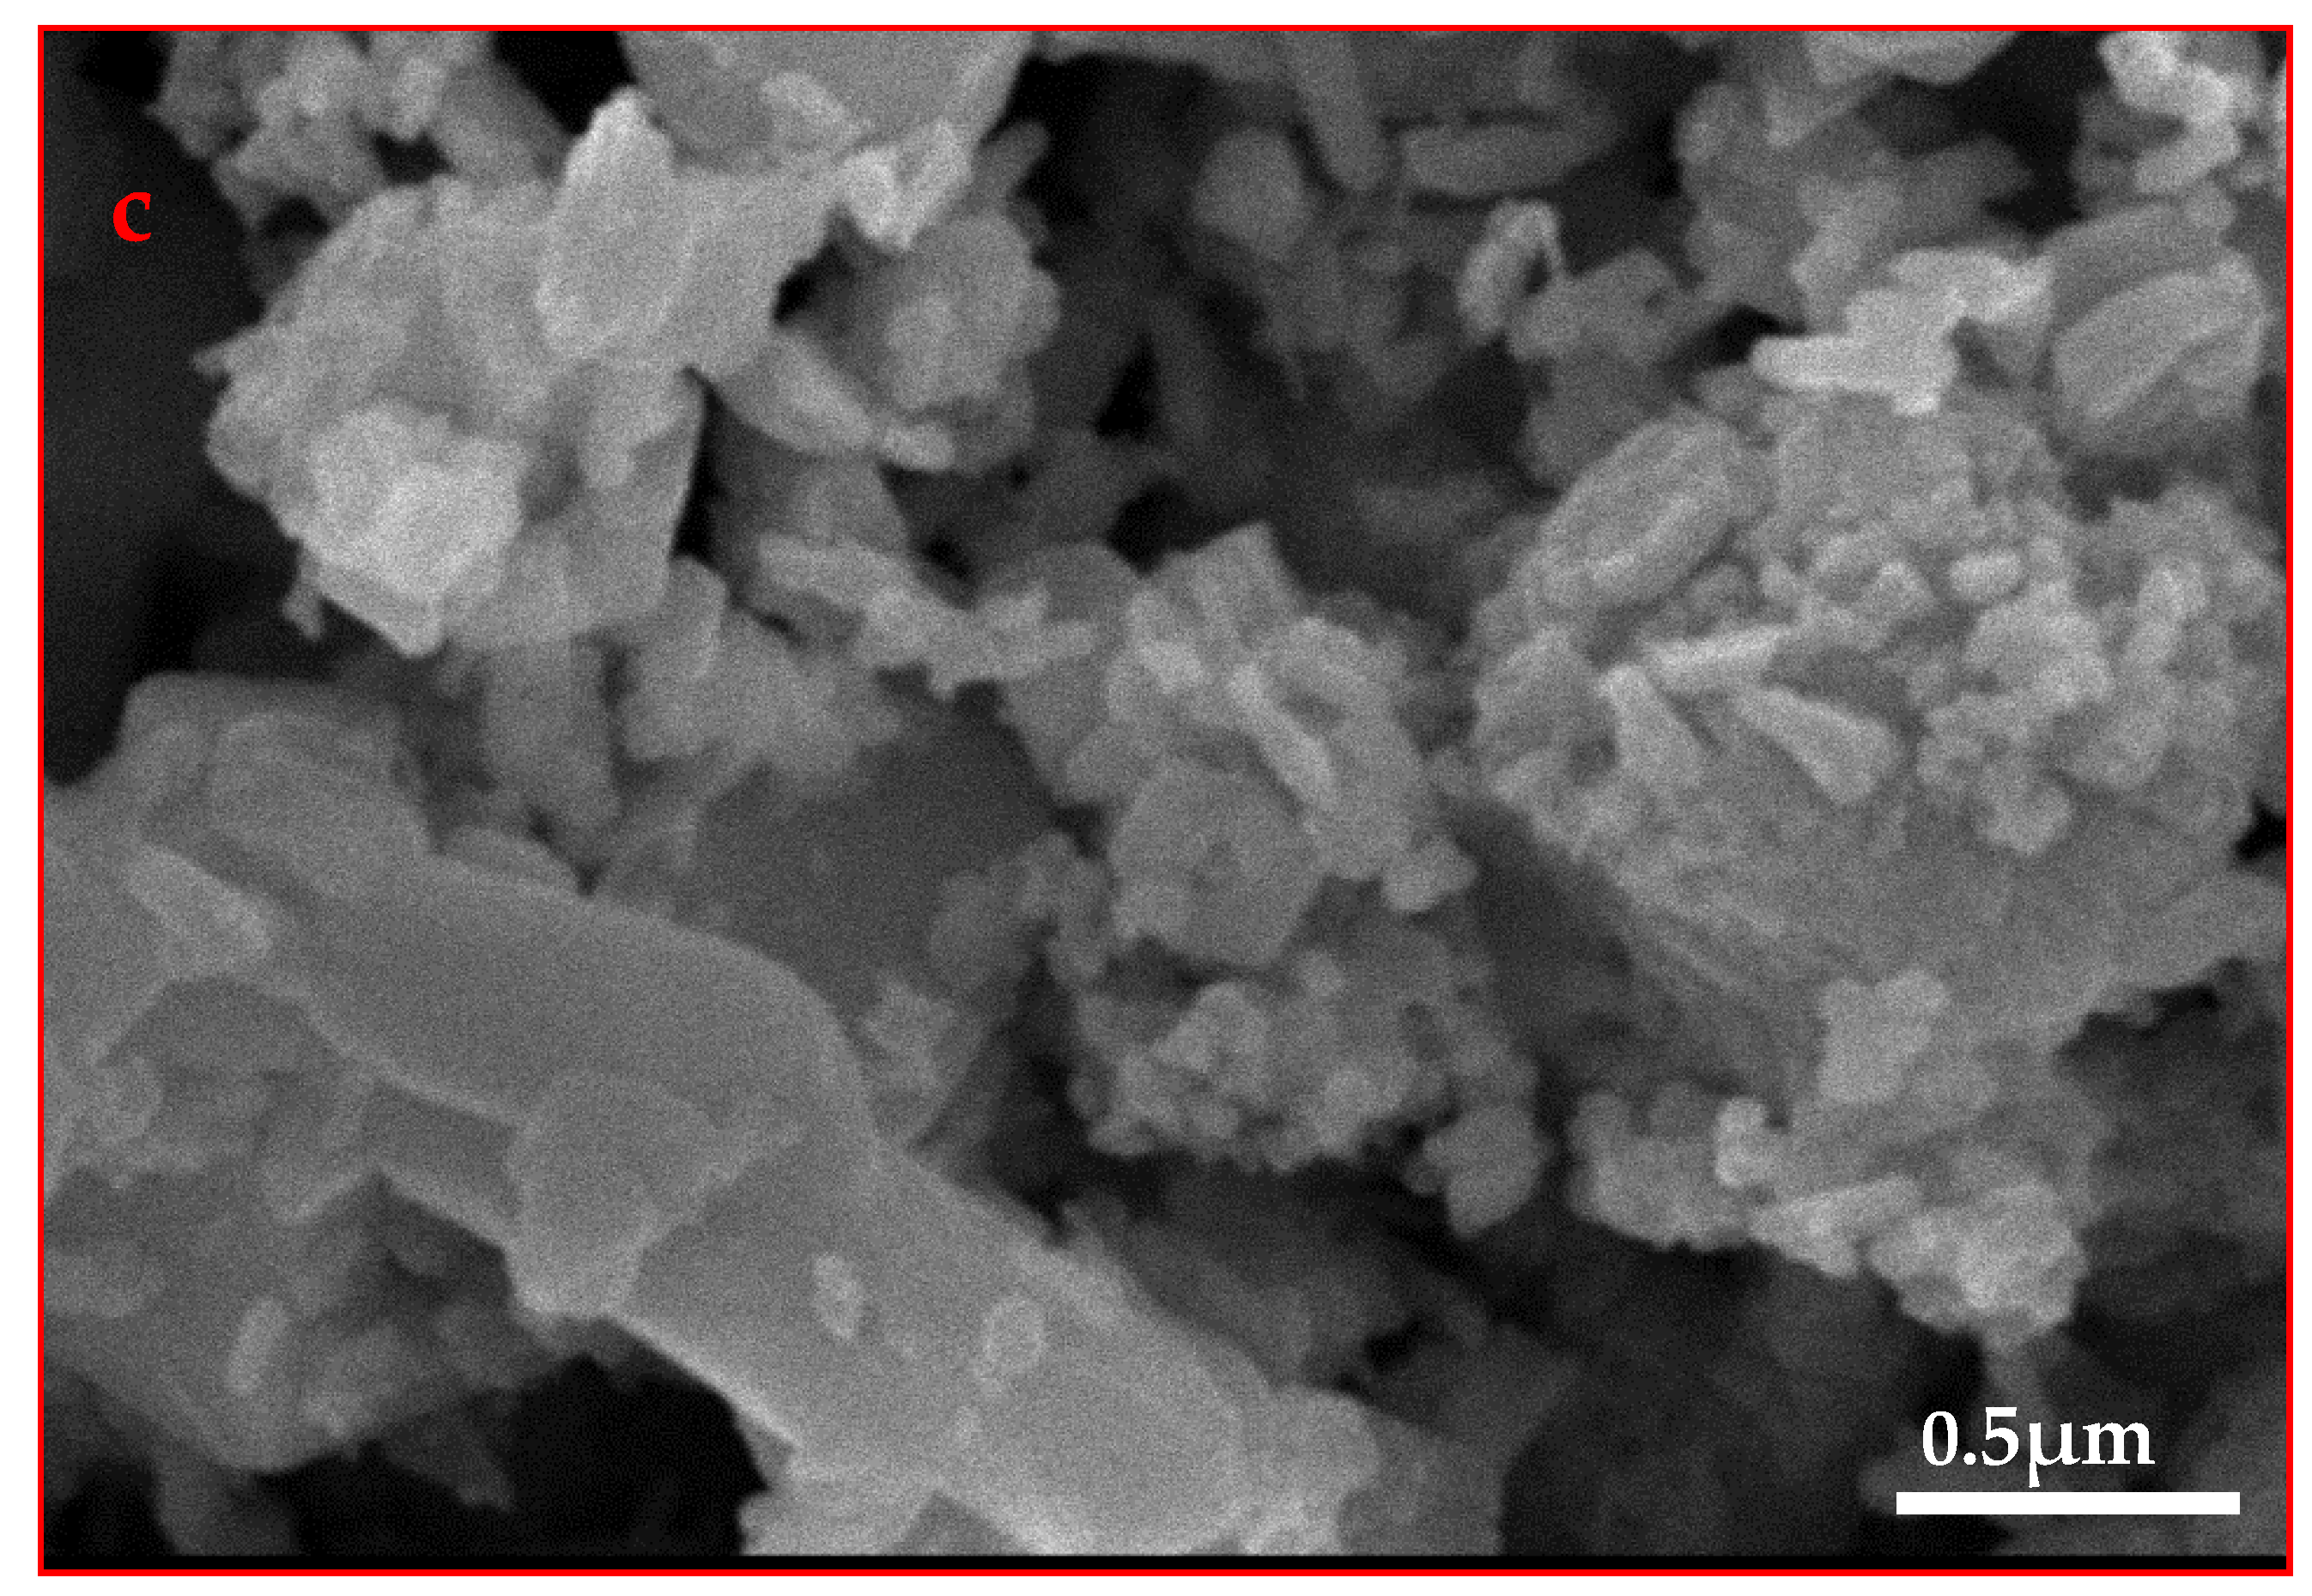
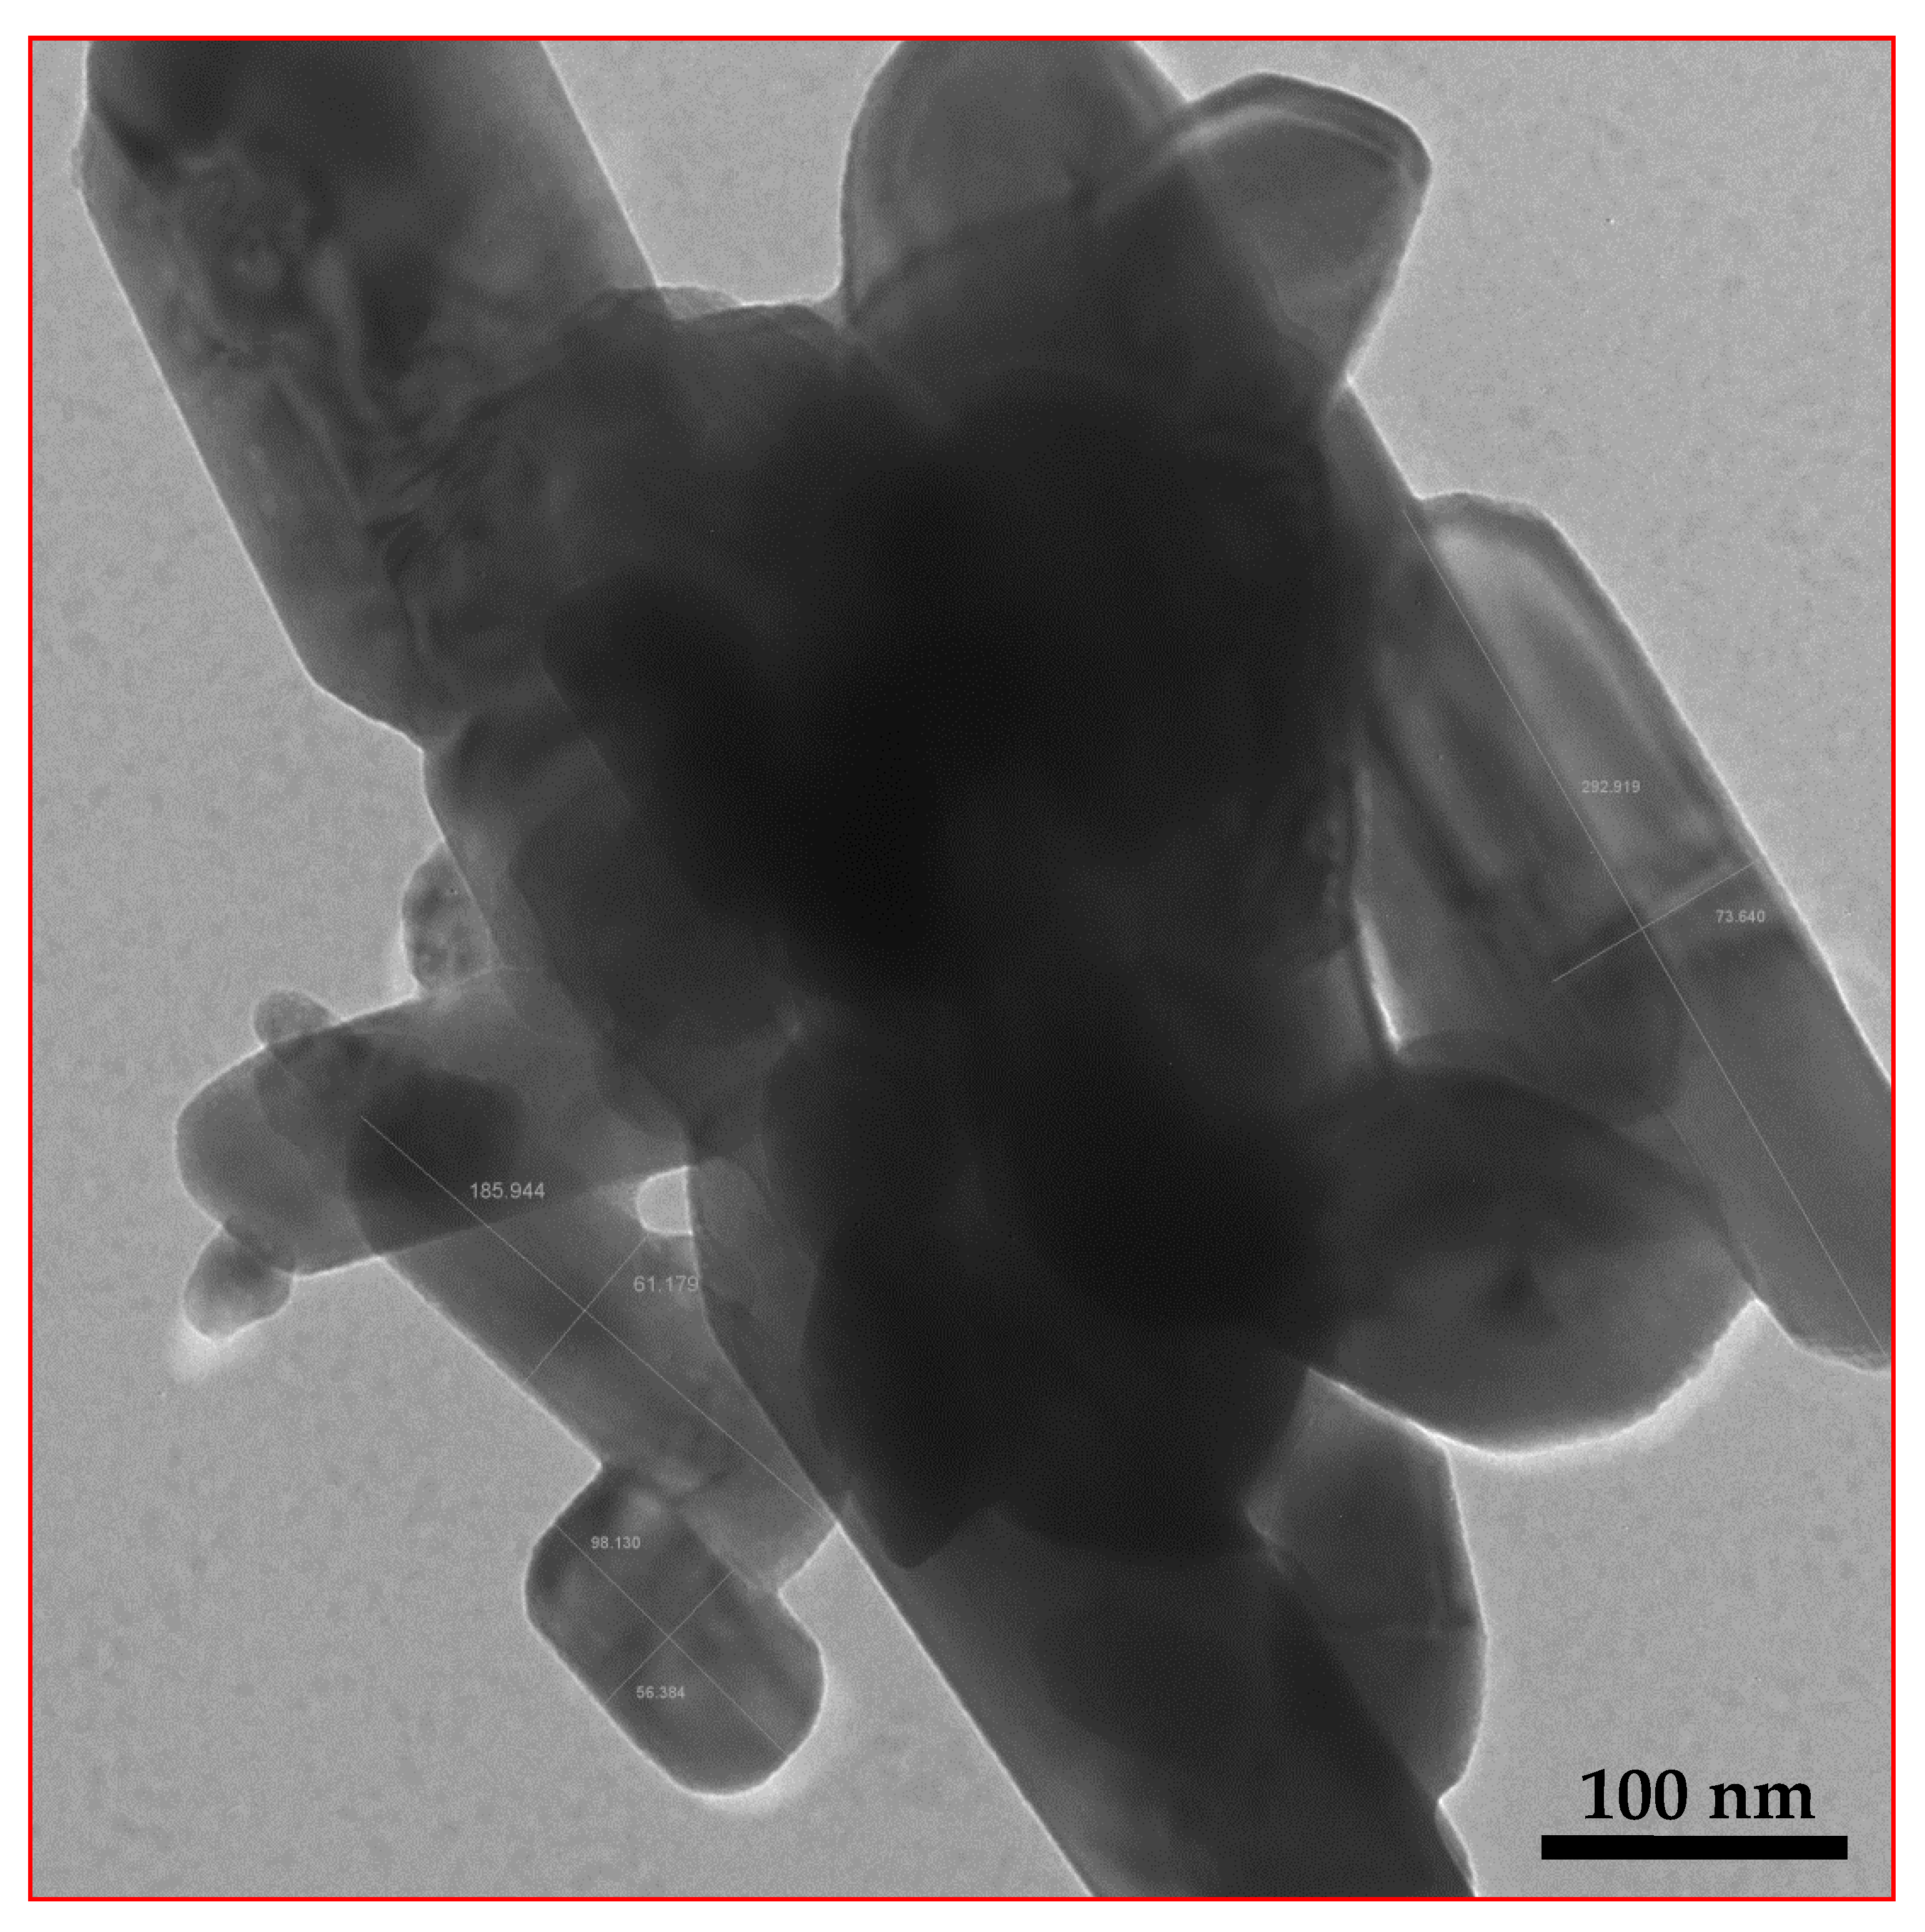
3.1. Characterization

Cu-ZnBO-Cp-CT NC was prepared via a bio-precipitation method with leaf extract of Brassica Rapa as a capping and stabilizing agent to control the growth of nanoparticles (NPs). This is an economical and non-toxic approach to produce lower size NPs. The prepared sample was characterized as follows.
The XRD pattern of the prepared sample was studied for crystal structure and phase of Cu-ZnBO-Cp-CT (Figure S1). By using the Match program [18], the crystal phases, structure, and cell dimensions of the prepared sample were defined. The data obtained from the Match program and their interpretations are listed in Table 1. A similar result was reported for our previous study [17]. This data analysis and interpretation suggest the presence of CuO, ZnO, and CdWO4 crystal system in the prepared sample. The average size of the CuO, ZnO, and CdWO4 crystal systems in Cu-ZnBO-Cp-CT was approximately 57.74, 46.94, and 40.83 nm using the Debye–Scherer equation (Equation (S1), ESI) at the highest sharp peak for each phase (2θ = 27.5 (°) for CuO, 36.1 (°) for ZnO, and 28.9 (°) for CdWO4), respectively. Compared to the previous study [17], average crystallite size is found to be increased in this study. The main reason for the increased size is the increased calcination temperature.
The FT-IR spectra of the prepared Cu-ZnBO-Cp-CT (Figure 1) showed various absorption bands ranging from 3500 cm−1 to 400 cm−1. The descriptions of all the assigned peaks are given in Table 2. The bands from 3400 to 1400 cm−1 were assigned for functional groups on the adsorbent surface as well as for absorbed water [19]. The use of plant extract during preparation accounted for the functional groups attached to the surface of NPs. The peaks, related to the absorbed water on the adsorbent surface, might be due to the sampling of NPs with KBr before recording the spectra [19]. The vibrational bands in the range 1000–450 cm−1 were assigned for the M-O bonds (ZnO, CuO, W-O, Cd-O, and Cd-O-W) of NPs. These bands suggest the preparation and functionalization of Cu-ZnBO-Cp-CT NPs by phytochemicals groups of the plant extract. The disappearances of several IR absorption peaks in this study can also be seen in the FTIR spectrum in compare to previous study [17]. These disappearances of several essential peaks might be due to the thermal treatment (calcination at 600 °C). The FT-IR spectrum of Cu-ZnBO-Cp-CT agrees well with the FT-IR spectrum of ZnO coupled CdWO4 [14]. An additional peak of Cu-O (at 596 cm−1) can be observed in the Cu-ZnBO-Cp-CT FTIR spectrum.
Table 1. XRD analysis of Cu-ZnBO-Cp-CT.
OrderCrystalCrystal SystemSymmetryCell DimensionsSpace GroupComposition (%)Characteristic Peaks and Corresponding Planes
a (Å)b (Å)c (Å)β (°) 2 Thetha (°)Planes
1.CuO
(Entry No. 96-901-5925) [20]
TenoriteMonoclinic4.68323.42885.129799.309-25.527.5
32.5
32.9
35.3
38.7
48.8
51.8
56.4
61.6
66.1
66.5
68.1
(002)
(110)
(−110, 110)
(−111)
(−200, 200)
(−202)
(112)
(021)
(−113)
(−311)
(−310, 310)
(220, −220)
2.CdWO4
(Entry No. 96-100-1752) [21]
WolframiteMonoclinic5.20895.85965.071591.519-43.116.7
23.2
28.9
29.5
30.6
35.5
38.8
47.6
50.5
56.9
59.9
(010)
(110)
(−111)
(111)
(020)
(002)
(012)
(022)
(221)
(013)
(032)
3.ZnO
(Entry No. 96-900-4179) [22]
ZinciteHexagonal3.2494-5.2038-P 63 m c31.531.8
34.5
36.4
47.4
56.7
63.0
66.5
68.9
(100)
(002)
(101)
(102)
(110)
(103)
(200)
(112)
The microscopic analysis of the prepared Cu-ZnBO-Cp-CT sample using scanning electron microscope, SEM and transmission electron microscope, TEM, gives the morphology and particle size of Cu-ZnBO-Cp-CT. The rough and porous surface can be seen in the SEM image (Figure 2a,c), along with the aggregate particles. The aggregations of particles to large particles are shown in the TEM image. The coalescence of smaller grain particles through grain boundary diffusion at high calcination temperature gives larger sized particles. These large particles were mostly rod-shaped with diameters in the range of 50–80 nm and lengths up to 90–300 nm (Figure 3). The EDAX instrumentation gives the elemental analysis of the Cu-ZnBO-Cp-CT sample (Figure 2b). This analysis showed the high purity of crystal, with the elemental composition as given in Table S1. These results were showed well agreement to our previous study [17].

3.2. Adsorption Studies

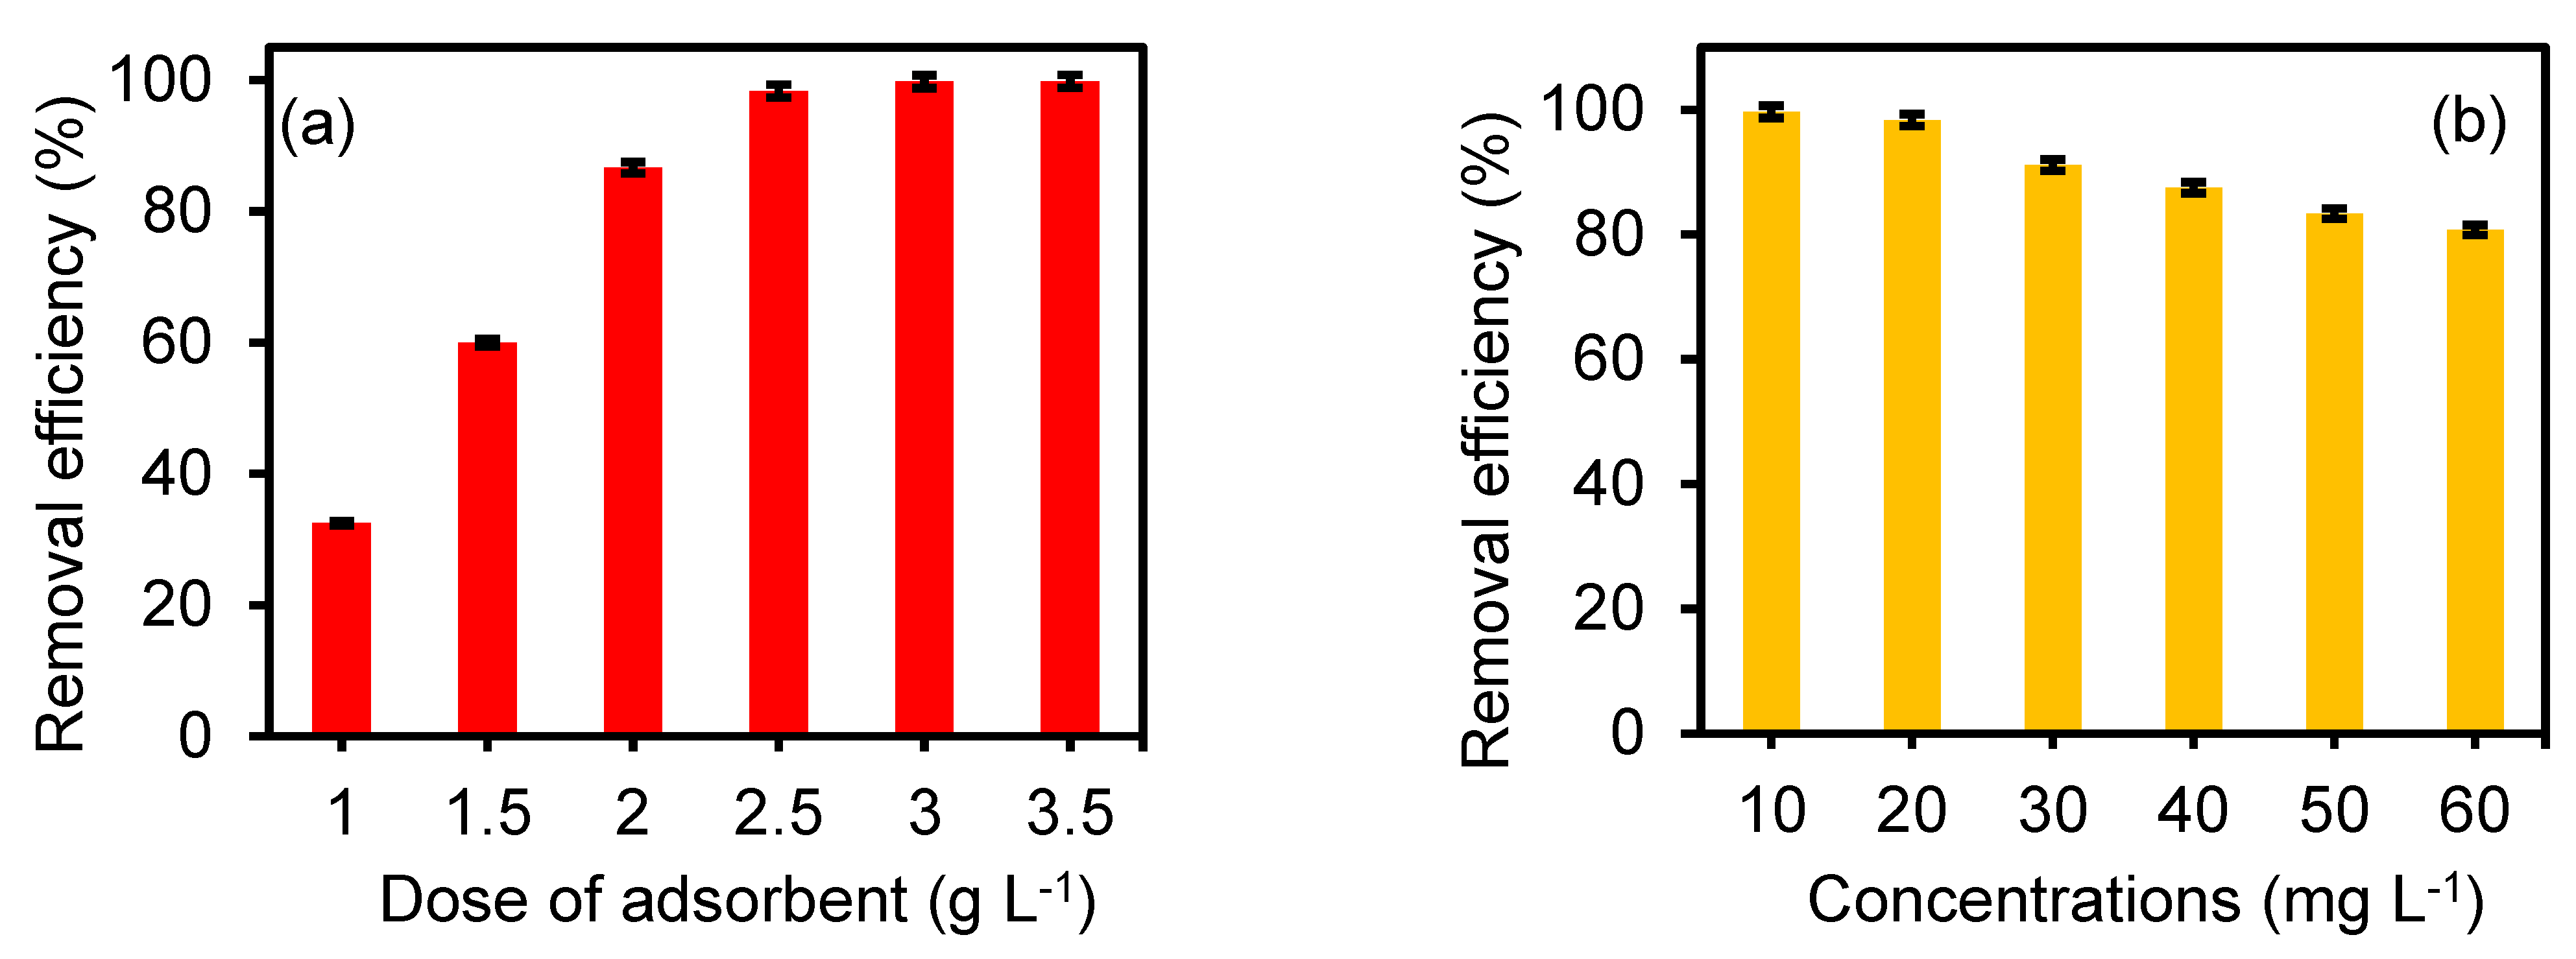
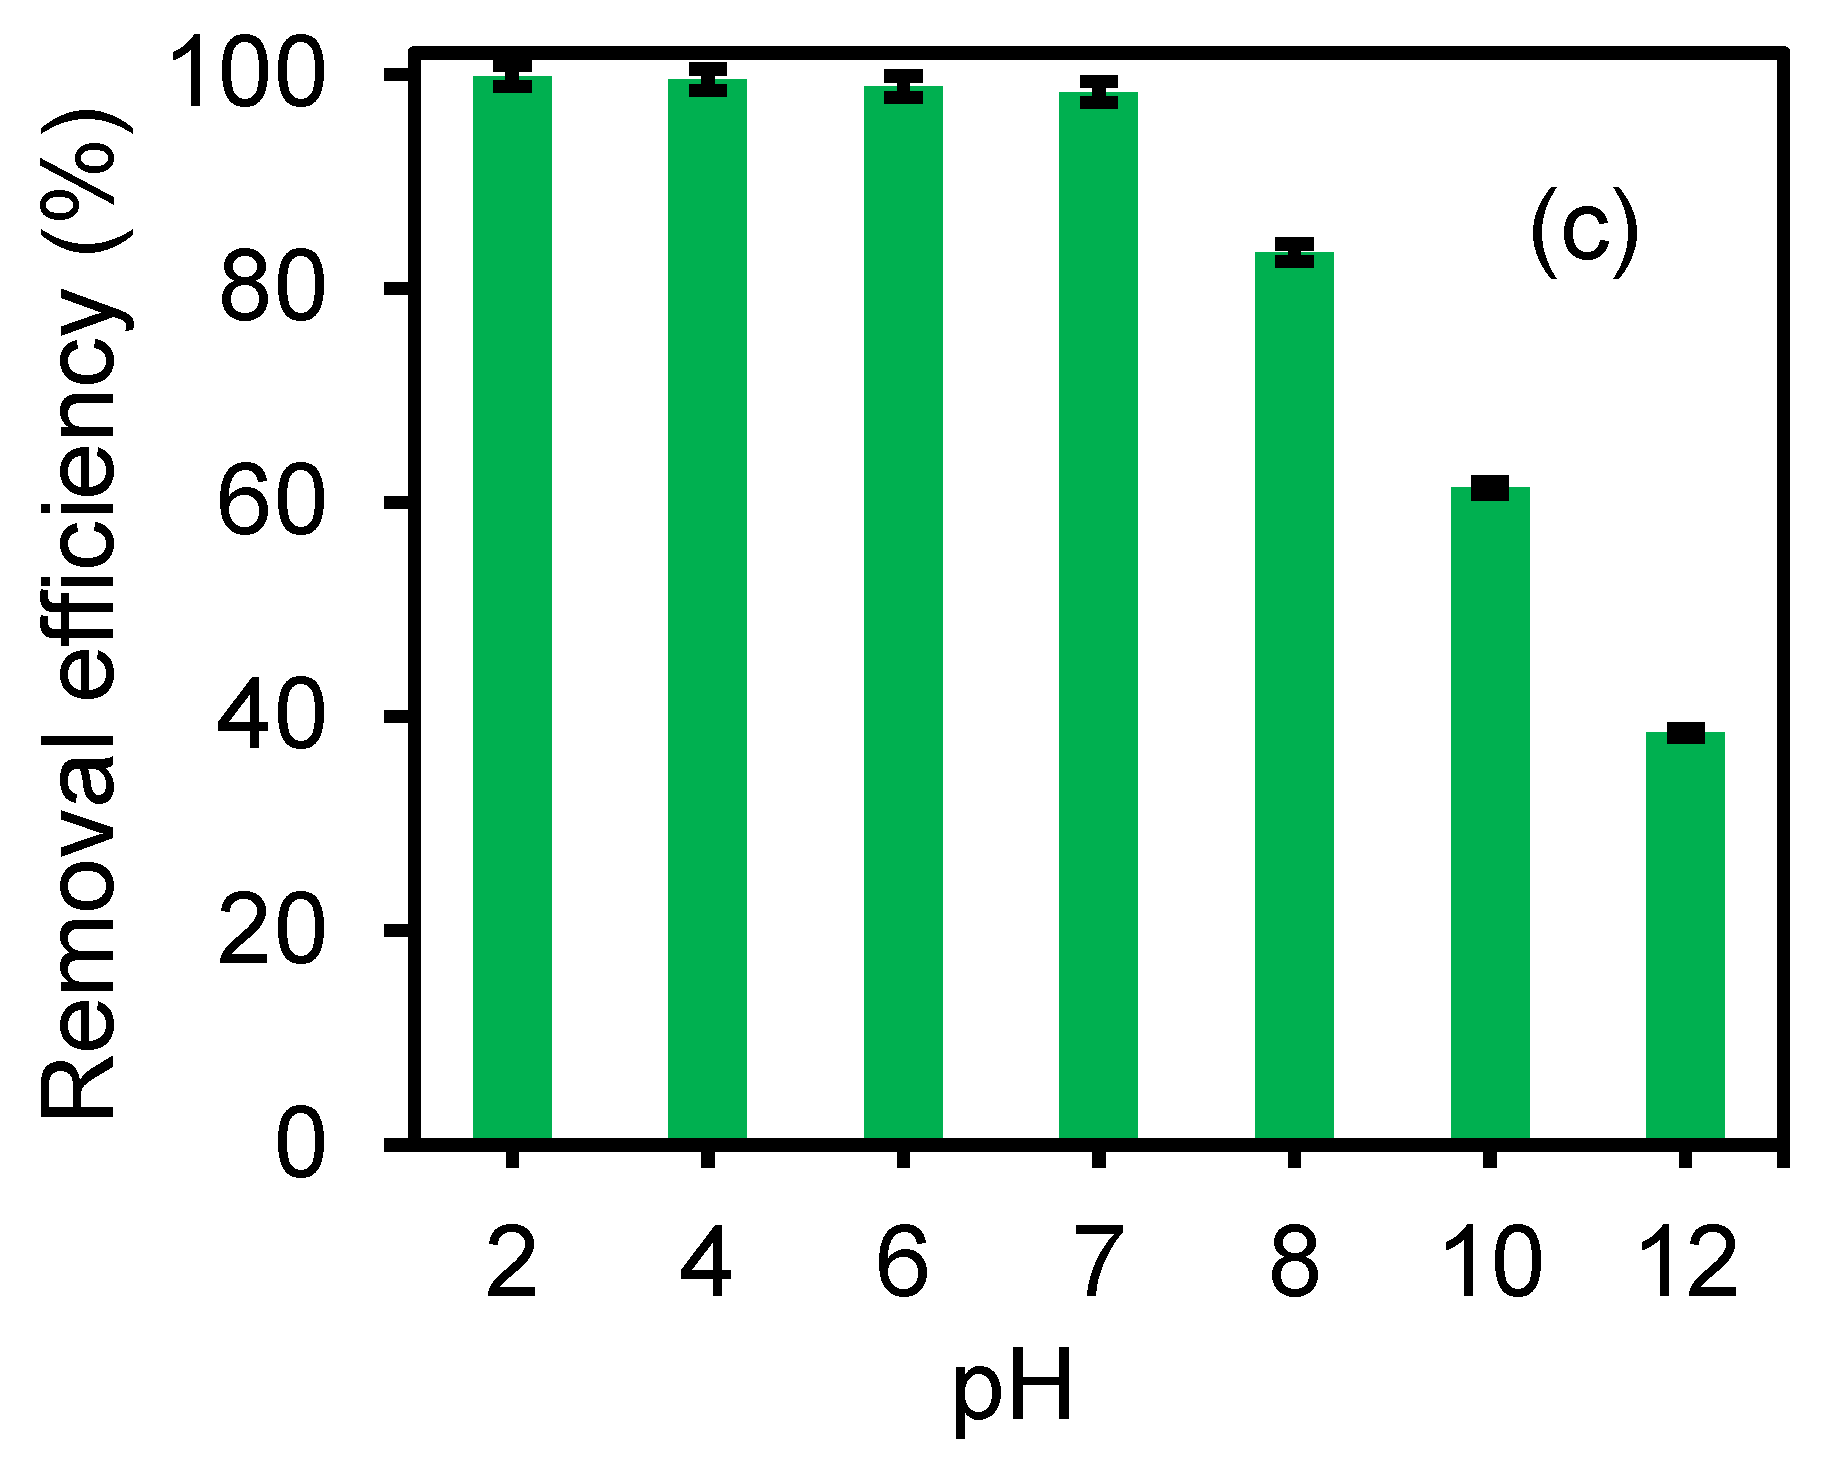
3.2.1. Optimization of CR Adsorption Capacity of Cu-ZnBO-Cp-CT under Various Parameters

By performing the batch mode experiment, an optimized adsorbent dose has been evaluated. Different dosage amount has been taken in the range from 1.0–3.5 g L−1 (Figure 4a) to investigate the dose amount in the removal efficiency of the prepared adsorbent for CR. Six Erlenmeyer flasks containing 10 mL of CR (20 mg L−1) dye solution with different adsorbent doses (1.0–3.5 g L−1) agitated at 150 rpm in an orbital mechanical shaker for 120 min at 30 °C. 2.5 g L−1 amount of Cu-ZnBO-Cp-CT could decolorize approximately 98.0% CR solution. Further addition of Cu-ZnBO-Cp-CT in CR solution did not show much increment in CR removal. The removal efficiency of Cu-ZnBO-Cp-CT was increased (from approximately 33.0 to 99.9%) with the increase in adsorbent amount (from 1.0 to 3.5 g L−1), respectively. This effect was accounted to the higher number of binding sites available on the Cu-ZnBO-Cp-CT surface at higher dosage.
The initial concentration of dye largely affects the removal efficiency of the tested adsorbent. For this study to optimize the concentration, CR dye solution with ranges of 10–60 mg L−1 were taken, with a fixed adsorbent dose, i.e., 2.5 g L−1 at 30 °C The removal efficiency was found to decrease with an increase in dye concentration (Figure 4b). This was approximately 99.60% for 10 mg L−1 solution which decreased to approximately, 88.72% at 60 mg L−1. The reason for this reduction at higher concentration could be that at the higher concentration the ratio of freely available sites on fixed adsorbent amount (2.5 g L−1), the less for mass transfer compared to a low concentration. Overall, 2.5 g L−1 amount of Cu-ZnBO-Cp-CT showed effective removal efficiency at both higher as well as lower concentrations. This result accounted for the large functional sites on the Cu-ZnBO-Cp-CT surface.
The pH of the solution largely affects the removal efficiency of the adsorbent. It helps in determining the ionization of oxygen containing bio-functional groups present on the adsorbent surface and the chemical specificity of the dye molecules [23]. In terms of pH, the performance of Cu-ZnBO-Cp-CT for CR adsorption was investigated by varying the pH (2–12) of the CR solution (Figure 4c). The adsorption of CR decreased from 99.83 to 38.50% with the change in pH from acidic to alkaline solution. The pH dependence of dye sorption can be better explained by knowing the pKa value of dye, the charge speciation (anionic or cationic) of dye in water, and the pHzpc of adsorbents.
For the present study, the pHzpc value for the Cu-ZnBO-Cp-CT was calculated to be 7.5, calculated similarly to that in the literature [24]. The method for obtaining the pHzpc of Cu-ZnBO-Cp-CT is discussed briefly in the supporting information. The adsorbent has different bio-functional groups on its surface that exhibit protonation or deprotonation phenomena at a certain pH and show different functional charges on the surface. Briefly, at pH < pHZPC, the surface of adsorbent is positively charged due to adsorption of excess H+ (protonation), and at pH > pHZPC the adsorbent surface is negatively charged due to desorption of H+ (deprotonation). The protonation of the adsorbent surface favors adsorption of anionic dyes, and vice versa for a deprotonated surface and cationic dyes.
It is well known that CR is an anionic dye having pKa value 4.0. Therefore, in acidic conditions, the CR molecules largely adsorb to the protonated surface, and as they increase the CR adsorption gradually decreases. This decrease was due to the repulsive forces enhancement between the CR molecules and Cu-ZnBO-Cp-CT surface with an increase in pH values. At the pH > pHZPC, the adsorbent surface become negative, and the OH concentration increases on the surface, thus the CR adsorption largely decreases. Therefore, at alkaline pH (8–12), the removal efficiency of Cu-ZnBO-Cp-CT for CR dye was observed to be very low. Some observed adsorption of CR onto the Cu-ZnBO-Cp-CT surface at pH (8–12) might be due to the non-electrostatic interaction (e.g., van der Waals interactions, hydrogen bonding, and complexation) between the CR and adsorbent. A non-electrostatic interaction is not affected by pH change. Similar findings were obtained for the adsorption of CR onto the gemini surfactant/graphene oxide composite surface reported by He et al. [25].

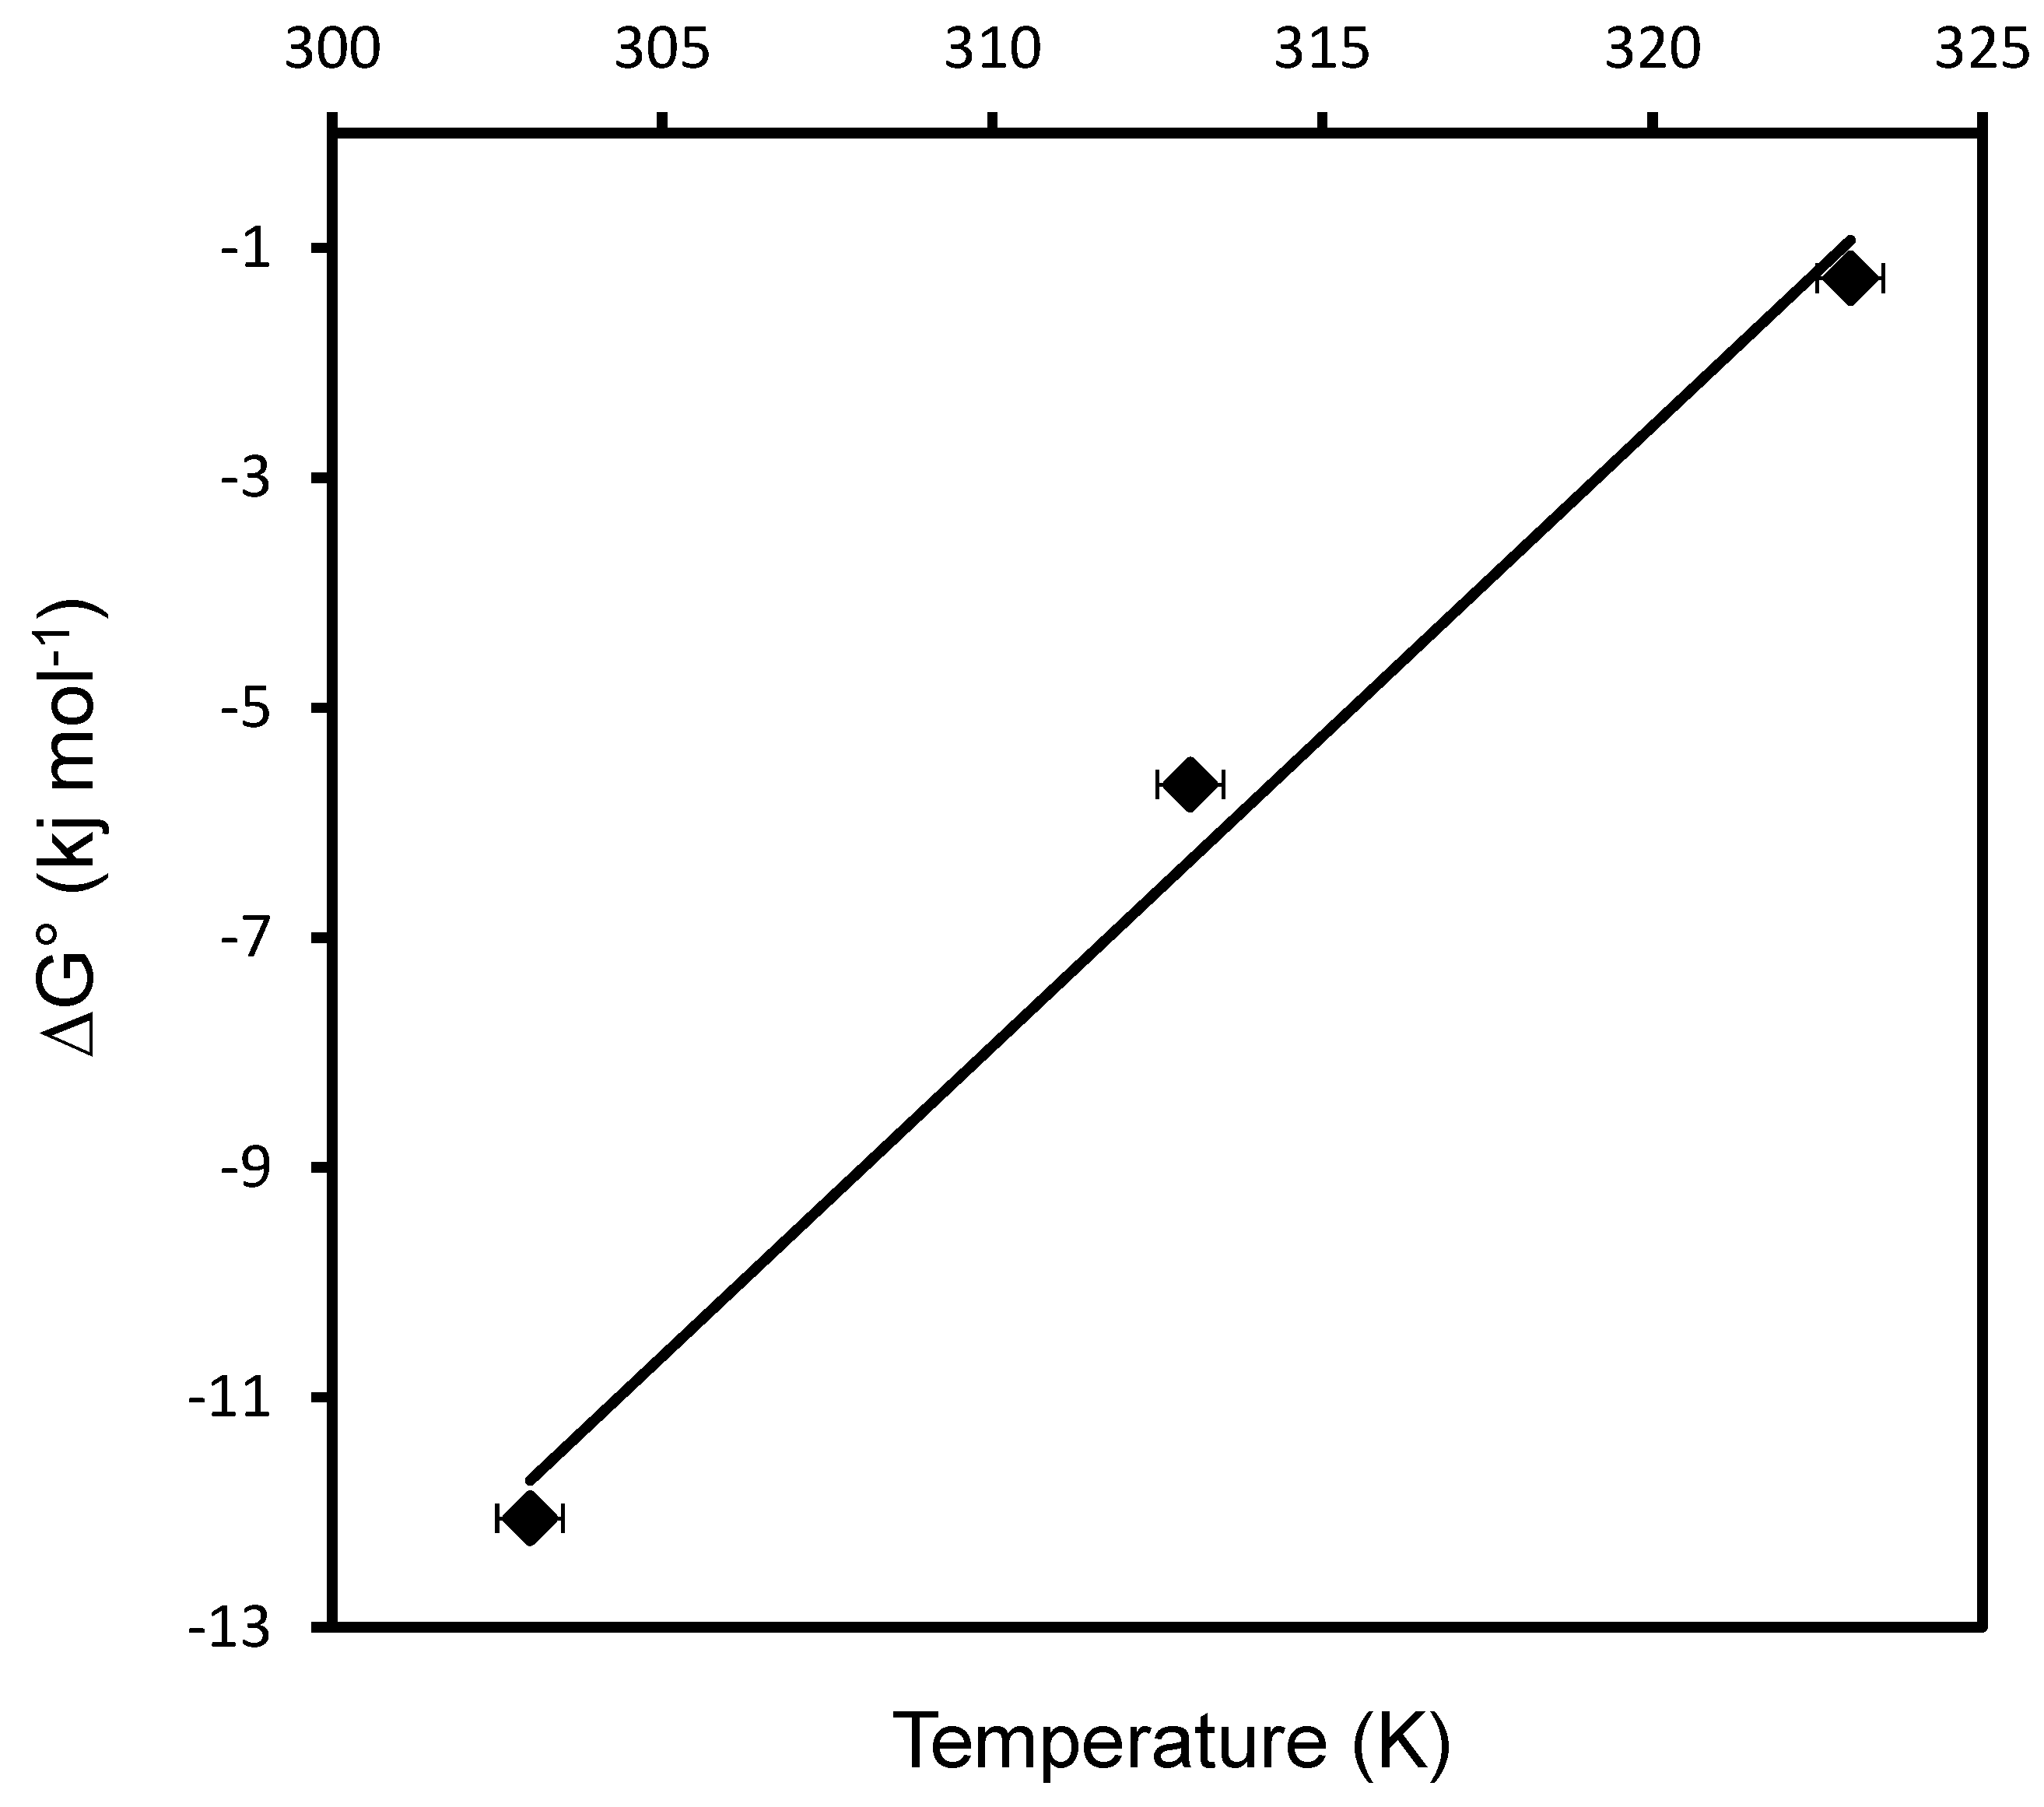
3.2.2. Thermodynamics of CR Adsorption onto the Cu-ZnBO-Cp-CT

The removal efficiency is also affected by temperature changes. For the present study, the removal efficiency gradually decreased with increased temperature (30–50 °C) for all the concentrations. This shows the exothermic nature of CR adsorption onto the Cu-ZnBO-Cp-CT surface. The decrease in the adsorption efficiency might be due to the weakening of the bond between the CR and functional groups of Cu-ZnBO-Cp-CT at higher temperatures. Thermodynamic parameters such as enthalpy, entropy, and Gibbs free energy were also evaluated to understand the mechanism involved in the CR adsorption onto the Cu-ZnBO-Cp-CT surface under the change in the reaction temperatures (30–50 °C).
The Gibbs free energy change (∆G) was calculated as Equation (3) [26]:
Δ G = R T ln   K c
where Kc (equilibrium constant) = Qe/Ce.
For this study, the calculated value of Δ was found to be negative in the range 0 to −20 (Table 3), indicating that adsorption is a thermodynamically favourable, feasible, spontaneous and physical process at all tested temperatures.
The enthalpy change (ΔH) and entropy change (ΔS) were calculated using the plot (Figure 5) obtained for the following Equation (4):
Δ G ° = Δ H ° T Δ S °
The obtained negative value of Δ (−175.2 kJ mol−1) indicates the exothermic nature of adsorption of CR on Cu-ZnBO-Cp-CT (Table 3). The negative value of Δ (−0.54 kJ mol−1K−1) suggests a decrease in randomness or degree of freedom. These results were verified by the literature [26].

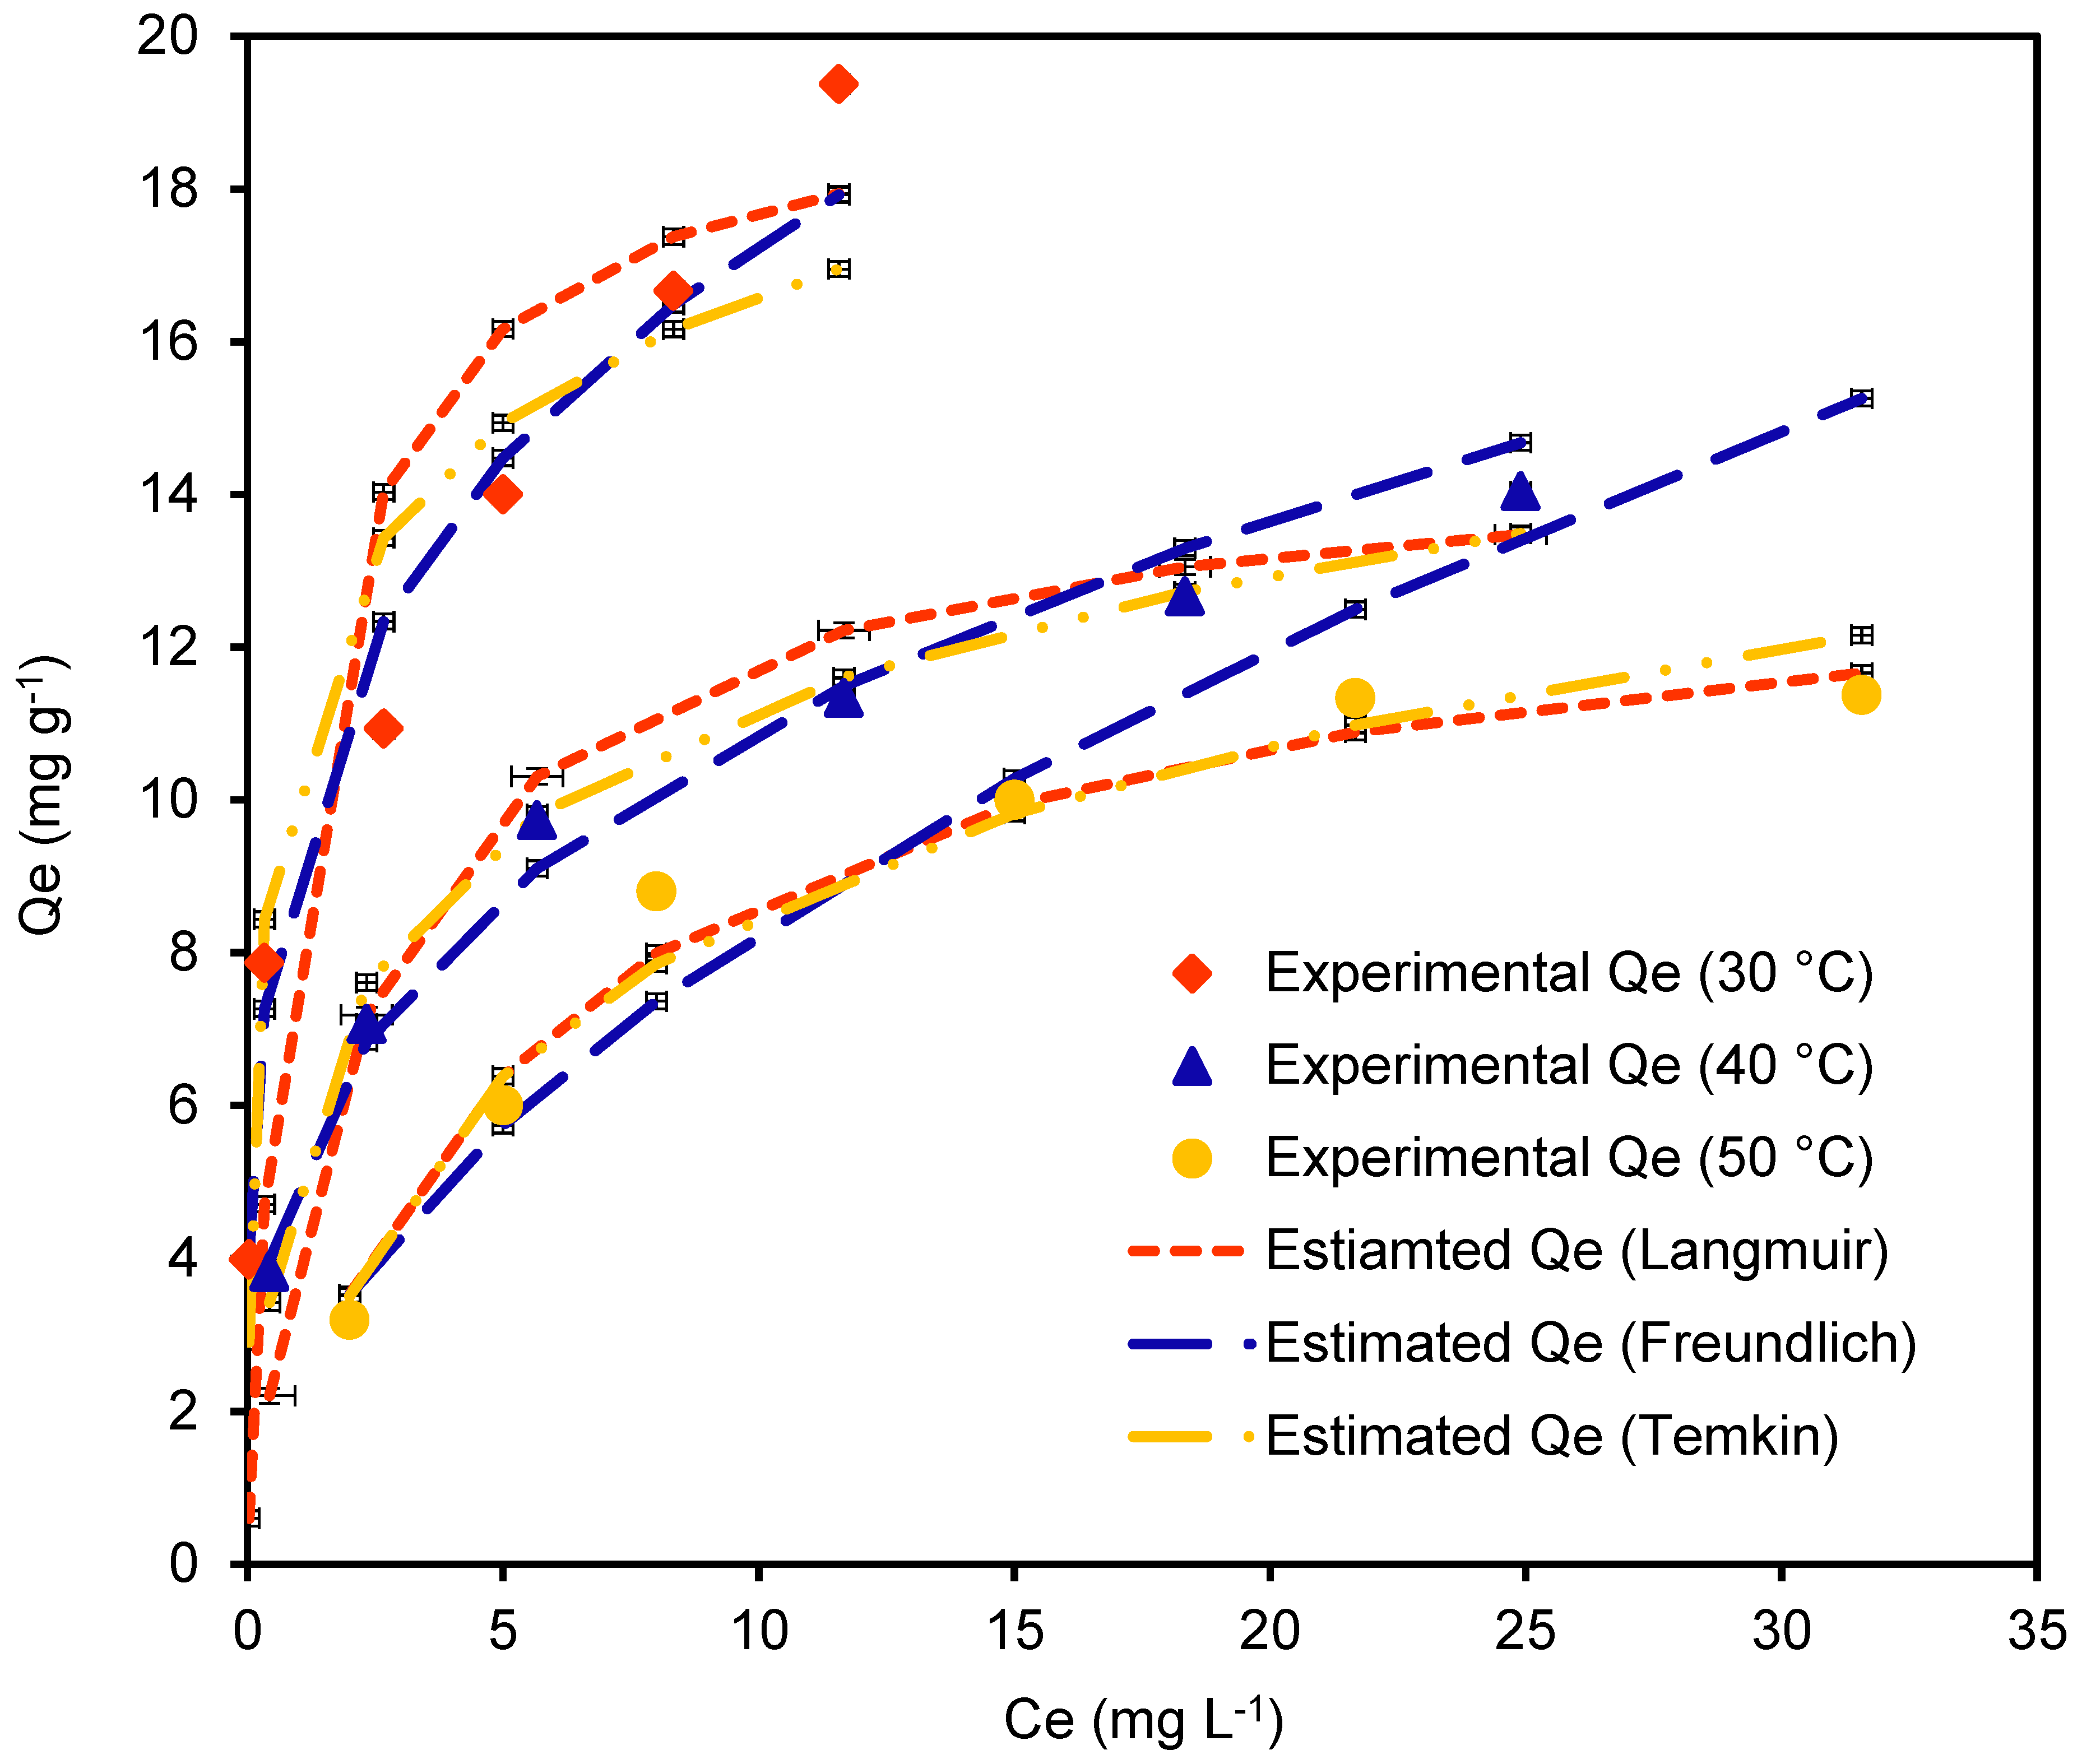
3.2.3. Adsorption Isotherm of CR Adsorption onto the Cu-ZnBO-Cp-CT Surface

To confirm the isotherm fitting, three models were involved in this study, i.e., Langmuir (Lm), Freundlich (Fr), and Temkin (Tm) isotherms.
The Lm isotherm, given by Irwin Langmuir, is used for studying the adsorption of a large variety of pollutants. This isotherm model states that adsorbate molecules bind chemically to the adsorbent molecules singly, having no interaction with their neighboring sites. Thus monolayer formation will occur and further adsorption will be disrupted.
This model can be expressed as Equation (5) [27]:
C e Q e = C e Q o + 1 Q o b
where Qo (mg g−1) is maximum adsorption capacity which is mg amount of solute adsorbed per gram of adsorbent. Qo determines the adsorbing behavior of the adsorbents and b (L mg−1) is the Langmuir constant giving the adsorption energy or binding affinity of Cu-ZnBO-Cp-CT with CR. RL is the dimensionless constant, called a separation factor, calculated by Equation (6) [27].
R L = 1 ( 1 + b C e )
The Fr isotherm applies to both homogeneous and heterogeneous solid surface systems that can be expressed by Equation (7) [27]. Physical adsorption leads to the formation of the multilayer.
log Q e = log k F + 1 n log C e
Here, kF [(mg g−1) (L mg−1)1/n] and n are Freundlich constants which give the uptake capacity and adsorption intensity, respectively. If the value of n lies in the range 1–10, the adsorption process shows favorability.
The Temkin (Tm) model assumes that interaction between adsorbate molecules and adsorbent shows a linear decrease in heat of adsorption with coverage of the adsorbent surface. The binding affinity of CR onto the heterogeneous surface of Cu-ZnBO-Cp-CT was evaluated from the linearized form of the Tm Equation (8) [28].
Q e = R T b T ln A T + R T b T ln C e  
Here, AT (Lg−1) and bT (kJ mol−1) are coefficients called Tm isotherm constants, which give the information for binding energy and adsorption heat, respectively.
The fitting of the isotherms model (Lm, Fr, and Tm isotherm) was evaluated by plotting the simulation graphs (Figure 6), comparing their error functions, and comparing the experimental and modelled adsorption capacity. Results observed from these models (Lm, Fr, and Tm isotherm) suggest that the experimental adsorption capacity (Qe, exp) showed good agreement with the adsorption capacity calculated (Qe, cal) by the Fr isotherm model at the lower temperatures (30 and 40 °C), while at the higher temperature (50 °C), the Qe, exp was found to be much closer to the Qe, cal of the Lm model. The simulation graphs also show the same. The error functions, i.e., average range error (ARE) values (calculated for the simulation graphs) were found to be lower for the Fr isotherm at lower temperature and for the Lm isotherm at higher temperature. These results indicate that initially (at 30 and 40 °C) the CR adsorption onto the Cu-ZnBO-Cp-CT surface followed the Fr isotherm and, later when the temperature increased to 50 °C, adsorption followed the Lm isotherm model.
For the present study, the values of kF were reported in the range 9.70 to 2.40 ((mg g−1) (Lmg−1)1/n), suggesting a decrease in the adsorption capacity with increased temperatures. The CR adsorption onto the Cu-ZnBO-Cp-CT surface was further affirmed as exothermic by the decreasing values of kF. The n values were found in the range 1–10 (higher than 1), suggesting the favourable and physical nature of CR adsorption onto the Cu-ZnBO-Cp-CT surface [27]. As temperature increased to 30–50 °C the values of n, however, decreased, which suggests an increase in the extent of chemical adsorption with increased temperature. The values of 1/n were found to be in the range 0–1 (less than 1), revealing the less cooperative CR adsorption onto the Cu-ZnBO-Cp-CT surface and the lower values of 1/n at lower temperatures, suggesting that CR adsorption onto the Cu-ZnBO-Cp-CT surface was more efficient and heterogeneous at lower temperatures.
The parameters of the Lm and Tm model also show significant results.
From the Lm model, the Qo values were found to be in the range 19.6 to 13.8 mg g−1 with increased temperatures (30–50 °C) (Table 4). The decrease in the Qo values indicated that the adsorption process was exothermic. The b value was highest at 30 °C which indicates the higher binding efficiency of CR to Cu-ZnBO-Cp-CT at 30 °C temperature. The RL value for the present study was found to be in the range 0–1, indicating that the CR adsorption onto the Cu-ZnBO-Cp-CT surface is feasible at all tested temperatures.
From the Tm isotherm, the value of AT was found to be higher at lower temperature indicating the stronger bonding. The bT values were found to be positive suggesting the exothermic CR adsorption onto the Cu-ZnBO-Cp-CT surface. Moreover, the slight changes in bT reveal the slight change in the bonding probability of CR dye onto Cu-ZnBO-Cp-CT at all the tested temperatures, 30 to 50 °C.
Overall isotherm results suggested that initially the CR adsorption onto the Cu-ZnBO-Cp-CT surface was physical and multilayer and, as the temperature increased, the weakly bounded (electrostatic and hydrogen bonding) CR molecules escaped from the surface and the extent of chemical bonding increased. Therefore, overall CR adsorption onto the Cu-ZnBO-Cp-CT surface was governed by the physio-chemical adsorption mechanism. Similar findings were reported by Al-Ghouti and Al-Absi [28] for methylene blue dye adsorbed onto cellulosic olive stones biomass.

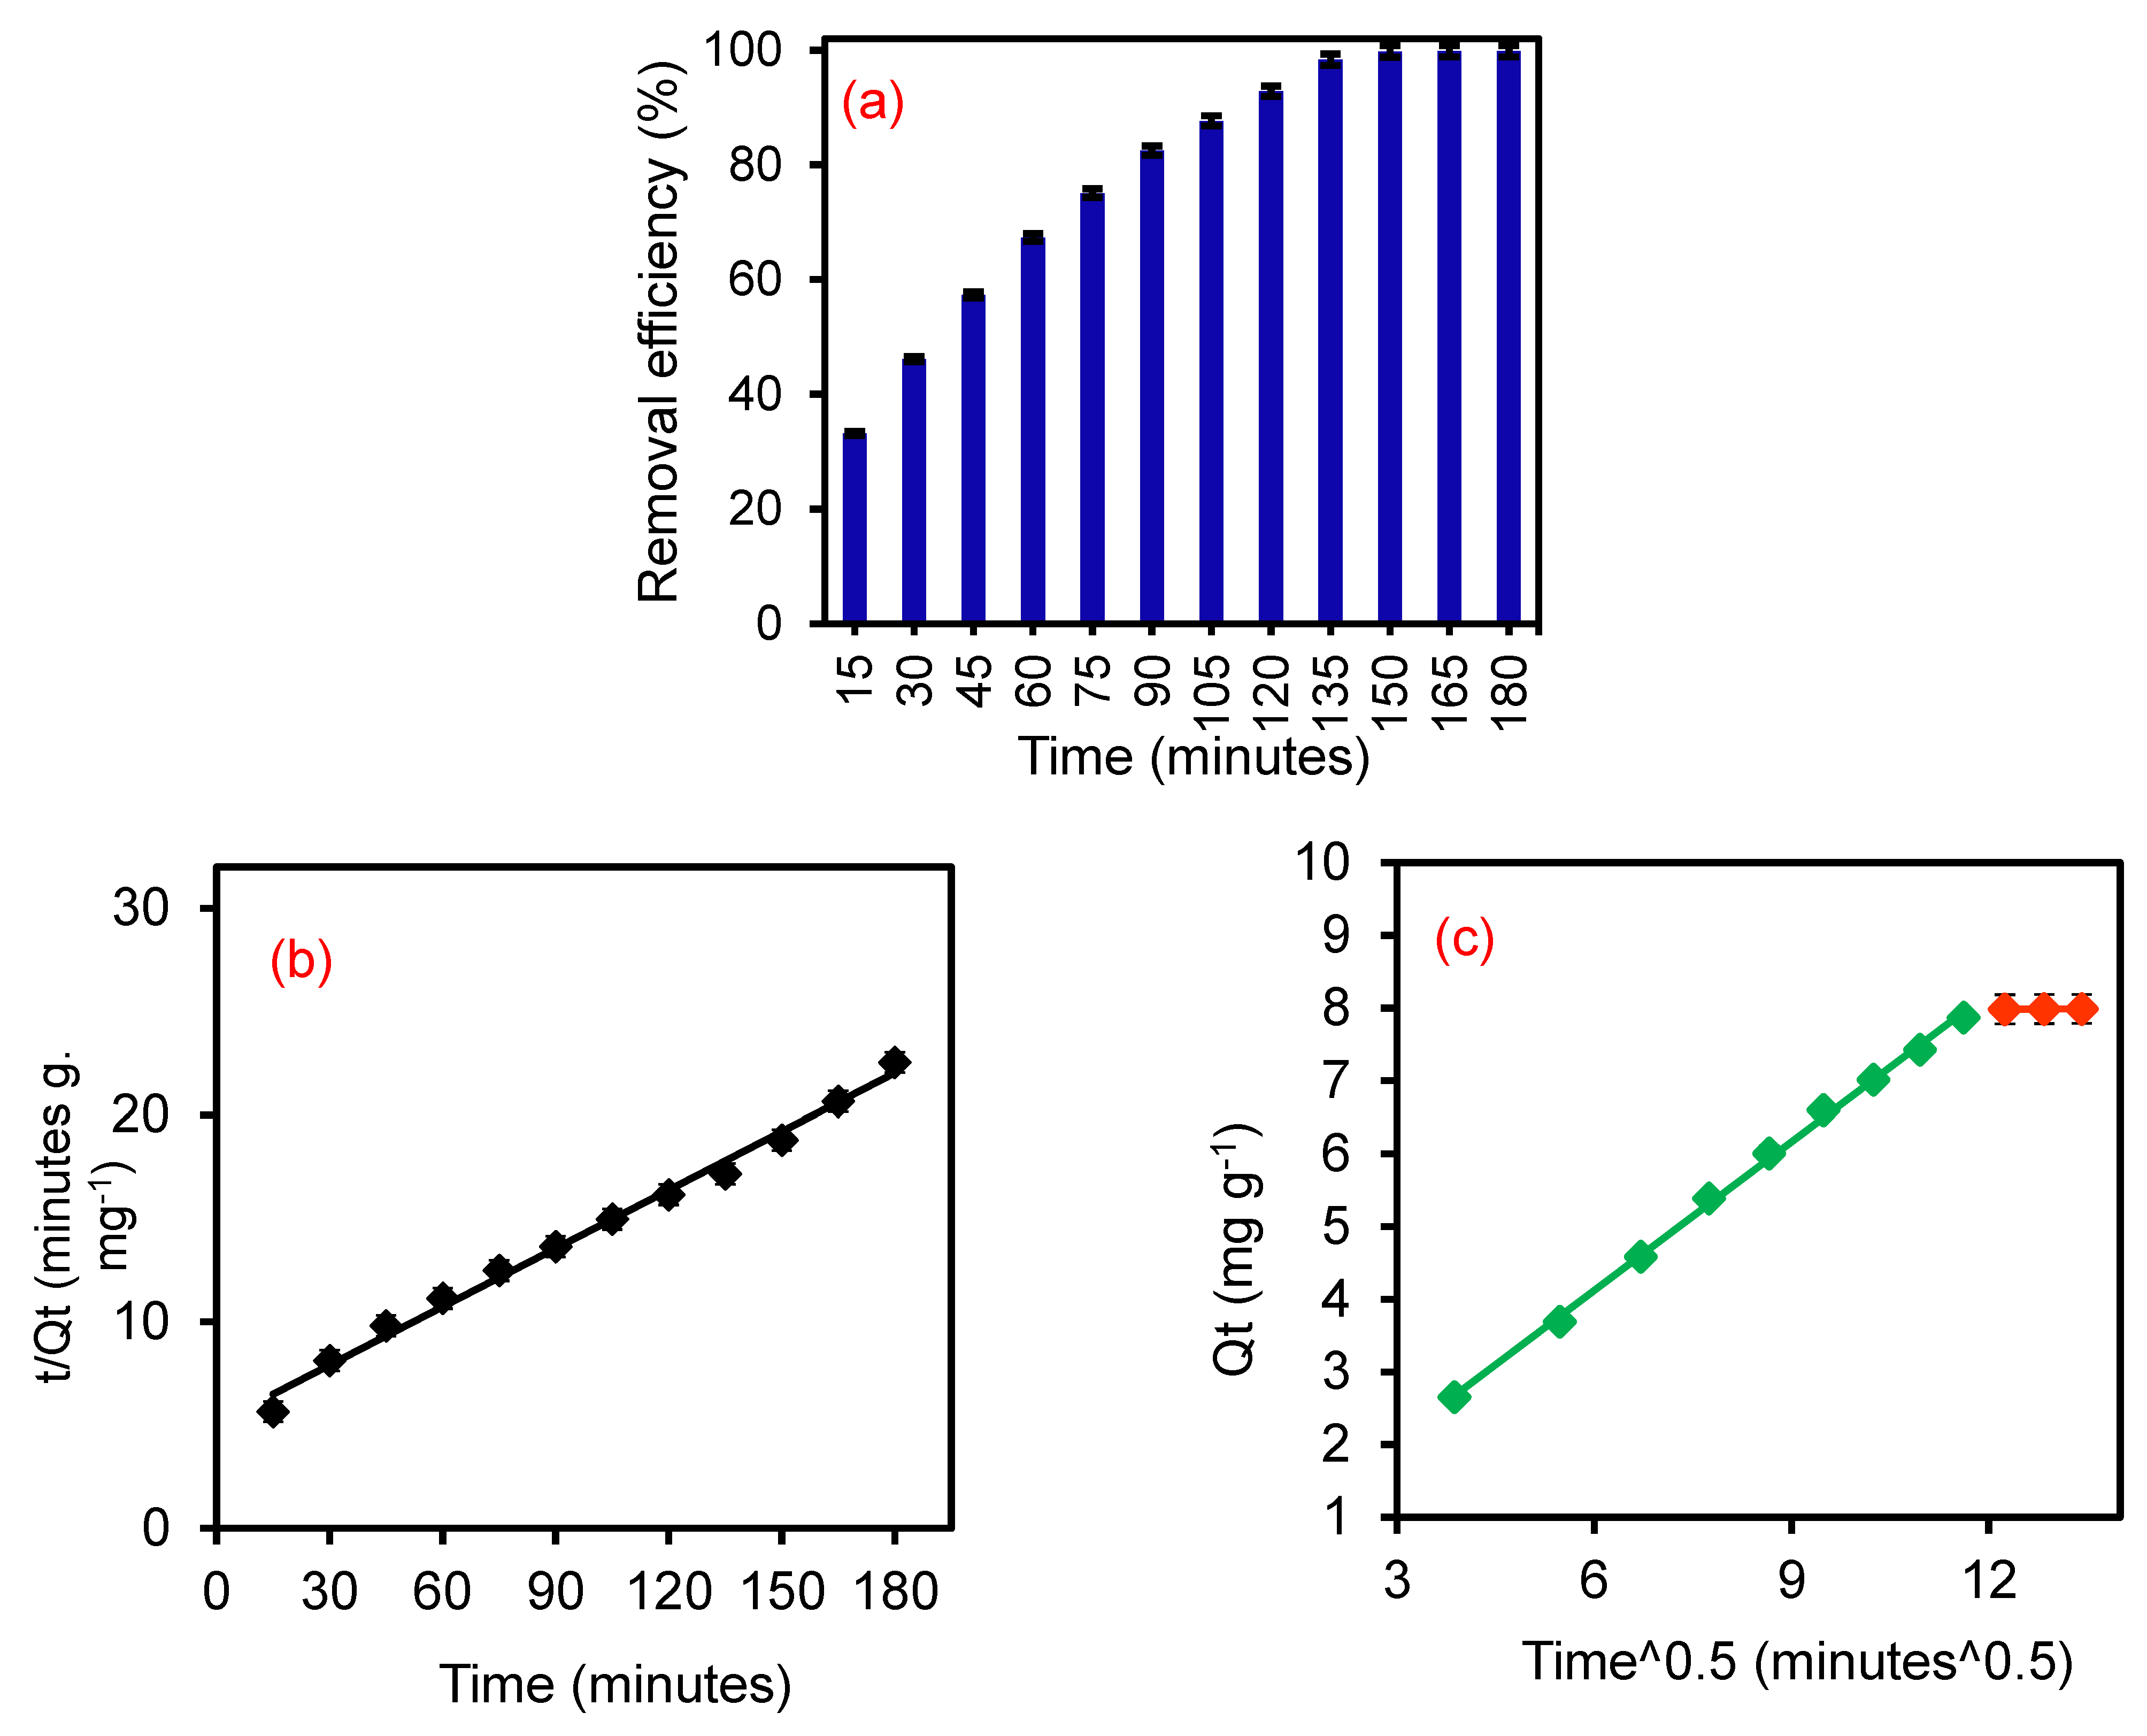
3.2.4. Adsorption Kinetics of CR Adsorption onto the Cu-ZnBO-Cp-CT Surface

Suitability of a particular adsorption system can be evaluated by knowing the equilibration time at which maximum removal of pollutants takes place. This will also help in evaluating the kinetics of adsorption. To obtain the optimized time, CR solutions were agitated with a 2.5 g L−1 Cu-ZnBO-Cp-CT in 20 mg L−1 concentration of CR for 15–180 min (Figure 7a). As shown in Figure 7a, the removal efficiency of Cu-ZnBO-Cp-CT for CR increased up to maximum level (~99.0%) at 135 min, from minimum levels at 15 min of reaction time. Figure 7a also suggests that the adsorption rate was rapid at the start, but decreased as time passed. This is because of the availability of large numbers of binding sites initially at the Cu-ZnBO-Cp-CT surface. As time passes the number of vacant active sites will decrease and the filled available sites provide a hindrance for upcoming CR molecules, resulting in more specific adsorption pathways for CR dye molecules. Similar results were obtained in the study of Elkady et al. [29], who reported the adsorption performance of eggshell bio-composite beads for reactive red dye.
These phenomena can be understood by the study of adsorption kinetics. Adsorption kinetics deals with the rate of transport of adsorbate molecules from the bulk solution to the adsorbent surface. It may occur through one step or several steps that are useful in determining the exact adsorption mechanism. The adsorption kinetics and related mechanism reveal the adsorption behaviour (either physio- or chemo-). These adsorption behaviors largely depend on the physicochemical characteristics of adsorbate and adsorbent [29].
To understand the adsorption kinetics, the experimental kinetic data was fitted into the given kinetics equations 9 and 10 for kinetic models pseudo-first-order (PFO) (Figure S2, ESI) and pseudo-second order (PSO) (Figure 7b), respectively [29]. The PFO kinetic model states that the adsorption kinetics are governed only by the surface sites of the adsorbent, while the PSO model assumes that both adsorbent surface and pollutant ions/molecules affect the kinetics of the adsorption process.
log   ( Q e Q t ) = log   Q e   k 1 2.303 t
t Q t = 1 h + t Q e
where, h = k2Qe2
Here, Qt and Qe (mg g−1) are the adsorption capacities at time t and equilibrium, respectively. k1 (min−1) and k2 (g mg−1 min−1) are the PFO and PSO rate constant, respectively, for solute adsorption onto the adsorbent surface.
The straight line plot between log (Qe-Qt) and t gives PFO parameters, while the plot t/Qt vs. t gives the value of PSO parameters.
The findings of differences in Qe, (exp) and Qe, (cal) suggest that the Qe (cal) of the PSO model showed less difference to Qe, compared to the PFO (Table 5). Further, the regression coefficient R2 of the PSO plot was 0.99, therefore PSO is the best fitting kinetic model. Thus, the suitability of PSO kinetics reveals that the CR adsorption onto the surface of Cu-ZnBO-Cp-CT is due to the interaction of functional groups onto the Cu-ZnBO-Cp-CT surface to CR [30].
The present adsorbent showed fast CR adsorption on its surface, which was likely to have been regulated by mass transfer, intraparticle diffusion (IPD) and/or film diffusion (FD). To find out the actual rate determining step, the Weber-Morris (WM) model (Equation (11)) was applied to the kinetics data [29].
Q t = k i p d t 0.5 + C
Here, the kipd (mg g−1 min0.5) is the IPD rate constant. C describes the thickness of the boundary (film) layer across the solution-adsorbent interface. The value of C directly affects the rate of adsorption. For the present study, observation of the WM plot (Figure 7c) can be explained as follows.
The WM plot could not pass through the origin suggesting the adsorption of CR onto the Cu-ZnBO-Cp-CT surface through multistep. There are two lines, indicated by green and red. The green line shows the primary step in CR adsorption which is governed by the FD (boundary layer formation). This line covers the long period of CR adsorption onto the Cu-ZnBO-Cp-CT surface from contact time 15–135 min. The red (secondary) line shows the short range of contact time from 135–150 min, which was governed by the IPD steps. To predict the actual slow step (rate determining step), the values of K (slope) and C (intercept) for both lines were compared. From Table 5, it can be seen that the value of C2 (for secondary red line) was larger than C1 (for primary green line) and the value of K2 was smaller than K1. These results suggest that the reaction was slowest during the secondary portion due to the large thickness of the boundary layer, resulting in the larger value of C2. Therefore, the rate determining step for adsorption of CR onto the Cu-ZnBO-Cp-CT surface was IPD. The present kinetic observations suggested the interaction between the adsorbent and CR dye functional groups. These findings were verified by the previous research of Elkady et al. [29] conducted for the removal of reactive red dye using eggshell bio-composite beads.

3.2.5. Comparative Evaluation of CR Adsorption Capacity of Cu-ZnBO-Cp-CT

The comparative analysis of adsorption performance of Cu-ZnBO-Cp-CT with ZnO coupled CdWO4 and other adsorbent systems were performed on the basis of maximum adsorption capacity, equilibrium adsorption capacity, and partition coefficient under various process parameters. The partition coefficient PC (mg g−1 μM−1) was determined by Equation (12) [31].
PC = Q e / C e
where Qe is the equilibrium adsorption capacity and Ce is the final concentration.
For present study, the value of PC was calculated at 83.3 mg g−1 µM−1 at 10 mg L−1 concentration of CR using 2.5 g L−1 amount of Cu-ZnBO-Cp-CT at 30 °C. In addition, PC values were found in decreasing order (83.3, 16.4, 2.9, 1.95, 1.40, and 1.22 mg g–1 µM−1) with increasing concentrations (at 10.0, 20.0, 30.0, 40.0, 50.0, and 60.0 mg L−1). This is because of saturation of adsorption sites on the surface of Cu-ZnBO-Cp-CT at higher concentrations.
Compared with the performance of ZnO coupled CdWO4 [14], Cu-ZnBO-Cp-CT shows better adsorption performance in terms of removal efficiency and PC value. ZnO coupled CdWO4 has a PC value of 21.4 mg g−1 μM−1 and 98.4% removal efficiency at an initial CR concentration of 10 mg L−1 using 2.0 g L−1 adsorbent.
Cu-ZnBO-Cp-CT also shows better performance than modified bentonite, RF carbon gel, and ZnFe2O4/SiO2/TG [14]. The adsorption equilibrium capacity of SiO2/C was higher than Cu-ZnBO-Cp-CT but required high CR concentration and contact time. Moreover, as per the preparation step, SiO2/C was costlier than Cu-ZnBO-Cp-CT [32].
Overall, among all the discussed adsorbents, Cu-ZnBO-Cp-CT has low cost, requires easy and green steps to prepare, and shows high adsorption performance in terms of removal efficiency, adsorption equilibrium capacity, and PC values. The low particle size, high porosity and functional groups of Cu-ZnBO-Cp-CT were responsible for its high removal performance for CR dye. The adsorption and photocatalytic activity [17] of this material has made it more efficient for wastewater treatment.

4. Conclusions and Future Prospects

The present study investigated the adsorption performance of the prepared nanocomposite, Cu-ZnBO-Cp-CT, for Congo red dye removal. Cu-ZnBO-Cp-CT was prepared via bioprecipitation reaction using plant extracts. The study showed the functionalization of Cu-ZnBO-Cp-CT by the plant extract. The functional groups attached to the Cu-ZnBO-Cp-CT were responsible for the Congo red dye adsorption on the Cu-ZnBO-Cp-CT surface. This research includes both theoretical and experimental studies for the removal of Congo red by the process of adsorption. Congo red adsorption onto Cu-ZnBO-Cp-CT surface follows the Langmuir isotherm at high temperature (50 °C) and the Freundlich isotherm at low temperature (30–40 °C). The maximum adsorption capacity of Cu-ZnBO-Cp-CT was 19.6 mg g−1. The adsorption data best fit to the pseudo-second order kinetics and the rate determining step was intraparticle diffusion. Thermodynamic studies showed the exothermic and feasible nature of Congo red adsorption on the Cu-ZnBO-Cp-CT surface. The partition coefficient value was calculated using 2.5 g L−1 for 10 mg L−1 Congo red concentration as 83.3 mg g−1 µM−1 at 30 °C and 7.0 pH. These findings demonstrated the higher adsorption performance of Cu-ZnBO-Cp-CT compared to other reported adsorbents. Therefore, this study revealed the adsorption potential of Cu-ZnBO-Cp-CT for Congo red dye, in addition to its photocatalytic degradation capability previously reported [17]. Future studies are needed to explore the adsorption performance of Cu-ZnBO-Cp-CT for natural water. The possible interaction between Cu-ZnBO-Cp-CT and Congo red through spectroscopic techniques will be a major topic. The effect of the immobilized biofilm on the adsorbent surface will also be addressed.

Supplementary Materials

The following are available online at https://www.mdpi.com/article/10.3390/w13223287/s1, Figure S1: XRD of Cu-ZnBO-Cp-CT. NPs calcined at 600 °C. Figure S2: Plot of PFO kinetic for CR adsorption onto the Cu-ZnBO-Cp-CT. Table S1: EDAX analysis of Cu-ZnBO-Cp-CT.

Author Contributions

B.F., S.I.S. and M.A.: Formal Analysis, Investigation, Methodology, and Writing—original draft. M.K.K., R.A., R.M. and R.R.: Writing—review & editing. S.O. and B.A.A.: Formal analysis, investigation, funding acquisition, supervision, validation, and writing—review & editing. All authors have read and agreed to the published version of the manuscript.

Funding

This study was funded by Deanship of Scientific Research (Project No.: RGP. 2/204/42), King Khalid University, Abha, K.S.A and National Research Foundation of Korea (No. NRF-2020R1A2C110157311), (MSIP; Ministry of Science, ICT & Future Planning).

Institutional Review Board Statement

Not applicable.

Informed Consent Statement

Not applicable.

Data Availability Statement

The datasets used and/or analysed during the current study are available from the corresponding author on reasonable request.

Acknowledgments

The research work was funded by the Deanship of Scientific Research (Project No.: RGP. 2/204/42), King Khalid University, Abha, K.S.A. The author, B.A.A., therefore, acknowledge with thanks to DSR and the Chemical Engineering Department in the College of Engineering (KKU) for financial and technical support. This study was supported by a National Research Foundation of Korea (NRF) grant funded by the Korean government (MSIP; Ministry of Science, ICT & Future Planning) (No. NRF-2020R1A2C110157311). The author Bushra Fatima acknowledges the Department of Chemistry, Jamia Millia Islamia, New Delhi, India for providing research facilities.

Conflicts of Interest

The authors declare that they have no competing interests.

Appendix A

Figure A1. Schematic diagram of preparation of Cu-ZnBO-Cp-CT.
Water 13 03287 g0a1

References

  1. Shah, K. Biodegradation of azo dye compounds. Int. Res. J. Biochem. Biotechnol. 2014, 1, 5–13. [Google Scholar]
  2. Naseem, K.; Farooqi, Z.H.; Begum, R.; Irfan, A. Removal of Congo red dye from aqueous medium by its catalytic reduction using sodium borohydride in the presence of various inorganic nano-catalysts: A review. J. Clean. Prod. 2018, 187, 296–307. [Google Scholar] [CrossRef]
  3. Derouich, G.; Younssi, S.A.; Bennazha, J.; Cody, J.A.; Ouammou, M.; El Rhazi, M. Development of low-cost polypyrrole/sintered pozzolan ultrafiltration membrane and its highly efficient performance for congo red dye removal. J. Environ. Chem. Eng. 2020, 8, 103809. [Google Scholar] [CrossRef]
  4. Arab, C.; Kurdi, R.E.; Patra, D. Efficient removal of Congo red using curcumin conjugated zinc oxide nanoparticles as new adsorbent complex. Chemosphere 2021, 276, 130158. [Google Scholar] [CrossRef] [PubMed]
  5. Mareedu, T.; Poiba, V.R.; Vangalapati, M. Green synthesis of iron nanoparticles by green tea and black tea leaves extract. Mater. Today Proc. 2021, 42, 1498–1501. [Google Scholar] [CrossRef]
  6. Malik, P.; Shankar, R.; Malik, V.; Sharma, N.; Mukherjee, T.K. Green chemistry based benign routes for nanoparticle synthesis. J. Nanopart. 2014, 2014, 302429. [Google Scholar] [CrossRef] [Green Version]
  7. Vijayakumar, S.; Arulmozhi, P.; Kumar, N.; Sakthivel, B.; Kumar, S.P.; Praseetha, P.K. Acalypha fruticosa L. leaf extract mediated synthesis of ZnO nanoparticles: Characterization and antimicrobial activities. Mater. Today Proc. 2020, 23, 73–80. [Google Scholar] [CrossRef]
  8. Fatima, B.; Siddiqui, S.I.; Ahmed, R.; Chaudhry, S.A. Green synthesis of f-CdWO4 for photocatalytic degradation and adsorptive removal of Bismarck Brown R dye from water. Water Res. Indus. 2019, 22, 100119. [Google Scholar] [CrossRef]
  9. Fatima, B.; Siddiqui, S.I.; Chaudhry, S.A.; Ahmad, R. Preparation of functionalized CuO nanoparticles using Brassica Rapa leave extract for water purification. Desalin. Water Treat. 2019, 164, 1–14. [Google Scholar] [CrossRef]
  10. Taneja, P.; Sharma, S.; Umar, A.; Mehta, S.K.; Ibhadon, A.O.; Kansal, S.K. Visible-light driven photocatalytic degradation of brilliant green dye based on cobalt tungstate (CoWO4) nanoparticles. Mater. Chem. Phys. 2018, 211, 335–342. [Google Scholar] [CrossRef]
  11. Xu, L.; Wang, X.; Xu, M.L.; Liu, B.; Wang, X.F.; Wang, S.H.; Sun, T. Preparation of zinc tungstate nanomaterial and its sonocatalytic degradation of meloxicam as a novel sonocatalyst in aqueous solution. Ultrason. Sonochem. 2020, 61, 104815. [Google Scholar] [CrossRef]
  12. Hang, T.T.M.; Vy, N.H.T.; Hanh, N.T.; Pham, T.D.; Yen, L.T.H. Facile synthesis of copper tungstate (CuWO4) for novel photocatalytic degradation of tetracycline under visible light. Sustain. Chem. Pharm. 2021, 21, 100407. [Google Scholar] [CrossRef]
  13. Shad, N.A.; Sajid, M.M.; Amin, N. Photocatalytic degradation performance of cadmium tungstate (CdWO4) nanosheets-assembly and their hydrogen storage features. Ceram. Int. 2019, 45, 19015–19021. [Google Scholar] [CrossRef]
  14. Fatima, B.; Siddiqui, S.I.; Nirala, R.K.; Vikrant, K.; Kim, K.H.; Ahmad, R.; Chaudhry, S.A. Facile green synthesis of ZnO–CdWO4 nanoparticles and their potential as adsorbents to remove organic dye. Environ. Poll. 2021, 271, 116401. [Google Scholar] [CrossRef] [PubMed]
  15. Wang, X.; Su, W.; Hu, X.; Liu, H.; Sheng, M.; Zhou, Q. Synthesis and characterization of Fe-doped CdWO4 nanoparticles with enhanced photocatalytic activity. Mater. Res. Exp. 2019, 6, 035507. [Google Scholar] [CrossRef]
  16. Sethi, Y.A.; Panmand, R.P.; Kadam, S.R.; Kulkarni, A.K.; Apte, S.K.; Naik, S.D.; Kale, B.B. Nanostructured CdS sensitized CdWO4 nanorods for hydrogen generation from hydrogen sulfide and dye degradation under sunlight. J. Colloid Interface Sci. 2017, 487, 504–512. [Google Scholar] [CrossRef]
  17. Fatima, B.; Siddiqui, S.I.; Ahmad, R.; Linh, N.T.T.; Thai, V.N. CuO-ZnO-CdWO4: A sustainable and environmentally benign photocatalytic system for water cleansing. Environ. Sci. Pollut. Res. 2021, 28, 53793–53803. [Google Scholar] [CrossRef]
  18. Putz, H.; Brandenburg, K. Pearson’s Crystal Data. In Crystal Structure Database for Inorganic Compounds-Crystal Impact; GbR, Kreuzherrenstr: Bonn, Germany, 2021; Available online: http://www.crystalimpact.com/endeavour (accessed on 14 June 2021).
  19. Shafiee, M.; Reza, M.; Kargar, M.; Ghashang, M. Characterization and low-cost, green synthesis of Zn2+ doped MgO nanoparticles. Green Process. Synth. 2018, 7, 248–254. [Google Scholar] [CrossRef]
  20. Calos, N.J.; Forrester, J.S.; Schaffer, G.B. A crystallographic contribution to the mechanism of a mechanically induced solid-state reaction. J. Solid State Chem. 1996, 122, 273–280. [Google Scholar] [CrossRef]
  21. Daturi, M.; Borel, M.M.; Leclaire, A.; Savary, L.; Costentin, G.; Lavalley, J.C.; Raveau, B. Crystallographic and catalytic studies of a new solid solution CdMoxW1–xO4. J. Chim. Phys. 1996, 93, 2043–2053. [Google Scholar] [CrossRef]
  22. Kihara, K.; Donnay, G. Anharmonic thermal vibrations in ZnO. Can Mineral. 1985, 23, 647–654. [Google Scholar]
  23. Dawood, S.; Sen, T.K. Removal of anionic dye Congo red from aqueous solution by raw pine and acid-treated pine cone powder as adsorbent: Equilibrium, thermodynamic, kinetics, mechanism and process design. Water Res. 2012, 46, 1933–1946. [Google Scholar] [CrossRef]
  24. Siddiqui, S.I.; Chaudhry, S.A. Nanohybrid composite Fe2O3-ZrO2/BC for inhibiting the growth of bacteria and adsorptive removal of arsenic and dyes from water. J. Clean. Prod. 2019, 223, 849–868. [Google Scholar] [CrossRef]
  25. He, S.; Liu, X.; Yan, P.; Wang, A.; Su, J.; Su, X. Preparation of gemini surfactant/graphene oxide composites and their superior performance for Congo red adsorption. RSC Adv. 2019, 9, 4908–4916. [Google Scholar] [CrossRef] [Green Version]
  26. Saha, P.; Chowdhury, S.; Tadashi, M. (Eds.) Insight into Adsorption Thermodynamics, Thermodynamics; InTech: London, UK, 2011; ISBN 978-953-307-544-0. Available online: http://www.intechopen.com/books/thermodynamics/insight-into-adsorption-thermodynamics (accessed on 23 August 2021).
  27. Foo, K.Y.; Hameed, B.H. Insights into the modelling of adsorption isotherm systems. Chem. Eng. J. 2010, 156, 2–10. [Google Scholar] [CrossRef]
  28. Al-Ghouti, M.A.; Al-Absi, R.S. Mechanistic understanding of the adsorption and thermodynamic aspects of cationic methylene blue dye onto cellulosic olive stones biomass from wastewater. Sci. Rep. 2020, 10, 15928. [Google Scholar] [CrossRef] [PubMed]
  29. Elkady, M.F.; Ibrahim, A.M.; Abd El-Latif, M.M. Assessment of the adsorption kinetics, equilibrium and thermodynamic for the potential removal of reactive red dye using eggshell biocomposite beads. Desalination 2011, 278, 412–423. [Google Scholar] [CrossRef]
  30. Jamshidi, M.; Ghaedi, M.; Dashtian, K.; Hajati, S.; Bazrafshan, A.A. Sonochemical assisted hydrothermal synthesis of ZnO: Cr nanoparticles loaded activated carbon for simultaneous ultrasound-assisted adsorption of ternary toxic organic dye: Derivative spectrophotometric, optimization, kinetic and isotherm study. Ultrason. Sonochem. 2016, 32, 119131. [Google Scholar] [CrossRef] [Green Version]
  31. Vikrant, K.; Kim, K.H. Nanomaterials for the adsorptive treatment of Hg(II) ions from water. Chem. Eng. J. 2019, 358, 264–282. [Google Scholar] [CrossRef]
  32. Wang, J.; Xiao, L.; Wen, S. Hierarchically porous SiO2/C hollow microspheres: A highly efficient adsorbent for Congo red removal. RSC Adv. 2018, 8, 19852. [Google Scholar] [CrossRef] [Green Version]
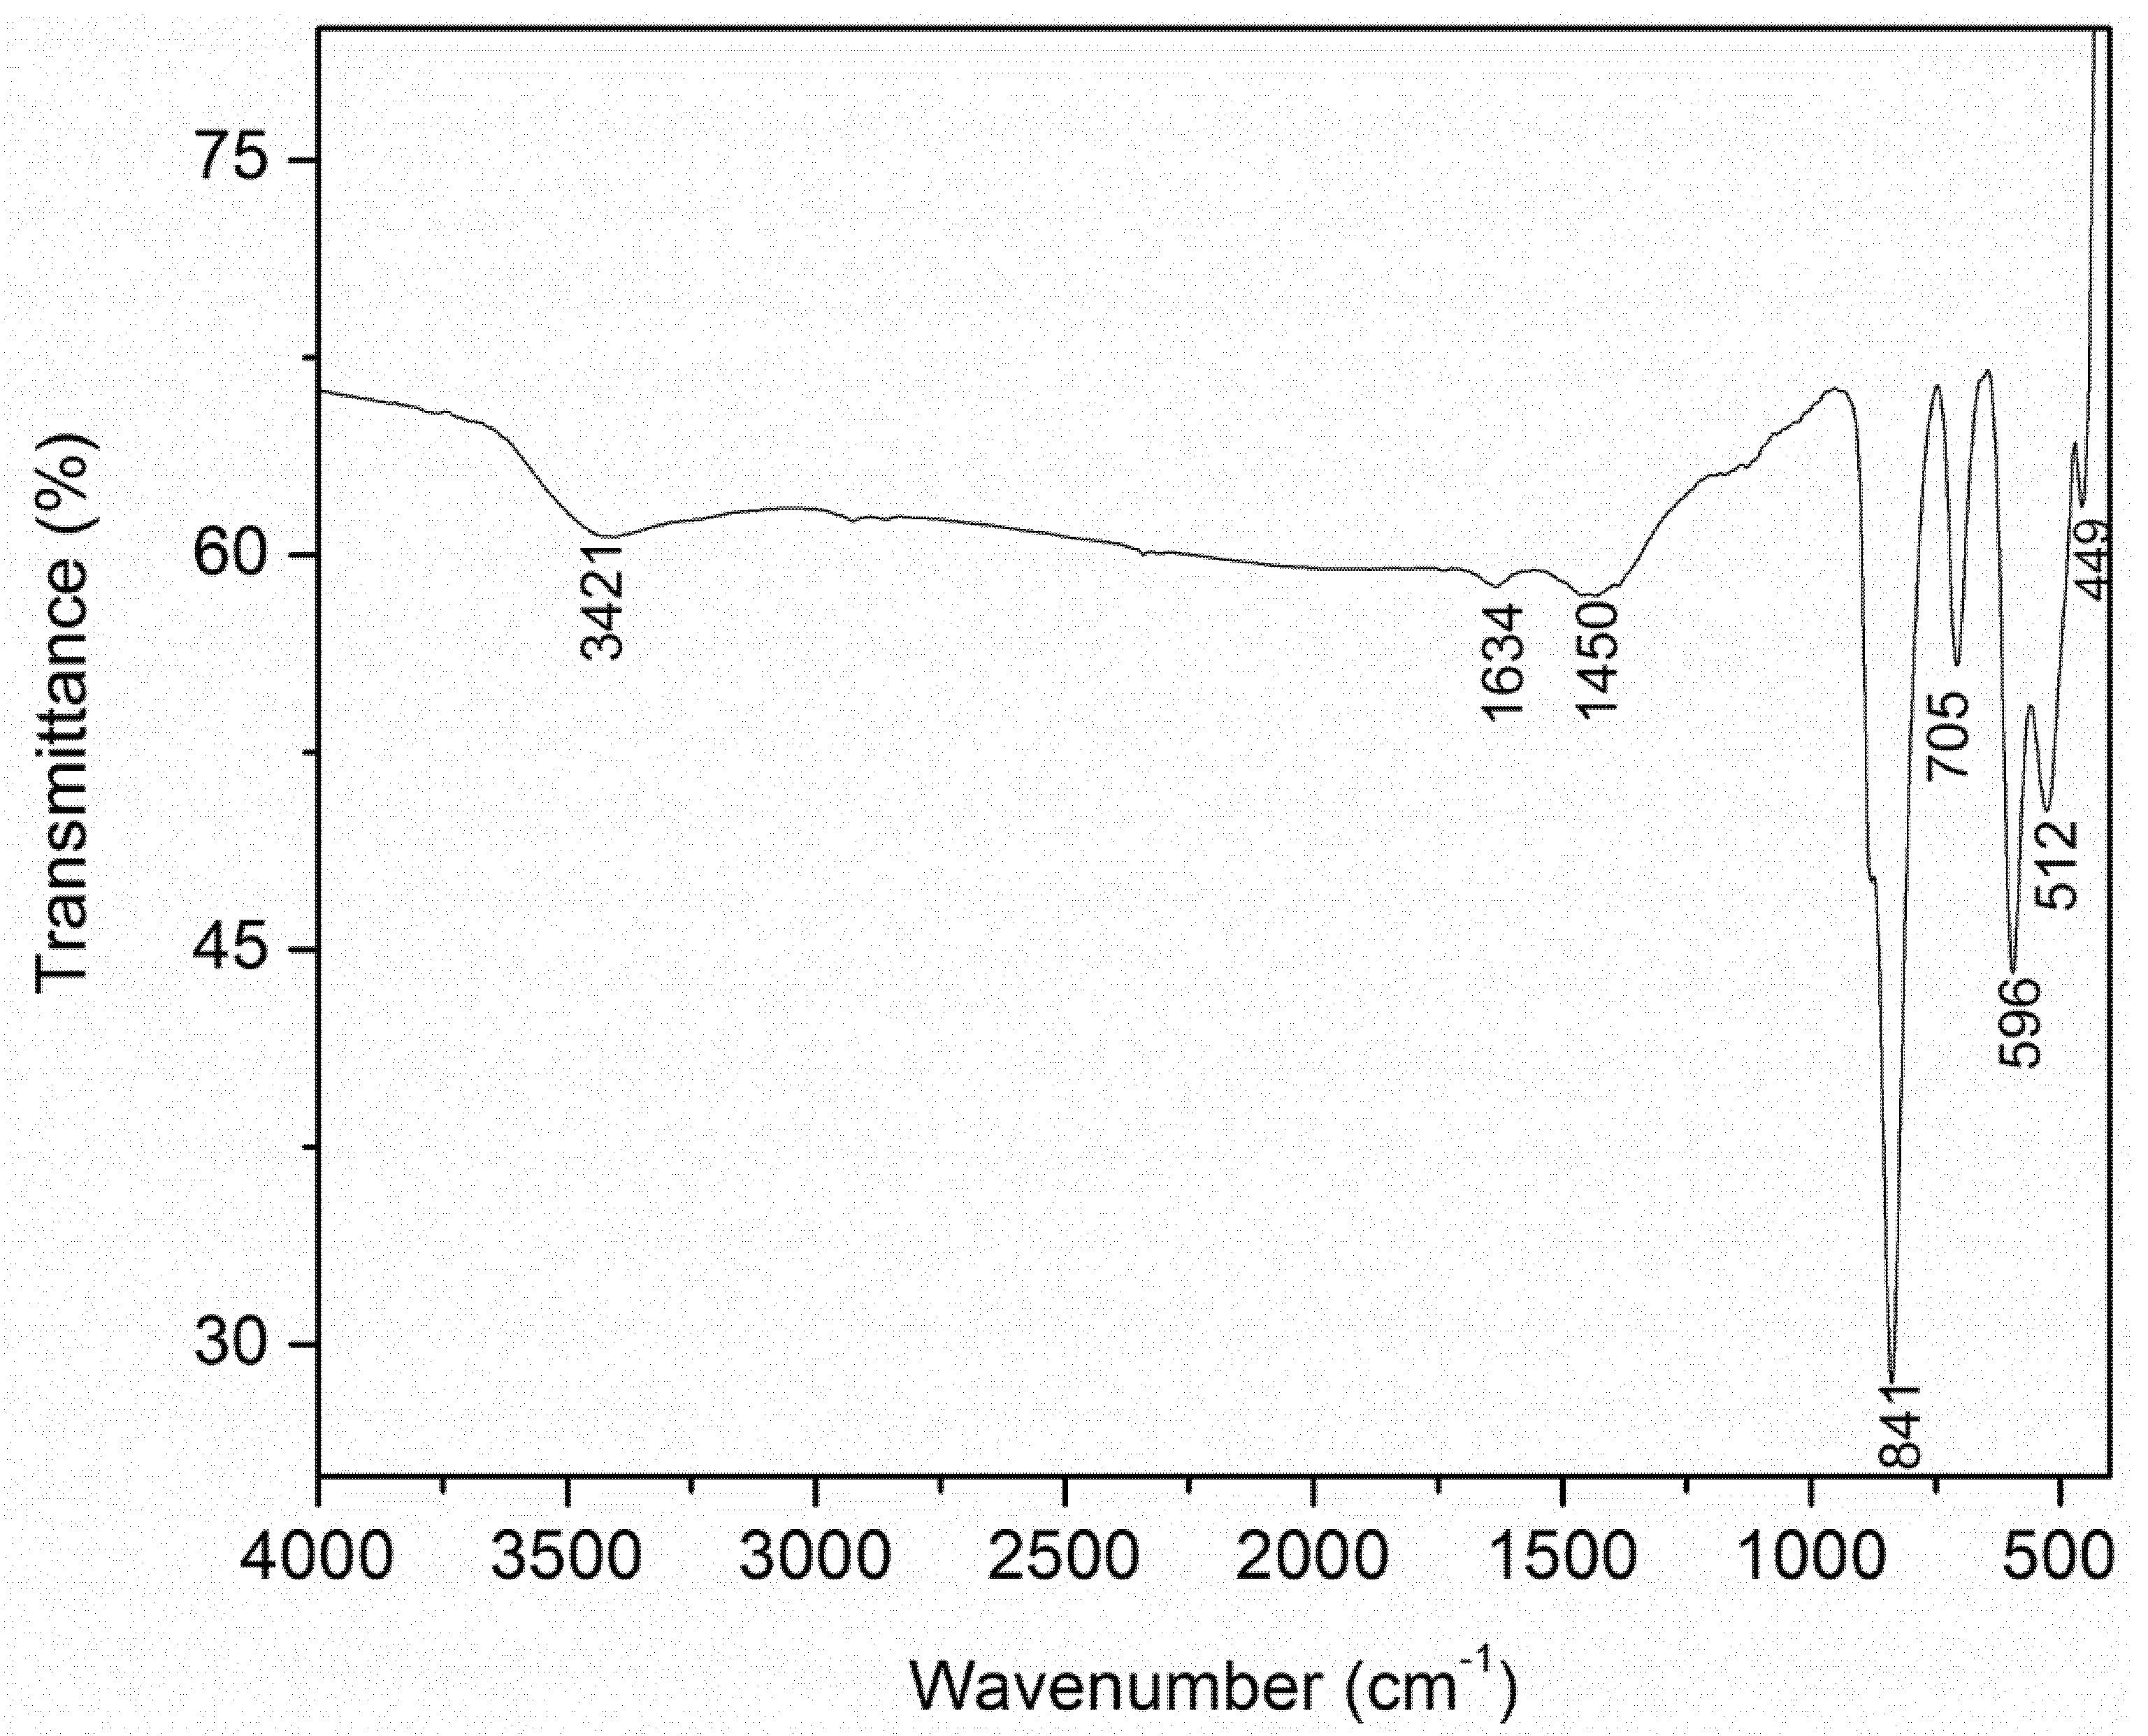
Figure 1. FT-IR spectrum of Cu-ZnBO-Cp-CT.
Water 13 03287 g001
Figure 2. SEM images (a,c) of Cu-ZnBO-Cp-CT at different magnifications (inset (b) shows the elemental composition).
Water 13 03287 g002aWater 13 03287 g002b
Figure 3. TEM images of Cu-ZnBO-Cp-CT.
Water 13 03287 g003
Figure 4. Effect of (a) adsorbent dose, (b) dye concentration, and (c) solution pH on the performance of Cu-ZnBO-Cp-CT for CR removal. (Experimental conditions: Adsorbent dose = 2.5 g L−1; Contact time = 135 min; Agitation speed = 200 rpm; Solution pH = 7; CR Concentration = 20 mg L−1; Temperature = 30 °C).
Water 13 03287 g004aWater 13 03287 g004b
Figure 5. Thermodynamic plot of CR adsorption onto the Cu-ZnBO-Cp-CT. (Experimental conditions: Adsorbent dose = 2.5 g L−1; Contact time = 135 min; Agitation speed = 200 rpm; Solution pH = 7; CR Concentration = 10 mg L−1; Temperature = 30 °C).
Water 13 03287 g005
Figure 6. Plot of isotherms simulation, (Experimental conditions: Adsorbent dose = 2.5 g L−1; Contact time = 135 min; Agitation speed = 200 rpm; Solution pH = 7).
Water 13 03287 g006
Figure 7. Plots of (a) contact time effect, (b) PSO kinetic model, and (c) WB model. (Experimental conditions: Adsorbent dose = 2.5 g L−1; Agitation speed = 200 rpm; Solution pH = 7; Temperature = 30 °C; Concentration 20 mg L−1).
Water 13 03287 g007
Table 2. FTIR absorption peaks at various wavenumber for Cu-ZnBO-Cp-CT.
OrderWave Number Assigned for Cu-ZnBO-Cp-CT (cm−1)Corr. PeaksRemarksReference
1.3421-OH str.Appeared for plant extract[14]
2.1634-OH str.
3.1450-C-H str.
4.841Cd-O-WAppeared for NPs
5.705W-O
6.596Cu-O
7.512Zn-O
8.449Cd-O
Table 3. Thermodynamic studies of CR adsorption onto Cu-ZnBO-Cp-CT **.
OrderTemperature, °C
kJ mol−1

kJ mol−1

kJ mol−1 K−1
1.30−12.0−175.2−0.54
2.40−5.7
3.50−1.2
** Experimental conditions: pH = 7; Adsorption dose = 2.5 g L−1; CR concentrations = 10 mg L−1; Contact time = 135 min; Agitation speed = 200 rpm.
Table 4. Isotherm studies for CR adsorption onto Cu-ZnBO-Cp-CT **.
OrderTemp., °CLangmuirFreundlichTemkin
Qo
mg g−1
b
L mg−1
RLARE #nkF
mg/g (L/mg)1/n
ARE #ATbTARE #
1.3019.60.950.1030.13.909.615.63100.81.0513.2
2.4014.80.400.2010.83.105.204.079.171.054.30
3.5013.80.170.405.501.902.4413.01.530.856.43
** Experimental conditions: pH = 7; Adsorption dose = 2.5 g L−1; CR concentrations = 10–60 mg L−1; Contact time = 135 min; Agitation speed = 200 rpm. # ARE = Average range error.
Table 5. Kinetic studies for CR adsorption onto Cu-ZnBO-Cp-CT **.
OrderKinetics ModelParametersQe (Exp) = 7.8 mg g−1
1.Pseudo-first orderk1 min−10.03
2.Qe (cal) mg g−111.5
3.Q #3.62
4.R20.88
5.χ *0.31
6.Pseudo-second orderk20.04
7.Qe (cal) mg g−110.6
8.Q #2.75
9.R20.99
10.Χ *0.26
14.Weber-MorrisK10.68
15.C10.04
16.R120.99
17.K20.003
18.C27.94
19.R20.97
** Experimental conditions: pH = 7; Adsorption dose = 2.5 g L−1; CR concentrations = 20 mg L−1; Contact time = 135 min; Agitation speed = 200 rpm. * χ = (Qe,exp − Qe,cal)/Qe,cal, where Qe,exp and Qe,cal are the equilibrium experimental results and calculated value is according to the model, respectively. # Note that, if the experimental results are similar to the data from the model, ΔQ will be small; otherwise it will be large.
Publisher’s Note: MDPI stays neutral with regard to jurisdictional claims in published maps and institutional affiliations.

