
Temporal and Spatial Changes of Runoff Regime in the Yellow River Basin from 1956 to 2017


1
School of Water Conservancy, North China University of Water Resources and Electric Power, Zhengzhou 450046, China
2
State Key Laboratory of Simulation and Regulation of Water Cycle in River Basin, China Institute of Water Resources and Hydropower Research, Beijing 100038, China
*
Authors to whom correspondence should be addressed.
Water 2021, 13(22), 3298; https://doi.org/10.3390/w13223298
Submission received: 21 October 2021
/
Revised: 14 November 2021
/
Accepted: 18 November 2021
/
Published: 21 November 2021
(This article belongs to the Special Issue Advances in Assessing Water Ecosystem Services for Water Resource Management)
Abstract
:The Yellow River is one of the major rivers with severe runoff declines in China, but there are significant differences in runoff changes in the upper and lower reaches of the basin and among different tributaries. However, the characteristic of runoff change and its spatial heterogeneity are not well understood in the whole basin. In this paper, 48 hydrological stations located in the mainstream and major tributaries were selected, and the meteorological and runoff data from 1956 to 2017 were collected. The multi-year and intra-year changes in runoff were analyzed, and then the attribution of climate change and human activity to runoff change was quantified by the climate elasticity coefficients. The results showed that: (1) in the past 60 years, the runoff of the Yellow River showed a serious decrease trend of −8.25 mm/10a. Moreover, most tributaries decreased significantly in runoff with a rate of −1.42 mm/10a to −28.99 mm/10a; (2) for the whole basin, the contribution of climate change and human activity to runoff changes was 13% and 87%, respectively. Moreover, the contribution of the two factors varied considerably in different tributaries. Finally, focusing on different runoff regime and socioeconomic characteristics, this study provided corresponding water resources adaptive management suggestions.
1. Introduction
Affected by climate change and human activity, global hydrological process and the related variables are undergoing drastic changes [1]. In recent years, the water problems characterized by runoff reduction, groundwater depletion, and urban flood disaster have become increasingly prominent around the world. Several major rivers in the world, such as the Nile, Colorado and Yellow Rivers, have shown a significant decreasing trend in annual runoff [2,3]. The factors that affect runoff changes are generally divided into two categories. One is climate change factors that are affected by natural conditions, such as precipitation and evapotranspiration [4,5]; the other is closely related to human activity, such as changes in land use, increased dam construction and human water use [6,7]. Currently, a great deal of research has been devoted to find the driving factors of runoff changes, and to further separate the influence of climate change and human activity. Through the attribution analysis of runoff changes, the related results contribute to the understanding of the formation process and evolution pattern of water resources.
At present, in a changing environment, the widely used methods for quantitatively separating the impact of the driving factors to runoff changes include the hydrological model method, the statistical analysis method, the comparative experiment method, and the climate elasticity coefficient method grounded on Budyko’s hypothesis. The hydrological model method considers the physical process to quantitatively analyze the impact factors with high accuracy, and is currently widely used in related research. Currently, the popular hydrological models include lumped hydrological models such as SIMHYD and the Xin’anjiang model, as well as distributed hydrological models such as SWAT, VIC, HBV, etc. However, the model structure, input and parameters can cause great uncertainties in the results [8,9,10]. In particular, the impact of human activity on runoff is difficult to be accurately described by hydrological models [11,12]. The statistical analysis method is generally used to compare the natural and measured values of runoff during the period of human activity disturbance. In this method, the relationship between runoff and climate variables is established [13,14,15]. The comparative experiment method refers to selecting two basins with similar natural climate conditions and similar geographical locations in a certain area. One of the basins serves as a reference basin, keeping its attributes unchanged. Another basin is used as an experimental basin, taking human activity in this basin as variable. By comparing the changes of hydrological variables in the two basins, the impact of human activity on runoff is explored. The principle of this method is simple, but the test period is too long and the cost is high, so it is limited to small basin applications [16,17,18]. Therefore, according to the actual situation of the study area, the appropriate quantitative analysis method needs to be selected to ensure the accuracy of the study results. The above methods are difficult to apply in the Yellow River basin, and there are great uncertainties.
The climate elasticity coefficient method, based on the elastic coefficient, describes the sensitivity of runoff to changes in multiple meteorological elements, including precipitation, temperature, relative humidity, etc., to calculate the contribution of climate change on runoff, and then calculate the contribution of human activity to runoff through water balance analysis [19]. By analyzing the global water and energy balance, the Soviet climatologist Budyko proposed a hydrothermal coupling balance equation that satisfies the boundary conditions and is independent of the water balance and energy balance according to the boundary conditions [20]. Schaak proposed a hydroelasticity calculation method for runoff drop based on the Budyko framework. Arora further established a calculation method for the sensitivity of runoff to changes in precipitation and potential evaporation. Fu et al. extended a single-precipitation elasticity coefficient to a double-parameter climate elasticity coefficient [21]. Since then, the climate elasticity coefficient method has gradually been more widely used. Zhang et al. analysed watersheds in northeastern China through a climate elasticity method and found that human activity was a major influence factor on runoff variability [22]. Xu et al. used the climate elasticity coefficient method grounded on the Budyko framework to reach the conclusion that land use/cover change is the main factor that causes runoff changes [23]. Overall, the method is theoretically explicit and does not rely on a large amount of historical climate and runoff data [19]. Studies have shown that the method is simple to use but effective at analyzing the attribution of runoff changes over large and limited data areas [24]. Based on the wide coverage of the Yellow River basin and the fact that hydro-meteorological monitoring has been carried out for a long time, this paper used the climate elasticity coefficient method to analyze the impact factors of runoff changes in this basin.
As the second longest river in China, the Yellow River flows through nine provinces. The Yellow River accounts for only 2% of the country’s total water resources, but it undertakes 12% of the country’s population and 15% of the arable land. However, the problem of runoff decline in the whole Yellow River basin is very severe and has been of significant concern [25,26,27]. Some studies have been carried out on the main stream of the Yellow River [25,27,28], or on some of its major tributaries such as the Fenhe, Weihe and Wudinghe rivers [13,29,30,31,32,33], but for most of them, the study area was small and few control sections have been selected. The period of study and the methods used vary from different studies, and it is not possible to give an objective assessment and analysis of the runoff characteristics of the whole Yellow River basin. With the implementation of ecological conservation and high-quality development of the Yellow River Basin proposed by president Xi Jinping, people have put forward higher requirements for the conservation and intensive use of the basin’s water resources. As a result, it is necessary to undertake an analysis on the runoff change in the Yellow River basin.
The Yellow River basin covers a large area, and there is strong spatial heterogeneity in hydrological changes and socioeconomic characteristics. A more in-depth and systematic analysis of the changes of runoff regime in the whole basin is needed to clarify the influencing factors of runoff changes. And among the above analysis methods, the climate elasticity coefficient method has certain advantages in this study. This research collected and processed a large amount of hydrometeorological data, which not only included the main stream of the Yellow River, but also basically covered all the main tributaries, and systematically analyzed the runoff changes characteristics and their influencing factors of the Yellow River basin as accurately and comprehensively as possible.
Forty-eight key river sections located in the main stream of the Yellow River and its 21 main tributaries were selected, and the characteristics of runoff changes in the whole basin in the past 60 years were clarified. The climate elasticity coefficient method was used to quantify the factors influencing runoff variability in different rivers, and then to understand the dominant factor contributing to runoff variability. According to the runoff characteristics and the socio-economic situations of different regions, several water resource adaptive management suggestions were proposed. The results can provide a reference for the ecological protection and development of the Yellow River Basin.
2. Materials and Methods
2.1. Study Area and Data
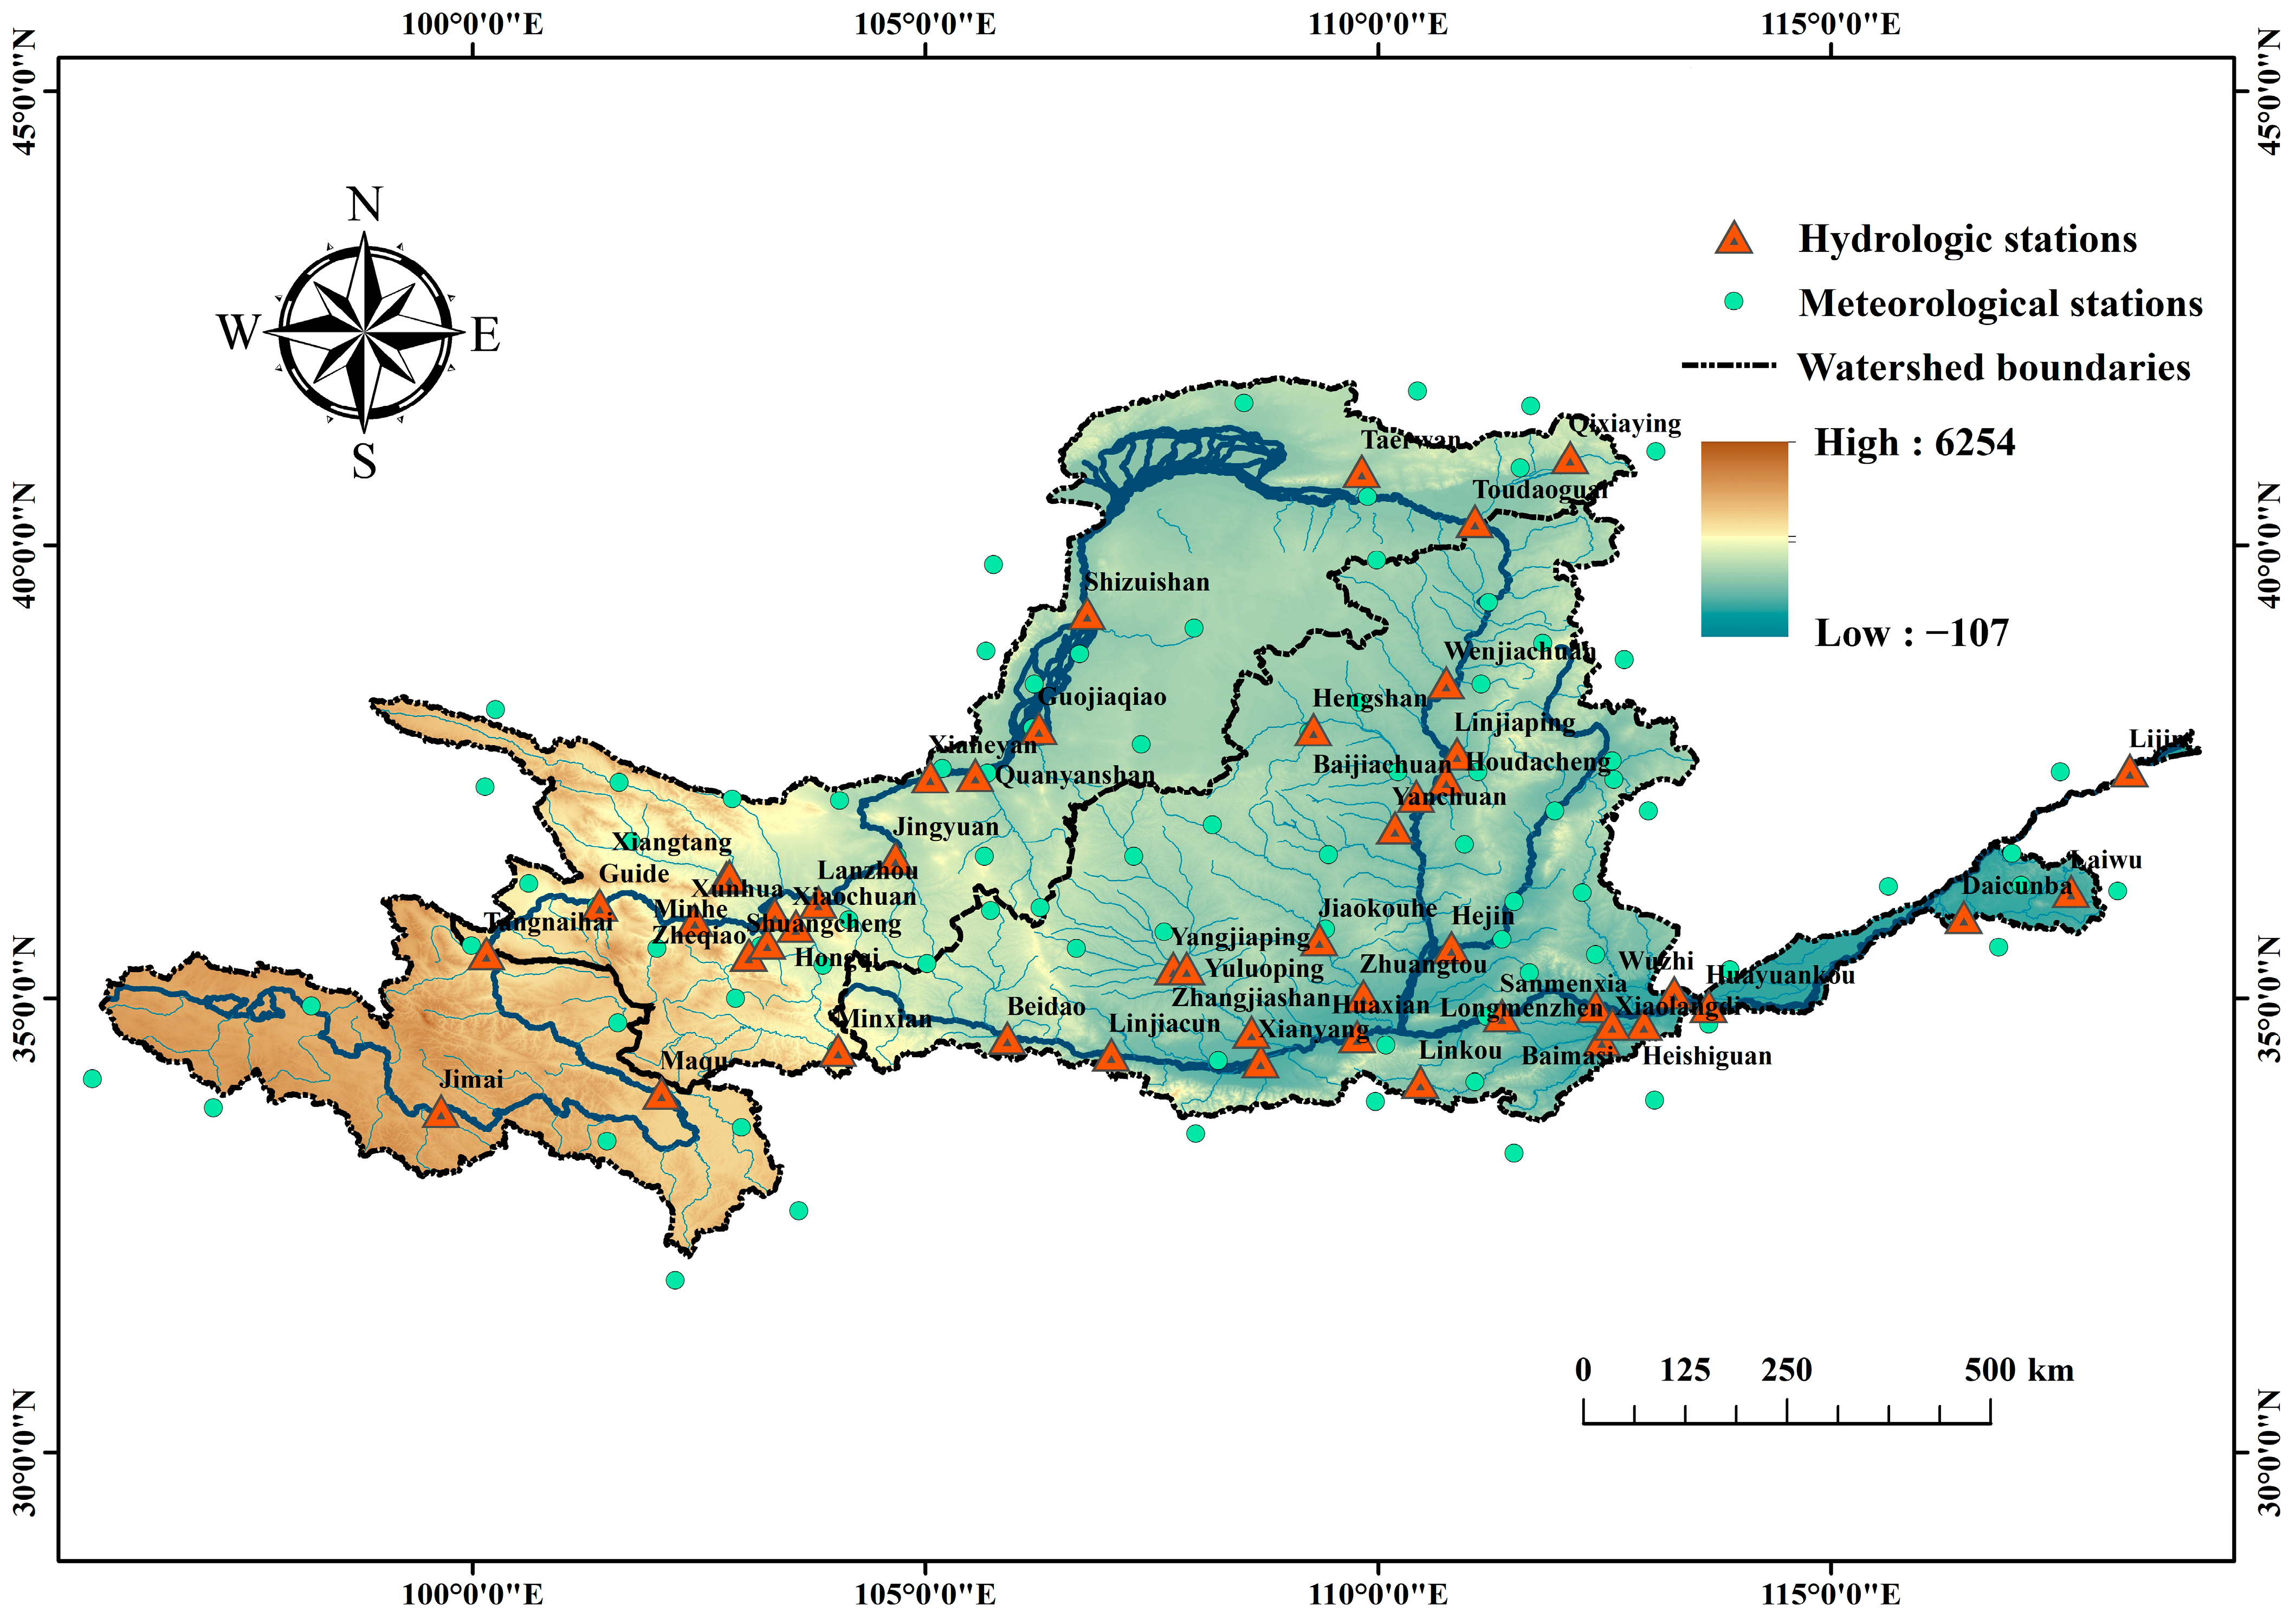
The Yellow River Basin originates from the Bayan Har Mountains of the Qinghai-Tibet Plateau, with a basin area of 79.5 × 10⁴ km2 and a main stream of 5464 km in length. As shown in Figure 1, a well-developed water system exists in this basin. The average annual precipitation is about 450 mm, and 70% of that is concentrated in June–October. The water resource of the Yellow River basin is less than 7% of that of the Yangtze River. The per capita occupancy is only 27% of the national average level, but the utilization ratio of water resources is as high as 80%. The Yellow River Basin is also a major energy and grain production region in China [34,35,36]. However, increasing human activity has led to a very prominent contradiction between supply and demand of water in the basin. Moreover, the differences in hydrological and climatic elements and their change are significant, which lead to great differences in the runoff regime across the basin in terms of time and space. Consequently, 48 control sections were selected in the main stream and 21 major tributaries for comparative analysis of hydrological changes. The basins above Tangnaihai, Toudaoguai and Huayuankou were considered as the source, upper and middle reaches of the Yellow River, respectively. The Lijin section was chosen as the outlet section of the entire catchment. The annual runoff data of each section from 1956 to 2017 were sourced from the Yellow River Basin Hydrological Yearbook [37]. Moreover, the data of 87 meteorological stations in the study area and surrounding areas were from the National Meteorological Center of the China Meteorological Administration, including precipitation, humidity, wind speed, sunshine hours, and daily temperatures. Based on these meteorological data, the potential evapotranspiration from 1956 to 2017 across the Yellow River Basin was determined through the Penman-Monteith equation recommended by the Agriculture Organization of the United Nations (FAO) [38].
2.2. Methodology
2.2.1. Analysis of Intra-Annual Concentration of Hydrological Variables
Concentration degree (Cd), proposed by Zhang and Qian (2003), is an important index to measure the annual concentration of hydrological variables [39]. The directions represent the angles assigned to each month in 30° increments, all of which include one circle (360°) for one year (Table 1). The procedure to calculate the Cd is as follows:
where i is the month in a year (1, 2, 3, …, 12); R(i) is the value of hydrological variable in the ith month in a year; θi is the angle assigned to the month i, °.
The Cd is a value of 0–1. The larger the value, the higher the concentration of hydrological variables during a year.
2.2.2. Detection of Trends and Changing Points
The Mann-Kendall (M-K) test method was used to judge whether the hydrological data series has an upward or downward trend, and identify the time when the series has an abrupt change [40]. It is calculated as the following formula:
where S is the M-K test statistic variables; n is the number of detected data series; xk and xj are the data values in time series k and j, respectively.
where n is the length of the data set; tp is width of each unit.
The test Z is used as a measure of trend significance. Positive values of Z denote increasing trends while negative Z values denote decreasing trends. For the given significance level 5%, if is greater than 1.96, a significant trend exists in the time series.
The normalized statistic UFk is estimated as follows:
where UFk is calculated using a positive sequence, and UBk is calculated using the same equation for a reverse data sequence. A positive UFk indicates an upward trend, while a negative UFk indicates a downward trend. An intersection of UFk and UBk that lies within the confidence interval indicates the mutation point.
2.2.3. Nonparametric Estimator of Climate Elasticity
The non-parametric climate elasticity method, proposed by Schaake [41], can directly use long-term meteorological and hydrological measured data to calculate the response of the runoff process to climate change [42]. The calculation formula is as follows:
where is the coefficient of elasticity of the climate element, dimensionless; is the correlation coefficient between meteorological elements (rainfall or potential evapotranspiration in this article) and runoff, and are the variation coefficients of meteorological elements (rainfall or potential evapotranspiration) and runoff respectively.
2.2.4. Attribution of Climate Change and Human Activity on the Runoff
All the factors that affect runoff changes can be attributed to two categories: human activity and climate change, as shown in the following formula:
where is the entire change in runoff; and represent the change in runoff caused by climate change and human activity, respectively.
The entire runoff change is determined as:
where and are the measured mean annual runoff depth before and after the mutation point, respectively.
Precipitation (P) and potential evapotranspiration (E0) are the main climatic conditions that affect runoff changes [43,44], and the relationship can be calculated as [26]:
where and are the precipitation and potential evapotranspiration elasticities of runoff. Here, and are the average changes of precipitation and potential evaporation before and after the mutation point, as follows:
where and are the average annual precipitation before and after the mutation point respectively, as are , and .
3. Results
3.1. Trend Detection of Runoff Regime
3.1.1. Annual Variation of Runoff
The statistical Z value and change rate of annual runoff during the period 1956–2017 in each control section was determined, as shown in Table 2 and Figure 2. From 1956 to 2017, the annual runoff of the main and tributary streams of the Yellow River Basin generally showed a decreasing trend, as shown in Table 2. The whole basin (above Lijin) had a significant decrease trend in annual runoff depth with −8.25 mm/10a, which passed the confidence level of 0.01. In recent years, the annual inflow of the river into the sea is less than 10 billion that has caused serious damage to wetland ecosystem in the Yellow River Delta. According to the calculation of academician Ni Jinren, the minimum annual runoff to ensure the ecological health of the estuary is between 25.42 billion and 29.35 billion m3. Therefore, the lower reaches of the Yellow River may be at risk of “functional cutoff” [45]. Among the 14 main stream sections from Jimai to Lijin, only the Jimai section showed an insignificant increase in annual runoff, while the other sections showed a downward trend. The statistical Z value of the main stream reached a significant positive correlation with the distance from the estuary, and the Pearson coefficient reached 0.99. Furthermore, annual runoff decreased significantly in 32 out of 34 tributary sections, especially in the middle and lower reaches of the Yellow River. Only the Quanyanshan section of the Qingshuihe River and the Guojiaqiao section of the Kushuihe River showed an increasing trend of annual runoff. Overall, the runoff reduction in the downstream section was obviously higher than that in the upstream sections. For the sections located in the upstream area (above Toudaoguai), the annual runoff variation ranged from −3.99 mm/10a to −6.05 mm/10a, with a mean value of −4.92 mm/10a. However, the annual runoff variation of the sections in the midstream and downstream area (below Toudaoguai) were between −5.88 mm/10a to −8.25 mm/10a, and the average value was −6.79 mm/10a.
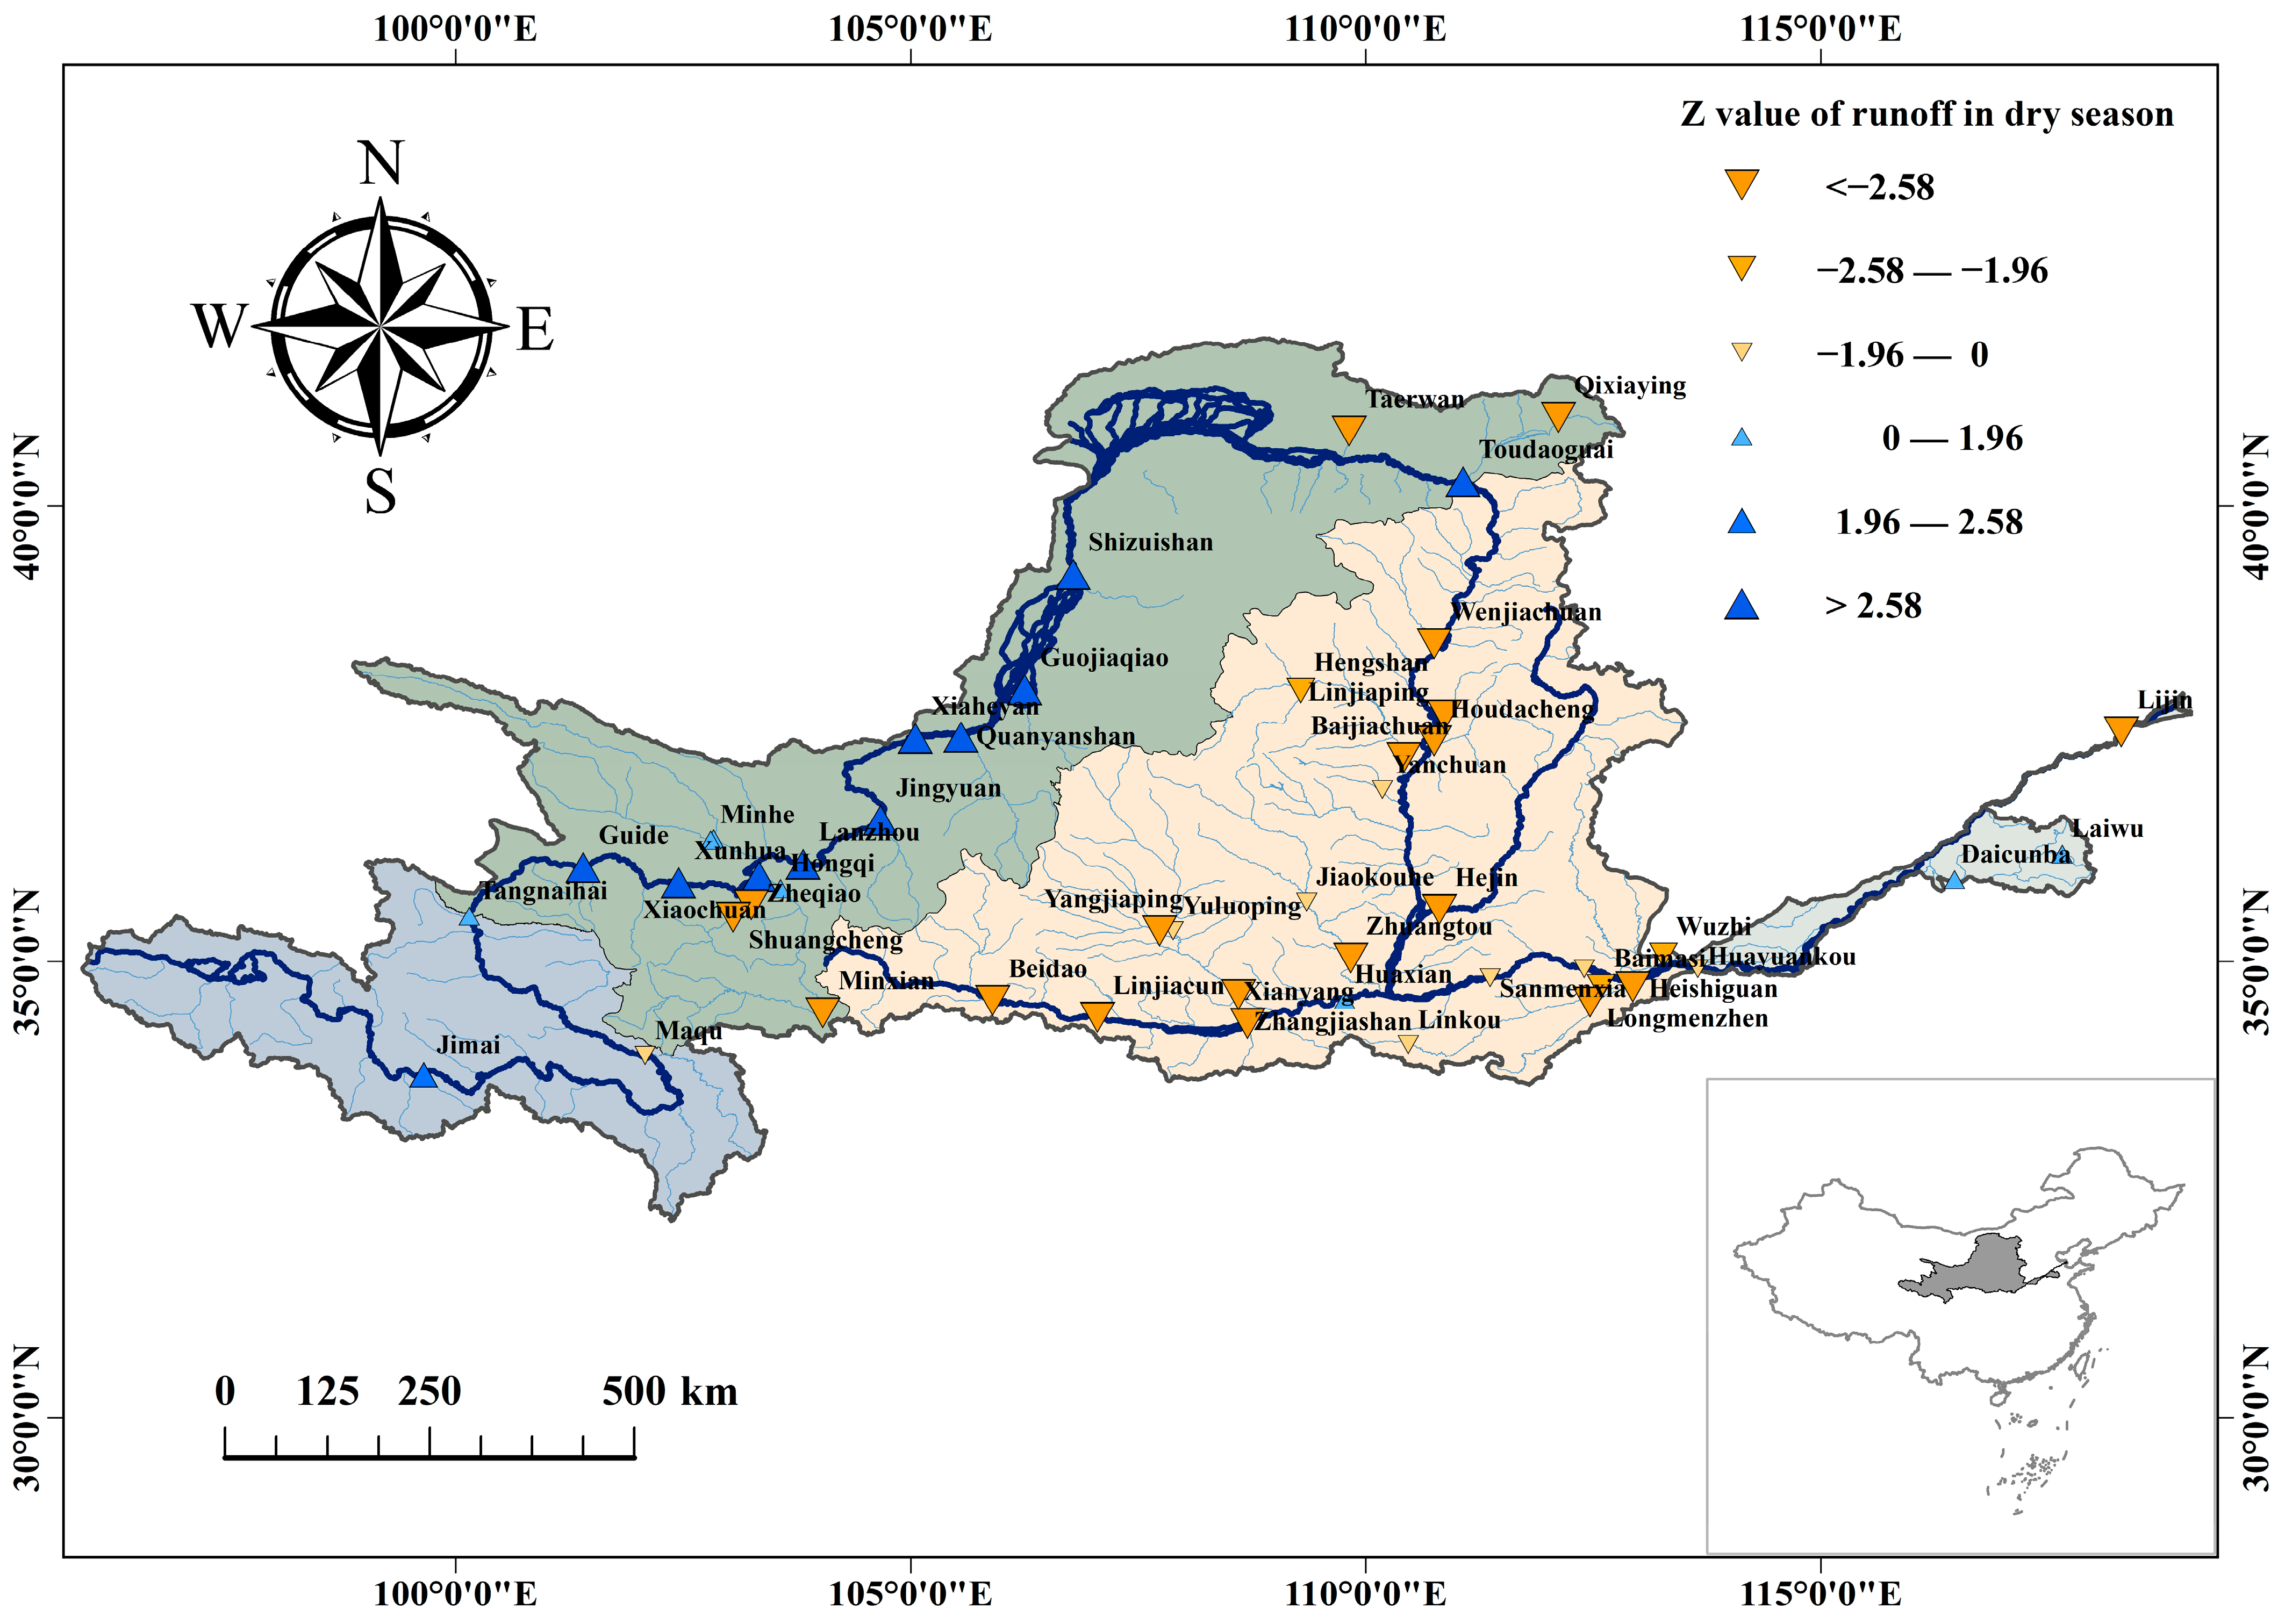
The temporal and spatial changes of dry season runoff and its possible ecological influence were further analyzed considering the important impact of low flow on river ecology. Based on the natural hydrological characteristics of the Yellow River Basin, the measured runoff from December to March of the next year was selected as the runoff of the Yellow River Basin during the dry season. The results are shown in Table 3 and Figure 3. It can be seen that the runoff during the dry season in the upper reaches of the Yellow River has a significant increase, especially in the main stream sections. The eight main stream sections in the upstream, with the exception of Maqu, increased significantly in the dry season runoff. This may be caused by two aspects, one being the intensification of glacial meltwater, the other the regulatory influence of the reservoirs. However, the dry season runoff in the middle and lower reaches (below Toudaoguai) exhibited a decreasing trend, and this trend was significant in most sections. As the estuary section, the Lijin section had the highest decreasing rate of the dry season runoff among all mainstream river sections, and the Z value reached −5.06. Obviously, this change posed a serious challenge to the water demand of the Yellow River Delta wetlands [46].
3.1.2. Intra-Annual Concentration of Runoff
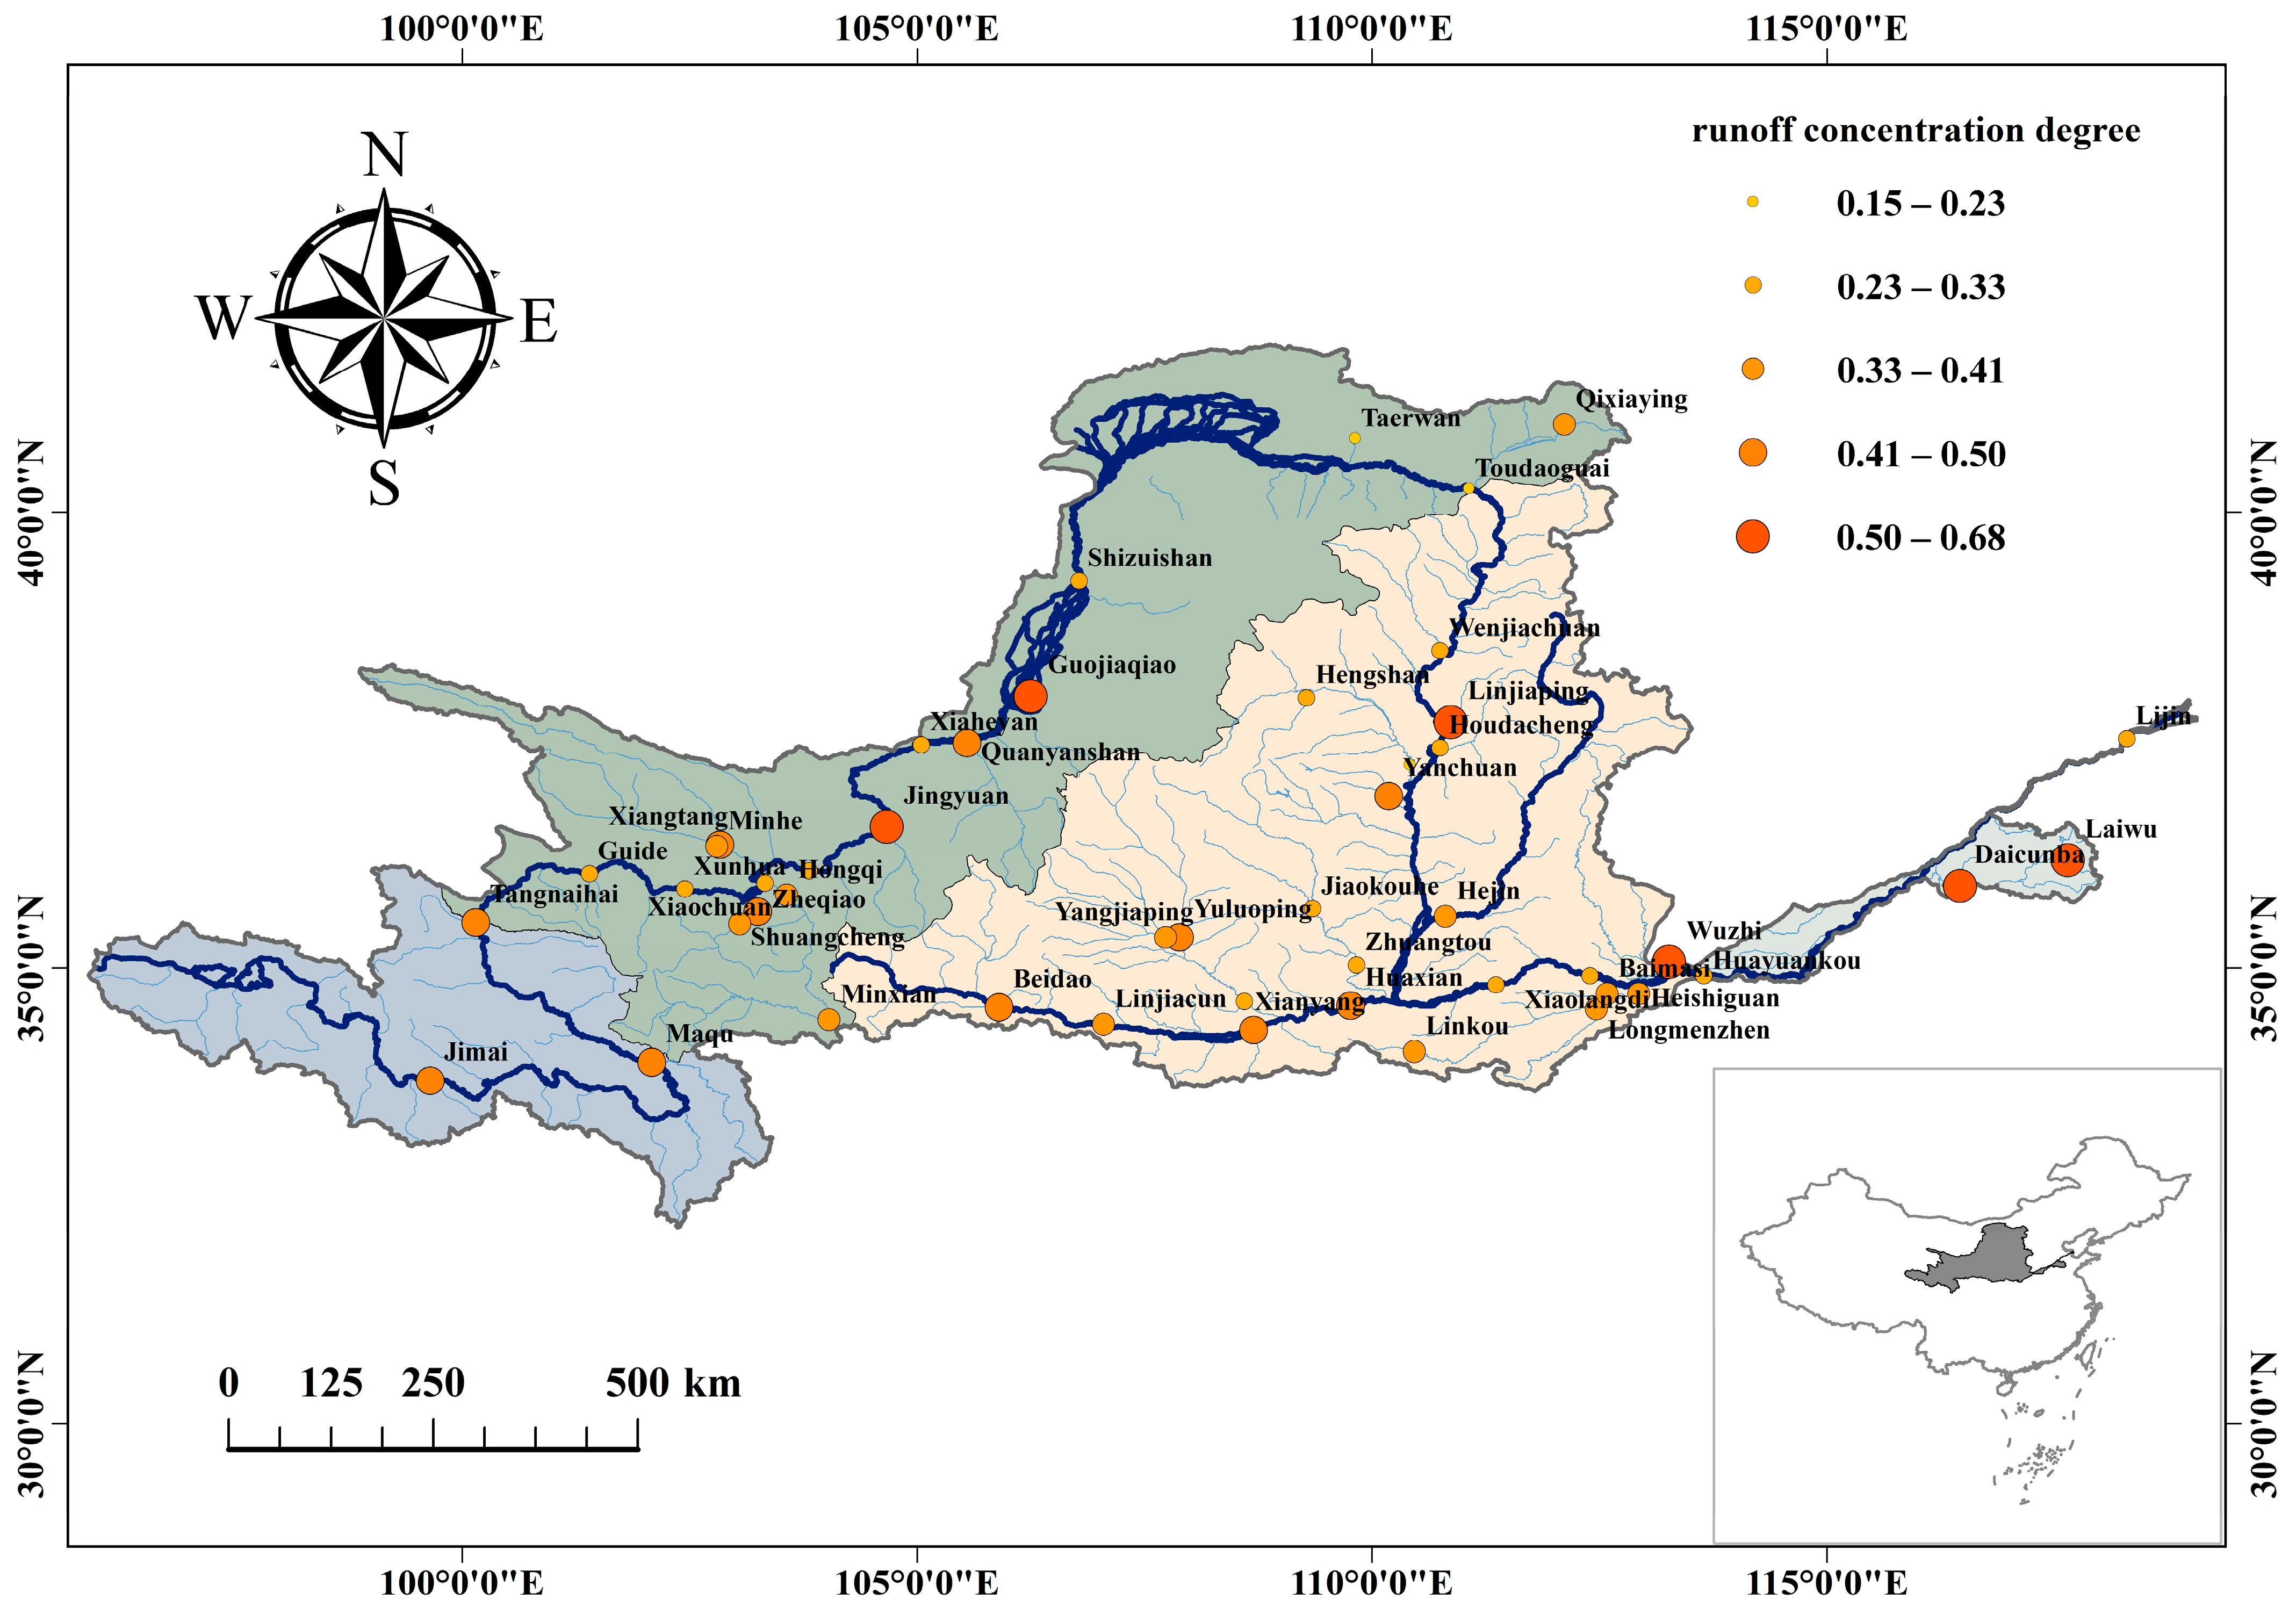
The concentration degree of annual runoff (RCD) in the 48 main stream and tributary sections were calculated, as shown in Table 4 and Figure 4. For the main stream sections, the concentration degree varied between 0.22 and 0.47. Interestingly, the concentration of annual runoff in the Yellow River source area was the highest of all regions. The runoff concentration of the Jimai, Maqu and Tangnaihai sections was 0.47, 0.46 and 0.45, respectively. However, the RCD values in the middle and lower reaches were generally around 0.3. According to the above analysis, the runoff in the source sections was replenished by glacier melting during dry season, which contributed to the uniformity of runoff distribution. However, hundreds of large hydraulic hubs have been built in the main stream since the Tangnaihai section, which played a greater role in regulating the natural runoff process. As a result, there was little difference in the runoff concentration of the middle and lower reaches, and the runoff distribution was relatively uniform throughout the year.
Focusing on the tributary sections, the RCD values varied significantly among different rivers, ranging from 0.15 to 0.68. Among these major tributaries, the runoff process of the Dawenhe River, Fenhe River, Kushuihe River, Qinhe River, Qiushuihe River, and Zuli River was the most concentrated in the year, with an average RCD of around 0.6. The Wudinghe River and Kundulunhe River had the most even distribution of annual runoff during the year, as the average value of RCD was less than 0.3. However, for different sections of the same tributary, there was little change in the RCD value, such as the Beidao, Huaxian and Xianyang sections of the Weihe River, the Baimasi and Lingkou sections of the Luohe River, and the Hongqi and Minxian sections of the Taohe River.
From changes of the runoff concentration in the past 60 years, the runoff tended to be uniform in most sections, especially in the main stream sections. Based on the above studies, the direct cause of this phenomenon may be the decrease in annual runoff and the increase in the dry season runoff for the upstream sections. Although both the dry season runoff and annual runoff in the middle and lower reaches decreased, the decreasing trend of the former was weaker than that of the latter. Consequently, the annual distribution in the middle and lower reaches tended to be even, but the trend was not significant. Moreover, the trend in the tributary sections was more significant than that in main stream sections. This may be because tributary runoff processes are more sensitive to climate change and human activity than the main stream ones.
3.2. Climate Elasticity Coefficient of the Annual Runoff
First, the joint M-K test and t-test were used to test the mutation points of the annual runoff series for 48 cross-sections during the period 1956–2017. Then, precipitation elasticity coefficients (εP) and potential evapotranspiration elasticity coefficients (εE) were calculated for the Yellow River basin. The results are presented in Table 5, Figure 5 and Figure 6. Observing the changes in annual runoff of the Lijin section, the runoff depth in the basin rapidly reduced from 64.71 mm to 11.91 mm during the period 1956–2017, and changed abruptly in 1981. The decrease of runoff gradually intensified, and the cut-off phenomenon was particularly serious in the 1990s. Among the 14 main stream sections, the abrupt change of runoff in the Lijin section was the earliest. As an estuary section, the change of runoff in the Lijin section was the most rapid response to the two major influencing factors in the basin. Correspondingly, the Jimai, Maqu, and Tangnaihai sections, situated in the source area, had the latest runoff abrupt changes, which occurred in 1998, 1994, and 1994, respectively. This may be because human activity had little influence on the source area before the 1990s and caused the abrupt change of runoff later. For the main stream sections in middle and lower reaches, the abrupt changes of annual runoff occurred mainly from 1987 to 1990. Not surprisingly, the times of abrupt changes in runoff in tributary sections varied greatly, even for different sections of the same tributary. The earliest abrupt changes in section runoff were from the 1960s to the 1970s, including the Huangshui River and Kushuihe River in the upper reaches, and the Fenhe River, Yiluohe River and Qinhe River in the middle and lower reaches. However, the abrupt change of runoff occurred after 2000 in some sections, such as Taerwan, Hengshan and Yanchuan.
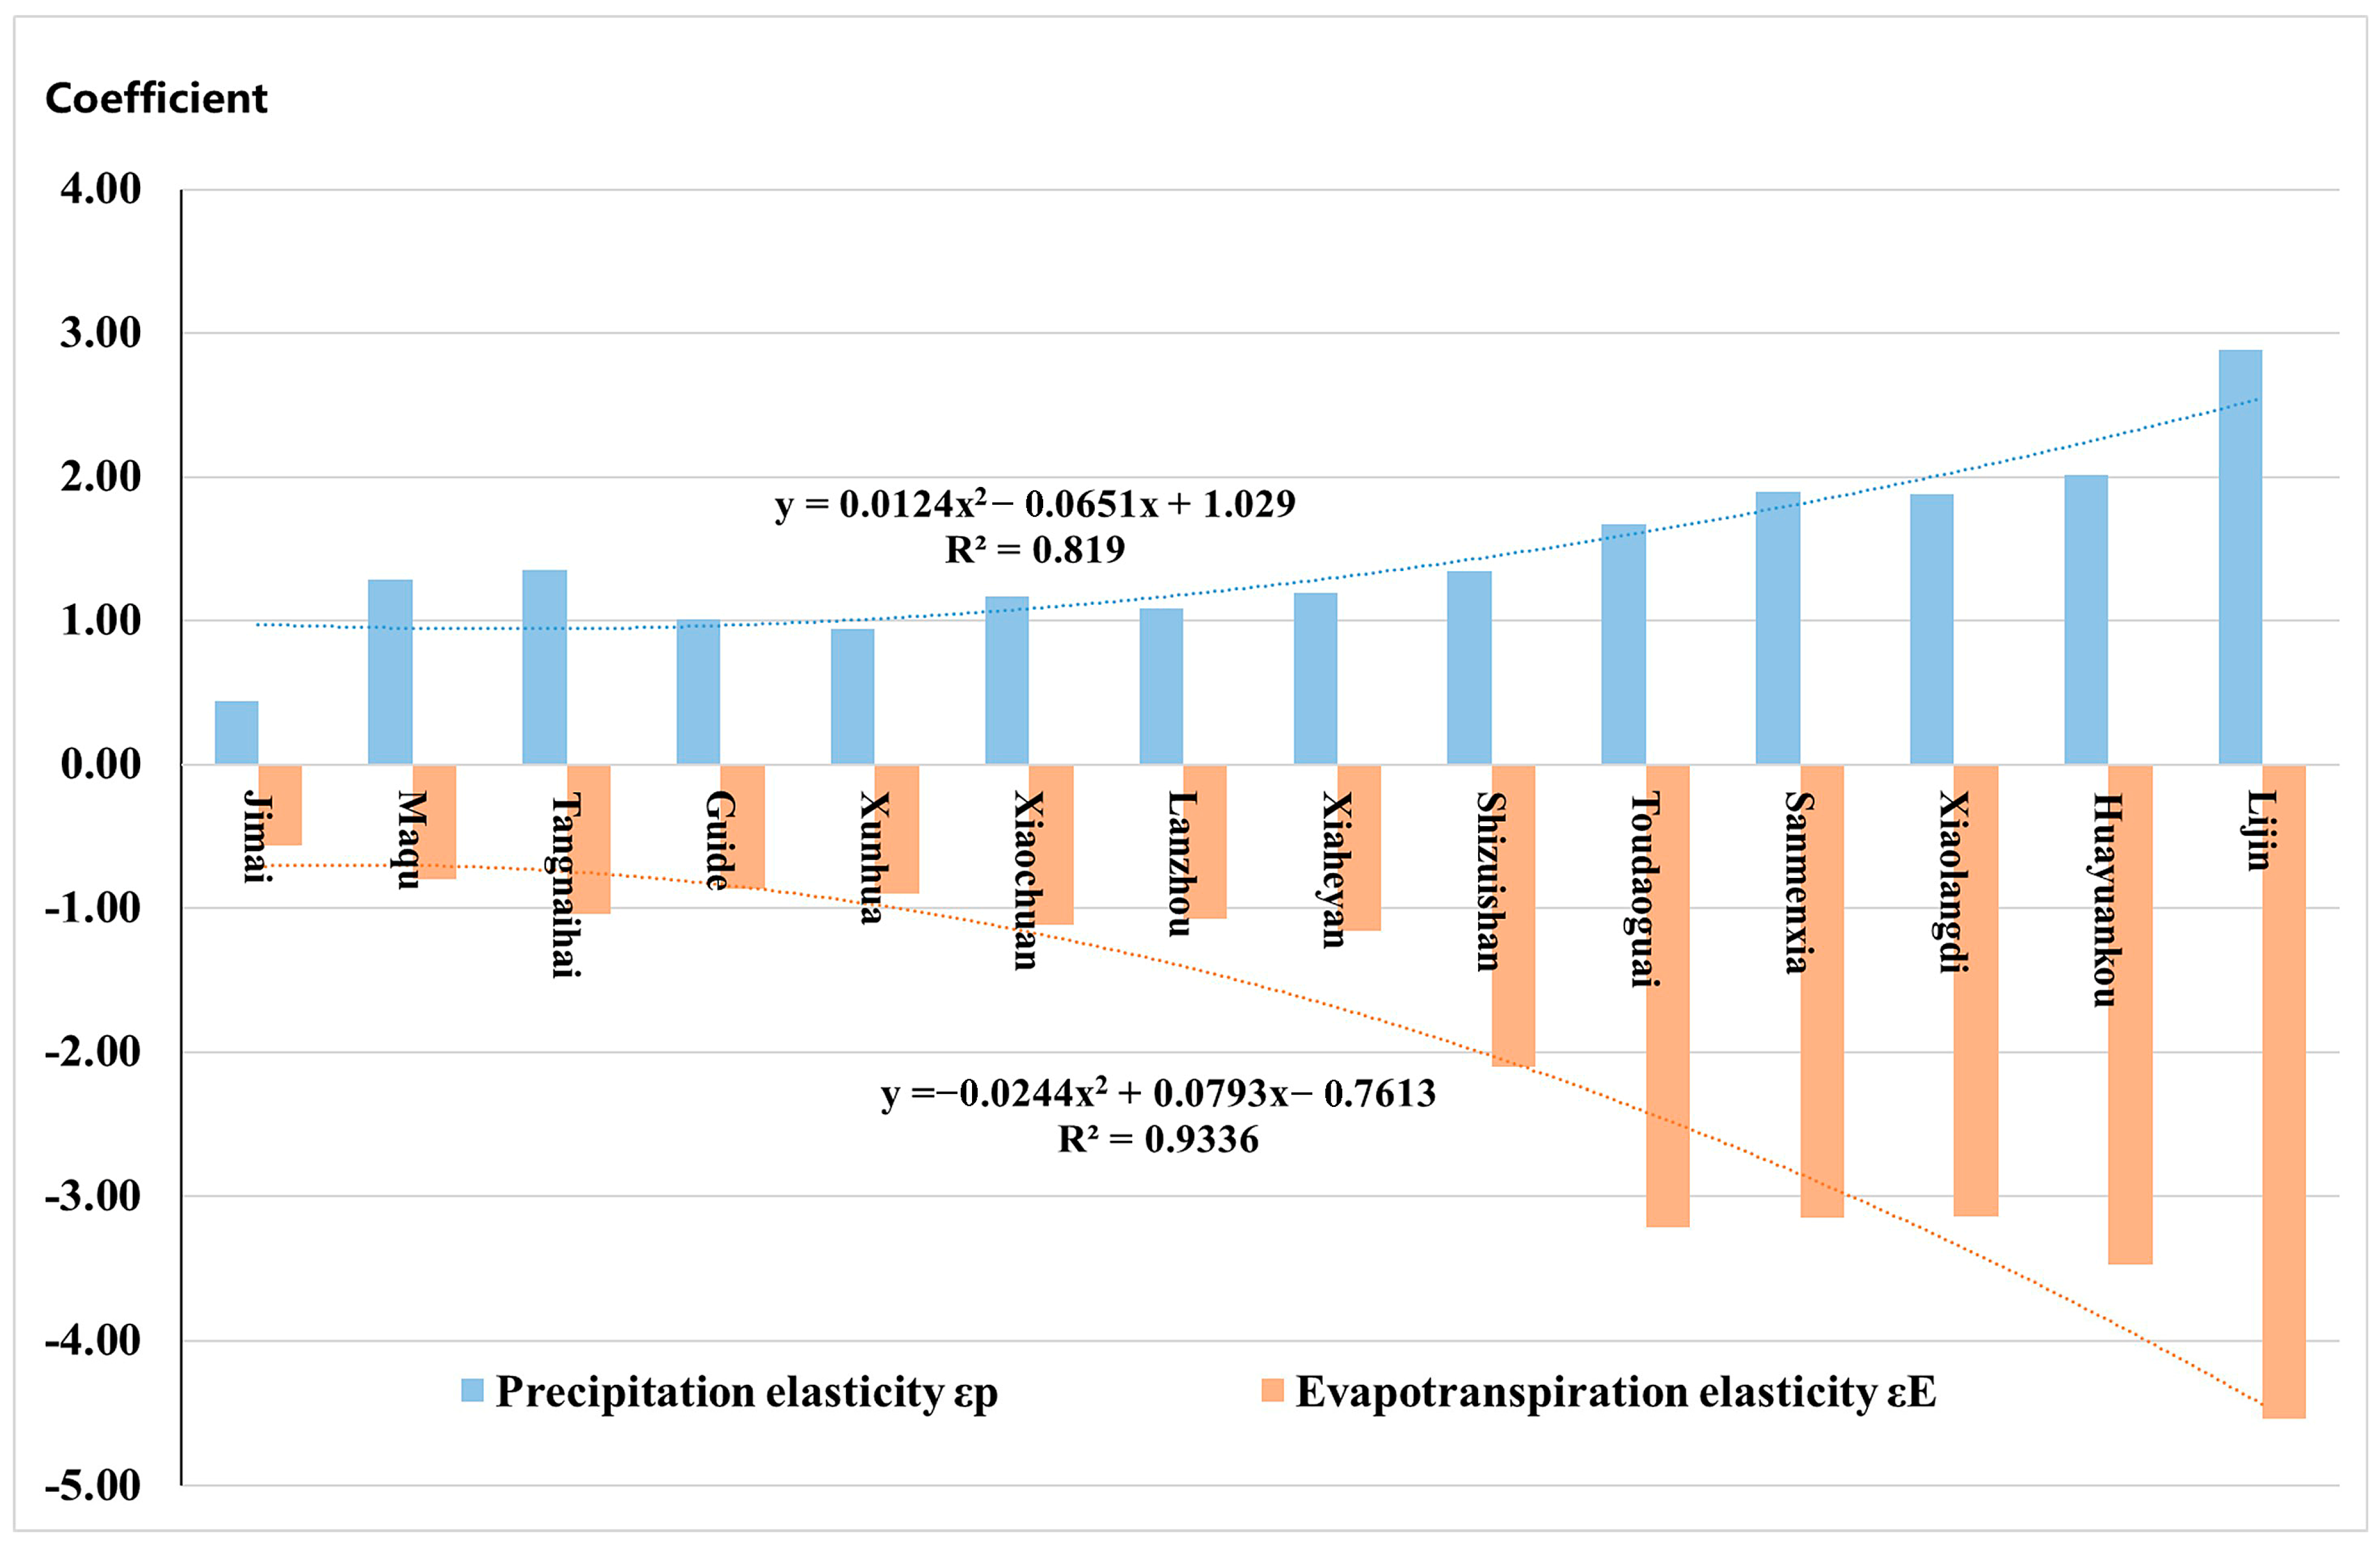
Focusing on the whole basin above the Lijin section, the precipitation elasticity coefficient εP and the potential evapotranspiration elasticity coefficient εE were 2.88 and −4.54, respectively. This indicates that a 10% increase in precipitation leads to a 28.8% increase in runoff and a 10% increase in potential evapotranspiration leads to a 45.4% decrease in runoff. From the perspective of the main stream sections of the Yellow River, the changes of εP and εE in each basin above the selected section were shown in Figure 5. It can be seen that as the sections move from upstream to downstream, the value of εP had an increasing trend and the value of εE gradually decreased. The εP and εE values in the upper reach (above Toudaoguai) were 1.67 and −3.22, respectively, while the values in the middle reach (above Huayuankou) were 2.01 and −3.48, respectively. In general, in the Yellow River basin, the sensitivity of runoff to precipitation and potential evapotranspiration increases gradually as the basin area increases.
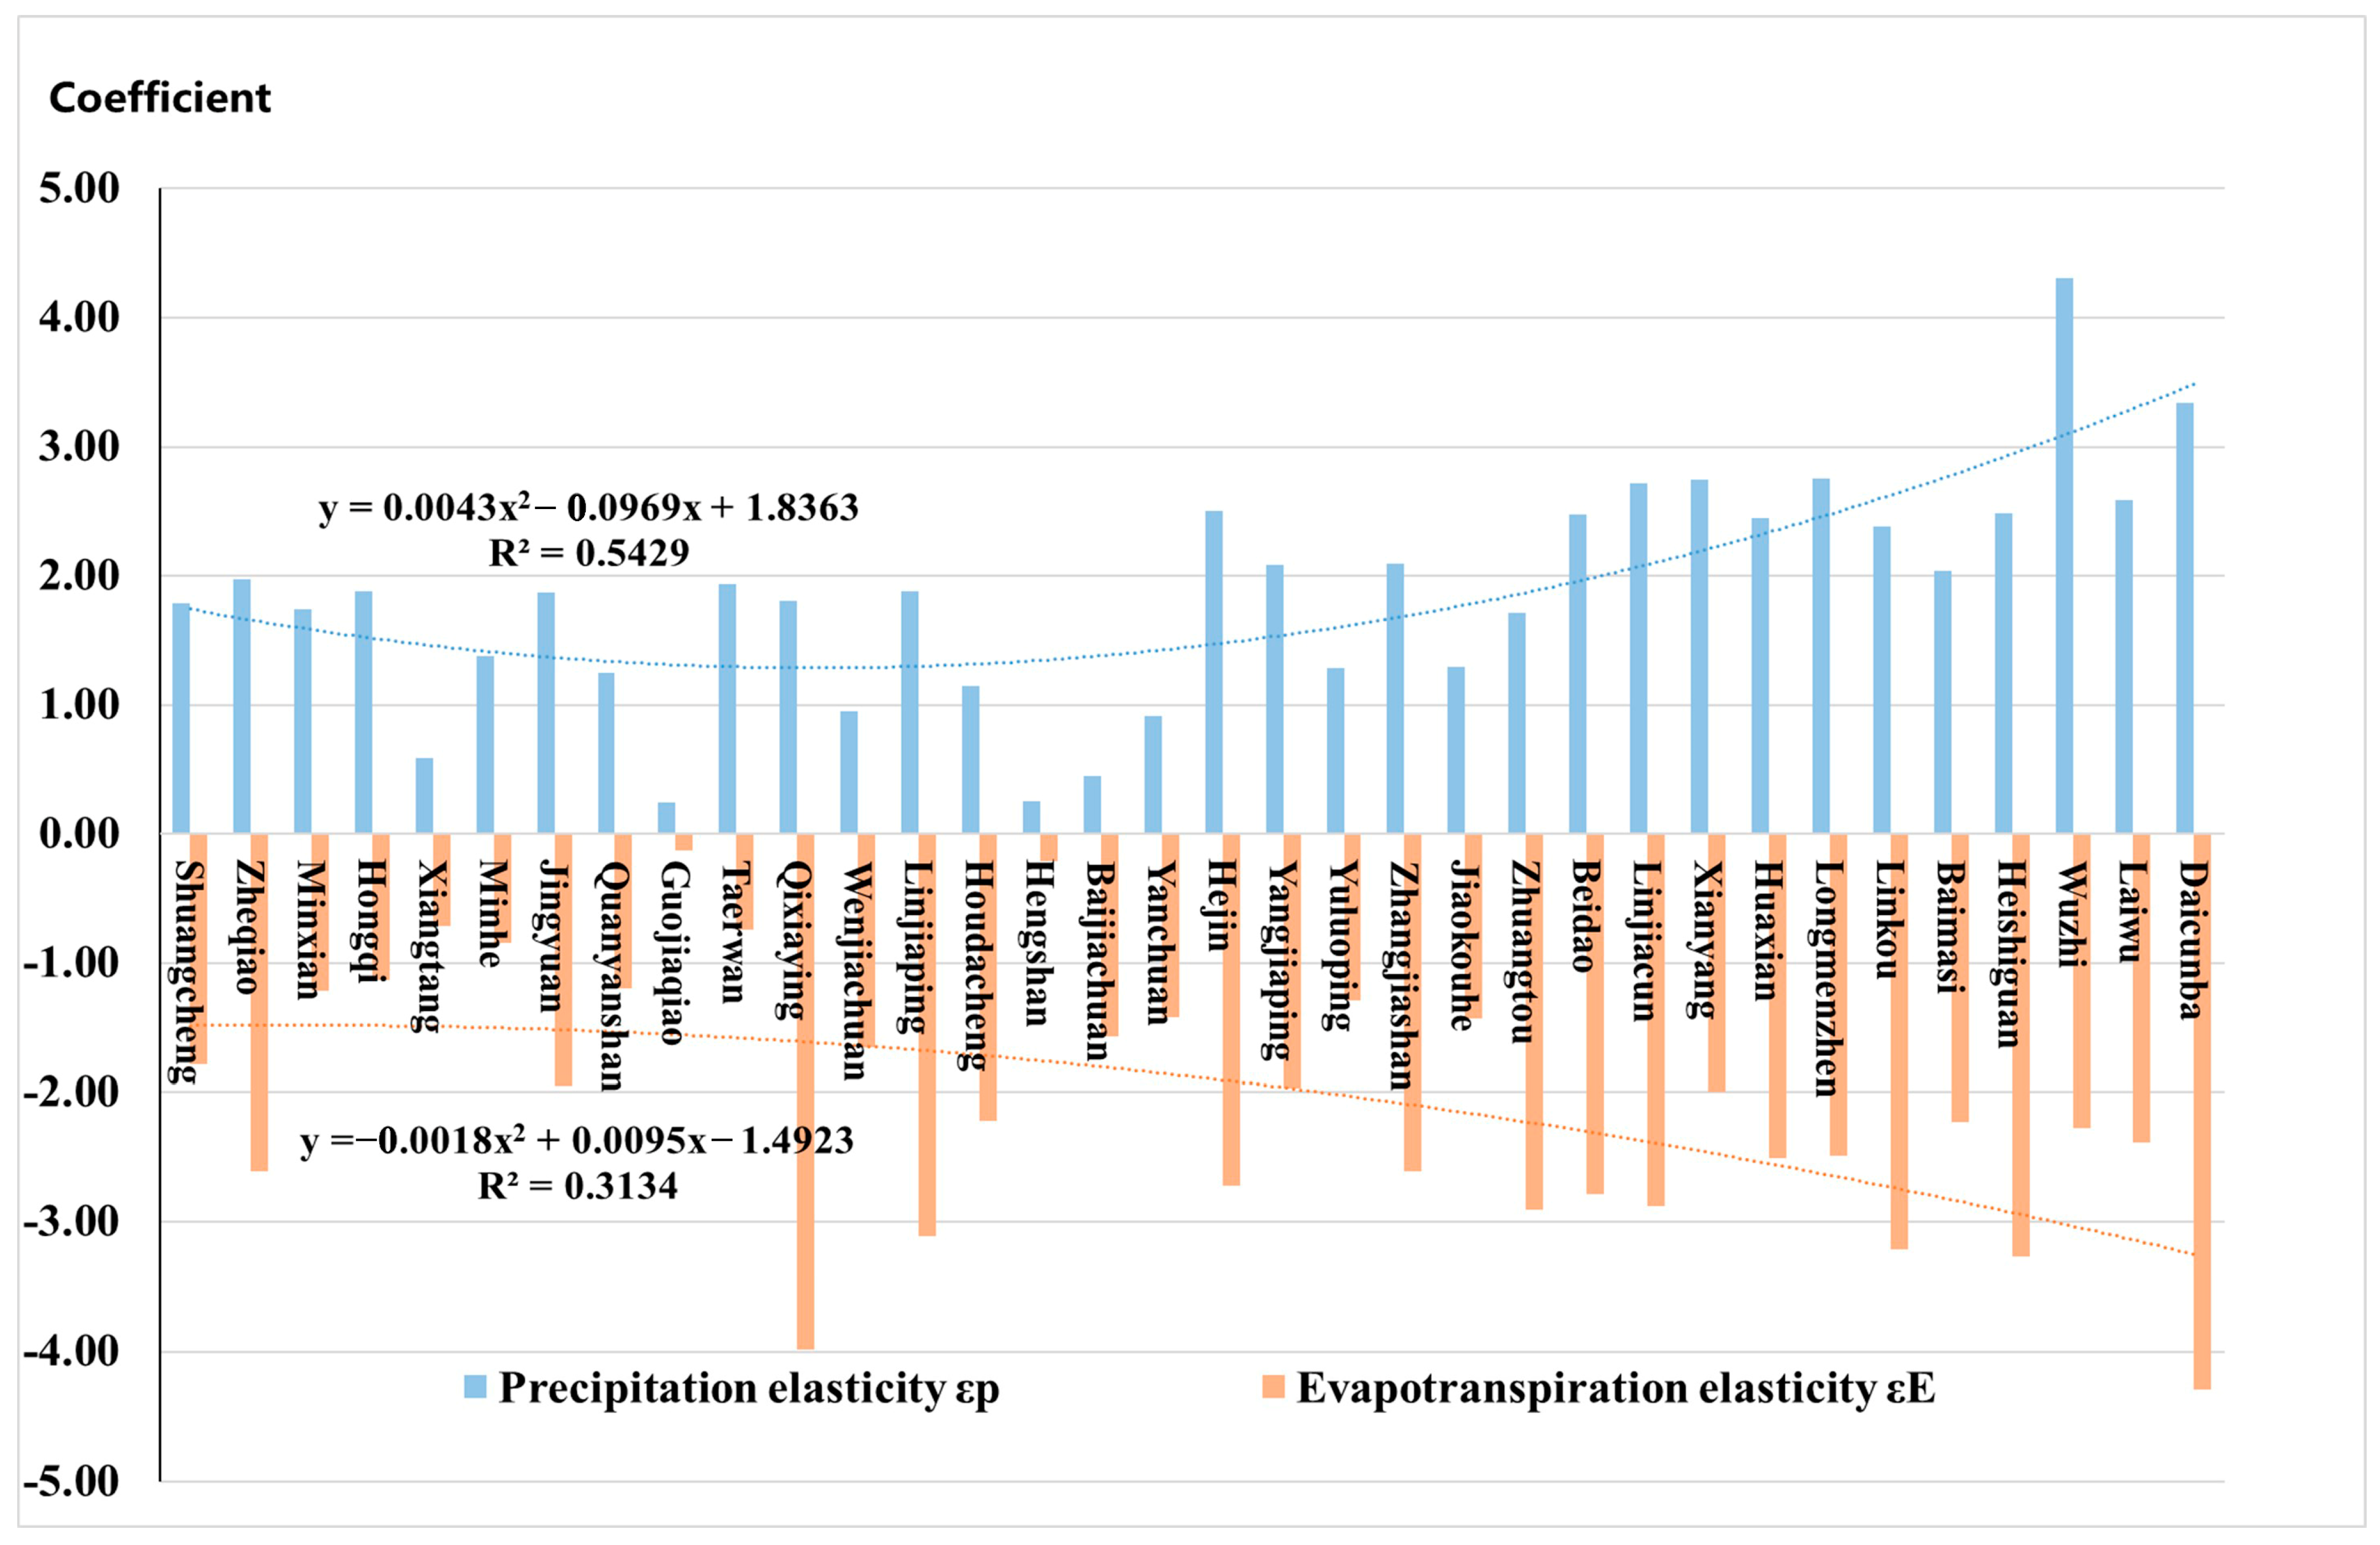
From the perspective of the major tributaries, the changes of values of εP and εE were shown in Figure 6 and Table 5. On the whole, the εP in the upstream tributaries was the smallest, followed by the middle stream tributaries, and the downstream tributaries had the largest value. The average values in the upstream, middle and downstream tributaries were 1.47, 1.94, and 2.96, respectively. The spatial variation of εE was contrary to that of εP, as the average value in the upper, middle and lower tributaries were −1.23, −2.31, and −3.34, respectively. This change characteristics were roughly consistent with that in the main stream sections. However, the εP and εE had stronger spatial heterogeneity in the tributary sections than in the main stream sections. The maximum value of εP reached 4.31, which occurred in the Qinhe River Basin (above Wuzhi), while the minimum value was only 0.25 in the Kushuihe River Basin (above Guojiaqiao). For the elastic coefficient of potential evapotranspiration, the maximum and minimum values were −0.13 and −4.29, which occurred in the Kushuihe River basin (above Guojiaqiao) and Dawenhe River basin (above Daicunba), respectively.
In summary, from the standpoint of spatial distribution, the runoff in the upper reaches of the Yellow River had a more limited response to climate change, while in the middle and lower reaches of the Yellow River, as the water used for human activity continues to increase, the influence of precipitation and potential evapotranspiration on runoff was gradually weakened. The absolute values of both εP and εE reach their maximum values in the lower reaches of the Yellow River. As a result, the influence of human activity on the runoff of the Yellow River from upstream to downstream was gradually increasing.
3.3. Attribution Analysis of Runoff Change
For the river sections with little change in annual runoff, attribution analysis of runoff change is of little significance. Therefore, this paper focused on the 38 sections in the Yellow River basin with large runoff changes, which have been identified in the Table 2. Based on the elasticity coefficient method, the contributions of climate change and human activity to the change of annual runoff across the Yellow River Basin were quantified, as shown in Table 6 and Figure 7. For the whole basin, climate change and human activity contributed 13% and 87% to runoff change, respectively. This result indicated that both of these influences play a role in reducing annual runoff of the Yellow River, but human activity is the major factor. Focusing on the whole basin, precipitation and potential evapotranspiration did not increase or decrease significantly in the past 60 years (1956–2017), as their statistical Z-values were −1.16 and 1.34, respectively. However, climate change and human activity mainly characterized by water consumption, afforestation, and reservoir construction had strong spatial heterogeneity across the Yellow River Basin. This caused a complex spatial difference on the contributions of the two factors to annual runoff variability. In the upper reaches of the basin (above Toudaoguai), human activity contributed more to runoff increase or reduction than climate change, as the values of ΔQC and ΔQH were 33.3% and 66.7%, respectively. When the focus area was extended to the upper and middle reaches (above Huayuankou), the contribution of human activity had further increased, contributing 69% of the runoff decrease.
The annual runoff of 31 tributary sections has obvious changes, of which 29 sections had decreasing runoff, and only the runoff in the Guojiaqiao sections showed an increasing trend. Overall, the runoff change in the 16 sections was dominated by human activity, with a contribution rate of 53% to 144.5%. The annual runoff of the remaining 15 sections has shown a significant reduction under the dominance of climate change, and the contribution rate was between 66.4% and 128.2%. Among the main upstream tributaries, the runoff of the Daxiahe River, Taohe River, and Zulihe River was dominated by climate change, while human activity was the leading factor in the Datonghe River, Kushuihe River and Kundulunhe River. For the tributaries in the middle reaches of the Yellow River, both factors have played a role in reducing runoff. The Weihe River and Fenhe River, located in the middle reaches, are the first and second largest tributaries of the Yellow River. The annual runoff decline in these two rivers was mainly caused by human activity, as the contribution rates were 58.3% and 68%, respectively. Furthermore, the dominant role of human activity on runoff was significant in the Yiluohe, Wudinghe, Luohe, Qingjianhe, Kuyehe, and Beiluohe rivers. On the contrary, in the Jinghe, Daheihe, Malianhe, Qinhe, Qiushuihe and Shachuanhe rivers, the decrease in runoff was mainly due to climate change, with a contribution rate of 66.4% to 94.3%. In comparison, these river basins were relatively small and mainly located in mountainous areas, where human activity was weak.
4. Discussion
4.1. Rationality of the Results of Attribution Analysis on Runoff Change
In order to improve the accuracy of attribution analysis, the M–K test and the sliding t-test were used to identify the year when the runoff had abrupt changes. In this paper, human activity mainly characterized by water consumption, afforestation, and reservoir construction is a major influencing factor in runoff changes in the Yellow River Basin, accounting for approximately 87% of the total, which is roughly the same as the previous study. As listed in Table 7, the major driving factor for the decrease in runoff of the Yellow River and its main tributaries, such as the Weihe, Fenhe, Wudinghe and Qinhe rivers, is consistent with as those in this research, although the contribution rates have slight differences. The differences may be caused by the selection of the runoff data series and the attribution analysis methods. The results for the Weihe river were somewhat different from those of Chang et al., which showed the runoff in the river decreased significantly, and climate change and human activity contributed 28% and 72% to runoff, respectively [47], while in this study, the two contributions were 41.7% and 58.3%, respectively. That may mainly be caused by the inconsistent selection of climate parameters. Meanwhile, each of the previous studies has their own different hydrometeorological stations, research periods and research methods. Consequently, the research results are reasonable and can provide important reference for ecological conservation and the high-quality development of the Yellow River Basin.
In comparison to the results of earlier studies, the results of attribution analysis of runoff change using the elastic coefficient method in this paper are reliable. However, the elastic coefficient method does not take into account the replenishment of glacial melt water to runoff under climate change. It has relatively poor adaptability in cold regions and has relatively few considerations. Therefore, it fails to fully separate climate change factors from human activity. Meanwhile, in order to verify the results of this study, other attribution analysis methods should be used to further quantify and analyze the impact of the two main influencing factors on the runoff changes.
4.2. Spatial Heterogeneity of Runoff Change
To better understand the spatial heterogeneity of runoff changes across the Yellow River Basin, a deep understanding of climate and human activity characteristics in different tributaries of the upper, middle and lower reaches of the river is needed. The source area is located on the Qinghai-Tibet Plateau, which belongs to the sub-frigid semi-humid area. Because activity is minimal in this area, the runoff change is majorly affected by the precipitation and the meltwater from glaciers, such as the basin above the Jimai section [50]. Except for the source area, the upper reaches mainly straddle the plateau’s temperate zone and the mid-temperate zone. The Datonghe, Huangshuihe, Daxiahe and Taohe rivers are the four important branches of the upper reaches of the Yellow River. All four tributaries are in the temperate zone of the plateau, but runoff changes and their causes in these basins are significantly different. The irrigation area of the Huangshuihe River basin is more concentrated, and the contradiction between water supply and water demand is more prominent. Consequently, a significant decrease in runoff has occurred. The Datonghe River is adjacent to the Huangshui River. With the continuous advancement of the Datonghe-to-Huangshuihe water diversion transfer project in the early 21st century, the annual runoff of the Datonghe River has a decreasing trend [51]. The Taohe River and Daxiahe River, located on the southeastern edge of the Qinghai-Tibet Plateau, have a relatively low level of economic development and limited population. Therefore, changes in annual runoff are mainly affected by climate change [52]. The Zulihe River is also known as the “Bitter River”, because the land in the basin is severely salinized and the water quality is poor, which hinders utilization of its water resources [53]. The local government is committed to improving water use by water transfer outside the basin, which has a greater impact on the surface water. Moreover, the reservoirs, such as the Longyangxia and Liujiaxia reservoirs, play a crucial role in regulating the annual runoff process [54]. This has caused an increasing trend in runoff in the upper Yellow River during the dry season.
Most of the middle reaches of the Yellow River are located on the Loess Plateau, which is the main sand-producing area in the basin. In order to reduce soil and water losses and improve the local natural environment, the Weihe River Basin and the Fenhe River Basin have adopted a series of water and soil conservation measures such as returning farmland to forests and grassland and building terraces, which not only improves the environment, but also reduces water and sand production [55,56,57]. From the perspective of climate change, the decline of precipitation in the Weihe River Basin is more obvious than that of other tributaries. The Kuyehe, Wudinghe, Qingjianhe, and Beiluohe rivers are all located on the right bank of the Yellow River, and their soil erosion is relatively serious. As a result, the afforestation measures have achieved remarkable results, and human activity becomes the major driving factor of runoff reduction [57]. Due to the more concentrated irrigation areas, as well as the combined effects of the construction of diversion canals and soil and water conservation measures, this has led to a reduction in runoff of the Yiluohe River [58]. Unlike other tributaries, the area covered by rocks and hills in the Qinhe River Basin reached 85% [32]. This land condition is not suitable for agricultural development, which caused local water utilization is weak. Therefore, climate change is the major driving factor for reduced runoff in the basin. In summary, in the middle reaches of the Yellow River, as soil and water conservation measures continue to be enhanced in the Loess Plateau, the water and sediment production has dropped significantly, and the contribution of human activity to the reduction in runoff has further increased.
The lower Yellow River flows through the North China Plain, and the course of the river has a small slope and a gentle flow. The riverbank is about 2–5 m above the ground on both banks. Since 2000, Shandong Province has carried out a series of key renovations for water conservancy projects of the Dawenhe River. These measures caused a drop in runoff of the Dawenhe River [29]. In addition, the lower Yellow River has a large irrigation area and extensive irrigation mode, resulting in large water consumption of water resources.
4.3. Adaptive Management of Water Resources
Affected by climate change and rapid social and economic development, the Yellow River basin is facing the prominent challenge of water shortage. Limited and severely reduced water resources fail to support the demands of both humanity and ecology, which restricts the ecological protection and high-quality development of the Yellow River Basin, especially for the middle and lower reaches of the basin. Therefore, it is necessary to consider the characteristics of different regions and put forward corresponding recommendations on water resources adaptive management.
Firstly, water transfer and diversion projects should continue to be promoted in the upper reaches of the Yellow River to address the uneven distribution of water resources and the poor water quality of some tributaries. However, full attention needs to be paid to the influence of water diversion projects on river ecology. Furthermore, the middle reaches of the Yellow River are also a key area for ecological protection. It should be noted that most tributaries located in the Loess Plateau were evolving towards dryness. More precipitation translates into evapotranspiration rather than runoff, which has led to the decrease of water storage in these basins. The reason for this phenomenon may be related to the local excessive afforestation, but the reasonable scale of forest and grass planting needs to be studied further. Some researchers oppose the continued Grain for Green expansion on China’s Loess Plateau, which has led to a continued runoff reduction of the Yellow River [59,60]. Finally, the lower reaches of the Yellow River should rationally allocate the water resources of the river, and explore more innovative governance agreements like the “Yellow River Basin (Yu-Lu Section) Horizontal Ecological Protection Compensation Agreement”. In addition, the basin has many irrigation areas, such as the Huangshui Valley, Ningxia Plain, Hetao Plain, Fenhe Valley, Weihe Plain, North China Plain, etc. The irrigation mode is mostly inefficient, so it is necessary to implement water-saving measures and increase the construction of irrigation infrastructure.
5. Conclusions
In this paper, the runoff variation and spatial heterogeneity of the main stream and main tributaries of the Yellow River basin were analyzed, and the conclusions are as follows:
(1) The runoff of the Yellow River showed a serious decreasing trend of −8.25 mm/10a. Except for the Qingshuihe River and the Kushuihe River, the runoff of other basins have all shown a downward trend ranging from −1.42 mm/10a to −28.99 mm/10a. Except for the source area of the Yellow River, most of the mutation years in the runoff sequence of the main stream were concentrated in the 1980s.
(2) The precipitation elasticity coefficient εP and the potential evapotranspiration elasticity coefficient εE of the Yellow River Basin were 2.88 and −4.54, respectively. The runoff is more sensitive to changes in potential evapotranspiration in the whole basin. As the control area of the main stream control section increased, the absolute values of εP and εE gradually increased.
(3) Climate change and human activity accounted for 13% and 87% of the runoff reduction in the Yellow River Basin, respectively. Since the 1980s, with the rapid social and economic development and the continuous strengthening of environmental governance measures, human activity has become the main factor in the sharp decline in the runoff of the Yellow River Basin.
In general, the results preliminarily verified the applicability of the elastic coefficient method to the Yellow River Basin, and can provide a reference for ecological protection and development of the basin. However, the neglect of glacier melting in cold regions limits the application effect of the elastic coefficient method in the source region of the Yellow River.
Author Contributions
J.W. and P.H. conceived and designed the study; M.Y., H.L. and Q.Z. collected and analyzed the data; M.Y. wrote the manuscript; H.L. and Y.H. reviewed and edited the manuscript. All authors have read and agreed to the published version of the manuscript.
Funding
This research was funded by the National Natural Science Foundation of China (42001040, 52009146, 51625904 and 51909091), National Key Research and Development Program of China (2017YFC0404503, 2016YFC0401302, 2018YFC0407705), the Basic Scientific Research Expense Project of IWHR (WR0145B072021).
Institutional Review Board Statement
Not applicable.
Informed Consent Statement
Not applicable.
Data Availability Statement
Data is contained within article.
Conflicts of Interest
The authors declare no conflict of interest.
References
- Petersen, L.; Heynen, M.; Pellicciotti, F. Freshwater Resources: Past, Present, Future. In International Encyclopedia of Geography; John Wiley & Sons, Inc.: Hoboken, NJ, USA, 2019; pp. 1–12. Available online: https://onlinelibrary.wiley.com/doi/pdf/10.1002/9781118786352.wbieg0712.pub2 (accessed on 16 November 2021).
- Chang, H.; Gannett, M.; Tullos, D.; Moradkhani, H.; Copeland, B. Climate Change and Freshwater Resources in Oregon; Oregon Climate Impact Assessment: Corvalis, OR, USA, 2010. [Google Scholar]
- Wheater, H.S. Water Security—Science and management challenges. Proc. Int. Assoc. Hydrol. Sci. 2015, 366, 23–30. [Google Scholar] [CrossRef] [Green Version]
- Elgaali, E.; Tarawneh, Z. Evaluation the Effects of Climate Change on the Flow of the Arkansas River—United States. Adv. Sci. Technol. Eng. Syst. 2021, 6, 65–74. [Google Scholar] [CrossRef]
- Hall, N.D.; Stuntz, B.B.; Abrams, R.H. Climate Change and Freshwater Resources. Nat. Resour. Environ. 2008, 22, 30–35. [Google Scholar]
- Post, D.A. Assessing the hydrological impacts of coal resource development: A case study from Australia. Vestn. St. Petersburg Univ. Earth Sci. 2021, 66, 91–106. [Google Scholar] [CrossRef]
- Rwd, A.; Rmh, B.; Saa, B.; Agb, C.; Br, D. Low streamflow trends at human-impacted and reference basins in the United States. J. Hydrol. 2019, 580, 124254. [Google Scholar] [CrossRef]
- Pathiraja, S.; Moradkhani, H.; Marshall, L.; Sharma, A.; Geenens, G. Data-Driven Model Uncertainty Estimation in Hydrologic Data Assimilation. Water Resour. Res. 2018, 54, 1252–1280. [Google Scholar] [CrossRef]
- Wei, Q.; Chi, Z.; Fu, G.; Chris, S.; Liu, Y. Impact of robustness of hydrological model parameters on flood prediction uncertainty. J. Flood Risk Manag. 2018, 12, e12488. [Google Scholar] [CrossRef] [Green Version]
- Moges, E.; Demissie, Y.; Larsen, L.; Yassin, F. Review: Sources of Hydrological Model Uncertainties and Advances in Their Analysis. Water 2021, 13, 28. [Google Scholar] [CrossRef]
- Dey, P.; Mishra, A. Separating the impacts of climate change and human activities on streamflow: A review of methodologies and critical assumptions. J. Hydrol. 2017, 548, 278–290. [Google Scholar] [CrossRef]
- Zeng, F.; Ma, M.G.; Di, D.R.; Shi, W.Y. Separating the Impacts of Climate Change and Human Activities on Runoff: A Review of Method and Application. Water 2020, 12, 2201. [Google Scholar] [CrossRef]
- Du, J.; Shi, C.X. Effects of climatic factors and human activities on runoff of the Weihe River in recent decades. Quat. Int. 2012, 282, 58–65. [Google Scholar] [CrossRef]
- Du, M.; Mu, X.; Zhao, G.; Gao, P.; Sun, W. Changes in Runoff and Sediment Load and Potential Causes in the Malian River Basin on the Loess Plateau. Sustainability 2021, 13, 443. [Google Scholar] [CrossRef]
- Jiang, S.; Ren, L.; Yong, B.; Singh, V.P.; Yang, X.; Yuan, F. Quantifying the effects of climate variability and human activities on runoff from the Laohahe basin in northern China using three different methods. Hydrol. Process. 2011, 25, 2492–2505. [Google Scholar] [CrossRef]
- Bren, L.; Hopmans, P. Paired catchments observations on the water yield of mature eucalypt and immature radiata pine plantations in Victoria, Australia. J. Hydrol. 2007, 336, 416–429. [Google Scholar] [CrossRef]
- Brown, A.E.; Lu, Z.; McMahon, T.A.; Western, A.W.; Vertessy, R.A. A review of paired catchment studies for determining changes in water yield resulting from alterations in vegetation. J. Hydrol. 2005, 310, 28–61. [Google Scholar] [CrossRef]
- Sun, W.; Song, X.; Zhang, Y.; Chiew, F.; Post, D.; Zheng, H.; Song, S. Coal Mining Impacts on Baseflow Detected Using Paired Catchments. Water Resour. Res. 2020, 56, e2019WR025770. [Google Scholar] [CrossRef]
- Yang, H.; Yang, D. Derivation of climate elasticity of runoff to assess the effects of climate change on annual runoff. Water Resour. Res. 2011, 47, W07526. [Google Scholar] [CrossRef]
- Budyko, M.I. The Heat Balance of the Earth′s Surface. Sov. Geogr. 1961, 2, 3–13. [Google Scholar] [CrossRef]
- Fu, G.; Charles, S.P.; Chiew, F. A two-parameter climate elasticity of streamflow index to assess climate change effects on annual streamflow. Water Resour. Res. 2007, 43, 2578–2584. [Google Scholar] [CrossRef]
- Zhang, Y.; Guan, D.; Jin, C.; Wang, A.; Wu, J.; Yuan, F. Analysis of impacts of climate variability and human activity on streamflow for a river basin in northeast China. J. Hydrol. 2011, 410, 239–247. [Google Scholar] [CrossRef]
- Xu, X.; Yang, D.; Yang, H.; Lei, H. Attribution analysis based on the Budyko hypothesis for detecting the dominant cause of runoff decline in Haihe basin. J. Hydrol. 2014, 510, 530–540. [Google Scholar] [CrossRef]
- Teng, J.; Chiew, F.H.S.; Vaze, J.; Marvanek, S.; Kirono, D.G.C. Estimation of climate change impact on mean annual runoff across continental Australia using Budyko and Fu equations and hydrological models. J. Hydrometeorol. 2012, 13, 1094–1106. [Google Scholar] [CrossRef]
- Wu, J.; Wang, Z.; Dong, Z.; Tang, Q.; Lv, X.; Dong, G. Analysis of Natural Streamflow Variation and Its Influential Factors on the Yellow River from 1957 to 2010. Water 2018, 10, 1155. [Google Scholar] [CrossRef] [Green Version]
- Zheng, H.; Zhang, L.; Liu, C.; Shao, Q.; Fukushima, Y. Changes in stream flow regime in headwater catchments of the Yellow River basin since the 1950s. Hydrol. Process. 2010, 21, 886–893. [Google Scholar] [CrossRef]
- Zhong, D.; Dong, Z.; Fu, G.; Bian, J.; Zhao, Y. Trend and change points of streamflow in the Yellow River and their attributions. J. Water Clim. Chang. 2020, 12, 136–151. [Google Scholar] [CrossRef]
- Kong, D.; Miao, C.; Wu, J.; Duan, Q. Impact assessment of climate change and human activities on net runoff in the Yellow River Basin from 1951 to 2012. Ecol. Eng. 2016, 91, 566–573. [Google Scholar] [CrossRef]
- Gao, Q.; Zhao, Q.; Yang, M.; Zou, C. Impact of Climate Change and Land Use on Runoff in the Dawen River Basin, China. Appl. Ecol. Environ. Res. 2019, 17, 2849–2863. [Google Scholar] [CrossRef]
- Li, L.J.; Zhang, L.; Wang, H.; Wang, J.; Yang, J.W.; Jiang, D.J.; Li, J.Y.; Qin, D.Y. Assessing the impact of climate variability and human activities on streamflow from the Wuding River basin in China. Hydrol. Process. Int. J. 2007, 21, 3485–3491. [Google Scholar] [CrossRef]
- Lv, X.; Zuo, Z.; Ni, Y.; Sun, J.; Wang, H. The effects of climate and catchment characteristic change on streamflow in a typical tributary of the Yellow River. Sci. Rep. 2019, 9, 14535. [Google Scholar] [CrossRef] [PubMed] [Green Version]
- Bai, P.; Liu, W.; Guo, M. Impacts of climate variability and human activities on decrease in streamflow in the Qinhe River, China. Theor. Appl. Climatol. 2014, 117, 293–301. [Google Scholar] [CrossRef]
- Zhang, D.; Liu, X.; Liu, C.; Bai, P. Responses of runoff to climatic variation and human activities in the Fenhe River, China. Stoch. Environ. Res. Risk Assess. 2013, 27, 1293–1301. [Google Scholar] [CrossRef]
- Jiang, G.; He, L.; Jing, J. Water security evaluation in Yellow River basin. AIP Conf. Proc. 2018, 1994, 020059. [Google Scholar]
- Water, C. Yellow River Basin: Living with scarcity. Water Int. 2010, 35, 681–701. [Google Scholar] [CrossRef]
- Yang, D.; Ishidaira, H. Profile of the Yellow River Basin. In The Yellow River: Water and Life; World Scientific: Singapore, 2009. [Google Scholar]
- MWR. Yellow River Basin Hydrological Yearbook; Water Power Press: Beijing, China, 2017. [Google Scholar]
- Allen, R.; Pereira, L.; Raes, D.; Smith, M.; Allen, R.G.; Pereira, L.S.; Martin, S. Crop Evapotranspiration: Guidelines for Computing Crop Water Requirements, FAO Irrigation and Drainage Paper 56; FAO: Rome, Italy, 1998; Volume 300, p. D05109. [Google Scholar]
- Zhang, L.; Qian, Y. Annual distribution features of the yearly precipitation in China and their inter annual variations. Acta Meteorol. Sin. 2003, 17, 146–163. [Google Scholar]
- Mann, H.B. Nonparametric test against trend. Econometrica 1945, 13, 245–259. [Google Scholar] [CrossRef]
- Schaake, J.C. From climate to flow. In Climate Change and US Water Resources; U.S. Department of Energy Office of Scientific and Technical Information: New York, NY, USA, 1990. [Google Scholar]
- Hu, S.; Liu, C.; Zheng, H.; Wang, Z.; Yu, J. Assessing the impacts of climate variability and human activities on streamflow in the water source area of Baiyangdian Lake. J. Geogr. Sci. 2012, 22, 895–905. [Google Scholar] [CrossRef]
- Budyko, M.I. Climate and Life; FAO: New York, NY, USA, 1974. [Google Scholar]
- Zhang, L.; Dawes, W.R.; Walker, G.R. Response of mean annual evapotranspiration to vegetation changes at catchment scale. Water Resour. Res. 2001, 37, 701–708. [Google Scholar] [CrossRef]
- Jinren, N.; Ling., J.; Yanan, Z.; Xiaoyong, L. Minimum water demand for ecosystem protection in the Lower Yellow River. J. Hydraul. Eng. 2002, 2002, 1–7. [Google Scholar]
- Zhang, J.; Chen, G.-C.; Xing, S.; Shan, Q.; Wang, Y.; Li, Z. Water shortages and countermeasures for sustainable utilisation in the context of climate change in the Yellow River Delta region, China. Int. J. Sustain. Dev. World Ecol. 2011, 18, 177–185. [Google Scholar] [CrossRef]
- Chang, J.; Wang, Y.; Istanbulluoglu, E.; Bai, T.; Huang, Q.; Yang, D.; Huang, S. Impact of climate change and human activities on runoff in the Weihe River Basin, China. Quat. Int. 2015, 380–381, 169–179. [Google Scholar] [CrossRef]
- Li, B.; Li, C.; Liu, J.; Qiang, Z.; Duan, L. Decreased streamflow in the Yellow River basin, China: Climate change or human-induced? Water 2017, 9, 116. [Google Scholar] [CrossRef]
- Wang, Y.; Ding, Y.; Ye, B.; Liu, F.; Wang, J. Contributions of climate and human activities to changes in runoff of the Yellow and Yangtze rivers from 1950 to 2008. Sci. China Earth Sci. 2013, 56, 1398–1412. [Google Scholar] [CrossRef]
- Qiang, M.A.; Hui-Jun, J.; Bense, V.F.; Dong-Liang, L.U.O.; Marchenko, S.S.; Harris, S.A.; Yong-Chao, L. Impacts of degrading permafrost on streamflow in the source area of Yellow River on the Qinghai-Tibet Plateau, China. Adv. Clim. Chang. Res. 2019, 10, 225–239. [Google Scholar] [CrossRef]
- Li, H.; Qin, T.; Wang, Z.; Qiu, Y.; Lei, X. Study on Management System of Inter-Basin Water Diversion Project—A Case Study of the Project of Drawing Water from Datong River into Huangshui River; IOP Publishing: Qingdao, China, 2018; p. 22047. [Google Scholar]
- Zhao, X.Y.; Li, W.; Yang, P.T.; Liu, S. Impact of livelihood capital on the livelihood activities of farmers and herdsmen on Gannan Plateau. Popul. Resour. Environ. 2011, 21, 111–118. [Google Scholar] [CrossRef]
- Liu, Z.; Tan, H.; Shi, D.; Xu, P.; Elenga, H.I. Origin and formation mechanism of salty water in Zuli River catchment of the Yellow River. Water Environ. Res. 2019, 91, 222–238. [Google Scholar] [CrossRef] [PubMed]
- Wang, H.; Yang, Z.; Saito, Y.; Liu, J.P.; Sun, X. Interannual and seasonal variation of the Huanghe (Yellow River) water discharge over the past 50years: Connections to impacts from ENSO events and dams. Glob. Planet. Chang. 2006, 50, 212–225. [Google Scholar] [CrossRef]
- Wang, S.; Fu, B.; Liang, W.; Liu, Y.; Wang, Y. Driving forces of changes in the water and sediment relationship in the Yellow River. Sci. Total Environ. 2017, 576, 453–461. [Google Scholar] [CrossRef]
- Gao, P.; Deng, J.; Chai, X.; Mu, X.; Zhao, G.; Shao, H.; Sun, W. Dynamic sediment discharge in the Hekou-Longmen region of Yellow River and soil and water conservation implications. Sci. Total Environ. 2017, 578, 56–66. [Google Scholar] [CrossRef]
- Liu, X.; Yang, S.; Dang, S.; Luo, Y.; Li, X.; Zhou, X. Response of sediment yield to vegetation restoration at a large spatial scale in the Loess Plateau. Sci. China Technol. Sci. 2014, 57, 1482–1489. [Google Scholar] [CrossRef]
- Wang, X.; Zhang, P.; Liu, L.l.; Li, D.; Wang, Y. Effects of human activities on hydrological components in the Yiluo River basin in middle Yellow River. Water 2019, 11, 689. [Google Scholar] [CrossRef] [Green Version]
- Chen, Y.; Wang, K.; Lin, Y.; Shi, W.; Song, Y.; He, X. Balancing green and grain trade. Nat. Geosci. 2015, 8, 739–741. [Google Scholar] [CrossRef]
- Feng, X.; Fu, B.; Piao, S.; Wang, S.; Ciais, P.; Zeng, Z.; LV, Y.; Zeng, Y.; Li, Y.; Jiang, X. Revegetation in China’s Loess Plateau is approaching sustainable water resource limits. Nat. Clim. Chang. 2016, 6, 1019–1022. [Google Scholar] [CrossRef]
Figure 1.
The location of hydrological and meteorological stations in the Yellow River Basin and sub-basins.
Figure 1.
The location of hydrological and meteorological stations in the Yellow River Basin and sub-basins.

Figure 2.
Interannual variation trend of runoff from the main control sections of the Yellow River Basin.
Figure 2.
Interannual variation trend of runoff from the main control sections of the Yellow River Basin.

Figure 3.
Interannual variation trend of runoff in dry season at main control sections of the Yellow River Basin.
Figure 3.
Interannual variation trend of runoff in dry season at main control sections of the Yellow River Basin.

Figure 4.
The annual average concentration of runoff from the main control sections of the Yellow River Basin.
Figure 4.
The annual average concentration of runoff from the main control sections of the Yellow River Basin.

Figure 5.
Elastic coefficient of precipitation and potential evapotranspiration at the control section of the mainstream of the Yellow River Basin.
Figure 5.
Elastic coefficient of precipitation and potential evapotranspiration at the control section of the mainstream of the Yellow River Basin.

Figure 6.
Elastic coefficient of precipitation and potential evapotranspiration at the control section of the tributaries of the Yellow River Basin.
Figure 6.
Elastic coefficient of precipitation and potential evapotranspiration at the control section of the tributaries of the Yellow River Basin.

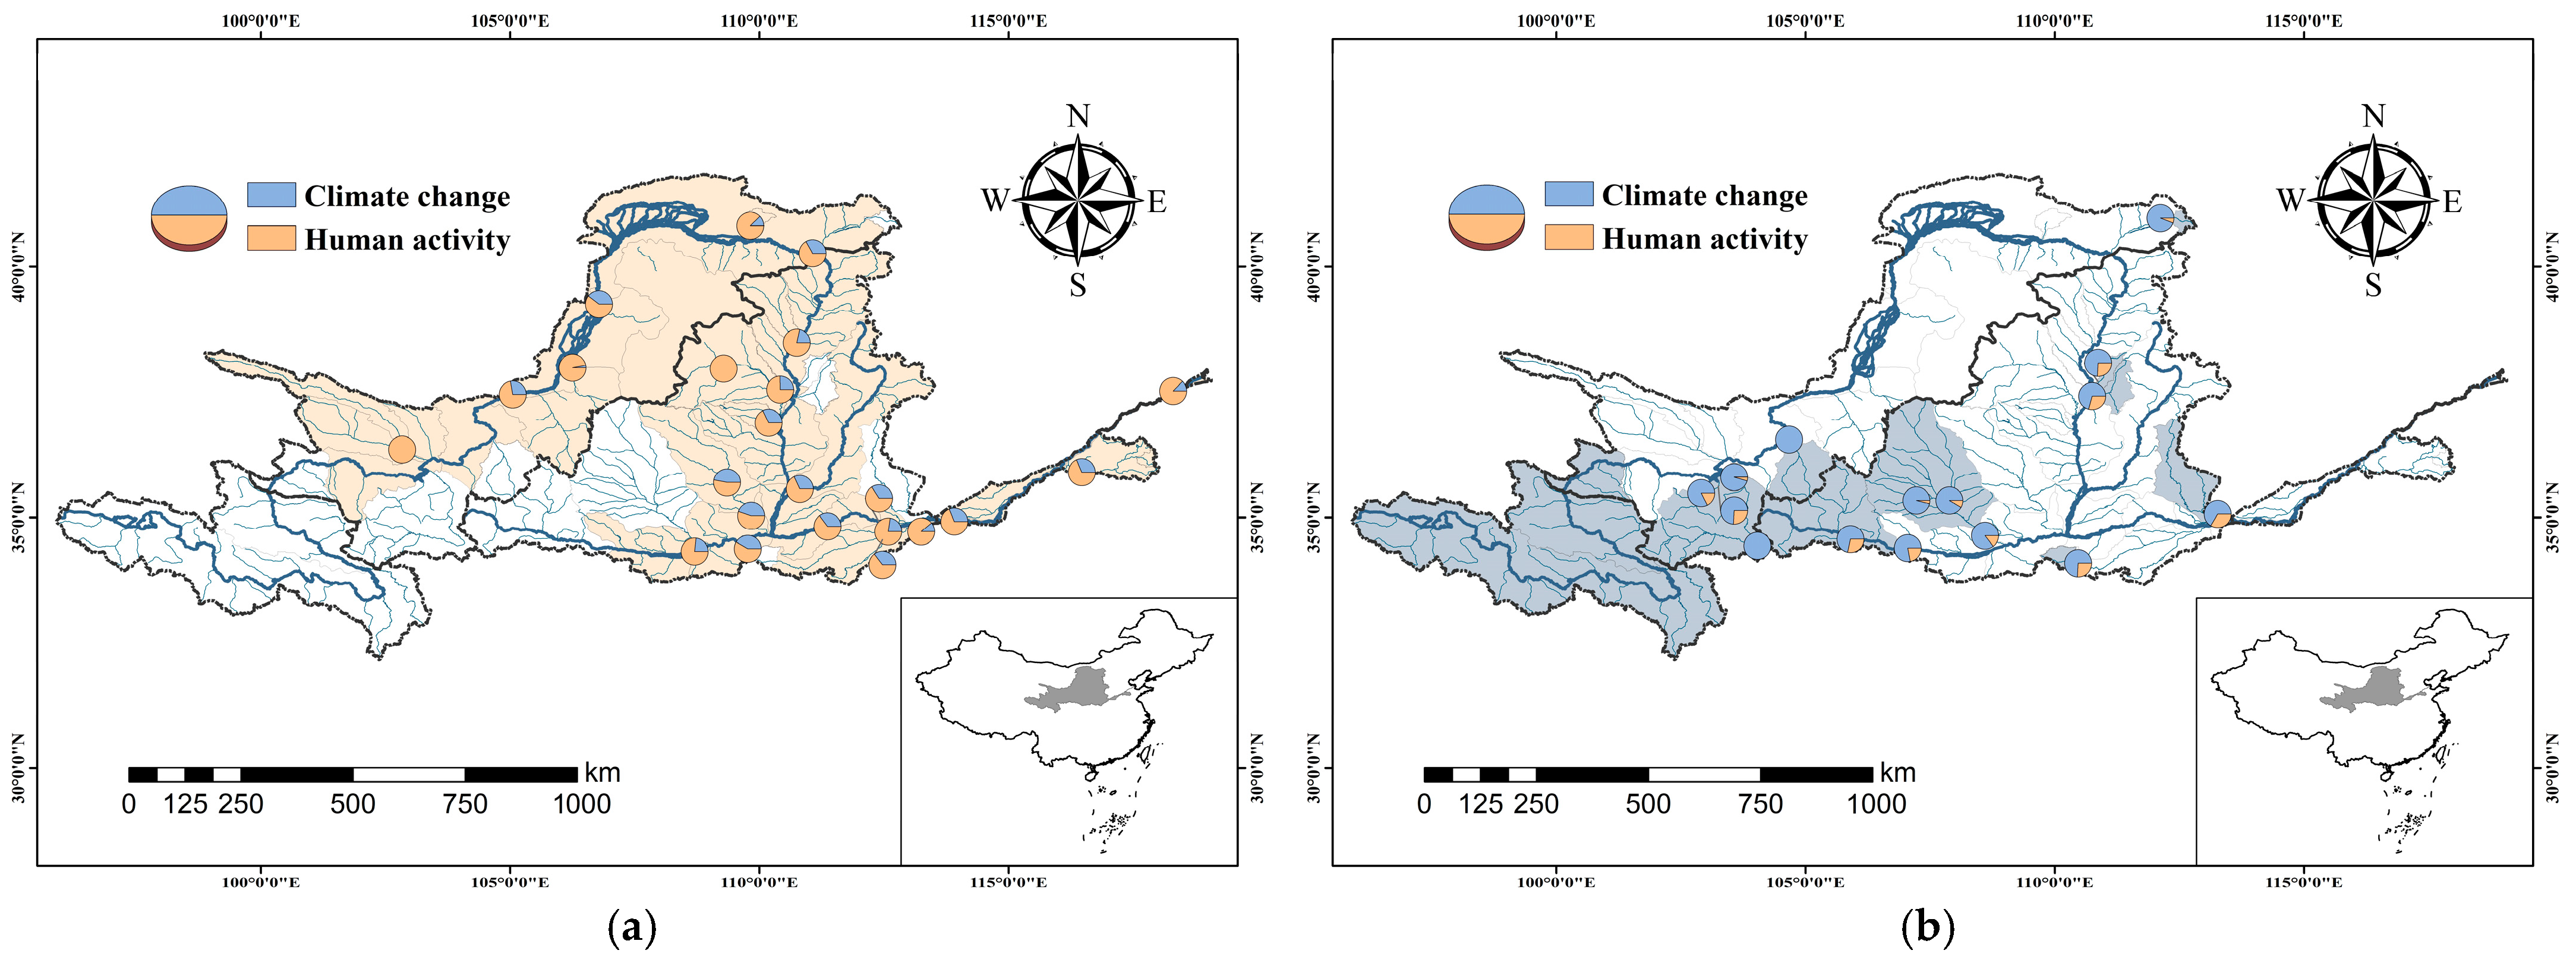
Figure 7.
Impacts of human activity (a) and climate change (b) on runoff changes at major control sections in the Yellow River basin as a percentage.
Figure 7.
Impacts of human activity (a) and climate change (b) on runoff changes at major control sections in the Yellow River basin as a percentage.


Table 1.
Corresponding relation between month and Cd.
| Month | Jan. | Feb. | Mar. | Apr. | May | Jun. | Jul. | Aug. | Sep. | Oct. | Nov. | Dec. |
|---|---|---|---|---|---|---|---|---|---|---|---|---|
| θ | 0° | 30° | 60° | 90° | 120° | 150° | 180° | 210° | 240° | 270° | 300° | 330° |
Table 2.
Interannual variation of runoff from the main control sections of the Yellow River Basin.
| River Name | Control Section | Annual Runoff Change (mm/10a) | Statistical Z Value | River Name | Control Section | Annual Runoff Change (mm/10a) | Statistical Z Value |
|---|---|---|---|---|---|---|---|
| Yellow River | Jimai | 2.36 | 1.19 | Daheihe River | Qixiaying | −4.41 | −4.16 ** |
| Maqu | −3.45 | −0.59 | Kuyehe River | Wenjiachuan | −2.45 | −3.08 ** | |
| Tangnaihai | −2.71 | −0.27 | Qiushuihe River | Linjiaping | −6.26 | −3.60 ** | |
| Guide | −3.99 | −0.97 | Sanchuanhe River | Houdacheng | −6.27 | −4.19 ** | |
| Xunhua | −4.52 | −1.06 | Wudinghe River | Hengshan | −3.36 | −2.91 ** | |
| Xiaochuan | −5.50 | −1.70 | Baijiachuan | −4.20 | −6.27 ** | ||
| Lanzhou | −4.46 | −1.19 | Qingjianhe River | Yanchuan | −3.18 | −2.88 ** | |
| Xiaheyan | −5.21 | −2.04 * | Fenhe River | Hejin | −5.92 | −4.66 ** | |
| Shizuishan | −4.80 | −2.25 * | Malianhe River | Yuluoping | −1.42 | −2.48 * | |
| Toudaoguai | −4.80 | −3.45 ** | Jinghe River | Yangjiaping | −6.85 | −4.45 ** | |
| Sanmenxia | −6.05 | −4.94 ** | Zhangjiashan | −6.76 | −5.49 ** | ||
| Xiaolangdi | −5.88 | −4.71 ** | Beiluohe River | Jiaokouhe | −1.70 | −2.78 ** | |
| Huayuankou | −6.24 | −4.91 ** | Zhuangtou | −5.11 | −5.00 ** | ||
| Lijin | −8.25 | −5.58 ** | Weihe River | Beidao | −7.28 | −4.29 ** | |
| Daxiahe River | Shuangcheng | −11.07 | −3.03 ** | Linjiacun | −13.89 | −6.24 ** | |
| Zheqiao | −19.17 | −4.27 ** | Xianyang | −13.78 | −4.37 ** | ||
| Taohe River | Minxian | −19.37 | −3.53 ** | Huaxian | −7.82 | −3.64 ** | |
| Hongqi | −12.88 | −2.80 ** | Yihe River | Longmenzhen | −28.99 | −4.47 ** | |
| Datonghe River | Xiangtang | −4.89 | −2.17 * | Luohe River | Lingkou | −26.17 | −2.69 ** |
| Huangshui River | Minhe | −2.81 | −0.09 | Baimasi | −18.03 | −3.56 ** | |
| Zulihe River | Jingyuan | −1.50 | −3.78 ** | Yiluohe River | Heishiguan | −20.84 | −4.28 ** |
| Qingshuihe River | Quanyanshan | 0.01 | 1.82 | Qinhe River | Wuzhi | −14.00 | −3.98 ** |
| Kushuihe River | Guojiaqiao | 4.25 | 7.14 ** | Dawenhe River | Laiwu | −11.08 | 0.00 |
| Kundulunhe River | Taerwan | −2.32 | −4.72 ** | Daicunba | −18.92 | −2.56 * |
Note: The superscripts * and ** indicate that the significance test passed the 0.05 and 0.01 confidence level respectively, and the blank cells in the table indicates that the river name is the same as the previous row the same below.
Table 3.
Interannual variation of runoff at main control sections of the Yellow River Basin in dry season.
Table 3.
Interannual variation of runoff at main control sections of the Yellow River Basin in dry season.
| River Name | Control Section | Statistical Z Value | River Name | Control Section | Statistical Z Value | River Name | Control Section | Statistical Z Value |
|---|---|---|---|---|---|---|---|---|
| Yellow River | Jimai | 2.51 * | Taohe River | Minxian | −4.16 ** | Malianhe River | Yuluoping | −1.92 |
| Maqu | −1.6 | Hongqi | 0.12 | Jinghe River | Yangjiaping | −3.54 ** | ||
| Tangnaihai | 1.31 | Datonghe River | Xiangtang | 1.93 | Zhangjiashan | −5.43 ** | ||
| Guide | 6.25 ** | Huangshui River | Minhe | 1.69 | Beiluohe River | Jiaokouhe | −1.01 | |
| Xunhua | 5.43 ** | Zulihe River | Jingyuan | 4.00 ** | Zhuangtou | −4.45 ** | ||
| Xiaochuan | 2.88 ** | Qingshuihe River | Quanyanshan | 4.25 ** | Weihe River | Beidao | −4.20 ** | |
| Lanzhou | 3.69 ** | Kushuihe River | Guojiaqiao | 7.35 ** | Linjiacun | −4.82 ** | ||
| Xiaheyan | 3.68 ** | Kundulunhe River | Taerwan | −5.25 ** | Xianyang | −3.61 ** | ||
| Shizuishan | 4.12 ** | Daheihe River | Qixiaying | −4.16 ** | Huaxian | 1.11 | ||
| Toudaoguai | 2.98 ** | Kuyehe River | Wenjiachuan | −4.33 ** | Yihe River | Longmenzhen | −3.39 ** | |
| Sanmenxia | −1.7 | Qiushuihe River | Linjiaping | −5.08 ** | Luohe River | Lingkou | −1.94 | |
| Xiaolangdi | −1.15 | Sanchuanhe River | Houdacheng | −4.30 ** | Baimasi | −2.24 * | ||
| Huayuankou | −1.3 | Hengshan | −2.07 * | Yiluohe River | Heishiguan | −3.03 ** | ||
| Lijin | −5.06 ** | Wudinghe River | Baijiachuan | −7.28 ** | Qinhe River | Wuzhi | −2.36 * | |
| Daxiahe River | Shuangcheng | −4.44 ** | Qingjianhe River | Yanchuan | −1.33 | Dawenhe River | Laiwu | 1.48 |
| Zheqiao | −3.01 ** | Fenhe River | Hejin | −5.47 ** | Daicunba | 1.46 |
Note: The superscripts * and ** indicate that the significance test passed the 0.05 and 0.01 confidence level respectively.
Table 4.
Annual concentration variation trend of runoff at main control sections in the Yellow River Basin.
Table 4.
Annual concentration variation trend of runoff at main control sections in the Yellow River Basin.
| River Name | Control Section | Average Cd | Statistical Z Value | River Name | Control Section | Average Cd | Statistical Z Value |
|---|---|---|---|---|---|---|---|
| Yellow River | Jimai | 0.47 | −2.60 ** | Daheihe River | Qixiaying | 0.36 | −2.15 * |
| Maqu | 0.46 | 0.07 | Kuyehe River | Wenjiachuan | 0.29 | −1.35 | |
| Tangnaihai | 0.45 | −1.38 | Qiushuihe River | Linjiaping | 0.56 | −0.14 | |
| Guide | 0.3 | −5.10 ** | Sanchuanhe River | Houdacheng | 0.3 | −1.15 | |
| Xunhua | 0.3 | −4.92 ** | Wudinghe River | Hengshan | 0.33 | −5.25 ** | |
| Xiaochuan | 0.27 | −5.06 ** | Baijiachuan | 0.15 | −0.13 | ||
| Lanzhou | 0.3 | −5.62 ** | Qingjianhe River | Yanchuan | 0.43 | −1.72 | |
| Xiaheyan | 0.29 | −5.89 ** | Fenhe River | Hejin | 0.4 | −0.52 | |
| Shizuishan | 0.27 | −5.61 ** | Malianhe River | Yuluoping | −0.62 | 0.46 | |
| Toudaoguai | 0.22 | −4.89 ** | Jinghe River | Yangjiaping | 0.37 | −2.62 ** | |
| Sanmenxia | 0.26 | −3.56 ** | Zhangjiashan | 0.33 | −4.45 ** | ||
| Xiaolangdi | 0.28 | −2.71 ** | Beiluohe River | Jiaokouhe | 0.33 | −2.28 * | |
| Huayuankou | 0.29 | −3.47 ** | Zhuangtou | 0.31 | 0.38 | ||
| Lijin | 0.32 | −0.46 | Weihe River | Beidao | 0.43 | −0.64 | |
| Daxiahe River | Shuangcheng | 0.39 | 0.34 | Linjiacun | 0.34 | −4.20 ** | |
| Zheqiao | 0.45 | 2.27 * | Xianyang | 0.42 | −0.11 | ||
| Taohe River | Minxian | 0.4 | 1.66 | Huaxian | 0.42 | −1.3 | |
| Hongqi | 0.38 | −2.02 * | Yihe River | Longmenzhen | 0.41 | −0.17 | |
| Datonghe River | Xiangtang | 0.5 | −1.1 | Luohe River | Lingkou | 0.38 | −4.45 ** |
| Huangshui River | Minhe | 0.37 | −1.29 | Baimasi | 0.38 | −0.46 | |
| Zulihe River | Jingyuan | 0.55 | −4.55 ** | Yiluohe River | Heishiguan | 0.36 | −0.78 |
| Qingshuihe River | Quanyanshan | 0.47 | −0.41 | Qinhe River | Wuzhi | 0.6 | 0.15 |
| Kushuihe River | Guojiaqiao | 0.53 | −2.69 ** | Dawenhe River | Laiwu | 0.57 | −0.03 |
| Kundulunhe River | Taerwan | 0.23 | 1.07 | Daicunba | 0.68 | 1.09 |
Note: The superscripts * and ** indicate that the significance test passed the 0.05 and 0.01 confidence level respectively.
Table 5.
Climatic elasticity coefficient of main control sections in the Yellow River Basin.
| River Name | Control Section | Mutation Year | εP | εE | River Name | Control Section | Mutation Year | εP | εE |
|---|---|---|---|---|---|---|---|---|---|
| Yellow River | Jimai | 1998 | 0.44 | −0.56 | Daheihe River | Qixiaying | 1991 | 1.80 | −3.98 |
| Maqu | 1994 | 1.29 | −0.80 | Kuyehe River | Wenjiachuan | 2005 | 0.95 | −1.65 | |
| Tangnaihai | 1994 | 1.35 | −1.04 | Qiushuihe River | Linjiaping | 1979 | 1.88 | −3.11 | |
| Guide | 1992 | 1.01 | −0.87 | Sanchuanhe River | Houdacheng | 1979 | 1.15 | −2.22 | |
| Xunhua | 1990 | 0.94 | −0.90 | Wudinghe River | Hengshan | 2006 | 0.26 | −0.21 | |
| Xiaochuan | 1987 | 1.17 | −1.12 | Baijiachuan | 1979 | 0.45 | −1.57 | ||
| Lanzhou | 1986 | 1.08 | −1.07 | Qingjianhe River | Yanchuan | 2008 | 0.92 | −1.42 | |
| Xiaheyan | 1987 | 1.19 | −1.16 | Fenhe River | Hejin | 1973 | 2.51 | −2.72 | |
| Shizuishan | 1987 | 1.34 | −2.10 | Malianhe River | Yuluoping | 2005 | 1.29 | −1.29 | |
| Toudaoguai | 1990 | 1.67 | −3.22 | Jinghe River | Yangjiaping | 1987 | 2.09 | −1.96 | |
| Sanmenxia | 1990 | 1.90 | −3.15 | Zhangjiashan | 1999 | 2.10 | −2.60 | ||
| Xiaolangdi | 1990 | 1.88 | −3.14 | Beiluohe River | Jiaokouhe | 2000 | 1.29 | −1.43 | |
| Huayuankou | 1987 | 2.01 | −3.48 | Zhuangtou | 2005 | 1.71 | −2.90 | ||
| Lijin | 1981 | 2.88 | −4.54 | Weihe River | Beidao | 1989 | 2.48 | −2.78 | |
| Daxiahe River | Shuangcheng | 1991 | 1.79 | −1.79 | Linjiacun | 1996 | 2.72 | −2.88 | |
| Zheqiao | 1991 | 1.97 | −2.61 | Xianyang | 1977 | 2.74 | −2.00 | ||
| Taohe River | Minxian | 1989 | 1.74 | −1.22 | Huaxian | 1985 | 2.45 | −2.51 | |
| Hongqi | 1990 | 1.88 | −1.13 | Yihe River | Longmenzhen | 1976 | 2.76 | −2.49 | |
| Datonghe River | Xiangtang | 2006 | 0.59 | −0.72 | Luohe River | Lingkou | 1976 | 2.38 | −3.21 |
| Huangshui River | Minhe | 1962 | 1.38 | −0.84 | Baimasi | 1986 | 2.04 | −2.23 | |
| Zulihe River | Jingyuan | 2005 | 1.87 | −1.95 | Yiluohe River | Heishiguan | 1972 | 2.48 | −3.27 |
| Qingshuihe River | Quanyanshan | 1994 | 1.25 | −1.20 | Qinhe River | Wuzhi | 1969 | 4.31 | −2.28 |
| Kushuihe River | Guojiaqiao | 1975 | 0.25 | −0.13 | Dawenhe River | Laiwu | 2002 | 2.59 | −2.39 |
| Kundulunhe River | Taerwan | 2011 | 1.94 | −0.74 | Daicunba | 2002 | 3.34 | −4.29 |
Table 6.
Contribution of climate change and human activity in the main control sections of the Yellow River Basin.
Table 6.
Contribution of climate change and human activity in the main control sections of the Yellow River Basin.
| River Name | Control Section | Qobs1 | Qobs2 | Pobs1 | Pobs2 | Eobs1 | Eobs2 | ΔQC | ΔQH |
|---|---|---|---|---|---|---|---|---|---|
| Yellow River | Xiaheyan | 130.65 | 105.16 | 517.16 | 500.30 | 512.67 | 519.45 | 27.7% | 72.3% |
| Shizuishan | 98.93 | 76.77 | 471.57 | 455.98 | 589.64 | 602.07 | 39.6% | 60.4% | |
| Toudaoguai | 66.22 | 46.09 | 432.52 | 411.36 | 657.09 | 661.04 | 33.3% | 66.7% | |
| Sanmenxia | 57.76 | 36.04 | 485.19 | 456.49 | 700.83 | 705.30 | 35.2% | 64.8% | |
| Xiaolangdi | 57.84 | 36.43 | 486.90 | 457.89 | 702.73 | 705.92 | 34.1% | 65.9% | |
| Huayuankou | 61.13 | 38.94 | 496.49 | 469.10 | 710.10 | 710.53 | 31.2% | 68.8% | |
| Lijin | 53.24 | 26.34 | 500.75 | 481.14 | 725.17 | 717.59 | 13.0% | 87.0% | |
| Daxiahe River | Shuangcheng | 136.71 | 98.50 | 541.15 | 530.88 | 435.99 | 483.99 | 82.5% | 17.5% |
| Zheqiao | 147.34 | 82.66 | 544.62 | 534.72 | 434.81 | 483.02 | 74.1% | 25.9% | |
| Taohe River | Minxian | 263.47 | 188.19 | 668.23 | 608.74 | 370.10 | 411.09 | 101.5% | −1.5% |
| Hongqi | 204.84 | 150.54 | 624.53 | 579.38 | 392.94 | 433.61 | 95.5% | 4.5% | |
| Datonghe River | Xiangtang | 191.53 | 171.26 | 418.65 | 453.37 | 544.33 | 545.67 | −44.5% | 144.5% |
| Zulihe River | Jingyuan | 10.99 | 6.06 | 455.22 | 420.16 | 580.30 | 708.75 | 128.2% | −28.2% |
| Kushuihe River | Guojiaqiao | 4.99 | 22.30 | 288.61 | 284.90 | 965.44 | 1011.49 | 2.9% | 97.1% |
| Kundulunhe River | Taerwan | 14.07 | 2.71 | 322.09 | 303.94 | 1024.71 | 1009.97 | 12.2% | 87.8% |
| Daheihe River | Qixiaying | 32.39 | 24.07 | 423.36 | 385.25 | 817.85 | 834.21 | 94.3% | 5.7% |
| Kuyehe River | Wenjiachuan | 50.58 | 28.89 | 440.22 | 437.82 | 857.27 | 902.13 | 21.4% | 78.6% |
| Qiushuihe River | Linjiaping | 56.40 | 28.40 | 537.63 | 527.52 | 853.73 | 945.10 | 74.1% | 25.9% |
| Sanchuanhe River | Houdacheng | 70.89 | 44.44 | 532.64 | 520.51 | 853.73 | 945.10 | 70.7% | 29.3% |
| Luhe River | Hengshan | 41.27 | 17.45 | 427.32 | 445.06 | 992.10 | 967.57 | −0.1% | 100.1% |
| Wudinghe River | Baijiachuan | 47.65 | 32.30 | 392.87 | 399.47 | 830.17 | 877.48 | 25.4% | 74.6% |
| Qingjianhe River | Yanchuan | 41.62 | 24.84 | 548.70 | 524.97 | 724.54 | 770.27 | 32.0% | 68.0% |
| Fenhe River | Hejin | 44.39 | 17.26 | 554.96 | 510.92 | 779.60 | 778.72 | 32.0% | 68.0% |
| Jinghe River | Yangjiaping | 59.06 | 35.82 | 625.63 | 566.88 | 666.17 | 728.23 | 96.3% | 3.7% |
| Malianhe River | Yuluoping | 23.91 | 16.13 | 542.30 | 488.22 | 727.58 | 823.74 | 91.7% | 8.3% |
| Jinghe River | Yangjiaping | 59.06 | 35.82 | 625.63 | 566.88 | 666.17 | 728.23 | 96.3% | 3.7% |
| Zhangjiashan | 41.38 | 17.16 | 592.28 | 546.21 | 691.11 | 780.40 | 85.4% | 14.6% | |
| Beiluohe River | Jiaokouhe | 28.01 | 21.27 | 581.21 | 548.39 | 656.20 | 674.58 | 47.0% | 53.0% |
| Zhuangtou | 33.51 | 7.01 | 600.36 | 559.75 | 673.38 | 728.79 | 44.9% | 55.1% | |
| Weihe River | Beidao | 56.95 | 30.17 | 569.95 | 505.71 | 557.45 | 568.90 | 71.5% | 28.5% |
| Linjiacun | 77.97 | 28.92 | 588.48 | 515.28 | 552.47 | 581.59 | 77.9% | 22.1% | |
| Xianyang | 115.34 | 66.50 | 637.41 | 585.81 | 606.98 | 569.57 | 23.3% | 76.7% | |
| Huaxian | 75.34 | 51.11 | 630.72 | 574.52 | 626.72 | 605.68 | 41.7% | 58.3% | |
| Yihe River | Longmenzhen | 220.27 | 108.55 | 802.60 | 737.93 | 830.89 | 816.66 | 35.4% | 64.6% |
| Luohe River | Lingkou | 296.23 | 184.93 | 753.42 | 676.62 | 762.86 | 771.34 | 74.2% | 25.8% |
| Baimasi | 167.37 | 100.50 | 619.56 | 564.88 | 763.76 | 733.10 | 22.6% | 77.4% | |
| Yiluohe River | Heishiguan | 194.95 | 112.51 | 760.76 | 696.80 | 752.95 | 715.85 | 11.2% | 88.8% |
| Qinhe River | Wuzhi | 121.94 | 42.73 | 695.39 | 603.47 | 810.34 | 761.18 | 66.4% | 33.6% |
| Dawenhe River | Daicunba | 124.43 | 117.69 | 782.46 | 748.82 | 761.75 | 739.31 | 31.5% | 68.5% |
Note: Qobs1 and Qobs2 are the average annual runoff depth before and after the mutation point respectively, the average annual precipitation and potential evapotranspiration Pobs1, Pobs2, Eobs1 and Eobs2 are similar.
Table 7.
Previous attribution analysis on the runoff change in the Yellow River Basin.
| River Name | Study Period | Method | Contribution | Source | |
|---|---|---|---|---|---|
| Climate Change (%) | Human Activity (%) | ||||
| Yellow River | 1960–2014 | Budyko framework | 17.5 | 82. 5 | Li, et al. [48] |
| Yellow River | 1951–2012 | double mass curves (RA-DMC) | 8.3 | 91.7 | Kong, et al. [28] |
| Yellow River | 1950–2008 | double mass curves (RA-DMC) | 16 | 84 | Wang, et al. [49] |
| Weihe River | 1956–2006 | Variable Infiltration capacity (VIC) hydrological model | 28 | 72 | Chang, et al. [47] |
| Weihe River | 1971–2006 | Stepwise regression model | 48.9 | 51.1 | Du, et.al [13] |
| Fenhe River | 1956–2010 | Two-parameter monthly hydrological model | 40.7 | 59.3 | Zhang, et al. [33] |
| Kuyehe River | 1951–2010 | Budyko framework | 30 | 70 | Lv, et al. [31] |
| Wudinghe River | 1960–1997 | Rainfall–runoff models | 13 | 87 | Li, et al. [30] |
| Beiluohe River | 1951–2010 | Budyko framework | 45 | 55 | Lv, et al. [31] |
| Qinhe River | 1956–2010 | Dynamic water balance model (DWBM) | 59.3 | 40.7 | Li, et al. [32] |
Publisher’s Note: MDPI stays neutral with regard to jurisdictional claims in published maps and institutional affiliations. |
© 2021 by the authors. Licensee MDPI, Basel, Switzerland. This article is an open access article distributed under the terms and conditions of the Creative Commons Attribution (CC BY) license (https://creativecommons.org/licenses/by/4.0/).
Share and Cite
MDPI and ACS Style
Yang, M.; Liu, H.; Han, Y.; Zeng, Q.; Wang, J.; Hu, P. Temporal and Spatial Changes of Runoff Regime in the Yellow River Basin from 1956 to 2017. Water 2021, 13, 3298. https://doi.org/10.3390/w13223298
AMA Style
Yang M, Liu H, Han Y, Zeng Q, Wang J, Hu P. Temporal and Spatial Changes of Runoff Regime in the Yellow River Basin from 1956 to 2017. Water. 2021; 13(22):3298. https://doi.org/10.3390/w13223298
Chicago/Turabian StyleYang, Mingda, Huan Liu, Yuping Han, Qinghui Zeng, Jianhua Wang, and Peng Hu. 2021. "Temporal and Spatial Changes of Runoff Regime in the Yellow River Basin from 1956 to 2017" Water 13, no. 22: 3298. https://doi.org/10.3390/w13223298
Note that from the first issue of 2016, this journal uses article numbers instead of page numbers. See further details here.