
Assessment of the Contribution of Rainwater Collection to Crop Production on Udo Island, Korea


1
Department of Water Resources, HANUL, Daejeon 34054, Korea
2
School of Civil, Environmental and Architectural Engineering, College of Engineering, Korea University, Seoul 02841, Korea
*
Author to whom correspondence should be addressed.
Water 2021, 13(22), 3299; https://doi.org/10.3390/w13223299
Submission received: 25 October 2021
/
Revised: 17 November 2021
/
Accepted: 17 November 2021
/
Published: 22 November 2021
(This article belongs to the Special Issue Water and Crops)
Abstract
:This study evaluated the contribution of small agricultural reservoirs (the mool-tongs) to crop production on Udo, and the role they play. Agricultural water demand and deficit, water storage in the mool-tongs, and the amount of irrigation water were analyzed by applying the water balance model. In particular, the Blaney-Criddle method was used to estimate the agricultural water for crop growth. In this study, four typical crops of garlic, spring onion, peanut, and barley were considered, whose growing seasons were somewhat different from each other. A total of 47 years (1973–2019) of rainfall, temperature, and evaporation data were used in this study. As a result, it was confirmed that the crop coefficient, growing period of a crop, share of the cultivated area, and the seasonal distribution of rainfall affect the role of the mool-tongs. Comparison of the frequencies of occurrence of agricultural water deficit and irrigation interval before and after introducing the mool-tongs also confirms their usefulness. After the introduction of the mool-tongs for irrigation, the frequency of occurrence of agricultural water deficits changed significantly, from almost 30% of the entire simulation period to less than 20%. Even though the water supply capacity of the mool-tongs on Udo is insufficient to offset the entire agricultural water deficit, the water stored in the mool-tongs was found to considerably aid the survival of the crops and increase crop production. The results in this study can help to determine the capacity of rainwater collecting systems, especially on a small island where the available water resources are limited.
1. Introduction
On small islands, it is generally the case that the available water is also small. Water for agricultural use is not easy to collect. The area of the island is too small to collect much surface water, nor is sufficient ground water expected. Thus, island residents are highly vulnerable to drought, and the impact of no rain appears immediately [1]. On volcanic islands, where the infiltration capacity of soil is high, the problem can be more serious. It becomes even more difficult to collect the surface water [2]. Recent climate change has also degraded the stability of the water supply, mainly due to the change in rainfall patterns [3,4,5].
Udo is a small island with an area of 6.1 km2, located near Jeju Island in Korea. It takes just 1 h to walk around the island. It is notorious for the shortage of water [6]. Udo was created made by volcanic activity like Jeju Island, whose land surface is covered by volcanic deposits. The topography of Udo is quite flat, and the highly porous basaltic plateau on Udo reveals high infiltration capacity [7]. Even though the annual rainfall amount is very large, at about 1975 mm, Udo does not have any small stream that flows all year-round. Simply put, the high infiltration capacity does not readily allow effective rainfall [8]. Based on JSSGP (2003), the runoff ratio on Jeju Island reaches just 21% [9]. A similar runoff ratio is expected, as the soil on Udo is more or less the same as on Jeju Island. As it is not easy to find other sources of water, most of the domestic water is supplied by rainwater collection. This is the main obstacle preventing more influx of the population to this island [10,11].
Various methods have been tried to collect additional water on Udo, including rainwater collection, ground water development, sea water desalination, and small dams [12,13]. On Udo, rainwater collection is popular, as on other islands in Korea. In fact, until a sea water desalination plant was introduced in the 1990s, rainwater collection was the most important method for securing domestic water [14]. Every household on Udo prepared one or two large water pots to collect water from the roof. In 1995, the number of water pots in Udo reached 467 [10]. Additional exploration for groundwater aquifers was not successful, as the danger of saltwater intrusion was high [13]. As the topography was rather flat, it was also not easy to find a proper location for dam reservoirs. However, the sea water desalination plant was successful on Udo [15], as in other countries such as Nauru [16], but recently halted operation, as a waterworks pipe was directly connected from Jeju Island to Udo [17]. Although the salt water desalination plants on many remote islands are still working, such efforts have been limited to domestic water supplies, not to agricultural water.
Fishing is the main industry on most small islands in Korea. Basically, fishing must be more profitable to those living on small islands, but there are also other reasons. For example, the mountainous landscape of these small islands is not suited to agriculture. It is almost impossible to secure enough water for agriculture on these small islands. However, the main production activity on this island is agriculture. More than 60% of the Udo area has been used for agriculture. More residents are farmers than fishermen. Although one of the reasons must be the flat landscape of Udo, there is another important reason. It is the mool-tong, which are small agricultural reservoirs. There were more than 30 mool-tongs on Udo, among which 24 mool-tongs are still actively used. In fact, the size of these mool-tongs is rather small, so their role could be underestimated. Most people simply assume that this small island is good for agriculture, with its flat landscape, mild temperature, and rainy summer.
The objective of this study was to demonstrate the role and contribution of mool-tongs to crop production on Udo. A total of 47 years (1973–2019) of rainfall, temperature, and evaporation data were used for this evaluation. Agricultural water demand, agricultural water deficit, water storage in the mool-tongs, and irrigation water were analyzed by applying the water balance model. In particular, the Blaney-Criddle method was used to estimate the agricultural water for crop growth. The Blaney-Criddle method was developed to estimate the monthly consumptive use of water of a crop considering the temperature, sunshine duration, and crop coefficient [18]. In this study, four typical crops of garlic, spring onion, peanut, and barley were considered, whose growing seasons are somewhat different from each other. The first analysis was performed without considering the mool-tongs, with the results evaluated from the point of crop production. The second analysis considered the mool-tongs, and compared the results with those from the first analysis. This comparison of results demonstrates the contribution of the mool-tongs to crop production on Udo.
2. Theoretical Background
2.1. The Blaney-Criddle Method
Agricultural water is essential for crop growth, and it comprises the consumptive use of water. The consumptive use of water by upland crops is also assumed to be identical to the evapotranspiration amount of the field [19,20]. While the amount of potential evapotranspiration can be measured directly by a lysimeter, its application difficulties and measurement limitations restrict its use [21]. On the other hand, indirect methods, such as the Thornthwaite [22], Turc [23], Penman [24], Blaney-Criddle [18], and Penman-Monteith [25], are more frequently used. In Korea, methods such as the Blaney-Criddle and FAO–Penman [26] are generally applied [20], among which the Blaney-Criddle is advantageous because its application requires just two pieces of data, temperature and the crop coefficient [19].
The Blaney-Criddle method was also considered in this study to estimate the consumptive use of water. That is, the Blaney-Criddle method was used to estimate the agricultural water demand for four popular crops on Udo (i.e., garlic, spring onion, peanut, and barley). In general, the Blaney-Criddle method is used to estimate the monthly or seasonal evapotranspiration amount for a given crop. The monthly consumptive use of water can be estimated by the following equation:
where CUW represents the monthly consumptive use of water (mm/month), and P is the factor of sunshine duration that represents the percentage of daily average sunshine duration of the target month to the annual sunshine duration. Additionally, t represents the monthly mean temperature (°C), and kc represents the crop coefficient. Table 1, prepared by Ponce (1989) [27], summarizes the factor of sunshine duration P with respect to the latitude and corresponding month. As Udo is located around 33° latitude N, the factors in Ponce (1989) were interpolated to be used in this study. Table 2 summarizes the crop coefficients kc of the crops of interest in this study, i.e., garlic, spring onion, peanut, and barley. These crop coefficients were estimated by KARICO (2005) [28]. Only the growing period of peanut includes summer, while those of the other three do not.
2.2. Water Balance Analysis
2.2.1. Water Storage in the Mool-Tongs
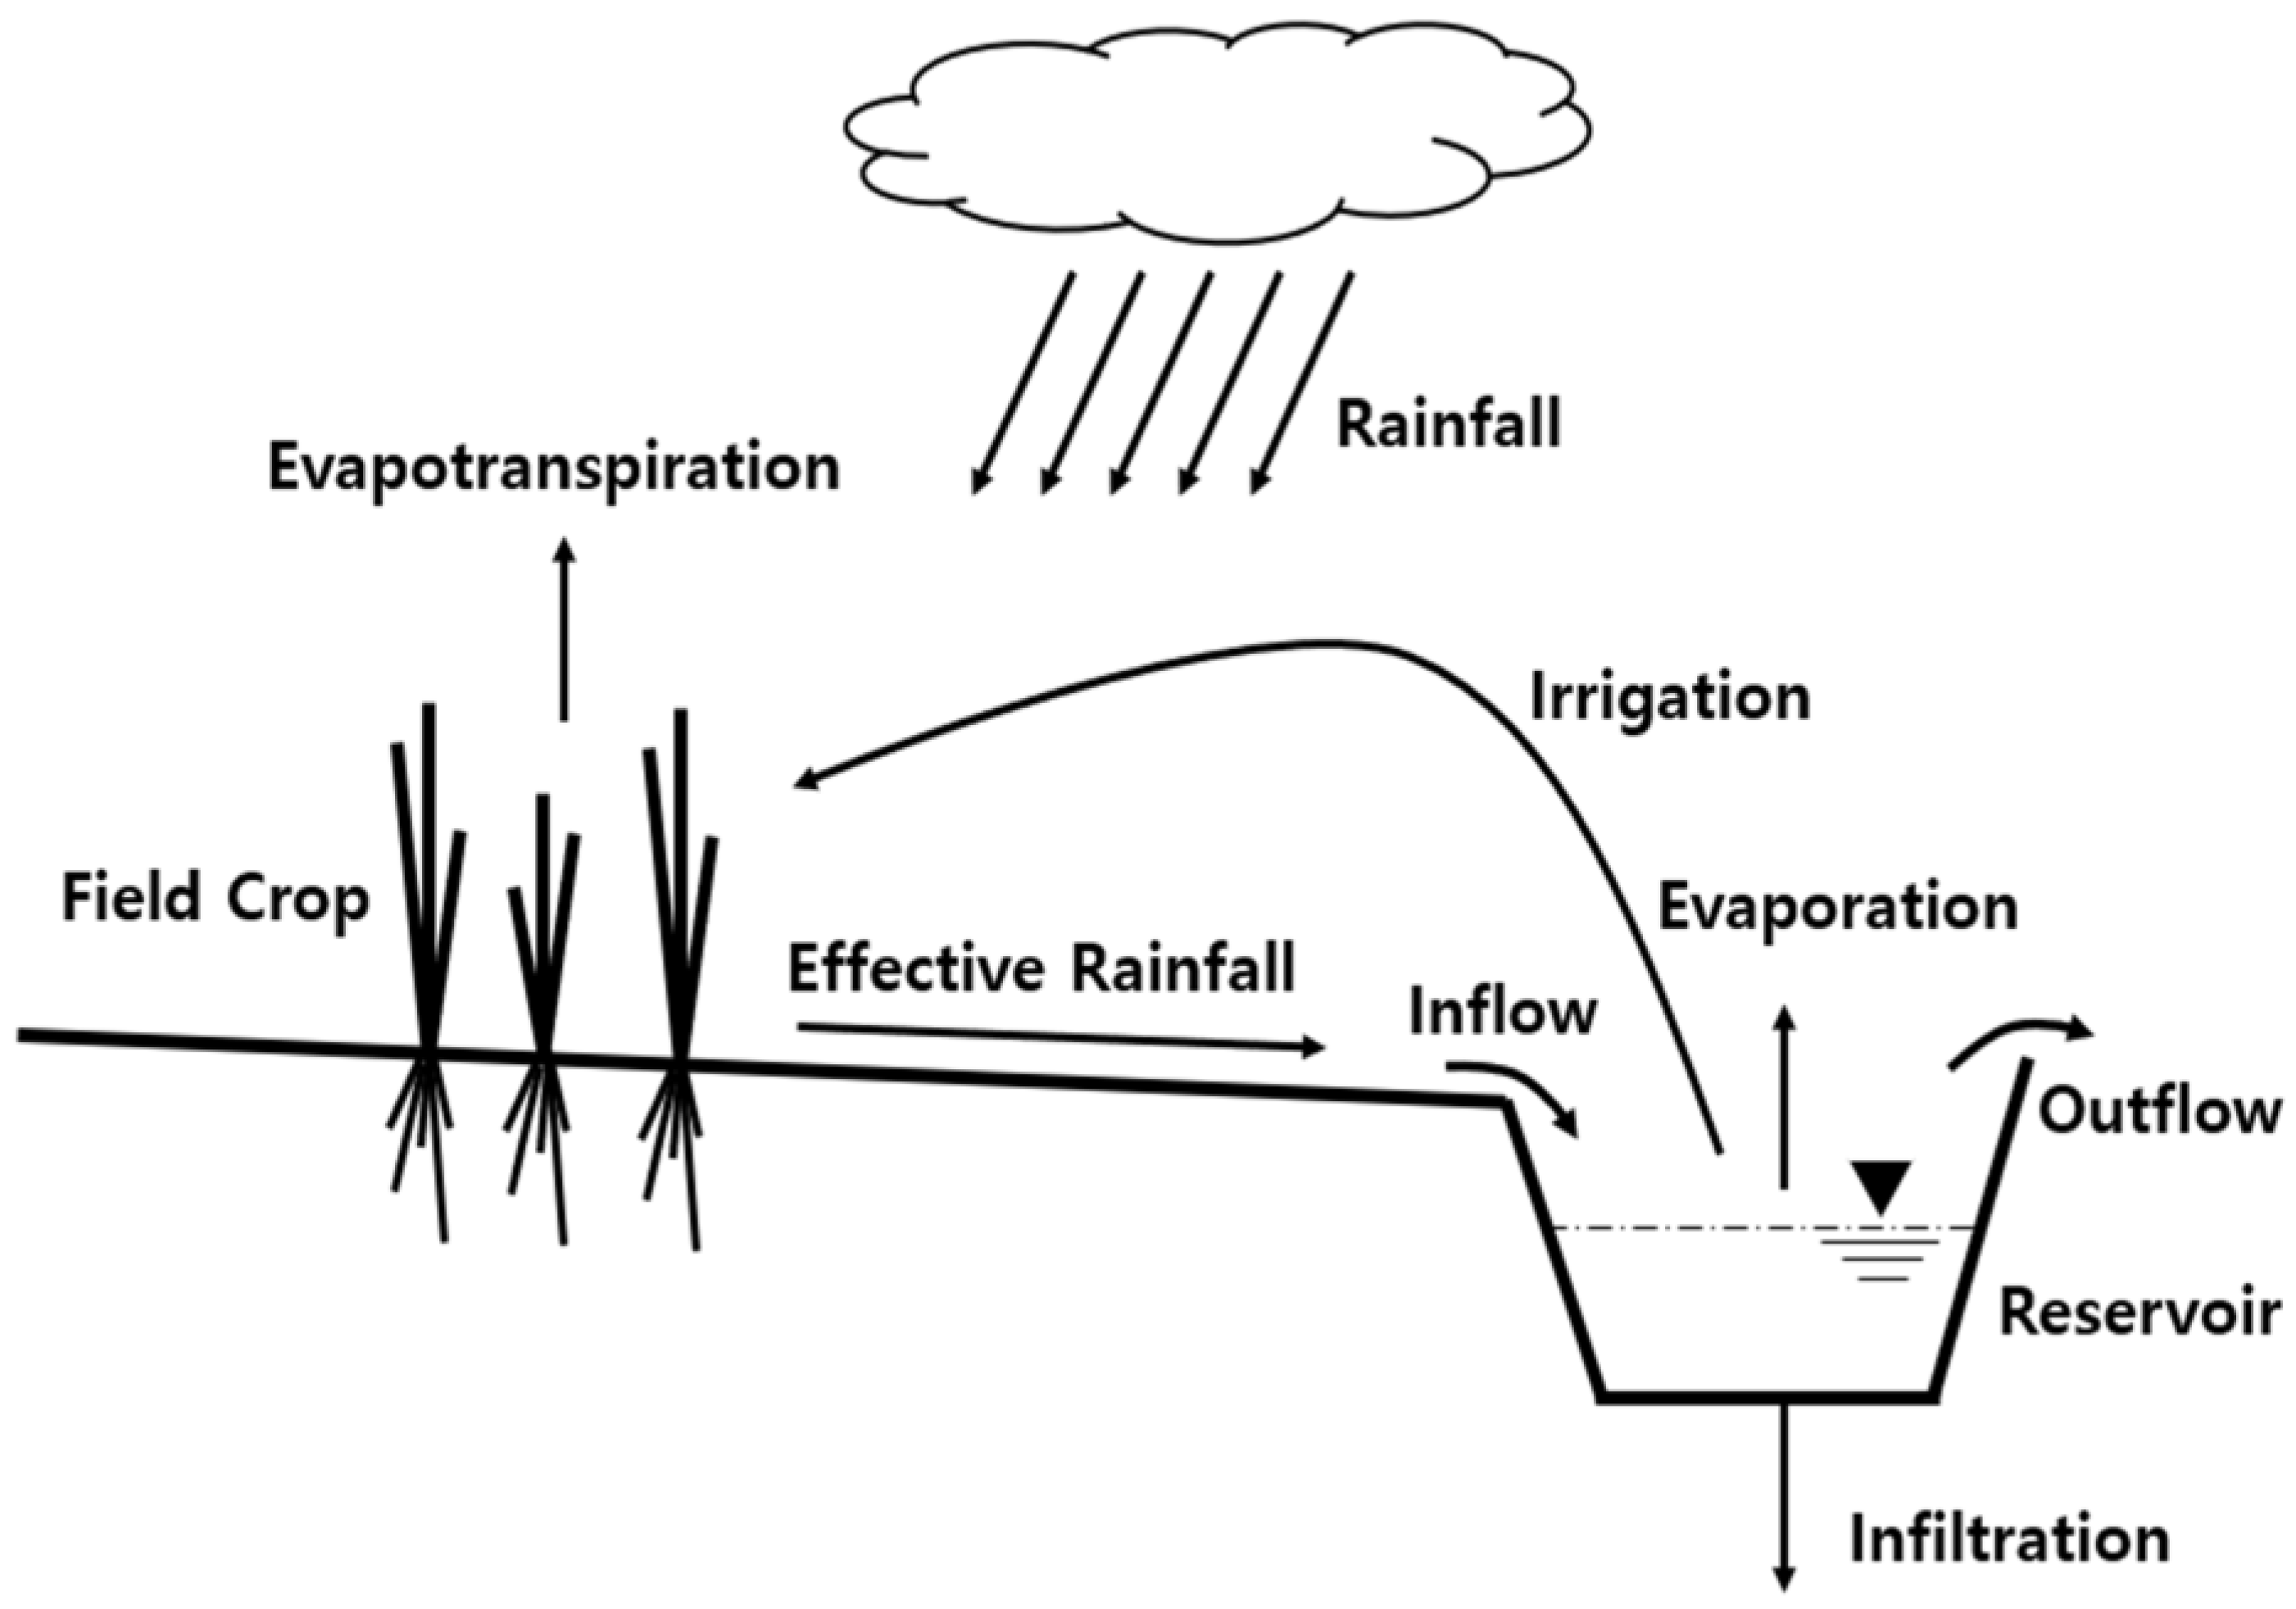
The mool-tong is the name of the small agricultural reservoir used on Jeju Island, Korea. Mool-tongs are generally located where the rainwater collection is rather easier. It is simply because most mool-tongs were made by the residents in Udo by their labor. The collected rainwater is mainly used for agriculture. Mool-tongs are still used for agriculture, even though the domestic water is supplied by waterworks from Jeju Island [29]. To estimate the amount of irrigation water from a mool-tong, it is necessary to simulate the water storage within the mool-tong. This study considered a simple water balance model for that purpose. The water balance model was applied to 24 mool-tongs, whose simulation results were used to evaluate the agricultural water deficit of four popular crops on Udo. The water stored in a mool-tong increases in proportion to the inflow from the corresponding sub-basin that the mool-tong represents. On the other hand, the water stored in a mool-tong decreases when irrigation from the mool-tong begins. The inflow into a mool-tong is simply the direct runoff from the corresponding sub-basin, i.e., the effective rainfall estimated by subtracting the infiltration and interception from the rainfall. The direct loss from a mool-tong includes irrigation water, evaporation loss from the surface, and infiltration from the bottom of the mool-tong. Additionally, if the mool-tong is full, additional inflows into the mool-tong are assumed to be a loss. Figure 1 shows the water balance model for the mool-tong used in this study:
The water storage of the mool-tong can be expressed as follows:
where Si is the water storage on the i-th day (mm), Si−1 is the water storage on the (i − 1)th day (mm), Ii is the inflow on the i-th day (mm), Fi is the infiltration loss from the bottom of the mool-tong on the i-th day (mm), and ETi is the evaporation loss from the surface of the mool-tong on the i-th day (mm).
The inflow to the mool-tong Ii, that is, the effective rainfall, was estimated by applying the Soil Conservation Service–Curve Number (SCS–CN) method. The SCS–CN method enables the effective rainfall from the total rainfall to be derived by considering the soil and land use information [30]. The CN ranges from 0 to 100. The CN of 0 indicates that all the rainfall is infiltrated, while the CN of 100 indicates that there will be no infiltration to maximize the effective rainfall. This study considered Lee et al. (2019) and Kang and Yoo (2020) in the application of the SCS–CN method [31,32]. In particular, Lee et al. (2019) proposed a new hydrological soil group by considering the volcanic ash soils of Jeju Island [31]. Their new hydrological soil group was also proven to be very accurate by Kang and Yoo (2020) and Yoo and Kang (2021) [32,33]. Kang and Yoo (2020) additionally proposed the use of a somewhat different initial loss rate and antecedent soil moisture conditions (AMCs) in the application of the SCS–CN method [32]. Their results showed that the conventional values of initial loss rate and AMCs used in the inland area of the Korean Peninsula could produce a somewhat biased estimation of the effective rainfall on the volcanic Jeju Island.
The infiltration capacity Fi at the bottom of the mool-tong was determined to be 4.0 mm/h, which was the value proposed for the small lakes on Jeju Island [34]. The evaporation ETi was determined by analyzing the small pan data observed at the nearby meteorological station operated by the Korean Meteorological Administration (KMA). The correction coefficient, 0.7, which was recommended to be used in Korea by the KMA and other studies [35,36,37], was applied to this pan data to derive the potential evaporation data. The actual evaporation amount was assumed to be around 50–70% of the potential evaporation amount, depending on the weather conditions. The observed data were smoothed in this study, to be used as input for the water balance model.
2.2.2. Amount of Irrigation Water
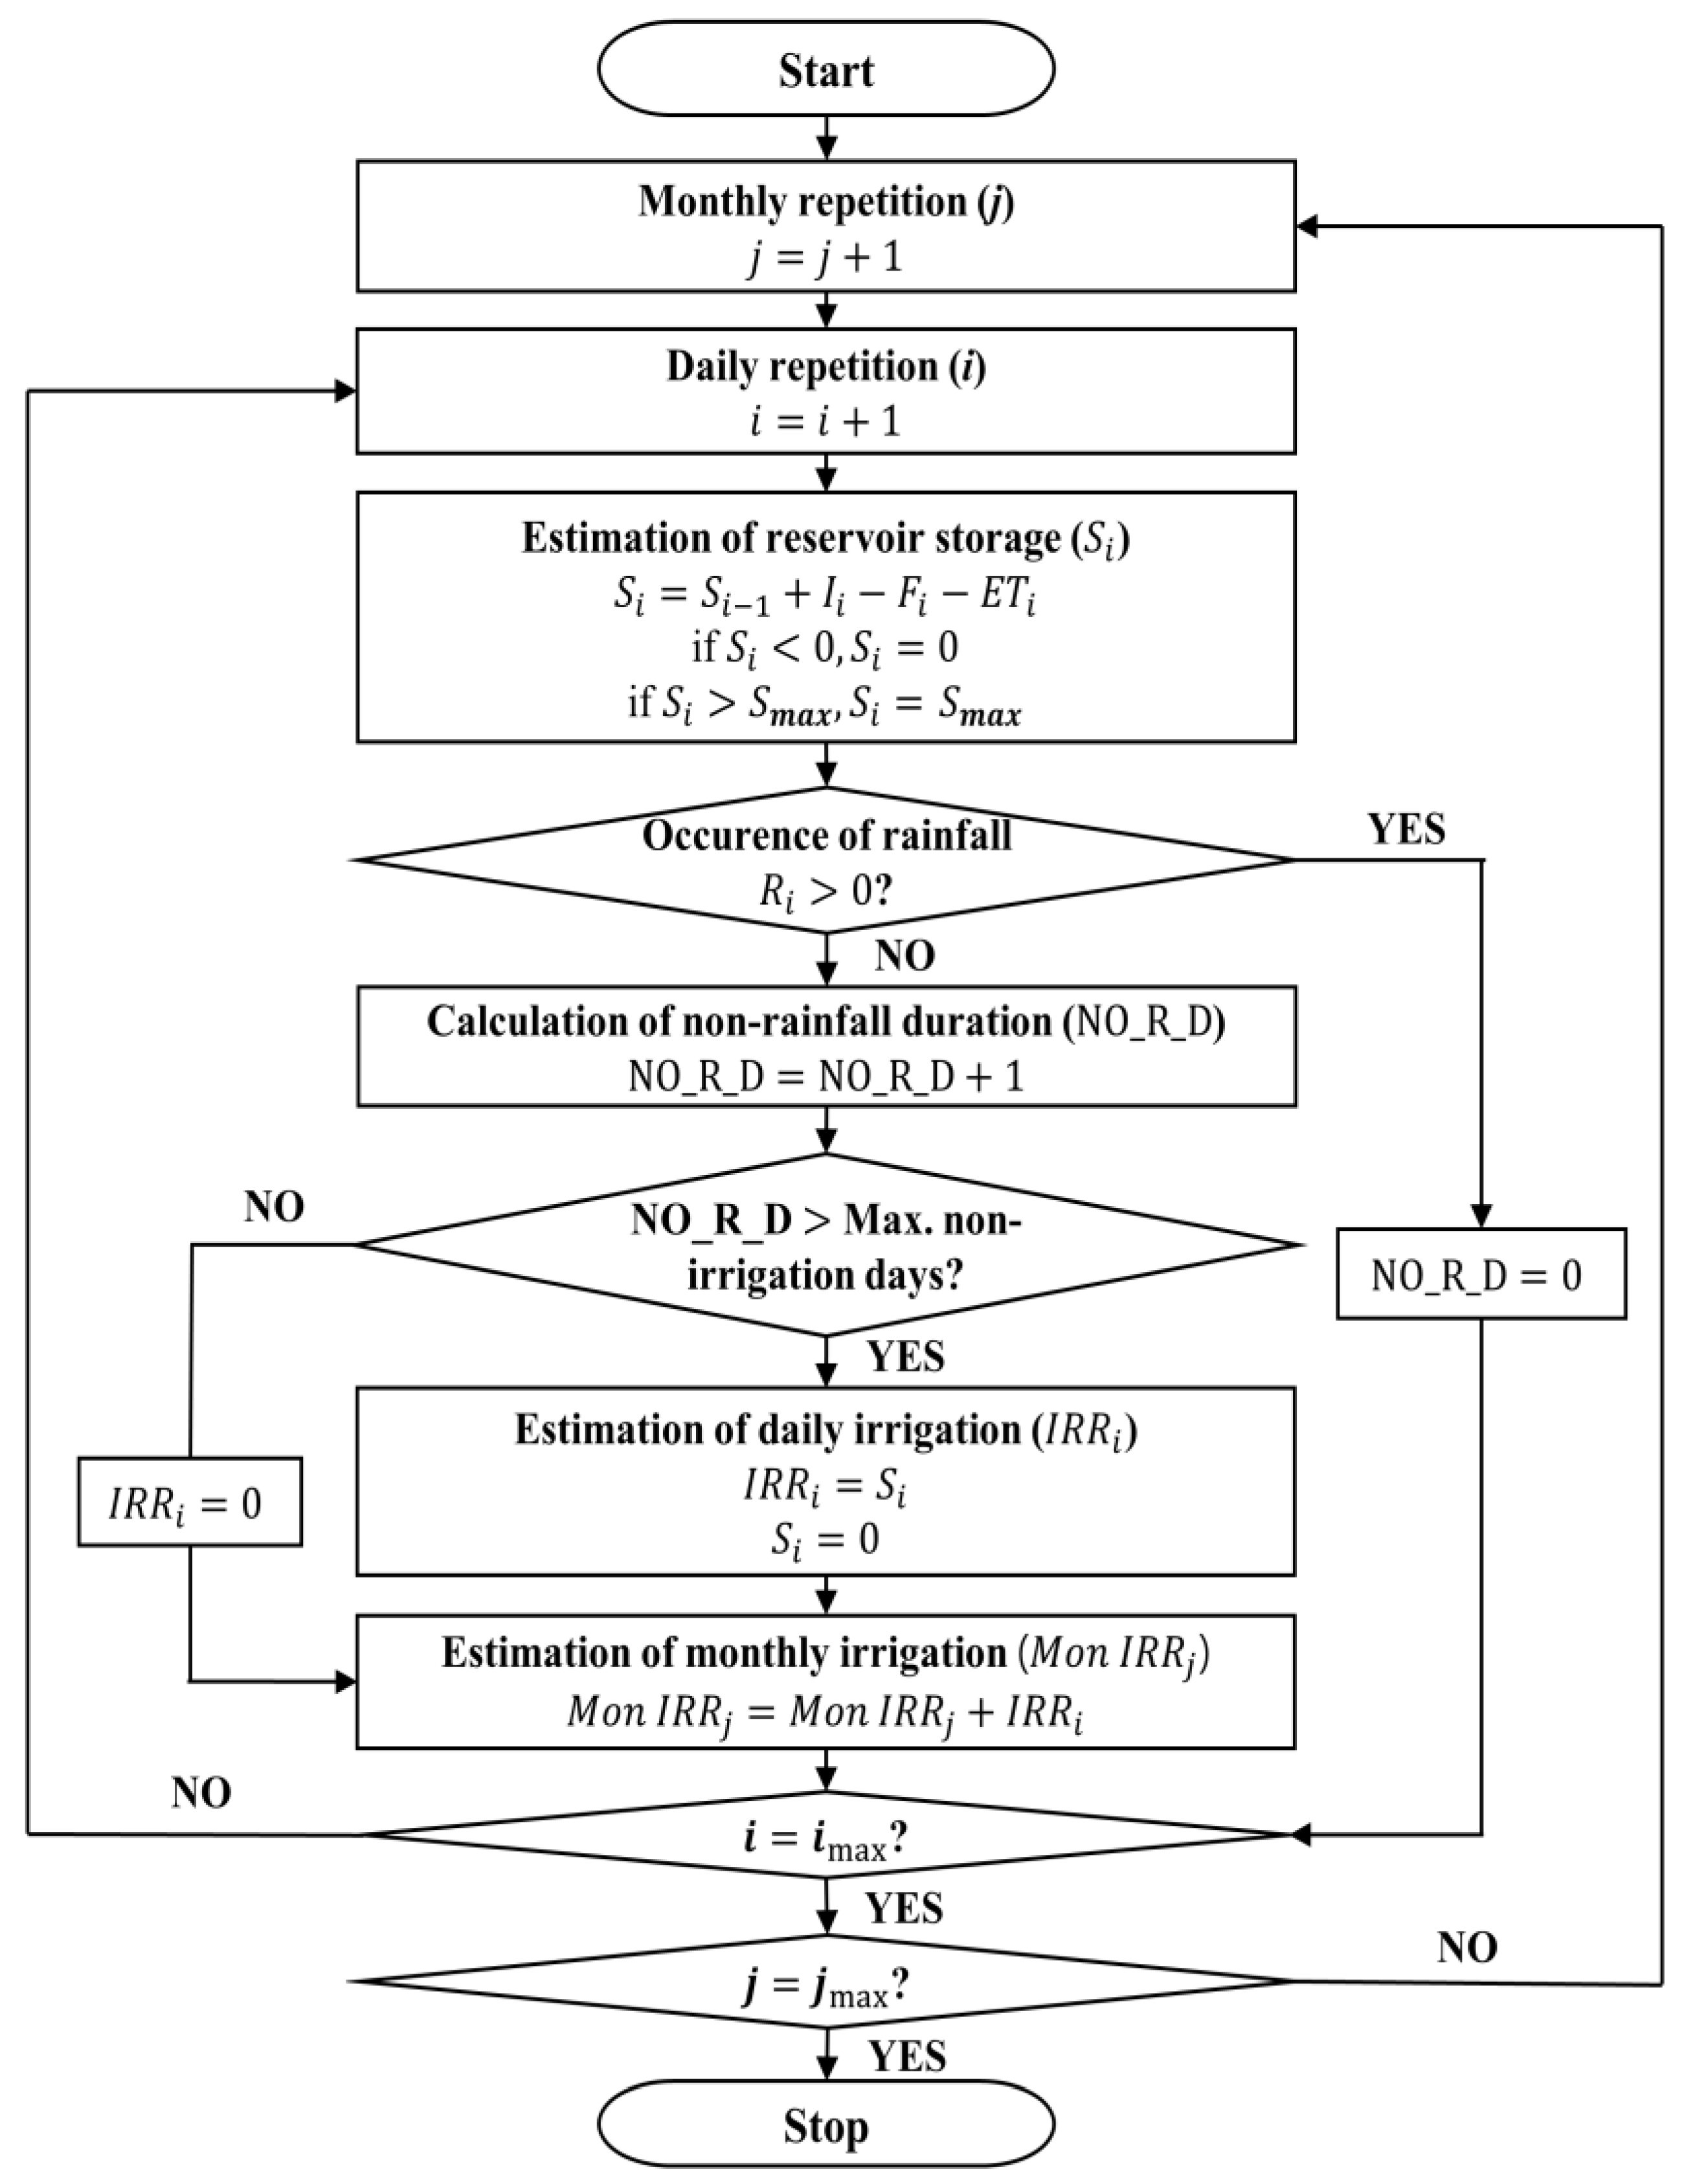
The amount of irrigation water was calculated on a daily basis by considering the current water storage in the mool-tong and the number of consecutive rainless days (Figure 2). The current water storage in the mool-tong was calculated by Equation (2). Then, it was determined if the current water storage should be used for irrigation or not. This study introduced a condition for this purpose that irrigation should occur whenever the number of consecutive rainless days was longer than the maximum non-irrigation days. Here the maximum non-irrigation days means the maximum number of days that a crop does not wither without any water supply. KRRI (2002) observed that the maximum non-irrigation days for bean and potato on Jeju Island are both around 10 days. It is also the same for spring onion and garlic [38].
In this study, the maximum non-irrigation days were set to 10 days, which might be the representative value for those crops considered in this study. That is, only when the number of consecutive rainless days was longer than 10 days was irrigation set to occur. Additionally, whenever irrigation occurred, all the stored water in the mool-tong was assumed to be used. This is because in comparison with the size of the farm field, the size of the mool-tong is rather small. In the case of rain on the day that irrigation should occur, the irrigation was set to stop. This simulation was performed on a daily basis, and the monthly irrigation amount was calculated by accumulating the daily irrigation amount.
3. Site and Data
3.1. Udo
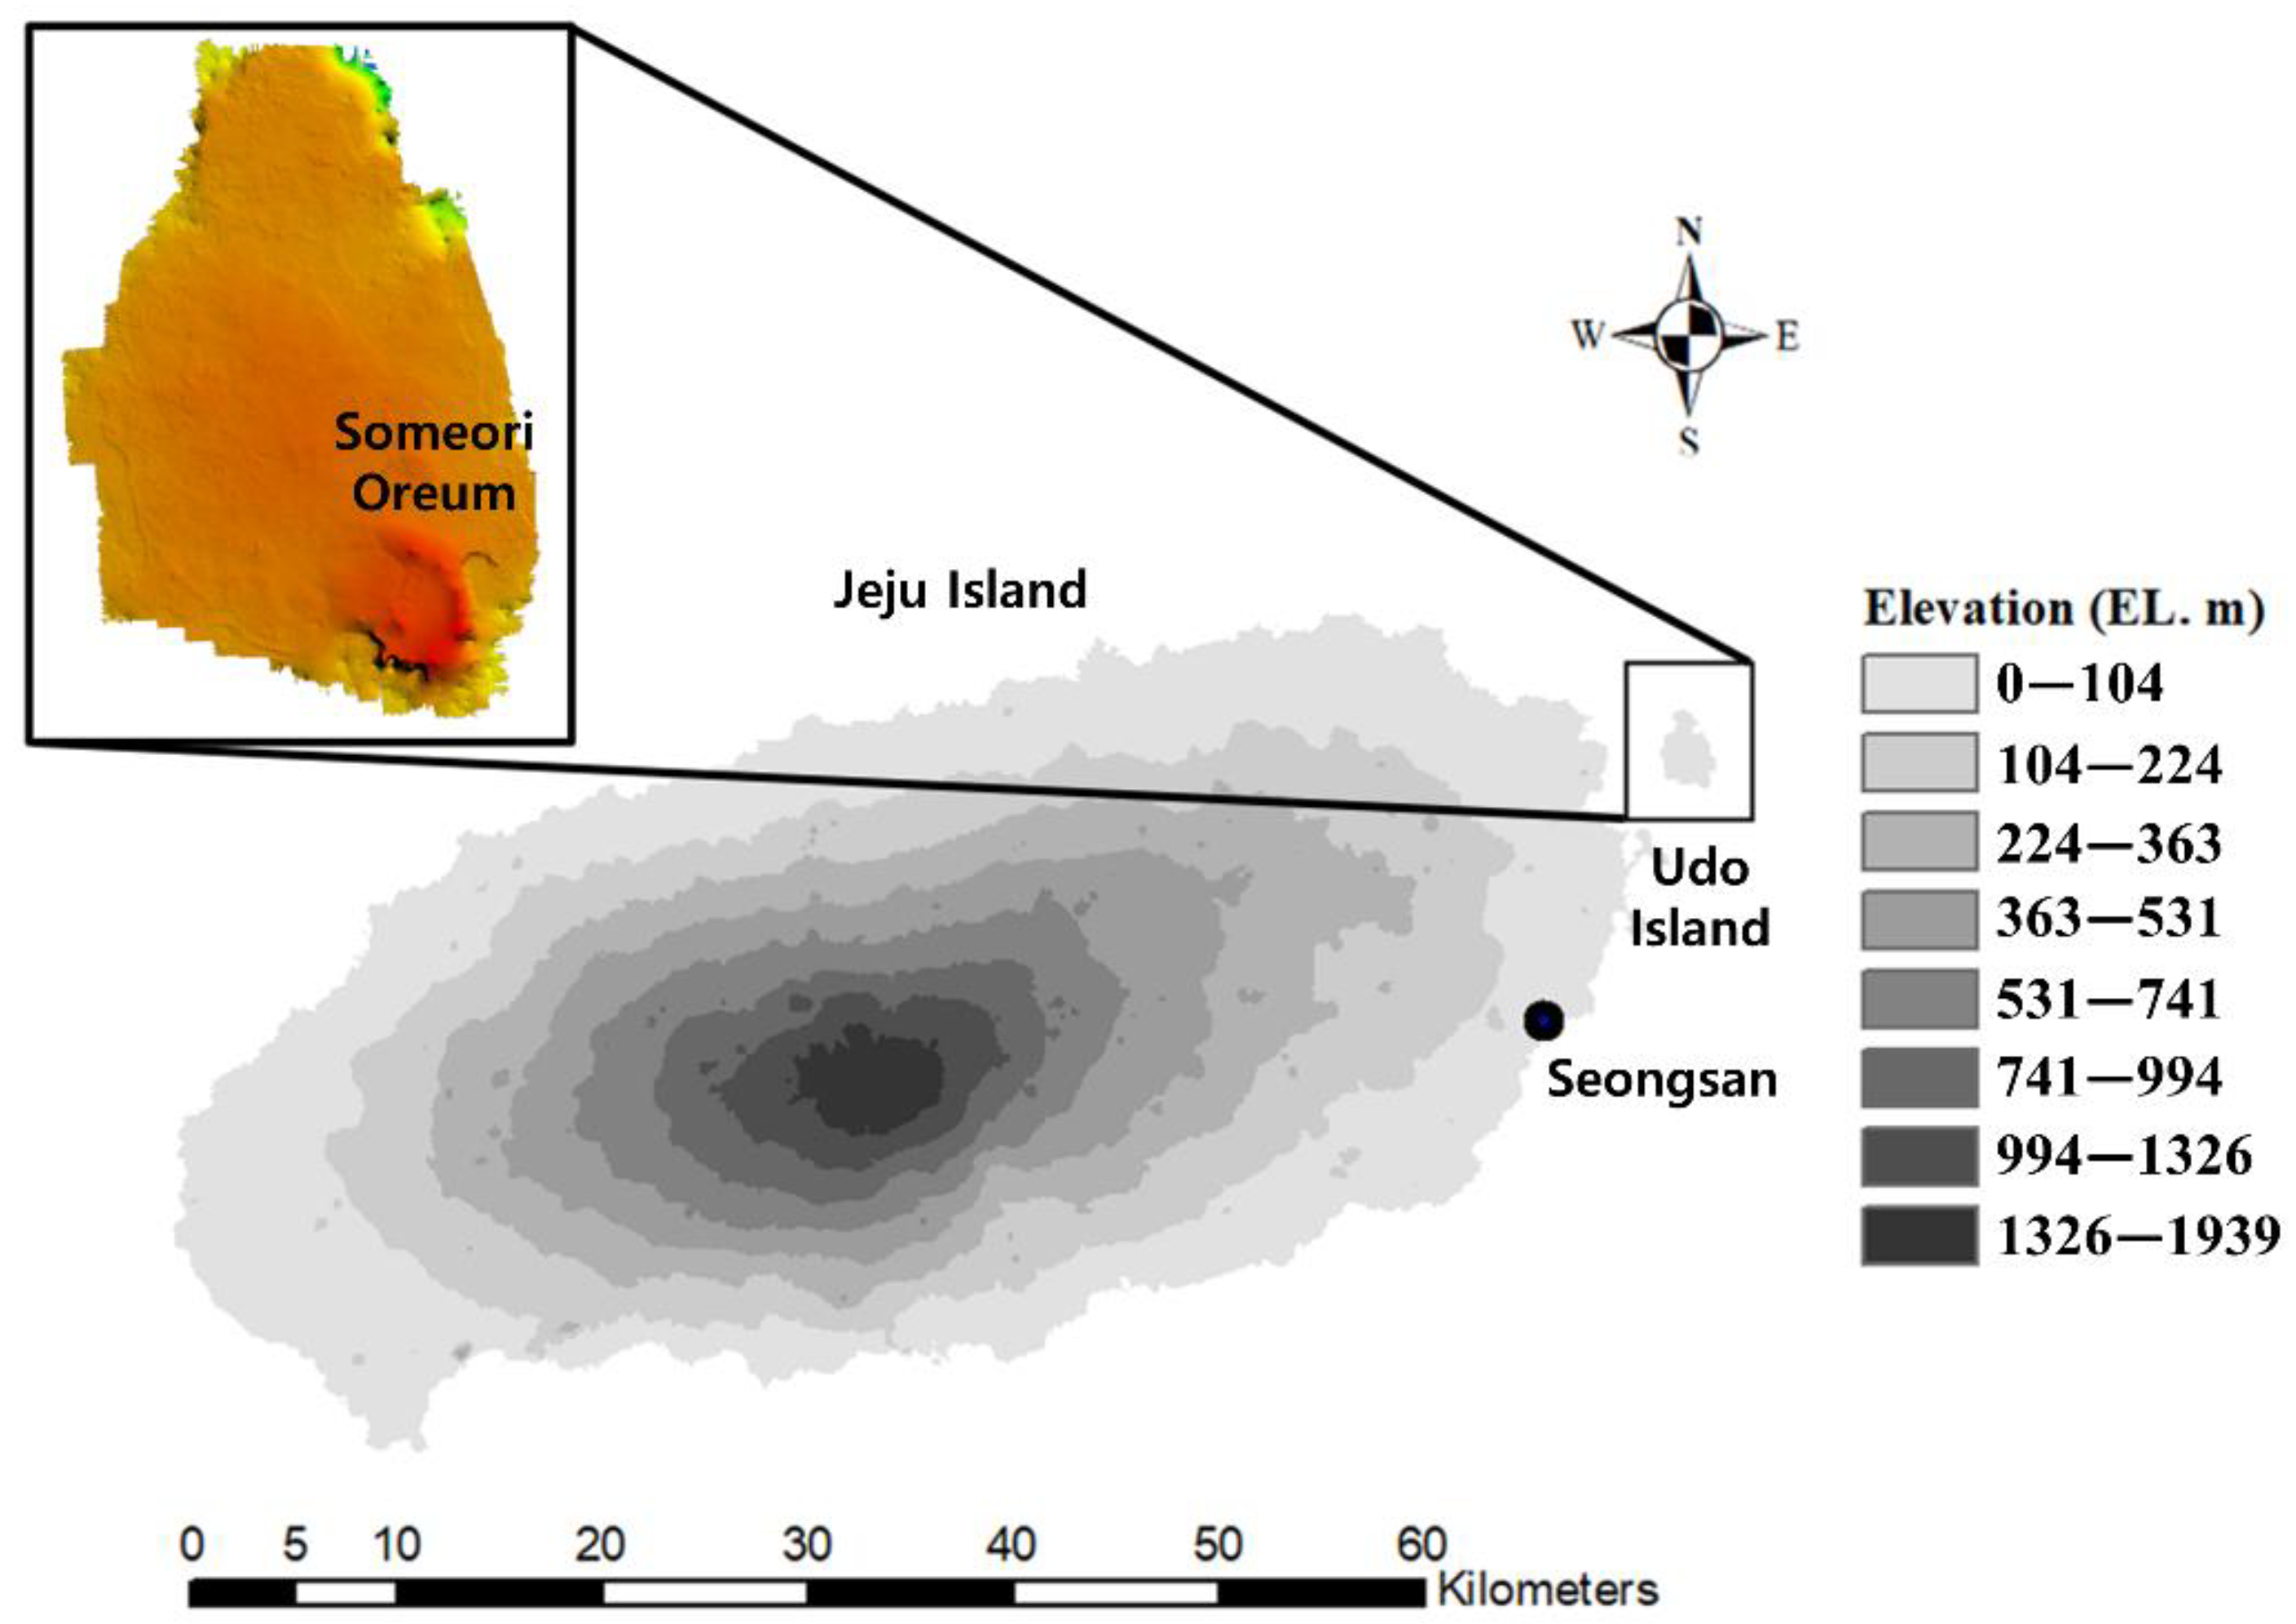
Udo is a small island located near the eastern part of Jeju Island. The area of Udo is just 6.1 km2, and its southeastern part is located on a small hill named the Someori Oreum. The Someori Oreum is made of pyroclastic deposits, and its height is 132.5 m. A small crater with a diameter of about 600 m and depth of about 40 m can also be found at the center of the Someori Oreum, which is open to the northwestern direction. The remaining area is the lava shield, which is mostly flat, with a height of less than 30 m. Figure 3 shows the location of Udo and its topographic characteristics. The meteorological data from Seongsan weather station were used in this study to represent the weather on Udo.
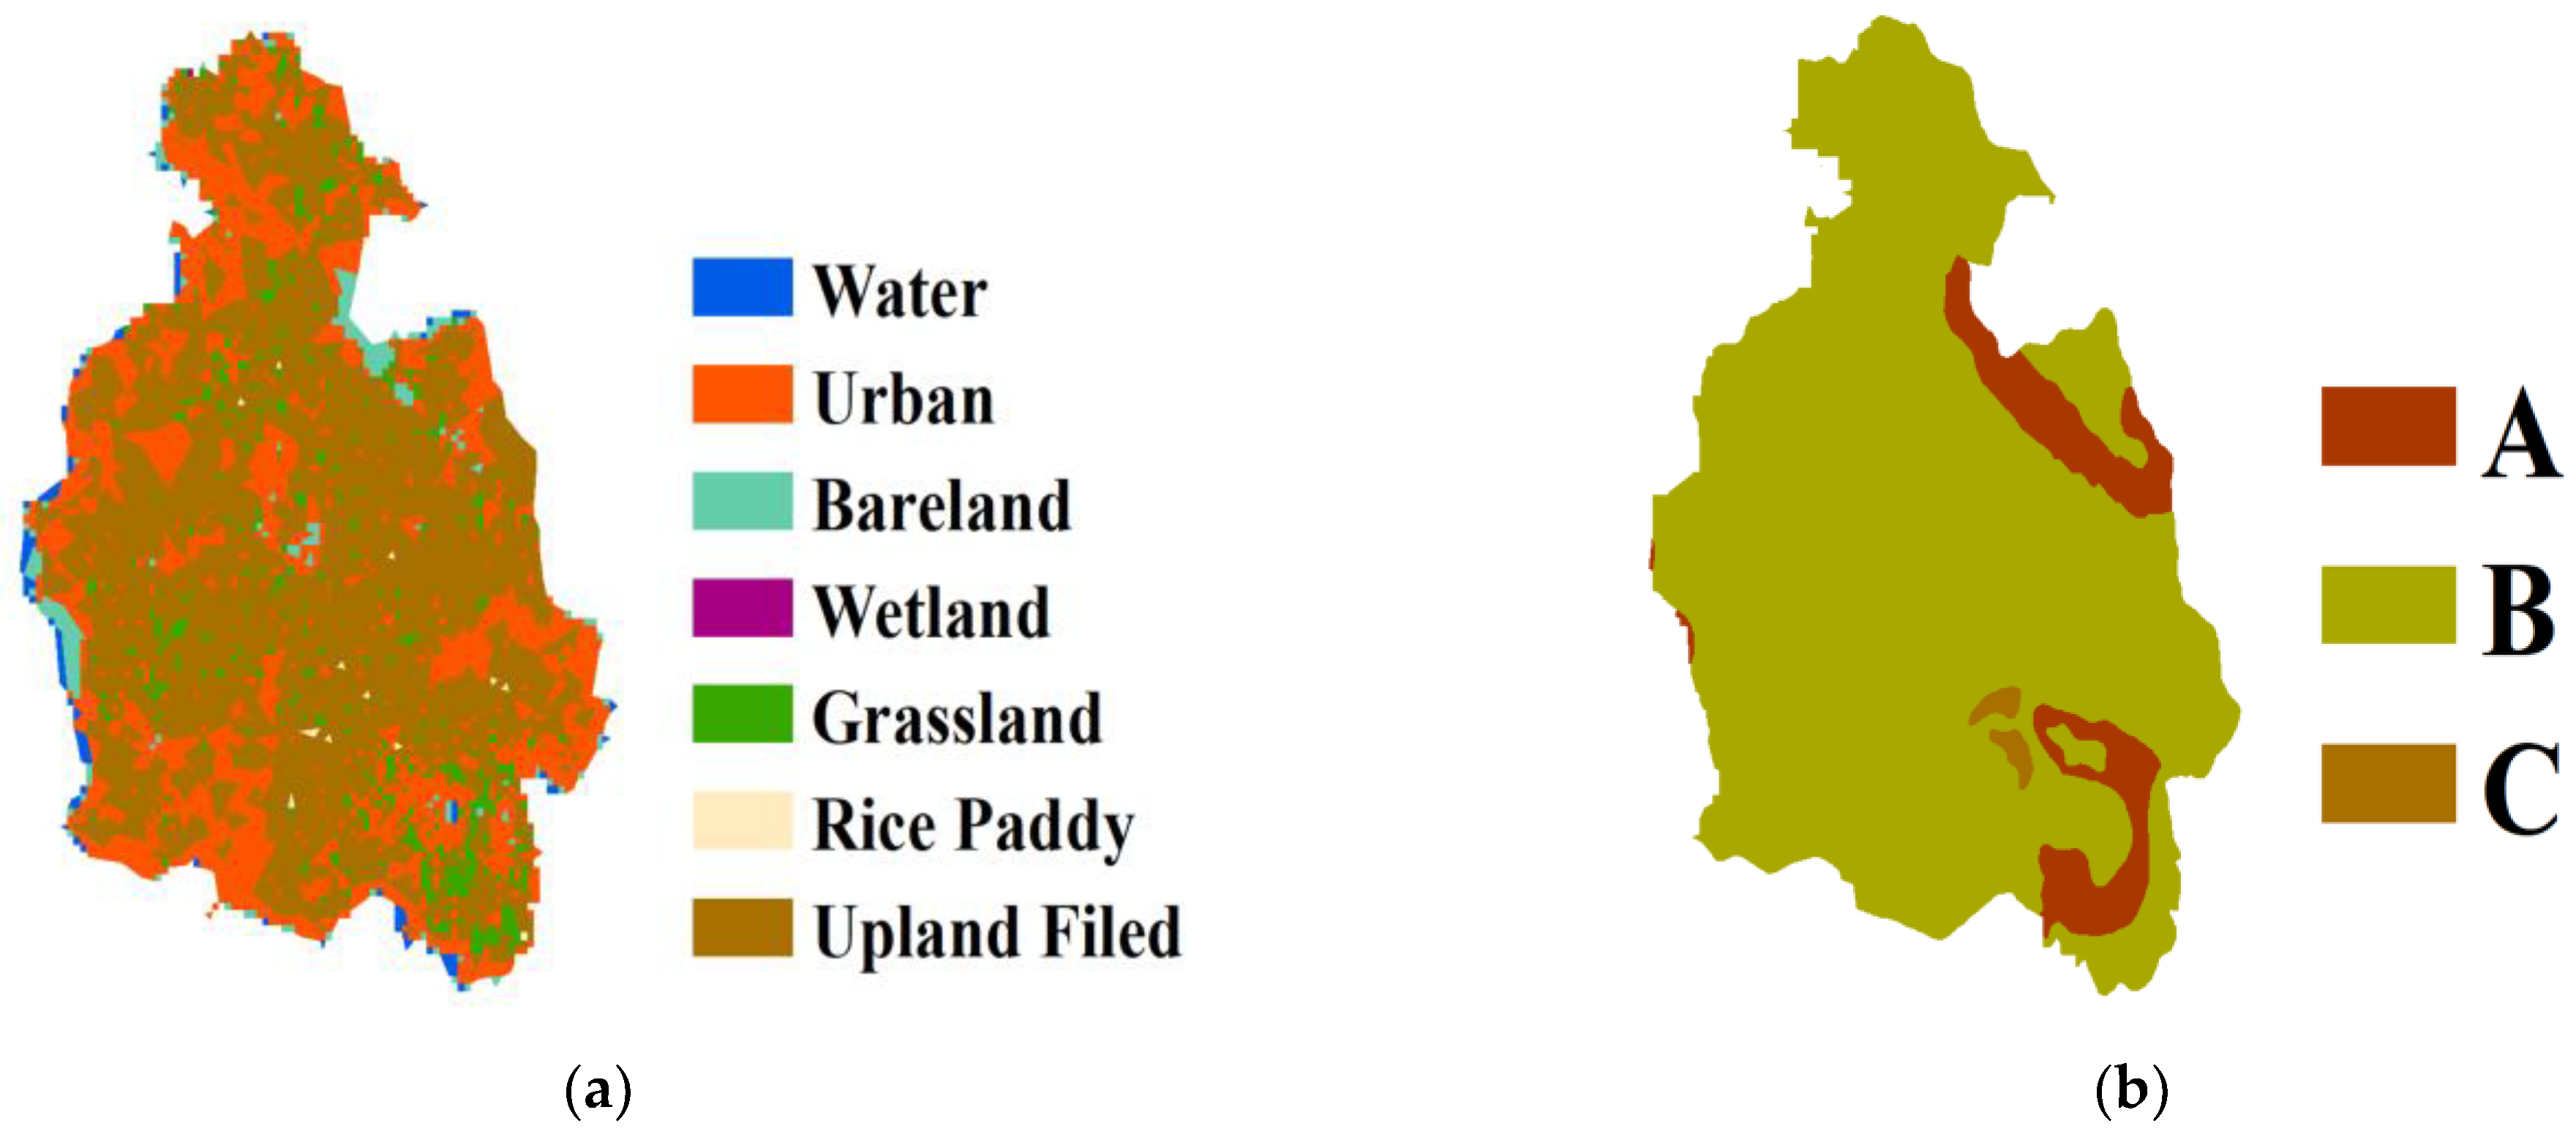
Figure 4a shows the information on land use, and Figure 4b shows the hydrological soil group over Udo. The digital soil map and the digital land use map can be obtained from the National Spatial Infrastructure Portal (http://data.nsdi.go.kr/ (accessed on 13 March 2021)) and Environmental Geographic Information Service (https://egis.me.go.kr/ (accessed on 13 March 2021)), respectively. Figure 4a shows that most of the area of Udo is used for farm fields (64.9%, 3.86 km2), while the remaining part is for forest (15.3%, 0.95 km2), roads (8.0%, 0.49 km2), etc. The hydrological soil group B is dominant on Udo (90.6%), as shown in Figure 4b. The hydrological soil group A covers 8.7%, while the hydrological soil group C covers just 0.7%. The representative crops on Udo include garlic, spring onion, peanut, and barley. In 2018, the farming area of garlic covered about 12.9%, spring onion about 21.0%, peanut about 40.2%, and barley about 25.9% [39]. Recently, the farming area planted in peanut on Udo has increased significantly.
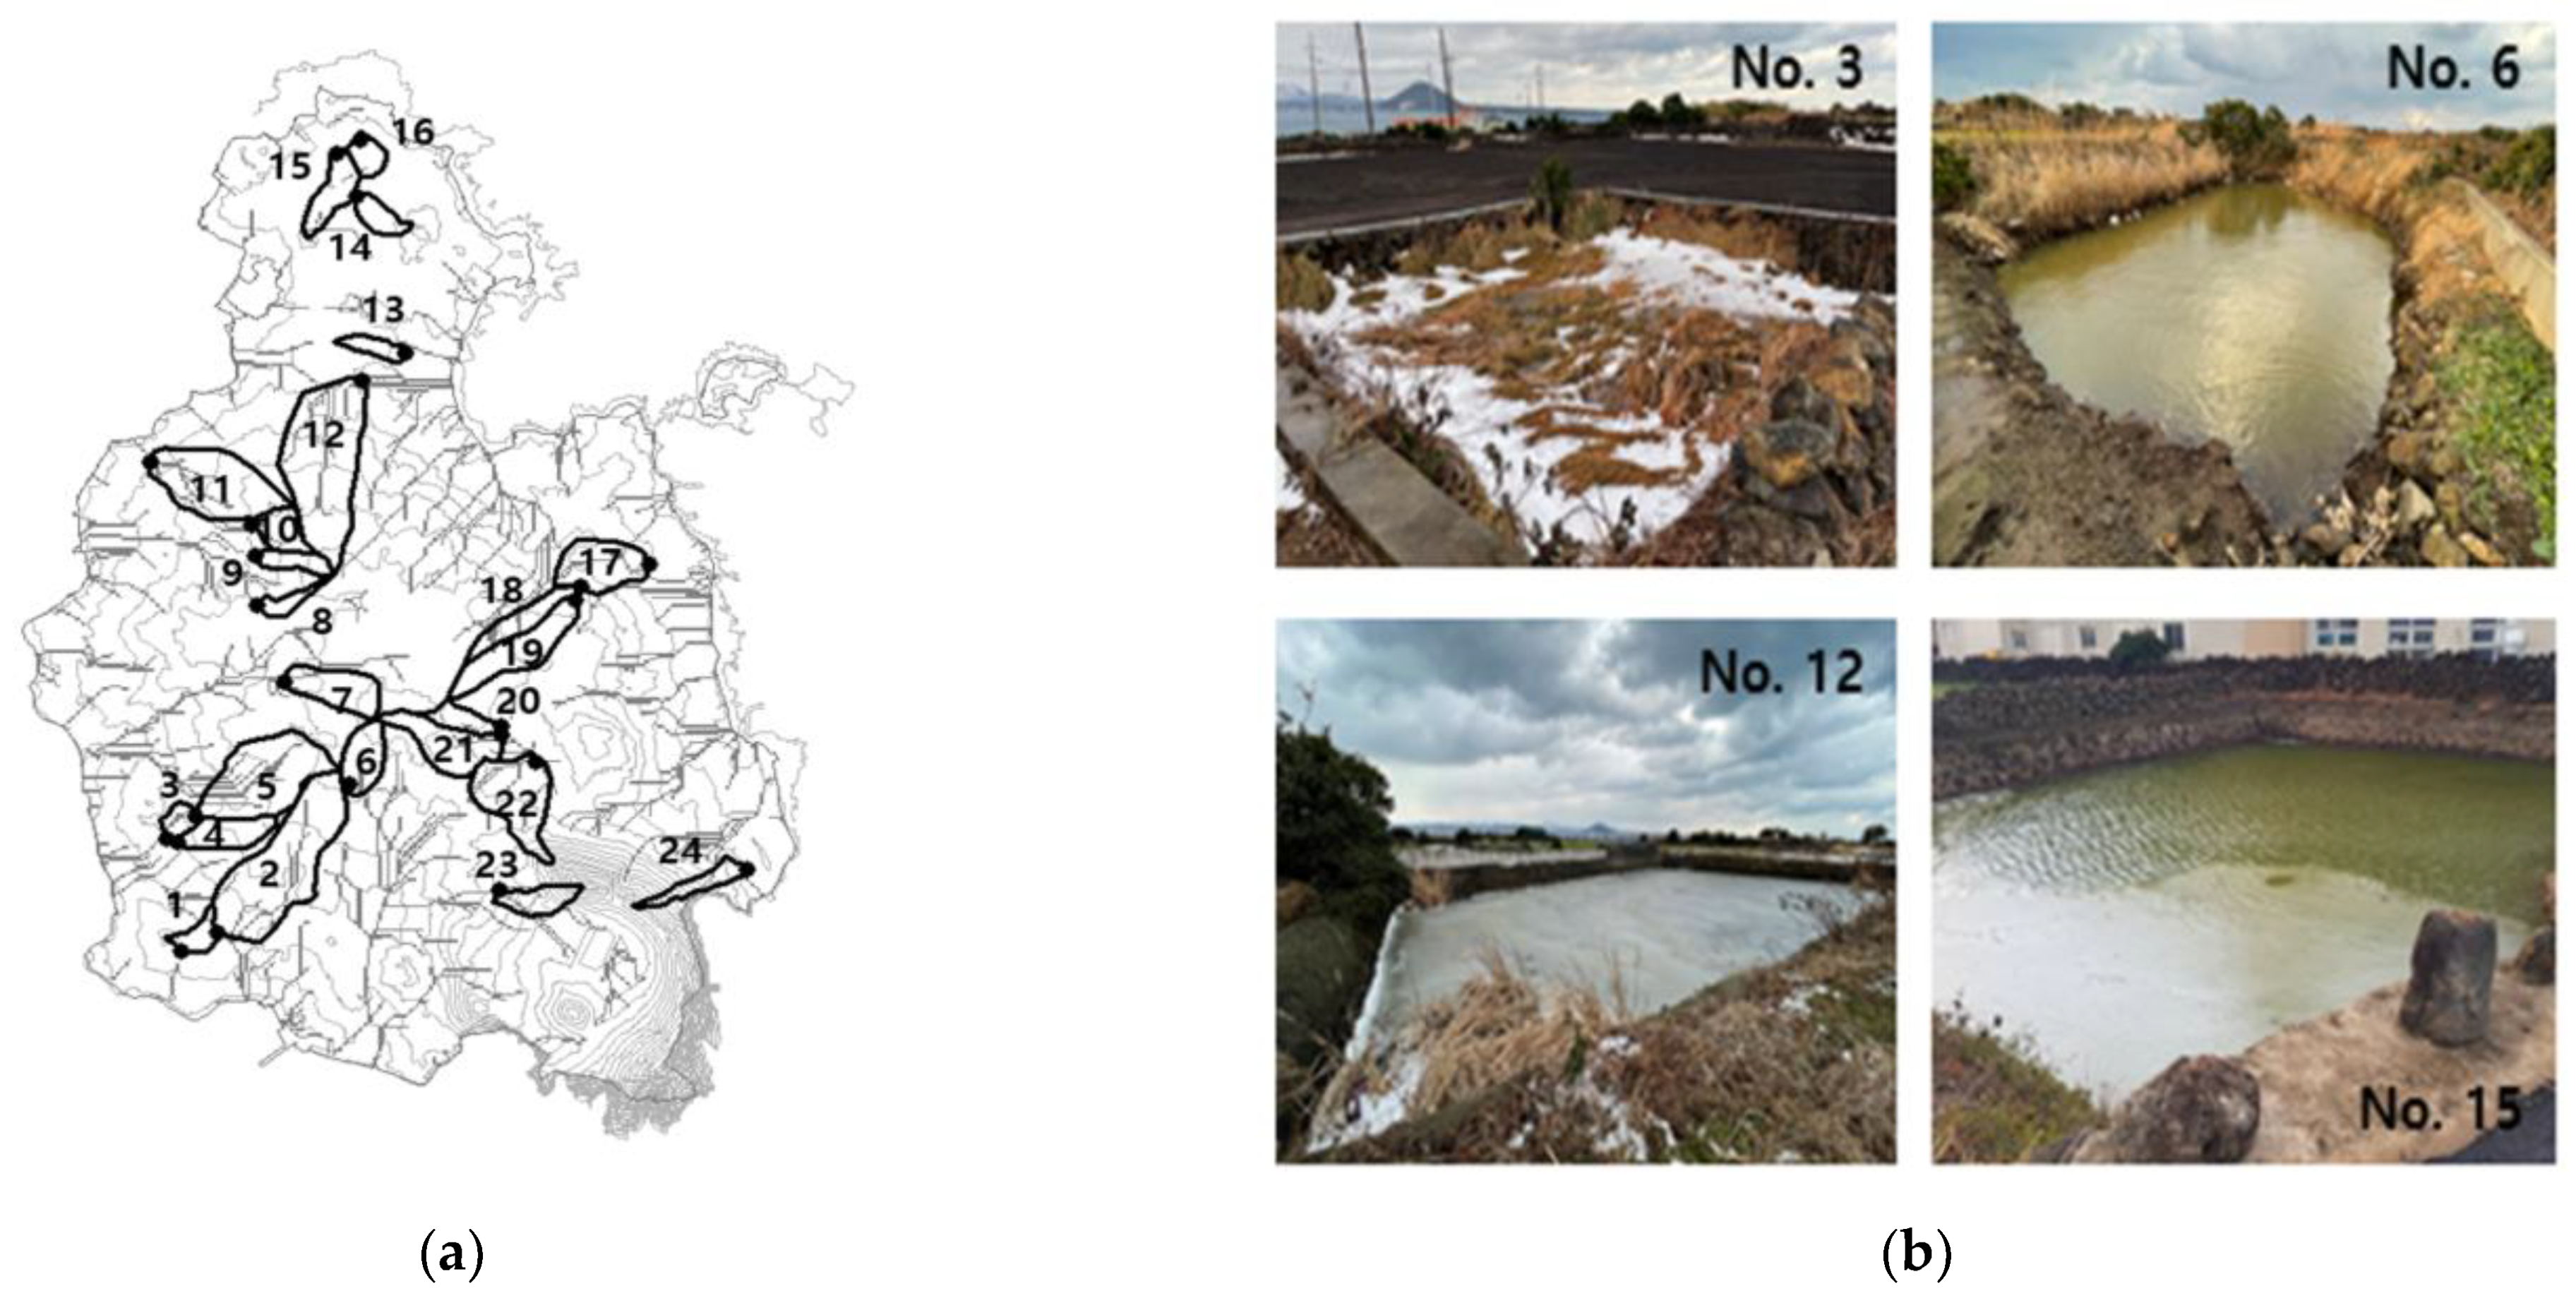
There are 24 mool-tongs (small farm reservoirs) on Udo, all of which were considered in this study. Each mool-tong is located at the exit of a small sub-basin, which was derived using a digital elevation model (DEM) of Udo. Figure 5 shows the location of the 24 mool-tongs and their sub-basins. Additionally, Figure 5b shows the typical shapes of mool-tongs (#3, #6, #12, and #15) on Udo. Table 3 also summarizes the reservoir bottom area, reservoir depth, reservoir volume, and the sub-basin area corresponding to each mool-tong. Here, the reservoir volume was estimated simply as the multiplication of the bottom area by the depth.
3.2. Data
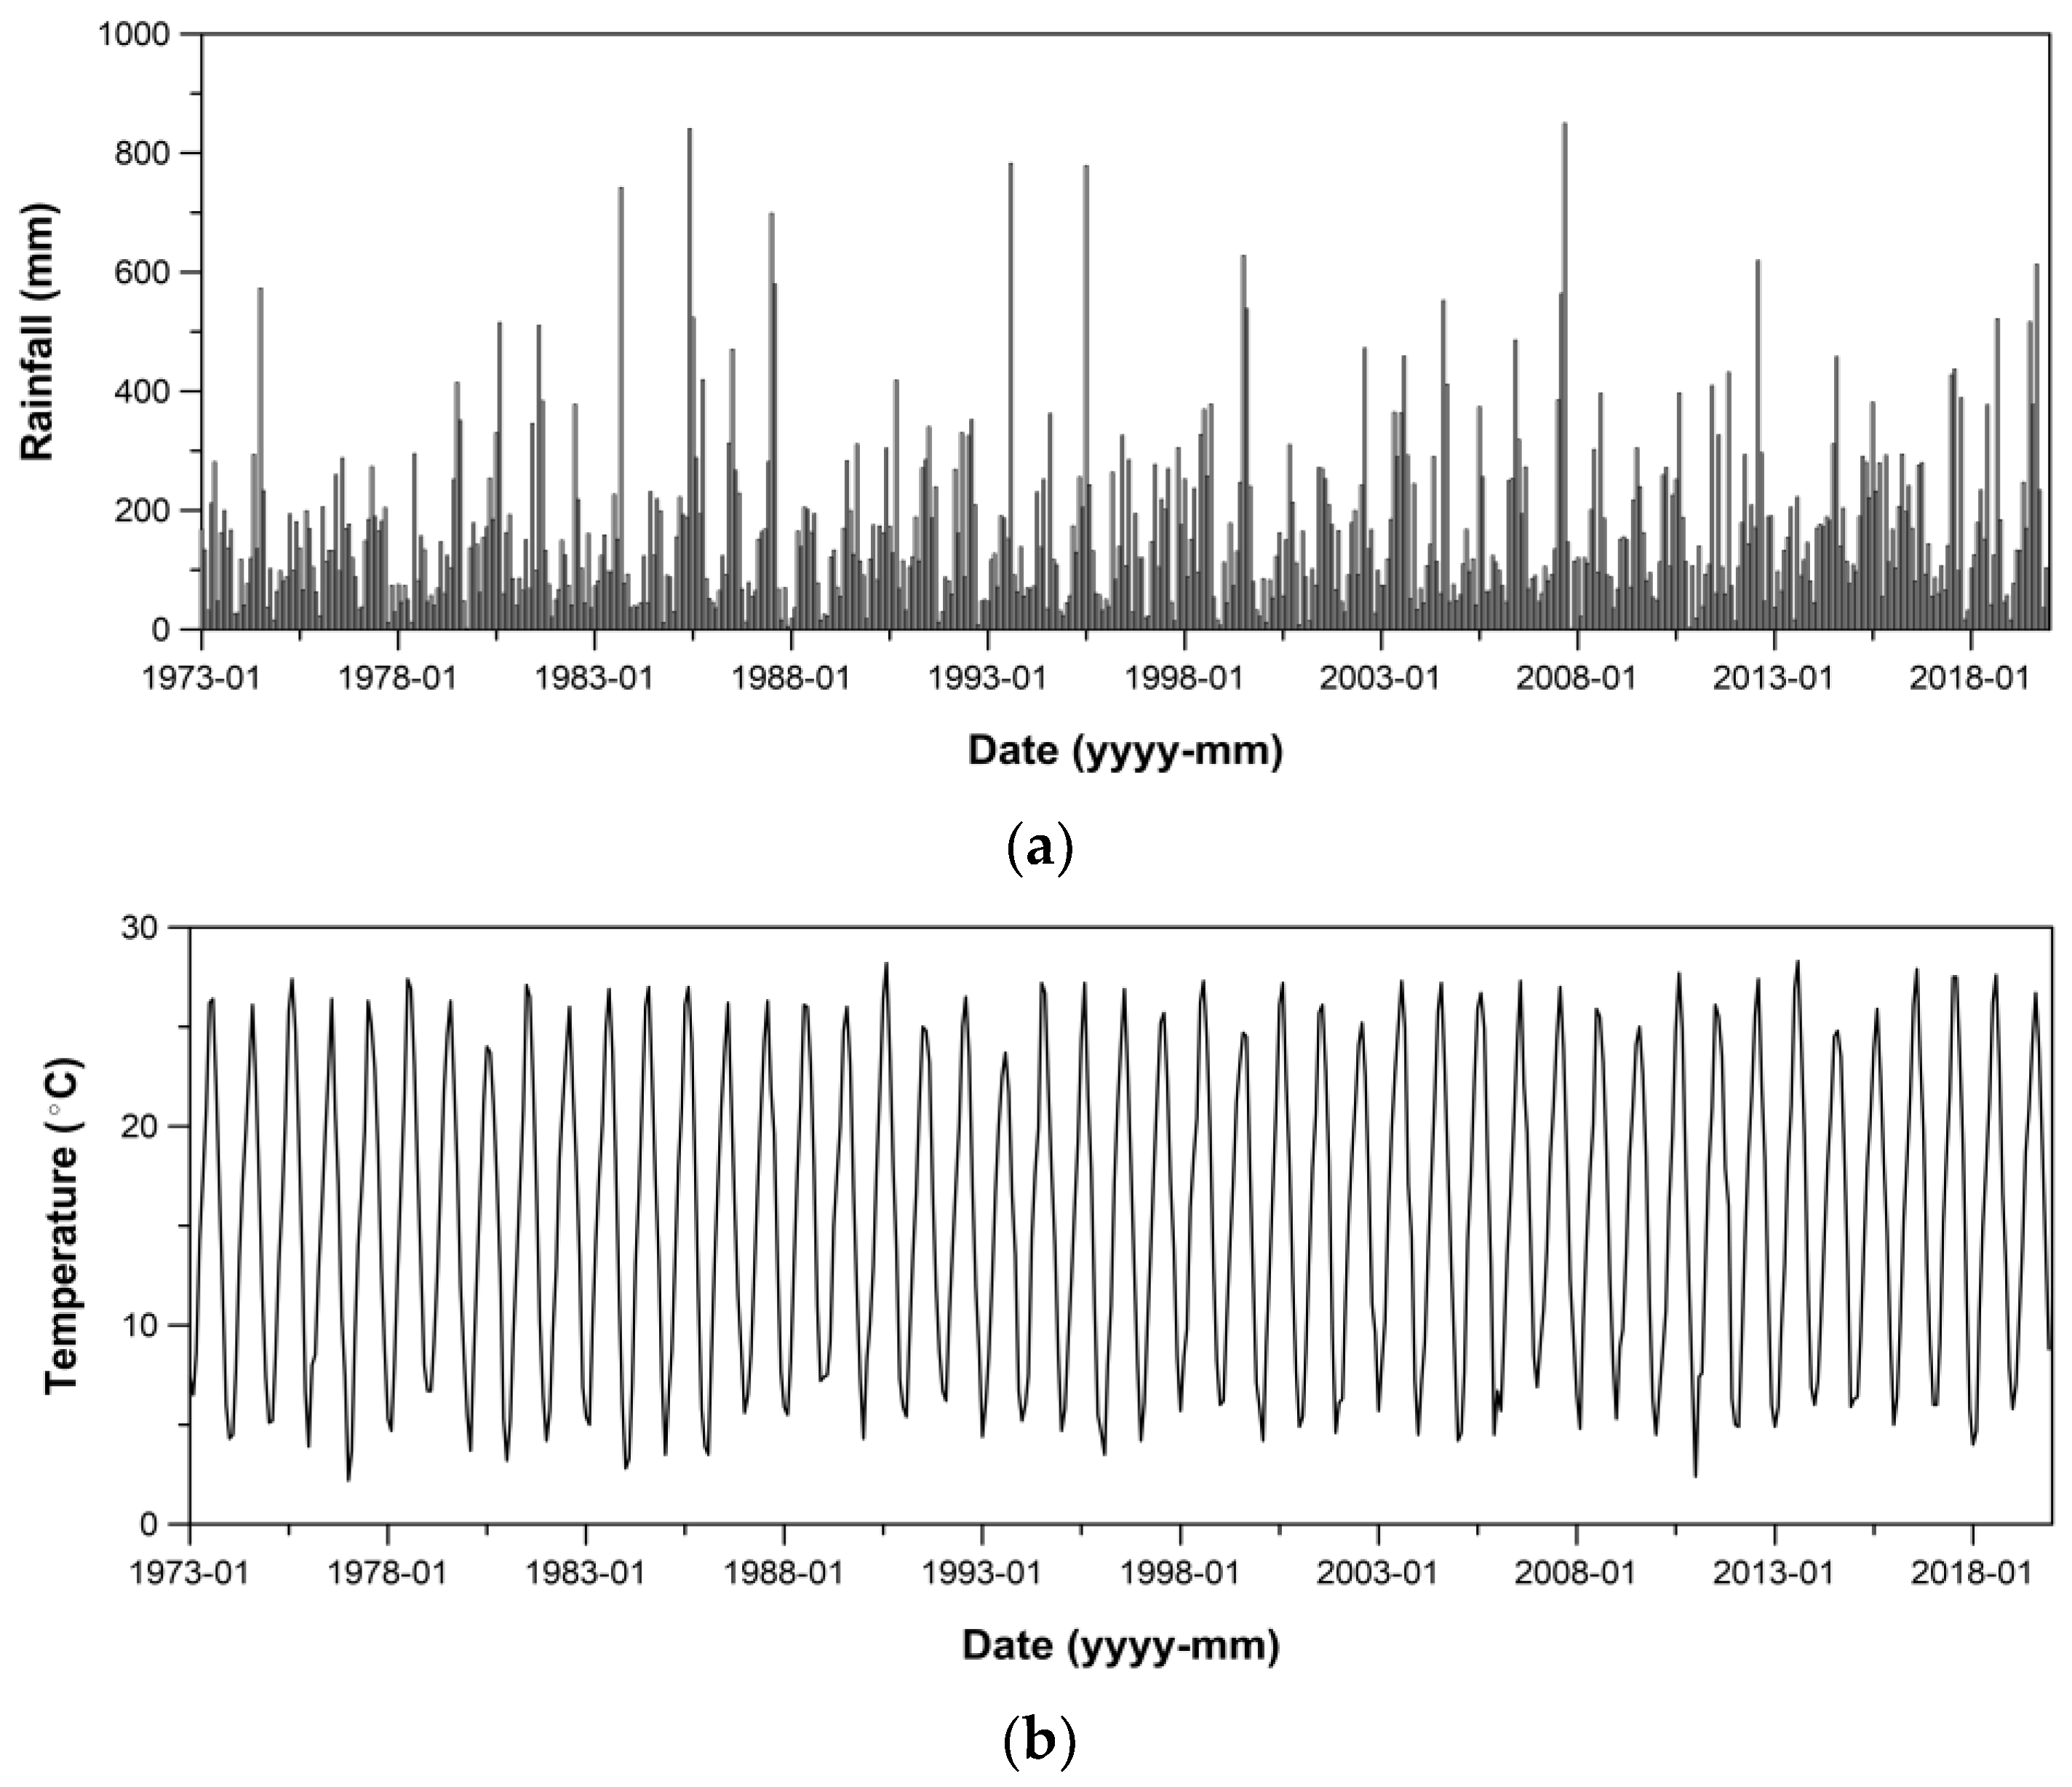
This study used the data collected at the Seongsan weather station, which include daily temperature, daily rainfall, and daily pan evaporation. The Seongsan weather station is the nearest weather station to Udo. There is no weather station on Udo. As the distance of the Seongsan weather station is just 15 km from Udo and the Seongsan weather station is also located near the seashore, it could be assumed that the meteorology at both locations is very similar. The data can be downloaded from the website of KMA (data.kma.go.kr). Basically, the daily data were used for simulation of the water storage in the mool-tongs. On the other hand, the monthly data were used in the application of the Blaney-Criddle method. Figure 6 shows the monthly rainfall and temperature data from 1973 to 2019 (47 years). Most of the rainfall was concentrated in the rainy summer season from June to September. The typical shape of seasonal variation can also be found in the temperature data.
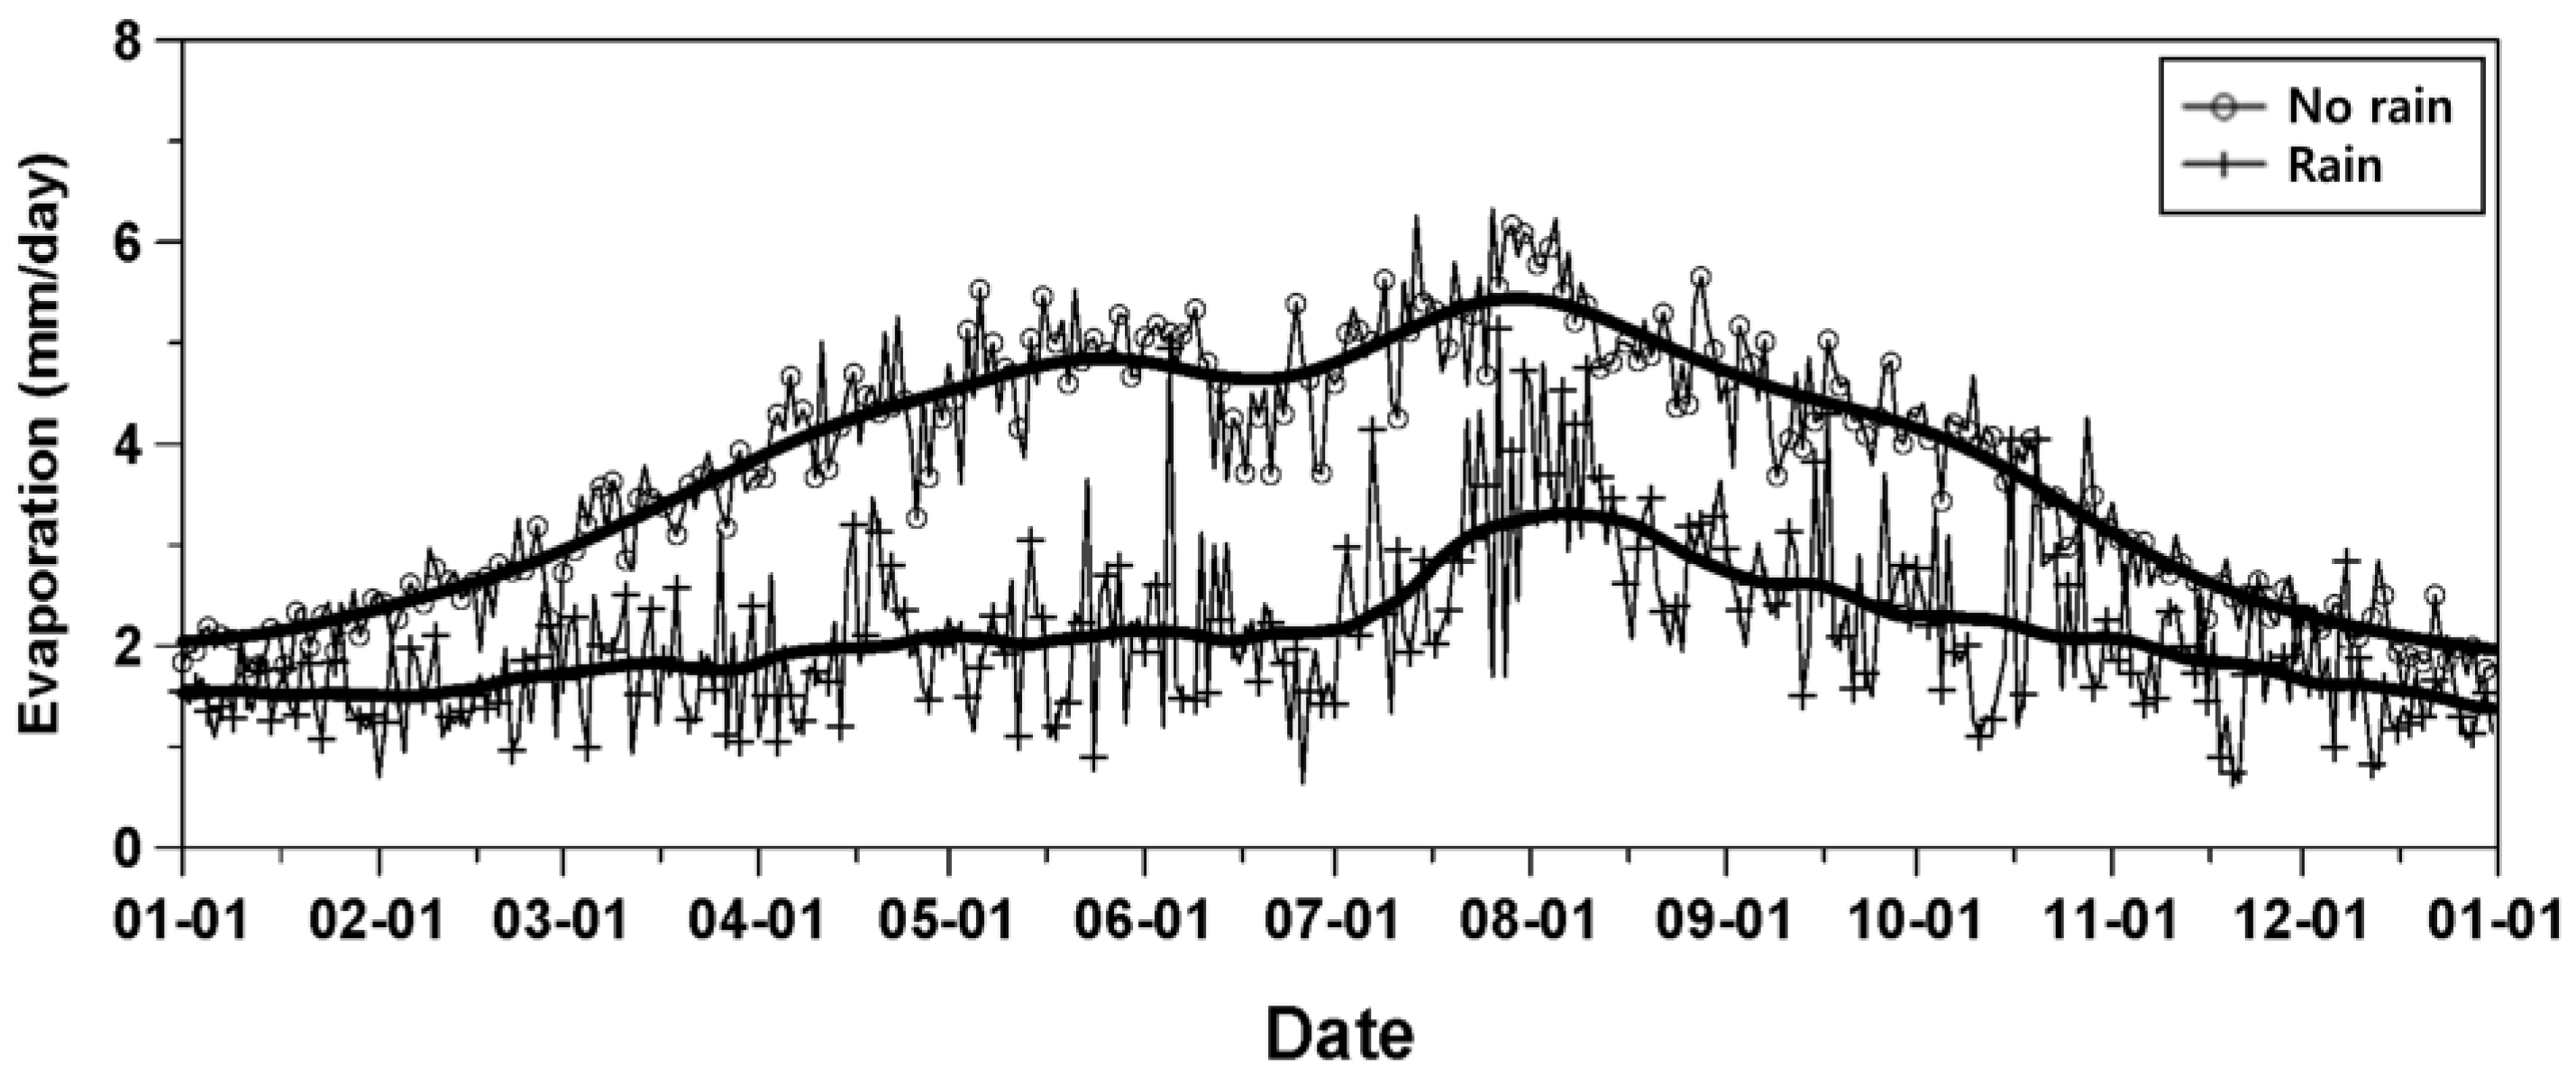
The pan evaporation data are also available at the Seongsan weather station, but only from 1977 to 1990. Measurement was discontinued from 1991. As it was not possible to use the actual evaporation measurement for simulation of the water storage in the mool-tongs, in this study the representative evaporation data were derived on a daily basis by considering the year-round variation in evaporation and its dependence on the rainfall occurrence. As is well known, evaporation varies significantly by season, and is also very dependent upon the rainfall occurrence. The rainfall amount and rainfall duration also affect the evaporation, but to simplify the simulation, were not considered in this study. Finally, Figure 7 shows the two curves that represent the year-round variation in evaporation under rain and no-rain conditions that were derived. In this figure, the two wiggly curves are those derived by averaging the available daily measurements of evaporation under the rain and no-rain conditions, respectively, while the solid lines are their smoothed versions. This study used the smoothed lines to determine the daily evaporation from the mool-tongs. That is, for the given date, evaporation from a mool-tong was determined simply by considering the rainfall occurrence condition.
4. Results and Discussion
4.1. Agricultural Water Demand
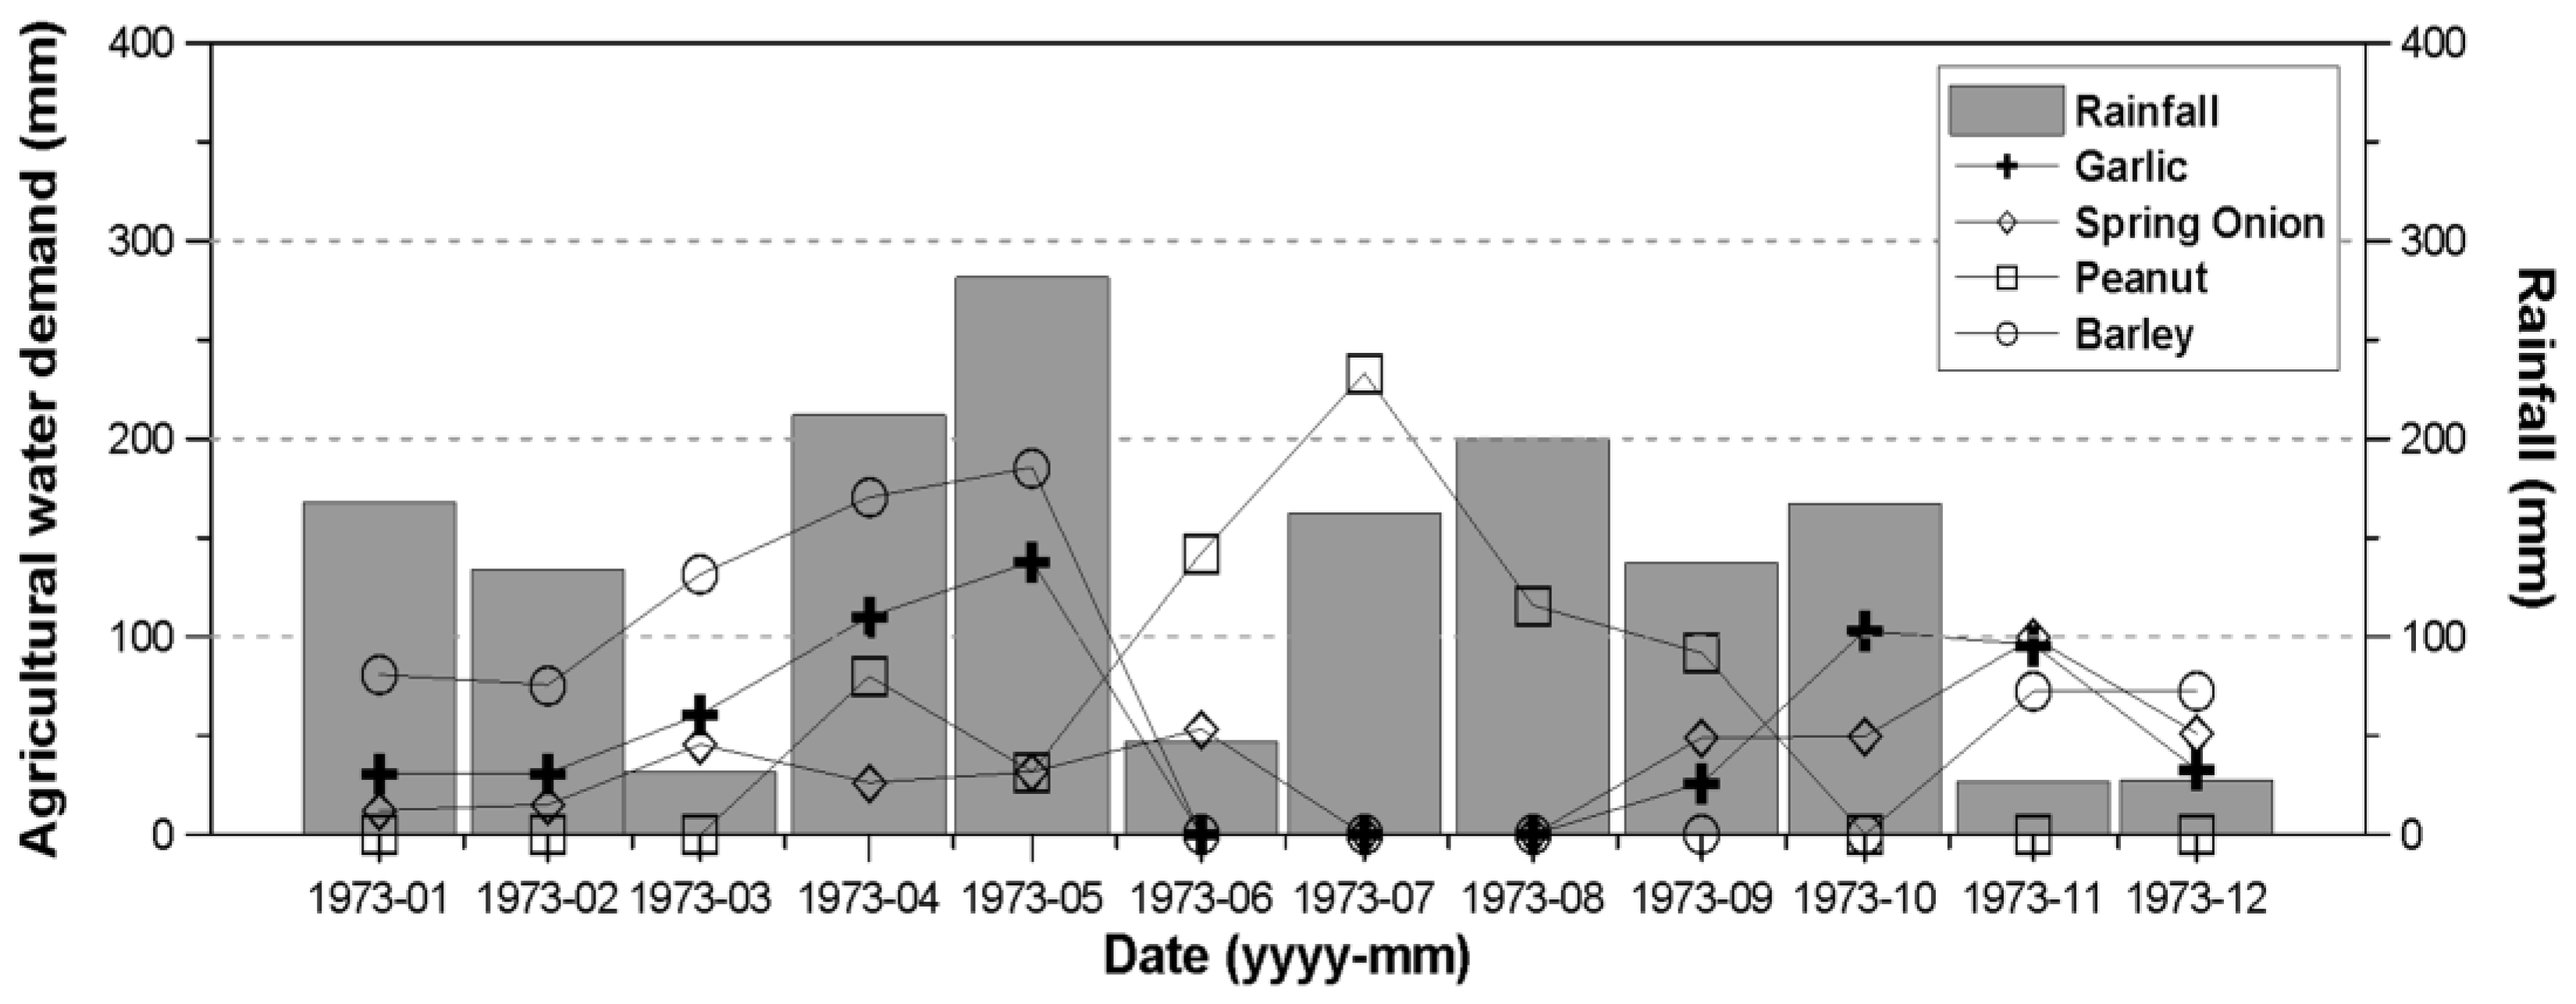
The consumptive use of water, or the agricultural water demand, was estimated by applying the Blaney-Criddle method for the four crops on Udo—garlic, spring onion, peanut, and barley. The agricultural water demand was estimated on a monthly basis. As an example, Figure 8 compares the monthly rainfall and agricultural water demand for the year 1973. The agricultural water demand for garlic was concentrated in the spring and fall seasons. The agricultural water demand for spring onion was also concentrated in the spring and fall seasons, but the total amount of water demand was estimated to be a bit less than that for garlic. On the other hand, the agricultural water demand for barley was found to be concentrated in the winter and spring seasons. As the growing period of peanut includes the summer season, its agricultural water demand was also estimated to be high in summer.
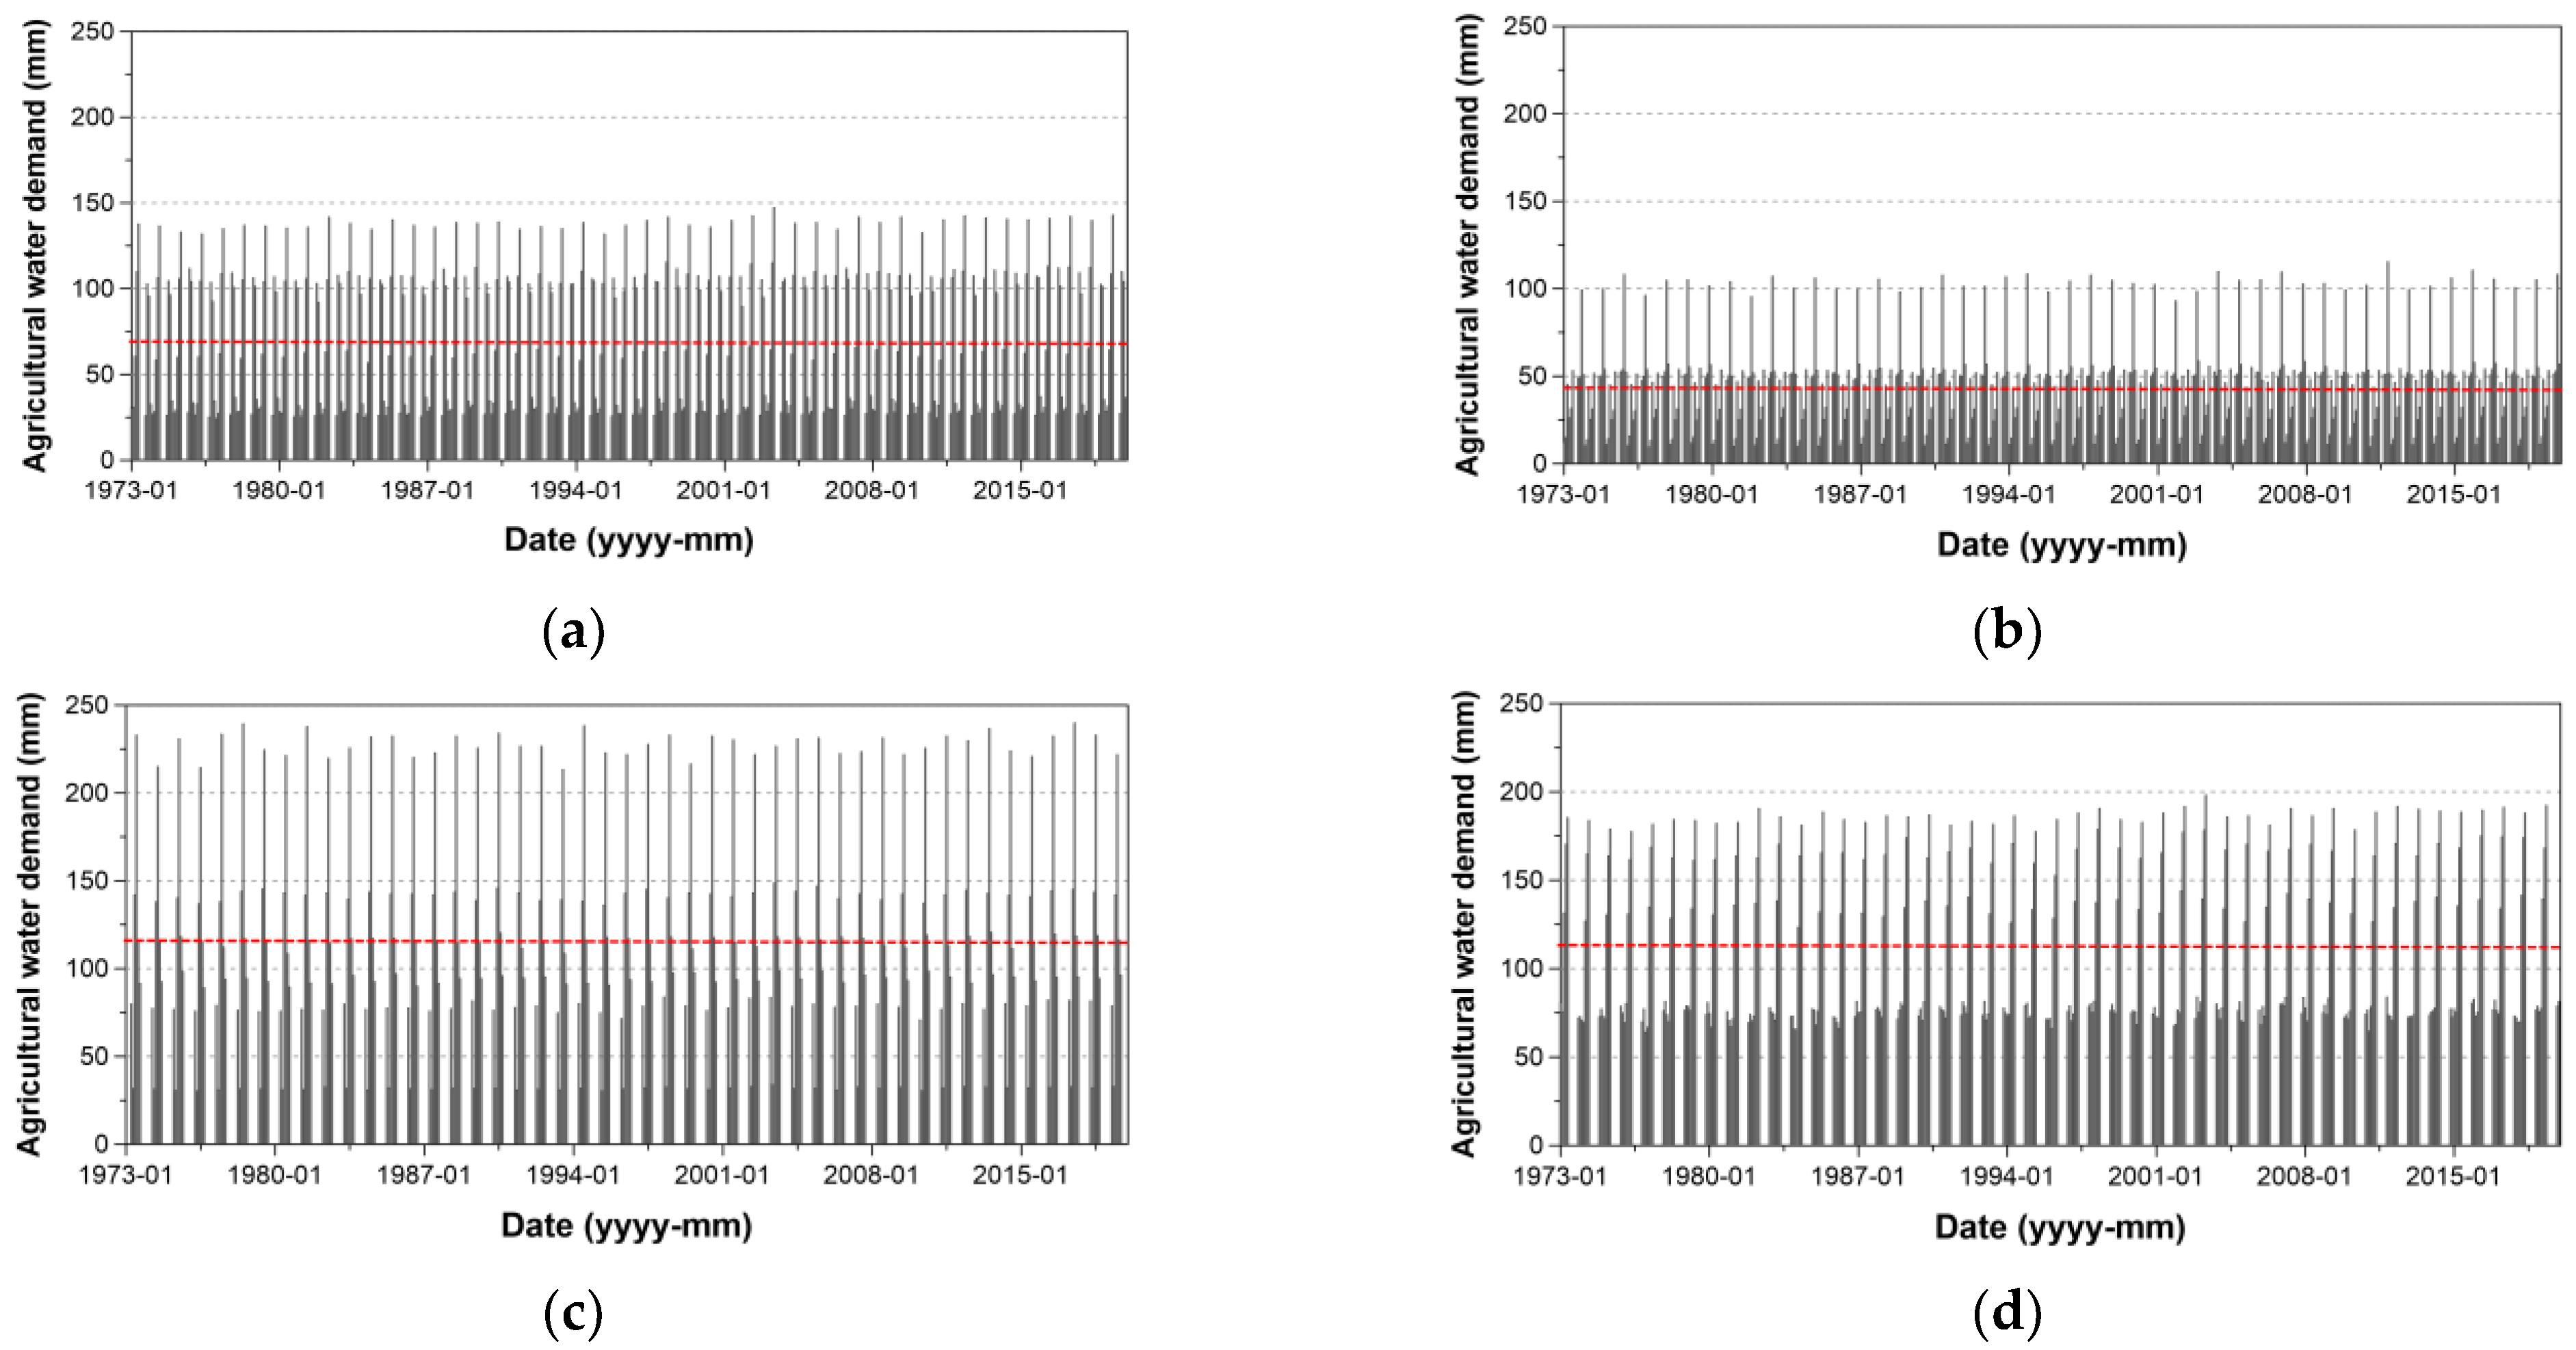
This study estimated the agricultural water demand of the four crops of interest in this study from 1973 to 2019. Figure 9 compares the temporal variation of agricultural water demand for those four crops, which shows obviously different patterns depending on the crop. The red horizontal line in Figure 9 represents the mean value of agricultural water demand for each crop. Both the crop coefficient and growing period affected the simulation result. Simply put, the agricultural water demand was high during the growing period, and low outside the growing period. The crop coefficient also varies depending on the growth stage of a crop. On average, the agricultural water demand of peanut was estimated to be about 115.0 mm/month, while that of barley was about 112.4 mm/month. Rather smaller estimates were derived for garlic and spring onion, which were 70.5 and 44.2 mm/month, respectively. The highest value was recorded for peanut, and the smallest for spring onion. As the growing period of peanut included the hot summer, the agricultural water demand was also estimated to be high. In general, the agricultural water demand was proportional to the temperature and sunshine duration.
4.2. Agricultural Water Deficit
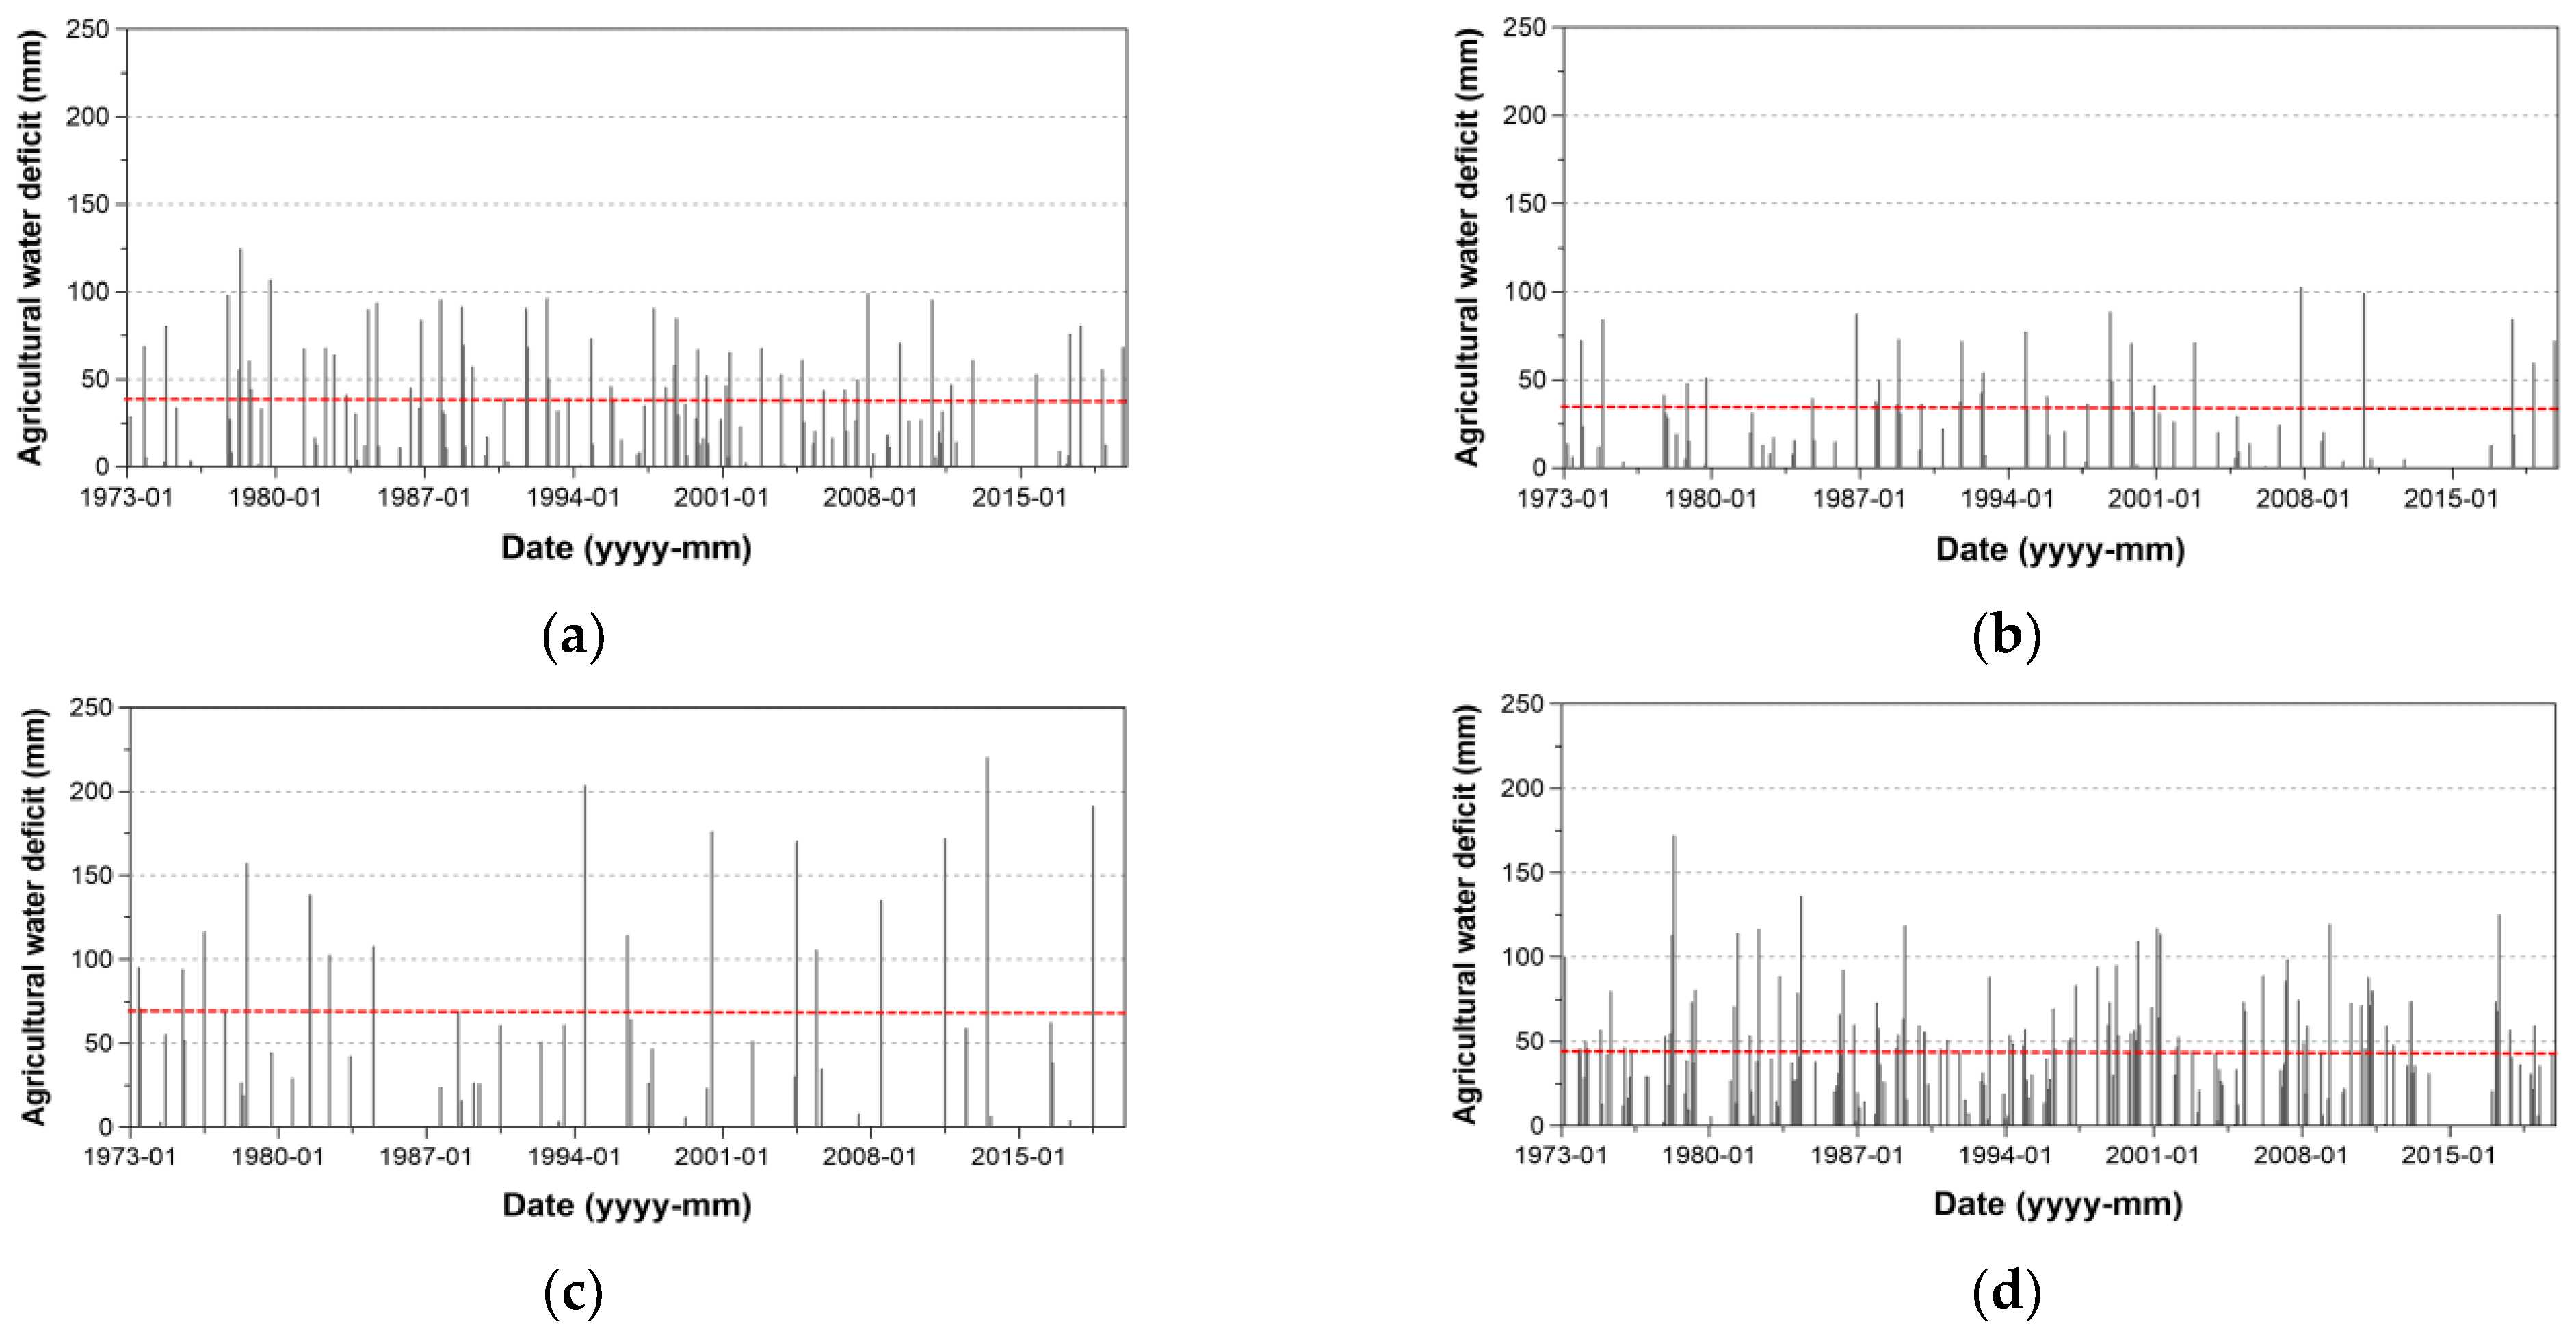
Agricultural water deficit indicates the shortage of monthly rainfall to meet the agricultural water demand. Thus, in the case where monthly rainfall is larger than agricultural water demand, the agricultural water deficit becomes zero. For example, in Figure 8, the rainfall amount in July was found to be smaller than the agricultural water demand, and their difference became the agricultural water deficit. Figure 10 shows the temporal variation in agricultural water deficit calculated from 1973 to 2019 for the four crops considered in this study. The red horizontal line in Figure 10 represents the mean value of the agricultural water deficit for each crop. Occurrence of agricultural water deficit was found to be most frequent for barley, and least frequent for peanut. However, whenever the agricultural deficit for peanut occurred, the amount of agricultural water deficit was larger than for the other three crops, indicating the highest deficit severity.
In this study, the results of agricultural water deficits derived from 1973 to 2019 were analyzed on an event basis. First, a deficit event was defined as a continuous deficit period, which was better to evaluate the impact of an agricultural water deficit on crop productivity. The deficit event could also be quantified by deficit duration, total amount of agricultural water deficit, and the mean of agricultural water deficit (i.e., deficit severity). The total amount of agricultural water deficit is simply the multiplication of the deficit duration by the mean of the agricultural water deficit. Table 4 summarizes the number of deficit events, agricultural water demand and deficit, deficit duration, and mean of agricultural water deficit for the four crops considered in this study. The table shows that the number of deficit events was highest for barley, and smallest for peanut. The deficit amount was also largest for barley (i.e., 98.2 mm), and smallest for spring onion (i.e., 51.5 mm). This result was partially due to the small rainfall amount from November to May of the following year, which is included in the growing period of barley. On the other hand, the agricultural water demand for spring onion was small, thus making the agricultural water deficit for spring onion smaller. The deficit severity for peanut was estimated to be 72.3 mm/month, which was mainly due to the deficit duration being rather short whenever a deficit event occurred.
4.3. Amount of Irrigation Water
Before determining the amount of irrigation water, the water storage in the mool-tong should be simulated. First, the curve number (CN) for each sub-basin needed to be determined by considering the soil and land use information, which was then used to estimate the effective rainfall. This effective rainfall was used as the inflow to the mool-tong. Table 5 summarizes the CNs determined for the 24 sub-basins. The highest CN of 82.4 was assigned to sub-basin #16, which was mainly due to the large portion of farm field with very low infiltration capacity. On the other hand, the lowest CN, 69.7, was assigned to sub-basin #17. This small CN was determined mainly by the large area of hydrological soil group A within the sub-basin. The average CN value for those 24 sub-basins was 76.3.
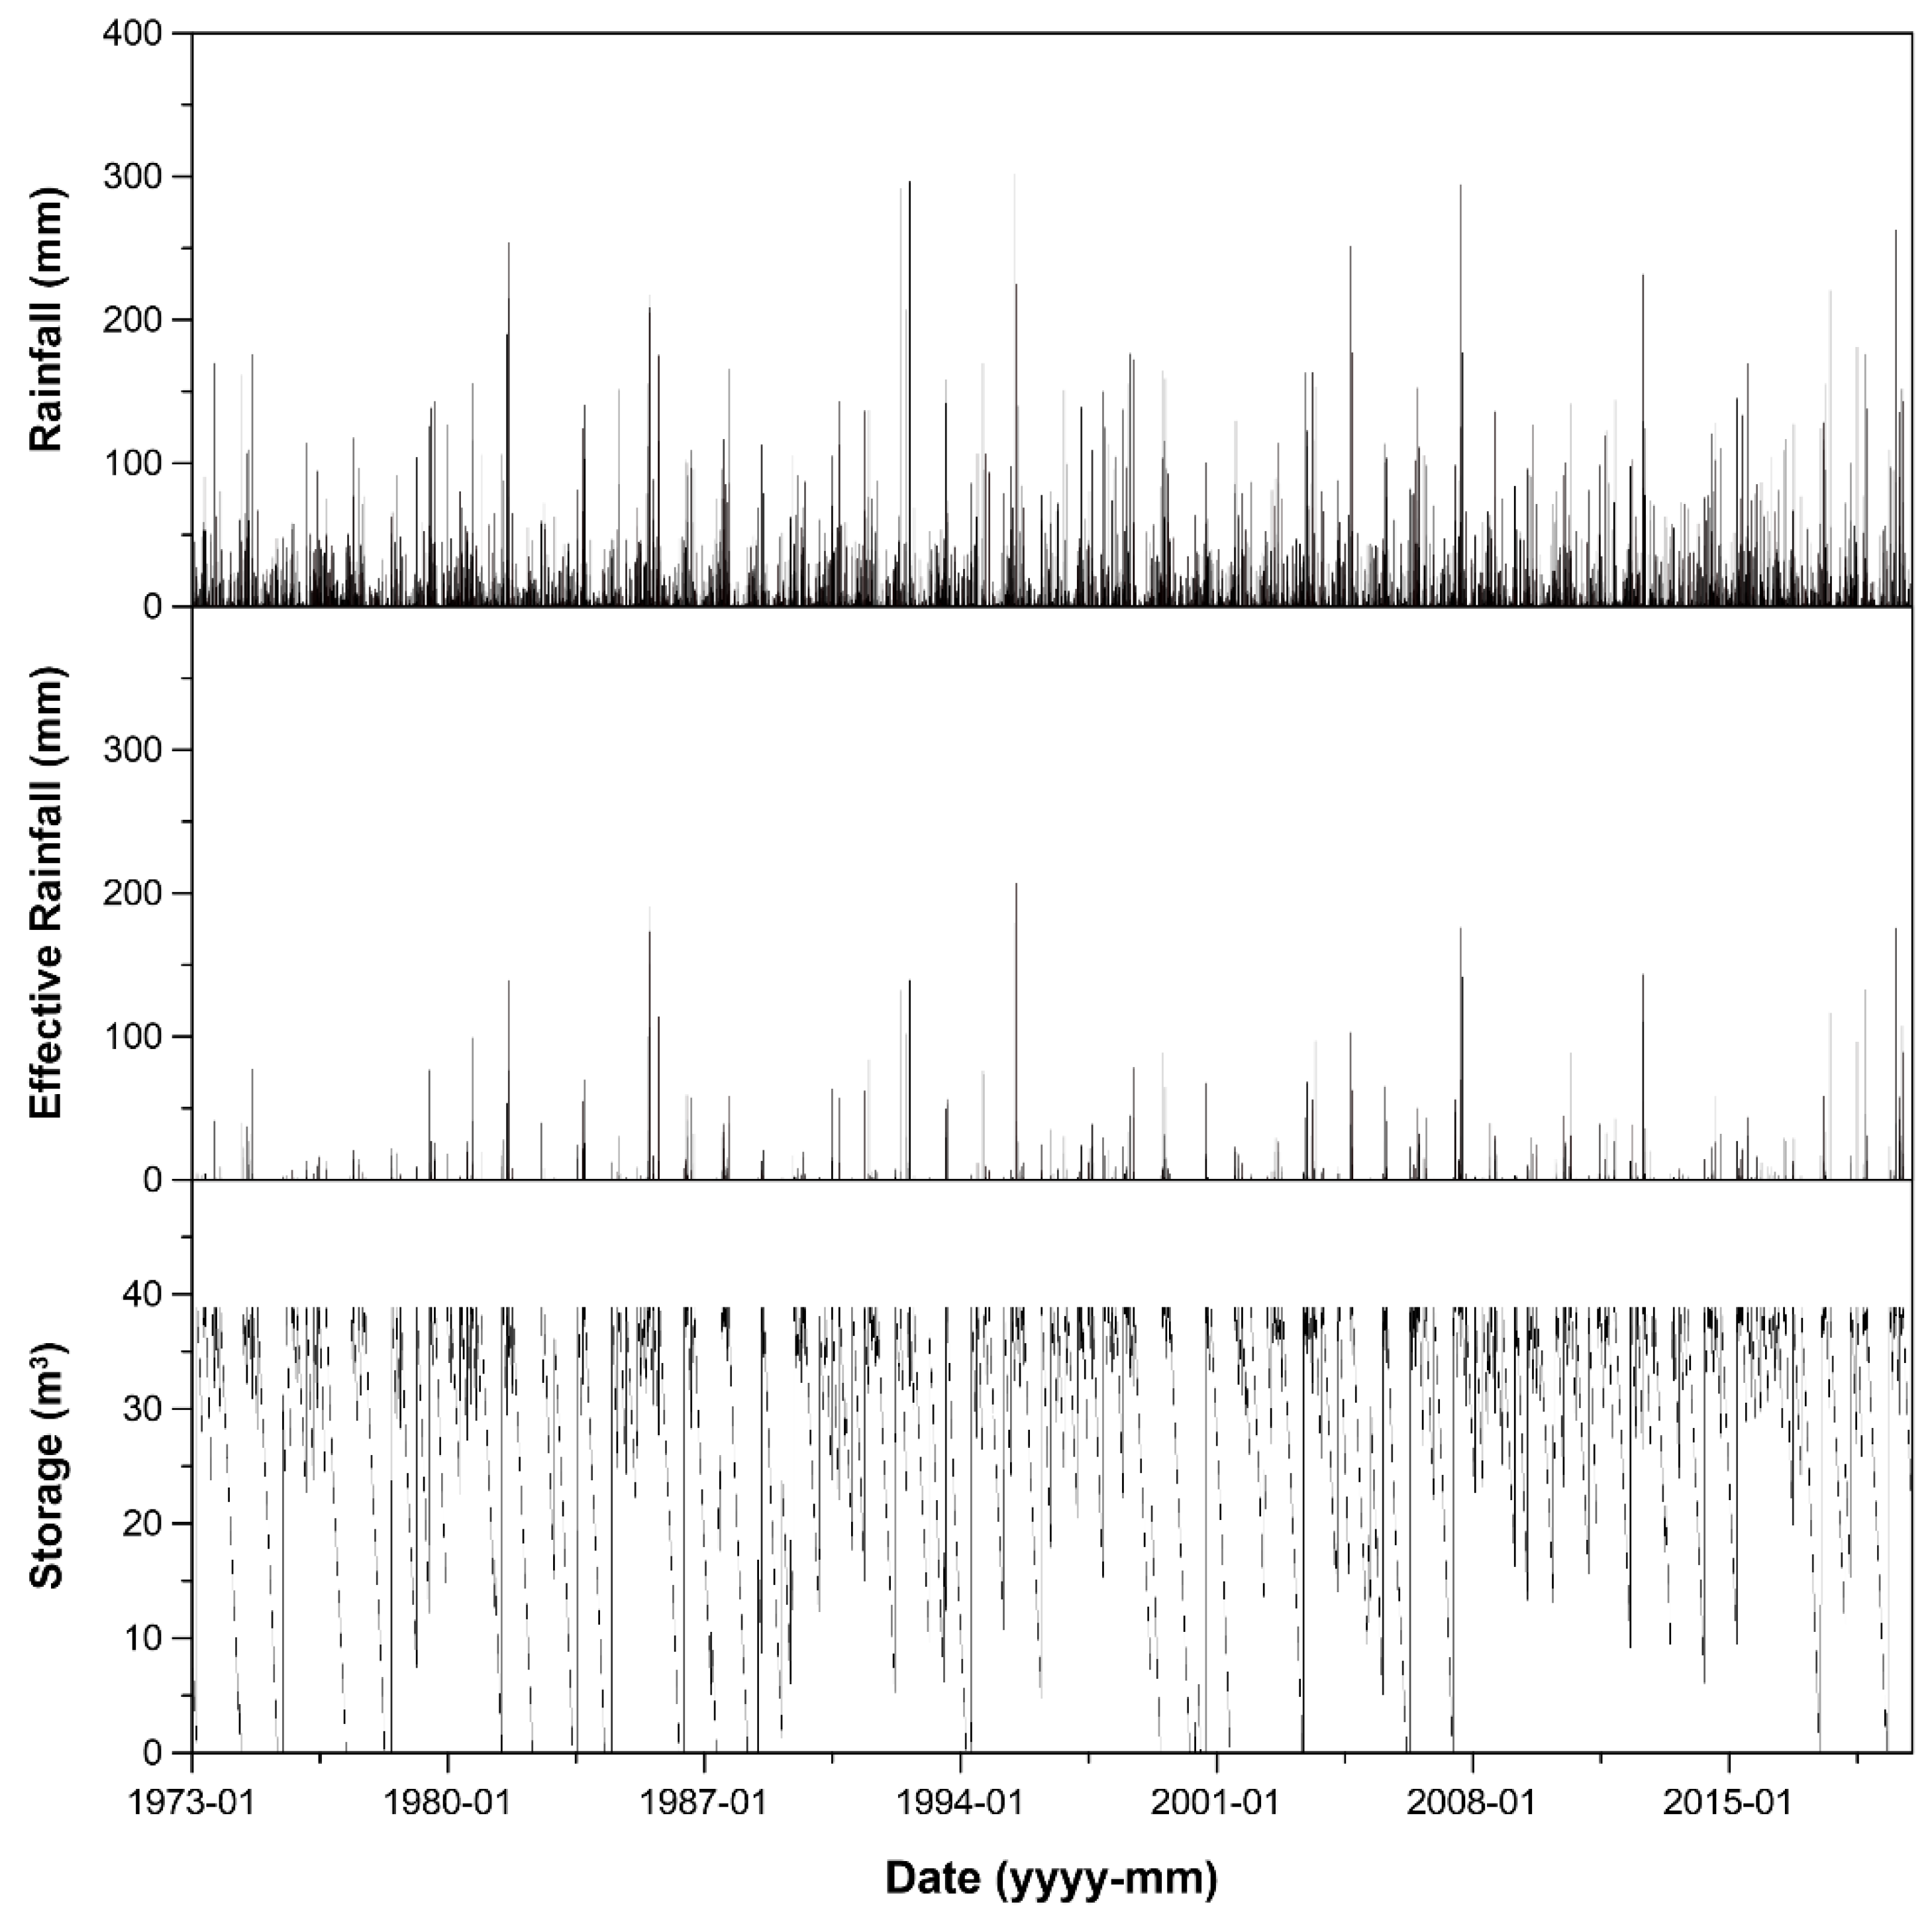
Second, the SCS–CN method was then applied to estimate the effective rainfall for each sub-basin. This effective rainfall was used as the inflow to the corresponding mool-tong. The simple water balance model was then applied to estimate the water storage in the mool-tong. Figure 11 shows the rainfall, effective rainfall, and water storage in mool-tong #1. Basically, due to the large amount of infiltration, slightly smaller effective rainfall was estimated. By considering both the evaporation loss from the surface of the mool-tong and the infiltration loss from the bottom of the mool-tong, the water storage in the mool-tong could be estimated. The maximum value of the water storage in mool-tong #1 was found to be just 38.9 m3, as shown in Figure 11, which was, in fact, the maximum storage capacity of mool-tong #1.
Finally, the monthly amount of irrigation water was estimated by following the procedure explained in Section 2.2. Basically, the irrigation was limited to the sub-basin corresponding to the mool-tong of interest. Moreover, the amount of irrigation water was dependent upon the water storage in the mool-tong. Additionally, it was assumed that the portion of each crop was the same for all 24 sub-basins. As previously mentioned, and based on the Development Plan for Udo in 2018 [39], the share of the cultivated area in garlic was 12.9%, that for spring onion, 21.0%; that for peanut, 40.2%; and that for barley, 25.9%. These shares of the cultivated area were necessary to distribute the irrigation water to these four crops.
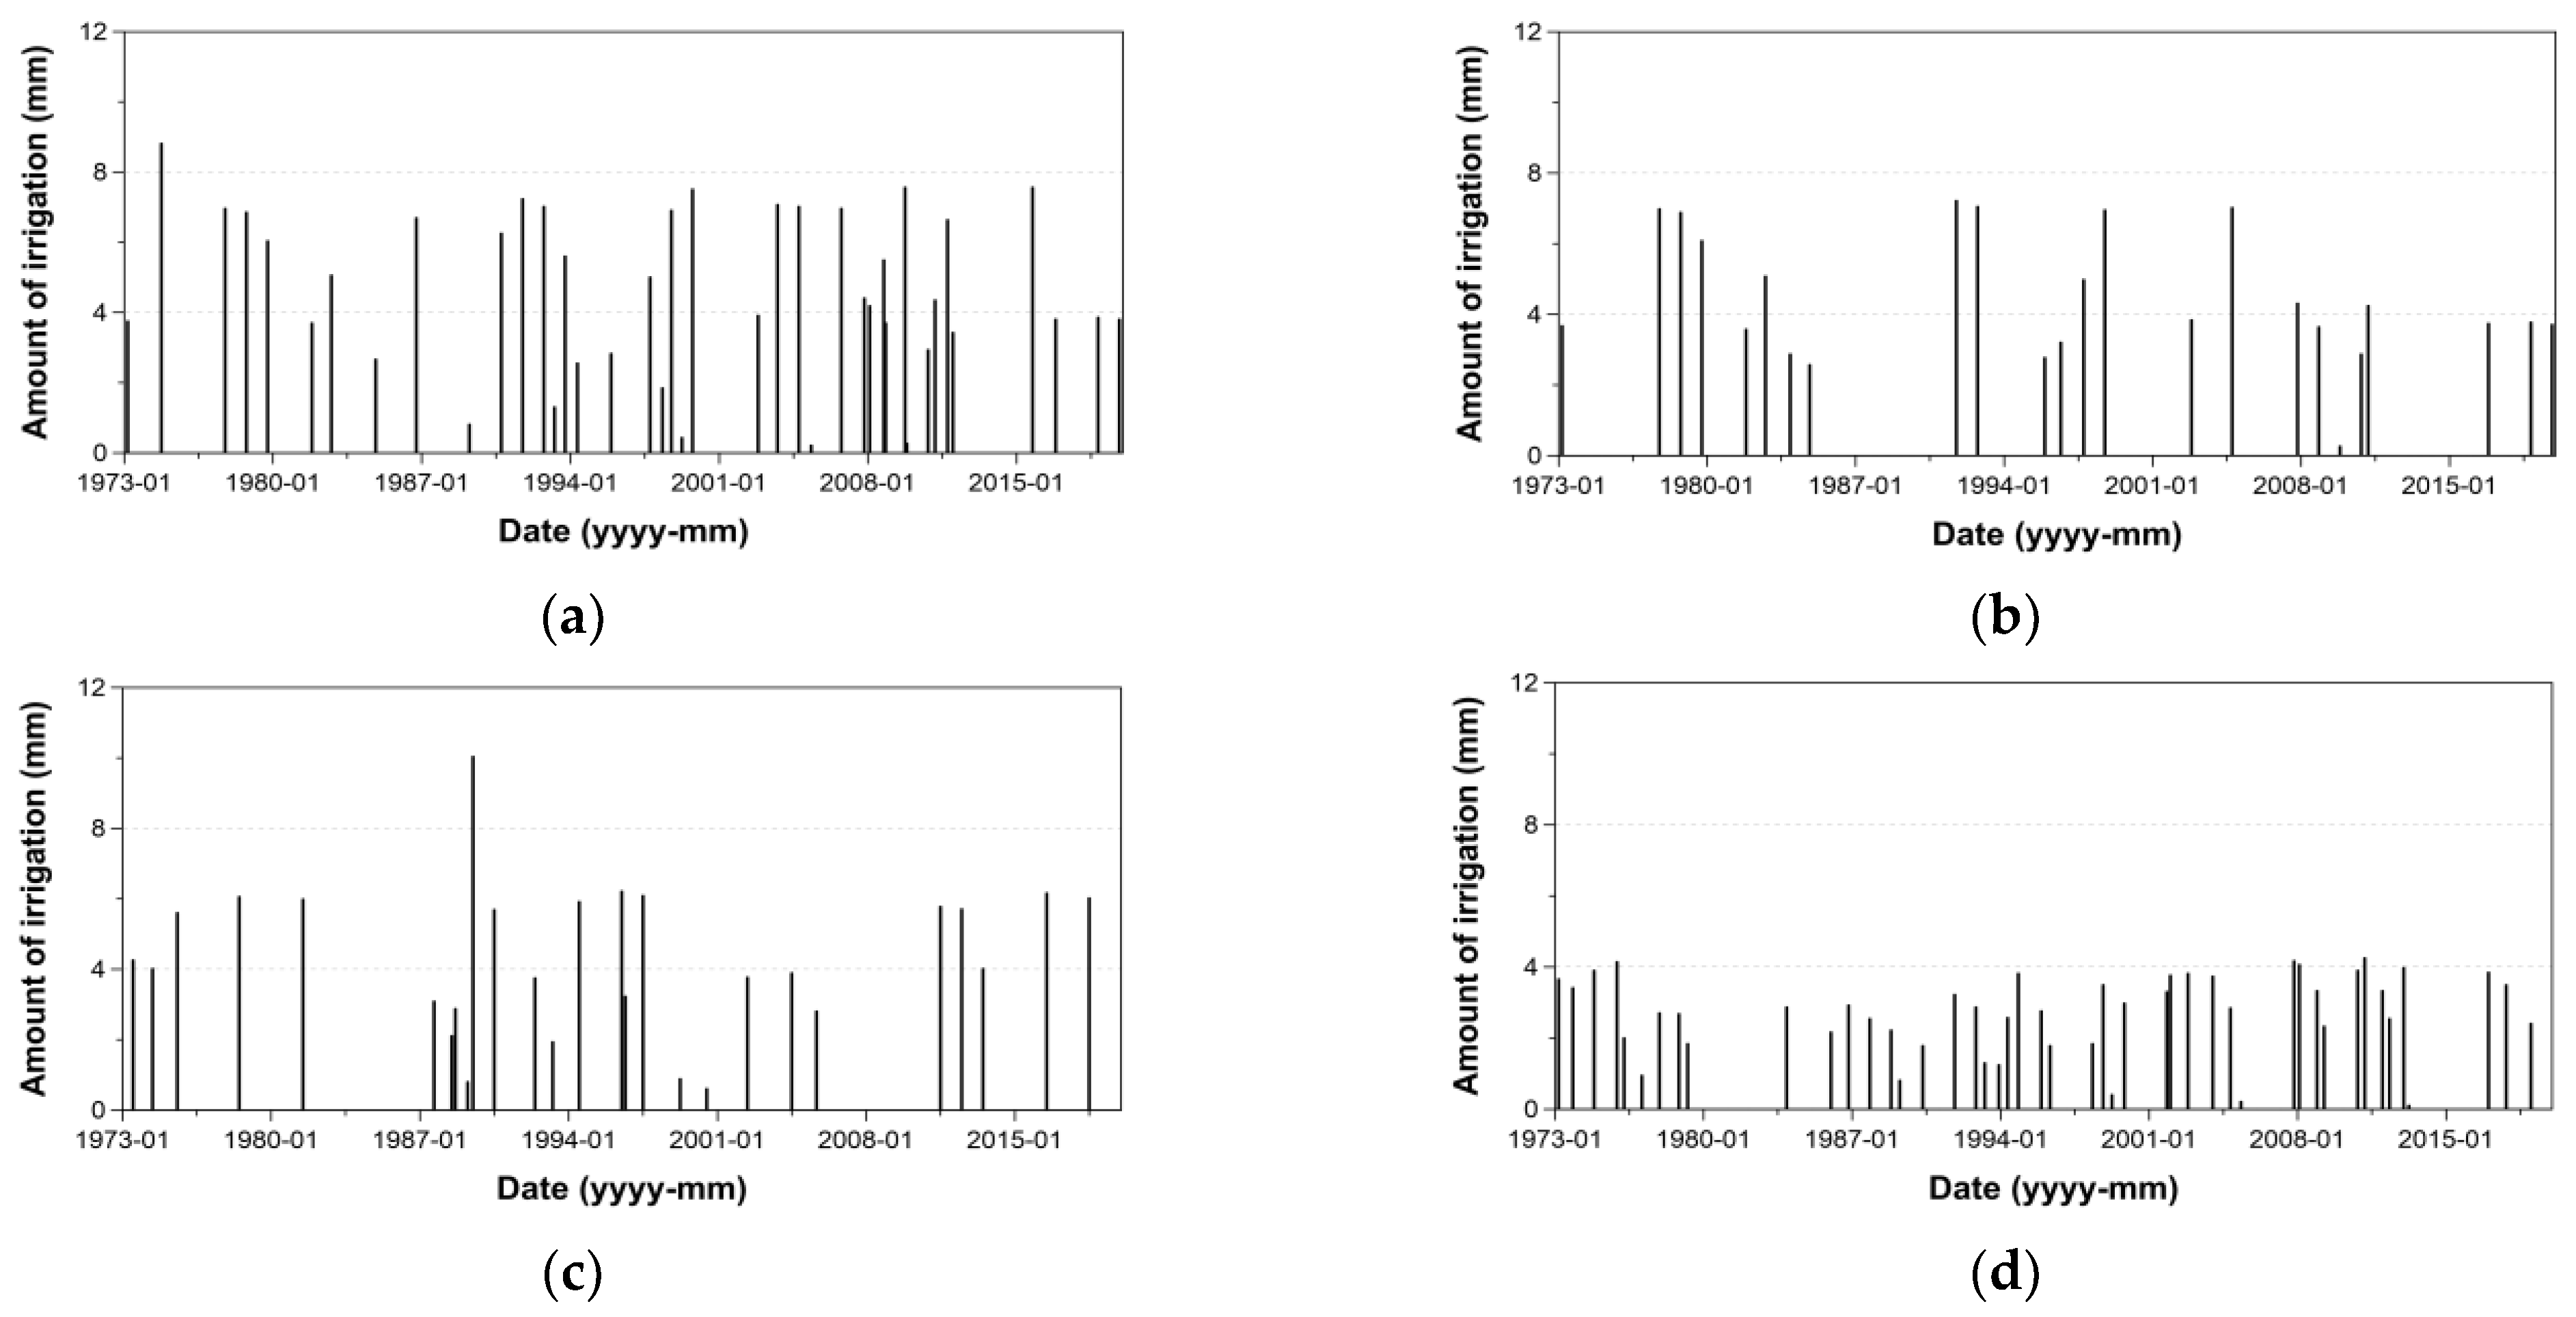
Figure 12 shows the resulting estimates of irrigation water to these four crops in mool-tong #1. As can be seen in this figure, the frequency of irrigation was highest for barley (47 months in 47 years), and smallest for spring onion (24 months in 47 years). However, somewhat different results were derived for the amount of irrigation water. The mean amount of irrigation water per irrigation was largest for garlic (4.7 mm), and smallest for barley (2.7 mm). Spring onion and peanut were found to have a similar mean amount of irrigation water, i.e., 4.4 and 4.3 mm, respectively. That is, barley was found to receive frequent irrigation with small amounts of water. On the other hand, garlic was found to receive less frequent irrigation, but with larger amounts of water.
The same procedure was applied to all 24 mool-tongs (Table 6). The amounts of irrigation water were estimated differently, among which the smallest was for mool-tong #5, and the largest for mool-tong #13. In fact, this result was closely related to the maximum storage capacity of the mool-tong and the corresponding sub-basin area. For example, mool-tong #13 had the large maximum storage capacity of 1579.5 m3, but the corresponding sub-basin area was rather small, at 13,037.9 m2. As a result, the irrigation capacity as a unit of rainfall depth became high.
The amount of irrigation water for each crop was also differently estimated due to various reasons. The growing period of a crop, share of the cultivated area, and the seasonal distribution of rainfall were all found to affect the amount of irrigation water. For the cases of garlic and spring onion, as the growing period was similar, and share of the cultivated area on Udo was also similar (i.e., 12.9% and 21.0%, respectively), the estimated amount of irrigation water was also estimated similarly. On the other hand, even though its growing period included the rainy summer season, the amount of irrigation water for peanut was estimated to be a bit smaller than for garlic and spring onion. This was mainly due to the relatively large share of the cultivated area in peanut (i.e., 40.2%). As the growing period for barley included winter and spring, it was difficult to secure enough water storage in the mool-tongs, which was the reason for the relatively small amounts of irrigation water derived for barley.
4.4. Agricultural Water Supply Capacity of the Mool-Tongs
Using the results for agricultural water demand in Section 4.1 (Figure 9), the agricultural water deficit in Section 4.2 (Table 4), and the amount of irrigation water in Section 4.3 (Table 6), this study could then evaluate the water supply capacity of the mool-tongs on Udo. First, this study compared the agricultural water deficit and the amount of irrigation water, and found that the mool-tongs did not have enough capacity to offset the agricultural water deficit. As a result, the actual amount of irrigation water was found to be far smaller than the agricultural water demand for all crops considered in this study. However, it was also true that the water stored in the mool-tongs greatly aided the survival of those crops and increased crop production. Mool-tong #13 and mool-tong #22 were the exceptions, each with enough water supply capacity to offset the agricultural water deficits within their corresponding sub-basins.
Comparisons of the occurrence frequencies of agricultural water deficits before and after introducing the mool-tongs also confirmed the usefulness of the mool-tongs. Here, the occurrence frequency of agricultural water deficits indicated the ratio of water deficit months out of the total simulation months. Table 7 shows that in the case where the mool-tongs were not considered, the occurrence frequency of the agricultural water deficits was almost 30% of the entire simulation period. However, by considering the water stored in the mool-tongs for irrigation, the frequency decreased significantly, to less than 20%. Even for peanut, whose growing period includes the rainy summer, the frequency decreased significantly, from 17.7% to 7.8%. Other crops, such as garlic and spring onion, also showed large decreases in the frequency of agricultural water deficit, i.e., from 28.8% to 17.3% for garlic, and from 16.6% to 11.1% for spring onion. However, even after introducing the mool-tongs, the frequency of the agricultural water deficit for barley was still high. This was mainly due to the rainfall being small in winter, which made it impossible to collect enough water in the mool-tongs for irrigation. Overall, the mool-tongs were found to be efficient during spring and fall, when the rainfall occurred rather intermittently compared to the summer.
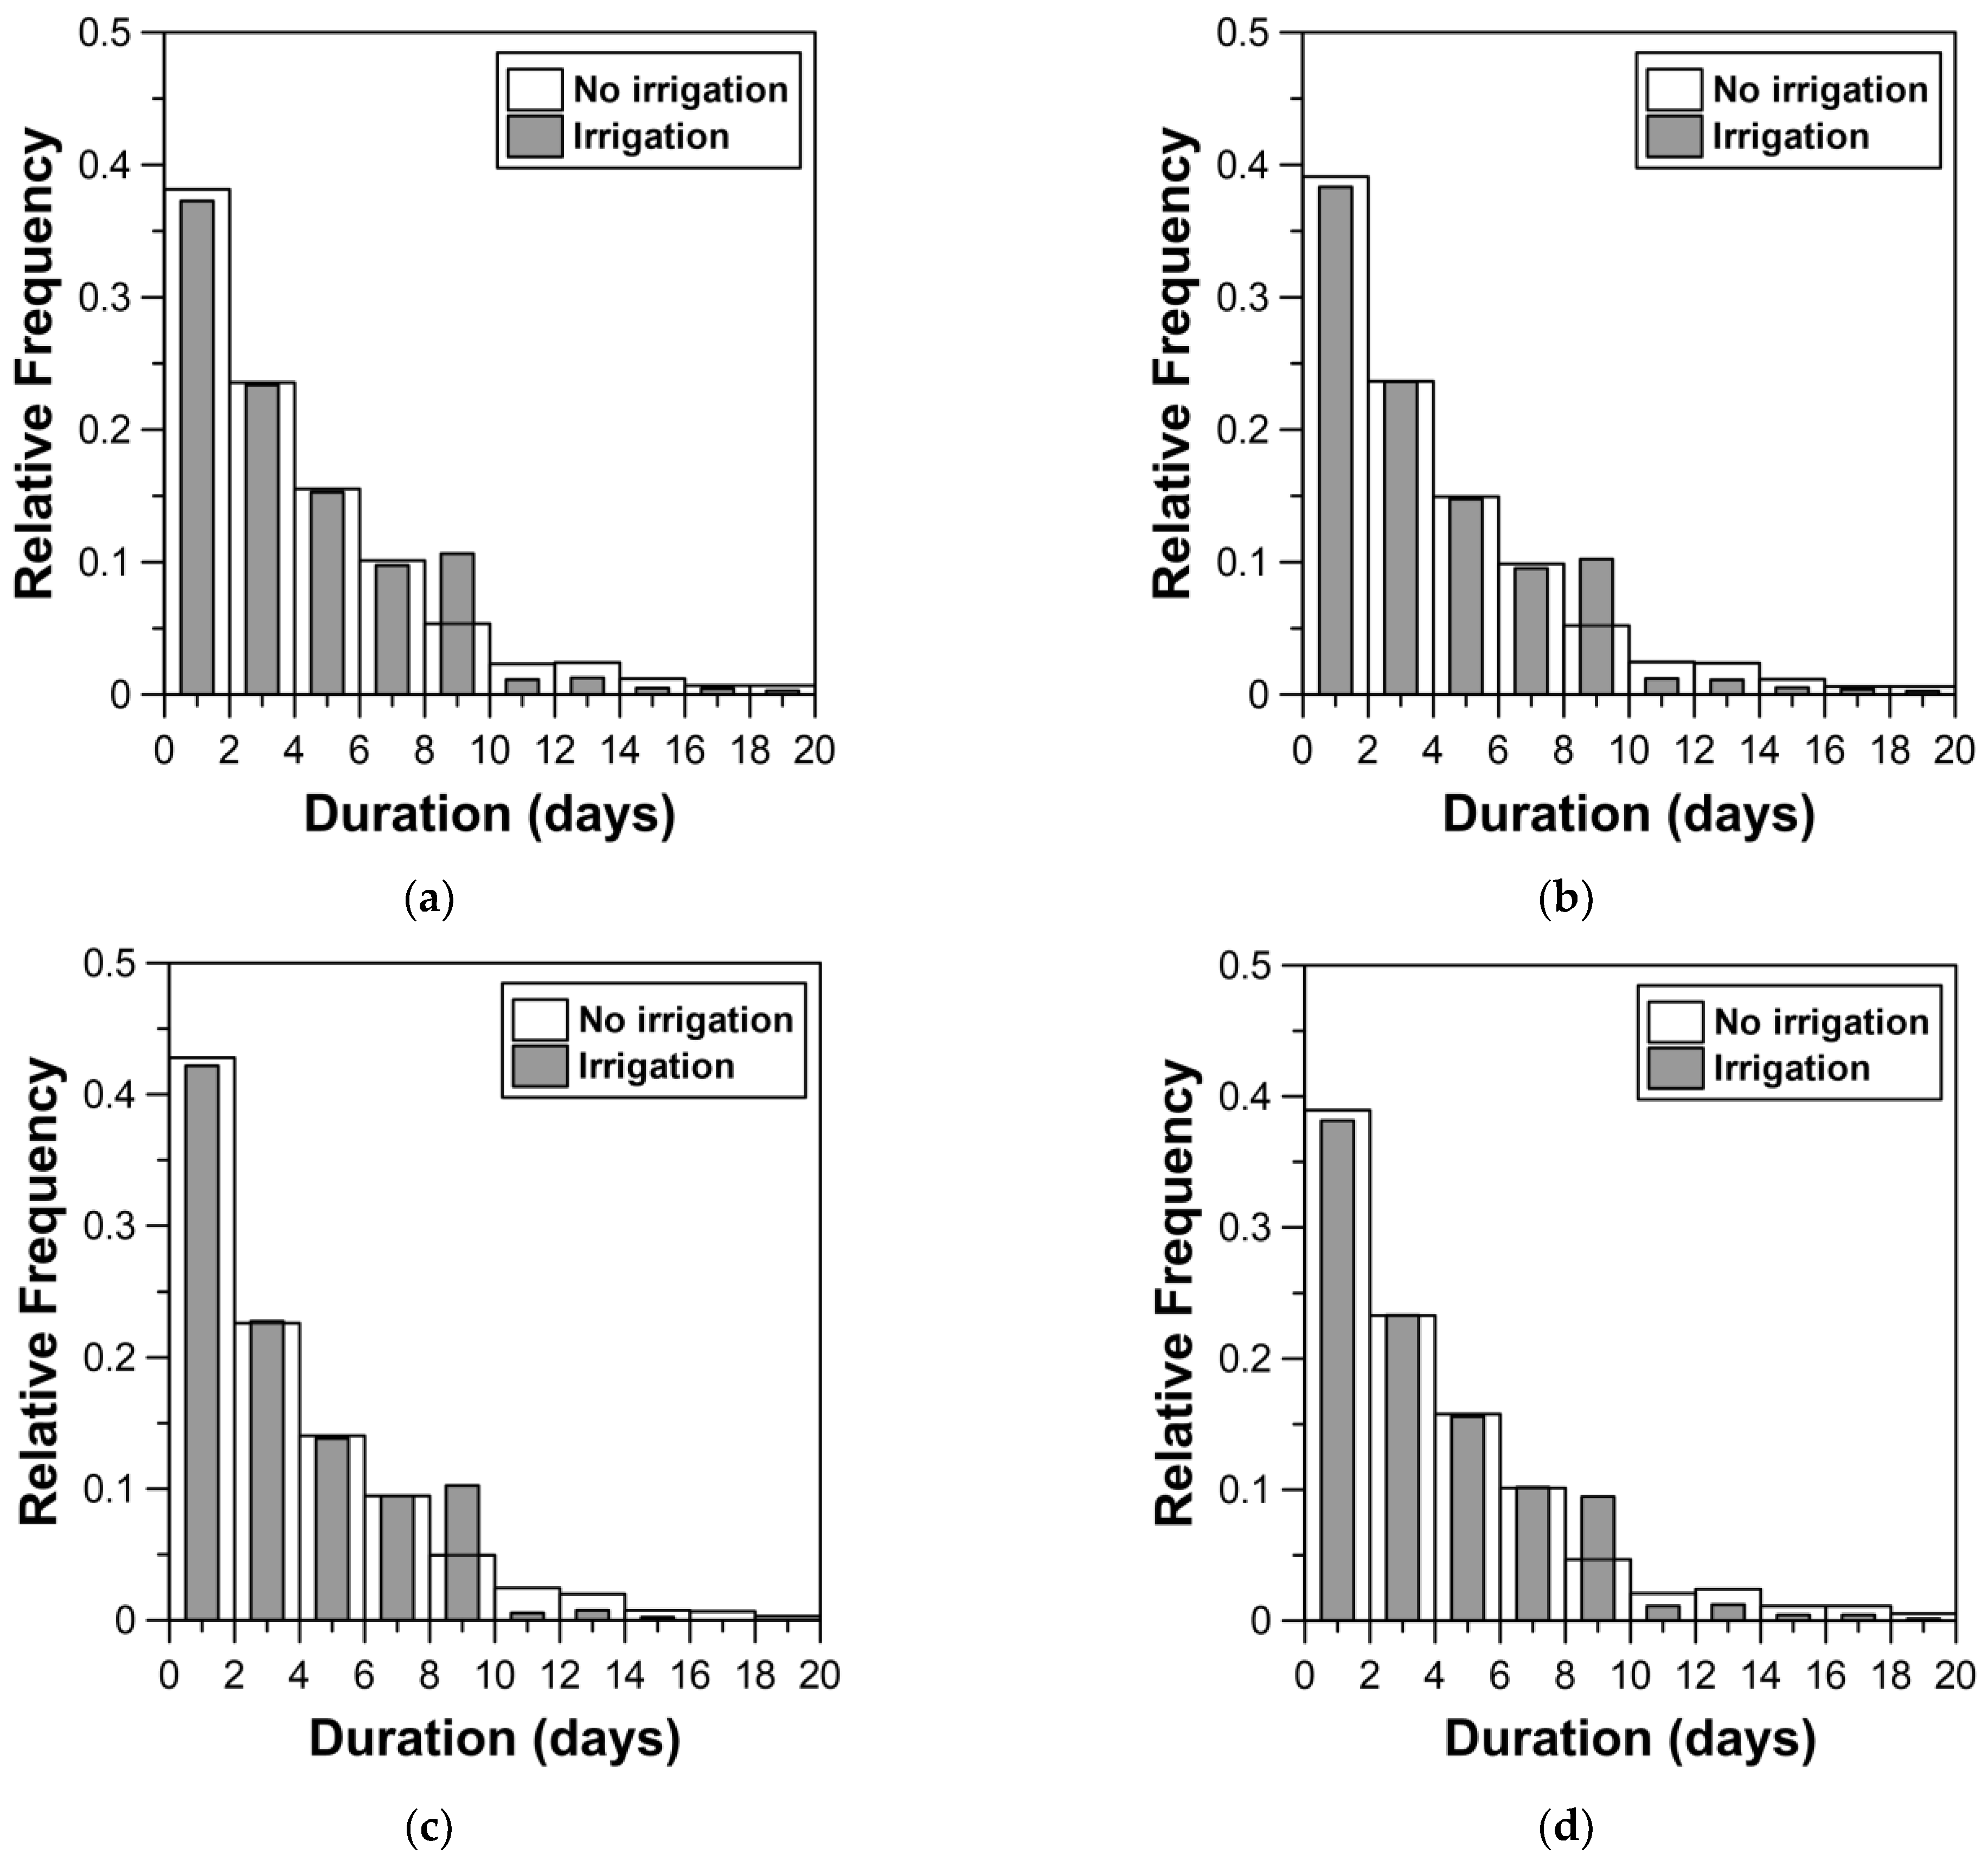
Finally, this study compared the irrigation interval before and after introducing the mool-tongs. The irrigation interval has a special meaning, as it is a crucial factor determining the survival of a crop. Without the mool-tongs, the irrigation interval is simply the interval between two consecutive rainfall events. But if considering the mool-tongs, the irrigation interval should be estimated by additionally considering the irrigation from the mool-tongs. Figure 13 compares the histograms of irrigation intervals before and after introducing the irrigation from the mool-tongs, and Table 8 summarizes the exceedance probability of 10 days, which was assumed as the maximum number of non-irrigation days to keep those four crops on Udo from withering [38]. The exceedance probability was estimated by dividing the number of irrigation intervals longer than 10 days by the total irrigation intervals. As the frequency of the irrigation intervals longer than the maximum non-irrigation days directly affects crop production, the exceedance probability in Table 8 indicates how the crop production could be increased by introducing the mool-tongs.
Figure 13 clearly shows that introducing the mool-tongs shortened the irrigation interval. More specifically, the frequency of the irrigation intervals longer than 10 days was significantly decreased. On the other hand, the frequency of irrigation intervals between 8 and 10 days increased. That is, the effect of irrigation from the mool-tongs was realized as dividing the irrigation interval much longer than 10 days into two. Table 8 summarizes this change before and after introducing the mool-tongs. That is, the exceedance probability of maximum non-irrigation days (i.e., 10 days in this study) before introducing the mool-tongs was high, at about 10%, but after introducing the mool-tongs, decreased to as low as 4%. This result indicates that introducing the mool-tongs greatly reduced the potential damage to crop production on Udo. Interestingly, the effect was also quite high for peanut, which indicates that the mool-tongs fulfilled a positive role even in the rainy summer season.
The above results highlight the possible role of rainwater collection on some remote islands. Especially, the water supply condition for some crops can be improved significantly by introducing rainwater collection systems. Figure 13 and Table 8 support this possibility. In particular, Table 7 shows that the agricultural water deficit durations (months) could be decreased significantly by introducing the mool-tongs. There are also several other cases in Korea where the role of this type of rainwater collection system has been demonstrated. These cases include Gido in Jeollabuk-do Province, Yeojado and Jukdo in Jeollanam-do Province, etc. These are all small islands where it is almost impossible to secure any surface water or groundwater. Most domestic water as well as agricultural water is supplied by rainwater collection systems [12,14,40].
It is also important to note that rainwater collection systems may not fully solve a water deficit problem. As can be seen in Table 7, the occurrence frequency of agricultural water deficits was reduced from 30% to 20% by introducing the mool-tongs. Even though the mool-tongs were very helpful, they could not lower the occurrence frequency of agricultural water deficits to near zero. Many previous studies on rainwater collecting systems also showed this limitation. For example, Falkland (1999) mentioned that the role of a rainwater collection system on a small volcanic island must be that of a supplementary source of water [1]. Peters (2006) also noted that the rainwater collection system on Carriacou Island in Grenada was good but limited [41]. It could not fully satisfy the domestic water demand. Similar cases can also be found in Hawaii (USA), Sicily (Italy), and Kefalonia (Greece) [42,43,44].
5. Conclusions
The objective of this study was to demonstrate the contribution of mool-tongs (small agricultural reservoirs) to crop production on Udo, and the role they play. For this evaluation, the agricultural water demand and deficit, water storage in the mool-tongs, and the amount of irrigation water were analyzed by applying the water balance model. In particular, the Blaney-Criddle method was used to estimate the amount of agricultural water for crop growth. Four typical crops of garlic, spring onion, peanut, and barley were considered, whose growing periods are somewhat different from each other. A total of 47 years (from 1973 to 2019) of rainfall, temperature, and evaporation data were used in this study. First, an analysis was performed without consideration for the mool-tongs, and the results were evaluated from the perspective of crop production. The second analysis considered the mool-tongs, and compared the results with those from the first analysis. This comparison illustrated the contribution of the mool-tongs to crop production on Udo. The results of this study were as follows:
First, the estimated agricultural water demand and deficits for the four crops showed obviously different patterns, depending on the crop. On average, the agricultural water demand of peanut was the highest. Rather smaller estimates were derived for garlic and spring onion. Second, the amount of irrigation water for each crop was also estimated differently. In particular garlic was found to receive less frequent irrigation, but with larger amounts of water. Third, a comparison of the frequencies of occurrence of agricultural water deficits and irrigation intervals before and after introducing the mool-tongs confirmed the usefulness of the mool-tongs. In the case where the mool-tongs were not considered, the frequency of occurrence of agricultural water deficits was almost 30% of the entire simulation period. However, considering the water stored in the mool-tongs for irrigation significantly decreased the frequency, to less than 20%. More specifically, the frequency of irrigation intervals of longer than 10 days, which was assumed to be the maximum number of non-irrigation days to keep the four crops on Udo from withering, was significantly decreased.
Even though the water supply capacity of the mool-tongs on Udo was found to be insufficient to offset the agricultural water deficits, the water stored in the mool-tongs greatly aided the survival of the crops, increasing crop production. The actual amount of irrigation water was found to be far smaller than the agricultural water demand for all crops. However, the mool-tongs were found to be efficient during spring and fall, when the rainfall occurs rather intermittently compared to summer. Additionally, the exceedance probability of maximum non-irrigation days (i.e., 10 days in this study) indicates that introducing the mool-tongs considerably decreased the possible damage to crop production on Udo. Interestingly, the effect was also quite high for peanut, which indicates that the mool-tongs served a favorable role even in the rainy summer season.
Author Contributions
Data curation, W.N.; Formal analysis, M.K.; Methodology, C.Y.; Supervision, C.Y.; Visualization, W.N.; Writing—original draft, M.K. and W.N.; Writing—review & editing, C.Y. All authors have read and agreed to the published version of the manuscript.
Funding
This work was supported by the National Research Foundation of Korea (NRF) grant funded by the Korea government (MSIT) (No. 2020R1A2C2008714), and the National Research Foundation of Korea (NRF) grant funded by the Korea government (MSIT) (No. NRF-2021R1A5A1032433).
Institutional Review Board Statement
Not applicable.
Informed Consent Statement
Not applicable.
Data Availability Statement
Not applicable.
Conflicts of Interest
The authors declare no conflict of interest.
References
- Falkland, T. Water resources issues of small island developing states. Nat. Resour. Forum. 1999, 23, 245–260. [Google Scholar] [CrossRef]
- Bonacci, O.; Ljubenkov, I.; Knezić, S. The water on a small karst island: The island of Korčula (Croatia) as an example. Environ. Earth Sci. 2012, 66, 1345–1357. [Google Scholar] [CrossRef]
- Ghina, F. Sustainable development in small island developing states. Environ. Dev. Sustain. 2003, 5, 139–165. [Google Scholar] [CrossRef]
- Van der Velde, M.; Green, S.R.; Vanclooster, M.; Clothier, B.E. Sustainable development in small island developing states: Agricultural intensification, economic development, and freshwater resources management on the coral atoll of Tongatapu. Ecol. Econ. 2007, 61, 456–468. [Google Scholar] [CrossRef]
- Karnauskas, K.B.; Schleussner, C.F.; Donnelly, J.P.; Anchukaitis, K.J. Freshwater stress on small island developing states: Population projections and aridity changes at 1.5 and 2 C. Reg. Environ. Change 2018, 18, 2273–2282. [Google Scholar] [CrossRef]
- Byun, C.G.; Kim, J.C.; Yang, S.K. Studies on efficient utilization of water resources in Jeju island. Bull. Mar. Sci. Inst. Jeju Natl. Univ. 1999, 23, 161–163. [Google Scholar]
- Kar, K.K.; Yang, S.K.; Lee, J.H. Assessing unit hydrograph parameters and peak runoff responses from storm rainfall events: A Case study in Hancheon basin of Jeju Island. J. Environ. Sci. Int. 2015, 24, 437–447. [Google Scholar] [CrossRef] [Green Version]
- Lau, L.S.; Mink, J.F. Hydrology of the Hawaiian Islands; University of Hawaii Press: Honolulu, HI, USA, 2006. [Google Scholar]
- Jeju Special Self Governing Province (JSSGP). Comprehensive Investigation of Hydrogeology and Groundwater Resources in Jeju Island (III); Jeju Special Self Governing Province (JSSGP): Jeju, Korea, 2003. [Google Scholar]
- Korea Institute of Construction Technology (KICT). Research Report of Seawater Desalination Method; Korea Institute of Construction Technology (KICT): Goyang, Korea, 1995. [Google Scholar]
- Oh, Y.J. The Study on the Application of Rainwater to Water Resources in the Jejudo. Master’s Thesis, Jeju National University, Jeju, Korea, 2007. [Google Scholar]
- Korea Environment Institute (KEI). A Study of Water Supply and Use in Small Islands; Korea Environment Institute (KEI): Seoul, Korea, 2009. [Google Scholar]
- Lee, B.K. Measures for securing water supply in island regions. Tech. Bull. Yooshin Eng. Corp. 2014, 21, 64–79. [Google Scholar]
- Han, M.; Ki, J. Establishment of sustainable water supply system in small islands through rainwater harvesting (RWH): Case study of Guja-do. Water Sci. Technol. 2010, 62, 148–153. [Google Scholar] [CrossRef]
- Lee, Y.D.; Ko, D.Y. A study on water quality characteristics of Chuja and Udo reservoirs. Bull. Mar. Sci. Inst. Jeju Natl. Univ. 2006, 30, 65–71. [Google Scholar]
- Vacher, L.H.; Quinn, T.M. Geology and Hydrogeology of Carbonate Islands; Elsevier: Amsterdam, The Netherland, 2004. [Google Scholar]
- Koh, G.; Park, B.; Kang, B.; Kim, G.; Moon, D.C. Volcanism in Jeju Island. J. Geol. Soc. Korea 2013, 49, 209–230. [Google Scholar]
- Blaney, H.F.; Criddle, W.D. Determining Consumptive Water Use and Irrigation Requirements; United States Department of Agriculture: Washington, DC, USA, 1962.
- Korea Agricultural and Rural Infrastructure Corporation (KARICO). A Study on Irrigation of Field Crops Using Surface Water; Korea Agricultural and Rural Infrastructure Corporation (KARICO): Naju, Korea, 2002. [Google Scholar]
- K-Water. Report of Agricultural Water Demand and Supply Estimation; K-Water: Daejeon, Korea, 2009.
- Korea Institute of Construction Technology (KICT). User’s Manual of Catchment Hydrologic Cycle Assessment Tool (CAT 3.2); Korea Institute of Construction Technology (KICT): Goyang, Korea, 2020. [Google Scholar]
- Wilm, H.G.; Thornthwaite, C.W.; Colman, E.A.; Cummings, N.W.; Croft, A.R.; Gisborne, H.T.; Harding, S.T.; Hendrickson, A.H.; Hoover, M.D.; Houk, I.E.; et al. Report of the committee on transpiration and evaporation, 1943–1944. Eos. Trans. Am. Geophys. Union. 1944, 25, 683–693. [Google Scholar] [CrossRef]
- Turc, L. Evaluation des besoins en eau d’irrigation, évapotranspiration potentielle. Ann. Agron. 1961, 12, 13–49. [Google Scholar]
- Penman, H.L. Natural evaporation from open water, bare soil and grass. Proc. R. Soc. Lond. A 1948, 193, 120–145. [Google Scholar] [CrossRef] [Green Version]
- Monteith, J.L. Evaporation and environment. In the 19th Symposium of Society for Experimental Biology; Cambridge University Press: Cambridge, UK, 1965; Volume 19, pp. 205–234. [Google Scholar]
- Allen, R.G.; Pereira, L.S.; Raes, D.; Smith, M. Crop Evapotranspiration-Guidelines for Computing Crop Water Requirements-FAO Irrigation and Drainage Paper No. 56; Food and Agriculture Organization (FAO): Rome, Italy, 1998; Volume 300, p. D05109. [Google Scholar]
- Ponce, V.M. Engineering Hydrology: Principles and Practices (Vol. 640); Prentice Hall: Englewood Cliffs, NJ, USA, 1989. [Google Scholar]
- Korea Agricultural and Rural Infrastructure Corporation (KARICO). Estimation of Irrigation Water Requirements for Upland Crops in Jeju; Korea Agricultural and Rural Infrastructure Corporation (KARICO): Naju, Korea, 2005. [Google Scholar]
- Han, J. A Study on the Water Use of Udo Residents in Jeju Island. Master’s Thesis, Jeju National University, Jeju, Korea, 2020. [Google Scholar]
- Soil Conservation Service (SCS). National Engineering Handbook; Soil Conservation Service (SCS): Washington, DC, USA, 1972.
- Lee, Y.; Kang, M.; Park, C.; Yoo, C. Suggestion of classification rule of hydrological soil groups considering the results of the revision of soil series: A case study on Jeju Island. J. Korea Water Resour. Assoc. 2019, 52, 35–49. [Google Scholar] [CrossRef]
- Kang, M.; Yoo, C. Application of the SCS–CN method to the Hancheon basin on the volcanic Jeju Island, Korea. Water 2020, 12, 3350. [Google Scholar] [CrossRef]
- Yoo, C.; Kang, M. Evaluation of waterfall occurrence of Eongtto Falls on Jeju Island, Korea by the SCS-CN method. J. Hydrol. Reg. Stud. 2021. Under Review. [Google Scholar]
- Korea Rural Research Institute (KRRI). Improving Water Management and Coping with Various Water Demands Using Small Reservoirs; Korea Rural Research Institute (KRRI): Ansan, Korea, 2006. [Google Scholar]
- Yoon, Y. Hydrology; Chungmun-gak: Seoul, Korea, 2007. [Google Scholar]
- Sur, C.; Lee, J.; Park, J.; Choi, M. Spatial estimation of Priestley-Taylor based potential evapotranspiration using MODIS imageries: The Nak-dong river basin. Korean J. Remot. Sens. 2012, 28, 521–529. [Google Scholar] [CrossRef]
- Lee, H.S.; Lee, B.Y.; Cho, H.S.; Lee, J. Observation of Evaporation at the Surface of Reservoir Using a Large Evaporation Pan. Magazine of the Korea Water Resources Association: Water for Future; Korea Water Resources Association: Seoul, Korea, 2014; Volume 47, pp. 54–67. [Google Scholar]
- Korea Rural Research Institute (KRRI). A Study on Irrigation of Field Crops Using Surface Water; Korea Rural Research Institute (KRRI): Ansan, Korea, 2002. [Google Scholar]
- Udo-Myeon Total Development Plan Report 2018; Jeju, Korea, 2018.
- Jeollanam-do Institute of Health and Environment (JIHE). Case Studies and Activation Plan for the Rainwater Use in Jeollanam-do Island Regions; Jeollanam-do Institute of Health and Environment (JIHE): Muan, Korea, 2003. [Google Scholar]
- Peters, E.J. Rainwater potential for domestic water supply in Grenada. In Proceedings of the Institution of Civil Engineers-Water Management; Thomas Telford Ltd.: London, UK, 2006; Volume 159, pp. 147–153. [Google Scholar] [CrossRef]
- Sazakli, E.; Alexopoulos, A.; Leotsinidis, M. Rainwater harvesting, quality assessment and utilization in Kefalonia Island, Greece. Water Res. 2007, 41, 2039–2047. [Google Scholar] [CrossRef]
- Campisano, A.; Modica, C. Optimal sizing of storage tanks for domestic rainwater harvesting in Sicily. Resour. Conserv. Recycl. 2012, 63, 9–16. [Google Scholar] [CrossRef]
- Donohue, M.J.; Macomber, P.S.; Okimoto, D.; Lerner, D.T. Survey of rainwater catchment use and practices on Hawaii island. J. Contemp. Water Res. Educ. 2017, 161, 33–47. [Google Scholar] [CrossRef] [Green Version]
Figure 1.
Concept of water balance model for the mool-tong in this study.

Figure 2.
Flowchart for simulating the irrigation from the mool-tong on Jeju Island.

Figure 3.
Location of Udo and its topographic map. The meteorological data of Seongsan weather station were used in this study to represent the weather on Udo.
Figure 3.
Location of Udo and its topographic map. The meteorological data of Seongsan weather station were used in this study to represent the weather on Udo.

Figure 4.
Maps of land use (a) and hydrological soil group (b).

Figure 5.
Locations of the mool-tongs on Udo (a) and selected mool-tong pictures (b).

Figure 6.
Monthly rainfall (a) and temperature (b) data collected at the Seongsan meteorological station (1973–2019).
Figure 6.
Monthly rainfall (a) and temperature (b) data collected at the Seongsan meteorological station (1973–2019).

Figure 7.
Interannual variation of the daily mean evaporation data depending on the condition of rainfall occurrence, derived with the observed daily pan evaporation data from 1977 to 1990 at the Seongsan Meteorological Station.
Figure 7.
Interannual variation of the daily mean evaporation data depending on the condition of rainfall occurrence, derived with the observed daily pan evaporation data from 1977 to 1990 at the Seongsan Meteorological Station.

Figure 8.
Example comparison of monthly rainfall and agricultural water demand for four crops considered in this study (year of 1973).
Figure 8.
Example comparison of monthly rainfall and agricultural water demand for four crops considered in this study (year of 1973).

Figure 9.
Agricultural water demand estimated for each crop considered in this study from 1973 to 2019. (a) Garlic; (b) Spring Onion; (c) Peanut; (d) Barley.
Figure 9.
Agricultural water demand estimated for each crop considered in this study from 1973 to 2019. (a) Garlic; (b) Spring Onion; (c) Peanut; (d) Barley.

Figure 10.
Agricultural water deficit estimated for each crop considered in this study from 1973 to 2019. (a) Garlic; (b) Spring Onion; (c) Peanut; (d) Barley.
Figure 10.
Agricultural water deficit estimated for each crop considered in this study from 1973 to 2019. (a) Garlic; (b) Spring Onion; (c) Peanut; (d) Barley.

Figure 11.
Monthly rainfall, effective rainfall, and water storage estimated for mool-tong #1 by applying the simple water balance model.
Figure 11.
Monthly rainfall, effective rainfall, and water storage estimated for mool-tong #1 by applying the simple water balance model.

Figure 12.
Monthly irrigation water amounts from mool-tong #1 estimated for each crop considered in this study. (a) Garlic; (b) Spring Onion; (c) Peanut; (d) Barley.
Figure 12.
Monthly irrigation water amounts from mool-tong #1 estimated for each crop considered in this study. (a) Garlic; (b) Spring Onion; (c) Peanut; (d) Barley.

Figure 13.
Comparison of irrigation intervals, before (i.e., without irrigation from Mul-Tongs) and after introducing the mool-tongs (i.e., with irrigation from the Mool-Tongs), for each crop considered in this study. (a) Garlic; (b) Spring Onion; (c) Peanut; (d) Barley.
Figure 13.
Comparison of irrigation intervals, before (i.e., without irrigation from Mul-Tongs) and after introducing the mool-tongs (i.e., with irrigation from the Mool-Tongs), for each crop considered in this study. (a) Garlic; (b) Spring Onion; (c) Peanut; (d) Barley.


Table 1.
The factor of sunshine hours P with respect to latitude and month (Ponce, 1989) [27].
Table 1.
The factor of sunshine hours P with respect to latitude and month (Ponce, 1989) [27].
| Latitude (°N) | Jan. | Feb. | Mar. | Apr. | May | Jun. | Jul. | Aug. | Sep. | Oct. | Nov. | Dec. |
|---|---|---|---|---|---|---|---|---|---|---|---|---|
| 60 | 0.15 | 0.20 | 0.26 | 0.32 | 0.38 | 0.41 | 0.40 | 0.34 | 0.28 | 0.22 | 0.17 | 0.13 |
| 50 | 0.19 | 0.23 | 0.27 | 0.31 | 0.34 | 0.36 | 0.35 | 0.32 | 0.28 | 0.24 | 0.20 | 0.18 |
| 40 | 0.22 | 0.24 | 0.27 | 0.30 | 0.32 | 0.34 | 0.33 | 0.31 | 0.28 | 0.25 | 0.22 | 0.21 |
| 30 | 0.24 | 0.25 | 0.27 | 0.29 | 0.31 | 0.32 | 0.31 | 0.30 | 0.28 | 0.26 | 0.24 | 0.23 |
| 20 | 0.25 | 0.26 | 0.27 | 0.28 | 0.29 | 0.30 | 0.30 | 0.29 | 0.28 | 0.26 | 0.25 | 0.25 |
| 10 | 0.26 | 0.27 | 0.27 | 0.28 | 0.28 | 0.29 | 0.29 | 0.28 | 0.28 | 0.27 | 0.26 | 0.26 |
| 0 | 0.27 | 0.27 | 0.27 | 0.27 | 0.27 | 0.27 | 0.27 | 0.27 | 0.27 | 0.27 | 0.27 | 0.27 |
Table 2.
Crop coefficients (kc) used for garlic, spring onion, peanut, and barley (KARICO, 2005) [28].
Table 2.
Crop coefficients (kc) used for garlic, spring onion, peanut, and barley (KARICO, 2005) [28].
| Crops | Jan. | Feb. | Mar. | Apr. | May | Jun. | Jul. | Aug. | Sep. | Oct. | Nov. | Dec. |
|---|---|---|---|---|---|---|---|---|---|---|---|---|
| Garlic | 0.38 | 0.41 | 0.60 | 0.84 | 0.87 | - | - | - | 0.17 | 0.83 | 1.06 | 0.45 |
| Spring Onion | 0.15 | 0.20 | 0.45 | 0.20 | 0.20 | 0.30 | - | - | 0.32 | 0.40 | 1.10 | 0.70 |
| Peanut | - | - | - | 0.61 | 0.20 | 0.80 | 1.15 | 0.60 | 0.60 | - | - | - |
| Barley | 1.00 | 1.00 | 1.30 | 1.30 | 1.17 | - | - | - | - | - | 0.80 | 1.00 |
Table 3.
Basic characteristics of the mool-tongs considered in this study.
| No. | Bottom Area (m2) | Depth (m) | Max. Storage (m3) | Sub-Basin Area (m2) |
|---|---|---|---|---|
| 1 | 30.0 | 1.3 | 38.9 | 14,244.1 |
| 2 | 153.5 | 0.7 | 107.5 | 141,314.5 |
| 3 | 100.5 | 1.5 | 150.7 | 12,115.0 |
| 4 | 233.5 | 2.3 | 537.1 | 30,726.0 |
| 5 | 15.5 | 0.7 | 10.9 | 97,214.7 |
| 6 | 1399.9 | 1.8 | 2519.8 | 33,016.7 |
| 7 | 253.0 | 2.5 | 632.5 | 41,765.3 |
| 8 | 136.2 | 2.0 | 272.4 | 12,042.1 |
| 9 | 233.7 | 0.8 | 186.9 | 16,095.1 |
| 10 | 154.0 | 2.5 | 385.1 | 22,536.6 |
| 11 | 231.5 | 1.9 | 439.9 | 89,579.5 |
| 12 | 345.7 | 2.0 | 691.4 | 142,248.2 |
| 13 | 631.8 | 2.5 | 1579.5 | 13,037.9 |
| 14 | 52.8 | 3.0 | 158.4 | 17,303.8 |
| 15 | 268.3 | 2.0 | 536.6 | 29,609.7 |
| 16 | 105.7 | 1.0 | 105.7 | 14,965.1 |
| 17 | 227.5 | 3.5 | 796.3 | 47,888.0 |
| 18 | 252.0 | 2.0 | 504.0 | 28,091.9 |
| 19 | 101.4 | 1.9 | 192.7 | 53,677.1 |
| 20 | 21.3 | 1.0 | 21.3 | 17,901.4 |
| 21 | 906.6 | 2.0 | 1813.2 | 49,232.3 |
| 22 | 1653.4 | 4.0 | 6613.6 | 68,412.8 |
| 23 | 44.3 | 1.9 | 84.2 | 22,323.6 |
| 24 | 94.2 | 2.0 | 188.3 | 19,625.2 |
Table 4.
Basic statistics of agricultural water deficit for the four crops considered in this study.
Table 4.
Basic statistics of agricultural water deficit for the four crops considered in this study.
| Crops | No. of Deficit Events | Mean Demand (mm) | Mean Deficit Amount (mm) | Mean Deficit Duration (months) | Mean Deficit Severity (mm/month) |
|---|---|---|---|---|---|
| Garlic | 76 | 142.7 | 59.2 | 1.6 | 38.4 |
| Spring Onion | 47 | 111.8 | 51.5 | 1.6 | 32.5 |
| Peanut | 44 | 181.9 | 79.8 | 1.1 | 72.3 |
| Barley | 83 | 244.3 | 98.2 | 2.2 | 45.1 |
Table 5.
CNs determined for each sub-basin represented by a mool-tong.
| # | CN | # | CN | # | CN | # | CN |
|---|---|---|---|---|---|---|---|
| 1 | 75.8 | 7 | 74.9 | 13 | 74.7 | 19 | 78.9 |
| 2 | 78.8 | 8 | 75.2 | 14 | 75.3 | 20 | 75.3 |
| 3 | 77.6 | 9 | 77.3 | 15 | 80.9 | 21 | 75.1 |
| 4 | 75.7 | 10 | 75.9 | 16 | 82.4 | 22 | 74.5 |
| 5 | 74.5 | 11 | 77.2 | 17 | 69.7 | 23 | 78.0 |
| 6 | 75.2 | 12 | 75.9 | 18 | 75.5 | 24 | 77.2 |
Table 6.
Mean irrigation amounts (mm) per crop estimated for the 24 mool-tongs considered in this study.
Table 6.
Mean irrigation amounts (mm) per crop estimated for the 24 mool-tongs considered in this study.
| # | Garlic | Spring Onion | Peanut | Barley |
|---|---|---|---|---|
| 1 | 4.7 | 4.4 | 4.3 | 2.7 |
| 2 | 1.1 | 1.1 | 1.1 | 0.6 |
| 3 | 17.4 | 16.9 | 5.9 | 10.7 |
| 4 | 22.6 | 21.8 | 23.4 | 14.0 |
| 5 | 0.2 | 0.2 | 0.1 | 0.4 |
| 6 | 78.6 | 70.6 | 53.7 | 40.7 |
| 7 | 19.5 | 19.0 | 20.4 | 12.2 |
| 8 | 27.9 | 26.5 | 26.5 | 16.9 |
| 9 | 12.9 | 12.5 | 13.2 | 7.1 |
| 10 | 22.5 | 21.9 | 23.6 | 14.2 |
| 11 | 7.6 | 7.9 | 7.8 | 4.6 |
| 12 | 7.2 | 7.4 | 7.4 | 4.4 |
| 13 | 130.9 | 127.1 | 87.4 | 75.8 |
| 14 | 13.2 | 13.1 | 13.6 | 8.6 |
| 15 | 26.3 | 26.6 | 28.3 | 16.6 |
| 16 | 11.0 | 10.9 | 12.1 | 6.8 |
| 17 | 20.4 | 19.0 | 18.6 | 12.6 |
| 18 | 22.0 | 20.7 | 22.4 | 13.5 |
| 19 | 6.0 | 6.0 | 6.7 | 3.6 |
| 20 | 2.0 | 2.0 | 1.9 | 1.3 |
| 21 | 41.2 | 37.9 | 37.5 | 24.0 |
| 22 | 104.5 | 94.7 | 69.8 | 61.0 |
| 23 | 6.2 | 6.2 | 6.8 | 3.7 |
| 24 | 13.4 | 13.1 | 14.5 | 8.2 |
| Average | 25.8 | 24.4 | 21.1 | 15.1 |
Table 7.
Comparison of agricultural water deficit durations (months) before and after introducing the mool-tongs.
Table 7.
Comparison of agricultural water deficit durations (months) before and after introducing the mool-tongs.
| Crops | Total Simulation Months | Before | After | ||
|---|---|---|---|---|---|
| Months | Ratio (%) | Months | Ratio (%) | ||
| Garlic | 423 | 122 | 28.84 | 73 | 17.26 |
| Spring Onion | 470 | 78 | 16.60 | 52 | 11.06 |
| Peanut | 282 | 50 | 17.73 | 22 | 7.80 |
| Barley | 329 | 184 | 55.93 | 127 | 38.60 |
| Average | - | - | 29.77 | - | 18.68 |
Table 8.
Comparison of exceedance probability (%) of irrigation intervals longer than the maximum non-irrigation days, by crop.
Table 8.
Comparison of exceedance probability (%) of irrigation intervals longer than the maximum non-irrigation days, by crop.
| Crops | Before | After |
|---|---|---|
| Garlic | 10.82 | 5.54 |
| Spring Onion | 10.64 | 5.11 |
| Peanut | 9.02 | 2.42 |
| Barley | 9.71 | 4.80 |
| Average | 10.05 | 4.47 |
Publisher’s Note: MDPI stays neutral with regard to jurisdictional claims in published maps and institutional affiliations. |
© 2021 by the authors. Licensee MDPI, Basel, Switzerland. This article is an open access article distributed under the terms and conditions of the Creative Commons Attribution (CC BY) license (https://creativecommons.org/licenses/by/4.0/).
Share and Cite
MDPI and ACS Style
Kang, M.; Yoo, C.; Na, W. Assessment of the Contribution of Rainwater Collection to Crop Production on Udo Island, Korea. Water 2021, 13, 3299. https://doi.org/10.3390/w13223299
AMA Style
Kang M, Yoo C, Na W. Assessment of the Contribution of Rainwater Collection to Crop Production on Udo Island, Korea. Water. 2021; 13(22):3299. https://doi.org/10.3390/w13223299
Chicago/Turabian StyleKang, Minseok, Chulsang Yoo, and Wooyoung Na. 2021. "Assessment of the Contribution of Rainwater Collection to Crop Production on Udo Island, Korea" Water 13, no. 22: 3299. https://doi.org/10.3390/w13223299
Note that from the first issue of 2016, this journal uses article numbers instead of page numbers. See further details here.