Article

The Role of Stakeholder Engagement in Developing New Technologies and Innovation for Nitrogen Reduction in Waters: A Longitudinal Study

1
Aalborg University Business School, Fibigerstraede 11, DK-9220 Aalborg O, Denmark
2
Department of Agroecology, Aarhus University, Blichers Allé 20, DK-8830 Tjele, Denmark
3
Department of Food and Resource Economics, University of Copenhagen, Rolighedsvej 23, DK-1958 Frederiksberg C, Denmark
4
Department of Management, Aarhus University, Fuglesangs Allé 4, DK-8210 Aarhus V, Denmark
*
Author to whom correspondence should be addressed.
Water 2021, 13(22), 3313; https://doi.org/10.3390/w13223313
Submission received: 30 September 2021 / Revised: 15 November 2021 / Accepted: 16 November 2021 / Published: 22 November 2021

Abstract

:
Better nitrogen management, technologies, and regulation are required to reduce nitrogen losses in the aquatic environment. New innovative technologies can support farmers in a more targeted planning of fertilizer application and crop management at the field level to increase the effect of measures when reducing nitrogen losses. However, if farmers do not perceive the need for such a concept, the demand (market pull) will be minimal, making the implementation of such a technology difficult. The lack of this market pull could, however, be counterbalanced by a market push from research or requirements from public sector stakeholders (regulators). Within this domain, the main objective of this paper was to study technological change over time and identify and understand the crucial stakeholder involvement using the Functions of Innovation Systems Approach. This article shows how stakeholders’ perceptions and participation evolved over a 10-year period. It examines the interplay between technology readiness and the perceived readiness and acceptance by affected stakeholders. We demonstrate how stakeholder engagement was crucial to ensure the development of the technologies by creating marketable options for their future implementation. A key dynamic that emerged in this process was the transition from a research push to a regulator pull. We demonstrate the fact that without the regulatory requirement linked to changes towards more targeting of measures, the technology would not, on its own, be a business case, although it would provide new knowledge, thus representing a gain for society. The specific findings can be used in countries where new technologies need to be developed, and where a link to the regulation can ensure the active use of the new technology and, therefore, make their implementation worthwhile.

1. Introduction

Adequate nitrogen (N) is of crucial importance for agriculture to ensure optimal growth of crops. However, excessive N creates challenges for society in terms of pollution and negative consequences for waters, climate, biodiversity, and public health (UN-FAO-WHO). For these reasons, N pollution has been addressed in European and Danish regulation and through the implementation of policies over the past 40 years [1,2] it is now also an integrated part of the United Nations Economic Commission for Europe (UN-ECE) guidance documents (UN-ECE, 2021). Such policies are often based on recommendations and initiatives from research that are then implemented locally, with very little stakeholder and farmer engagement. However, changing farmers’ perceptions concerning crop rotations and levels of fertilizer use is not straightforward. Hence, regulatory intervention will be better accepted if stakeholders have a common ground or understanding of the solutions presented to them. Thus, stakeholder engagement can be crucial to facilitate a consensus-driven dialogue between key stakeholders in the task of creating a common and more deep understanding of the issues [3,4,5,6,7,8].
The agricultural stakeholders in Denmark have historically been good at handling incremental changes to the N paradigm, which has led to improved N use efficiency (especially via better livestock manure management) and a reduction in the N loads to the aquatic environment [2]. Consequently, there has also been a decline in nitrate concentrations in groundwaters over the years [9]. A new regulatory “paradigm” based on targeted regulation has been used since 2018. This is based on mapping of the N retention on a 1500-hectare scale, meaning a much more differentiated N fertilizer regulation than the previous national implemented “command and control” regulation required [2,10].
Within this new framework, a key challenge is to develop, innovate, and legitimize tools that can help target the N measures implemented [11]. Research points to a 20–30% economic gain from being better at spatially targeting measures, solutions, and interventions [12], but to develop tools that are both effective, cost-efficient, precise, and accessible requires considerable time. However, promoting the acceptance of such improved or innovative technologies, despite them being built on solid research, is a challenging task. With targeted regulation of N fertilizer, some crop fields will be “robust”, meaning that they have a high level of N retention, while other fields might turn out to be “vulnerable” due to lower N retention. The effect of N reduction regulation would arguably have the greatest impact on such “vulnerable” fields. This condition would imply that some farmers will potentially “lose” while others will “win” yield from having their fields mapped for crop N retention levels.
This creates an odd market situation for implementing new technologies, as those stakeholders whose aim is to assist in identifying robust lands have very little and heterogenous interest in investing in it. On the other side of the coin are the governmental agencies that will first need to investigate whether or not the new technology can be used to inform or administer regulation. This leaves new technologies in an odd vacuum without end users or markets per se. This paper follows, over a 10-year project period, the evolution of different stakeholders’ positions and changes in perceptions of the development of such a spatially targeted technology and tool within a series of three connected research projects in Denmark covering the entire spectrum of technological readiness levels over time.
Technologies pushed by a research agenda often end up in this odd vacuum, yet to our knowledge, only a few research articles have explored how stakeholder engagement is implemented and managed by research teams to promote key features of the technologies that are being developed.
While this article presents a Danish case, the described challenge can be found in many European countries facing the requirements of the Water Framework Directive. As an example, the German implementation of an N policy is linked to the “red” areas with lower groundwater quality [13], where specific regulation would be required. Regulatory approaches, for instance, in the Netherlands and Belgium also point to the need for a targeted regulation approach [10]. Thus, guidelines and practical implications on how to implement nation- or regionwide technologies and innovations can be transferred; e.g., to other countries in relation to the achievement of goals and ambitions as in the EU Water Framework Directive or the UN Sustainable Development Goals.
The innovation connected to research projects often aims to find solutions to problems that are either wicked in nature or niche markets that present situations of potential market failure due to no obvious demand from end users. The literature has so far relied on theories and assumptions that are more fitting to private sector organizations, but they might not be transferable one-to-one when researching innovation in the public sector [14]. Public sector innovation addresses other needs by examining end users’ needs and interests, whereas the private sector market understands where the push-and-pull dynamics are in play when looking at customers and their demands and willingness to pay.
In this paper, the objective is to attain a better understanding of how new tools and technologies pushed or pulled to the market are perceived differently among the stakeholders in relation to the technology readiness levels, and how their attitudes and subsequent acceptance or rejection change over time. We aimed to extend the stakeholder engagement literature by theorizing on how the pull dynamics develop over time. To do this, we employed the theoretical framework of the Functions of Innovation Systems Approach [15] and focused on the observable dynamics that materialize around each of its seven functions to better understand the complex process of facilitating stakeholder engagement connected to public sector innovation. This study presents a new and different approach to understanding and theorizing how these functions, in conjunction with stakeholder engagement, assist in creating common ground amongst the stakeholders, aligning technological readiness with perceived readiness, and eventually facilitating acceptance and paving the ground for change.
In the interest of the above, we were guided by the following research question: How does stakeholder engagement contribute to the seven innovative functions in the technology development of a new N retention mapping concept? We explored this question by employing a longitudinal case study in Denmark, where the current regulation of N is being subjected to a paradigm shift, and where both public and private sectors are navigating this transition to the best of their abilities to preserve members’ interests. In Section 2, we provide an overview of the literature on stakeholder engagement connected to public sector projects, the importance of push and pull factors for promoting public sector innovation, and lastly outline the theory on seven functions for innovation. In Section 3, we outline the methodological consideration and present the historic backgrounds of the case study connected to the “MapField” research project in Denmark. Section 4 presents the findings from our case study, and in Section 5 and Section 6, we discuss the findings and conclude the paper.

2. Background and Theoretical Framework

2.1. Stakeholder Engagement in Large Sustainability-Oriented Research Projects

The literature on stakeholder engagement in sustainability issues is pointing towards the many benefits and drawbacks that participation can have [16,17,18,19].
The value of stakeholder engagement is found to improve the social, economic, political, and cultural outcomes of decision making when stakeholder voices are being heard [16,20,21,22,23].
There is evidence that stakeholder engagement with decisions made through a transparent, democratic, and participatory approach is perceived as being more legitimate [24,25,26]. Stakeholder engagement may then lead to decisions that can help legitimize final decisions [27], potentially leading to less resistance and easier implementation [28]. Additionally, evidence suggests that participatory processes could lead to more effective solutions being identified [29,30]. However, the opposite is also found, as participation does not always result in better environmental outcomes [31,32]. One of the drawbacks of stakeholder engagement is that it can take more time than a top-down process, and that it may be more costly and also delay decisions [33]. In addition, there is the risk of powerful interest groups overtaking a participatory process [34]. Despite these acknowledged drawbacks and challenges, stakeholder engagement is increasingly being encouraged in water resource management.
Recent studies have deemed stakeholder engagement crucial for the success of large societal projects [35,36], and stakeholder engagement is becoming an increasingly integral part of many projects, and within water resource management has become increasingly prevalent worldwide [37]. Due to the impact that public projects have on society, stakeholder engagement has been suggested as a required interaction for broadly societal transdisciplinary and multisectoral projects. The argument in favor of this is that stakeholder engagement assists with effectively achieving the desired societal impact with less effort; i.e., obtaining more results for less resources employed [38,39] and a better understanding of the challenges related to implementation in practice. Given this, it is reasonable to argue that stakeholder engagement is important to the success of projects that have a societal sustainable agenda.
One of the main hurdles for successful stakeholder engagement is the building of a common understanding of the actual research output (and in this case the need of the developed technologies) due to: (1) stakeholders’ heterogeneous background and knowledge; and (2) possibly conflicting interests in terms of impact on the output, resource allocation, and costs. To facilitate interaction and alignment of these differences, stakeholder engagement is useful for creating a “common sense” [40]. The concept of common sense has successfully been applied in organizational theory to understand how units and occupational communities coordinate [41,42]. Based on the importance of common sense in the coordination across units internally in organizations, the establishment of common sense will be just as important for coordinating across both various internal and external stakeholders in large societal research projects, with very different understandings and desired outcomes. As such, the literature outlines that stakeholders are often concerned about the conflict of their interest within the project [43]. Given the nature of sustainable projects, this is likely to happen, as it bridges the tension field between technology, legislation, sustainable actions, and economic incentives. Another indication of this is found within the literature on stakeholder engagement and large research projects on the paradox between an enforced academic push to the market rather than a stakeholder or end-user market demand-pull [44,45,46]. Very central to stakeholder engagement in research project literature are the value streams in a project [35,47]. This literature on value streams outlines three dominant approaches to stakeholder engagement, the first one being absolute attention to project values: here the project management team places more resources with the stakeholders, who are providing value to the project. The second approach is absolute attention to stakeholder values: the project management team gives more attention to the rights and values of stakeholders; in that sense, the PI is allocating resources to stakeholders who are less salient, despite the fact that it might not contribute to any value creation. The third approach is integrative attention to both projects and stakeholders’ values: in this approach, the project management team engages with stakeholders to balance both the project’s values and at the same time, the stakeholders’ values. This third approach is also called the hybrid approach, and is argued to be a proper tool to ensure sustainability purposes because it facilitates a balance between economic, environmental, and social goals [43]. The focus on stakeholder engagement to create common sense is important when analyzing the technology-push in larger sustainable projects. One could argue that the project management team has the responsibility to drive and coordinate such a translation process towards a common understanding among the stakeholders. Indeed, this is what private companies generally do when they push a new technology by nurturing the pull mechanics through marketing means. For public sector organizations, the adoption of a new technology in society is often limited by an (information) barrier that must be mitigated so that key stakeholders understand it [48,49,50]. We argue that active stakeholder engagement with the key stakeholders is an effective way to overcome these challenges.
However, while this sounds like a simple task, sustainability projects often include and address diverse stakeholders who have different understandings and desires about the final outcome. Consequently, if a persistent knowledge gap between the stakeholders is not mitigated, the outcome might result in failure; i.e., with the developed technology not being adopted by targeted markets as they find that there is no need for it.
The above could imply that the “forced research push” from industry will not gain the stakeholder engagement needed to generate a “pull” or the selected technology. The ongoing translation through stakeholder engagement aims to legitimize the research push, making stakeholders more prone to embrace the potential of the technology developed. Given the nature of environmental sustainability projects, conflicts are likely to occur, as these projects bridge tensions and viewpoints between technology, legislation, sustainable actions, and economic incentives [51]. This is a theme in the literature on stakeholders in large research projects, in which it is referred to as a paradox between an enforced academic push to the market with little to no stakeholder or end-user demand-pull [44,45]. In the case of the present study, this lack of pull from the stakeholders is supplemented with a certain reluctance towards new concepts potentially affecting spatially differentiated N regulation.

2.2. Technological Push and Market Pull in Private and Public Sector Innovation

The technology-push and market demand-pull factors are two long-debated hypotheses on drivers of technological changes that also coined the technology-push and demand-pull hypotheses. These two factors have been studied theoretically and empirically, and scholars have concluded that mutual causality exists between the two [52,53,54,55]. However, scholars argue that technological advance plays a key role in technological changes (the technology-push). Other scholars argue that market demand drives technological progress (the demand-pull). Therefore, the terms “technology push” or “market pull” relate to the orientation of how markets absorb a technology. Within the framework of the resource-based view literature the push and pull are two different orientations, namely a technology orientation or a consumer orientation [56]. Generally, technology development can precede market demand, and market demand can also drive the technology development process. However, the push and pull factors have one meaning for private sector organizations and another for public organizations. Also, the technology-push and demand-pull factors are only in effect when actors appreciate the generating innovations to the market. For that reason, it is rather well described how private firms best utilize resources to maximize profit by leveraging these factors [57]. However, as profit is not the main goal for public organizations, these orientations have different meanings, as public sector organizations innovate for different reasons than private sector organizations. Innovation in the public sector aims at creating more of a public good (roads, hospitals, better environment, etc.) for affordable costs and mostly without profit margins. Therefore, the push and pull factors that apply to innovation in a normal market are less likely to be applied when debating public sector innovation. The research on public sector innovation and the push- and pull-related mechanisms is scarce, and traditional private sector theories seem to fall short in explaining innovative outcomes beyond that spectrum [58,59]. More so, in a recent review, de Vries et al. [59] showed that public-sector-driven innovation lacks a “clear theoretical underpinning” and does not relate to existing theories on innovation within organizations (ibid: 161). One main theoretical difference is how private sector organizations and public sector organizations approach innovation of technology and its push to markets differently. Private sector organizations have the opportunity to nurture a demand-pull through means of marketing while performing a technology push [52,57]. On the other hand, public sector organizations lack markets, or the innovation addresses only niche markets, and there is a need for public accountability connected to this innovation [14,60]. Furthermore, in the presence of a lack of market push/pull, it can be argued that markets or market forces are created/stimulated through public sector interventions and regulations. These are important differences that influence how the push and pull factors unfold for public sector innovation [61]. Public sector organizations innovate to create public value in a more efficient or better way in terms of resource utilization [61,62,63]. Universities and research institutions play a key role in innovative activity in the public sector, and this increases the quality of public services and interagency collaboration [64].
The public-sector-driven technology push explained above is rather straightforward. However, the market demand-pull known to private sector organizations may not function in the same way for public sector organizations. In that way, public organizations are not as motivated by market demand factors; instead, they are more motivated by other external demand factors, such as government policy, budgets, legislation, and societal momentum [65,66,67,68,69]. Given this, public sector organizations are facing other pull factors in their technology push than the private sector organizations. So, in cases where the private sector would focus on profit, the public sector would perhaps focus more on the low costs of a given task. We argue that common sense in such partnerships is to be achieved through active stakeholder engagement, providing venues for a demand-pull of public organization innovation. We are theorizing on how the engagement of stakeholders influences the push and pull factors for public organization innovation. One common measure connected to such a technology push is the technology readiness assessment.

2.3. Perceived Readiness of Technologies

Before applying for funding for innovative research projects, most often the project teams need to explain and account for the aspired technological readiness of the technology being researched and/or developed with public resources. In doing so, the evolution of the technology needs to be evaluated and mapped to the so-called project technological readiness level (TRL). These are also used in the EU Horizon funding framework and describe nine steps, from basic principles (TRL1) that have been observed through technology development and tests to demonstration and ready for market adaption (TRL9) (European Commission, 2017).
However, given the differences in knowledge, understanding, and political viewpoints, some stakeholders may not agree with provided technological readiness assessments, as they have conflicting perceived understandings or interests of the technology and readiness. There can be many reasons for such misalignment in perception. For instance, the literature provides some explanations for this discrepancy between technological readiness perceptions and partnered stakeholders in a project [70]. The perceived understanding of the readiness level of the technology among stakeholders relates to their sector (here: public or private). In the literature on search in innovation [71], technological search is argued to be done differently for industry (private sector) compared to science and research (public sector). The broad literature implies that private organizations are more likely to engage in local searches [72]. In local search, new knowledge is identified by altering one component by a reconfiguration or replacement [73]. More so, local search refers to the fact that the research is closely related to prior and known activities [74]. In contrast, the scientific knowledge generation produces a different search than the local one. Scientific search provides an equivalent to a map, or a stylized representation, of the field being searched. Scientific knowledge differs from that derived through local search, in particular because the scientific endeavor attempts to generate and test theories more broadly. The science search is often done in public sector research institutions and universities. In doing so, science aims to explain why phenomena occur and provide means of predicting the results of their usefulness [74]. These two heuristics of thinking rather clash with the usefulness of the innovation, and might drive an underlying discrepancy between private and public innovation thinking and understanding.

2.4. Insights from the Innovation Systems Approach

The main objective of this paper is to study technological change and identify and understand the crucial activities in how innovation systems in the making evolve, from the perspective of the stakeholders involved. The aim is to create insights into the dynamics and possible patterns of technological change and related innovation processes.
Technology does not emerge or evolve in a vacuum; the external societal environment and broader institutional structures facilitate the development of technological innovations. These include elements such as universities, governmental funding programs, policies, and regulations [75]. In this paper, we applied the technological Innovation System Approach, and more specifically the Functions of Innovation Systems Approach [15,76,77,78]. Technological innovation systems focus on all components that influence the innovation process for that technology; this means both institutions and actors. The functions of innovation systems is a framework to systematically analyze the activities and events taking place in innovation systems resulting in technological change. A key element of this theory is to map the activities and events (functions), which is the generation and diffusion of innovation [78]. The theory has its background in institutional theory and evolutionary theories around innovation systems [75]. However, instead of focusing the analysis on a specific industrial sector (energy sector, etc.) or geographical area, the focus is set on the technology or technological systems. Understood as a special version of innovation systems, the socio-technological transition theory, with its multilevel model, has the same focus [79]. The main goal of these transition theories and theories on functions of innovation systems is:
under which circumstances becomes a niche so successful that it becomes part of the existing regime? (…) what are the conditions that foster the growth of an emerging innovation system in such a way that it becomes so large and entrenched in society, that it is able to compete with and even become part of existing (innovation) systems?” (Hekkert et al.: 415–416) [78].
The purpose of using the concept of functions of innovation systems is to understand processes of technological change and innovation. These processes can also be understood as sequences of events, and can help explain the outcome of a technological change as a result of the order of events. Events are what the central subjects do or what happens to them.
In this theory, the development of a new technology and innovation is a result of seven processes here labeled “functions”, which have a direct and immediate impact on development, diffusion, and the use of new technologies. Based on Hekkert and Negro [15], the seven functions are:
  • Entrepreneurial activities/experimentation. The existence of entrepreneurs in innovation systems is of prime importance. Without entrepreneurs, innovation would not take place and the innovation system would not even exist.
  • Knowledge development (learning). Mechanisms of knowledge development and learning are core to any innovation process. Therefore, knowledge development is fundamental within the innovation system. This function encompasses “learning by searching” and “learning by doing”.
  • Knowledge diffusion through networks. Networks act as an exchange of information. Any network activities can be regarded as a precondition to “learning by interacting”.
  • Influence on the direction of search. The activities within the innovation system that can positively affect the visibility and clarity of specific requirements among technology users can be regarded as influencing the direction of search. These activities influence the legitimacy of the development technologies and stimulate the mobilization of resources for this development.
  • Market formation. A new technology often has difficulties competing with incumbent technologies, as is often the case for sustainable technologies. Therefore, it is important to create protected spaces for new technologies. This can be done by governments, but also by other agents in the innovation system.
  • Resource mobilization. Resources, both financial and human, are necessary as a basic input to all the activities within the innovation system.
  • Creation of legitimacy/counteract resistance to change. To develop soundly, a new technology has to become part of a regime or has to even overthrow it. Parties with vested interests will often oppose this force of “creative destruction” [15].
This last function is especially of relevance to the objective of our study, as it is the function in which stakeholder engagement plays a major role.
These seven functions differ from the previously described nine technology readiness levels mainly in the fact that the seven functions are concerned with the conditions for and around the innovation process to take place. The TRLs are instead focused on the technical stages of development in relation to the market and not the process behind it. In the Results section, we will show how stakeholders’ perceptions and attitudes towards the technology in focus shift and hereby also affect the process and functions over time.

3. Methodology

To answer our research question, we conduct a comprehensive longitudinal case study of three projects (cases), the NiCA project, the rOpen project, and the MapField project. For more information regarding the projects please refer to the following: MapField projects homepage: http://mapfield.dk; the rOpen project: https://hgg.au.dk/projects/ropen-nitrate-retention; and the NiCA project: http://nitrat.dk/about_us_uk/main.html, accessed on 29 October 2021) [80]. All three projects are and were a central part of the development of the final N retention mapping tool developed in MapField. Our data were mainly collected during the MapField project; i.e., in the years 2019–2021. However, the data cover the entire period of these three subsequent larger research projects that ran from 2010 until 2021. We selected these three sequential projects because they outline and depict the movement towards targeted regulation and the stakeholders’ attitudes to it. Introducing case observations over time allows us to include historical accounts and events (functions of innovation) that made the technology push compelling or irrelevant for (some) stakeholders during the period. The advantage of connected projects is that they allow for chronological data collection on the same phenomenon and conduct a within-and-between analysis similar to comparative case studies [81]; i.e., instead of observing a linear progression of stakeholder engagement on the innovation of new technologies, we account for how the project keeps its focus depending on the TRL regarding stakeholder engagement. As such, this study followed a qualitative approach to case studies suggested by, e.g., Miles and Huberman [82] and Eisenhardt [83]. Descriptively, we took a seemingly linear approach; however, we both included observational data from historical observations and cross-referenced it with accounts from expert interviews. We focused on the microlevel of innovation in the projects, as all of them are aiming at developing new knowledge that can make the mapping technology ready for a market introduction.
By focusing on the functions of innovation (events), detailed information was gathered. Expert interviews were also conducted with people involved in the earlier projects. By doing so, we mapped events connected to the technology development (functions of innovation) and related stakeholder attitudes. As we mapped the events, we matched them to one or more of the seven functions through an event scheme.
In this case, we mapped the events that took place within the technology-specific innovation system under investigation [78]. We predominantly only considered large events that in some form altered or changed the scope of the stakeholder management. Therefore, we did not include the day-to-day or week-to-week microlevel stakeholder interactions. Instead, we constructed a database including larger key historical events regarding the interaction between stakeholder engagement and technology development. It was constructed with an emphasis on relevant stakeholder engagement events related to a specific technological development trajectory. As we had access to key people who at the time had key roles in driving the case for targeted N regulation and the connected technology push, we used this access for conducting expert interviews. Interviews were augmented by observations of both organizational and project meetings, coding of meeting minutes, project reports, and research appendices. Policy documents, research reports, and strategy documents provided additional contextual data. Table 1 below illustrates the data foundation that we used for this study.
The expert interviews were predominantly done in (focus) groups with the intent of stimulating discussions with the experts of our questions. Semistructured interview questions were mainly related to those events that required additional information and knowledge about their understanding and perception of the situation at the time. During the interview, we also used visualization tools to outline key events for stakeholder engagement and technology development throughout the case study.
Interviews were recorded and fully transcribed. Analyses consisted of searches for themes related to the technology development and stakeholder engagement within-case and between-case connected to the innovative functions. Given this approach, our coding strategy followed a deductive coding procedure; i.e., we started with a set of known topics that were related to stakeholder engagement and innovation [84]. Deductive coding is an approach that helps focus the coding on those important issues in the existing literature. Due to this, deductive coding and analysis are often useful for theory testing or theory refinement, at which this study aimed. As such, for a theory-driven study, our theoretical framework was converted into a coding framework [85]. Given this, our data sampling was predominantly theoretical.
Our coding strategy had three overall themes subjected to our coding; these were “stakeholder engagement”, “technology development and innovation”, and “implementation and adoption”. By coding within themes, we saw other known topics emerge; i.e., within stakeholder engagement, we coded subthemes such as stakeholders’ involvement in the different projects, stakeholders’ attitudes through the years, stakeholder ownership and participation, stakeholders’ interest and influence, and stakeholder activation. Importantly, we placed these subtheme codes in relation to the stakeholders’ sector affiliation; e.g., if the code was connected to stakeholder engagement with public organizations such as ministries and agencies, this allowed us to account for several important stakeholder events in the data. These events presented our findings and were visualized throughout the case study. We relied on expert interviews to both gain deeper knowledge of the process of innovation and stakeholder engagement within the projects, but our main question frame was focused on establishing cross-validation between the results of our coding analysis and the understanding of the events by the experts.
The events were constructed from multiple codes across deductive themes; i.e., event 4, which is found in the case below, consisted of codes from many different data coding points: for the first part, “rOpen develops a tTEM (towed TEM) system, mapping the geology to 50 m depth.” This first part originated from the accepted proposal and related to technology and innovation development. As for the second part of event 4, “The team gets access to selected farmers’ fields in the short off-season period. Based on the data the team collects and generates retention maps with the use of model simulations.” This was based on an observation from a workshop, and it appeared again during meetings and expert interviews. Codes belonged predominantly to the stakeholder engagement and more specifically stakeholders’ involvement, ownership, and participation with cross-coding to both technology development and implementation opportunities. The next part, “In dialog with farmers, agricultural advisors, and other scientists the team interprets the result and it indicates that targeted regulations are doable with the use of the tTEM technology. The stakeholders are optimistic about tTEM being part of the final concept. The codes that we used to generate this part of the event came from a scientific economic report made for the project and accounts from the expert interviews. The codes were analytically placed within the stakeholder engagement themes, more precisely stakeholder attitudes, participation, and involvement with cross-references to implementation. The last part of the event derives from meeting notes and expert interviews: “The agricultural sector is interested as they believe that this will provide opportunities for removing restrictions on the robust lands. The principal investigator (PI) team has much focus on meeting the needs and requests of the farmers in this period.” Codes from this last piece of the event were situated within stakeholder engagement of technology development. As for stakeholder engagement, code was primarily placed in stakeholder attitudes and interests, and in technology development, refinement, and solution-driven resource allocation. All events were analytically derived similarly through codes as event 4, as depicted above. This ensured a strong crossed-codes foundation when articulating the events.

4. Results–The Case of Danish N Management and the Innovation Project MapField

4.1. Historic Case Narratives

In the case study, we identified 11 events (E1–E11) that we considered important to when and why stakeholder engagement should be prioritized by the project management teams. Figure 1 below outlines these events derived from the case material and expert interviews. For each of the projects, we highlighted the importance of the different functions connected to innovation and stakeholder engagement. The latter is represented by the lines in the respective diagram.
The diagrams show the level of perceived readiness from the public sector (top), compared with that of the farming industry (bottom). These ranged from a low to a medium level. The middle diagram outlines the projects’ focus for stakeholder engagement activities (upper or lower orientation), as well as the intensity of the stakeholder engagement activities. The centerline in the middle diagram indicates an equal distribution between the farming industry and the public sector. The events (E1 through E11) were related to their context, and are described in detail in the following sections; relevant parts that are related to stakeholder engagement are emphasized in bold text.

4.1.1. The NiCA Project (2010–2014)

The overall goal of this project was to add new knowledge about the development of cost-effective strategies for fulfilling the national goals in the EU Water Framework Directive, with a focus on also developing scientific knowledge for N retention. In doing so, the NiCA project aimed to identify robust agricultural areas for which only a limited part of the nitrate leached from the root zone reached the marine waters. The specific scientific objectives of the project were to further develop and quantify the ability to resolve near-surface, local-scale heterogeneity by using the geophysical methods MiniSkyTEM and magnetic resonance sounding (MRS) in work packages 4 and 2, respectively [80]. Following this, the project assessed the implication of obtaining knowledge on the heterogeneity of subsurface nitrate reduction. NiCA also developed and tested a couple of codes for simulation of nitrate leaching, transport, and reduction at catchment scale. Another task of NiCA was identifying the smallest potential scale at which a hydrological model could have the predicted capability. Lastly, the project assessed the benefits of implementing a more precise, local-scale agricultural regulation (dynamic/targeted regulation), as opposed to the national or large catchment scale (23 of average 1913 km2) used in the regulation at the time.
Event 1 (E1): The Parliament and the Danish Agriculture and Food Council (agricultural interest organization) initiated the first document of interest in investigating the dynamic of targeted regulation. From a national perspective, this initiative aimed at lowering the current impact of N on nature and the environment. The agricultural industry, on the other hand, has an interest in less regulation of robust cropland production. The NiCA project was funded to investigate and map potential technologies for targeted regulation.
The NiCA project began on 1 January 2010 and ran for five years until the end of 2014. Its partners consisted of five research groups (including one from Canada). Besides the research groups, one GTS institute, four Danish consulting companies (including two SMEs), and two Danish public authorities were involved in the project. NiCA was partly funded by the Danish Council for Strategic Research [86].
The overall result of the NiCA project was the methodology for assessing the minimum scale (around 500 × 500 m (25 ha)) at which a model with a given data input potentially has the predictive capability with acceptable uncertainty. NiCA concluded that it would never be possible to obtain sufficiently detailed data to deterministically describe the geological heterogeneity. Instead, they suggested that researchers and practitioners must rely on geostatistical approaches, including the generation of plausible geological models. They recommended numerical modeling studies using the stochastically generated heterogeneous geologies and sample results from an increasing number of grid cells until the results among samples become stable [86].
The NiCA project also provided recommendations for water management. The developed tools were used in the Norsminde Fjord catchment to assess their utility in future water management planning. The farmers in the area were involved in evaluating the practical feasibility of a large range of possible measures to reduce nitrate leaching. Importantly, we must mention that concurrently with NiCA, another project (SkyTEM) was attempting to develop a transient electromagnetic system (TEM) technology that could map large catchments by the use of helicopters. The technology developed in this project became the focal technology in the rOpen project that succeeded NiCA.
Event 2 (E2): During NiCA, much attention was given to the governmental agency bodies that formulate the regulation of the farming industry. NiCA suggested that technologies at the time, such as SkyTEM developed in the HighTem project, could be refined to do targeted regulation. The interest and involvement of the key stakeholders were rather peripheral, and the PI team paid most attention to the governmental agencies.
The economic analysis compared the cost of measures using the current mapping with the costs of measures using the NiCA retention mapping. The analysis was carried out for two levels of N leaching, namely the current N loss level and with a reduction of 18% in the N losses [12]. For each level, the farmers could either reallocate catch crops (few options) (Scenario B) or also apply optimal N levels together with targeted catch crops and in-between crops (more options) (scenario C). The economic gain for the 10 farms was EUR 14–21/ha for scenario (B–C) (the same N losses) and EUR 28–53/ha for Scenario (E–F) (N loss reduction of 18%). So, the higher reduction requirement also increased the economic gain from targeting. In comparison, the mapping was calculated to cost EUR 6–10/ha, and so an economic gain from mapping could be calculated [87]. Jacobsen and Hansen [12] also showed that not all farms could use the detailed information on N reduction, and there was not a clear link between spatial variation in N reduction at the farm level and possible economic gains for all 10 of these farms.
Event 3 (E3): The NiCA project ended with recommendations for both technology, concept, and regulation to move forward; both key actors, industry and the state, increased their interest in the technology or concept that could potentially meet their demands for more sustainable production on robust lands. The suggestions of NiCA gave the research team of rOpen opportunities to further develop the TEM technology to match a more complex concept for mapping N retention on crop fields and potentially identify agricultural drains. Initially, the researchers had more interactions with the regulatory organizations, but the PI team needed to have more focus on including the farmers, as access was needed to their fields. Importantly, in 2016 the parliament initiated a new paradigm for environmental regulation of the agricultural sector (Regeringen, 2015, Ministry of Environment, 2018). This meant a first version of targeted regulation on a catchment scale and included the use of targeted catch crops. One of the models used for determining the N leaching was the NLES5 model.
NiCA can be considered an explorative project that needed to include stakeholders from all sectors to obtain sufficient information about farmers to be included in scenario analysis. There was some clear indication of function 1, entrepreneurial activity, since the researchers and governmental bodies expressed some ideas about how targeted regulation could be done, and more centrally what innovation action could be taken to assist in this process. Similarly, we saw that knowledge development, function 2, was very profound, as scenario analysis was done to create both knowledge and an understanding of the phenomenon. We also observed that function 3, which related to knowledge diffusion, was important early on, and important for some stakeholders.

4.1.2. The rOpen Research Project (2016–2020)

The rOpen project was a follow-up to the NICA project to ensure further development of the potential established. At the start of the project, recent legislation in the Food and Agricultural Package [88] had allowed Danish farmers to increase N application considering only economic benefits. This posed a risk of an increased nitrate load to the surface- and groundwater.
To counteract this, detailed regulation was scheduled to reduce N emissions starting from 2019, thus allowing farmers to target measures for the largest effect [89,90]. As a new tool, the level of detail used in the regulation was now increased, as the regulation was based on N retention maps based on approximately 15 km2 (ID15) areas (1500 ha). Although more detailed than previous maps, they were still not close to the effective management at the field level, as the basic data did not allow for a more detailed scale than this.
The vision of rOpen was to explore new mapping approaches and methods for more effective targeting to be achieved using innovative geophysical mapping in combination with hydrogeological and geochemical modeling, but without increasing the uncertainty related to the mapping.
Event 4 (E4): rOpen developed a tTEM (towed TEM) system, mapping the geology to a 50 m depth. The team had access to selected farmers’ fields in the short off-season period. Based on the data the team collected, they generated retention maps with the use of model simulations. In dialogue with farmers, agricultural advisors, and other scientists, the team interpreted the result and indicated that targeted regulations were doable with the use of the tTEM technology. Overall, the stakeholders were optimistic about tTEM being part of the final concept. The agricultural sector was interested, as they believed that this would provide opportunities for removing restrictions on the robust lands. The PI team was very focused on meeting the needs and requests of the farmers in this period.
This higher resolution in retention maps aimed to improve the prediction of nitrate transport in the open landscape at the field scale (a few hectares). Furthermore, the rOpen project aimed to develop a transparent, data-driven decision support tool that would be cost-effective on a national scale. Such improved management can lead to targeted regulation and more efficient fertilizer utilization, benefitting both the agricultural sector and the environment.
In the proposal, the project teams stated that “by combining the expertise and the scientific activities, rOpen will meet the societal desire for mapping of N retention at field scale and we will develop the necessary tools”.
In this, the project indicated values for stakeholders from different sectors. Firstly, for the farming industry, individual farmers, who without more knowledge would meet more general regulations on N application. Secondly, society will benefit from jobs and large export opportunities inspired by a financially healthy agricultural industry in balance with the natural environment. Thirdly, research institutions will strengthen their international reputation within the important scientific areas of geophysics, hydrology, geology, geochemistry, microbiology, agricultural-related land management, and the links between applied N and the N loss. Lastly, within the society at large, citizens will be less exposed to N pollution through the protection of surface and groundwater resources, which is of economical and recreational interest. This also includes lower costs related to mapping contaminated sites by the Danish regions.
The steps adopted in the rOpen project were to examine existing data, construct subsurface structures, model the N retention, and disseminate and use the results on case farms. The rOpen further developed the concept, now based on the tTEM instead of Sky-TEM as a mapping concept for differentiating agricultural land according to their vulnerability to N leaching to be used for a targeted N regulation. The learning in the project improved the maps used over time, and the concept was being automated, but still some new challenges regarding, e.g., redox levels, meant that creating the final maps took longer to produce than expected, and so the project termination was delayed by one year. In other words, the technology was approaching a final stage, and with the adjustments in the project, the research team was ready for more in-depth validation of the findings.
The concept benefited from the incorporation of innovative geophysics in hydrological and geochemical mapping and modelling. To capture and describe relevant uncertainties, a large number of equally probable realizations were created through multiple point statistical (MPS) methods. The focus was now more on the uncertainty in the different steps. The detailed mapping allowed farmers to use this information in the farm planning to live up to potential N reduction requirements on their farm at a lower cost. However, interviews revealed that not all farms would realize an economic gain from the detailed mapping, as costs for some farmers would exceed the potential economic gain. At the society level, the concept allowed authorities to deliver an effective implementation of legislation with a knowledge-based and transparent approach that focused on detailed mapping of the retention related to N losses from both surface water and groundwater [91]. The level used was around 30 × 30 to 300 × 300 m (0.1 ha to 9 ha). So, the intention of mapping at the field level without increasing uncertainty was achieved. At the end of the project, the costs of mapping were estimated at EUR 20/ha/year; this estimate was higher than the NiCA estimate, as it also covered more processes from the beginning of mapping to the advice given to the farmer. This also included the integration of the maps into existing farm management tools to ease their use in practice. The usefulness was compared by farmers to having soil samples analysed every five years, and so the costs should not be any higher than EUR 10/ha/yr.
Event 5 (E5): A series of scenario analyses indicated that targeted regulation with tTEM could be made. Analyses at the national level showed that if a targeted approach was used, it would benefit 8 out of 10 farmers in terms of lower restrictions than the current levels were imposing. However, the calculation also showed that 1 or 2 out of 10 farms would have to close their businesses due to increased restrictions. These analyses changed the attitude of the farmers’ union and their in-house scientific experts. The project team conducted stakeholder meetings and engaged the farmers in dialogue and interviews based on the mapping results. However, the scenario analyses and the results of the tTEM sparked the state agency’s interest in the technology.
At the end of the project, advancing the development of the concept would require the Ministry of Environment to further commit as a financial project partner. A further purpose concerning the wider dissemination was to give the Ministry of Environment a closer insight into the development of the maps and their potential use. The maps can be used both at the farm level, but also as an alternative tool for mapping the retention in selected areas. This could be in areas where uncertainty regarding N retention mapping in the national retention map is largest, or it could be areas where the high reduction requirements would be questioned by farmers. In that respect, the approval of the Ministry of Environment was required for further use in regulation. In the next step, it was clear that the Ministry of Environment needed to be an active financial participant, and not just a member of the steering committee, to prove to the project participants and to the Innovation Fund that their belief was followed by financial support.
Event 6 (E6): At the end of the rOpen project, the tTEM technology had been both developed and tested on fields, and the data that this method generated were considered useful for a potential N retention mapping tool. However, it still needed refinement and further validation.
The rOpen project’s primary purpose was to develop pillars for a potential measurement that could be used for potential future regulation. Therefore, the product presented to the stakeholder was also more conceptual or even hypothetical; i.e., not including any tangible data to show or discuss. Findings were presented and debated at smaller workshops, and some stakeholders showed an interest, but often in the secondary uses of the technology. For instance, the region was interested in the technology, as they saw a potential for using it in combating point pollution. Yet, in many aspects of the rOpen project, stakeholder engagement was not the focus. In a sense, it was in a vacuum, merely concentrating on refining the measurement models. Following this, from the start rOpen was very centered on function 2, knowledge development, and less focused on diffusion, function 3, compared to both NiCA and MapField.

4.1.3. The Concurrent Research Project: MapField (2018–2022)

Based on the two previous projects, the focus in MapField was on consolidation and validation, but also commercialization of the concept. The steps taken were to get the Ministry involved as a partner, and this was only possible if the validation was linked to the ongoing test sites (LOOP areas) where activities were already financed by the Ministry [92]. As the regulatory side had also developed the targeted regulation as a concept, it was now widely used by farmers, and farmers also wanted more measurements at the farm level to identify their level of N losses. This was also why the project at the outset was only a 3-year and 3-month project, but ended up covering almost 4 years.
The idea for the MapField project was consolidating between the findings of prior projects and two new pillars, namely adding hydrology modeling to known TEM technology pushed in HighTem and rOpen; and secondly, how the technology could be implemented and commercialized. This represented an academic research push of a new technology towards a more targeted regulation.
The MapField concept aimed at providing a cost-effective field-level mapping tool to measure N retention. However, the project team realized early on that pricing or costing estimation was needed for the interest of stakeholders, both farmers and governmental agencies [12]. However, pricing and costing also relate to making strategic decisions regarding commercializing the final product. The technology has its limitations, as it needs a rather large amount of data points to make the retention maps, and so the validation of the mapping requires a larger area covering a whole subcatchment.
Event 7 (E7): MapField costing meetings were initiated. They revealed that, while it was feasible to determine potential mapping costs, the MapField concept in itself did not always provide clear benefits for the individual farmers. Likewise, it was clear that the government must sustain the costs of a substantial amount of the mapping technology by either a subsidy or a governance model in which farmers are compensated. Several stepwise approaches connected to the implementation were debated in these meetings. One suggestion was a stop-and-go model that was also presented to the rest of the MapField research and project team. The purpose was that farmers should not pay for the full project if preliminary analyses indicated no variation. This approach was later refined into an idea of developing a so-called “priority tool” cocreated through stakeholder engagement.
Besides being very active in strategic meetings internally, the MapField management team was very proactive in reaching out to the regulating agencies. Granted, the agencies had been on the steering committee on rOpen and had cosponsored MapField, so the access was there. As the N-retention mapping became more detailed and refined, the stakeholders began to grasp how the final product could be used. This made the engagement of stakeholders easier due to the tangible products that MapField had produced. This made the ministry and agency interested in one-on-one meetings with the research teams, as they wanted to learn more about the tools’ usefulness, and also if they could be reconfigured to fit with the current models that they were using.
Event 8 (E8): Meeting series with the environmental agency and the researchers of MapField. The project researchers were able to show and explain to the agency how the mapping and modeling worked. Furthermore, the researchers were able to present to the agency visualizations of the results from test catchment areas. Furthermore, the team also showcased positive results for what was called the LOOP areas. These were test areas with different scenarios created on real farms that the government used to select detailed data for a long period.
The interviews from rOpen showed that deciding on crop rotation was already a complex process. With the introduction of detailed retention mapping, this became more complex.
Another aspect was the expected uptake of the concept. In the project, the approach was to focus on selected catchments (5–10) with selected challenges. This would require a tool to be set up to determine where the largest potential benefits were to be found. The projects have shown that large geological variation was likely to lead to large variations in retention. As opposed to this, the Ministry of Environment had a greater focus on national mapping. On the other hand, having a more tangible product also created stakeholder engagement with the sectors, as researchers could now challenge the theoretical knowledge created from the models, and together with the farming industry, question the practical implications of the overall tool. All this led to a further refinement of the underlying models in the measurement tool, and as this refined progress and project boxes were ticked, it was decided to create a report that would inform stakeholders who would have a key interest in the tool.
Event 9 (E9): The management team decided to produce a white paper that could be used to communicate and inform key stakeholders about the MapField concept and how it could be used. It was aimed at being predominantly useful for scientists, policymakers, and agricultural advisors.
From the above, we have showcased that going from a conceptual hypothetical product to a tangible product in itself motivated stakeholders to engage. However, it also motivated the stakeholders to engage in assisting the project team in developing a strategic decision-making tool related to the mapping tool. The development of this tool was an ongoing process that ran for over a year, including researchers, agriculture advisors, engineering consultants, and agro-economists.
Event 10 (E10): The priority tool development. The priority tool was meant to assist users of the MapField N retention tool in pinpointing where it would make sense to conduct catchment mapping towards a more targeted regulation. The process began with two conceptual methods, one developed by the principal investigators’ team and one from agricultural advisors. These two actors were also the main facilitators of the priority tool development. The initial two methods had some variation and similarities, but through stakeholder engagement and inclusion of 15 people from different backgrounds, they settled for a hybrid model between the two.

4.1.4. A Potential Road to Commercialization

Through extensive meetings with the regulating agency, the inclusion of stakeholders in formulating reports and white papers, and engagement of stakeholders in cocreating the priority tool, the agencies were convinced that the MapField tool could be the next step, and this related to the last event of this case study. The Ministry approach now led to an option that the costs for farmers could be paid through the Rural Development Program, thus setting a more formal way of financing. Here, it was stressed that applications could not be at the farm level, and the actual use would require more development to fit into the existing regulation concept.
Event 11 (E11): The MapField management team was asked by the agency and ministry to create a task force that would advise the agency/ministry on the cost and time to implement this technology.

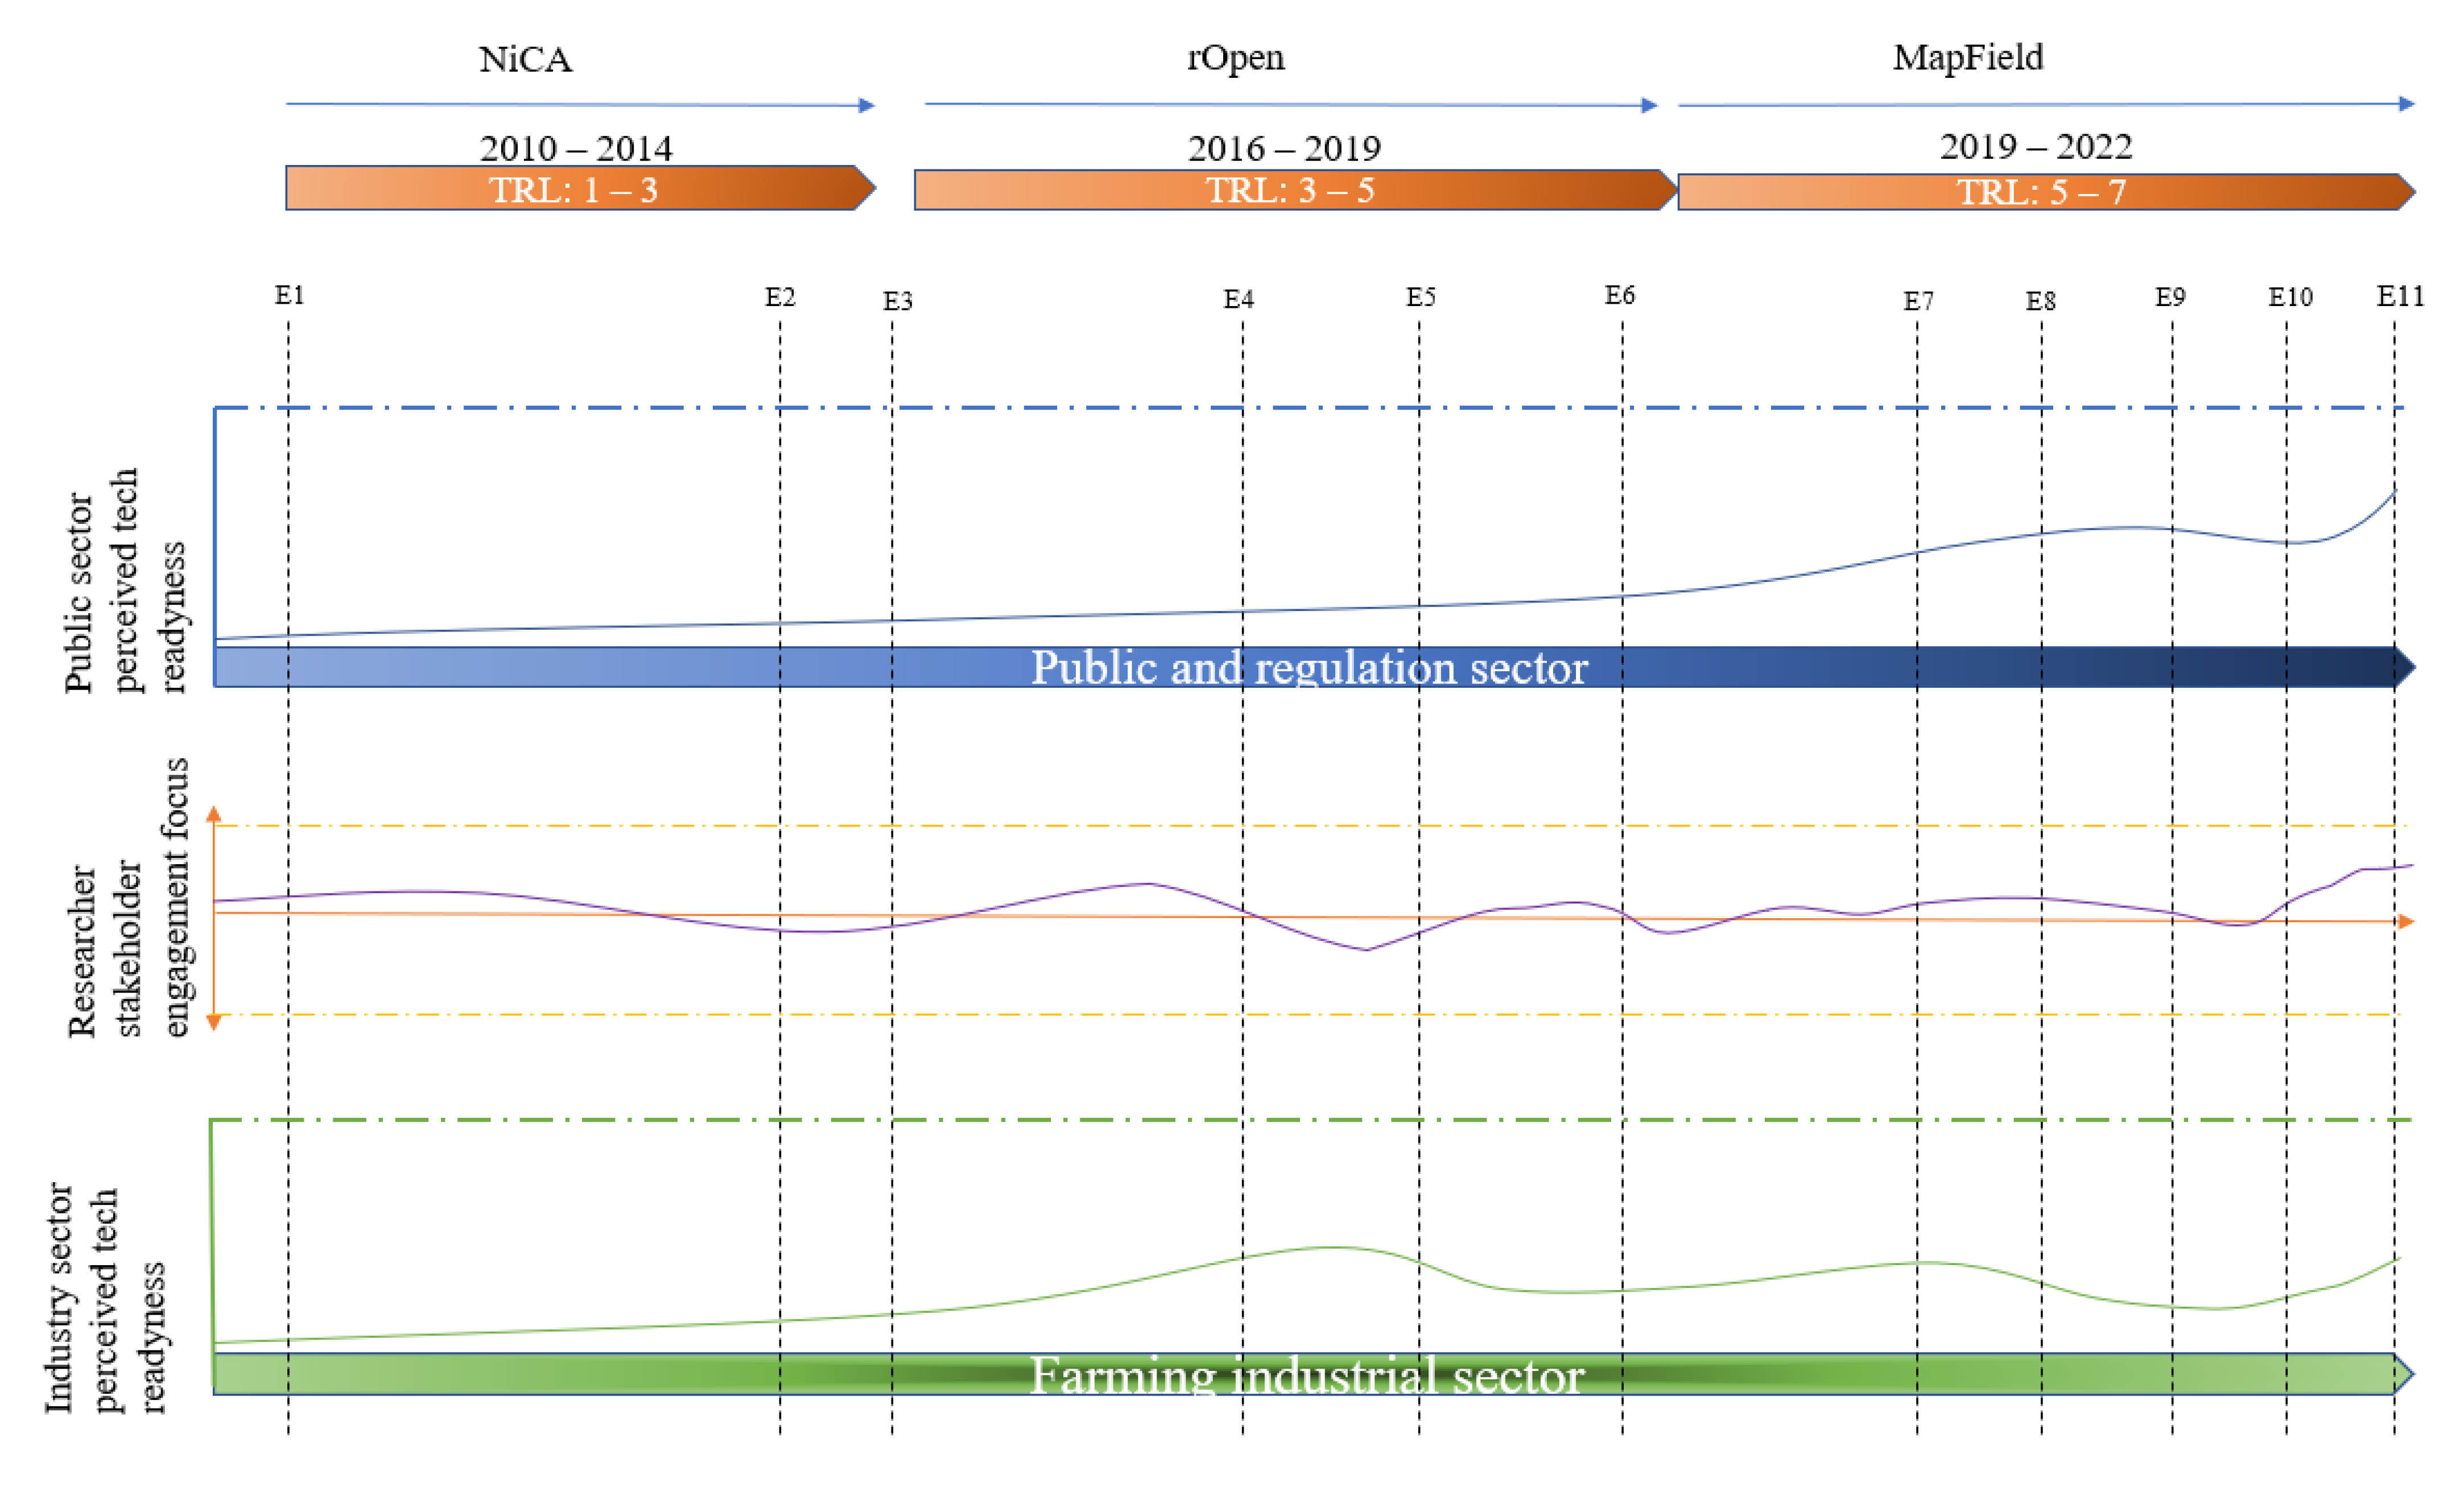
4.2. A Shift in Stakeholders’ Perception and Acceptance of Technology

The outlined findings from our case study intrinsically showed that there was a shift in perception of the value of the technologies that the projects were developing, or at least of the attractiveness for potential end users (i.e., farmers). Figure 1 visualizes these shifts in turns. For instance, the PI of the third project in the timeline (MapField) and other project partners seemed highly convinced at the beginning that they were developing a technology in which farmers would be very interested. However, it soon became observable that the initial value propositions from the MapField technology indicated a lack of such a pull from the farmers [51]. Specifically, with the possibility to estimate realistic cost figures, it was not possible to come up with figures that would—under the current regulation—provide any real benefits for farmers [93].
Further, the uncertainty of not knowing the direction of the outcome of a mapping beforehand had similar impacts on the lack of interest amongst the farmers. This was confirmed by the interviews conducted during both the rOpen and MapField projects. These concerns were also confirmed by the industry representatives involved in those two projects. The technology might have been (partly) misunderstood, as it was often compared to soil samples that farmers carried out every five years and were already familiar with. Observations such as these aligned with the notion of a lack of common ground when debating the usefulness among some stakeholders, which was arguably a significant co-cause of a low willingness to sustain the mapping costs. This position was further enforced; i.e., with the formulation of value proposition, it became clearer that the overall benefit of large-scale mappings would mainly be for the society at large. Moreover, some of the individual farmers would rather have suffered the higher costs than received any direct benefits, at least not without governmental subsidization [93]. The investment decision for farmers might be on a 20-year horizon, including the cost of the mappings on one side and the expected benefit (monetary value) of the increased production due to lower regulatory requirements on the other. However, the latter is subject to a certain degree of uncertainty due to the intrinsic uncertainty of the mappings, market fluctuations, weather dependencies, etc.
However, the results also depicted how an increased degree and focus of stakeholder engagement turned the projects’ opportunities around, assisting in the progress of technological development by eventually creating a potential market for its implementation. The stakeholder engagement activities changed over time, from interacting with curiosity-driven farmers (the initial NiCA approach) to understanding the actual needs among farmers and private sector stakeholders in the late stages of rOpen. Indeed, the activities in rOpen focused more on “pushing” the technologies in development for the farmers. Another important reason for these projects to maintain stakeholder engagement with the farmer community during the technology development was for pragmatic reasons, to gain access to their fields to test the development of the technology. Limited access to fields would not have allowed for the refinement of the technologies and further endangered their legitimization in the field.
The significant shift towards the public sector occurred midway in the last project (MapField), when the internal stakeholders acknowledged the difficulties of precisely addressing private stakeholders’ benefits without a regulatory link to the mapping technology. As a result, stakeholder engagement shifted towards the environmental protection agency and the ministry, while activities with farmers were reduced to refining and fine-tuning the technologies for validation. At the same time, the interaction with the farmers was now occurring at a centralized level through their advisory group. While the proof of concept activities was progressing (TRL8–9), the dialogue between the project team and the environmental agency also became more frequent and pragmatic, as the agency for the environment could see the potential in MapField’s technologies for the refinement of future targeted nitrogen usage regulation.
During the MapField project, we could outline the dynamics behind this shift in focus and perception by mapping the key stakeholders’ interests and influence on the latest project’s outcome. Therefore, Figure 2 below was constructed according to step three from the stakeholder analysis suggested by Wang and Aenis [94], and highlights how the interest and influence of these key stakeholders changed characteristics in terms of interest and influence. Key stakeholders were those primarily impacting or being impacted by implementing or introducing a new technology or regulation.
Figure 2 illustrates two snapshots during MapField’s timeline; i.e., early 2019 and mid-2021. Stakeholders’ interest and influence were ranked by score 1 (low) to 10 (high) on each of the axes. This ranking was constructed by the research group and validated by several internal project partners during meetings and workshops. To do so, project workshop participants were asked to identify key stakeholders themselves by means of a survey tool. Further, their ranking was presented and discussed during workshops and smaller meetings in which refinements were made until a consensus was reached. From a stakeholder engagement perspective of the project, the matrix shows how farmers, agricultural advisors, and regulators played a crucial role. All of them had a degree of influence on the MapField project from its inception. However, farmers and regulators did not appear very interested in that phase. Analyses of meeting minutes, documents, and expert interviews indicated that key stakeholders with high interest were partly “pushing” the project’s outcome on the market, despite no clear interest from the market itself. Indeed, there was limited participation in the rOpen and MapField projects from the actual farmers—only farmers mobilized through agricultural advisors showed some interest. However, this lack was also driven by the fact that the early interim result maps presented to farmers were merely hypothetical and did not outline practical implications.
Hence, the main interest from industry stakeholders was represented at the national advisory level, whose members also showed a more significant commitment to participate in an economic scenario analysis performed in the area where the newest retention maps were done. Similar to government officials’ increasing interest, the advisors more proactively argued for potential pitfalls of the mapping technology. Similarly, the advisors became very active in the cocreation of the priority tool to influence the included calculation and metrics towards fitting their needs and concerns. The advisors’ experience and knowledge partly drove this motivation to participate, so that the decisions made in this process may soon be implemented or guide the regulation.
As the technology developed and its possible implementation options became more defined, the key stakeholders changed position in the matrix during 2020–2021. This brought the potential implementation closer to regulators, as these stakeholders could see possibilities for its use within the regulatory intervention; i.e., the new nitrogen paradigm. This situation was a bidirectional engagement and dialogue, because the environmental agency and ministry actively began seeking relevant information amongst the various parts of the research community in Denmark. As a result of the engagement and dissemination activities of the project, the environmental agency initiated discussion rounds with the project team. The intention appeared twofold: firstly, receiving information about the project’s progress and applicability; and secondly, trying to influence it to an increasing degree to meet the agency’s specific requirements for including it in possible regulatory initiatives.
The successful engagement with these stakeholders and their influence played a significant role in enabling the final development of the technology. Hence, it can be argued that as public sector stakeholder engagement became more important during the MapField project, the interest of farmers increased, arguably due to possible threats or opportunities from new regulation initiatives informed by new mappings employing MapField’s technology.

5. Discussion

The literature on push and market-demand pulls indicates that a connection with societal challenges might often end in market failure situations, because publicly supported R&D is often a response to a market failure itself [44]. While legislation is often identified as the reason for such failure in the market, it can, however, if used proactively, be a driver of market formation, especially when connected to sustainable projects [95]. We outlined how the publicly funded research project MapField and its predecessors developed concepts and technologies that otherwise would not have had a business case. Indeed, the adoption of these technologies needed to be stimulated by a corresponding regulatory framework, de facto creating a market that otherwise would not have existed. We have outlined how stakeholder engagement and dissemination activities were paramount in this process, and argued that the following dynamics and interactions had made this possible.

The Interaction of Stakeholder Engagement with the Seven Functions

We have accounted for eleven events related to stakeholder engagement activities and the seven functions throughout the data. On a meta level, we have further outlined how these events created significant shifts in perception and have mobilized stakeholders to embrace the technologies, thereby creating the foundation for its future implementation and possible commercialization. The historical data analysis and its results have shown how stakeholder engagement activities were a key component of these three research projects to “go to the next level”. Our results have also demonstrated the dynamics and details of how this process unfolded. To highlight this latter point, the identified events are mapped to the seven functions in Table 2 below.
Despite the seemingly linear approach to innovation, this case study of three subsequent projects provided indications that this innovative process is far from being linear and certain. The development stages and the related stakeholder engagement activities are central for each of the functions in play at that time. Table 2 shows an interesting fact; i.e., to enable the linear development of the TRLs, it was observed that several iterations of the seven functions occurred throughout the project. We argue that these iterations were driven by the stakeholder engagement that needed to accompany these projects to ensure their survival; i.e., the funding of the subsequent projects. The stakeholders’ interactions also showed some facilitated path dependency in the funding process, required to allow the actual implementation of earlier projects’ results. This became particularly apparent during MapField, which refined the N retention concept and included its stakeholders, thus creating the opportunity to extend the initial value creation by adding more tangible outputs to the markets connected to the mapping technology.
Regarding the importance of functions for innovation, Function 2, as in all science-based projects, seemed to be essential. For instance, connected to Event 6, we focused on how the mapping processes could become increasingly automated in order to reduce costs. Using the technology on a larger scale would also require that processes be automated to deliver results within an adequate timeframe. Given this, the research push had to be reduced to give more time for validation and marketing. The rOpen project, therefore, decided to inform more broadly about the technology and describe how it works and the current limitations; e.g., highlighting that the technology/approach was based on mapping an area of 1500 ha, thus requiring almost the entire area to be mapped to be able to compare its findings to measurement data. Therefore, the technology could not be offered to the individual farmers, but only collectively to groups of farmers—differently from the proposals of the Ministry of Agriculture.
Function 3, as in NiCA, became necessary as the project was actively seeking the stakeholder dialogue. However, compared to its predecessors, MapField was very engaged in Function 4, influencing the search direction. This was shown by the fact that the project team made the concept more tangible by providing more resources available by influencing legitimacy and nurturing cocreation with the stakeholders. For instance, concerning Event 8, we have presented data on stakeholders’ perceived attitudes towards introducing such technology. We can furthermore account for how roles changed throughout the project’s timeline. This showcases the importance of knowledge and how actors responded to this new concept when farmers also were reluctant to rely on modeled data regarding N losses of their fields. Through active stakeholder engagement, the project team tried to create legitimacy and counteract the resistance, which relates to Function 7. Finally, the Function 5, market formation, focused on satisfying the agency at the end of the project. The management team is paving the way for this sustainable technology to be implemented.

6. Conclusions

Stakeholders can have great interest in and influence on sustainability innovation projects; however, there is contrasting evidence on whether their involvement always contributes in the direction of better environmental outcomes. With this article, we illustrated how stakeholder engagement facilitated the process of innovation and technological development with an environmental focus, and more so, that stakeholders’ acceptance and perception towards the development of new technologies change over time. This article highlighted how the process of innovation is not linear, even though it is represented as such by the TRL standards. We showed that innovation unfolds in iterations with the seven functions approach, and that project development and innovation must be accompanied by stakeholder engagement to ensure the advancement of the innovation process towards market readiness.
We have shown how the development of the concept for detailed N retention mapping in agriculture was first developed to become a technology aimed at traditional commercialization. Initially, the concept and innovation were met by limited interest (no pull) from potential end users (farmers). However, this limited interest drove the project team to intensify and adjust the focus of the stakeholder engagement strategy to increase demand mainly based on policy regulation rather than conventional market forces.
An important evolvement in the duration of the three projects studied was that regulations have changed throughout the projects’ course, and the perceived need for more differentiated N regulation and related technologies was altered consequently. Indeed, policymakers can stimulate and create the foundation for the demand for such technologies by embracing them through regulatory requirements and subsidizing policies. Connected to our research objective, we have shown that stakeholders were curious and intrigued in the ideation project stage (NiCA). However, the next phase, developing and innovating the technology (rOpen), was often based on theoretical and technical assumptions and understandings amongst the researchers. This might have created an abstract situation for practitioners (both farmers and public servants in this case), making it difficult to recognize the possible value, and consequently diminishing their interest. Lastly, the refinement and implementation stage (MapField) outlined and produced maps and an N concept considered more tangible for the stakeholders, thus accounting for more stakeholder engagement during this phase of the overall development project.
Using the seven function approach developed by [15] this paper showed how 11 key events moved the development from the experimentation stages (Function 1) to the market formation (Function 5). Furthermore, this development in turn showed the development from technology readiness level 1–2 to close to 9.
The analysis showed how key stakeholders’ inputs and positions changed throughout the projects. The focus at the beginning was on technology development, with some interest from farmers. The focus in the latter stage was on markets, and dialogue with regulators and farm advisors. With this came a need for validation, but also a more automated process with lower costs. A key dynamic that emerged in this process was the transition from a research push to a regulator pull. At the same time, the project developments provided spin-off options for other analyses and sectors (regions) that were not anticipated at the outset. These entrepreneurial experimentation activities could also somewhat be related to Function 1.
The critical issue addressed in this study was not strictly about different perceptions of the TRLs, but about the difference between scientific and commercial perspectives in sustainability innovation projects. While the former seeks more knowledge, independently from profitability, the latter pursues options that would generate higher profits, resulting in dynamics aiming for more details from the scientific community against the profit optimum.
Research project funding today focuses very much on the likely turnover and the number of jobs created. In that sense, the focus is set on the projects to generate knowledge or technology that benefits society (TRLs). However, our analyses showed that the path can be long, and that the projects might end with other outcomes than expected.

Recommendations

Future research in the dynamics of creating new technologies and the role of stakeholder engagement is needed, especially concerning the accountability that publicly funded projects have towards a multitude of stakeholders and society in general. The focus of technological development for less-regulated industries could generate insightful complementary results to the present study. The implications of this study are generalizable mainly to settings that are similar to our case country, where three main sectors (research, the agricultural industry, and the governmental agencies), through a consensus-driven approach, tried to establish common ground through stakeholder engagement. The process and interaction between innovation and stakeholder engagement may unfold very differently in countries that regulate through a more command-and-control decision-making process.
This article outlined the paramount role of stakeholders alongside a technology development process, providing evidence to support the following recommendations. First, policymakers and other funding bodies should focus on the entire range of affected stakeholders and, at the same time, leverage their position as key stakeholders in directing the implementation towards the fulfillment of societal needs. Second, decision-makers of all kinds, including research project managers, should focus on engagement with stakeholders in the research and development process as early as possible (similar to change management initiatives) and include these stakeholders and their needs in the phases of development, thereby more likely reaching a broader acceptance and legitimacy of the developed technologies. Thirdly, funders of innovation projects should realize that innovation does not occur in a linear process, but, as we have shown, unfolds in an iterative process along with seven key functions of innovation. This has implications for how public money are funded through the nine TRLs.

Author Contributions

K.N. and M.G. were the leading authors in tight collaboration with S.S.; B.H.J. and T.D. coauthored parts of the manuscript and provided sporadic input and feedback throughout the writing process. All authors have read and agreed to the published version of the manuscript.

Funding

This research was supported by the Innovation Fund Denmark projects: MapField–Field-scale mapping for targeted N-regulation and management (8850-00025B).

Institutional Review Board Statement

Not applicable.

Informed Consent Statement

Not applicable.

Data Availability Statement

Not applicable.

Conflicts of Interest

The authors declare no conflict of interest.

References

  1. Sutton, M.A.; Howard, C.; Erisman, J.W.; Biller, G.; Bleeker, A. The European Nitrogen Assessment; Cambridge University Press: Cambridge, UK, 2011; Available online: http://www.nine-esf.org/node/204/ENA.html (accessed on 29 October 2021).
  2. Dalgaard, T.; Hansen, B.; Hasler, B.; Hertel, O.; Hutchings, N.; Jacobsen, B.H.; Jensen, L.S.; Kronvang, B.; Olesen, J.E.; Schjoerring, J.K.; et al. Policies for agricultural nitrogen management—trends, challenges and prospects for improved efficiency in Denmark. Environ. Res. Lett. 2014, 9, 115002. [Google Scholar] [CrossRef]
  3. Wright, S.A.; Jacobsen, B.H. Participation in the implementation of the Water Framework Directive in Denmark: The prospects for active involvement. Water Policy 2011, 13, 232–249. [Google Scholar] [CrossRef]
  4. Graversgaard, M. Stakeholder participation for effective governance: Bridging the gap between top-down water resource management and bottom-up local implementation. Ph.D. Thesis, Aarhus Universitet, Department of Agroecology, Aarhus, Denmark, 2018. [Google Scholar]
  5. Borowski-Maaser, I.; Graversgaard, M.; Foster, N.; Prutzer, M.; Roest, A.; Boogaard, F. WaterCoG: Evidence on How the Use of Tools, Knowledge, and Process Design Can Improve Water Co-Governance. Water 2021, 13, 1206. [Google Scholar] [CrossRef]
  6. OECD. Stakeholder Engagement for Inclusive Water Governance; OECD Studies on Water; OECD Publishing: Paris, France, 2015. [Google Scholar]
  7. Pahl-Wostl, C. Participative and stakeholder-based policy design, evaluation and modeling processes. Integr. Assess. 2002, 3, 3–14. [Google Scholar] [CrossRef] [Green Version]
  8. Hassanzadeh, E.; Strickert, G.; Morales-Marin, L.; Noble, B.; Baulch, H.; Shupena-Soulodre, E.; Lindenschmidt, K.E. A framework for engaging stakeholders in water quality modeling and management: Application to the Qu’Appelle River Basin, Canada. J. Environ. Manag. 2019, 231, 1117–1126. [Google Scholar] [CrossRef]
  9. Hansen, B.; Thorling, L.; Schullehner, J.; Termansen, M.; Dalgaard, T. Groundwater nitrate response to sustainable nitrogen management. Sci. Rep. 2017, 7, 8566. [Google Scholar] [CrossRef]
  10. Liefferink, D.; Graversgaard, M.; Nielsen, H.Ø.; Boezeman, D.; Crabbé, A.; Wiering, M.; Kaufmann, M. How Hercules cleans up the Augean stables: Differentiated implementation of the EU Water Framework Directive. Water Policy 2021, 23, 1000–1016. Available online: https://iwaponline.com/wp/article/doi/10.2166/wp.2021.024/82900/How-Hercules-cleans-up-the-Augean-stables (accessed on 29 October 2021). [CrossRef]
  11. Thorsøe, M.H.; Graversgaard, M.; Noe, E. The challenge of legitimizing spatially differentiated regulation: Experiences from the implementation of the Danish Buffer zone act. Land Use Policy 2017, 62, 202–212. [Google Scholar] [CrossRef]
  12. Jacobsen, B.H.; Hansen, A.L. Economic gains from targeted measures related to non-point pollution in agriculture based on detailed nitrate reduction maps. Sci. Total Environ. 2016, 556, 264–275, ISSN 0048-9697. [Google Scholar] [CrossRef]
  13. Umweltbundesamt. Gewässer in Deutschland: Zustand und Bewertung. Dessau-Roßlau. 2017. Available online: https://www.umweltbundesamt.de/sites/default/files/medien/1968/publikationen/170829_uba_fachbroschure_wasse_rwirtschaft_mit_anderung_bf.pdf (accessed on 29 September 2021).
  14. Nählinder, J. Understanding innovation in a municipal context: A conceptual discussion. Innovation 2013, 15, 315–325. [Google Scholar] [CrossRef]
  15. Hekkert, M.P.; Negro, S.O. Functions of innovation systems as a framework to understand sustainable technological change: Empirical evidence for earlier claims. Technol. Forecast. Soc. Chang. 2009, 76, 584–594, ISSN 0040-1625. [Google Scholar] [CrossRef] [Green Version]
  16. Reed, M.S. Stakeholder participation for environmental management: A literature review. Biol. Conserv. 2008, 141, 2417–2431. [Google Scholar] [CrossRef]
  17. Carr, G.; Blöschl, G.; Loucks, D.P. Evaluating participation in water resource management: A review. Water Resour. Res. 2012, 48, 11. [Google Scholar] [CrossRef] [Green Version]
  18. Scott, T. Does collaboration make any difference? Linking collaborative governance to environmental outcomes. J. Policy Anal. Manag. 2015, 34, 537–566. [Google Scholar] [CrossRef]
  19. Van Buuren, A.; van Meerkerk, I.; Tortajada, C. Understanding emergent participation practices in water governance. Int. J. Water Resour. Dev. 2019, 35, 367–382. [Google Scholar] [CrossRef]
  20. Mikalsen, K.H.; Jentoft, S. From user-groups to stakeholders? The public interest in fisheries management. Mar. Policy 2001, 25, 281–292. [Google Scholar] [CrossRef]
  21. Layzer, J.A. Natural Experiments: Ecosystem-Based Management and the Environment; MIT Press: Cambridge, MA, USA, 2008. [Google Scholar]
  22. Wendt, D.E.; Starr, R.M. Collaborative research: An effective way to collect data for stock assessments and evaluate marine protected areas in California. Mar. Coast. Fish. Dyn. Manag. Ecosyst. Sci. 2009, 1, 315–324. [Google Scholar] [CrossRef]
  23. Sayce, K.; Shuman, C.; Connor, D.; Reisewitz, A.; Pope, E.; Miller-Henson, M.; Owens, B. Beyond traditional stakeholder engagement: Public participation roles in California’s statewide marine protected area planning process. Ocean Coast. Manag. 2013, 74, 57–66. [Google Scholar] [CrossRef]
  24. Pateman, C. Participation and Democratic Theory; Cambridge University Press: Cambridge, UK, 1970. [Google Scholar]
  25. Carr, G. Stakeholder and public participation in river basin management—An introduction. WIREs Water 2005, 2, 393–405. [Google Scholar] [CrossRef]
  26. Van de Kerkhof, M. Making a difference: On the constraints of consensus building and the relevance of deliberation in stakeholder dialogues. Policy Sci. 2006, 39, 279–299. [Google Scholar] [CrossRef]
  27. Elster, J. (Ed.) Deliberative Democracy; Cambridge University Press: Cambridge, UK, 1998; pp. 1–18. [Google Scholar]
  28. Bjerregaard, R. Getting Europe’s waters cleaner: Getting the citizens involved. Water Policy 1998, 1, 73–80. [Google Scholar] [CrossRef]
  29. Newig, J.; Pahl-Wostl, C.; Sigel, K. The role of public participation in managing uncertainty in the implementation of the water framework directive. Eur. Environ. 2005, 15, 333–343. [Google Scholar] [CrossRef]
  30. Graversgaard, M.; Jacobsen, B.H.; Kjeldsen, C.; Dalgaard, T. Stakeholder Engagement and Knowledge Co-Creation in Water Planning: Can Public Participation Increase Cost-Effectiveness? Water 2017, 9, 191. [Google Scholar] [CrossRef] [Green Version]
  31. Koontz, T.M.; Thomas, C.W. What do we know and need to know about the environmental outcomes of collaborative management? Public Admin. Rev. 2006, 66, 111–121. [Google Scholar] [CrossRef]
  32. Newig, J.; Fritsch, O. Environmental governance: Participatory, multi-level-and effective? Environ. Policy Gov. 2009, 19, 197–214. [Google Scholar] [CrossRef] [Green Version]
  33. Lubell, M. Resolving conflict and building cooperation in the National Estuary Program. Environ. Manag. 2004, 33, 677–691. [Google Scholar] [CrossRef]
  34. Cooke, B.; Kothari, U. Participation: The New Tyranny? Zed Books: London, UK, 2001. [Google Scholar]
  35. Bahadorestani, A.; Naderpajouh, N.; Sadiq, R. Planning for sustainable stakeholder engagement based on the assessment of conflicting interests in projects. J. Clean. Prod. 2020, 242, 118402. [Google Scholar] [CrossRef]
  36. Lam, P.T.; Chan, E.H.; Poon, C.S.; Chau, C.K.; Chun, K.P. Factors affecting the implementation of green specifications in construction. J. Environ. Manag. 2010, 91, 654–661. [Google Scholar] [CrossRef] [PubMed]
  37. Margerum, R.D.; Robinson, C.J. Collaborative partnerships and the challenges for sustainable water management. Curr. Opin. Environ. Sustain. 2015, 12, 53–58. [Google Scholar] [CrossRef]
  38. Podestá, G.P.; Natenzon, C.E.; Hidalgo, C.; Toranzo, F.R. Interdisciplinary production of knowledge with participation of stakeholders: A case study of a collaborative project on climate variability, human decisions and agricultural ecosystems in the Argentine Pampas. Environ. Sci. Policy 2013, 26, 40–48. [Google Scholar] [CrossRef]
  39. DeFries, R.; Nagendra, H. Ecosystem management as a wicked problem. Science 2017, 356, 265–270. [Google Scholar] [CrossRef] [PubMed]
  40. Ferraro, F.; Beunza, D. Creating common ground: A communicative action model of dialogue in shareholder engagement. Organ. Sci. 2018, 29, 1187–1207. [Google Scholar] [CrossRef]
  41. Okhuysen, G.A.; Bechky, B.A. 10 coordination in organizations: An integrative perspective. Acad. Manag. Ann. 2009, 3, 463–502. [Google Scholar] [CrossRef]
  42. Loewenstein, J.; Ocasio, W.; Jones, C. Vocabularies and vocabulary structure: A new approach linking categories, practices, and institutions. Acad. Manag. Ann. 2012, 6, 41–86. [Google Scholar] [CrossRef]
  43. Lin, X.; Ho, C.M.; Shen, G.Q. Who should take the responsibility? Stakeholders’ power over social responsibility issues in construction projects. J. Clean Prod. 2017, 154, 318–329. [Google Scholar] [CrossRef] [Green Version]
  44. Foray, D.; Mowery, D.C.; Nelson, R.R. Public R&D and social challenges: What lessons from mission R&D programs? Res. Policy 2012, 41, 1697–1702. [Google Scholar]
  45. Schmoch, U. Double-boom cycles and the comeback of science-push and market-pull. Res. Policy 2007, 36, 1000–1015. [Google Scholar] [CrossRef]
  46. Costantini, V.; Crespi, F.; Martini, C.; Pennacchio, L. Demand-pull and technology-push public support for eco-innovation: The case of the biofuels sector. Res. Policy 2015, 44, 577–595. [Google Scholar] [CrossRef]
  47. Eskerod, P.; Larsen, T. Advancing project stakeholder analysis by the concept ‘shadows of the context’. Int. J. Project Manag. 2018, 36, 161–169. [Google Scholar] [CrossRef]
  48. Abreu, M.; Grinevich, V.; Hughes, A.; Kitson, M. Knowledge Exchange Between Academics and the Business, Public and Third Sectors; University of Cambridge and Imperial College: London, UK, 2009. [Google Scholar]
  49. Phillipson, J.; Lowe, P.; Proctor, A.; Ruto, E. Stakeholder engagement and knowledge exchange in environmental research. J. Environ. Manag. 2012, 95, 56–65. [Google Scholar] [CrossRef]
  50. Cvitanovic, C.; McDonald, J.; Hobday, A.J. From science to action: Principles for undertaking environmental research that enables knowledge exchange and evidence-based decision-making. J. Environ. Manag. 2016, 183, 864–874. [Google Scholar] [CrossRef] [Green Version]
  51. Jacobsen, B.H.; Anker, H.T.; Baaner, L. Implementing the water framework directive in Denmark—Lessons on agricultural measures from a legal and regulatory perspective. Land Use Policy 2017, 67, 98–106. [Google Scholar] [CrossRef]
  52. Di Stefano, G.; Gambardella, A.; Verona, G. Technology push and demand pull perspectives in innovation studies: Current findings and future research directions. Res. Policy 2012, 41, 1283–1295. [Google Scholar] [CrossRef]
  53. Elberse, A.; Eliashberg, J. Demand and supply dynamics for sequentially released products in international markets: The case of motion pictures. Market. Sci. 2003, 22, 329–354. [Google Scholar] [CrossRef] [Green Version]
  54. Kleinknecht, A.; Verspagen, B. Demand and innovation: Schmookler re-examined. Res. Policy 1990, 19, 387–394. [Google Scholar] [CrossRef]
  55. Mowery, D.; Rosenberg, N. The influence of market demand upon innovation: A critical review of some recent empirical studies. Res. Policy 1979, 8, 102–153. [Google Scholar] [CrossRef]
  56. Gatignon, H.; Xuereb, J.M. Strategic orientation of the firm and new product performance. J. Mark. Res. 1997, 34, 77–90. [Google Scholar] [CrossRef]
  57. Teece, D.J.; Pisano, G.; Shuen, A. Dynamic capabilities and strategic management. Strateg. Manag. J. 1997, 18, 509–533. [Google Scholar] [CrossRef]
  58. Demircioglu, M.A. Reinventing the wheel? Public sector innovation in the age of governance. Public Adm. Rev. 2017, 77, 800–805. [Google Scholar] [CrossRef]
  59. De Vries, H.; Bekkers, V.; Tummers, L. Innovation in the public sector: A systematic review and future research agenda. Public Adm. 2016, 94, 146–166. [Google Scholar] [CrossRef] [Green Version]
  60. Potts, J.; Kastelle, T. Public sector innovation research: What’s next? Innovation 2010, 12, 122–137. [Google Scholar] [CrossRef]
  61. Clausen, T.H.; Demircioglu, M.A.; Alsos, G.A. Intensity of innovation in public sector organizations: The role of push and pull factors. Public Adm. 2020, 98, 159–176. [Google Scholar] [CrossRef] [Green Version]
  62. Moore, M.H. Creating Public Value: Strategic Management in Government; Harvard University Press: Cambridge, MA, USA, 1995. [Google Scholar]
  63. Pablo, A.; Reay, T.; Dewald, J.R.; Casebeer, A. Identifying, enabling and managing dynamic capabilities in the public sector. J. Manag. Stud. 2007, 44, 687–708. [Google Scholar] [CrossRef]
  64. Demircioglu, M.A.; Audretsch, D.B. Public sector innovation: The effect of universities. J. Technol. Transf. 2019, 44, 596–614. [Google Scholar] [CrossRef]
  65. Luke, B.; Verreynne, M.L.; Kearins, K. Innovative and entrepreneurial activity in the public sector: The changing face of public sector institutions. Innov. Organ. Manag. 2010, 12, 138–153. [Google Scholar] [CrossRef]
  66. Verhoest, K.; Verschuere, B.; Bouckaert, G. Pressure, legitimacy, and innovative behavior by public organizations. Gov. Int. J. Policy Adm. Inst. 2007, 20, 469–497. [Google Scholar] [CrossRef]
  67. Fernandez, S.; Wise, L.R. An exploration of why public organizations ‘ingest’ innovations. Public Adm. 2010, 88, 979–998. [Google Scholar] [CrossRef]
  68. Sahni, N.R.; Wessel, M.; Christensen, C.M. Unleashing Breakthrough Innovation in Government. Stanford Social Innovation Review. 2013. Available online: https://ssir.org/articles/entry/unleashing_breakthrough_innovation_in_government# (accessed on 29 October 2021).
  69. Gonzalez, R.; Llopis, J.; Gasco, J. Innovation in public services: The case of Spanish local government. J. Bus. Res. 2013, 66, 2024–2033. [Google Scholar] [CrossRef] [Green Version]
  70. Hofmann, T.; Lowry, G.V.; Ghoshal, S.; Tufenkji, N.; Brambilla, D.; Dutcher, J.R.; Gilbertson, L.M.; Giraldo, J.P.; Kinsella, J.M.; Landry, M.P.; et al. Technology readiness and overcoming barriers to sustainably implement nanotechnology-enabled plant agriculture. Nat. Food 2020, 1, 416–425. [Google Scholar] [CrossRef]
  71. Cyert, R.M.; March, J.G. A Behavioral Theory of the Firm; University of Illinois at Urbana: Urbana, IL, USA, 1963; Volume 2, pp. 169–187. [Google Scholar]
  72. Laursen, K. Keep searching and you’ll find: What do we know about variety creation through firms’ search activities for innovation? Ind. Corp. Chang. 2012, 21, 1181–1220. [Google Scholar] [CrossRef]
  73. Drews, J. Drug discovery: A historical perspective. Science 2000, 287, 1960–1964. [Google Scholar] [CrossRef] [Green Version]
  74. Fleming, L.; Sorenson, O. Science as a map in technological search. Strateg. Manag. J. 2004, 25, 909–928. [Google Scholar] [CrossRef]
  75. Nelson, R.R.; Nelson, K. Technology, institutions, and innovation systems. Res. Policy 2002, 31, 265–272. [Google Scholar] [CrossRef]
  76. Jacobsson, S.; Bergek, A. Transforming the energy sector: The evolution of technological systems in renewable energy technology. Ind. Corp. Chang. 2004, 13, 815–849. [Google Scholar] [CrossRef]
  77. Bergek, A.; Jacobsson, S.; Carlsson, B.; Lindmark, S.; Rickne, A. Analyzing the functional dynamics of technological innovation systems: A scheme of analysis. Res. Policy 2008, 37, 407–429. [Google Scholar] [CrossRef] [Green Version]
  78. Hekkert, M.P.; Suurs, R.A.A.; Negro, S.O.; Kuhlmann, S.; Smits, R.E.H.M. Functions of innovation systems: A new approach for analysing technological change. Technol. Forecast. Soc. Chang. 2007, 74, 413–432, ISSN 0040-1625. [Google Scholar] [CrossRef] [Green Version]
  79. Geels, F.W. Technological transitions as evolutionary reconfiguration processes: A multi-level perspective and a case-study. Res. Policy 2002, 31, 1257–1274. [Google Scholar] [CrossRef] [Green Version]
  80. Refsgaard, J.C.; Hansen, A.L.; He, X.; Jacobsen, B.H.; Gertz, F. NiCA Grundlag for Differentieret Regulering af Nitratudledning. NiCA Technical Note. 2014. Available online: http://nitrat.dk/xpdf/technicalnote---nica-results.pdf (accessed on 29 October 2021).
  81. Yin, R.K. How to do better case studies. In The SAGE Handbook of Applied Social Research Methods; Sage: Thousand Oaks, CA, USA, 2009; Volume 2, pp. 254–282. [Google Scholar]
  82. Miles, M.B.; Huberman, A.M. Qualitative Data Analysis: An Expanded Sourcebook; Sage: Thousand Oaks, CA, USA, 1994. [Google Scholar]
  83. Eisenhardt, K.M. Agency theory: An assessment and review. Acad. Manag. Rev. 1989, 14, 57–74. [Google Scholar] [CrossRef]
  84. Miles, M.B.; Huberman, A.M.; Saldana, J. Qualitative Data Analysis: A Methods Sourcebook; Sage: Thousand Oaks, CA, USA, 2014. [Google Scholar]
  85. Rowley, J. Using case studies in research. Manag. Res. News 2002, 25, 16–27. [Google Scholar] [CrossRef]
  86. Refsgaard, J.C.; Auken, E.; Bamberg, C.; Christensen, B.; Clausen, T.; Dalgaard, E.; Effersø, F.; Ernstsen, V.; Gertz, F.; Hansen, A.L.; et al. Nitrate reduction in geologically heterogeneous catchments—A framework for assessing the scale of predictive capability of hydrological models. Sci. Total Environ. 2014, 468, 1278–1288. [Google Scholar] [CrossRef]
  87. Refsgaard, J.C.; Auken, E. NiCAmapping of Agricultural Areas—A Cost Estimate. NiCA Technical Note. 2014. Available online: http://nitrat.dk/xpdf/technicalnote---cost-of-nica-mapping.pdf (accessed on 29 October 2021).
  88. Regeringen. Fødevare og Fødebrugspakken. 2015. Available online: https://mfvm.dk/fileadmin/user_upload/FVM.dk/Dokumenter/Landbrug/Indsatser/Foedevare-_og_landbrugspakke/Aftale_om_foedevare-_og_landbrugspakken.pdf (accessed on 29 October 2021).
  89. Ministry of Environment and Food. Aftale om Målrettet Regulering. 2018. Available online: https://mfvm.dk/fileadmin/user_upload/MFVM/Aftaletekst_om_maalrettet_regulering.docx.pdf (accessed on 29 October 2021).
  90. Ministry of Environment. Status and Trends of the Aquatic Environment and Agricultural Practice in Denmark—Report to the European Commission for the Period 2016–2019 in Accordance with Article 10 of the Nitrates Directive (1991/676/EEC); Ministry of Environment: Copenhagen, Denmark, 2021. [Google Scholar]
  91. Christensen, A.A.; Andersen, P.S.; Piil, K.; Andersen, E.; Vejre, H.; Graversgaard, M. Pursuing implementation solutions for targeted nitrogen management in agriculture: A novel approach to synthesize knowledge and facilitate sustainable decision making based on collaborative landscape modelling. J. Environ. Manag. 2019, 246, 679–686. [Google Scholar] [CrossRef] [PubMed]
  92. Blicher-Mathiesen, G.; Petersen, R.J.; Holm, H.; Rolighed, J.; Houlborg, T.; Andersen, H.E.; Carstensen, M.V.; Jensen, P.G.; Wienke, J.; Hansen, B.; et al. Landovervågningsoplande 2019. 2021. Available online: https://dce2.au.dk/pub/SR451.pdf (accessed on 29 October 2021).
  93. Nygaard, K.; Schaper, S.; Jacobsen, B.; Hansen, B. Sustainable value propositions of a new technology for targeted nitrogen regulation. J. Clean. Prod. 2021. Under Review. [Google Scholar]
  94. Wang, J.; Aenis, T. Stakeholder analysis in support of sustainable land management: Experiences from southwest China. J. Environ. Manag. 2019, 243, 1–11. [Google Scholar] [CrossRef] [PubMed]
  95. Bromley, D.W. Environmental regulations and the problem of sustainability: Moving beyond “market failure”. Ecol. Econ. 2007, 63, 676–683. [Google Scholar] [CrossRef]
Figure 1. Key events for stakeholder engagement, stakeholder attention, and stakeholder attitudes.
Water 13 03313 g001
Figure 2. Stakeholder influence/interests matrix (selection of key stakeholders).
Water 13 03313 g002
Table 1. Overview of data foundation.
ProjectsSourcesActivityDescriptionAmountDocuments
MapFieldParticipatory meeting activityWork package leader meetings/internal stakeholder workshops/larger external stakeholder workshop/taskforcesObservations and notes related to the implementation and commercialization of the mapping technology through stakeholder engagement.35+ meetings and seminars with observations notesAbout 100 pages of handwritten notes. Official meeting minutes and other related documents (also included were iterations of document production, such as whitepaper and priority tools), in total amounting to roughly 50 pages.
MapFieldImplementation strategyCosting groupInternal project group aimed at calculating the cost of mapping per ha per year. The group also strategized on various implementation options or possibilities.8 meetings with notes plus various calculations and suggestions for the cost structure and potential value drivers to sustain the cost drivers.30 pages of notes, including possible models for making the initial investment.
MapField and rOpenFarmer-specific interviewExternal stakeholdersInterviews with the external stakeholders were primarily done with farmers.6 farmers20 pages of transcription
MapField and rOpenSurvey dataInternal stakeholdersProject internal survey used a validation of the stakeholder matrix.17 informants17 completed survey
MapFieldDocumentations, reports, and email correspondencesParticipation in the coordination of project internal activities. Development of various reportsDevelopment of leaflet, historical accounts, the creation of a priority tool, problem-solving activities.200+ emails, 25+ documentsRoughly 165 pages of transcription
rOpen and NiCAOfficial and internal documents, cluster reports, technical reportsReports, papers, and other relevant technical reports from all of the projectsThe purpose of this data collection was to understand the interaction between these two projects on stakeholder engagement and the technology push.We in total included 15 papers and reports from NiCA and rOpenFrom these reports, we included 25+ pages for relevant analysis.
AllExpert interviewsKey individuals from the three projects were interviewed to cross-validate or adjust events that we had found to be important in our initial coding.One expert interview with a top-tier agency official—who has been part of the paradigm change from the start. Two group interviews in which we included PIs, agro-economists, and a director from an agro-consultant who all are or have been part of the subsequent research portfolio.5 experts in totalThematic transcription, in total, amounted to 14 pages of transcription.
Table 2. The interplay of stakeholder engagement activities with the seven functions and TRL.
Events and Stakeholder Engagement ActivitiesCorresponding FunctionsCorresponding TRL (Approximate)
Event 1: The Parliament and the Danish Agriculture and Food Council (agricultural interest organization) initiated the first document of interest in investigating the dynamic or targeted regulation.Function 6: resource mobilization TRL 1
Event 2: The interest and involvement of the key stakeholders were rather peripheral, and the PI team paid most attention to the governmental agencies.Function 2: knowledge development (learning) TRL 2
Event 3: (…) but the PI team needed to have more focus on including the farmers, as access was needed to their fields.Function 3: knowledge diffusion through networks TRL 3–4
Event 4: In dialogue with farmers, agricultural advisors, and other scientists, the team interpreted the result and indicated that targeted regulations were doable with the use of the tTEM technology. Function 3: knowledge diffusion through networks
Function 7: creation of legitimacy/counteract resistance to change
TRL 4–5
Event 5: These analyses changed the attitude amongst the farmers’ union and their in-house scientists. The project team held stakeholder meetings and engaged the farmers in dialogue and interviews based on the mapping results.Function 7: creation of legitimacy/counteract resistance to change TRL 5
Event 6: At the end of the rOpen project, the tTEM technology was developed and tested in fields. The data that this method generated were considered useful for a potential N retention mapping tool.Function 2: knowledge development (learning) TRL 7
Event 7: One suggestion was a stop-and-go model that was also presented to the rest of the MapField research and project team. (…) This approach was later refined into developing a so-called priority tool cocreated through stakeholder engagement. Function 2: knowledge development (learning) TRL 7
Event 8: Meeting series with the environmental agency and the researchers of MapField. The project researchers were able to show and explain to the agency how the mapping and modeling worked.Function 4: influence on the direction of search TRL 7–8
Event 9: The management team decided to produce a white paper that could be used to communicate and inform key stakeholders about the MapField concept and how it could be used.Function 7: creation of legitimacy/counteract resistance to changeTRL 7–8
Event 10: The initial two methods had some variation and similarities, but through stakeholder engagement and inclusion of 15 people from different backgrounds, they settled for a hybrid model between the two.Function 3: knowledge diffusion through networks
Function 7: creation of legitimacy/counteract resistance to change
TRL 8
Event 11: The MapField management team was asked by the agency and ministry to create a task force that would advise the agency/ministry on the cost and time to implement this technology.Function 5: market formationFunction 6: resource mobilizationTRL 8–9
Publisher’s Note: MDPI stays neutral with regard to jurisdictional claims in published maps and institutional affiliations.

