Article

Hydrological Drought Assessment Based on the Standardized Streamflow Index: A Case Study of the Three Cape Provinces of South Africa

by
Christina M. Botai
1,*,
Joel O. Botai
1,2,3,4,*,
Jaco P. de Wit
1,
Katlego P. Ncongwane
1,5,
Miriam Murambadoro
1,
Paul M. Barasa
4 and
Abiodun M. Adeola
1
1
South African Weather Service, Private Bag X097, Pretoria 0001, South Africa
2
Department of Geography, Geoinformatics and Meteorology, University of Pretoria, Private Bag X020, Hatfield, Pretoria 0028, South Africa
3
Department of Information Technology, Central University of Technology, Free State, Private Bag X200539, Bloemfontein 9300, South Africa
4
Centre for Transformative Agricultural and Food Systems, School of Agricultural, Earth and Environmental Sciences, University of KwaZulu-Natal, Pietermaritzburg 3209, South Africa
5
School of Geography and Environmental Science, University of KwaZulu-Natal, Durban 4041, South Africa
*
Authors to whom correspondence should be addressed.
Water 2021, 13(24), 3498; https://doi.org/10.3390/w13243498
Submission received: 9 November 2021 / Revised: 2 December 2021 / Accepted: 4 December 2021 / Published: 8 December 2021

Abstract

:
Global impacts of drought conditions pose a major challenge towards the achievement of the 2030 Sustainable Development Goals. As a result, a clarion call for nations to take actions aimed at mitigating the adverse negative effects, managing key natural resources and strengthening socioeconomic development can never be overemphasized. The present study evaluated hydrological drought conditions in three Cape provinces (Eastern, Western and Northern Cape) of South Africa, based on the Standardized Streamflow Index (SSI) calculated at 3- and 6-month accumulation periods from streamflow data spanning over the 3.5 decades. The SSI features were quantified by assessing the corresponding annual trends computed by using the Modified Mann–Kendall test. Drought conditions were also characterized in terms of the duration and severity across the three Cape provinces. The return levels of drought duration (DD) and drought severity (DS) associated with 2-, 5-, 10-, 20- and 50-year periods were estimated based on the generalized extreme value (GEV) distribution. The results indicate that hydrological drought conditions have become more frequent and yet exhibit spatial contrasts throughout the study region during the analyzed period. To this end, there is compelling evidence that DD and DS have increased over time in the three Cape provinces. Return levels analysis across the studied periods also indicate that DD and DS are expected to be predominant across the three Cape provinces, becoming more prolonged and severe during the extended periods (e.g., 20- and 50-year). The results of the present study (a) contribute to the scientific discourse of drought monitoring, forecasting and prediction and (b) provide practical insights on the nature of drought occurrences in the region. Consequently, the study provides the basis for policy- and decision-making in support of preparedness for and adaptation to the drought risks in the water-linked sectors and robust water resource management. Based on the results reported in this study, it is recommended that water agencies and the government should be more proactive in searching for better strategies to improve water resources management and drought mitigation in the region.

1. Introduction

Drought is a naturally recurring hazard associated with a decrease in water availability over time within a region. Such conditions are often attributed to anomalous weather conditions associated with the decreasing intensity or a deficiency of precipitation; the changes in the onset and cessation of precipitation; and in climatological parameters, such as temperature, relative humidity and evapotranspiration [1,2,3]. Drought is also influenced by natural global circulation changes; the long-term abnormal Sea Surface Temperature (SST), particularly in the tropics; and El Nino Southern Oscillation (ENSO) associated with below-normal rainfall [4]. In addition, drought over Africa (especially in the Sahel region) could be associated with the southward shift of the warm SST in the Atlantic and the warming in the Indian Ocean [5].
South Africa, similarly to many semi-arid and arid countries globally, suffers from frequent occurrence of drought conditions. In recent years, some parts of the country have been declared disaster areas; however, some regions have since recovered or are slowly recovering. Some regions have experienced what has been termed the “worst drought in over 35 years” [6], including the 2015 drought that was partly attributed to a rainfall deficit that reached the lowest annual average since 1904 [7]. The southwestern and southeastern regions of the country, particularly the Western, Eastern and Northern Cape provinces, have been experiencing diverse impacts of drought, resulting from the common classified categories (e.g., meteorological, agricultural, hydrological and socioeconomic) conditions [8,9]. The drought conditions had profound and negative implications on the economies of these adjacent provinces. In particular, a persistent physical phenomenon attributed to the first three classes of drought (meteorological, agricultural and hydrological) has caused substantial and irreversible socioeconomic challenges in the Eastern Cape, resulting in significant low water levels, bringing uncertainty to the most vulnerable communities. The Western Cape province has also experienced a water crisis, particularly in 2015/2016 and 2018/19, which was attributed to past drought conditions in the province [10]. In addition, severe drought in the Northern Cape province has affected farming activities and cost the provincial government millions of Rands in drought-related funding relief to mitigate the inherent effects.
Persistent drought conditions in the three Cape provinces have led the National Disaster Management Centre to reclassify drought as a national drought disaster in a bid to mobilize the necessary resources to support the affected communities, including farmers. While this declaration is essential and provides a short-term solution, there is a need to explore long-term solutions to alleviate the negative impacts of drought in these regions. Effective drought monitoring and early warning systems form the basis for reducing vulnerability, as well as developing proactive policies to enhance adaptive capacity and drought mitigation measures. Drought indices are some of the tools that can be used to evaluate and monitor drought. Examples of existing drought indices that have been applied in drought-related studies include the Standardized Precipitation Index (SPI) [11], Standardized Precipitation and Evapotranspiration Index (SPEI) [12], Palmer Drought Severity Index (PDSI) [13], Effective Drought Index (EDI) [14], Surface Water Supply Index (SWSI) [15], Streamflow Drought Index (SDI) [16] and Standardized Streamflow Index (SSI) [17], among others. The selection and application of these drought indices are dependent on various factors, such as the nature of the index, local conditions and data requirements and availability. Some of these indices have been extensively applied in South Africa for drought-related studies. These include drought characteristics over the Western Cape province [10], in the Free State and North West provinces [18], in Mpumalanga, Kwa-Zulu Natal, Free State, and North West provinces [19] and the Southern Africa [20]. Moreover, drought propagation using SPI and SSI was reported by Reference [21], as well as drought-risk assessment in the Eastern Cape province [22], hydroclimatic extremes in the Limpopo River Basin [23] and drought characteristics based on the SPI and EDI in the Free State province [24], among others.
Most of these studies have primarily focused on a meteorological drought, where they have analyzed precipitation data, presumably because rainfall is the leading driver to drought. Despite the fact that, in most parts of South Africa, the impacts of drought are manifested in water resources, e.g., increased water demand for domestic, irrigation and industrial use, among others, studies on hydrological drought are rather limited. The purpose of this study was to characterize and understand the extent of hydrological drought conditions that have adversely affected the water resources in the three Cape provinces of South Africa, using the SSI. The specific study objectives were to (1) assess characteristics of the past hydrological drought in terms of historical trends, duration and severity and (2) determine the return levels of drought duration and severity across selected periods. The results can contribute towards the implementation of drought monitoring and early warning systems that could support planning, preparedness and innovation to improve the regions’ adaptive capacity for water resources’ supply and demand.

2. Study Area, Materials and Methods
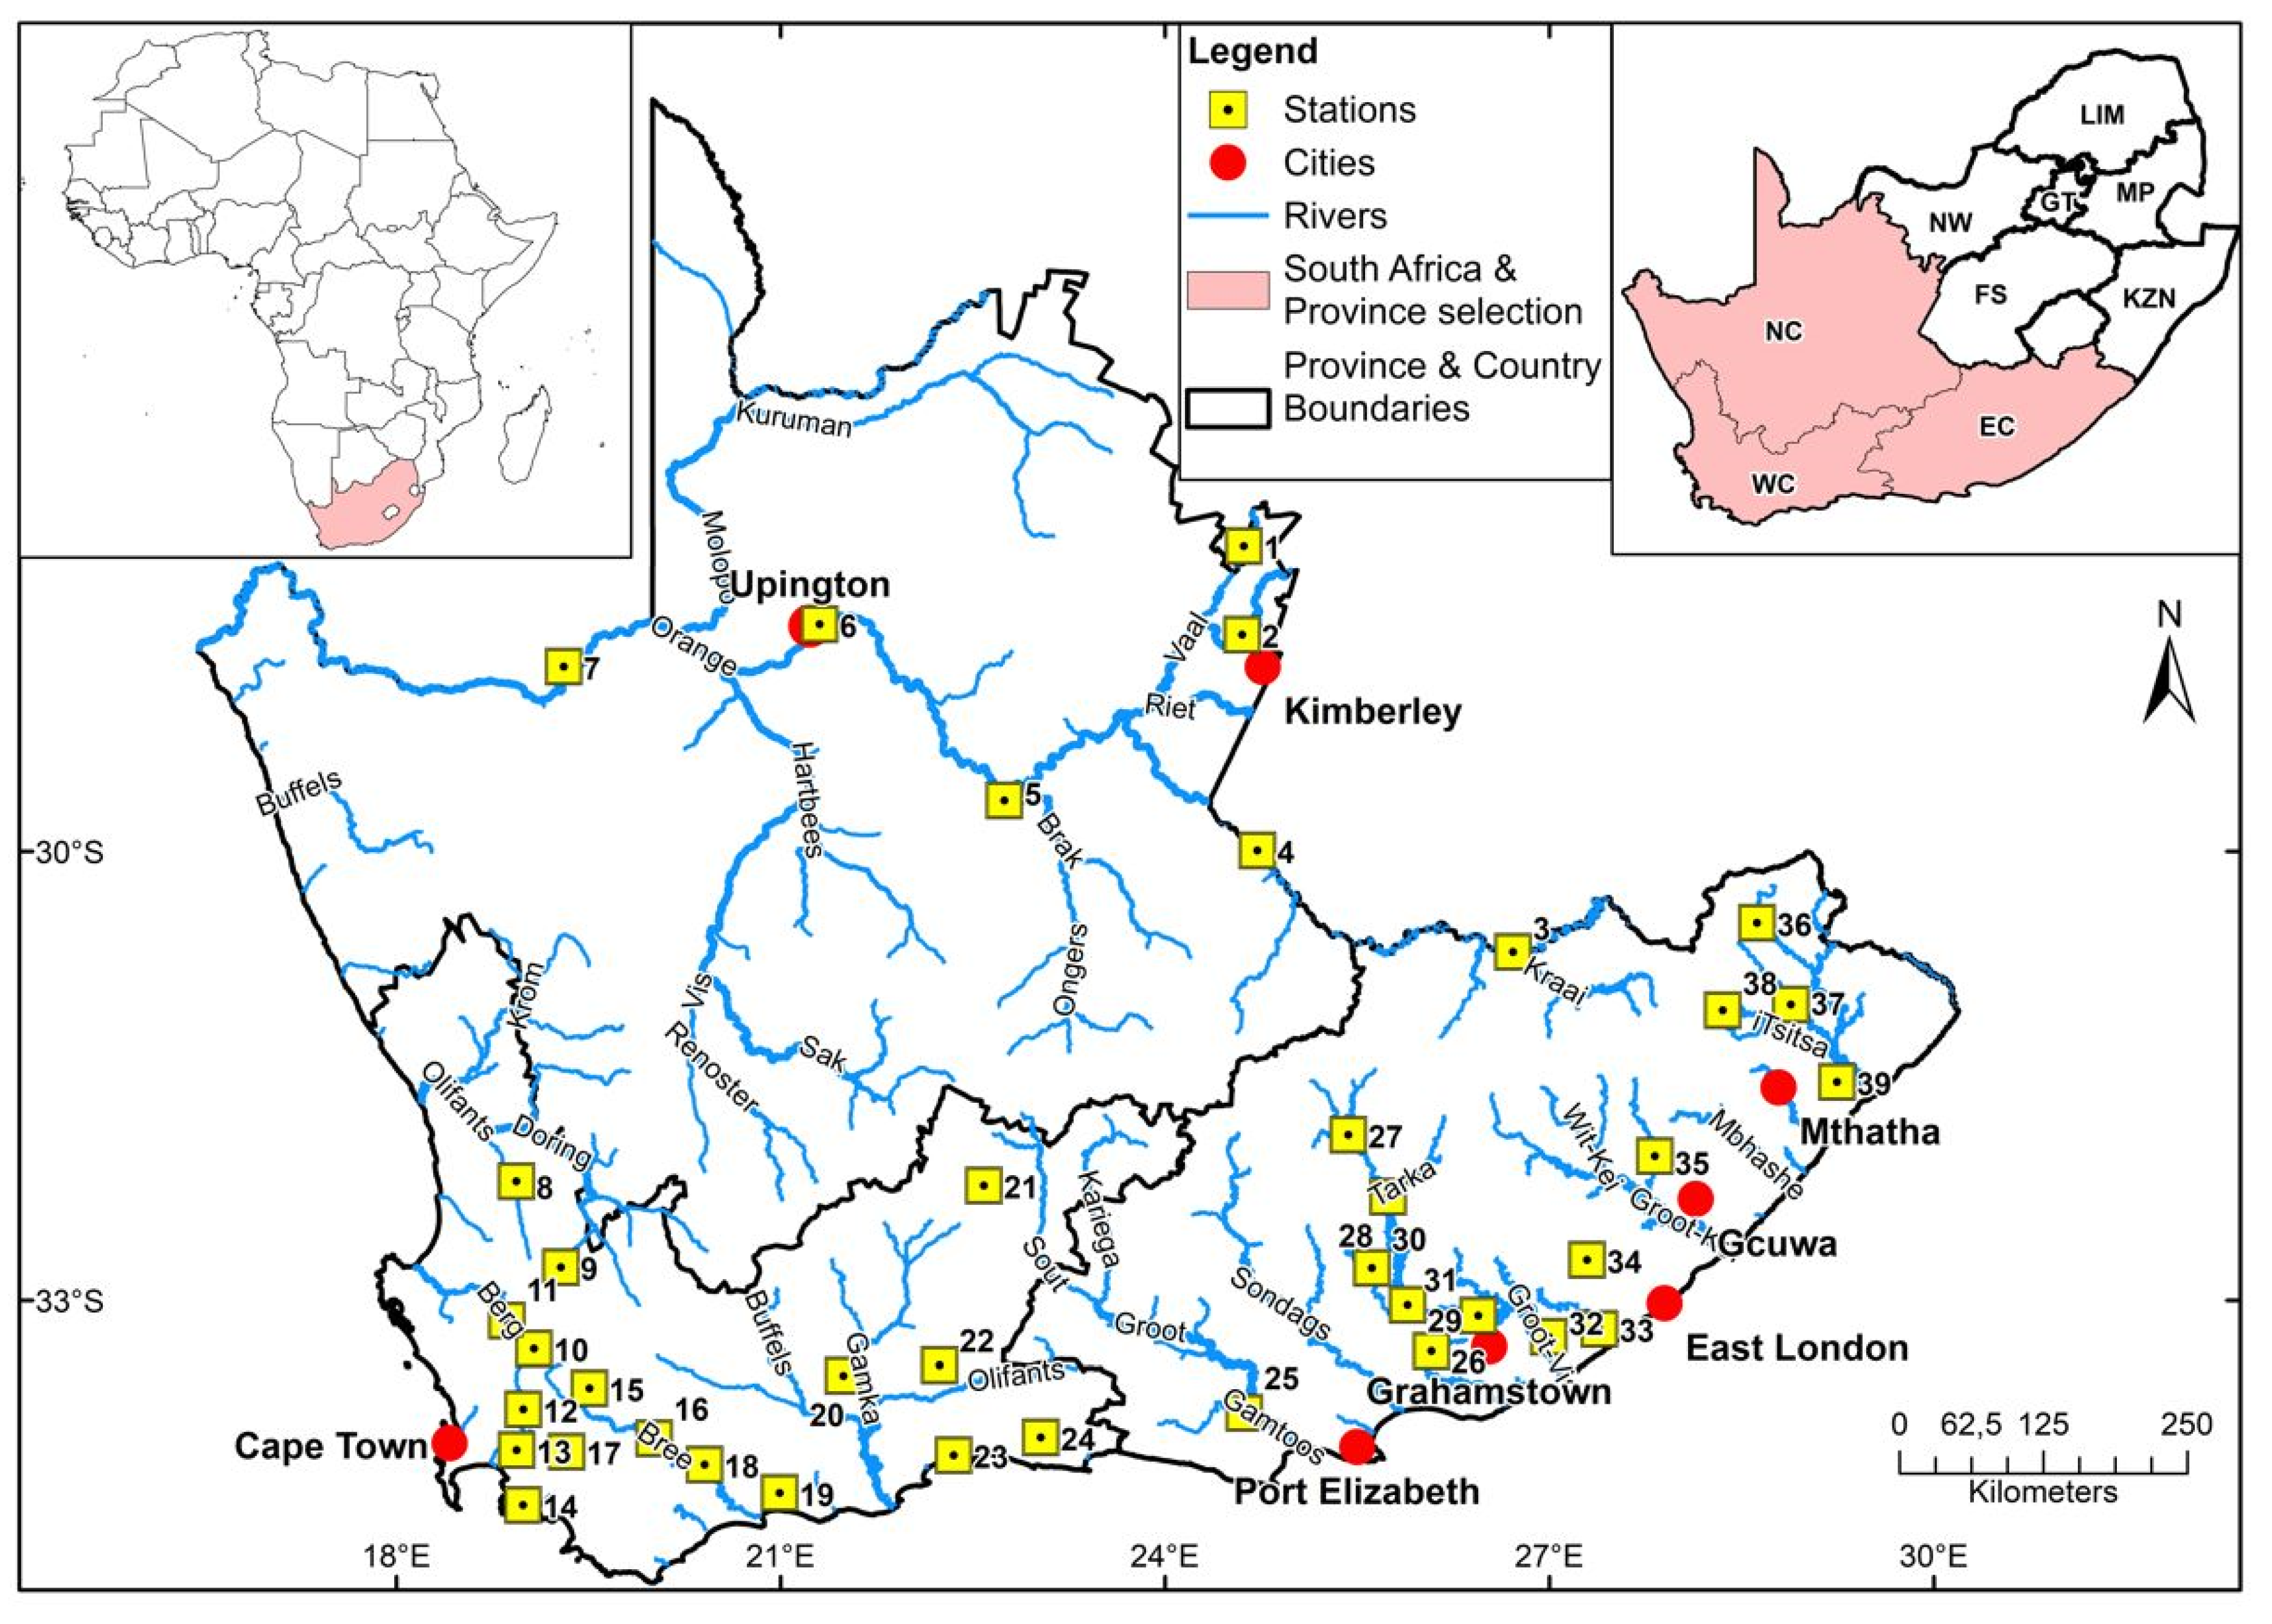
2.1. Study Area

The three Cape provinces of South Africa, (the Northern Cape (NC), Eastern Cape (EC), and Western Cape (WC)), as shown in Figure 1, are located in the southwest of the country and account for more than half (55%) of the country’s total geographical area [25,26]. The WC province is situated on the southwestern tip of South Africa between the Indian and Atlantic oceans. It is characterized by a warm temperate Mediterranean climate, with cool, wet winters and relatively dry, warm summers [27]. The province experiences diverse climate conditions, including dominant rainfall in austral winter and early spring. In general, the WC province exhibits two dominant rainfall zones, e.g., the winter (west coast) and the bi-modal (spring and autumn in the southern regions) rainfall features [27]. All-season rainfall is received in the south-coast regions of the province [27]. The received rainfall is highly variable, ranging between the lowest of 60 mm to the highest of 3345 mm per year [28]. Most areas in the province receive annual rainfall between 350 and 1000 mm per year [28]. Coastal and inland temperatures range between 15 and 27 °C and between 3 and 5 °C, respectively [28]. The WC province is responsible for a large share of national output in agriculture, forestry and fisheries, with a large proportion of the agricultural activities mostly concentrated in the Cape Winelands [29].
The EC province is a coastal province that lies on the country’s southeastern coast bordering the subtropical KwaZulu-Natal and Mediterranean WC province. The province is characterized by a bi-modal type of rainfall, meaning that it receives both summer (most southern) and winter (southwestern) rainfall [30]. Some pocket areas in the western coast of the province are classified as all-season rainfall regions. In general, the EC province has an arid to semi-arid climate, with annual rainfall ranging between 350 and 550 mm/year, mean annual temperature of 17.6 °C and daily maximum temperatures of up to 40 °C in the summer [31].
The NC province is South Africa’s largest province, covering approximately 31% of the country’s land area, and has the country’s lowest population density of all provinces [32]. In general, the NC province is mostly a desert-to-semi-desert area. The region is characterized by fluctuating temperatures and varying landscapes [33]. The western areas of the province receive winter rainfall, whereas summer rainfall with thunderstorms is experienced in the eastern regions. The mean annual rainfall is sparse, ranging between 50 and 400 mm per annum, while the temperature in summer often reaches maximum of 40 °C [34].

2.2. Materials

The daily observed streamflow datasets were acquired from the Department of Water and Sanitation, South Africa, on https://www.dws.gov.za/Hydrology/Verified/hymain.aspx (accessed on 6 September 2021). The present study considered datasets from 39 stations distributed across the three Cape provinces, with provincial distribution as follows: 6 in the NC, 16 in the EC and 17 in the WC (see Figure 1). Table 1 gives a summary of the selected flow gauge stations, including the location, catchment area and average flow. The stations were selected based on the availability of continuous datasets for the period spanning from 1985 to 2020 and less than 5% gaps. As shown in Figure 1, the WC has a dense network of streamflow stations, followed by the EC province. Notwithstanding harboring few streamflow stations, the northern parts of the NC province have Kalahari Desert conditions. As a result, a better characterization of the drought conditions in the province was deemed necessary.

2.3. Methods

2.3.1. Standardized Streamflow Index

The SSI developed by Vicente-Serrano [17] is considered a useful index for the assessment and characterization of hydrological drought. Hydrological drought is associated with a reduction in the groundwater and/or surface-water resources, including river flows, reservoir storage and acquires [35], consequently affecting water supply for various purposes, including domestic, agriculture, power generation and recreation, among others. The SSI has been applied in various studies globally for the assessment of hydroclimatic extremes [23], characterization of anomalies in streamflow data [17,36], drought assessment [37], etc. While there has been no consensus on the exact methodology to use in the computation of the SSI, two approaches have been proposed in the literature by Modarres [36] and Vecente-Serrano et al. [17]. In studies by Vecente-Serrano et al. [17], the SSI considers a probability distribution fitting that best represents the streamflow variations over the analyzed domain. This concept is statistically similar to the calculation of the Standardized Precipitation Index (SPI) [11].
In this study, the SPI concept was used to compute SSI to characterize the hydrological drought conditions across the three Cape provinces of South Africa. An important aspect when computing a drought index is the ability to select the most suitable probability distribution function that best fits the datasets of hydroclimatic variables. For instance, the gamma probability distribution has been identified as the best and hence is widely used in computing SPI [11]. In the case of SSI, no single probability distribution has been identified as being suitable for its computation [17]. However, according to References [38,39], the gamma distribution is also appropriate and can be used to fit long-term streamflow data and calculate SSI. In this regard, the gamma probability distribution was used in the present study to fit the aggregated monthly streamflow records.
A gamma distribution in which a random variable, x, is continuous can be expressed as follows [11,40]:
g ( x , α , β ) = 1 β α Γ ( α ) x α 1 e x / β
where α > 0 and β > 0 are the estimated shape and scale parameters, respectively; x > 0 is the streamflow (m3/s); and Γ(α) is the gamma function defined by the following:
Γ ( α ) = 0 x α 1 e x d x
The gamma distribution is used to compute the cumulative probability function given as follows:
G ( x ) = 0 x g ( x ) d x = 0 x 1 β α Γ ( α ) x α 1 e x / β d x = 1 Γ ( a ) 0 x t a 1 e 1 d t
If x = 0 and q = P(x = 0) > 0, where P(x = 0) is the probability of zero streamflow, then the gamma distribution is undefined. In this regard, the cumulative probability density can be described by the following:
H ( x ) = q + ( 1 q ) G ( x )
The cumulative probability distribution function is transformed into a normal distribution, with an average and standard deviation of zero (0) and one (1), respectively, resulting in SSI time series. The resulting SSI consists of both negative and positive values which represent drought/dry (i.e., a period having negative/below zero values) and non-drought/wet (i.e., a period with positive/above zero values) events, respectively.
In this study, the SSI was computed for three (e.g., SSI-3) and six (SSI-6) accumulation periods and categorized by using the classification criteria of SPI, recommended by the World Meteorological Organization standards [41] as given in Table 2. The selected accumulated time-steps cover both seasonal (or agricultural) and supra-seasonal, where water resources are likely to be affected due to insufficient and/or delayed precipitation. Annual features of the SSI were calculated based on the hydrological calendar year (e.g., October–September).

2.3.2. Drought Duration and Severity

The SSIs calculated for the 3- and 6-month time scales were used to characterize hydrological drought in terms of drought duration (DD) and drought severity (DS) across the three Cape provinces. Following various studies (e.g., References [42,43]), the following procedure was used to calculate the DD and DS:
(a)
A drought event (epoch) was determined when 2 or more consecutive months exhibited negative SSI values.
(b)
For each drought event, DD represents the number of months of the drought event.
(c)
The DS was computed as the absolute sum of the SSI, and is given in Equation (5) [43,44]:
DS e = | j = 1 DD SSI j |
where j represents a drought month, and DD corresponds to the duration of a drought event e.

2.3.3. The Modified Mann–Kendall Trend Analysis

Trends analysis for streamflow, as well as the selected drought features (SSI, DD and DS), across the study area, was carried out by using the Modified Mann–Kendall (MMK) test [45,46]. The MMK test, as the name implies, is the modified version of the original form of the Mann–Kendall (MK) test [47,48,49]. The MK non-parametric test is known to be flexible with all distributions [50] and has been extensively used in research fields, such as meteorology, hydrology and climatology, among others, to detect shifts and changes in climatic [51] and hydrologic variables [52,53]. Despite this, the MK test has drawbacks in handling issues relating to autocorrelation in the datasets, as is commonly the case of streamflow data. In this regard, the MMK trend test was used in the present study to account for the presence of autocorrelation in the streamflow data.
The MK test statistic (S) is defined by Equation (6), as described in Malik and Kumar [46]:
S = i = 1 n 1 j = 1 n sgn ( X j X i )
where n represents the number of datasets, Xi is the rank for the ith datasets (i = 1, 2, 3, …, n − 1) and Xj is the rank for the jth datasets (j = i + 1, 2, …, n). The sign function, sgn, is computed as per Equation (7) [46]:
sgn   ( X j X i ) = { 1 ; if   ( X j X i ) > 0 0 ; if   ( X j X i ) = 0 1 ; if   ( X j X i ) < 0
The MMK test is normally applied to a significant autocorrelation coefficient of time-series data, with the modified variable computed by using Equation (8):
V a r ( S ) * = V a r ( S ) n n s
where V a r ( S ) * is the modified variance of the MMK test, Var(S) represents the variance of the MK test series and n/ns is a correction attributed to autocorrelation within the data, as is given by Equation (9):
n n s = 1 + 2 n ( n 1 ) ( n 2 ) k = 1 n 1 ( n k ) ( n k 1 ) ( n k 2 ) r k
In Equation (9), n corresponds to an actual number of datasets, and rk is a significant autocorrelation coefficient at lag-k, with its value ranging between negative and positive one. The standardized MMK test statistics are estimated as follows:
Z MMK = { S 1 V a r ( S ) * ; if   S > 0 0 ; if   S = 0 S + 1 V a r ( S ) * ; if   S < 0
The ZMMK satisfies a standard normal distribution, where the mean and variance are zero (0) and one (1), respectively. In this study, the null hypothesis (e.g., no trend) and the opposite hypothesis (trend) were tested at a 95% confidence level, e.g., trends were considered statistically significant whenever the p-value was less or equal to 0.05.

2.3.4. Drought Return Levels Analysis

The DD and DS values were analyzed by using the Generalized Extreme Value (GEV) distribution. The GEV is a family of three distributions (e.g., Gumbel, Frechet and Weibull) used for analyzing extreme events, including modeling the block maxima [54,55]. Using the GEV, the distribution of the magnitudes of DD and DS can be approximated as per Equation (11):
F ( x ) = e x p { [ 1 ξ ( z μ σ ) ] 1 ξ }
where μ, σ and ξ are the location, scale and shape GEV parameters (all dimensionless), respectively. These parameters are estimated based on the maximum likelihood estimation method [55], where the likelihood function is given by the following:
L = i = 1 N { 1 σ [ 1 ξ ( x i μ σ ) ] 1 ξ 1 e [ 1 ξ ( x i μ ) σ ] 1 ξ }
where N is the number of observations. In this study, the predicted DD and DS return levels associated with 2, 5, 10 and 20 years were calculated by using Equation (13):
Z p = μ ^ σ ^ ξ [ 1 { l o g ( 1 1 T ) } ξ ]
where Zp is the estimated return level corresponding to T-years return periods (e.g., T = 2, 5, 10, 20 and 50).

3. Results

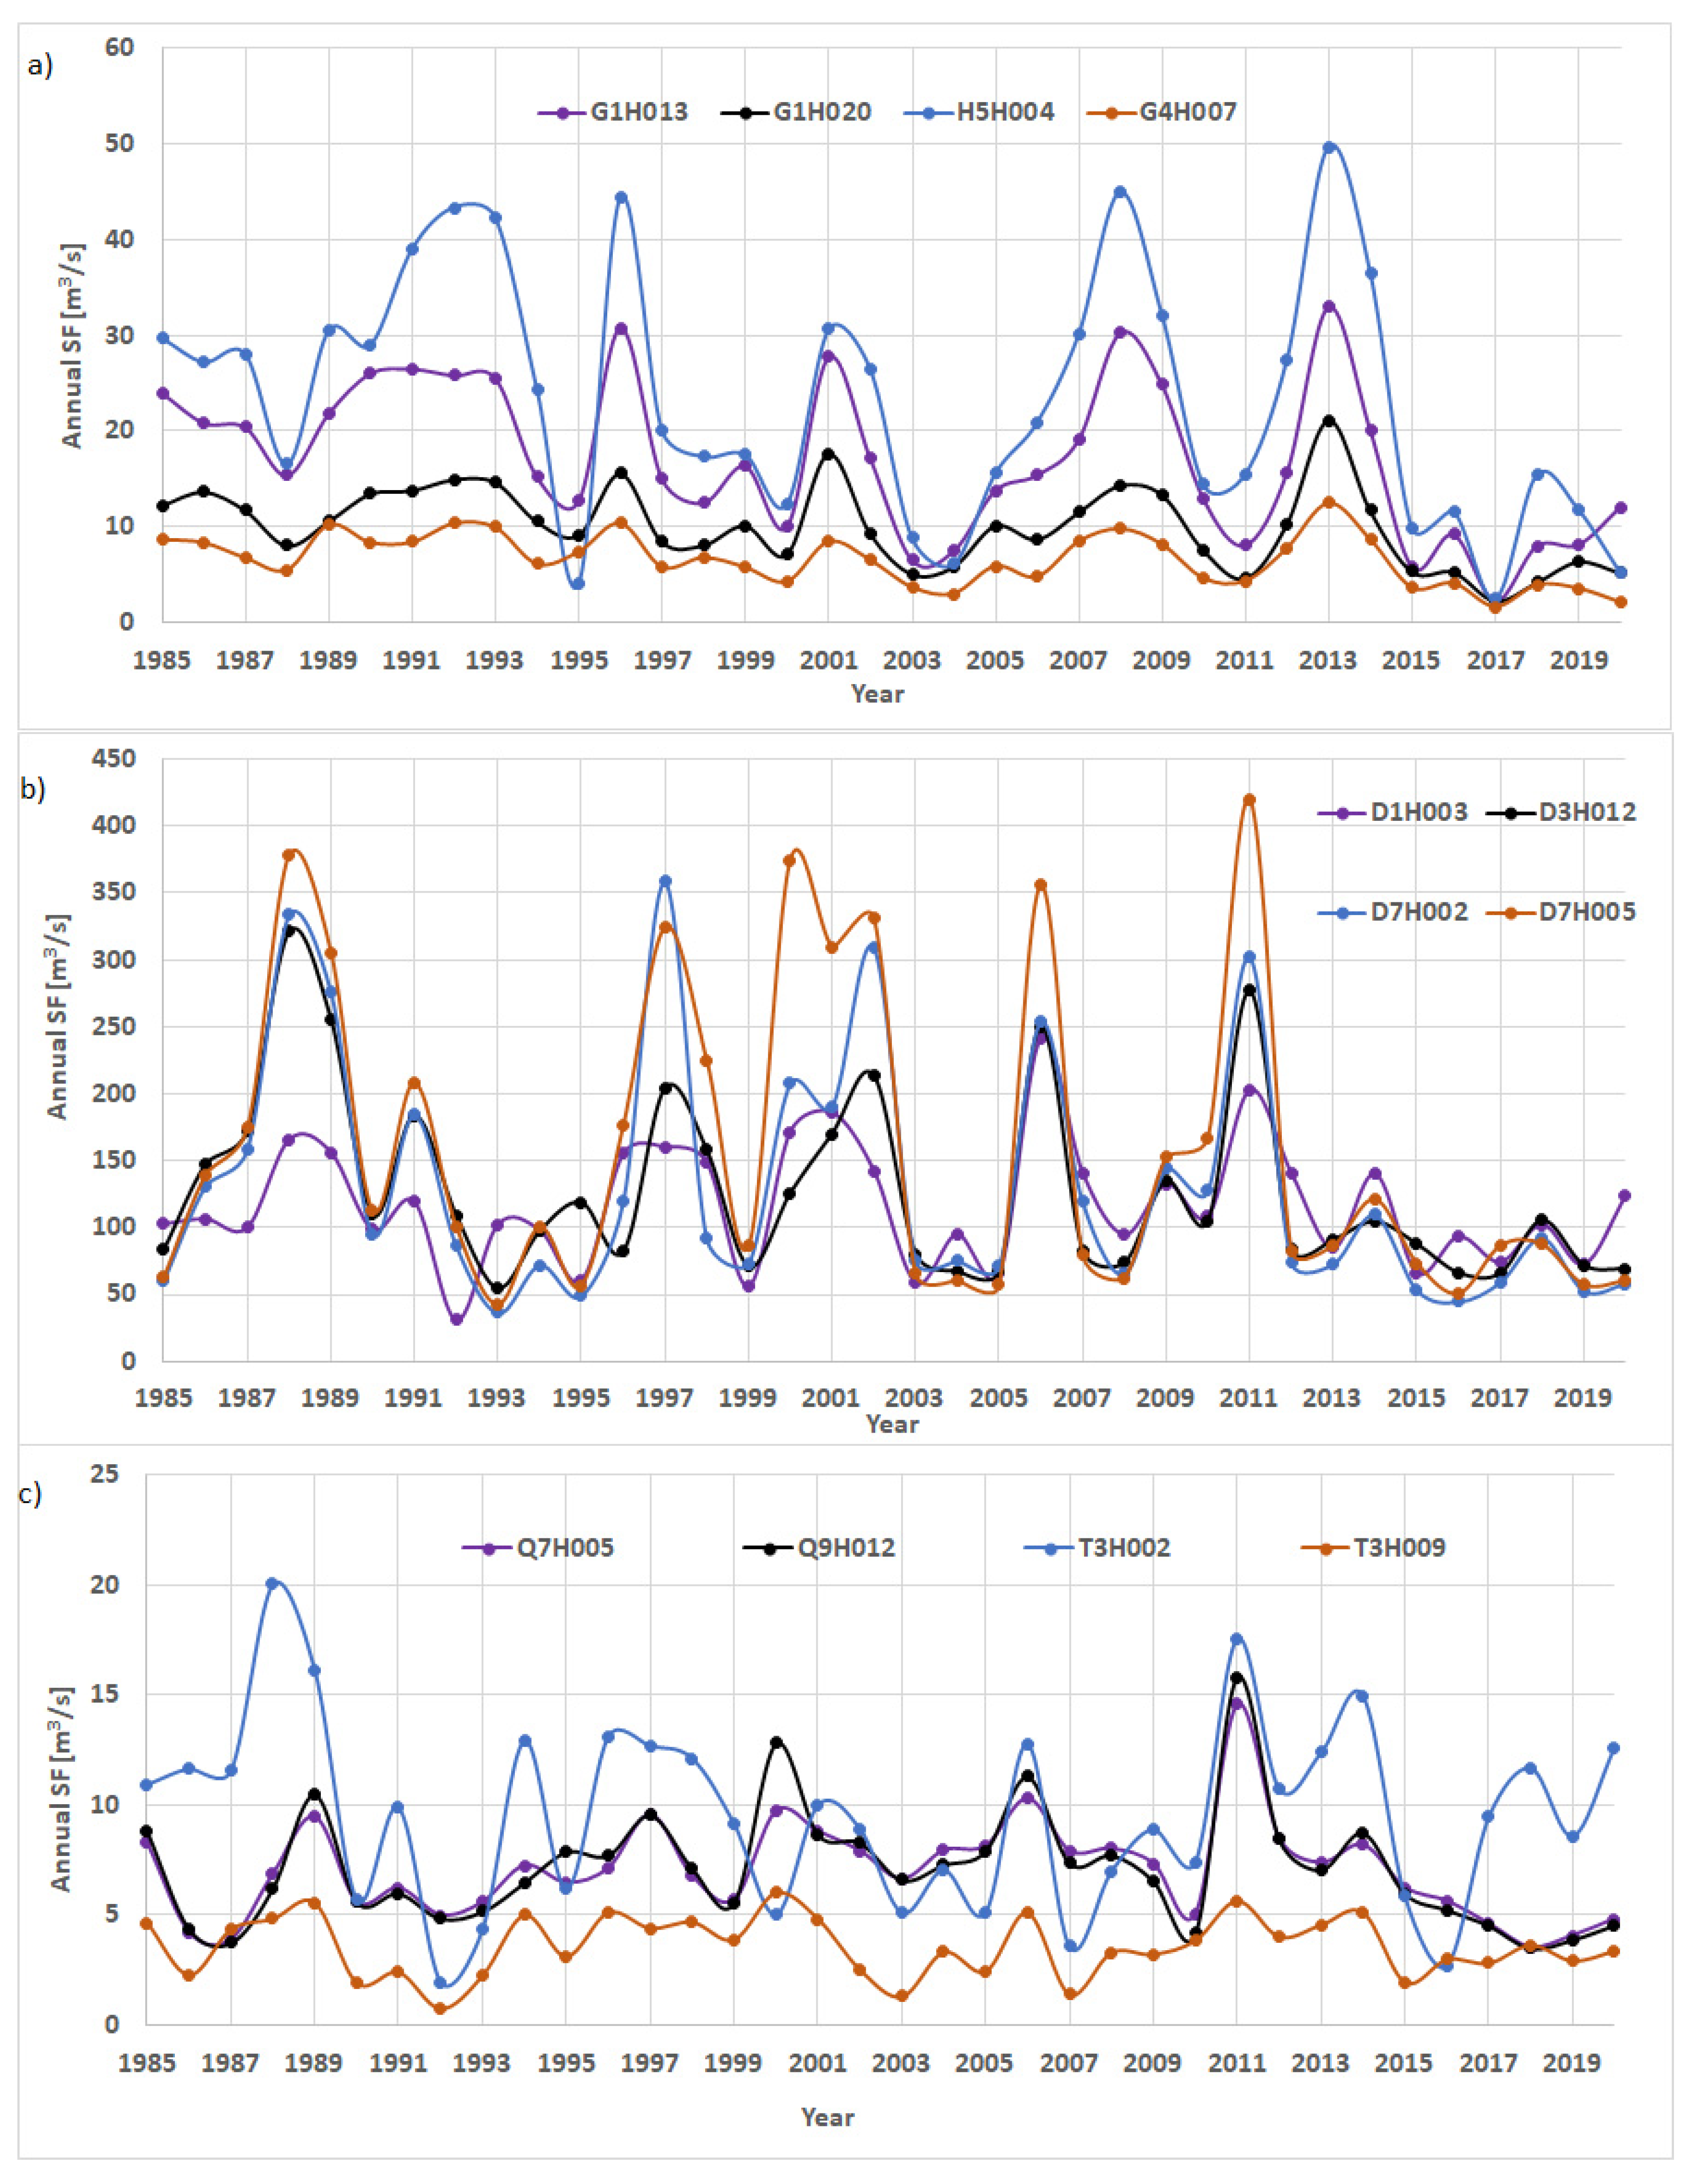
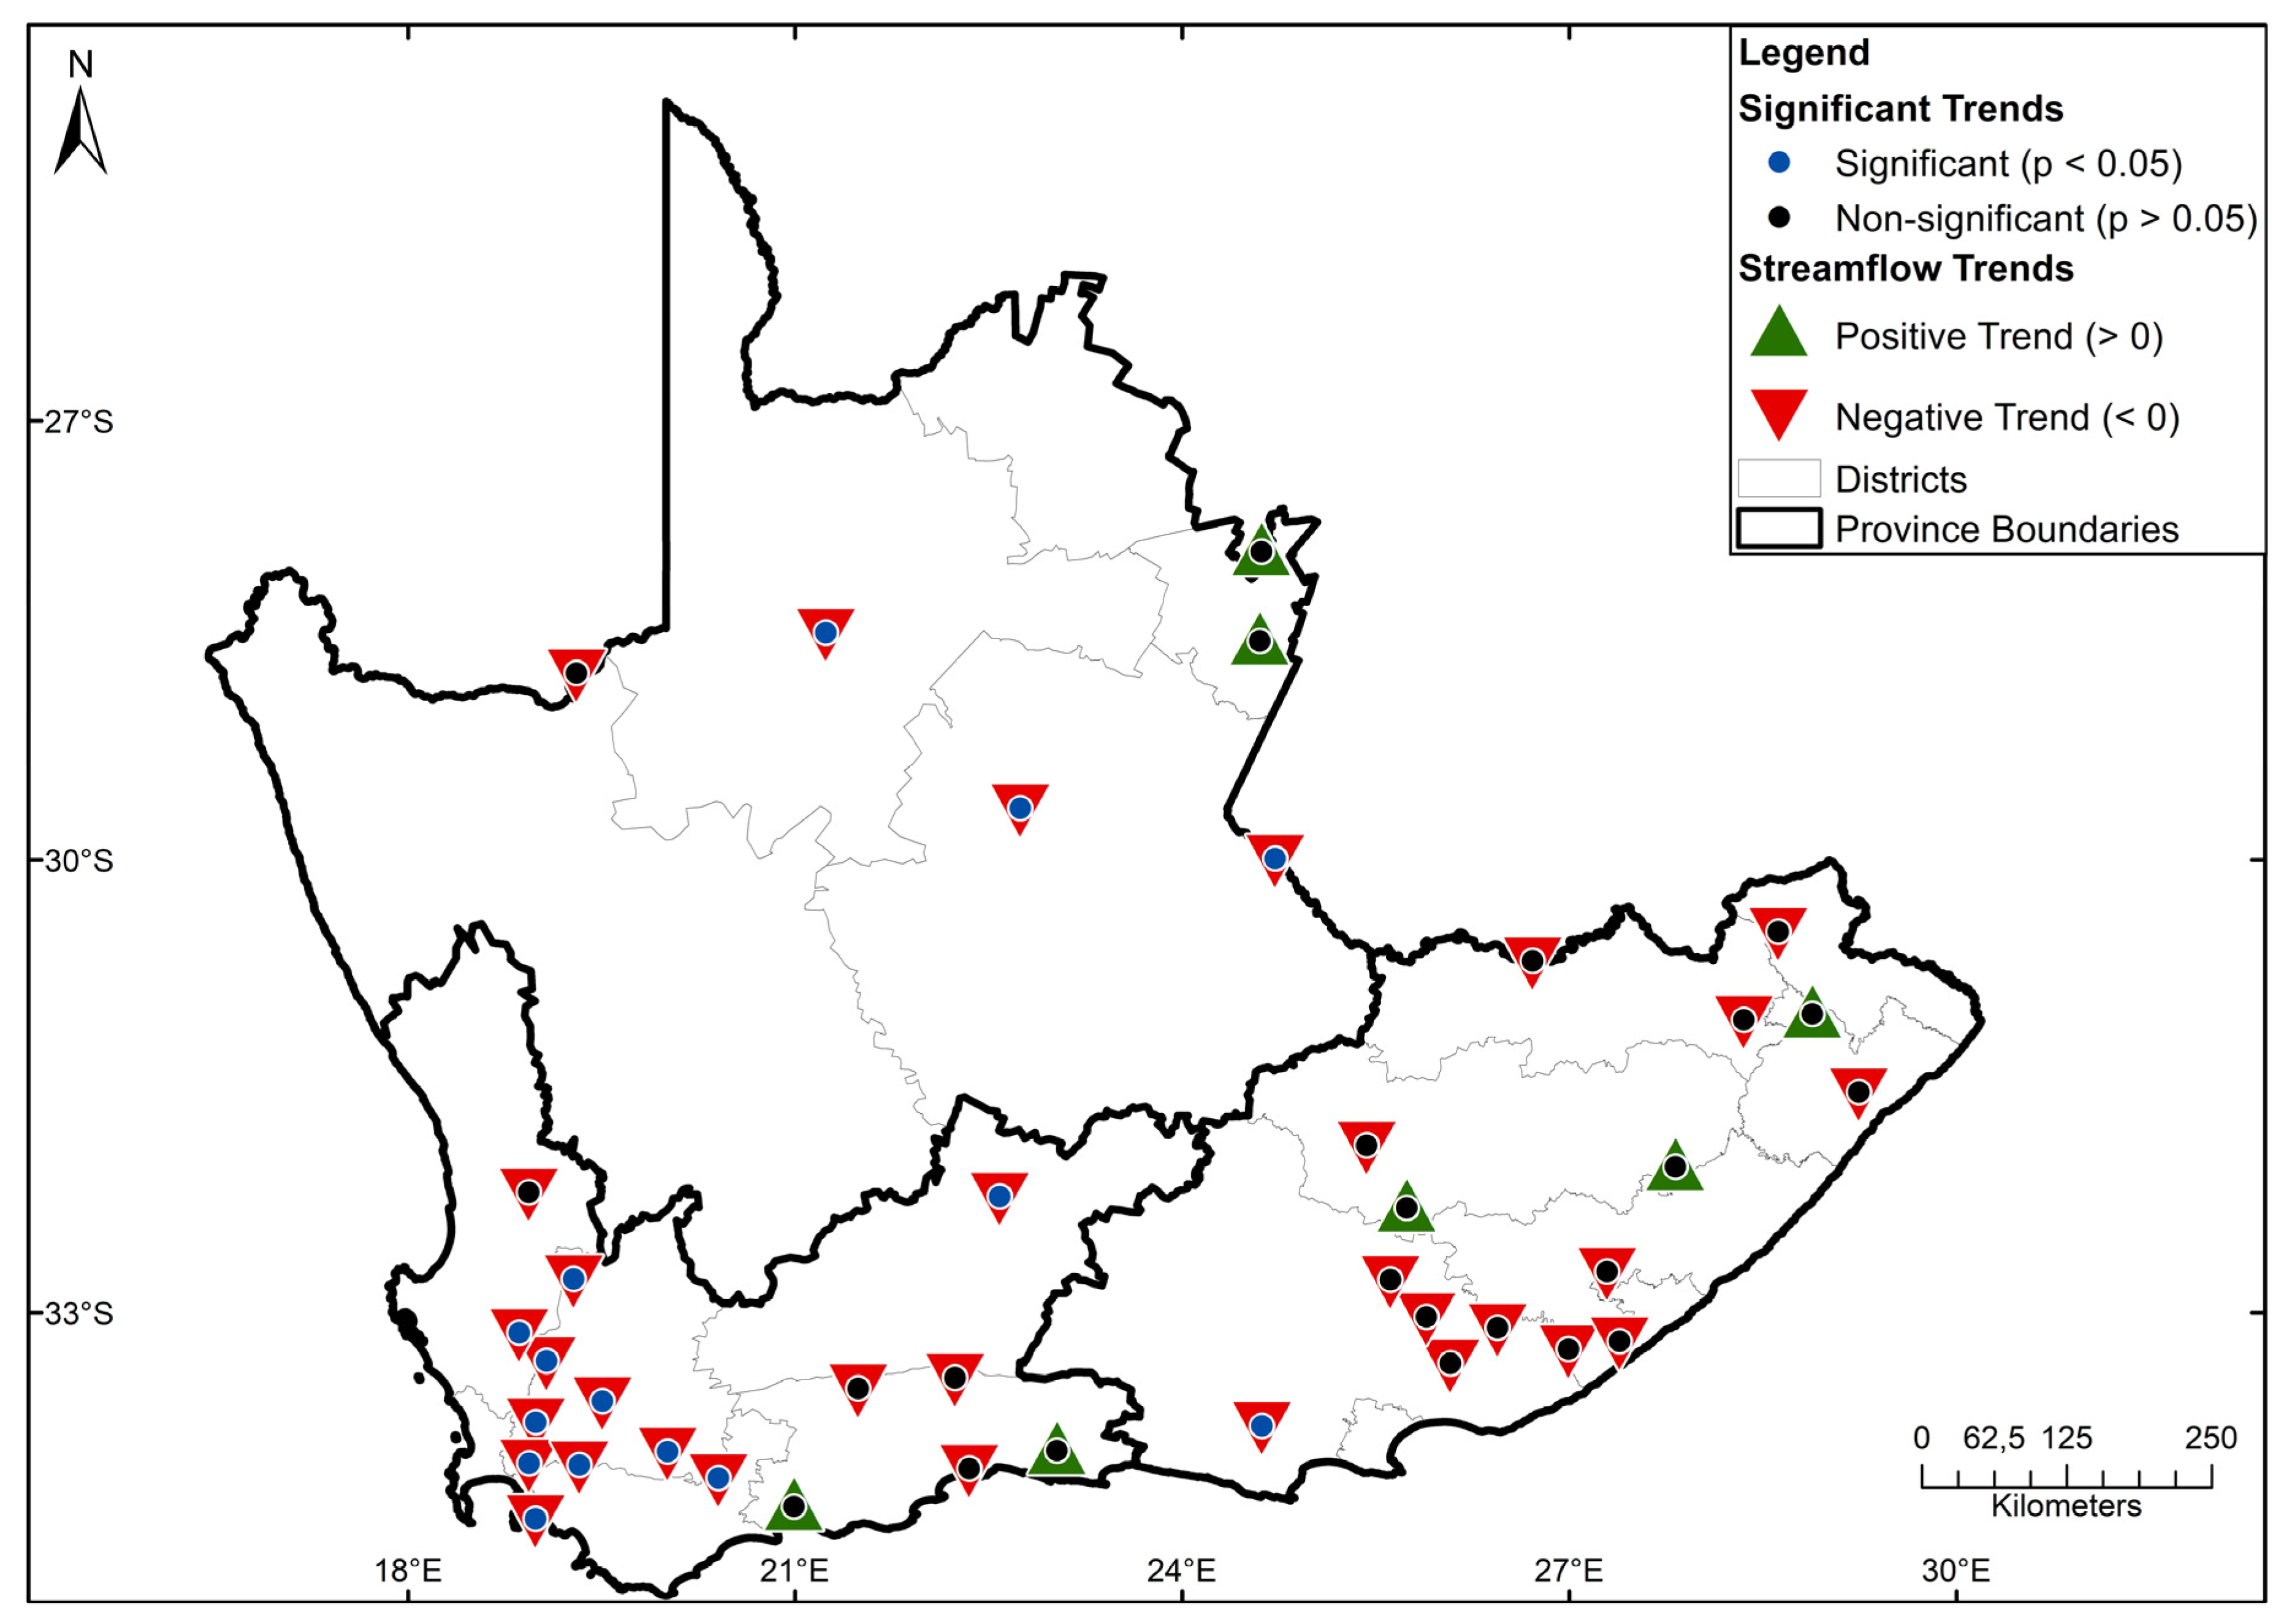
3.1. Historical Trends of Streamflow

Figure 2a–c depicts annual streamflow (in m3/s) for selected gauge stations in the WC, NC and EC provinces, respectively. Streamflow is highly variable across the provinces, ranging between ~2 and ~50 m3/s in the WC, ~1 to ~20 m3/s in EC and ~30 to ~420 m3/s in NC province. The highest annual streamflow was recorded in 1992, 1993, 1997, 2008 and 2013 in the WC region. In the NC region, the highest annual streamflow was recorded in 1988, 1997, 2000, 2002, 2006 and 2011. Similarly, the EC province recorded the highest annual streamflow in 1988, 2006 and 2011. In general, the EC has received the lowest streamflow, whereas a greater streamflow was received in the NC province over the period 1985–2020. It is also noted that streamflow has reduced in the WC and EC from 2015 to 2020. On the other hand, the NC province has experienced reduced annual streamflow from 2012 to 2020. The distribution of averaged mean streamflow (m3/s) across the stations and study site is depicted in Table 1. Most of the stations in both the WC and EC provinces show significantly small averaged mean streamflow values.
Historical trends of streamflow from 1985 to 2020 across the three Cape provinces were assessed based on the MMK test. The results are presented in Figure 3, where the upward and downward triangles correspond to positive and negative trends, and the blue and black dots inside the triangles represent significant and non-significant trends, tested at 95% significant level, respectively. In general, the study area demonstrates notable drying trends. In particular, 75%, 88% and 67% of the stations in the EC, WC and NC provinces, respectively, depict negative annual trends in streamflow. Overall, 80% of the stations exhibit a negative trend in streamflow across the three provinces. In addition, 38% of the detected negative trends are statistically significant at a 95% significant level. While most areas in the WC province are known to be “all-year rainfall” [10,28], there has been either a shift (where there was no rainfall in some seasons) or delayed/insufficient rainfall to benefit water resources. These results are consistent with the continued drought conditions that persist to burden the supply of water resources, particularly in the EC and WC provinces.

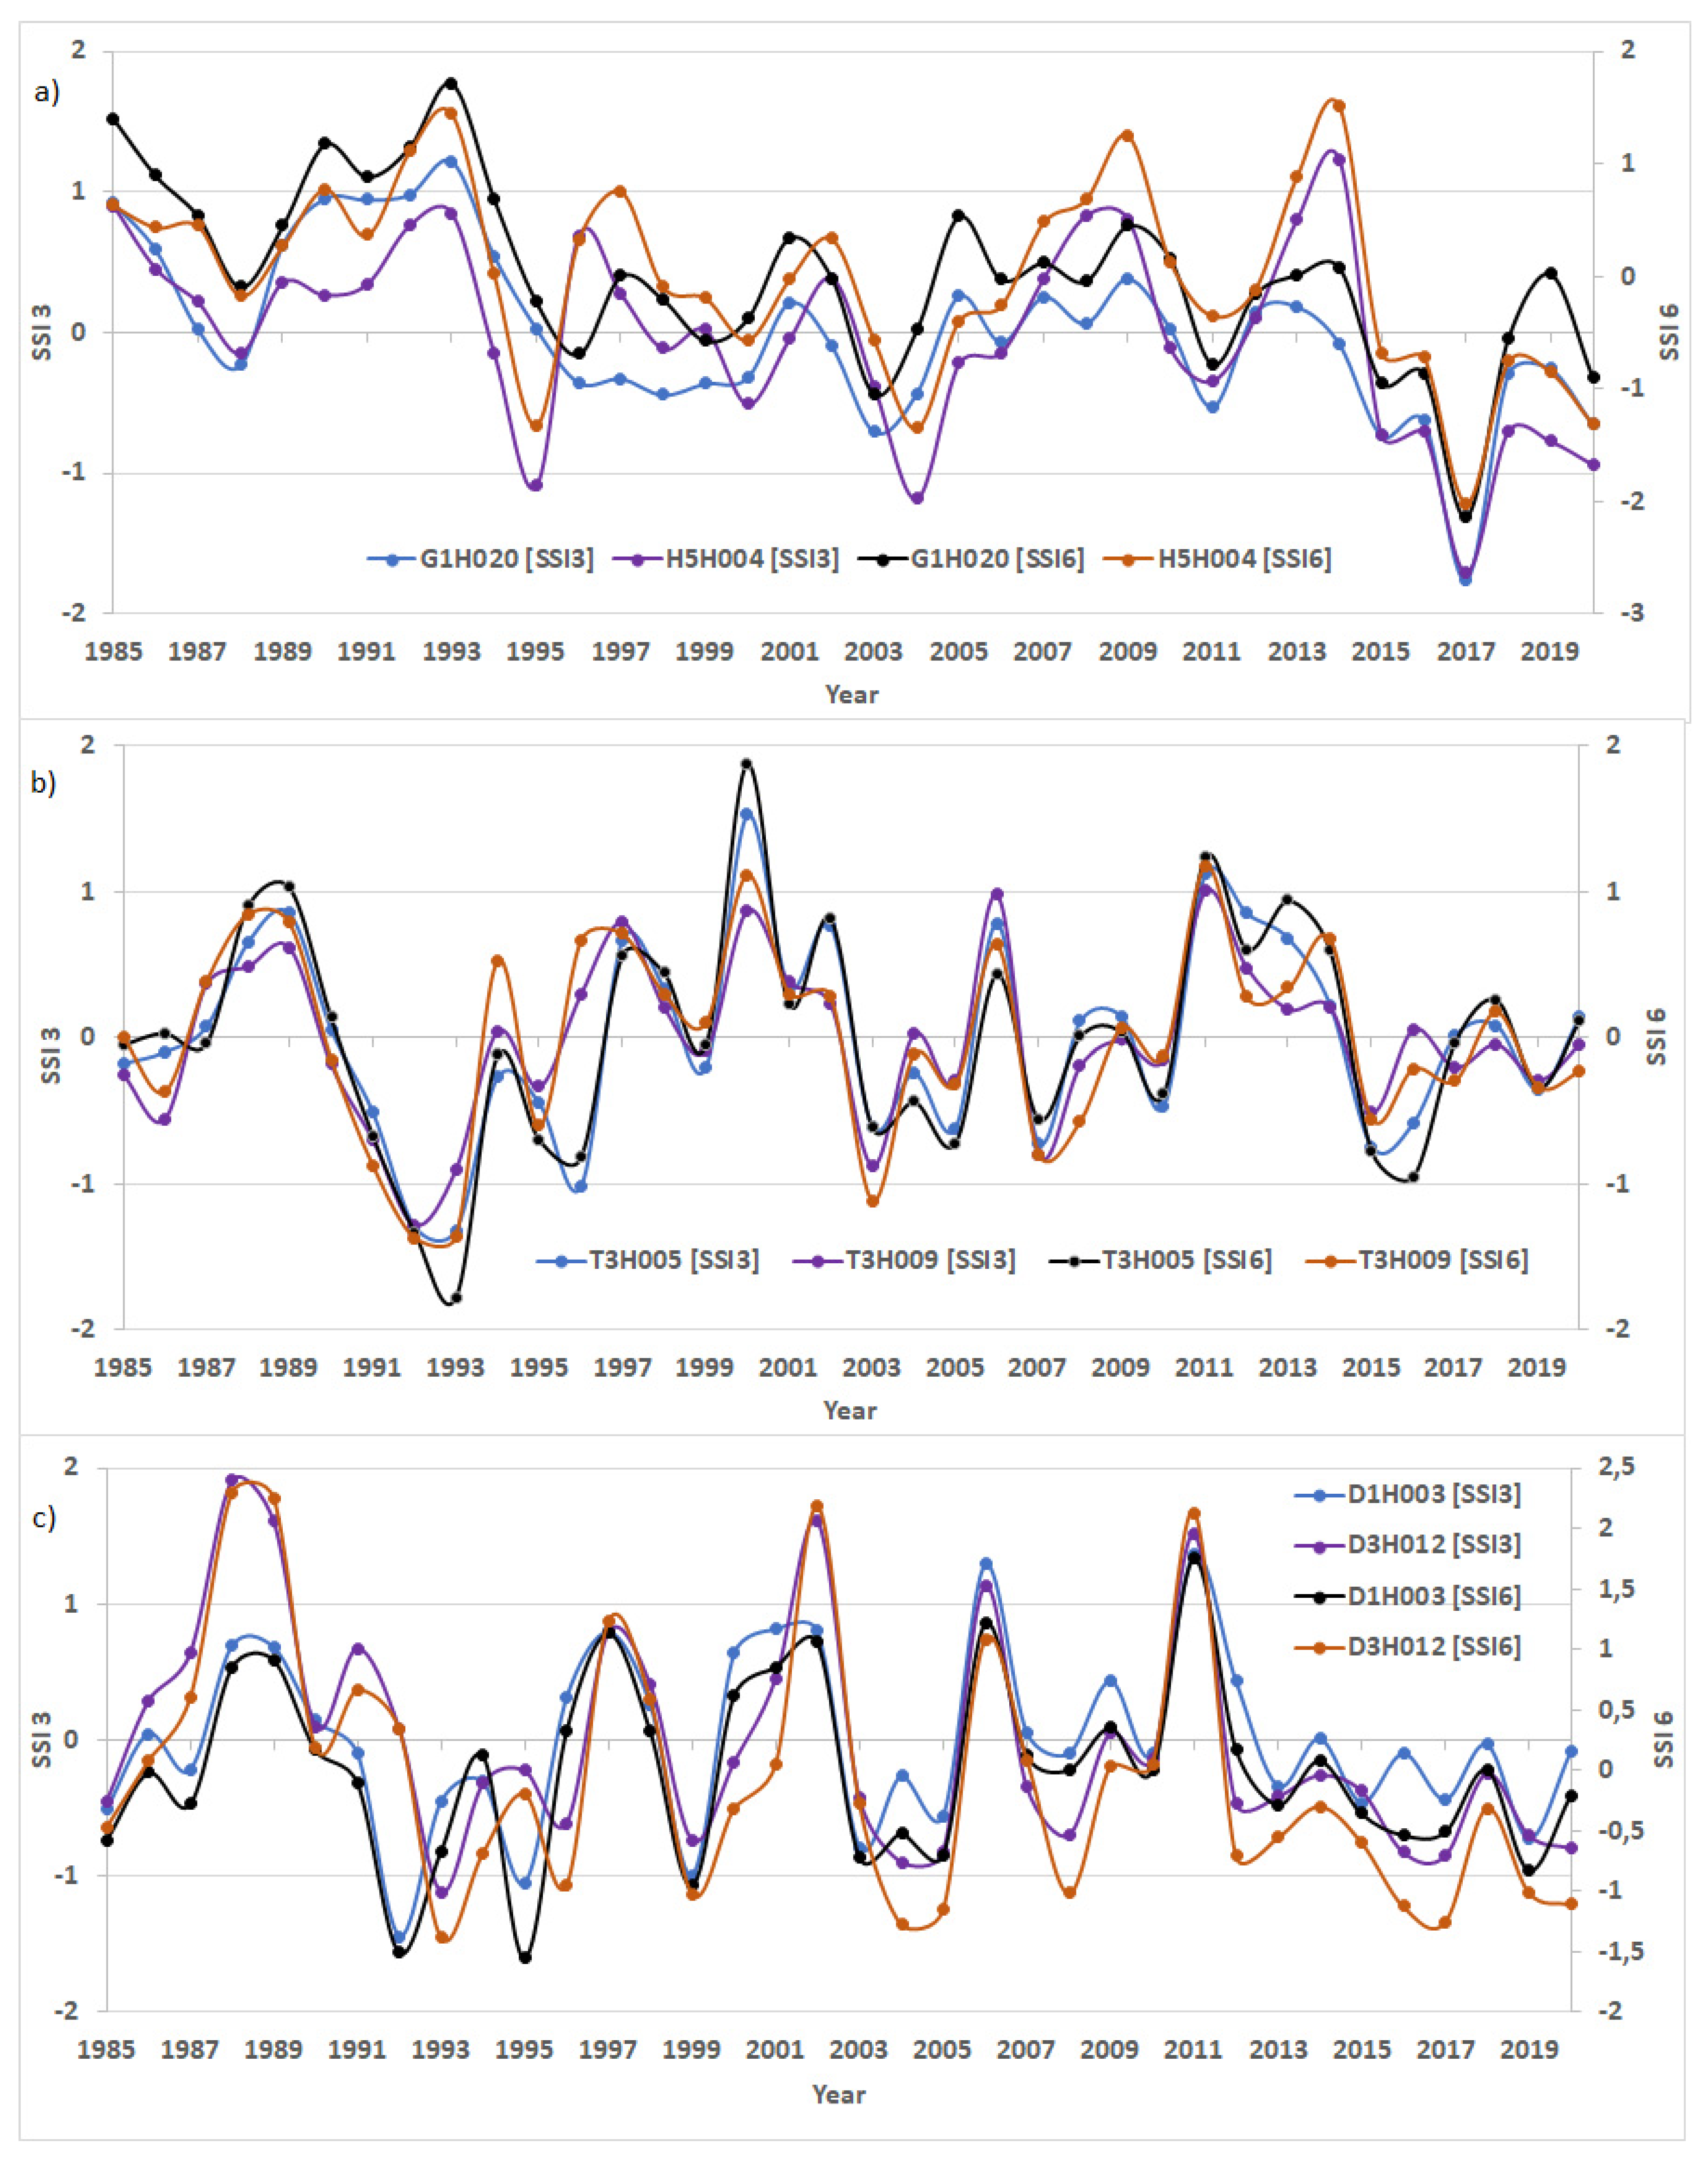
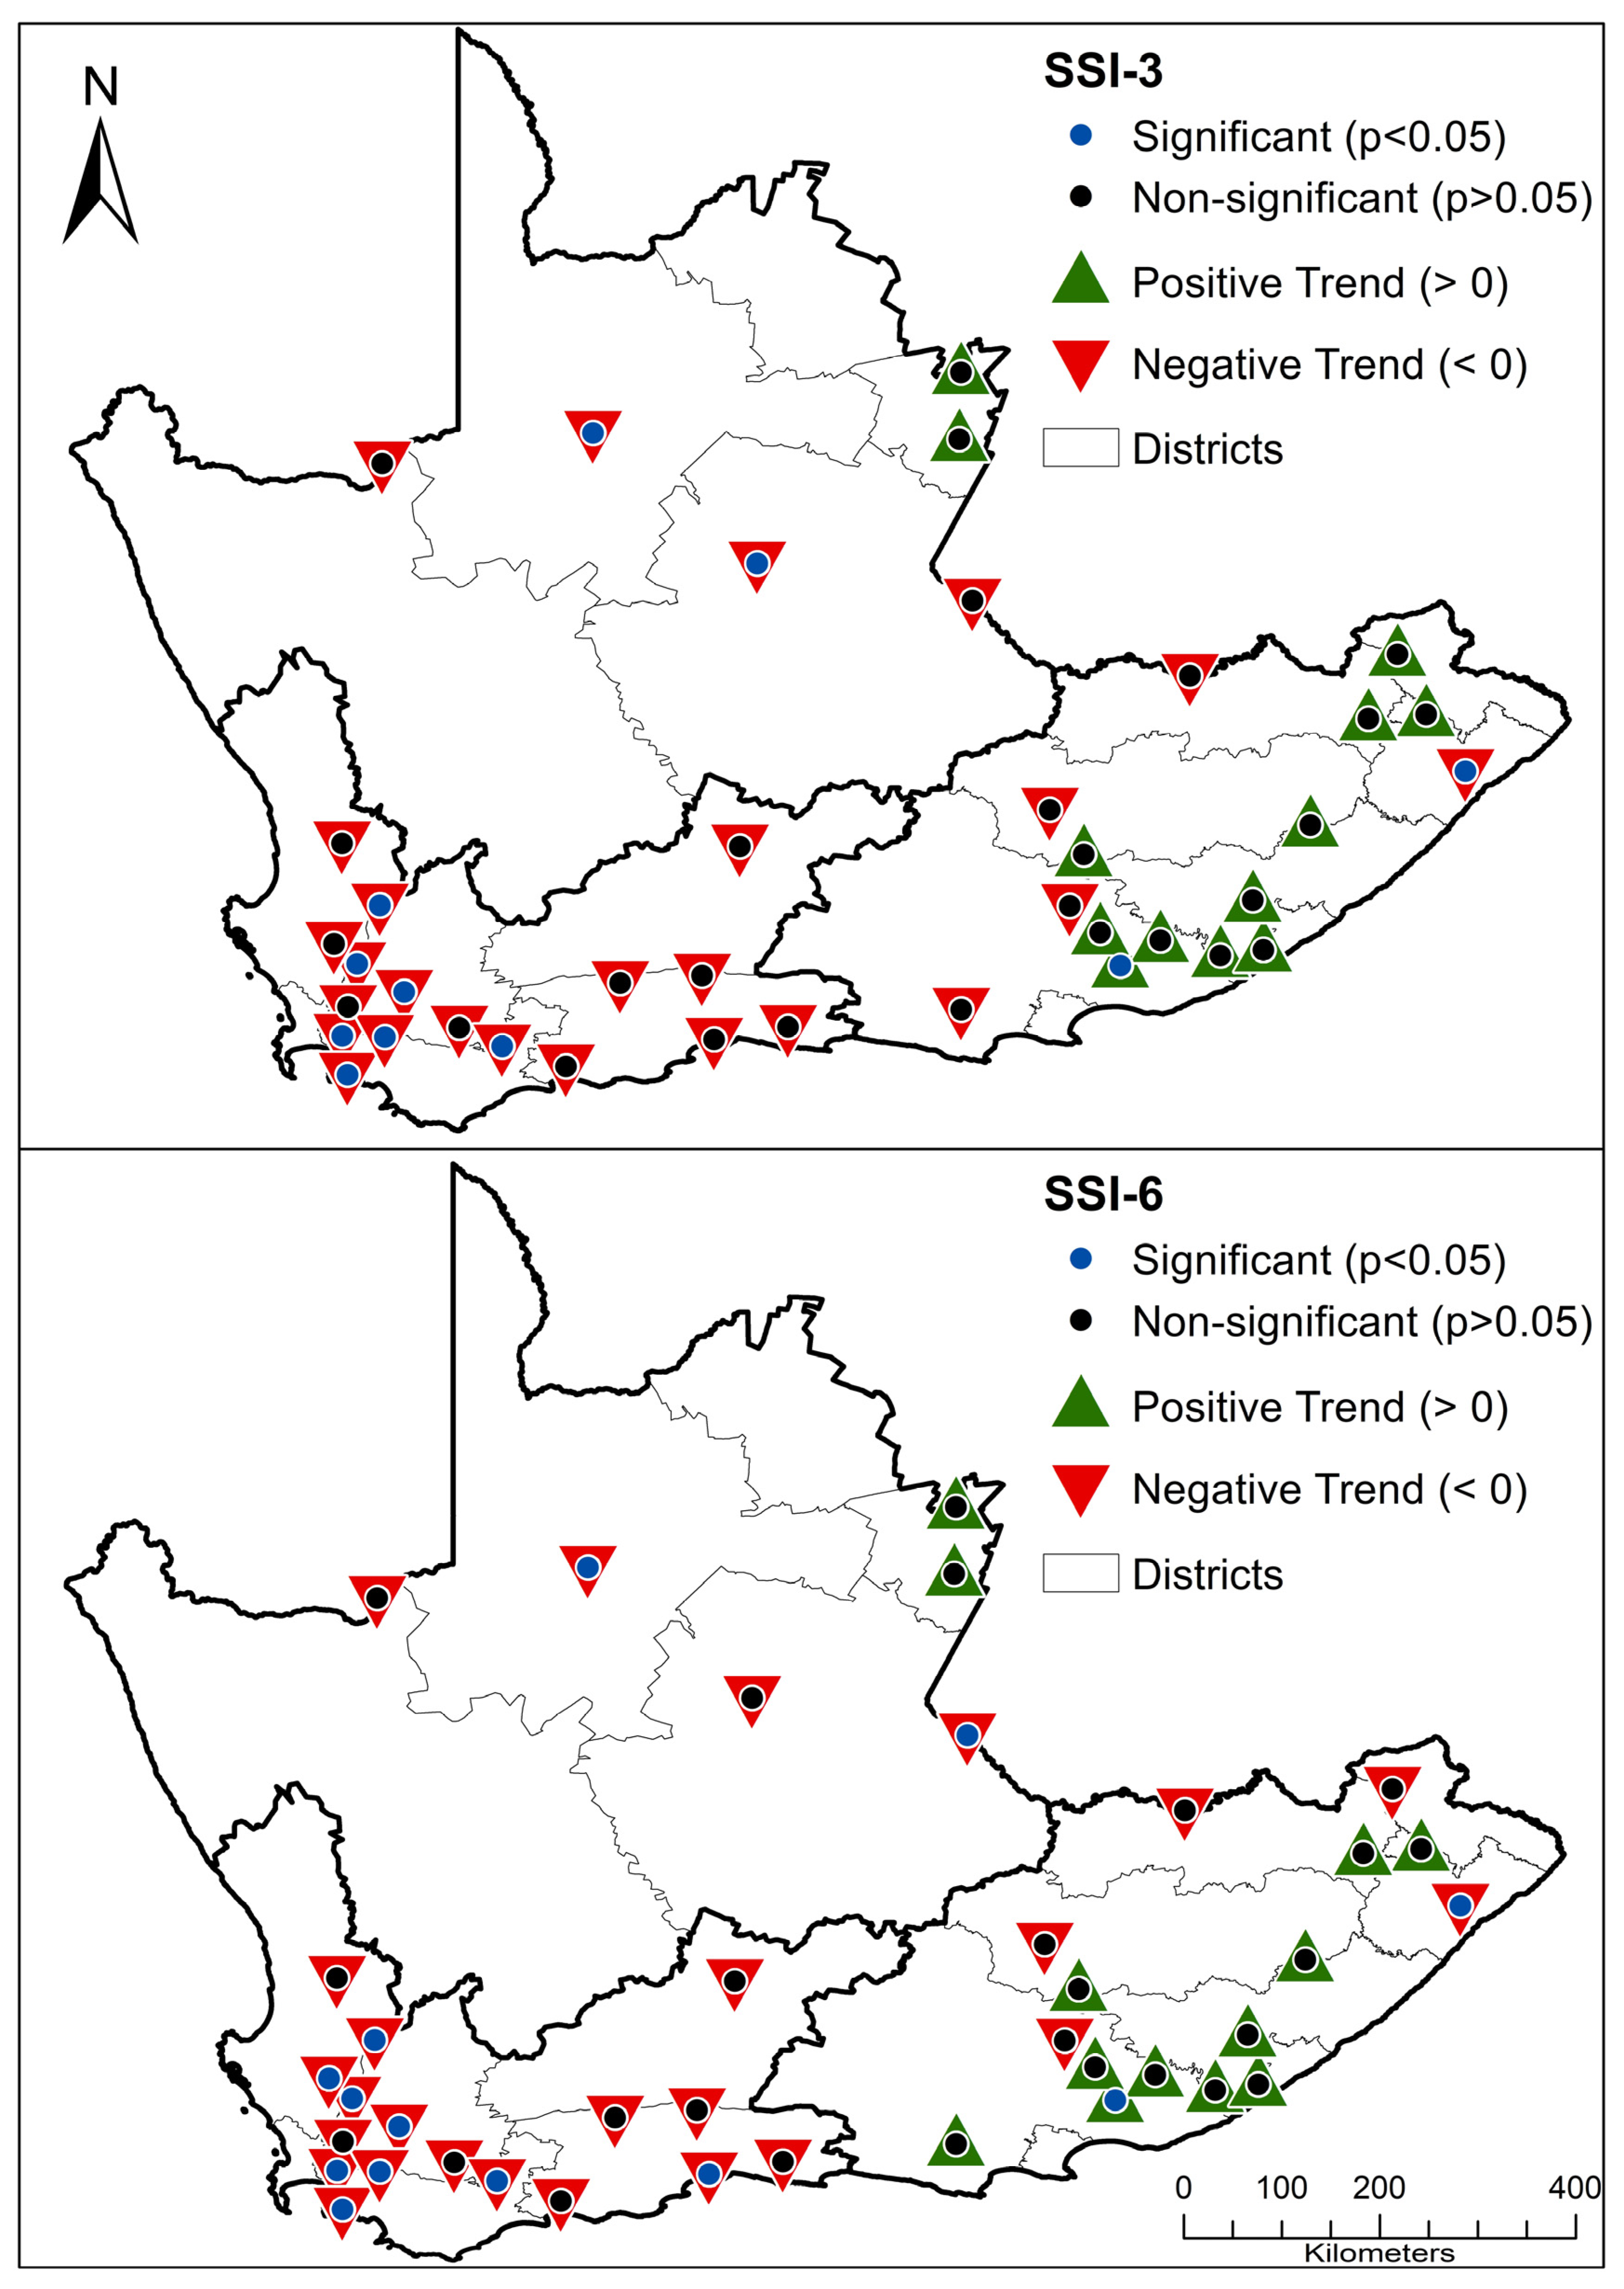
3.2. Characteristics of Standardized Streamflow Index

Figure 4a–c depicts SSI-3 and -6 annual mean time series for selected stations in the WC, EC and NC provinces. Based on the results, most of the stations have experienced mild drought over the study period. The longest drought in the EC and NC provinces was observed in the years 1991–1996, 2003–2005 and 2015–2020, mostly lying between mild and moderate categories. The WC province experienced the most prolonged drought in the years 1995–2000, 2003–2006, 2010–2012 and 2015–2020, mostly fluctuating between mild and moderate drought categories. The WC province also experienced severe drought in 2017 across all the selected stream-gauge stations.
The MMK trend test results of the SSI computed from streamflow data at 3- and 6-month accumulation time-steps across the study sites are shown in Figure 5. In this figure, the top and bottom panels correspond to trends based on 3- and 6-month cumulative periods, respectively. Positive (negative) and significant (non-significant) trends are shown by green (red) triangles and blue (black) dots, respectively. The test results depict similar annual trend patterns across the accumulation periods and stations within the study area. Dry conditions are evident across the study area, with all the stations in the WC exhibiting negative trends for both SSI-3 and SSI-6 accumulation epochs. Similarly, most of the NC regions, where gauge stations are located, depict negative trends, reflecting a long-term hydrological drought pattern. On the contrary, most of the stations (approximately 68%) in the EC province depict notable increasing trends in SSI values across the time-steps for the period 1985–2020. These trends are, however, not statistically significant at the 95% confidence level.

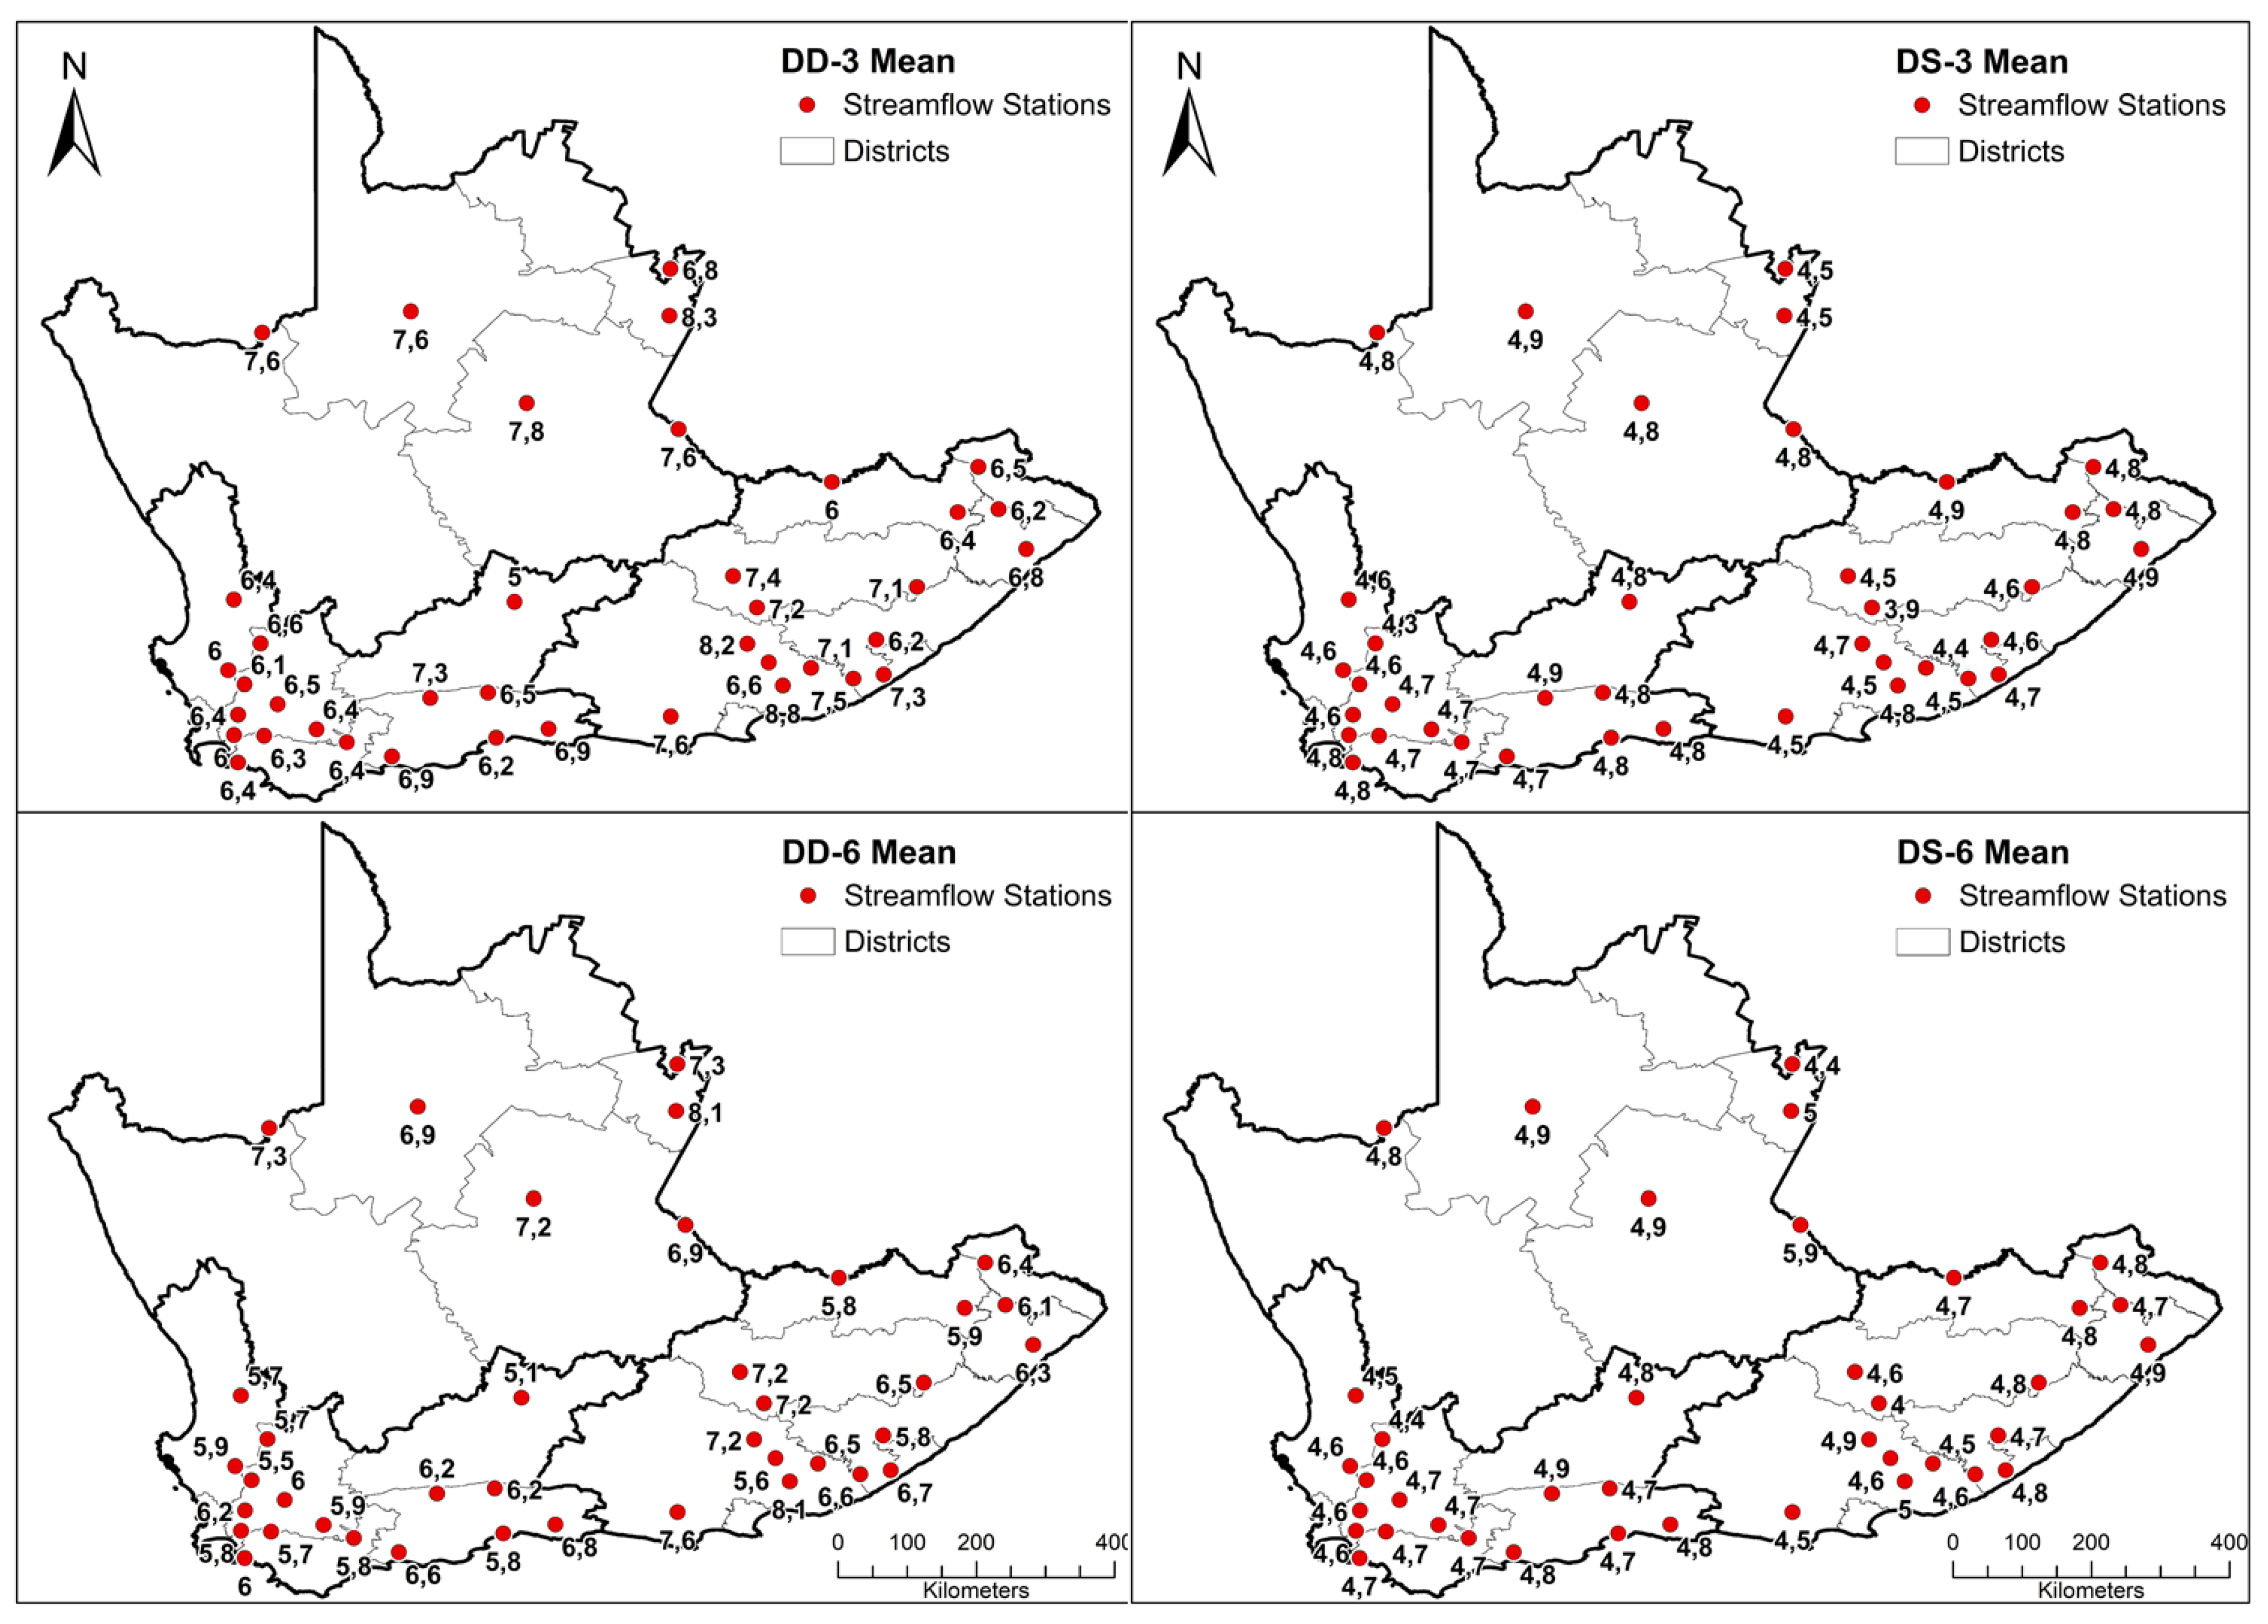
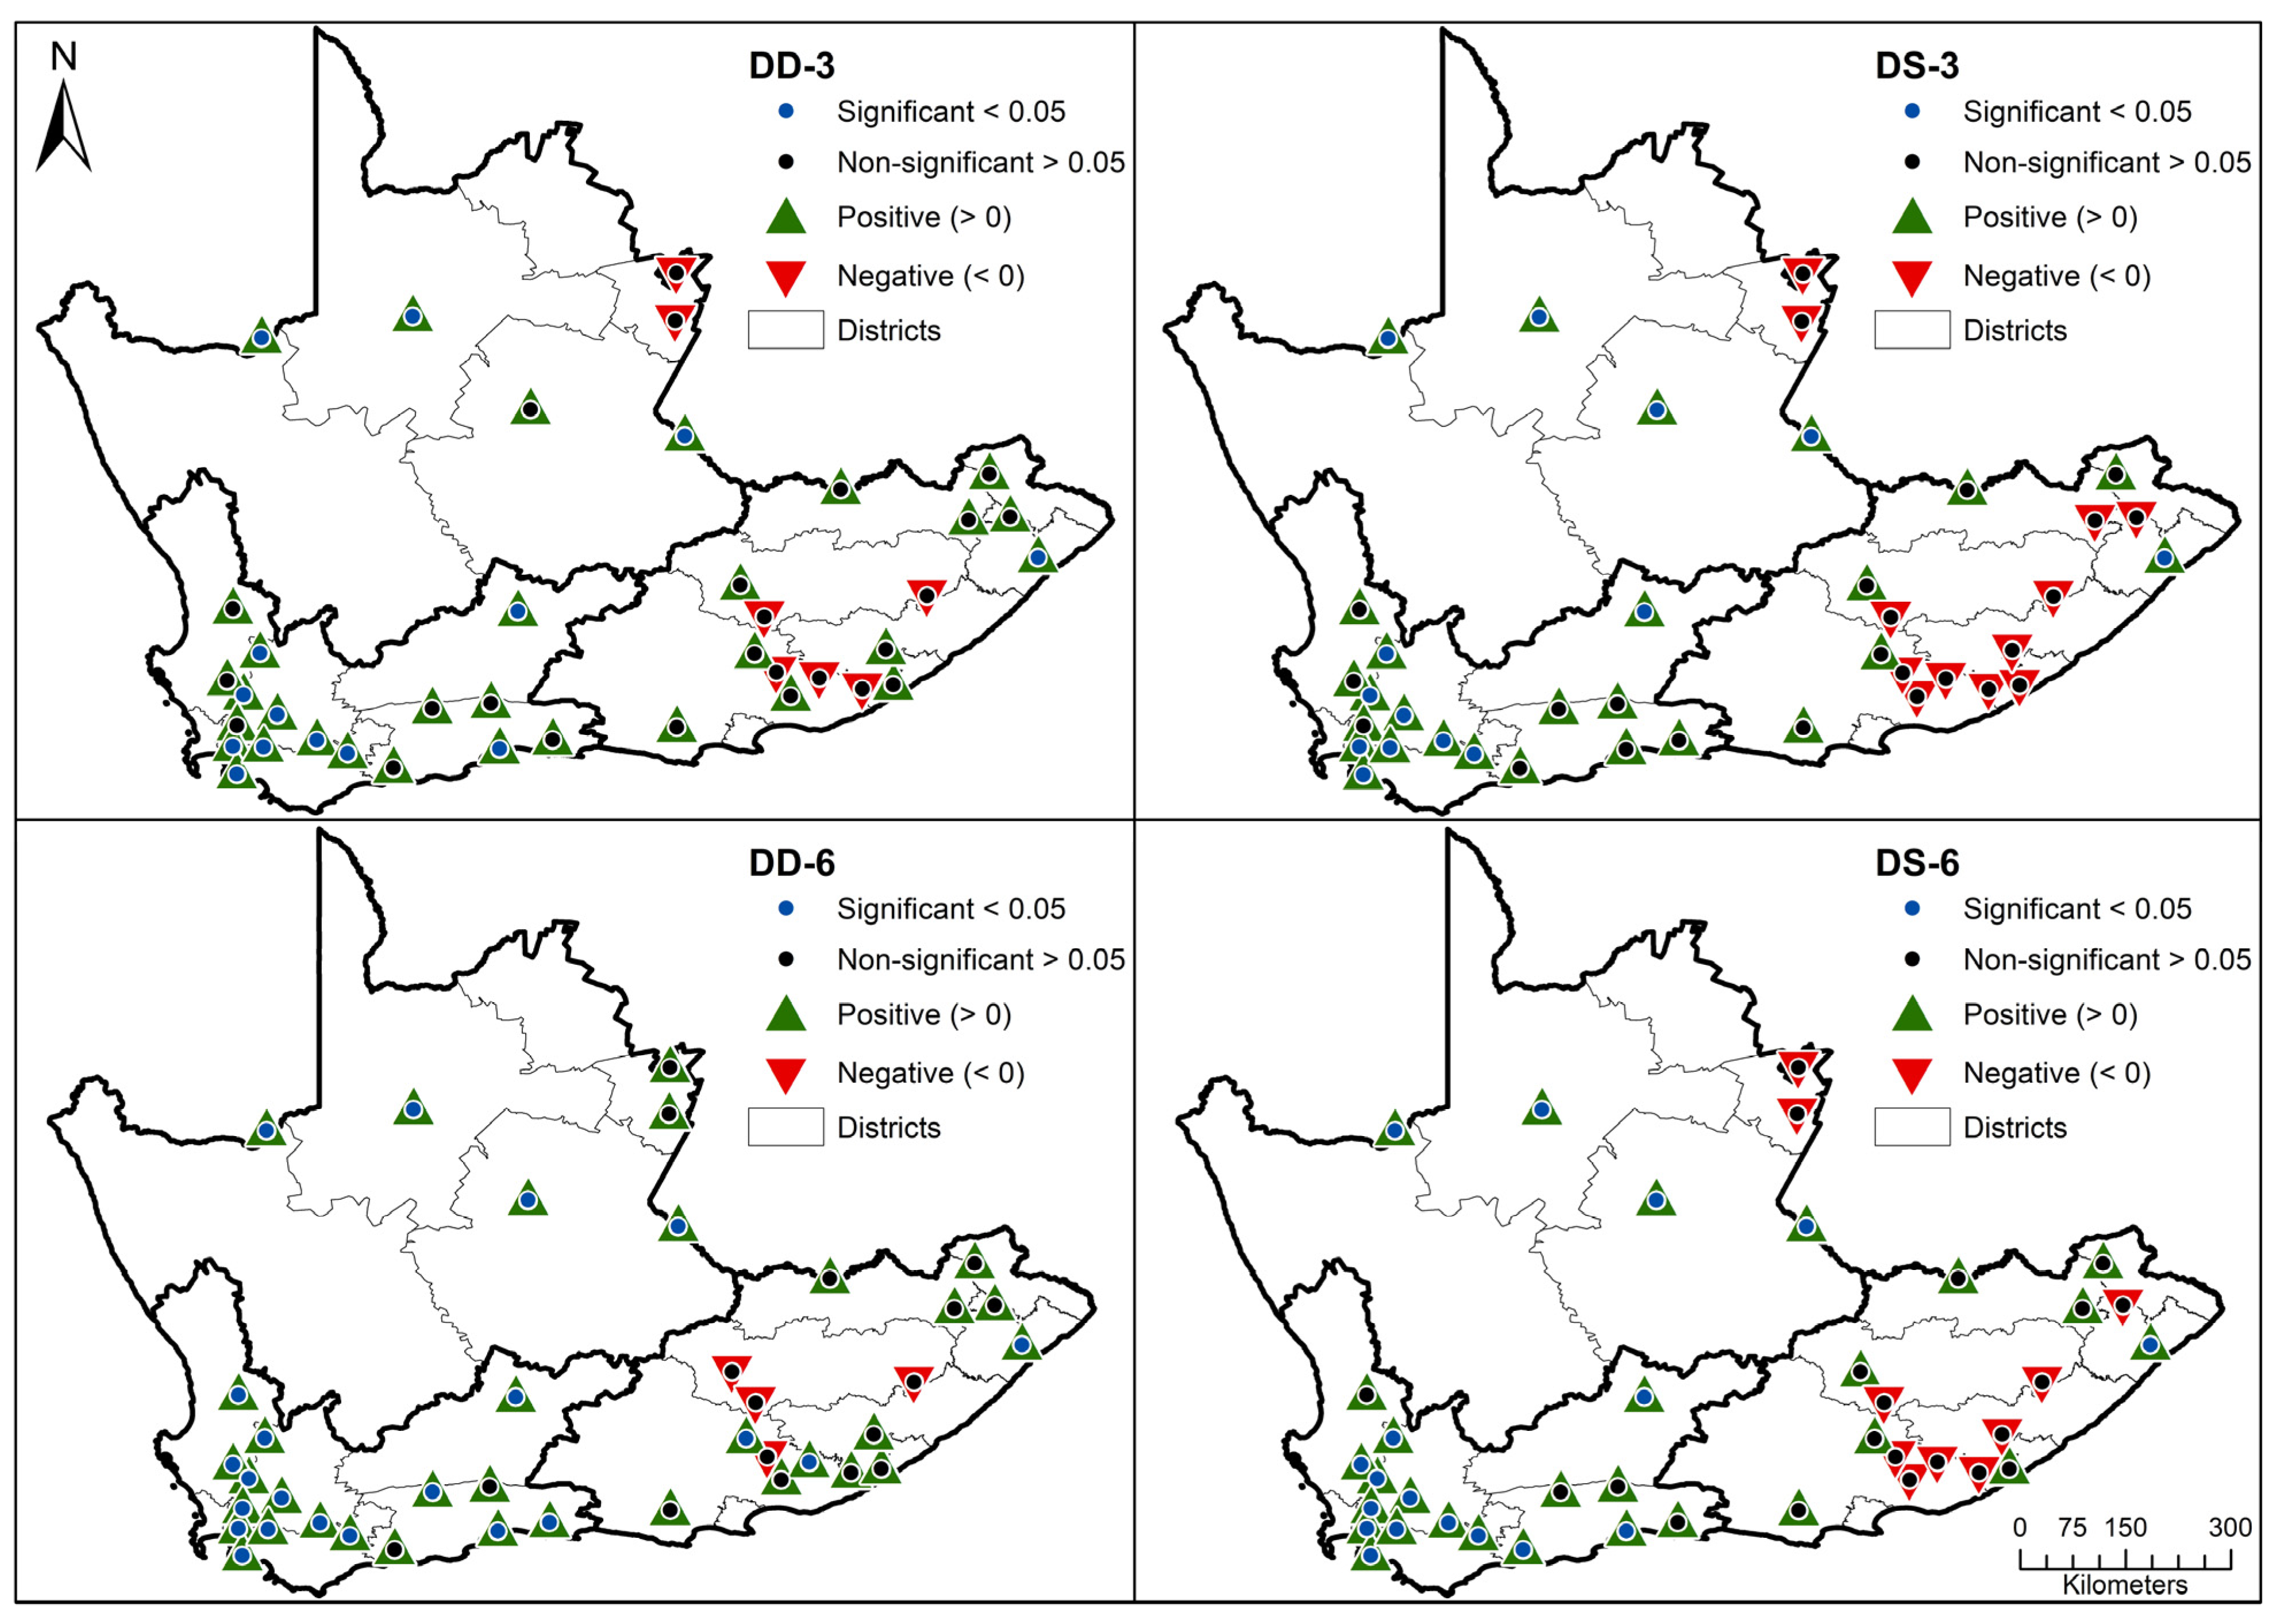
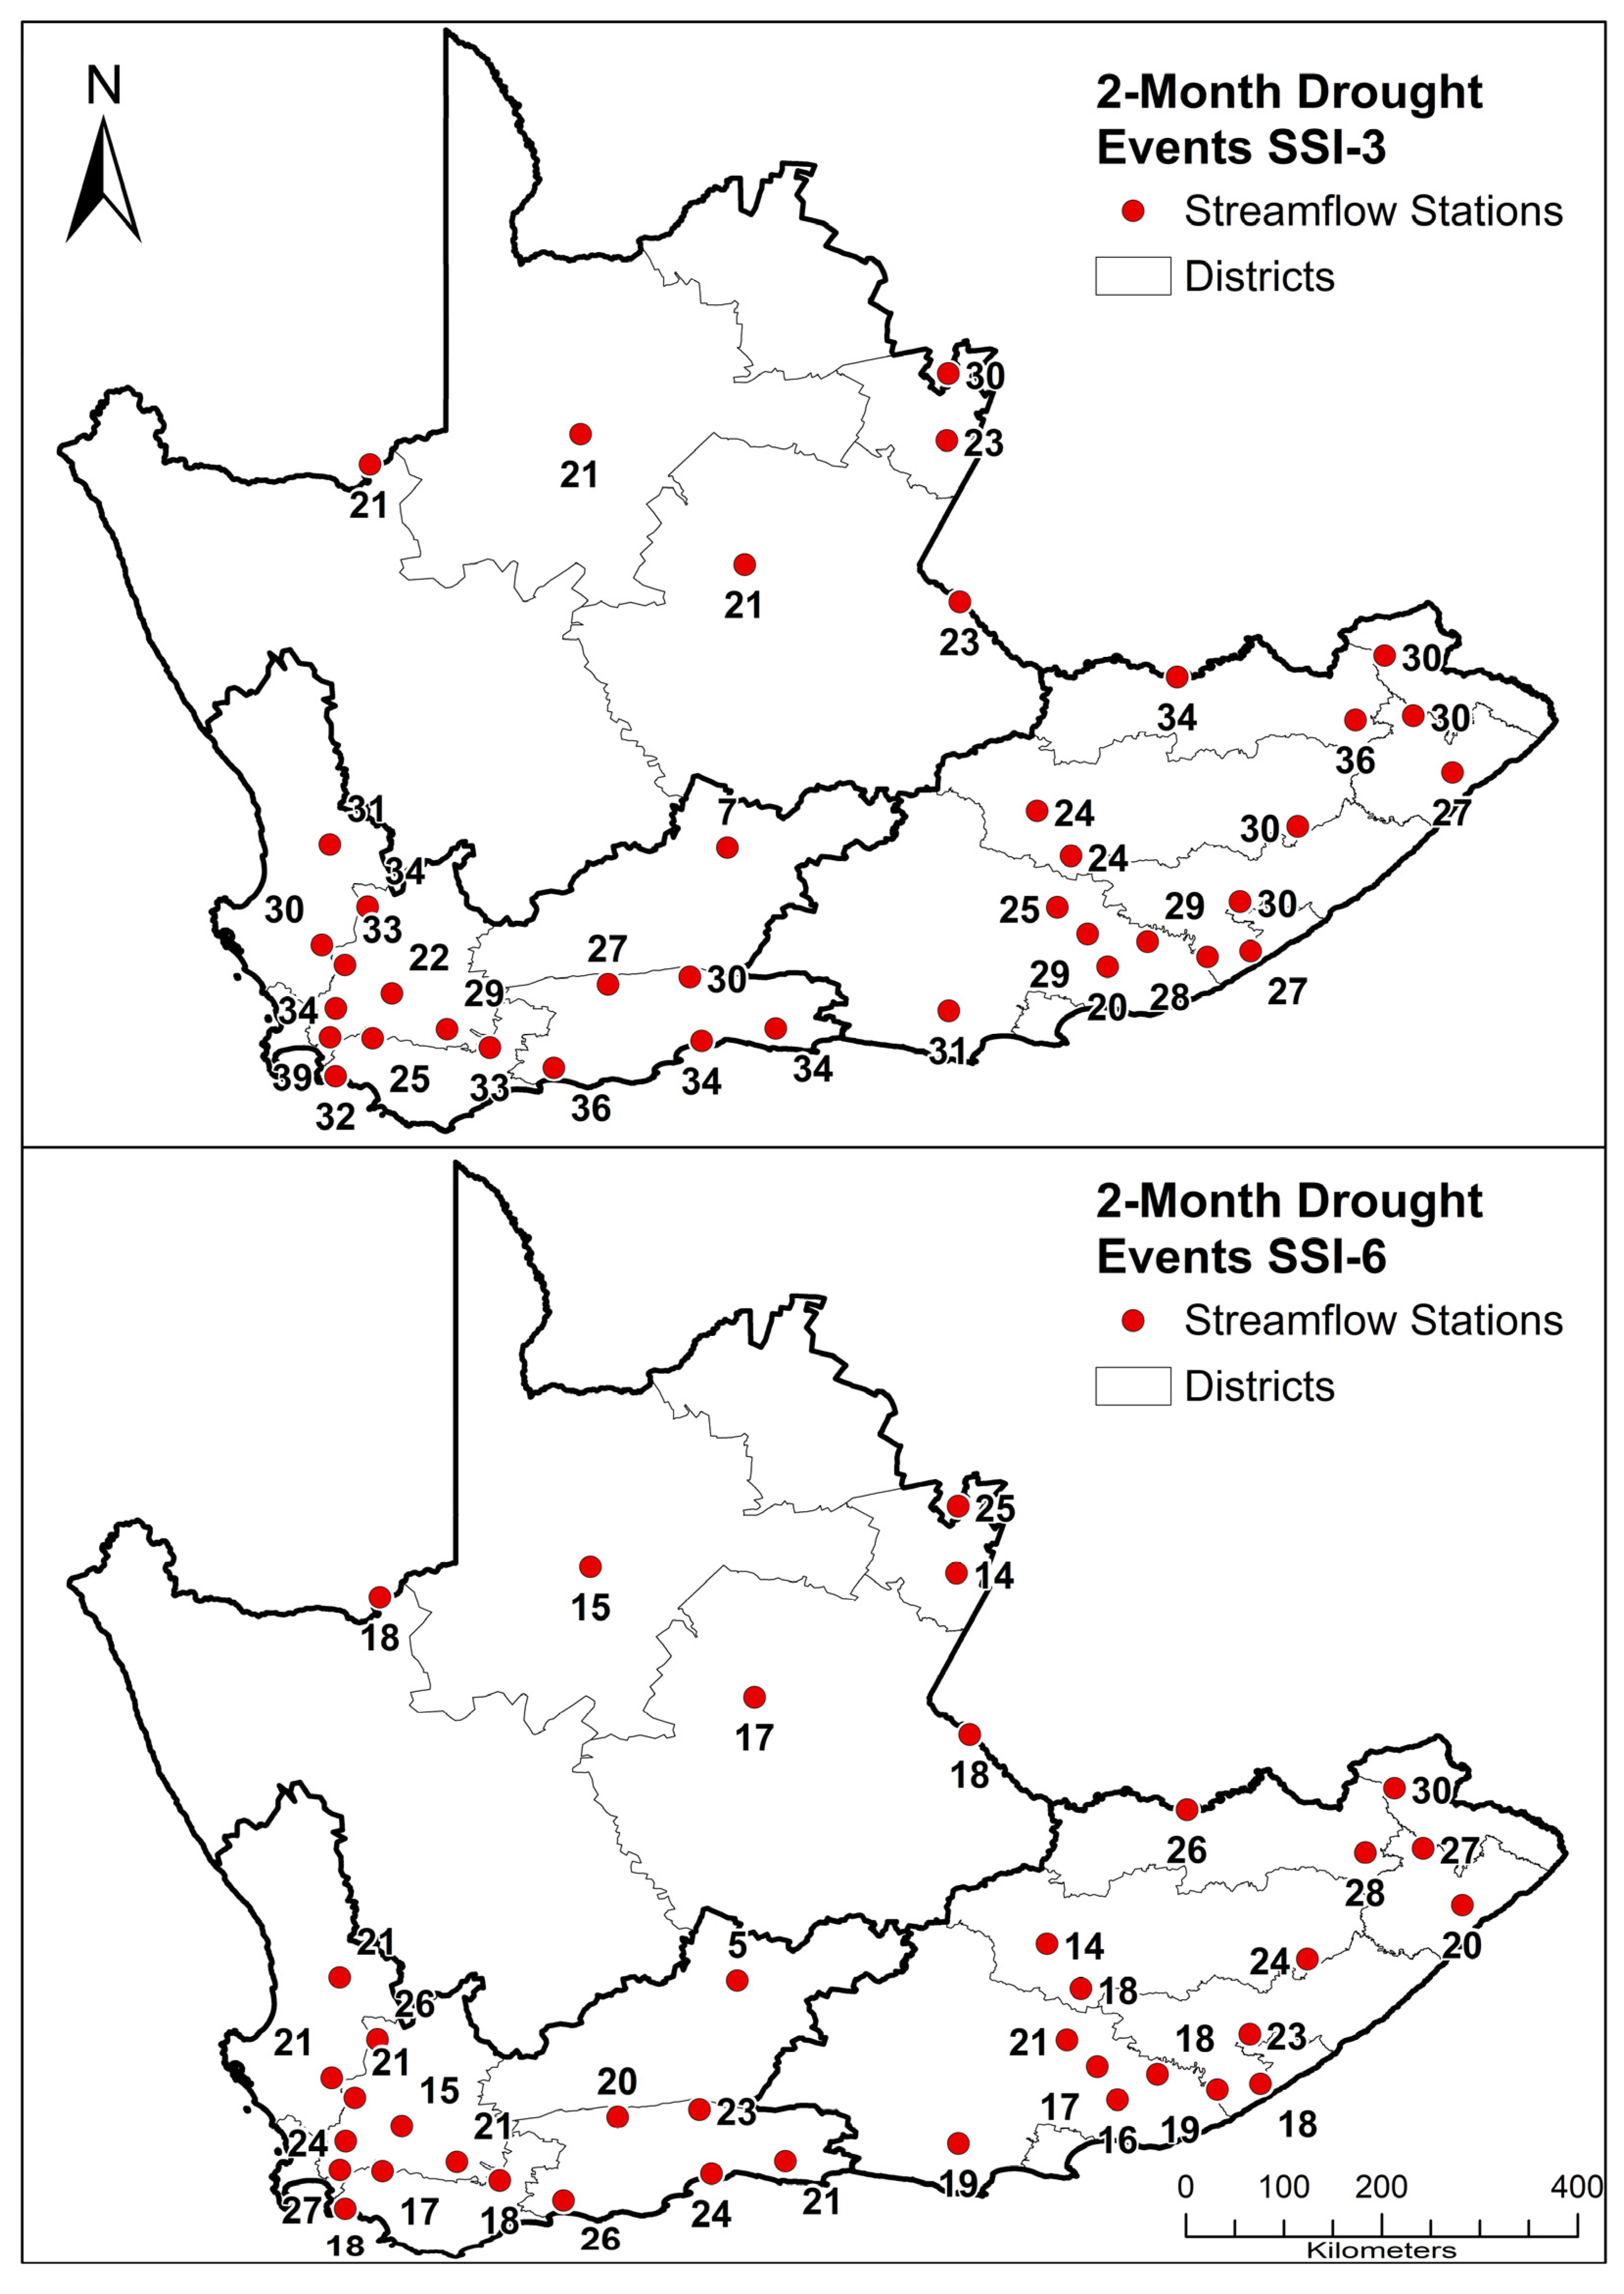
3.3. Characteristics of Drought Duration and Severity

Figure 6 illustrates the spatial distribution of the average duration and severity of drought across the three Cape provinces during the study period (1985–2020). The average DD ranges between 5 and ~9 months across the provinces. While most parts of the WC experienced average DD ranging between ~5 and ~7 months, the parts of the EC and NC provinces experience the longest DD lasting for ~9 months. In particular, the WC exhibits the lowest DD ranging from 5 to 7 across the stations and accumulation periods. Similarly, greater DD values are observed in the NC and EC provinces, ranging from 6 to 8 months across the accumulation time-steps. The EC and NC provinces DD range from approximately 6 to 9 months across the accumulation time-steps. Severe drought is observed across the provinces, with estimated maximum average DS of 5.0 noticed across most of the stations, and in both the analysis of 3- and 6-month accumulation periods.
The trend analysis results indicate that DD has significantly increased across the study area, with exceptions to parts of the EC province (see the first column of Figure 7). Approximately 47% of the observed trends in DD are statistically significant at the 95% statistically significance level. The severity of drought (second column of Figure 7) has increased during the study period (1985–2020), particularly in the WC and NC provinces. Overall, about 78% of the stations exhibit positive trends in DS, with 48% of the observed trends being at the statistically significant 95% significance level. In the EC province, only 18% of the stations indicated an increase in the DS, while the majority of the stations (82%) displayed a decrease in the severity of drought over the 1985–2020 study period.

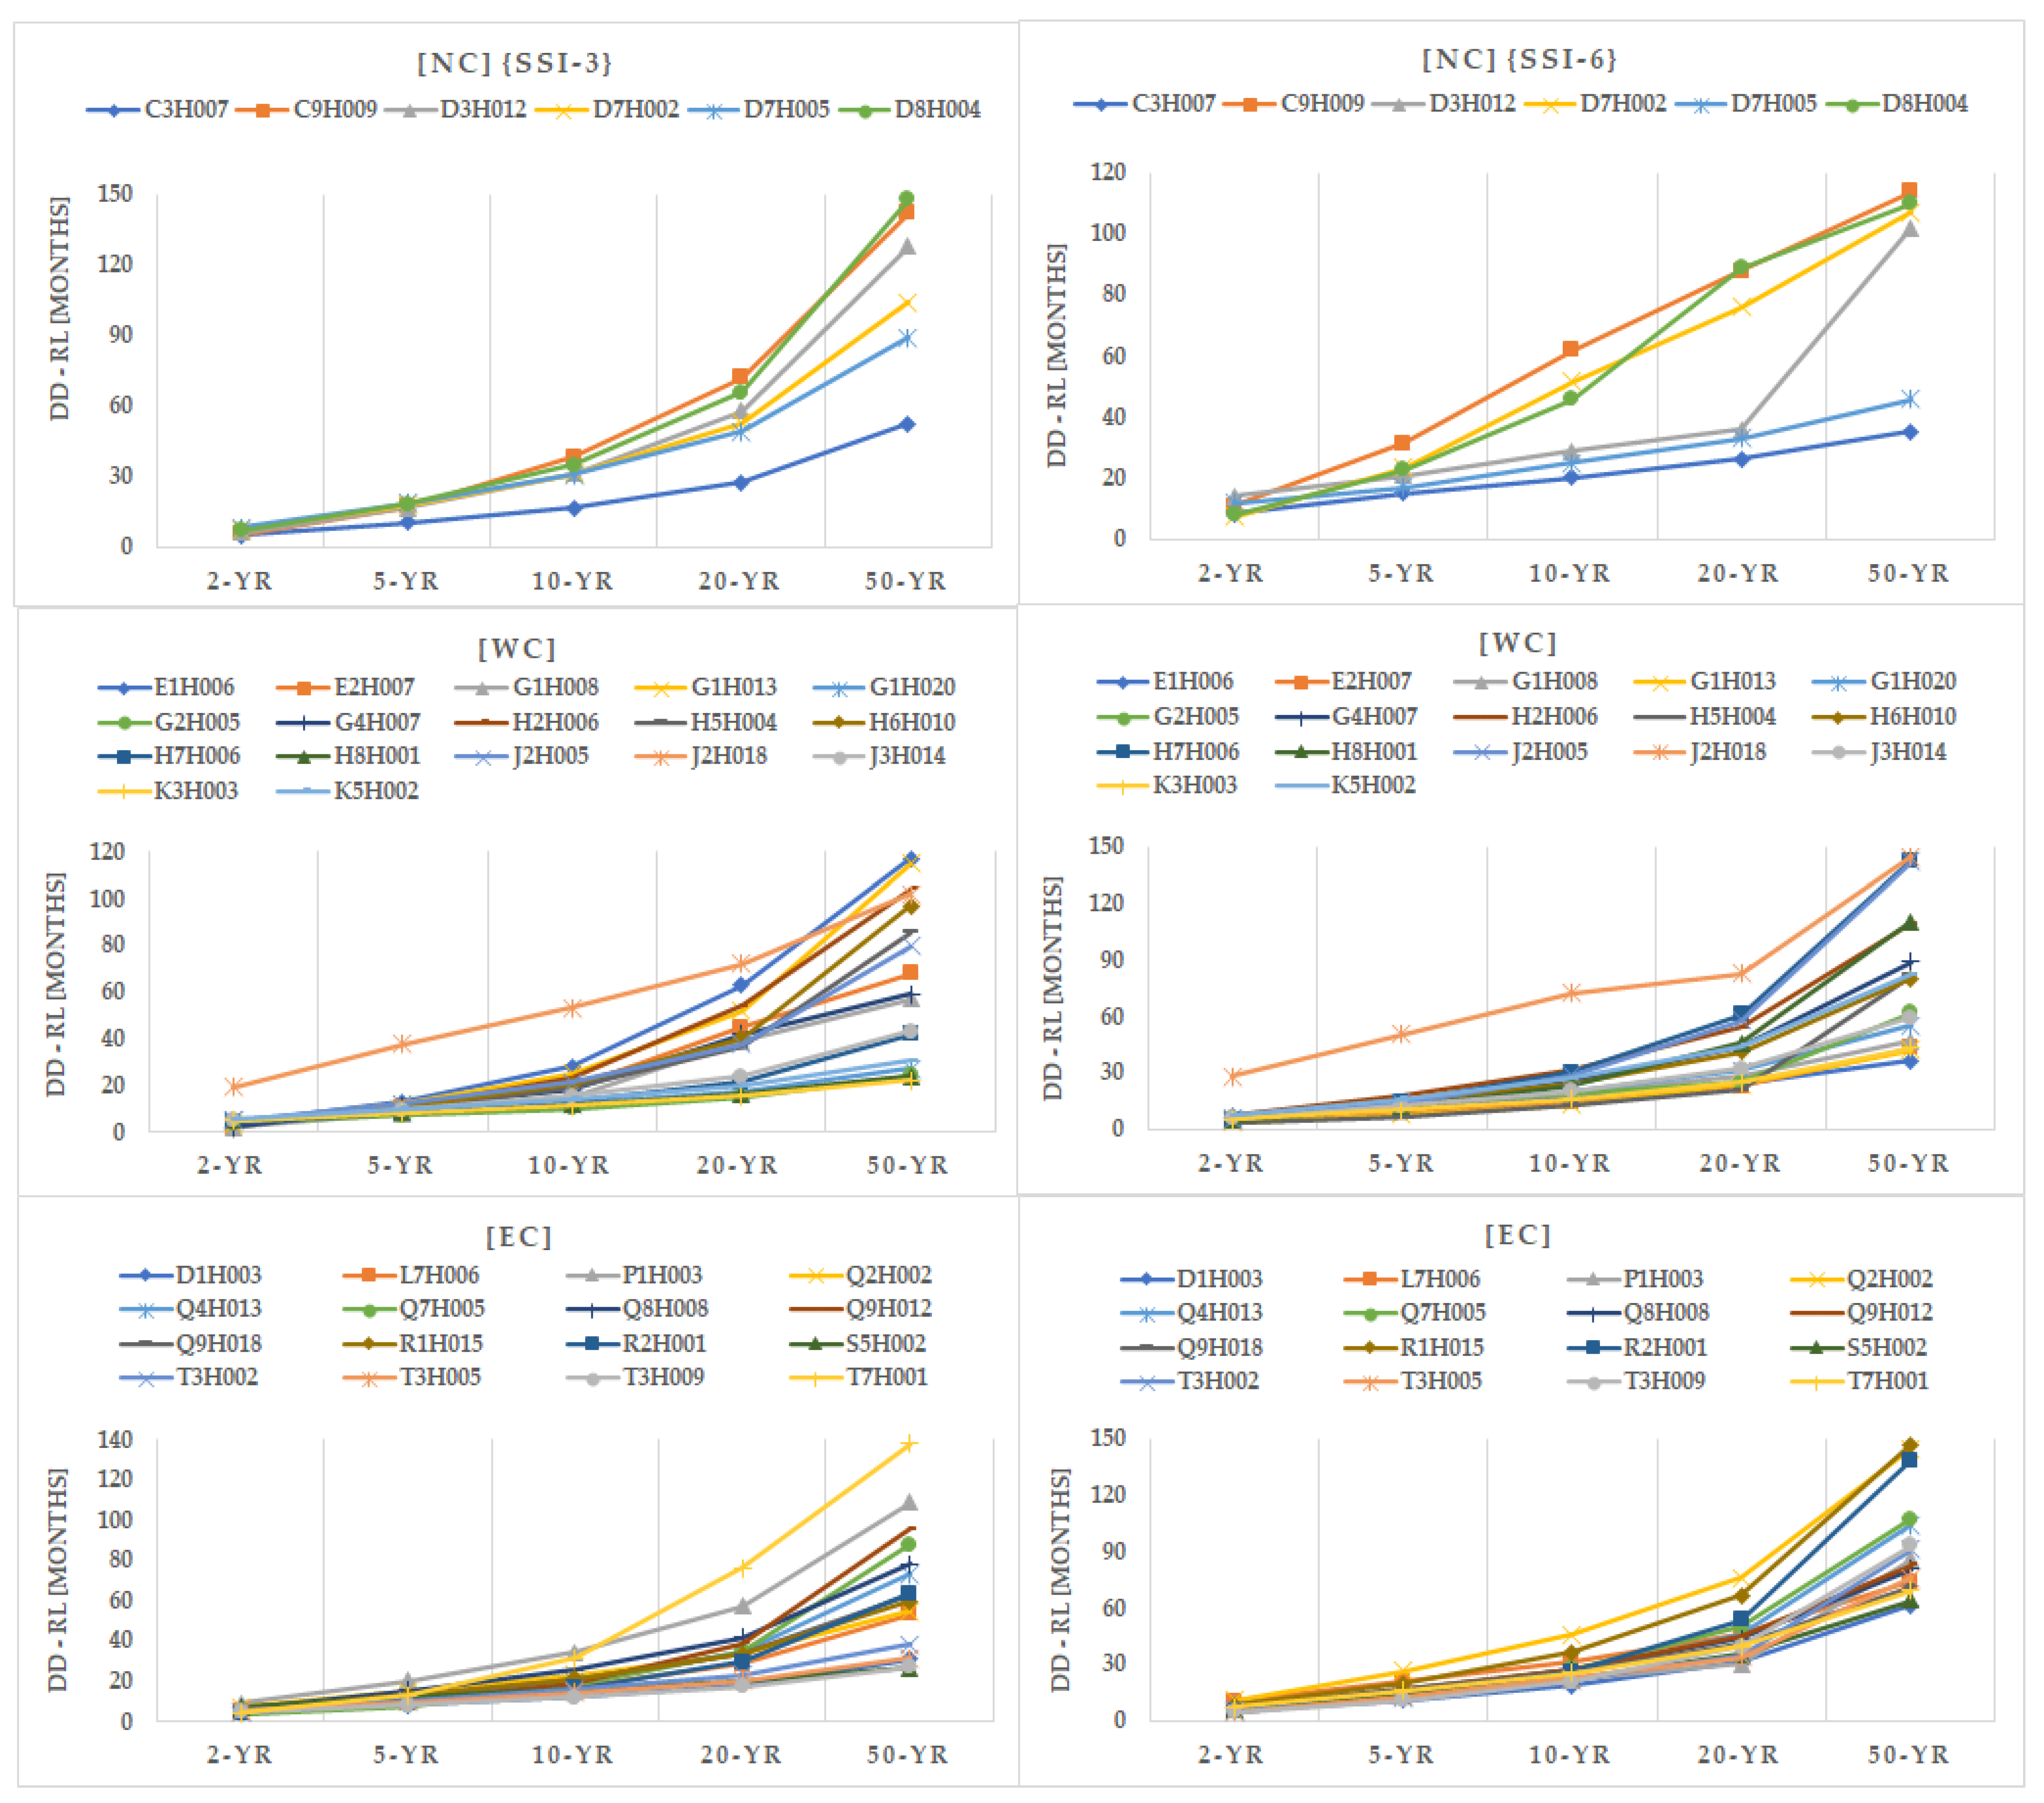
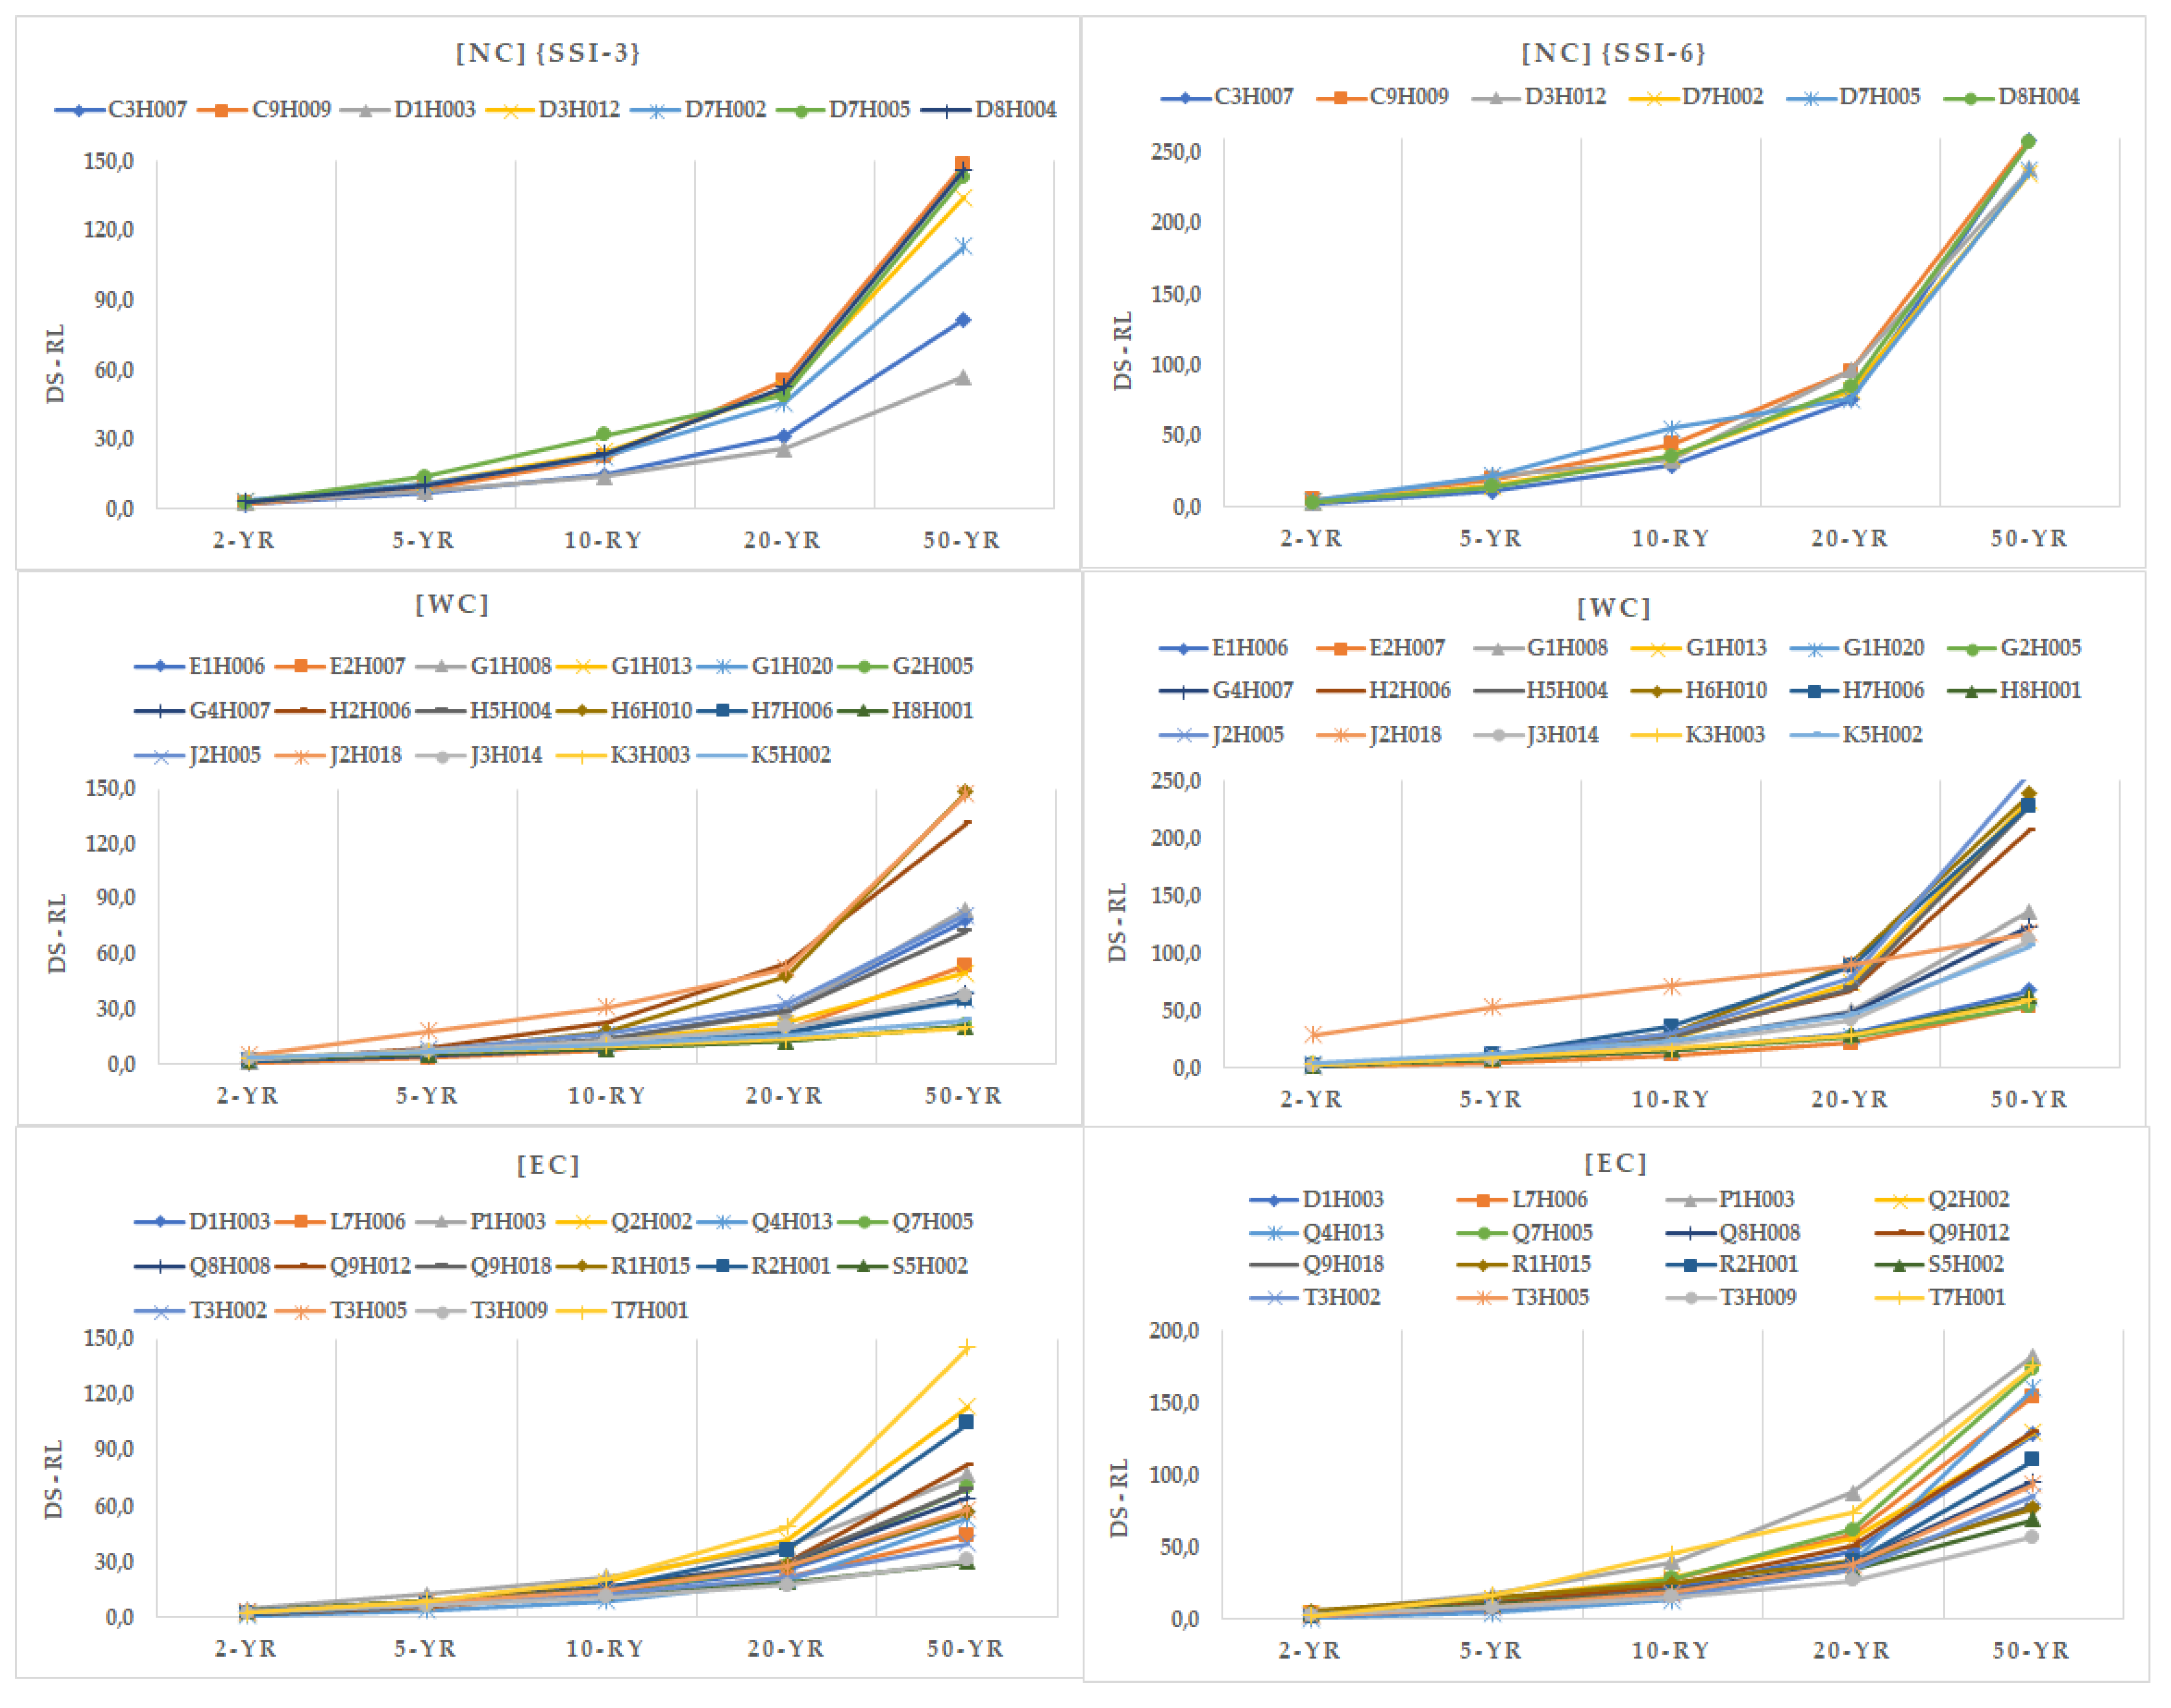
3.4. Return Levels of Drought Duration and Severity

Figure 8 depicts the spatial distribution of drought events estimated from the SSI at 3- and 6-month accumulation time-steps across the three Cape provinces. These events were estimated based on the condition that the SSI exhibited continued negative values for 2 months or more. The results of SSI at 3- and 6-month accumulation time-steps at six stations in the NC region indicate that there were 21–30 and 14–25 drought events during the period 1985–2020, respectively. The EC province experienced 24–36 and 14–30 drought episodes based on the analysis of SSI at 3- and 6-month accumulation periods, respectively. In the WC province, drought episodes ranged from the seven, which was the lowest, to 39, the highest, for the SSI-3 analysis. Drought episodes were reduced when considering the SSI-6 analysis, with the events ranging from five at the lowest to 27 at the highest. The J2H018 in the WC region is the solely stream-gauge station that has recorded the lowest drought events during the 3.5 decades. Such a huge deviation requires further inspection of streamflow data for this station. Overall, the results indicate that SSI-3 exhibited greater drought events as compared to the SSI-6 accumulation period. The drought events in Figure 8 were used to estimate the return levels of DD and DS at both 3- and 6-month accumulation time-steps.
Figure 9 depicts the spatial distribution of estimated return levels of DD associated with 2-, 5-, 10-, 20- and 50-year periods computed based on 3- (first column) and 6-month (second column) accumulation time-steps. In Figure 9, DD return levels for the NC province study site are shown in the first row, whereas the second and third rows represent the output for the WC and EC provinces, respectively. As noted in the results, the estimated return levels exhibit localized and spatial variability across the studied periods and accumulation time-steps. In both the DD at 3- and -6-month accumulation periods’ analyses, the return levels increase in subsequent periods. In the NC province, hydrological drought is expected to occur with duration ranging between 5 and 8 and between 10 and 19 months across the province for the 2- and 5-year periods, respectively. Prolonged hydrological drought is expected to range from 28 to 66 and from 53 to 148 months in the next 20- and 50-year periods, respectively. Hydrological drought is likely to be short (2–5 months) in the WC during the next 2 years, followed by a rapid increase in subsequent periods, with duration in the range of 15–72 and 22–115 months for the 20- and 50-year periods, respectively. The J2H018 is the only stream-gauge station depicting extreme return levels across the periods, resulting in a slight deviation pattern from the rest of the stations. Similarly, hydrological drought is expected to last between 4 and 9 months in a shorter period and reach a maximum of 138 in 50 years’ time. Results for the 6-month accumulation period depict a similar increasing pattern across the stations and the provinces. Moreover, the results indicate that the NC is likely to experience prolonged DD, followed by the EC province. The WC province is expected to experience short DD, as compared to the other Cape provinces. Overall, the results of the return levels suggest that the three Cape provinces are likely to experience persistent drought with localized duration. Moreover, the duration of drought is expected to increase in subsequent periods.
The results for the return levels of DS associated with the 2-, 5-, 10-, 20- and 50-year periods are shown in Figure 10 for 3- and 6-month accumulation periods. Similar to DD, the estimated return levels for DS increase with increasing periods. The 2-year return levels for DS range from the lowest of 1.4 to maximum severity of 5 in the WC to 1.2–4.6 in the EC and to 2.1–3.5 in the NC provinces. The severity doubles for the 5-year period across the stations and provinces. A significant increase in drought severity is recorded for the 20- and 50-year periods, reaching a maximum severity of 55.6, 55.0 and 48.8 for the 20-year period and in the NC, WC and EC provinces, respectively. The severity of hydrological drought is expected to double in magnitude in 50 years, as compared to the 20-year analysis period. A similar increasing pattern of DS return levels is observed for the 6-month accumulation time-step. While drought is expected to become severe in the future, the WC is likely to experience less severity. On the contrary, drought is likely to be more severe in the NC region, followed by the EC province.

4. Discussion

The present study investigated past hydrological drought conditions in the three Cape provinces of South Africa. Streamflow observations spanning 3.5 decades were used to compute SSI and its features at 3- and 6-month accumulation epochs. Based on the results, streamflow across most stations (~80%) exhibited a decreasing trend pattern. These findings collaborate with various research conducted in the WC and EC provinces. For instance, studies by Lakhraj-Govender and Grab [56] reported a decreasing trend in annual and winter rainfall and river flow in the WC province for the period spanning from 1987 to 2017. Similar studies focusing on rainfall characteristics have been reported by Botai et al. [10] in the WC, Botai et al. [22] in the EC and Mahlalela et al. [57] in the Southwestern Cape regions. The observed downward trend can be attributed to seasonality effects, manifested as reduced precipitation, coupled with increased temperature, as well as other influential factors, such as relative humidity and wind speed. These climatic variables, particularly the temperature, atmospheric humidity and wind speed, have moderating effects on other hydroclimatic variables, for instance, influencing potential evaporation [58,59]. Precipitation fundamentally affects water availability and supply within a region [59]. Consequently, it is clear that the change in these climatic variables has modified the surface water balance, contributing to the drying conditions in the three Cape provinces in the past three and a half decades (1985–2020). Moreover, conditions in the EC province are further complicated by its climatic conditions, e.g., the western parts lie near the transition zone between the summer and winter rainfall regions towards the southeastern part of the country [60]. The EC regions are also influenced by mid-latitude and tropical systems, which lead to complex meteorology that involves interlinkages with the neighboring Agulhas current or landscape [61], contributing to a decrease in mean summer rainfall along the EC coast [62]. The streamflow in the WC province is also influenced by regional climate, including fluctuation in rainfall and evaporation rates (due temperature changes), as well as enhanced water withdrawal (and demand) for consumption [59].
Prolonged drought episodes are notable across the three provinces. These drought episodes include the 1991–1996 (EC), 1995–2000 (WC) and 2015–2020 across the three Cape provinces. These results agree with previously reported drought events that led to severe water crisis in the region [10,22,57,63]. Negative trends in SSI-3 and SSI-6 were detected in approximately 67% of the stream-gauge stations across the provinces. While the SSI values in the EC province depict positive trends in approximately 68% of the stations, water resources have remained excessively under pressure during the study period. This condition is still largely experienced currently, with provincial average dam levels in 2020 reaching the lowest of less than 50% full storage capacity. The ongoing drought in the EC province has left the most vulnerable communities with great uncertainty of facing the famously so-called “day zero” state [64], where plans, such as increasing water restrictions and the possibility of shutting off taps, are being considered. Most of the major dams that supply water in the region are currently below 50% [65]. Therefore, these suggest that, while some areas in the EC province might have received increased precipitation during the study period, the received amount could not have been significant to enhance ground-water recharge and compensate the growing demand for water resources.
The WC province has also experienced severe drought conditions that resulted in a decline in dam storage capacity. Significant reduction in water levels can be attributed to the 2015–2018 drought conditions, which were reportedly a manifestation of past droughts in the province [10]. During this period, dam levels reached the lowest of ~30% full storage capacity, particularly in 2017 and ~40% in 2018, posing threats of an impending “day zero” state. The current results suggest that the WC province is still experiencing acute drought conditions. Such conditions can be attributed to factors such as climate change, deficit/decrease in rainfall and lack of monitoring systems [66]. Persistent drought in the WC regions is likely to exacerbate water shortages, particularly in vulnerable urban and rural areas, affecting agricultural activities and other activities that highly depend on water resources. The NC province is a generally arid area, and, therefore, it is inherently prone to drought conditions which increase the vulnerability and coping capacity of economic sectors, such as agriculture and mining.
The duration and severity of drought conditions over the three provinces have increased during the 1985–2020 study period, as evidenced from the observed upward trends of DD and DS across the 3- and 6-month accumulation epochs. While the study area is prone to drought conditions, the duration and severity features vary spatially across the provinces. For instance, the southeastern regions covering the WC and the EC provinces experienced DD lasting for 5–7 months on average, whereas the NC, which exhibits a unique geographical location (e.g., mostly aridity) and climate conditions, experienced prolonged drought, reaching a maximum of ~9 months. Furthermore, drought has become more severe over time, reaching a maximum severity of 5.0 in most parts of the three Cape provinces. The observed DD and DS for the period 1985–2020 are expected to continue, according to results from drought return levels, associated with 2-, 5-, 10-, 20- and 50-year periods. Results indicate that DD and DS will slightly increase for 2-year return period, followed by a rapid increase in subsequent periods, particularly in the next 20 and 50 years. These increases will be localized and vary according to geographical location, as well as the climate conditions, as observed in the historical features.
Increased return levels of extreme events are likely to have significant impacts on key water-linked sectors, such as agriculture and tourism, as well as manufacturing and production industries, which sustain socioeconomic development in the three provinces. Such extreme events are expected to add more pressure to the already burdened water resources, thereby increasing water stress and impact on agricultural activities and their value chain (e.g., livestock production, wheat, fruit and wine production). According to Kalaba [67], the country’s economy only grew by a mere 1.1% per annum between 2015 and 2017, a period when the country was gripped with one of the worst droughts. Such a growth rate is not sufficient to help tackle the triple challenges of poverty, unemployment and inequality and have implications on efforts to achieve national and global development goals (e.g., National Development Plan and SDG). Persistent drought conditions and the corresponding extreme events which are likely to reverberate into the future will probably exacerbate the triple challenges in the three Cape provinces. Additionally, the drought conditions would impact employment and especially the remuneration for low skilled and seasonal workers in sectors, such as agriculture and agro-processing, whereby productivity is likely to be affected by the availability of water for crop irrigation. In general, as evaluated in the current study, hydrological drought is a reality that requires concerted proactive actions by water agencies within the provinces, as well as the surrounding provinces that share catchments. Information derived from this study can support disaster management efforts at provincial and national levels to reduce spending on disaster relief, which often diverts money away from other fiscal activities. Such drought-risk information can also support the management of water resources in catchments at risk management and reduction, food price inflation, the food-import bill and economic growth in the future.

5. Conclusions

In this contribution, the SSI computed from 3.5 decades of streamflow data was used to evaluate hydrological drought conditions in the southwestern and southeastern parts of South Africa, covering the WC, NC and EC provinces. A decreasing streamflow trend was detected in most of the stream-gauge stations across the three Cape provinces. Hydrological drought analysis based on the SSI for 3- and 6-months accumulation periods indicate that most of the study regions experienced pronounced, yet localized drought conditions during the studied period. More specifically, negative trends in SSI-3 and SSI-6 were detected in approximately 67% of the stations across the provinces. Such a downward trend can be attributed to reduced streamflow, influenced by reduced precipitation or a shift in seasonal precipitation, coupled with increased temperature, among other factors. Based on the estimated return levels, increased DD is expected to occur within the study regions, with shortened and prolonged duration in the southeastern and southwestern areas, respectively. Severe drought events are also expected in the future, following a similar pattern as the estimated DD. In general, the historical trends analyses presented in this study form the basis for streamflow and drought projections in the three provinces. The present study and its findings are crucial for the implementation of appropriate policies and strategies for effective water-resource planning and management in the WC, EC and NP provinces. Based on the key findings of this study, it is recommended that water agencies and the government should be more proactive in searching for strategies to improve water resource management and drought mitigation in these regions.

Author Contributions

Conceptualization, C.M.B. and J.O.B.; methodology, C.M.B. and J.O.B.; software, J.O.B.; formal analysis, C.M.B. and J.O.B.; investigation, C.M.B. and J.O.B.; data curation, C.M.B. and J.P.d.W.; writing—original draft preparation, C.M.B., K.P.N., M.M., P.M.B. and A.M.A.; writing—review and editing, All Authors.; visualization, C.M.B., J.O.B. and J.P.d.W.; supervision, J.O.B. All authors have read and agreed to the published version of the manuscript.

Funding

This research was funded by the Water Research Commission of South Africa, grant number C2019/2020-00017.

Institutional Review Board Statement

Not applicable.

Informed Consent Statement

Not applicable.

Data Availability Statement

Not applicable.

Acknowledgments

The authors wish to thank the anonymous reviewers for providing constructive and detailed comments that assisted to improve the quality of the manuscript.

Conflicts of Interest

The authors declare no conflict of interest.

References

  1. Bordi, I.; Frigio, S.; Parenti, P.; Speranza, A.; Sutera, A. The analysis of the Standardized Precipitation Index in the Mediterranean area: Large-scale patterns. Ann. Geophys. 2001, 44, 965–978. [Google Scholar] [CrossRef]
  2. Vicente-Serrano, S. Spatial and temporal analysis of droughts in the Iberian Peninsula (1910–2000). Hydrol. Sci. J. 2006, 51, 83–97. [Google Scholar] [CrossRef]
  3. Adhyani, N.L.; June, T.; Sopaheluwakan, A. Exposure to drought: Duration, severity and intensity (Java Bali and Nusa Tenggara). IOP Conf. Ser. Earth Environ. Sci. 2017, 58, 012040. [Google Scholar] [CrossRef] [Green Version]
  4. Niang, I.; Ruppel, O.C.; Abdrabo, M.A.; Essel, A.; Lennard, C.; Padgham, J.; Urquhart, P. Africa. In Climate Change 2014: Impacts, Adaptation, and Vulnerability. Part B: Regional Aspects. Contribution of Working Group II to the Fifth Assessment Report of the Intergovernmental Panel on Climate Change; Barros, V.R., Field, C.B., Dokken, D.J., Mastrandrea, M.D., Mach, K.J., Bilir, T.E., Chatterjee, M., Ebi, K.L., Estrada, Y.O., Genova, R.C., et al., Eds.; Cambridge University Press: Cambridge, UK; New York, NY, USA, 2014; pp. 1199–1265. [Google Scholar]
  5. Dai, A. Characteristics and trends in various forms of the Palmer Drought Severity Index during 1900–2008. J. Geophys. Res. Atmos. 2011, 116, D12115. [Google Scholar] [CrossRef] [Green Version]
  6. Hornby, D.; Vanderhaeghen, Y.; Versfeld, D.; Ngubane, M. A harvest of dysfunction: Rethinking the approach to drought, its causes and impacts in South Africa. In Report for Oxfam South Africa; Oxfam South Africa: Johannesburg, South Africa, 2016. [Google Scholar]
  7. Bureau for Food and Agriculture Policy. Policy Brief on 2015/2016 Drought; BFAP: Cape Town, South Africa, 2016. [Google Scholar]
  8. Wilhite, D.A.; Glantz, M.H. Understanding the drought phenomenon: The role of definitions. Water Int. 1985, 10, 111–120. [Google Scholar] [CrossRef] [Green Version]
  9. Yang, W. Drought Analysis under Climate Change by Application of Drought Indices and Copulas. Master’s Thesis, Portland State University, Portland, OR, USA, 2010. [Google Scholar]
  10. Botai, C.M.; Botai, J.O.; de Wit, J.P.; Ncongwane, K.P.; Adeola, A.M. Drought characteristics over the Western Cape Province, South Africa. Water 2017, 9, 876. [Google Scholar] [CrossRef] [Green Version]
  11. McKee, T.B.; Doesken, N.J.; Kleist, J. The relationship of drought frequency and duration to time scales. In Proceedings of the 8th Conference on Applied Climatology, Anaheim, CA, USA, 17–22 January 1993; American Meteorological Society: Boston, MA, USA, 1993; pp. 179–183. [Google Scholar]
  12. Vicente-Serrano, S.M.; Beguería, S.; Lopez-Moreno, I. A Multiscalar Drought Index Sensitive to GlobalWarming: The Standardized Precipitation Evapotranspiration Index. J. Clim. 2010, 23, 1696–1718. [Google Scholar] [CrossRef] [Green Version]
  13. Palmer, W.C. Meteorological Drought; Weather Bureau Research Paper, No. 45; Department of Commerce: Washington, DC, USA, 1965; p. 58.
  14. Byun, H.; Wilhite, D.A. Objective quantification of drought severity and duration. J. Clim. 1999, 12, 2747–2756. [Google Scholar] [CrossRef]
  15. Shafer, B.; Dezman, L. Development of a SurfaceWater Supply Index (SWSI) to assess the severity of drought conditions in snowpack runoff areas. In Proceedings of the 50th Western Snow Conference, Reno, NV, USA, 19–23 April 1982; pp. 164–175. [Google Scholar]
  16. Nalbantis, I.; Tsakiris, G. Assessment of hydrological drought revisited. Water Resour. Manag. 2009, 23, 881–897. [Google Scholar] [CrossRef]
  17. Vicente-Serrano, S.M.; Lopez-Moreno, J.I.; Begueria, S.; Lorenzo-Lacruz, J.; Azorin-Molina, C.; Moran-Tejeda, E. Accurate computation of a streamflow drought index. J. Hydrol. Eng. 2012, 17, 318–332. [Google Scholar] [CrossRef] [Green Version]
  18. Botai, C.M.; Botai, J.O.; Dlamini, L.C.; Zwane, N.S.; Phaduli, E. Characteristics of droughts in South Africa: A case study of the Free State and North West provinces. Water 2016, 8, 439. [Google Scholar] [CrossRef]
  19. Adisa, O.M.; Botai, J.O.; Adeola, A.M.; Botai, C.M.; Hassen, A.; Darkey, D.; Tesfamariam, E.; Adisa, A.T.; Adisa, A.F. Analysis of drought conditions over major maize producing provinces of South Africa. J. Agric. Meteorol. 2019, 75, 173–182. [Google Scholar] [CrossRef] [Green Version]
  20. Rouault, M.; Richard, Y. Intensity, and spatial extent of drought in southern Africa. Geophys. Res. Lett. 2005, 32, 1–4. [Google Scholar] [CrossRef]
  21. Botai, J.O.; Botai, M.C.; de Wit, J.P.; Muthoni, M.; Adeola, A.M. Analysis of drought progression physiognomies in South Africa. Water 2019, 11, 299. [Google Scholar] [CrossRef] [Green Version]
  22. Botai, C.M.; Botai, J.O.; Adeola, A.M.; de Wit, J.P.; Ncongwane, K.P.; Zwane, N.N. Drought risk analysis in the Eastern Cape Province of South Africa: The copula lens. Water 2020, 12, 1938. [Google Scholar] [CrossRef]
  23. Botai, C.M.; Botai, J.O.; Zwane, N.N.; Hayombe, P.; Wamiti, E.K.; Makgoale, T.; Murambadoro, M.D.; Adeola, A.M.; Ncongwane, K.P.; de Wit, J.P.; et al. Hydroclimatic extremes in the Limpopo River Basin, South Africa, under changing climate. Water 2020, 12, 3299. [Google Scholar] [CrossRef]
  24. Adeola, O.M.; Masinde, M.; Botai, J.O.; Adeola, A.M.; Botai, C.M. Ana analysis of precipitation extreme events based on the SPI and EDI values in the Free State Province, South Africa. Water 2021, 13, 3058. [Google Scholar] [CrossRef]
  25. StatsSA. Census 2011 Provincial Profile: Eastern Cape; Report 03-01-71; Statistics South Africa: Pretoria, South Africa, 2011. Available online: http://www.statssa.gov.za/publications/Report-03-01-71/Report-03-01-712011.pdf (accessed on 29 October 2021).
  26. Pocket Guide to South Africa. Provinces 2016–2017. Available online: https://www.gcis.gov.za/sites/default/files/pictures/provinces1617.pdf (accessed on 1 August 2021).
  27. Zwane, E.M. Impact of climate change on primary agriculture, water sources and food security in Western Cape, South Africa. Jamba J. Disaster Risk Stud. 2019, 11, a562. [Google Scholar] [CrossRef] [Green Version]
  28. Gasson, B. The Biophysical Environment of the Western Cape Province in Relation to its Economy and Settlements; School of Architecture and Planning, University of Cape Town for the Department of Local Government and Housing (Directorate of Development Promotion) of the Province of the Western Cape: Cape Town, South Africa, 1998. [Google Scholar]
  29. Partridge, A.; Morokong, T. Western Cape Agricultural Sector Profile: 2018 Western Cape Department of Agriculture Muldersvlei Road Elsenburg 7607 South Africa. Tech. Rep. 2018, 1–48. [Google Scholar] [CrossRef]
  30. Department of Environmental Affairs: Republic of South Africa. Draft–South Africa’s 2nd National Communication under the United Nations Framework Convention on Climate Change; Department of Environmental Affairs (DEA): Pretoria, South Africa, 2010.
  31. Zengeni, R.; Kakembo, V.; Nkongolo, N. Historical rainfall variability in selected rainfall stations in Eastern Cape, South Africa. S. Afr. Geogr. J. 2016, 98, 118–137. [Google Scholar] [CrossRef]
  32. StatsSA 2019. P0302-Mid-Year Population Estimates, 2020. 9 July 2020; Statistical Release. Available online: http://www.statssa.gov.za/?page_id=1854&PPN=P0302&SCH=72634 (accessed on 1 August 2021).
  33. Jordaan, A.J.; Sakulski, D.; Jordaan, A.D. Drought Risk Assessment for Northern Cape Province; Unpublished Report; Department of Agriculture and Rural Development: Kimberley, South Africa, 2011.
  34. Jordaan, A.J.; Sakulski, D.; Jordaan, A.D. Interdisciplinary drought risk assessment for agriculture: The case of communal farmers in the Northern Cape Province, South Africa. S. Afr. J. Agric. Ext. 2013, 41, 44–58. [Google Scholar]
  35. Tallaksen, L.M.; van Lanen, H.A.J. Hydrological Drought-Processes and Estimation Methods for Streamflow and Groundwater; Elsevier: Amsterdam, The Netherlands, 2004. [Google Scholar]
  36. Modarres, R. Streamflow drought time series forecasting. Stoch. Environ. Res. Risk Assess. 2007, 21, 223–233. [Google Scholar] [CrossRef]
  37. Tijdeman, E.; Stahl, K.; Tallaksen, L.M. Drought characteristics derived based on the Standardized Streamflow Index: A large sample comparison for parametric and nonparametric methods. Water Resour. Res. 2020, 56, e2019WR026315. [Google Scholar] [CrossRef]
  38. Shamshirband, S.; Hashemi, S.; Salimi, H.; Samadianfard, S.; Asadi, E.; Shadkani, S.; Kargar, K.; Mosavi, A.; Nabipour, N.; Chau, K.-W. Predicting Standardized Streamflow index for hydrological drought using machine learning models. Eng. Appl. Comput. Fluid Mech. 2020, 14, 339–350. [Google Scholar] [CrossRef]
  39. Salimi, H.; Asadi, E.; Darbandi, S. Meteorological and hydrological drought monitoring using several drought indices. Appl. Water Sci. 2021, 11, 11. [Google Scholar] [CrossRef]
  40. Karavitis, C.A.; Alexandris, S.; Tsesmelis, D.E.; Athanasopoulos, G. Applications of the Standardized Precipitation Index (SPI) in Greece. Water 2011, 3, 787–805. [Google Scholar] [CrossRef]
  41. WMO. Standardized Precipitation Index User Guide; Svoboda, M., Hayes, M., Wood, D., Eds.; WMO-No. 1090; WMO: Geneva, Switzerland, 2012. [Google Scholar]
  42. Lee, T.; Modarres, R.; Quarda, T.B.M.J. Data-based analysis of bivariate copula tail dependence for drought duration and severity. Hydrol. Process. 2013, 27, 1454–1463. [Google Scholar] [CrossRef]
  43. Shiau, J.T.; Feng, S.; Nadaraiah, S. Assessment of hydrological droughts for the Yellow River, China, using copulas. Hydrol. Process. 2007, 21, 2157–2163. [Google Scholar] [CrossRef]
  44. Tan, C.; Yang, J.; Li, M. Temporal-spatial variation of drought indicated by SPI and SPEI in Ningxia Hui Autonomous region, China. Atmosphere 2015, 6, 1399–1421. [Google Scholar] [CrossRef] [Green Version]
  45. Hamed, K.H.; Rao, R. A modified Mann-Kendall trend test for autocorrelated data. J. Hydrol. 1998, 204, 182–196. [Google Scholar] [CrossRef]
  46. Malik, A.; Kumar, A. Spatio-temporal trend analysis of rainfall using parametric and non-parametric tests: Case study in Uttarakhand, India. Theor. Appl. Climatol. 2020, 140, 183–207. [Google Scholar] [CrossRef]
  47. Mann, H.B. Nonparametric tests against trend. Econometrica 1945, 13, 245–259. [Google Scholar] [CrossRef]
  48. Kendall, M.G. Rank Correlation Methods; Charles Griffin: London, UK, 1975. [Google Scholar]
  49. Gilbert, R.O. Statistical Methods for Environmental Pollution Monitoring; Wiley: Hoboken, NY, USA, 1987. [Google Scholar]
  50. Wang, J.; Lin, H.; Huang, J.; Jiang, C.; Xie, Y.; Zhou, M. Variations of drought tendency, frequency, and characteristics and their responses to climate change under CMIP5 RCP scenarios in Huai River Basin, China. Water 2019, 11, 2174. [Google Scholar] [CrossRef] [Green Version]
  51. Liang, L.; Li, L.; Liu, Q. Temporal variation of reference evapotranspiration during 1961–2005 in the Taoer River basin of Northeast China. Agric. For. Meteorol. 2010, 150, 298–306. [Google Scholar] [CrossRef]
  52. Ahn, K.H.; Merwade, V. Quantifying the relative impact of climate and human activities on streamflow. J. Hydrol. 2014, 515, 257–266. [Google Scholar] [CrossRef]
  53. Wang, X.; He, K.; Dong, Z. Effects of climate change and human activities on runoff in the Beichuan River Basin in the northeastern Tibetan Plateau, China. Catena 2019, 176, 81–93. [Google Scholar] [CrossRef]
  54. Coles, S.G. An Introduction to Statistical Modeling of Extreme Values; Springer: London, UK, 2001; Volume 208. [Google Scholar]
  55. Beirlant, J.; Goegebeur, Y.; Segers, J.; Teugels, J. Statistics of Extremes: Theory and Applications; Wiley Series in Probability and Statistics; Wiley: Chichester, UK, 2004. [Google Scholar]
  56. Lakhraj-Governder, R.; Grab, S.W. Rainfall and river flow trends for the Western Cape Province, South Africa. S. Afr. J. Sci. 2019, 115, 1–6. [Google Scholar]
  57. Mahlalela, P.; Blamey, R.C.; Reason, C.J.C. Mechanisms behind early winter rainfall variability in the southwestern Cape, South Africa. Clim. Dyn. 2019, 53, 21–39. [Google Scholar] [CrossRef]
  58. Allen, R.G.; Pereira, L.S.; Raes, D.; Smith, M. Crop Evapotranspiration: Guidelines for Computing Crop Water Requirements; Food and Agriculture Organization of the United Nations: Rome, Italy, 1998. [Google Scholar]
  59. Liu, M.; Xu, X.; Sun, A.Y.; Wang, K. Decreasing spatial variability of drought in southwest China during 1959–2013. Int. J. Climatol. 2017, 37, 4610–4619. [Google Scholar] [CrossRef]
  60. Reason, C.J.C.; Rouault, M.; Melice, J.-L.; Jagadheesha, D. Interannual winter rainfall variability in SW Africa and large scale ocean-atmosphere interactions. Meteorol. Atmos. Phys. 2002, 80, 19–29. [Google Scholar] [CrossRef]
  61. Singleton, A.T.; Reason, C.J.C. Numerical simulations of a severe rainfall event over the Eastern Cape coast of South Africa: Sensitivity to sea surface temperature and topography. Tellus A 2006, 58, 355–367. [Google Scholar] [CrossRef]
  62. Jury, M.R.; Valentine, H.R.; Lutjeharms, J.R.E. Influence of the agulhas current on summer along the southeast coast of South Africa. J. Appl. Meteorol. 1993, 32, 1282–1287. [Google Scholar] [CrossRef] [Green Version]
  63. Burls, N.J.; Blamey, R.C.; Cash, B.A.; Swenson, E.T.; al Fahad, A.; Bopape, M.-J.M.; Straus, D.M.; Reason, C.J.C. The Cape Town “Day Zero” drought and Hadley cell expansion. NPJ Clim. Atmos. Sci. 2019, 2, 27. [Google Scholar] [CrossRef] [Green Version]
  64. Kouga Municipality. Defeat Day Zero in Kouga. 2021. Available online: https://www.kouga.gov.za/article/dam-levels-just-over-16 (accessed on 25 August 2021).
  65. Department of Water and Sanitation Weekly Report. Available online: https://www.dws.gov.za/Hydrology/Weekly/Weekly.pdf (accessed on 8 November 2021).
  66. Orimoloye, I.R.; Olalade, O.O.; Mazinyo, S.P.; Kalumba, A.M.; Ekundayo, O.Y.; Busayo, E.T.; Akinsanola, A.A.; Nel, W. Spatial assessment of drought severity in Cape Town area, South Africa. Heliyon 2019, 5, e02148. [Google Scholar] [CrossRef] [Green Version]
  67. Kalaba, M. How will Droughts Affect South Africa’s Broader Economy. 2019. Available online: https://theconversation.com/how-droughts-will-affect-south-africas-broader-economy-111378. (accessed on 25 August 2021).
Figure 1. Central area: study area map and distribution of streamflow gauge stations. Top left panel: map of Africa with South Africa highlighted in brown. Top right panel: map of South Africa with its nine provinces. The 3 Cape provinces are highlighted in brown, where NC, WC and EC are abbreviations for the Northern Cape, Western Cape and Eastern Cape provinces, respectively.
Water 13 03498 g001
Figure 2. Annual streamflow time series for selected stream-gauge stations in (a) the Western Cape, (b) Northern Cape and (c) Eastern Cape study sites over the period 1985–2020. The abbreviations appearing on the station names represent drainage regions where the stations are located, and H in the middle gives the classification of data type—in this case, hydrological.
Water 13 03498 g002
Figure 3. Trends in streamflow across the study site.
Water 13 03498 g003
Figure 4. Annual SSI time series at 3- and 6-month accumulation time-steps for selected stations in (a) the Western Cape, (b) Eastern Cape and (c) Northern Cape provinces over the period 1985–2020.
Water 13 03498 g004
Figure 5. Trends in the Standardized Streamflow Index at 3- (top) and 6-month (bottom) accumulation periods.
Water 13 03498 g005
Figure 6. Annual mean of drought duration (in months) and severity based on the SSI-3 and SSI-6 analysis shown in left and right panels, respectively.
Water 13 03498 g006
Figure 7. Trends in drought duration (left) and severity (right) at 3- and 6-month accumulation periods.
Water 13 03498 g007
Figure 8. Drought episodes across the stations and study site. These events are defined when the standardized streamflow index at 3- (top) and 6-month (bottom) accumulation periods exhibited continuous negative values for 2 and more months.
Water 13 03498 g008
Figure 9. Return levels for drought duration for studied periods based on the SSI-3 and SSI-6 analysis, as depicted in the first and second columns, respectively.
Water 13 03498 g009
Figure 10. Return levels for drought severity for studied periods based on the SSI-3 and SSI-6 analysis, as depicted in the first and second columns, respectively.
Water 13 03498 g010
Table 1. Selected river stations, with basic information including annual mean flow. The letters in station names (e.g., C, D, G, …, K) represent the drainage region, while the middle H letter stands for hydrological data.
Station No.Station NameLocationLatitudeLongitudeCatchment Area (km2)Mean Flow (m3/s)
1C3H007NC−27.903224.6151423.9005.52
2C9H009NC−28.516224.60069121.22023.85
3D1H003EC−30.678326.7163836.975116.63
4D3H012NC−29.991124.7202789.755126.80
5D7H002NC−29.651722.74591337.690130.17
6D7H005NC−28.457921.23923361.530156.61
7D8H004NC−28.735919.30553856.400117.90
8E1H006WC−32.211718.936661601.31
9E2H007WC−32.780319.283332651.35
10G1H008WC−33.313919.074723932.05
11G1H013WC−33.130818.86277293617.13
12G1H020WC−33.707818.9911162810.07
13G2H005WC−33.973618.93805310.52
14G4H007WC−34.329418.988334646.65
15H2H006WC−33.570819.506117072.67
16H5H004WC−33.897820.01166671323.39
17H6H010WC−33.983619.32916150.05
18H7H006WC−34.067520.40555984232.77
19H8H001WC−34.251720.991947902.88
20J2H005WC−33.489721.489442530.19
21J2H018WC−32.240322.58583980.03
22J3H014WC−33.421122.240831510.44
23K3H003WC−34.006722.350271450.70
24K5H002WC−33.891123.029441330.76
25L7H006EC−33.73124.6179429.5601.85
26P1H003EC−33.329426.0777514790.18
27Q2H002EC−31.904225.4306117130.35
28Q4H013EC−32.314225.7411147420.54
29Q7H005EC−33.027625.893319.1307.04
30Q8H008EC−32.78525.6148315120.62
31Q9H012EC−33.098326.4447523.0547.12
32Q9H018EC−33.237826.9948629.74311.17
33R1H015EC−33.185427.3907525303.27
34R2H001EC−32.731927.29361290.31
35S5H002EC−32.044327.8223823593.91
36T3H002EC−30.482828.6208321019.61
37T3H005EC−31.031828.8845259714.59
38T3H009EC−31.071728.353613073.60
39T7H001EC−31.551229.24383151.19
Table 2. Classification of drought based on the Standardized Streamflow Index estimated values.
Non-DroughtMild DroughtModerate DroughtSevere DroughtExtreme Drought
SSI ≥ 0.0−1.0 ≤ SSI < 0.0−1.5 ≤ SSI < −1.0−2.0 ≤ SSI < −1.5SSI ≤ −2.0
Publisher’s Note: MDPI stays neutral with regard to jurisdictional claims in published maps and institutional affiliations.

