
Soil Erosion Assessment Using the RUSLE Model and Geospatial Techniques (Remote Sensing and GIS) in South-Central Niger (Maradi Region)


Abstract
:1. Introduction
2. Materials and Methods
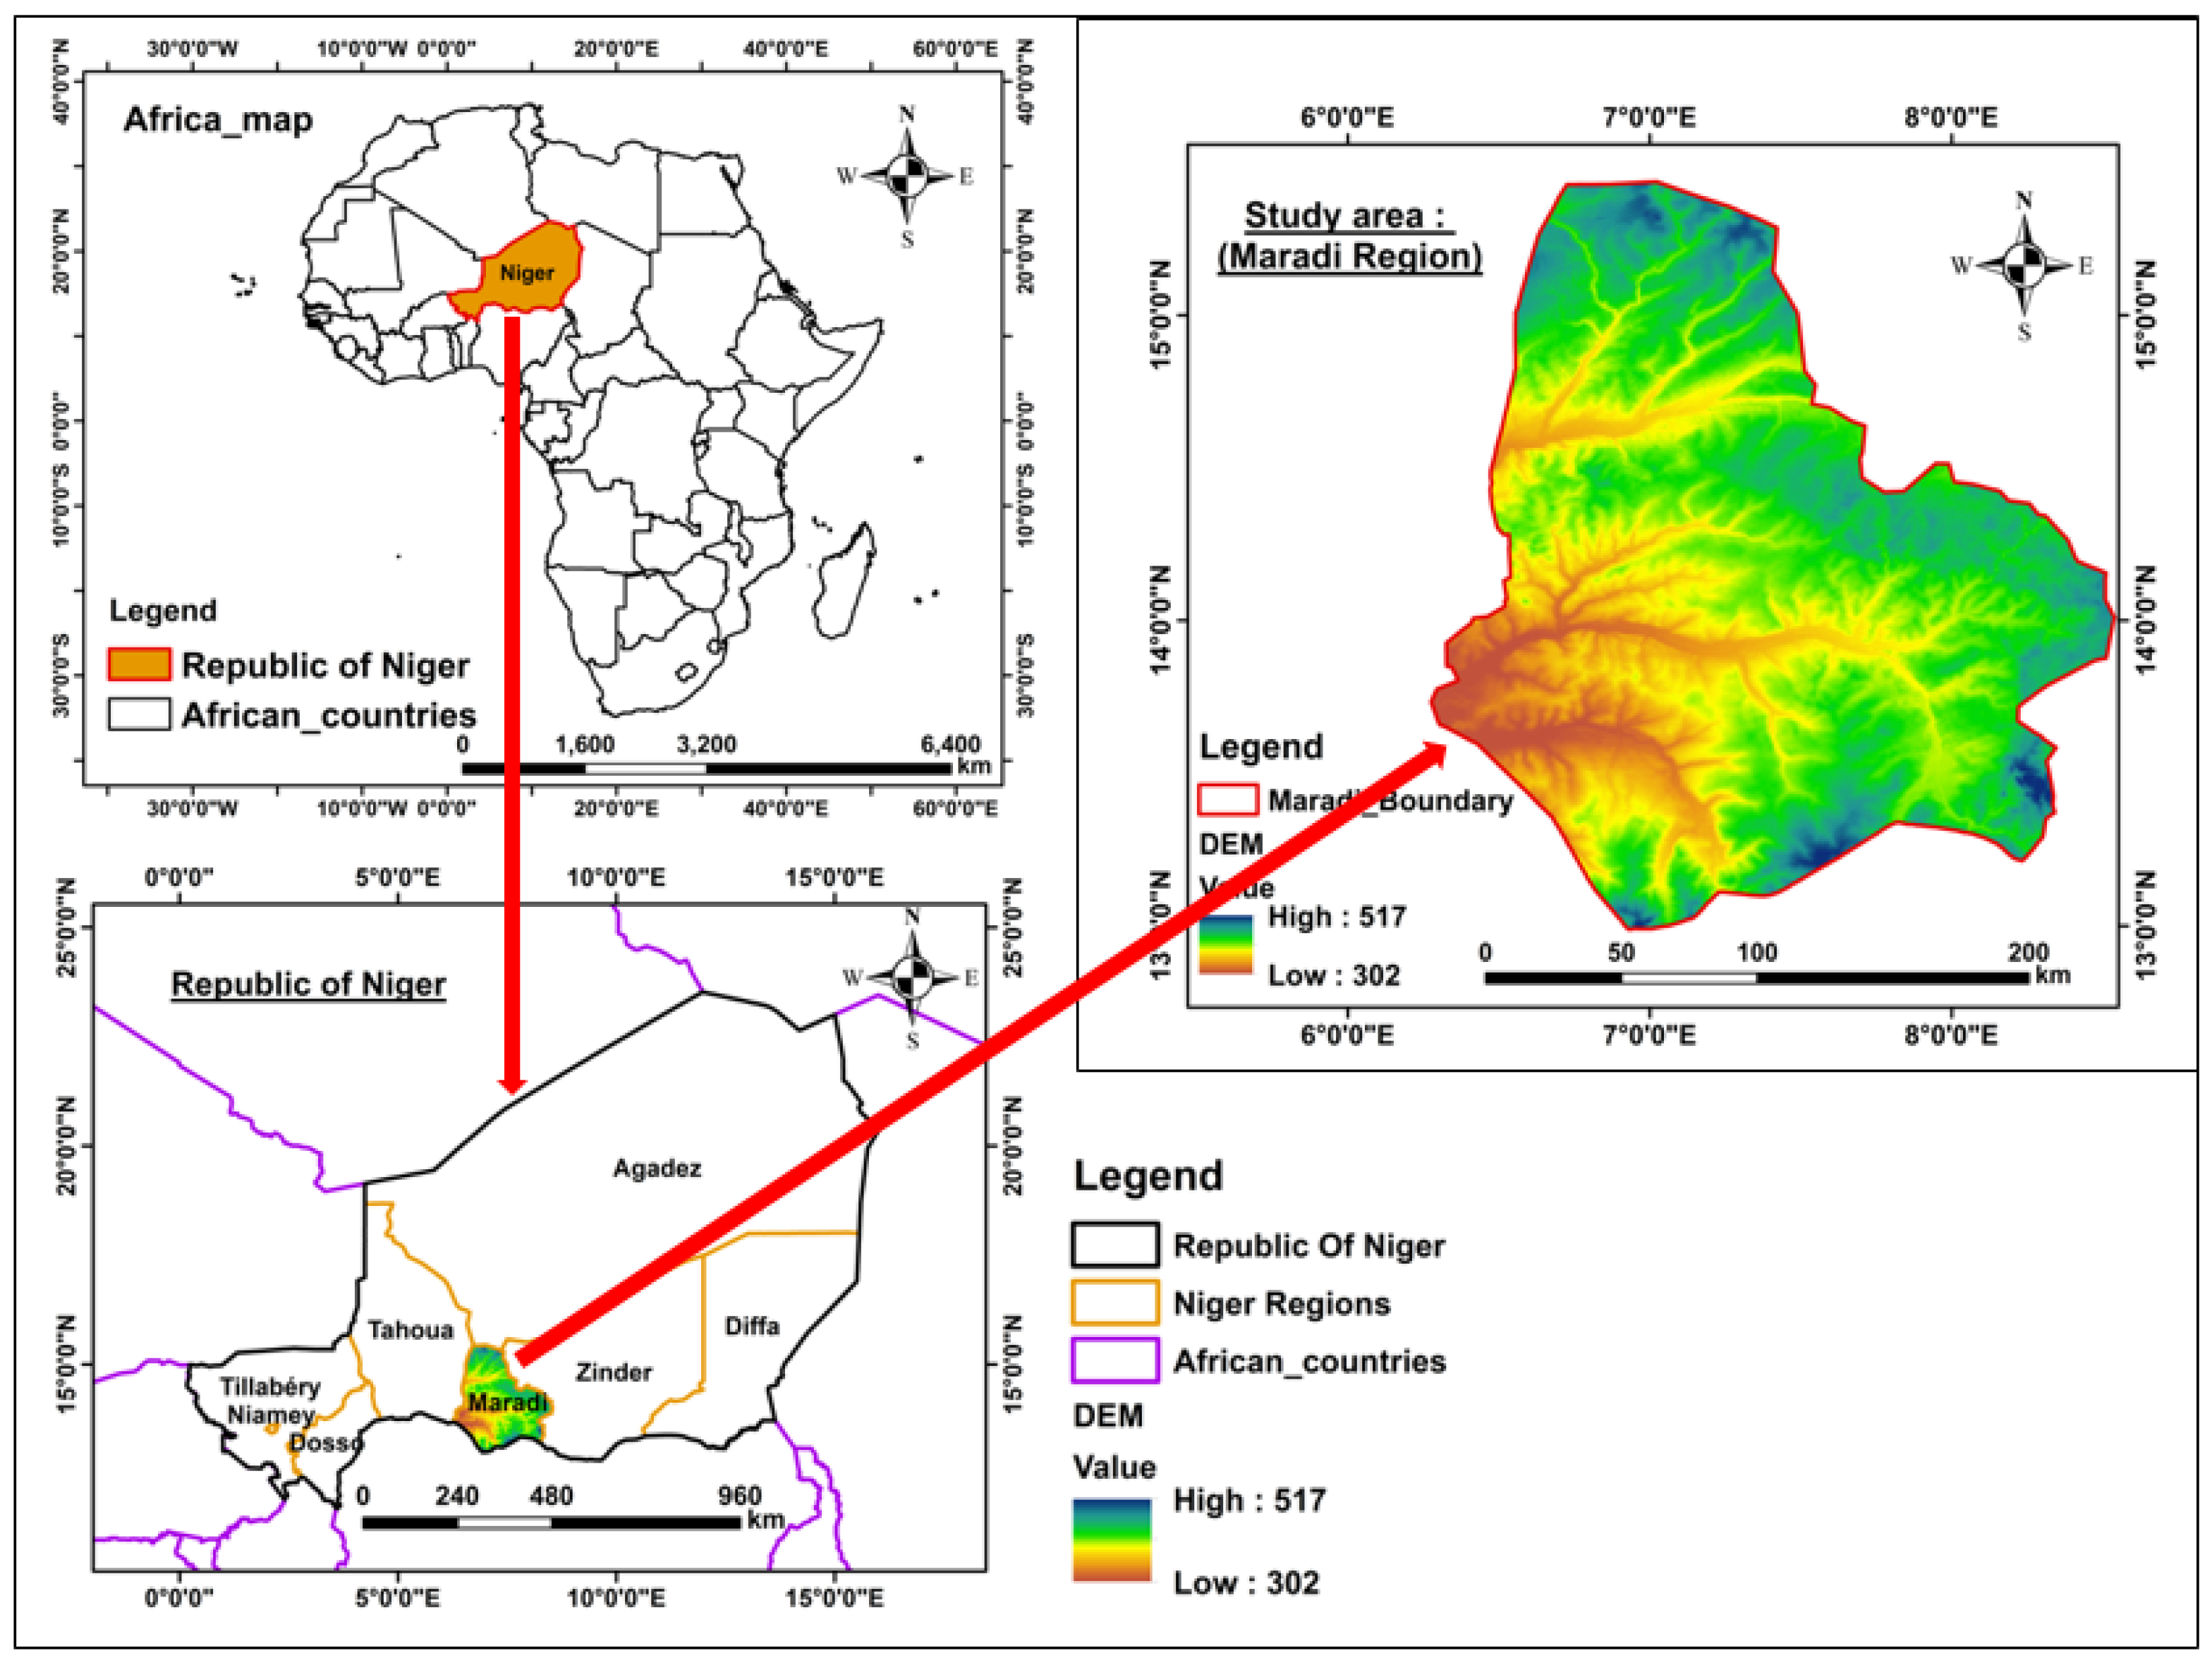
2.1. Description of the Study Area
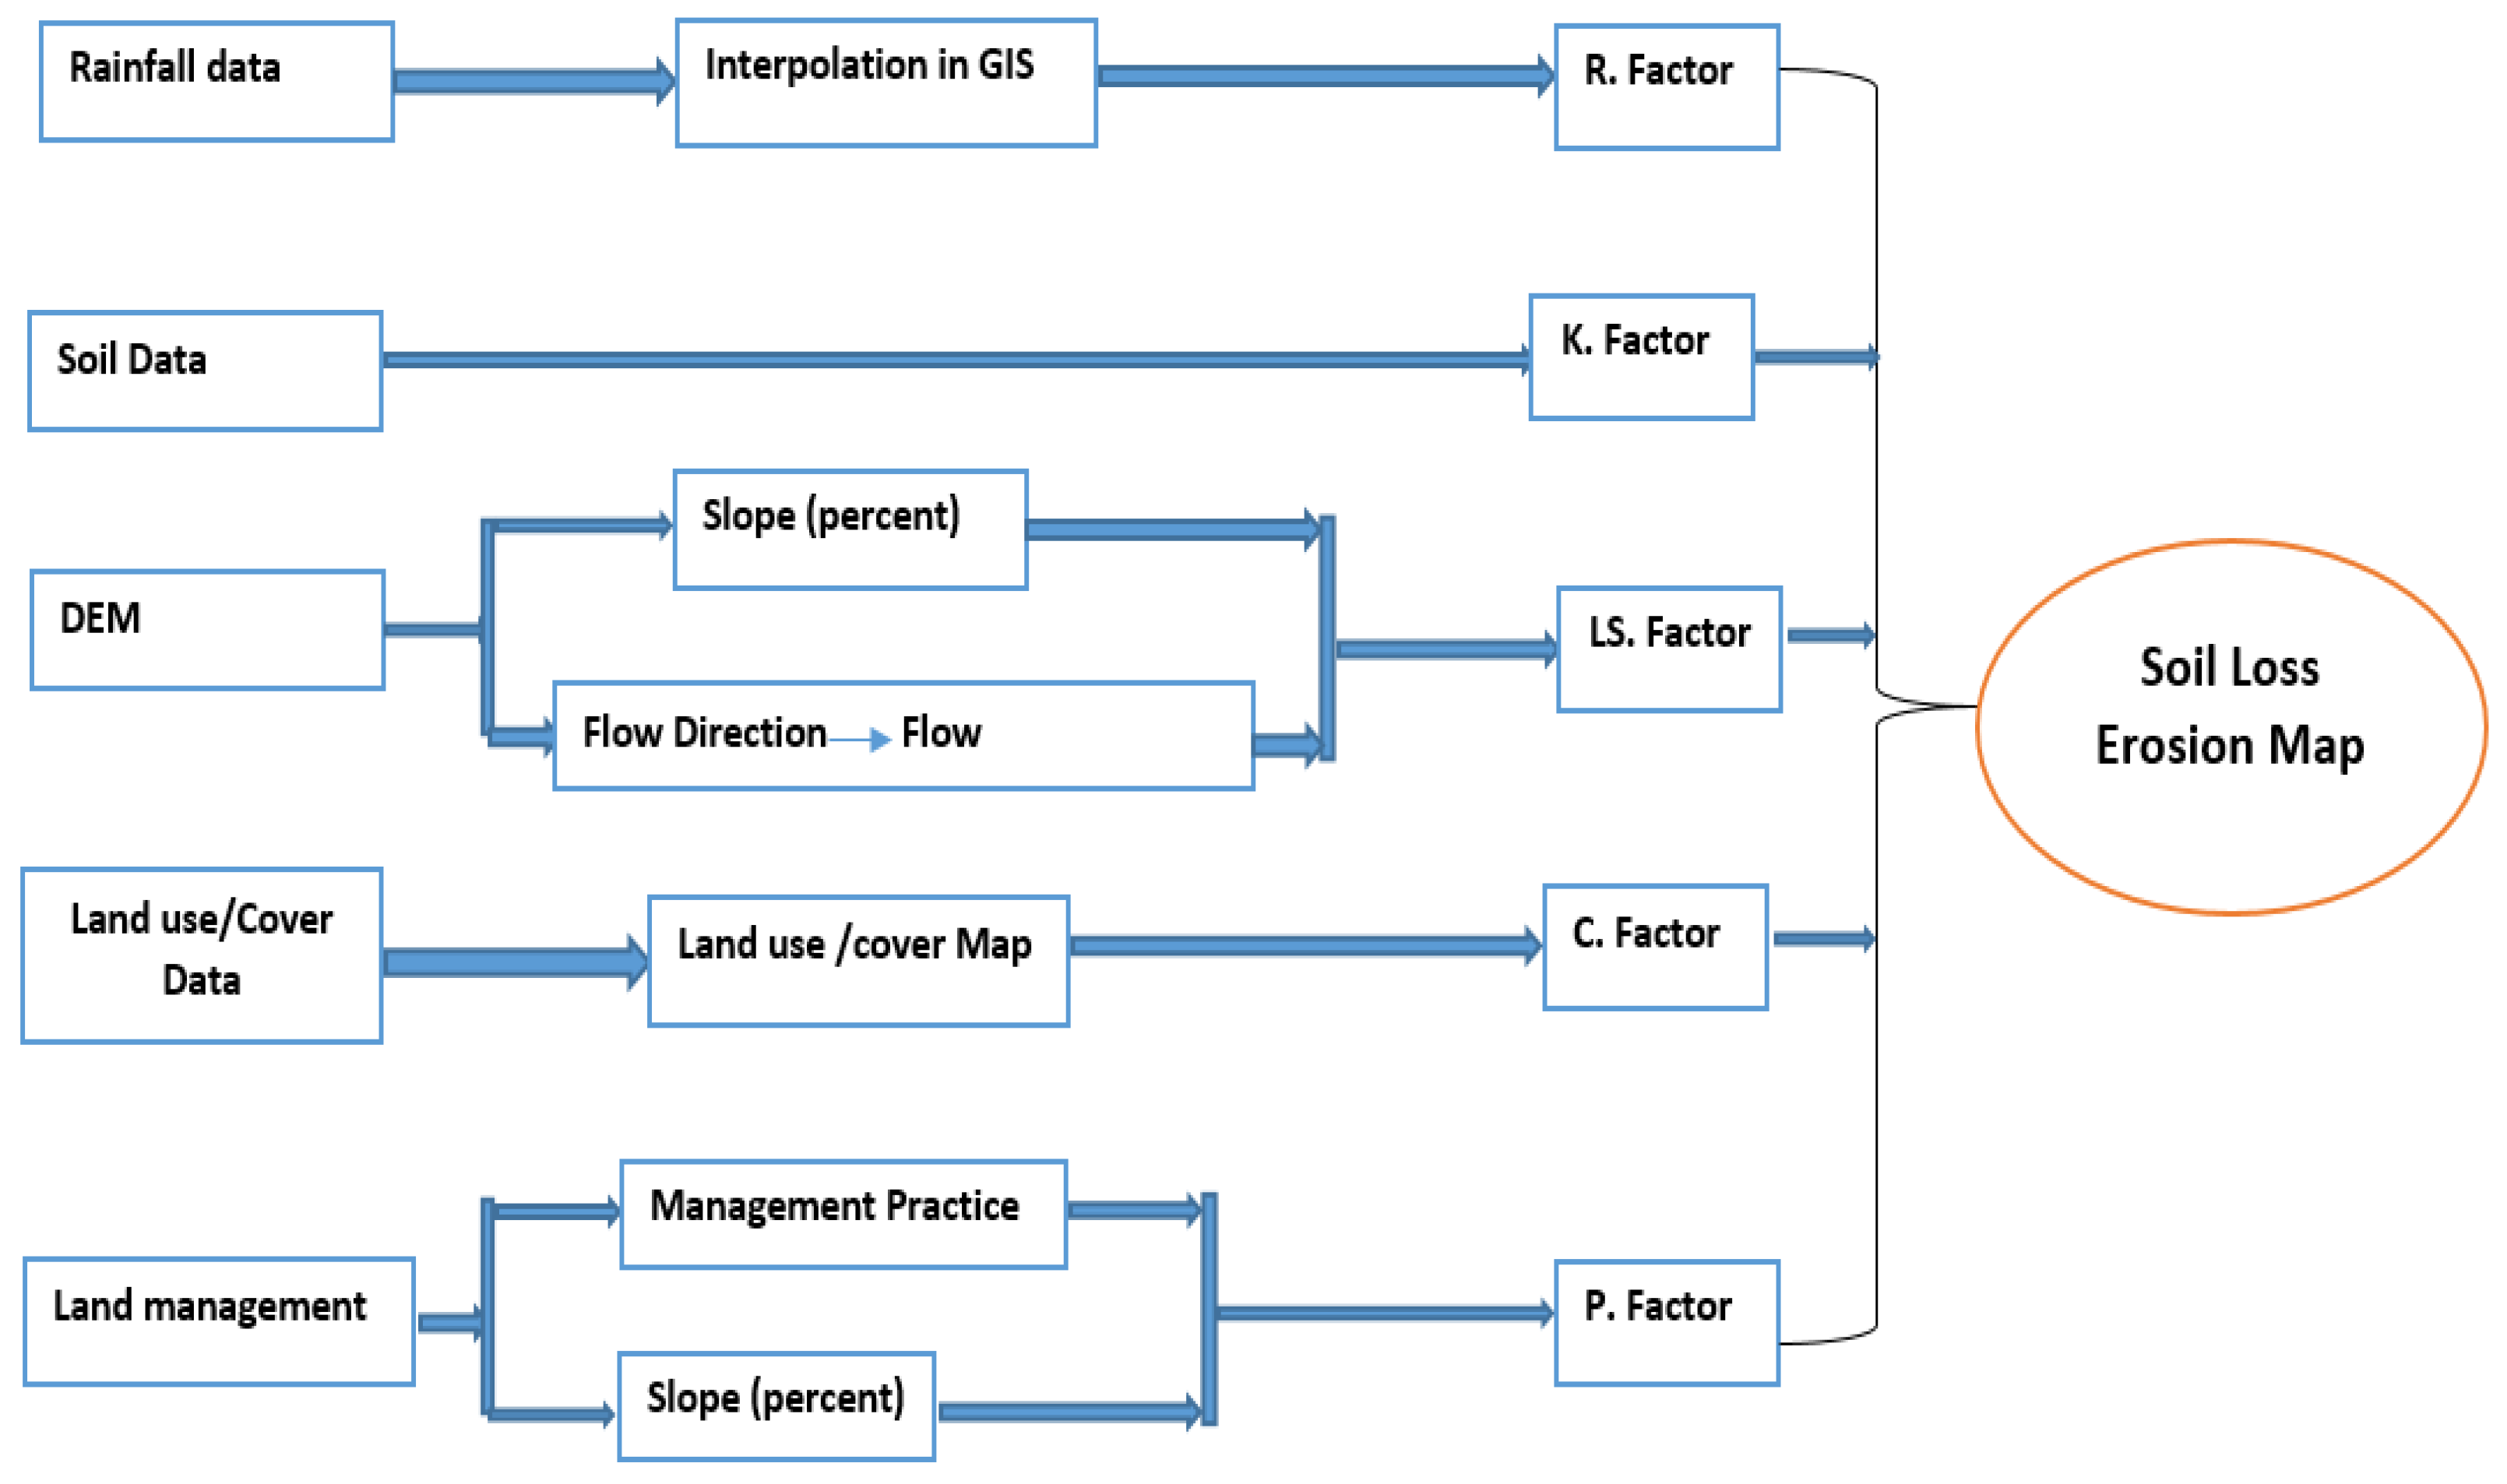
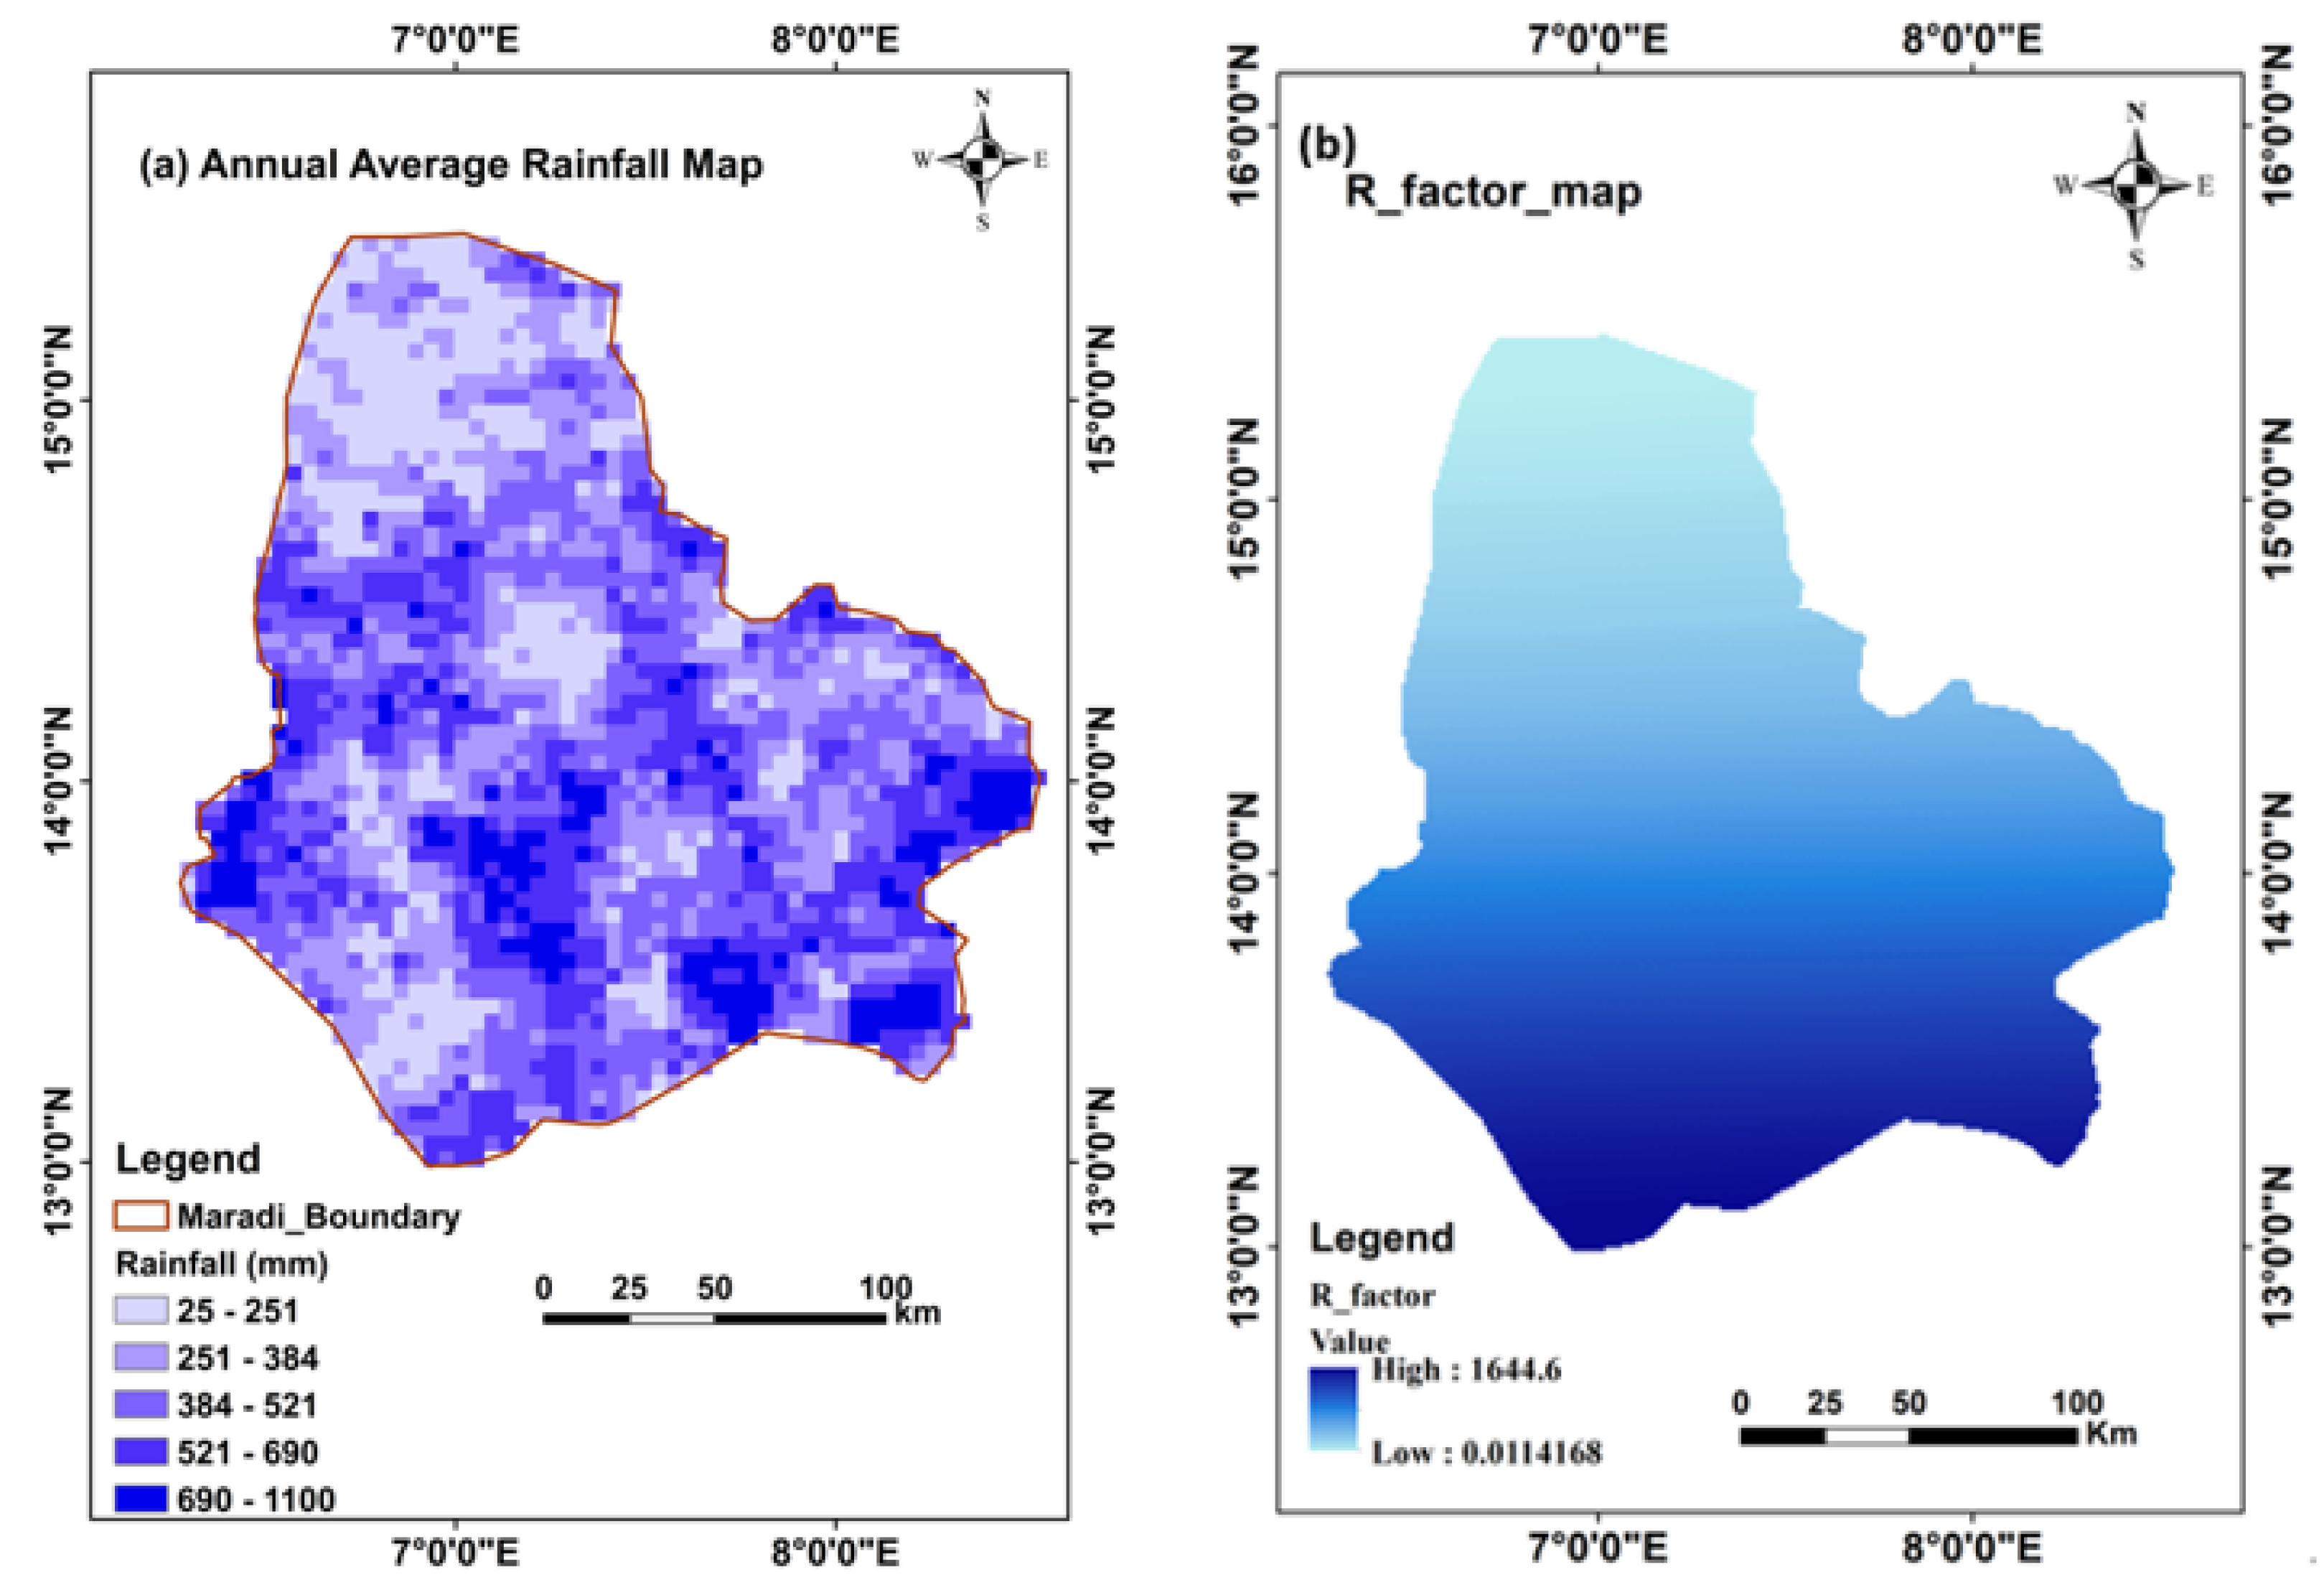
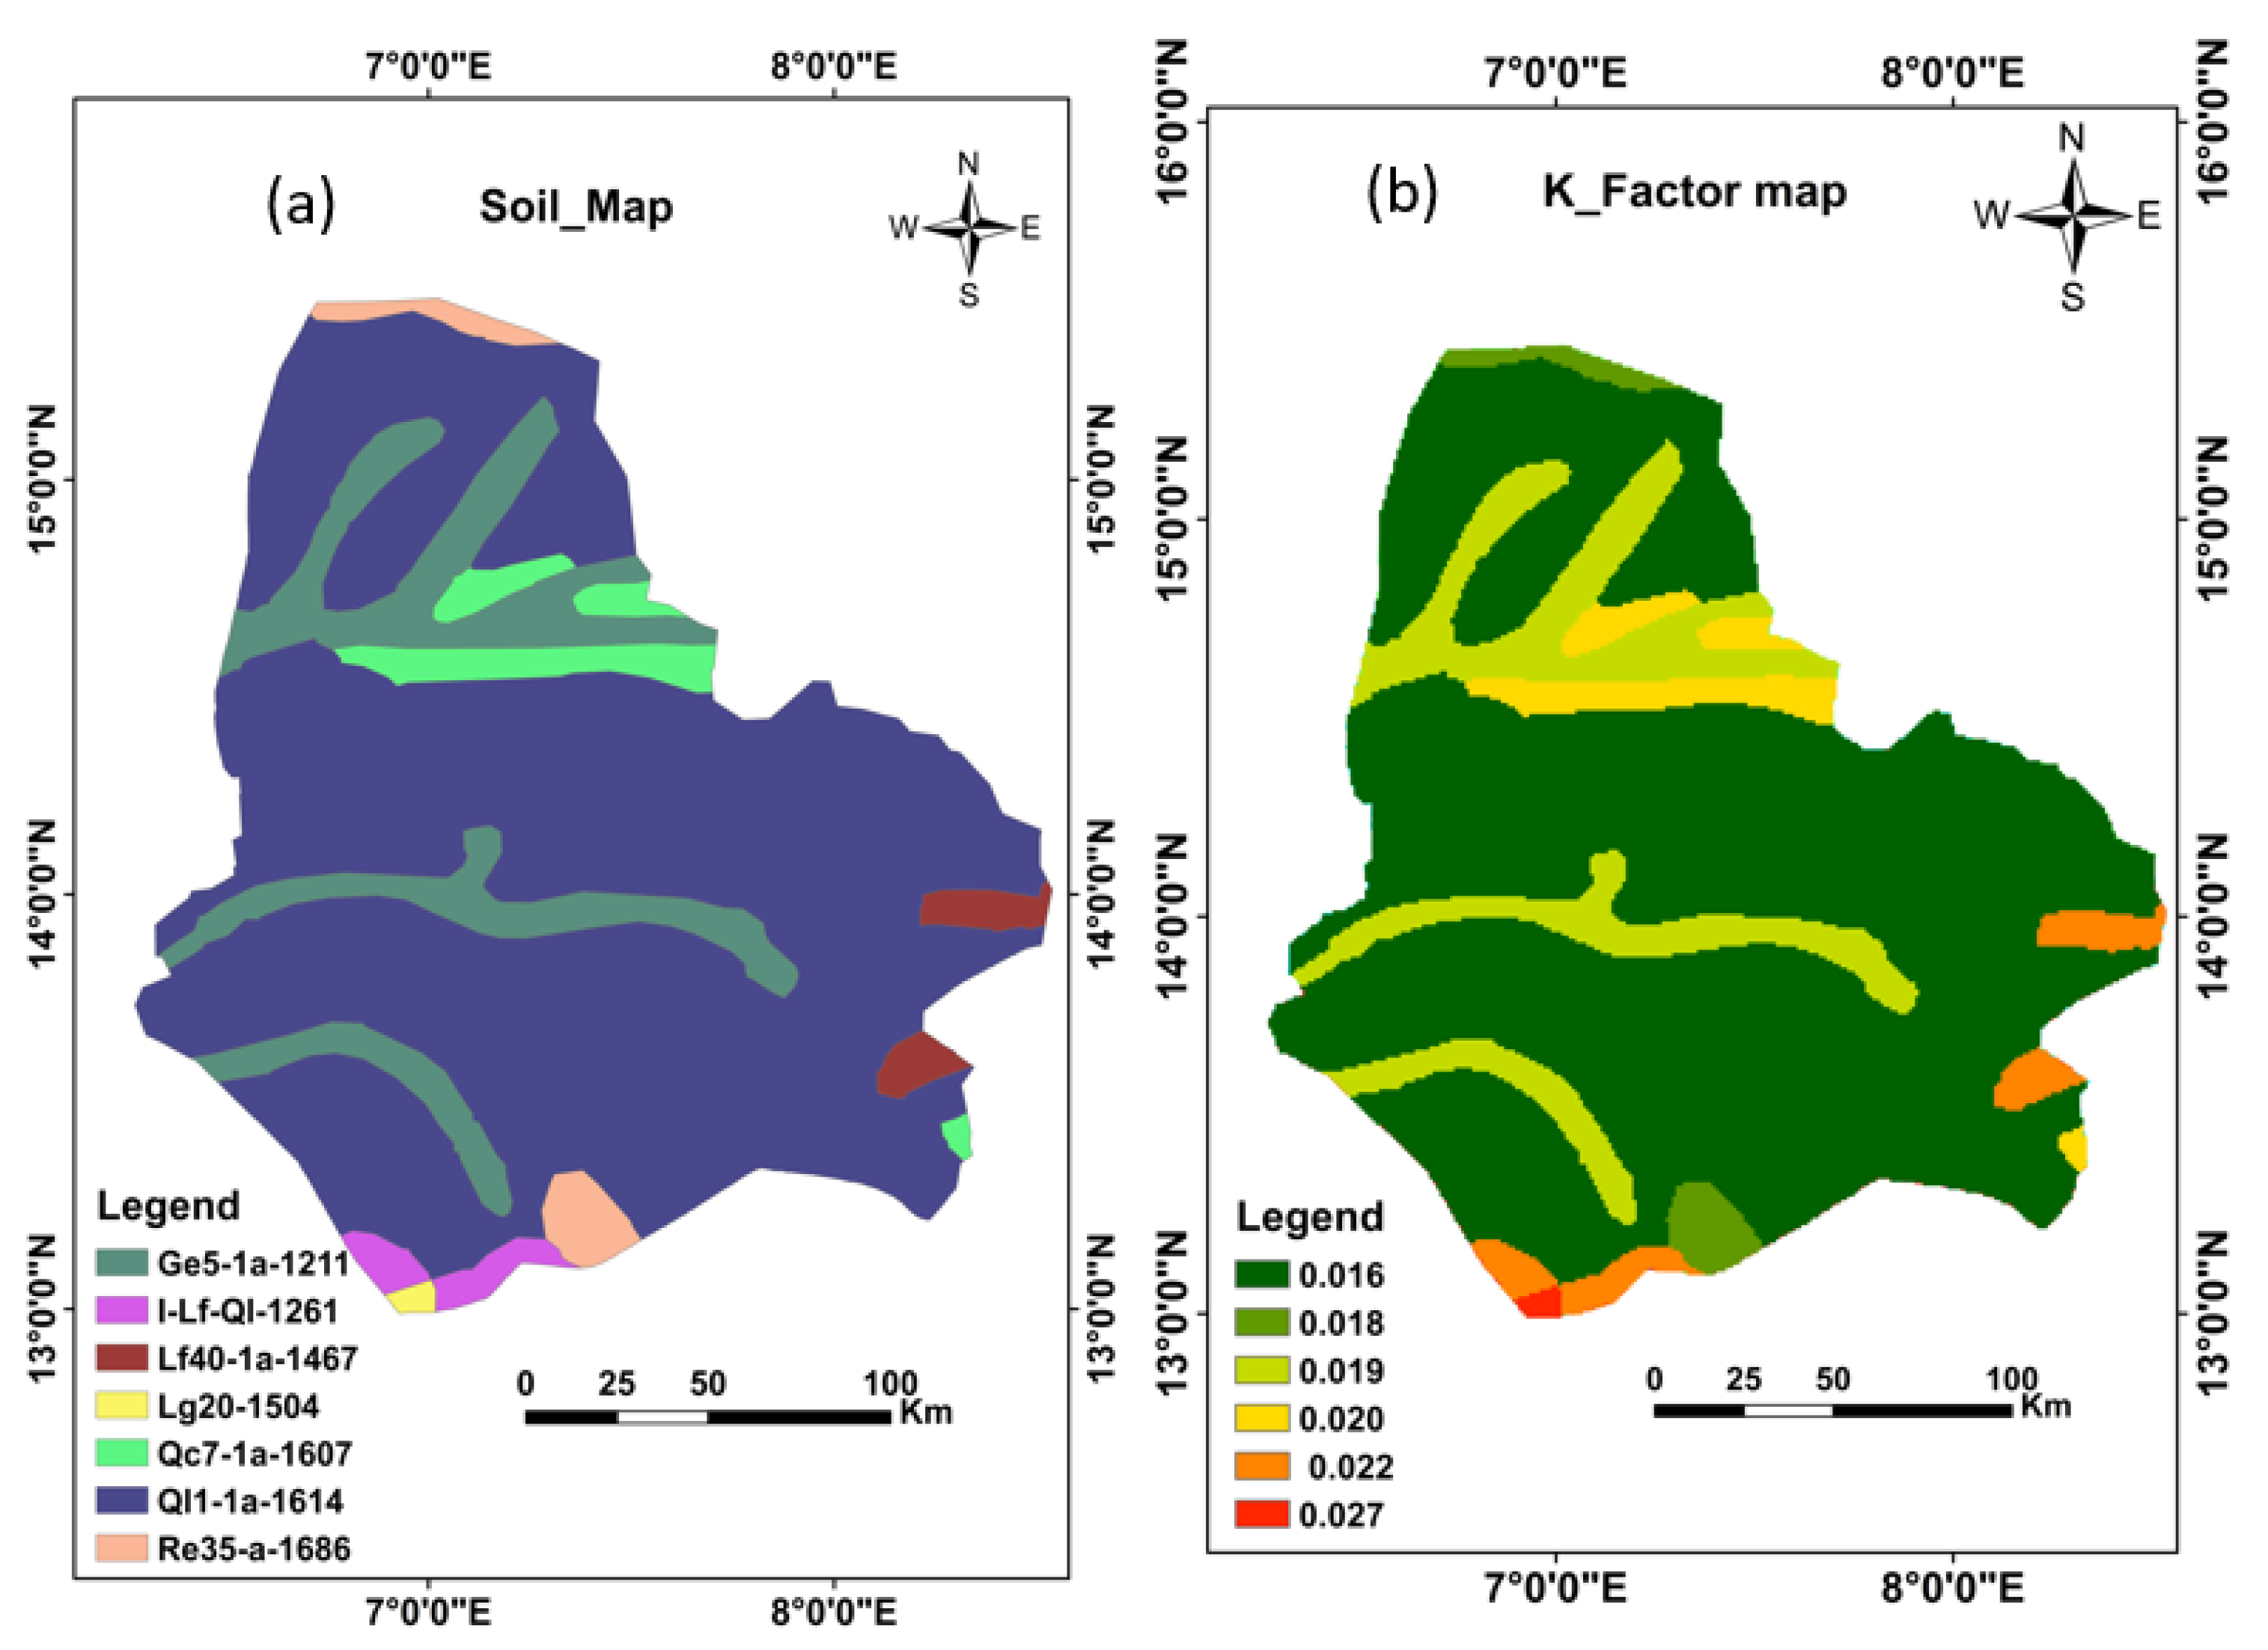
2.2. Data Source Processing
2.3. Limitations and Uncertainties
3. Results and Discussion
3.1. Soil Loss Rate Assessment
3.2. Estimation of Potential Soil Erosion
4. Conclusions and Recommendations
Author Contributions
Funding
Institutional Review Board Statement
Informed Consent Statement
Data Availability Statement
Acknowledgments
Conflicts of Interest
References
- Huang, X.; Liu, J.; Zhang, Z.; Fang, G.; Chen, Y. Assess River Embankment Impact on Hydrologic Alterations and Floodplain Vegetation. Ecol. Indic. 2019, 97, 372–379. [Google Scholar] [CrossRef]
- Maqsoom, A.; Aslam, B.; Hassan, U.; Kazmi, Z.A.; Sodangi, M.; Tufail, R.F.; Farooq, D. Geospatial Assessment of Soil Erosion Intensity and Sediment Yield Using the Revised Universal Soil Loss Equation (RUSLE) Model. ISPRS Int. J. Geo-Inf. 2020, 9, 356. [Google Scholar] [CrossRef]
- Ping, Z.; Yajin, G.E.; JIANG, Y.; Yanan, X.I.E.; Zhiwen, S.I.; Hainan, Y.; Hong-Yuan, H.U.O.; Junchuan, Y.U.; Guanyuan, W.E.I. Assessment of Soil Erosion by the RUSLE Model Using Remote Sensing and GIS: A Case Study of Jilin Province of China. Preprints 2020. [Google Scholar] [CrossRef]
- Sun, L.; Wan, S.; Luo, W. Biochars Prepared from Anaerobic Digestion Residue, Palm Bark, and Eucalyptus for Adsorption of Cationic Methylene Blue Dye: Characterization, Equilibrium, and Kinetic Studies. Bioresour. Technol. 2013, 140, 406–413. [Google Scholar] [CrossRef]
- Gao, J. Wetland and Its Degradation in the Yellow River Source Zone. In Landscape and Ecosystem Diversity, Dynamics and Management in the Yellow River Source Zone; Springer: Berlin, Germany, 2016; pp. 209–232. [Google Scholar]
- Boakye, E.; Anyemedu, F.O.K.; Donkor, E.A.; Quaye-Ballard, J.A. Spatial Distribution of Soil Erosion and Sediment Yield in the Pra River Basin. SN Appl. Sci. 2020, 2, 320. [Google Scholar] [CrossRef] [Green Version]
- Grepperud, S. Soil Conservation and Governmental Policies in Tropical Areas: Does Aid Worsen the Incentives for Arresting Erosion? Agric. Econ. J. Int. Assoc. Agric. Econ. 1995, 12, 129–140. [Google Scholar]
- Dabral, P.P.; Baithuri, N.; Pandey, A. Soil Erosion Assessment in a Hilly Catchment of North Eastern India Using USLE, GIS and Remote Sensing. Water Resour Manag. 2008, 22, 1783–1798. [Google Scholar] [CrossRef]
- Latrubesse, E.M.; Arima, E.Y.; Dunne, T.; Park, E.; Baker, V.R.; d’Horta, F.M.; Wight, C.; Wittmann, F.; Zuanon, J.; Baker, P.A.; et al. Damming the Rivers of the Amazon Basin. Nature 2017, 546, 363–369. [Google Scholar] [CrossRef]
- Wiedmann, T.; Lenzen, M.; Keyßer, L.T.; Steinberger, J.K. Scientists’ Warning on Affluence. Nat. Commun. 2020, 11, 3107. [Google Scholar] [CrossRef]
- Hoyos, N. Spatial Modeling of Soil Erosion Potential in a Tropical Watershed of the Colombian Andes. Catena 2005, 63, 85–108. [Google Scholar] [CrossRef]
- Pandey, A.; Mathur, A.; Mishra, S.K.; Mal, B.C. Soil Erosion Modeling of a Himalayan Watershed Using RS and GIS. Env. Earth Sci. 2009, 59, 399–410. [Google Scholar] [CrossRef]
- Prasannakumar, V.; Vijith, H.; Abinod, S.; Geetha, N. Estimation of Soil Erosion Risk within a Small Mountainous Sub-Watershed in Kerala, India, Using Revised Universal Soil Loss Equation (RUSLE) and Geo-Information Technology. Geosci. Front. 2012, 3, 209–215. [Google Scholar] [CrossRef] [Green Version]
- Ullah, S.; Ali, A.; Iqbal, M.; Javid, M.; Imran, M. Geospatial Assessment of Soil Erosion Intensity and Sediment Yield: A Case Study of Potohar Region, Pakistan. Environ. Earth Sci. 2018, 77, 705. [Google Scholar] [CrossRef]
- Zhao, F.; Wu, Y.; Qiu, L.; Sun, Y.; Sun, L.; Li, Q.; Niu, J.; Wang, G. Parameter Uncertainty Analysis of the SWAT Model in a Mountain-Loess Transitional Watershed on the Chinese Loess Plateau. Water 2018, 10, 690. [Google Scholar] [CrossRef] [Green Version]
- Sidi Almouctar, M.A.; Wu, Y.; Kumar, A.; Zhao, F.; Mambu, K.J.; Sadek, M. Spatiotemporal Analysis of Vegetation Cover Changes around Surface Water Based on NDVI: A Case Study in Korama Basin, Southern Zinder, Niger. Appl. Water Sci. 2020, 11, 4. [Google Scholar] [CrossRef]
- Fagbohun, B.J.; Anifowose, A.Y.B.; Odeyemi, C.; Aladejana, O.O.; Aladeboyeje, A.I. GIS-Based Estimation of Soil Erosion Rates and Identification of Critical Areas in Anambra Sub-Basin, Nigeria. Model. Earth Syst. Environ. 2016, 2, 159. [Google Scholar] [CrossRef] [Green Version]
- Adediji, A.; Tukur, A.M.; Adepoju, K.A. Assessment of Revised Universal Soil Loss Equation (RUSLE) in Katsina Area, Katsina State of Nigeria Using Remote Sensing (RS) and Geographic Information System (GIS). Iran. J. Energy Environ. 2010, 1, 255–264. [Google Scholar]
- Mhangara, P.; Kakembo, V.; Lim, K.J. Soil Erosion Risk Assessment of the Keiskamma Catchment, South Africa Using GIS and Remote Sensing. Environ. Earth Sci. 2012, 65, 2087–2102. [Google Scholar] [CrossRef]
- Ravi, K.K.; Asadi, S.S.; Venkata Ratnam, K. Estimation of Soil Erosion Status for Land Resources Management Using Remote Sensing and GIS: A Model Study from A.P. Int. J. Mech. Eng. Technol. 2017, 8, 873–880. [Google Scholar]
- Atoma, H.; Suryabhagavan, K.V.; Balakrishnan, M. Soil Erosion Assessment Using RUSLE Model and GIS in Huluka Watershed, Central Ethiopia. Sustain. Water Resour. Manag. 2020, 6, 12. [Google Scholar] [CrossRef]
- Hurni, H. Land Degradation, Famine and Resource Scenarios in Ethiopia. In World Soil Erosion and Conservation; Pimentel, D., Ed.; Cambridge University Press: Cambridge, UK, 1993; pp. 27–62. [Google Scholar] [CrossRef]
- Maina, C.W.; Sang, J.K.; Raude, J.M.; Mutua, B.M.; Moriasi, D.N. Sediment Distribution and Accumulation in Lake Naivasha, Kenya over the Past 50 Years. Lakes Amp. Reserv. 2019, 24, 162–172. [Google Scholar] [CrossRef]
- Iradukunda, P.; Bwambale, E. Reservoir Sedimentation and Its Effect on Storage Capacity–A Case Study of Murera Reservoir, Kenya. Cogent Eng. 2021, 8, 1917329. [Google Scholar] [CrossRef]
- Kastridis, A.; Kamperidou, V. Influence of Land Use Changes on Alleviation of Volvi Lake Wetland (North Greece). Soil Water Res. 2016, 10, 121–129. [Google Scholar] [CrossRef] [Green Version]
- Parveen, R.; Kumar, U. Integrated Approach of Universal Soil Loss Equation (USLE) and Geographical Information System (GIS) for Soil Loss Risk Assessment in Upper South Koel Basin, Jharkhand. J. Geogr. Inf. Syst. 2012, 4, 588–596. [Google Scholar] [CrossRef] [Green Version]
- Yeshaneh, G.T. Assessment of Soil Fertility Variation in Different Land Uses and Management Practices in Maybar Watershed, South Wollo Zone, North Ethiopia. Int. J. Environ. Bioremedi. Biodegrad. 2015, 3, 15–22. [Google Scholar]
- Chen, S.; Zha, X. Evaluation of Soil Erosion Vulnerability in the Zhuxi Watershed, Fujian Province, China. Nat. Hazards 2016, 82, 1589–1607. [Google Scholar] [CrossRef]
- Molla, T.; Sisheber, B. Estimating Soil Erosion Risk and Evaluating Erosion Control Measures for Soil Conservation Planning at Koga Watershed in the Highlands of Ethiopia. Solid Earth 2017, 8, 13. [Google Scholar] [CrossRef] [Green Version]
- Wynants, M.; Kelly, C.; Mtei, K.; Munishi, L.; Patrick, A.; Rabinovich, A.; Nasseri, M.; Gilvear, D.; Roberts, C.N.; Boeckx, P. Drivers of Increased Soil Erosion in East Africa’s Agro-Pastoral Systems: Changing Interactions between the Social, Economic and Natural Domains. Reg. Environ. Chang. 2019, 19, 1909–1921. [Google Scholar] [CrossRef] [Green Version]
- Brath, A.; Castellarin, A.; Montanari, A. Assessing the Effects of Land-Use Changes on Annual Average Gross Erosion. Hydrol. Earth Syst. Sci. 2002, 6, 255–265. [Google Scholar] [CrossRef]
- Ganasri, B.P.; Ramesh, H. Assessment of Soil Erosion by RUSLE Model Using Remote Sensing and GIS - A Case Study of Nethravathi Basin. Geosci. Front. 2016, 7, 953–961. [Google Scholar] [CrossRef] [Green Version]
- Fu, B.; Wang, S.; Liu, Y.; Liu, J.; Liang, W.; Miao, C. Hydrogeomorphic Ecosystem Responses to Natural and Anthropogenic Changes in the Loess Plateau of China. Annu. Rev. Earth Planet. Sci. 2017, 45, 223–243. [Google Scholar] [CrossRef]
- Tadesse, L.; Suryabhagavan, K.V.; Sridhar, G.; Legesse, G. Land Use and Land Cover Changes and Soil Erosion in Yezat Watershed, North Western Ethiopia. Int. Soil Water Conserv. Res. 2017, 5, 85–94. [Google Scholar] [CrossRef] [Green Version]
- El Jazouli, A.; Barakat, A.; Khellouk, R.; Rais, J.; El Baghdadi, M. Remote Sensing and GIS Techniques for Prediction of Land Use Land Cover Change Effects on Soil Erosion in the High Basin of the Oum Er Rbia River (Morocco). Remote. Sens. Appl. Soc. Environ. 2019, 13, 361–374. [Google Scholar] [CrossRef]
- Renard, K.G.; Foster, G.R.; Weesies, G.A.; McCool, D.K.; Yoder, D.C. Predicting Soil Erosion by Water: A Guide to Conservation Planning with the Revised Universal Soil Loss Equation (RUSLE); United States Government Printing: Washington, DC, USA, 1997. [Google Scholar]
- Kefi, M.; Yoshino, K.; City, T. Evaluation of the Economic Effects of Soil Erosion Risk on Agricultural Productivity Using Remote Sensing: Case of Watershed in Tunisia. Int. Arch. Photogramm. Remote. Sens. Spat. Inf. Sci. 2010, 38, 930. [Google Scholar]
- Yoshino, K.; Ishioka, Y. Guidelines for Soil Conservation towards Integrated Basin Management for Sustainable Development: A New Approach Based on the Assessment of Soil Loss Risk Using Remote Sensing and GIS. Paddy Water Env. 2005, 3, 235–247. [Google Scholar] [CrossRef]
- Hacısalihoglu, S.; Oktan, E.; Yucesan, Z. Predicting Soil Erosion in Oriental Spruce (Picea Orientalis (L.) Link.) Stands in Eastern Black Sea Region of Turkey. Afr. J. Agric. Res. 2010, 5, 2200–2214. [Google Scholar]
- Leh, M.; Bajwa, S.; Chaubey, I. Impact of Land Use Change on Erosion Risk: An Integrated Remote Sensing, Geographic Information System and Modeling Methodology. Land Degrad. Dev. 2013, 24, 409–421. [Google Scholar] [CrossRef]
- Kefi, M.; Yoshino, K.; Zayani, K.; Isoda, H. Estimation of Soil Loss by Using Combination of Erosion Model and GIS. Case Study Watersheds Tunis. J. Arid Land Stud. 2009, 19, 287–290. [Google Scholar]
- Anache, J.A.A.; Bacchi, C.G.V.; Panachuki, E.; Sobrinho, T.A. Assessment of Methods for Predicting Soil Erodibility in Soil Loss Modeling. Geociências 2016, 34, 32–40. [Google Scholar]
- Chappell, A.; Warren, A.; Taylor, N.; Charlton, M. Soil flux (loss and gain) in southwestern Niger and its agricultural impact. Land Degrad. Dev. 1998, 9, 295–310. [Google Scholar] [CrossRef]
- Panagos, P.; Meusburger, K.; Alewell, C.; Montanarella, L. Soil Erodibility Estimation Using LUCAS Point Survey Data of Europe. Environ. Model. Softw. 2012, 30, 143–145. [Google Scholar] [CrossRef]
- Bonilla, C.A.; Johnson, O.I. Soil Erodibility Mapping and Its Correlation with Soil Properties in Central Chile. Geoderma 2012, 189, 116–123. [Google Scholar] [CrossRef]
- Boggs, G.; Devonport, C.; Evans, K.; Puig, P. GIS-Based Rapid Assessment of Erosion Risk in a Small Catchment in the Wet/Dry Tropics of Australia. Land Degrad. Dev. 2001, 12, 417–434. [Google Scholar] [CrossRef]
- Van Remortel, R.D.; Hamilton, M.E.; Hickey, R.J. Estimating the LS Factor for RUSLE through Iterative Slope Length Processing of Digital Elevation Data within Arclnfo Grid. Cartography 2001, 30, 27–35. [Google Scholar] [CrossRef]
- Fan, J.R.; Zhang, J.H.; Zhong, X.H.; Liu, S.Z.; Tao, H.P. Monitoring of Soil Erosion and Assessment for Contribution of Sediments to Rivers in a Typical Watershed of the Upper Yangtze River Basin. Land Degrad. Dev. 2004, 15, 411–421. [Google Scholar] [CrossRef]
- Tian, Y.C.; Zhou, Y.M.; Wu, B.F.; Zhou, W.F. Risk Assessment of Water Soil Erosion in Upper Basin of Miyun Reservoir, Beijing, China. Env. Geol. 2009, 57, 937–942. [Google Scholar] [CrossRef]
- Tzioutzios, C.; Kastridis, A. Multi-Criteria Evaluation (MCE) Method for the Management of Woodland Plantations in Floodplain Areas. Int. J. Geo-Inf. 2020, 9, 725. [Google Scholar] [CrossRef]
- Pangali Sharma, T.P.; Zhang, J.; Khanal, N.R.; Prodhan, F.A.; Nanzad, L.; Zhang, D.; Nepal, P. A Geomorphic Approach for Identifying Flash Flood Potential Areas in the East Rapti River Basin of Nepal. Int. J. Geo-Inf. 2021, 10, 247. [Google Scholar] [CrossRef]
- Rawat, K.S.; Mishra, A.K.; Bhattacharyya, R. Soil Erosion Risk Assessment and Spatial Mapping Using LANDSAT-7 ETM+, RUSLE, and GIS—A Case Study. Arab. J. Geosci. 2016, 9, 288. [Google Scholar] [CrossRef]
- Alhassane, A.; Chaibou, I.; Karim, S.; Soumana, I.; Mahamane, A.; Saadou, M. Flore et Structure Des Peuplements Ligneux Des Pâturages Naturels de La Région de Maradi, Niger. Afr. Sci. 2018, 14, 171–189. [Google Scholar]
- Download Data by Country|DIVA-GIS. Available online: https://www.diva-gis.org/gdata (accessed on 27 September 2021).
- FAO. Digital Soil Map of the World (DSMW)|Land & Water|Food and Agriculture Organization of the United Nations Land & Water|Food and Agriculture Organization of the United Nations. Available online: http://www.fao.org/land-water/land/land-governance/land-resources-planning-toolbox/category/details/en/c/1026564/ (accessed on 20 September 2021).
- USGS-EarthExplorer. Available online: https://earthexplorer.usgs.gov/ (accessed on 20 September 2021).
- Simpson, J.; Kummerow, C.; Tao, W.K.; Adler, R.F. On the tropical rainfall measuring mission (TRMM). Meteorol. Atmos. Phys. 1996, 60, 19–36. [Google Scholar] [CrossRef] [Green Version]
- Biswas, S.S.; Pani, P. Estimation of Soil Erosion Using RUSLE and GIS Techniques: A Case Study of Barakar River Basin, Jharkhand, India. Modeling Earth Syst. Environ. 2015, 4, 42. [Google Scholar] [CrossRef] [Green Version]
- Thapa, P. Spatial Estimation of Soil Erosion Using RUSLE Modeling: A Case Study of Dolakha District, Nepal. Env. Syst. Res. 2020, 9, 15. [Google Scholar] [CrossRef]
- Wang, B.; Zheng, F.; Guan, Y. Improved USLE-K Factor Prediction: A Case Study on Water Erosion Areas in China. Int. Soil Water Conserv. Res. 2016, 4, 168–176. [Google Scholar] [CrossRef] [Green Version]
- Belayneh, M.; Yirgu, T.; Tsegaye, D. Potential Soil Erosion Estimation and Area Prioritization for Better Conservation Planning in Gumara Watershed Using RUSLE and GIS Techniques’. Environ. Syst. Res. 2019, 8, 20. [Google Scholar] [CrossRef] [Green Version]
- Farhan, Y.; Nawaiseh, S. Spatial Assessment of Soil Erosion Risk Using RUSLE and GIS Techniques. Environ. Earth Sci. 2015, 74, 4649–4669. [Google Scholar] [CrossRef]
- Diwediga, B.; Le, Q.B.; Agodzo, S.K.; Tamene, L.D.; Wala, K. Modelling Soil Erosion Response to Sustainable Landscape Management Scenarios in the Mo River Basin (Togo, West Africa). Sci. Total. Environ. 2018, 625, 1309–1320. [Google Scholar] [CrossRef]
- Alewell, C.; Borrelli, P.; Meusburger, K.; Panagos, P. Using the USLE: Chances, Challenges and Limitations of Soil Erosion Modelling. Int. Soil Water Conserv. Res. 2019, 7, 203–225. [Google Scholar] [CrossRef]
- Yesuph, A.Y.; Dagnew, A.B. Soil Erosion Mapping and Severity Analysis Based on RUSLE Model and Local Perception in the Beshillo Catchment of the Blue Nile Basin, Ethiopia. Environ. Syst. Res. 2019, 8, 17. [Google Scholar] [CrossRef] [Green Version]
- Wischmeier, W.H.; Johnson, C.B.; Cross, B.V. Soil Erodibility Nomograph for Farmland and Construction Sites. J. Soil Water Conserv. 1971. Available online: https://trid.trb.org/view/125184 (accessed on 30 November 2021).
- Obiora-Okeke, O.A. Erosion mapping using revised universal soil loss equation model and geographic information system: A case study of Okitipupa, Nigeria. Eur. J. Eng. Technol. 2019, 7. Available online: https://www.idpublications.org/wp-content/uploads/2019/05/Full-Paper-EROSION-MAPPING-USING-REVISED-UNIVERSAL-SOIL-LOSS-EQUATION-MODEL-AND-GEOGRAPHIC-INFORMATION.pdf (accessed on 30 November 2021).
- Olorunfemi, I.E.; Komolafe, A.A.; Fasinmirin, J.T.; Olufayo, A.A.; Akande, S.O. A GIS-Based Assessment of the Potential Soil Erosion and Flood Hazard Zones in Ekiti State, Southwestern Nigeria Using Integrated RUSLE and HAND Models. Catena 2020, 194, 104725. [Google Scholar] [CrossRef]
- Wischmeier, W.H.; Smith, D.D. Predicting Rainfall Erosion Losses: A Guide to Conservation Planning; Department of Agriculture, Science and Education Administration: Corvallis, OR, USA, 1978. [Google Scholar]
- Ekwueme, O.U.; Obiora, D.N.; Okeke, F.N.; Ibuot, C. Environmental Assessment of Gully Erosion in Parts of Enugu North, Southeastern Nigeria. Indian J. Sci. Technol. 2021, 14, 2400–2409. [Google Scholar] [CrossRef]
- Uddin, K.; Murthy, M.S.R.; Wahid, S.M.; Matin, M.A. Estimation of Soil Erosion Dynamics in the Koshi Basin Using GIS and Remote Sensing to Assess Priority Areas for Conservation. PLoS ONE 2016, 11, e0150494. [Google Scholar] [CrossRef] [PubMed] [Green Version]


| No | Type of Data | Data Description | Name of the Service That Provide the Data |
|---|---|---|---|
| 1 | DEM | SRTM DEM (30 s resolution) Grid format | DIVA-GIS Satellite [54] |
| 2 | Soil Data | FAO Digital soil Map of the World (DSMW) | Food and Agriculture Organization of the United Nations [55] |
| 3 | Satellite Data | MODIS/Tera Aqua Combined land cover type yearly global 500 m SIN Grid V006 | National Aeronautics and Space Administration (NASA) [56] |
| 5 | Rainfall Data | TRMM is a mission between NASA and the Japan Aerospace Exploration Agency (JAXA) | NASA and the Japan Aerospace Exploration Agency (JAXA) [57] |
| Code No | Soil Sample | Fao Soil Classes | K-Factor Values |
|---|---|---|---|
| 1 | Ql1-1a-1614 | Luvic Arenosols | 0.016 |
| 2 | Re35-a-1686 | Eutric Regosols | 0.018 |
| 3 | Ge5-1a-1211 | Eutric Gleysols | 0.019 |
| 4 | Qc7-1a-1607 | Arenosols | 0.02 |
| 5 | Lf40-1a-1467 | Ferric Luvisols | 0.021 |
| 6 | I-Lf-Ql-1261 | Lithosols | 0.022 |
| 7 | Lg20-1504 | Gleyic Luvisols | 0.027 |
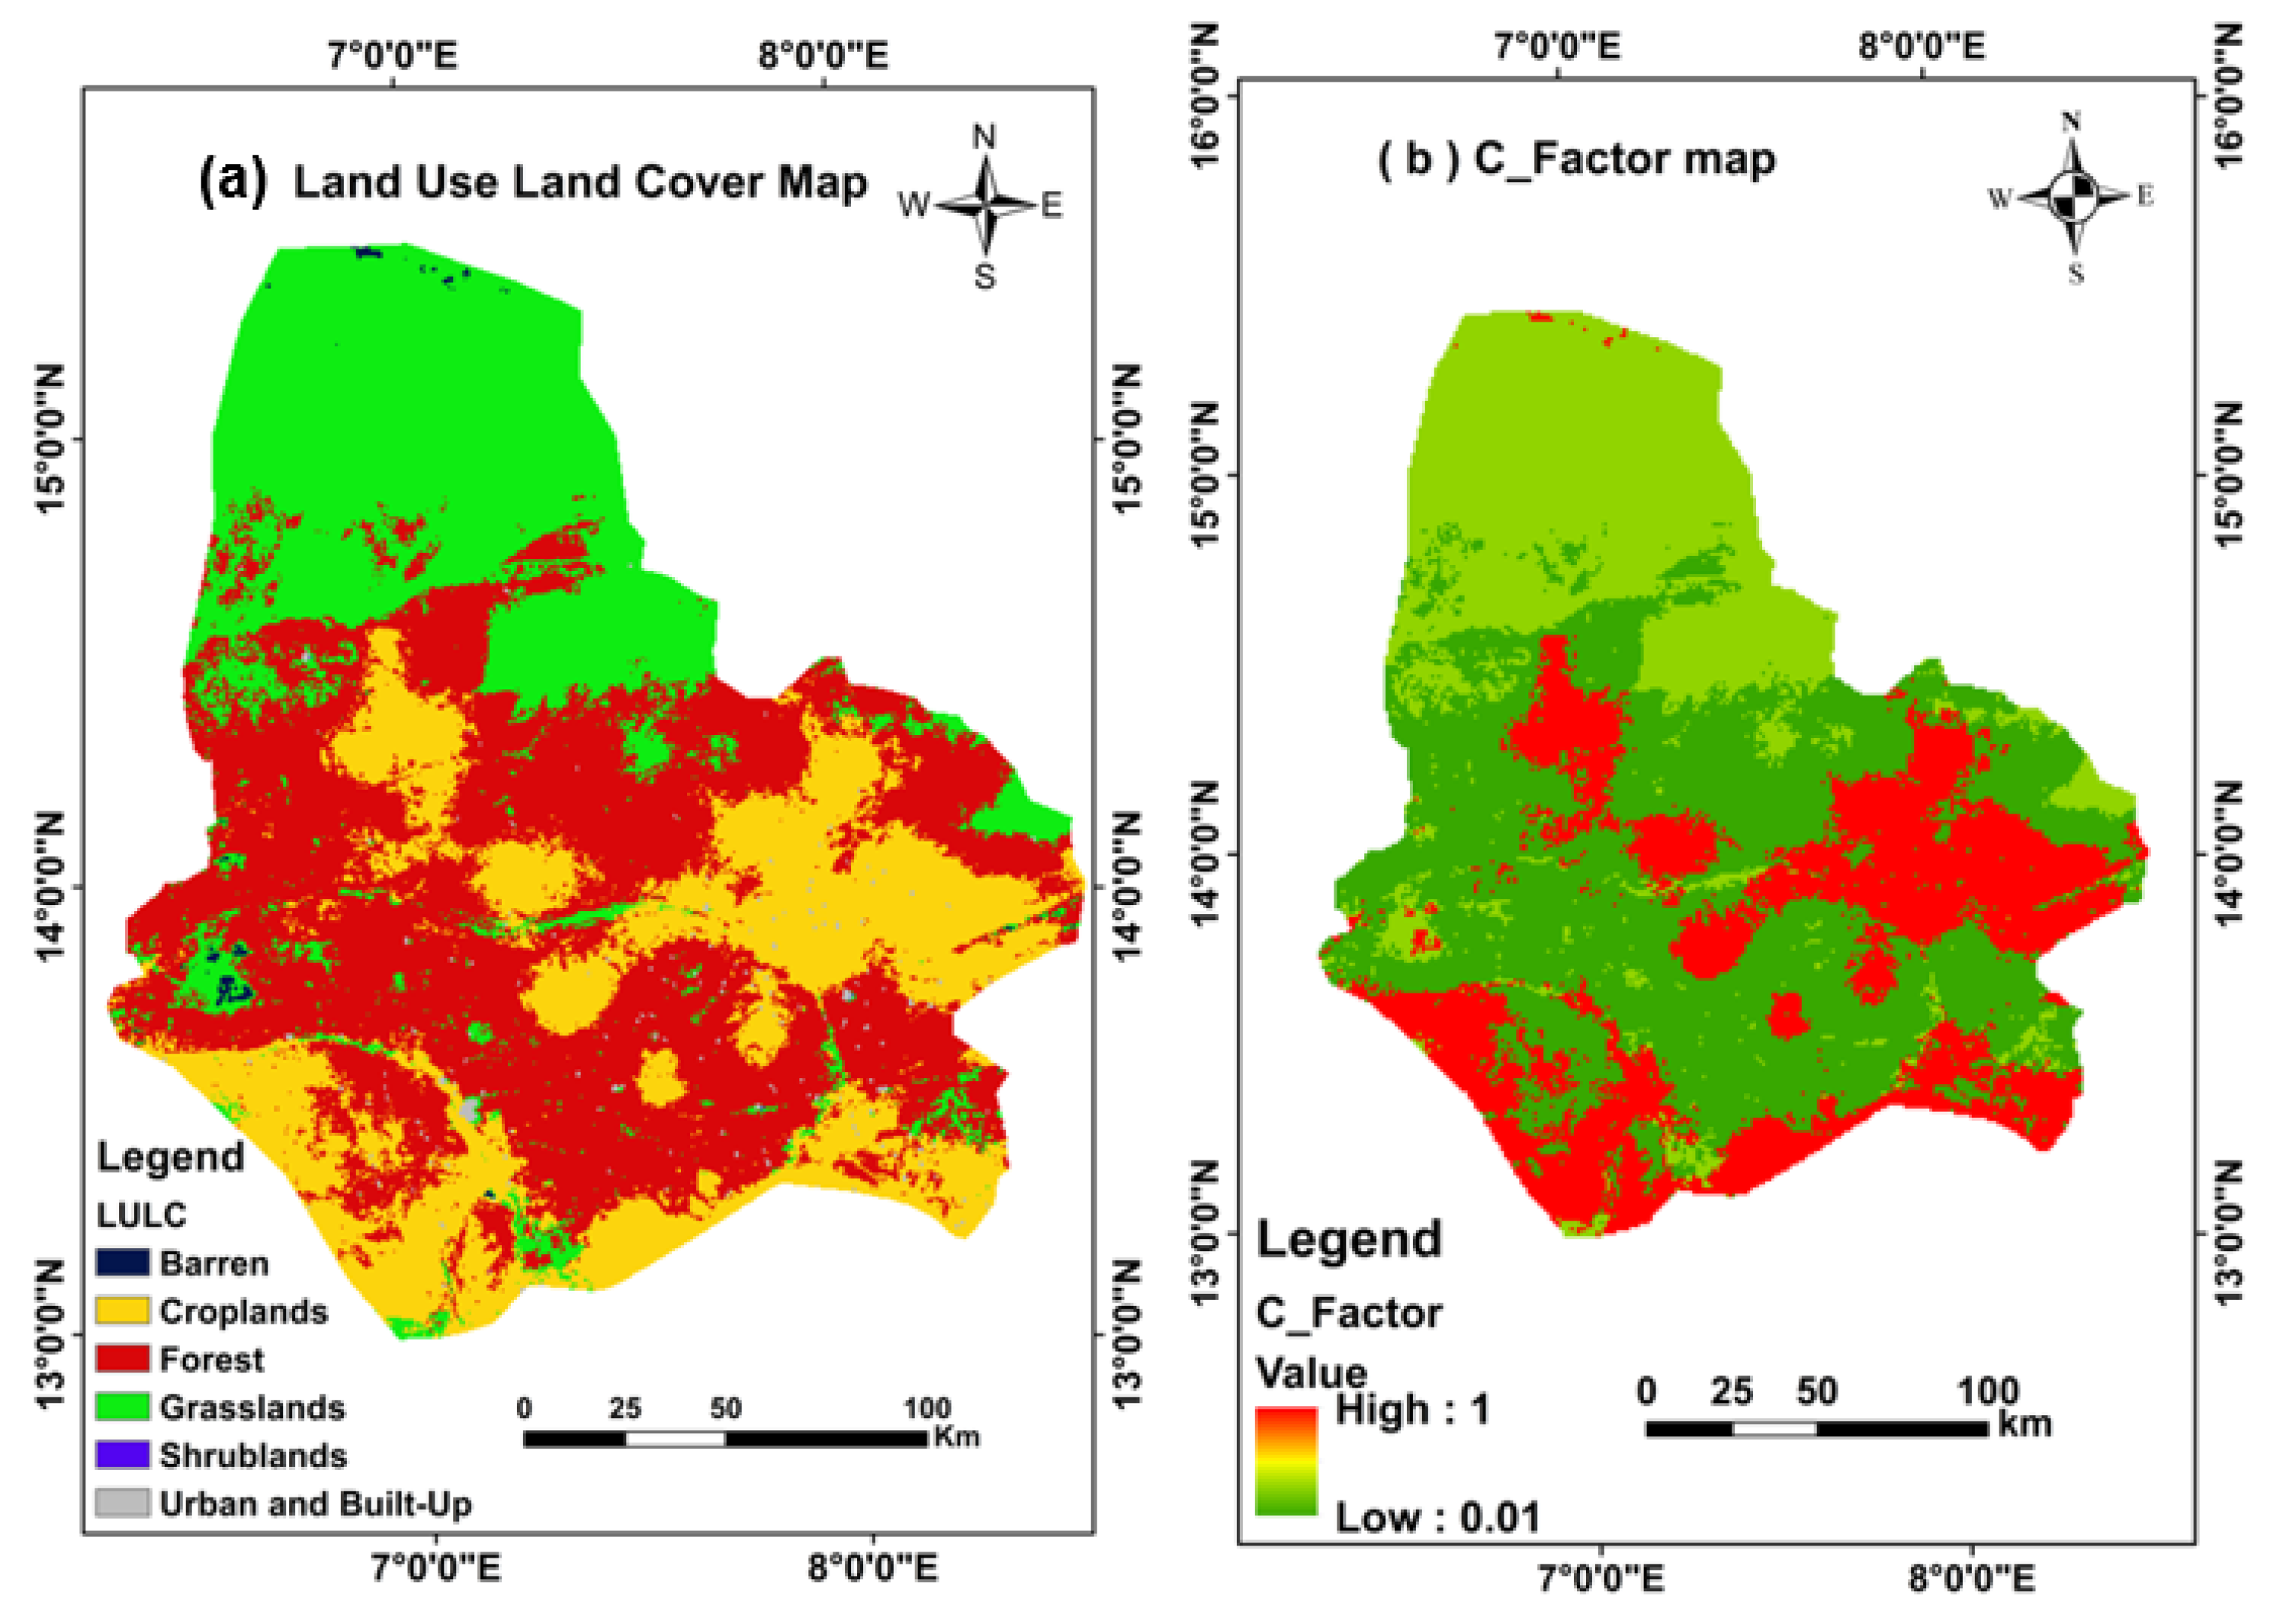
| Gridcode No | LU/LC Types | Area | C-Values |
|---|---|---|---|
| 7 | Forest | 7534.17 | 0.01 |
| 10 | Shrublands | 0.72 | 0.07 |
| 12 | Barren | 33.84 | 0.18 |
| 13 | Grasslands | 4663.8 | 0.23 |
| 14 | Croplands | 4237.47 | 0.28 |
| 16 | Urban and Built-up | 78.93 | 1 |
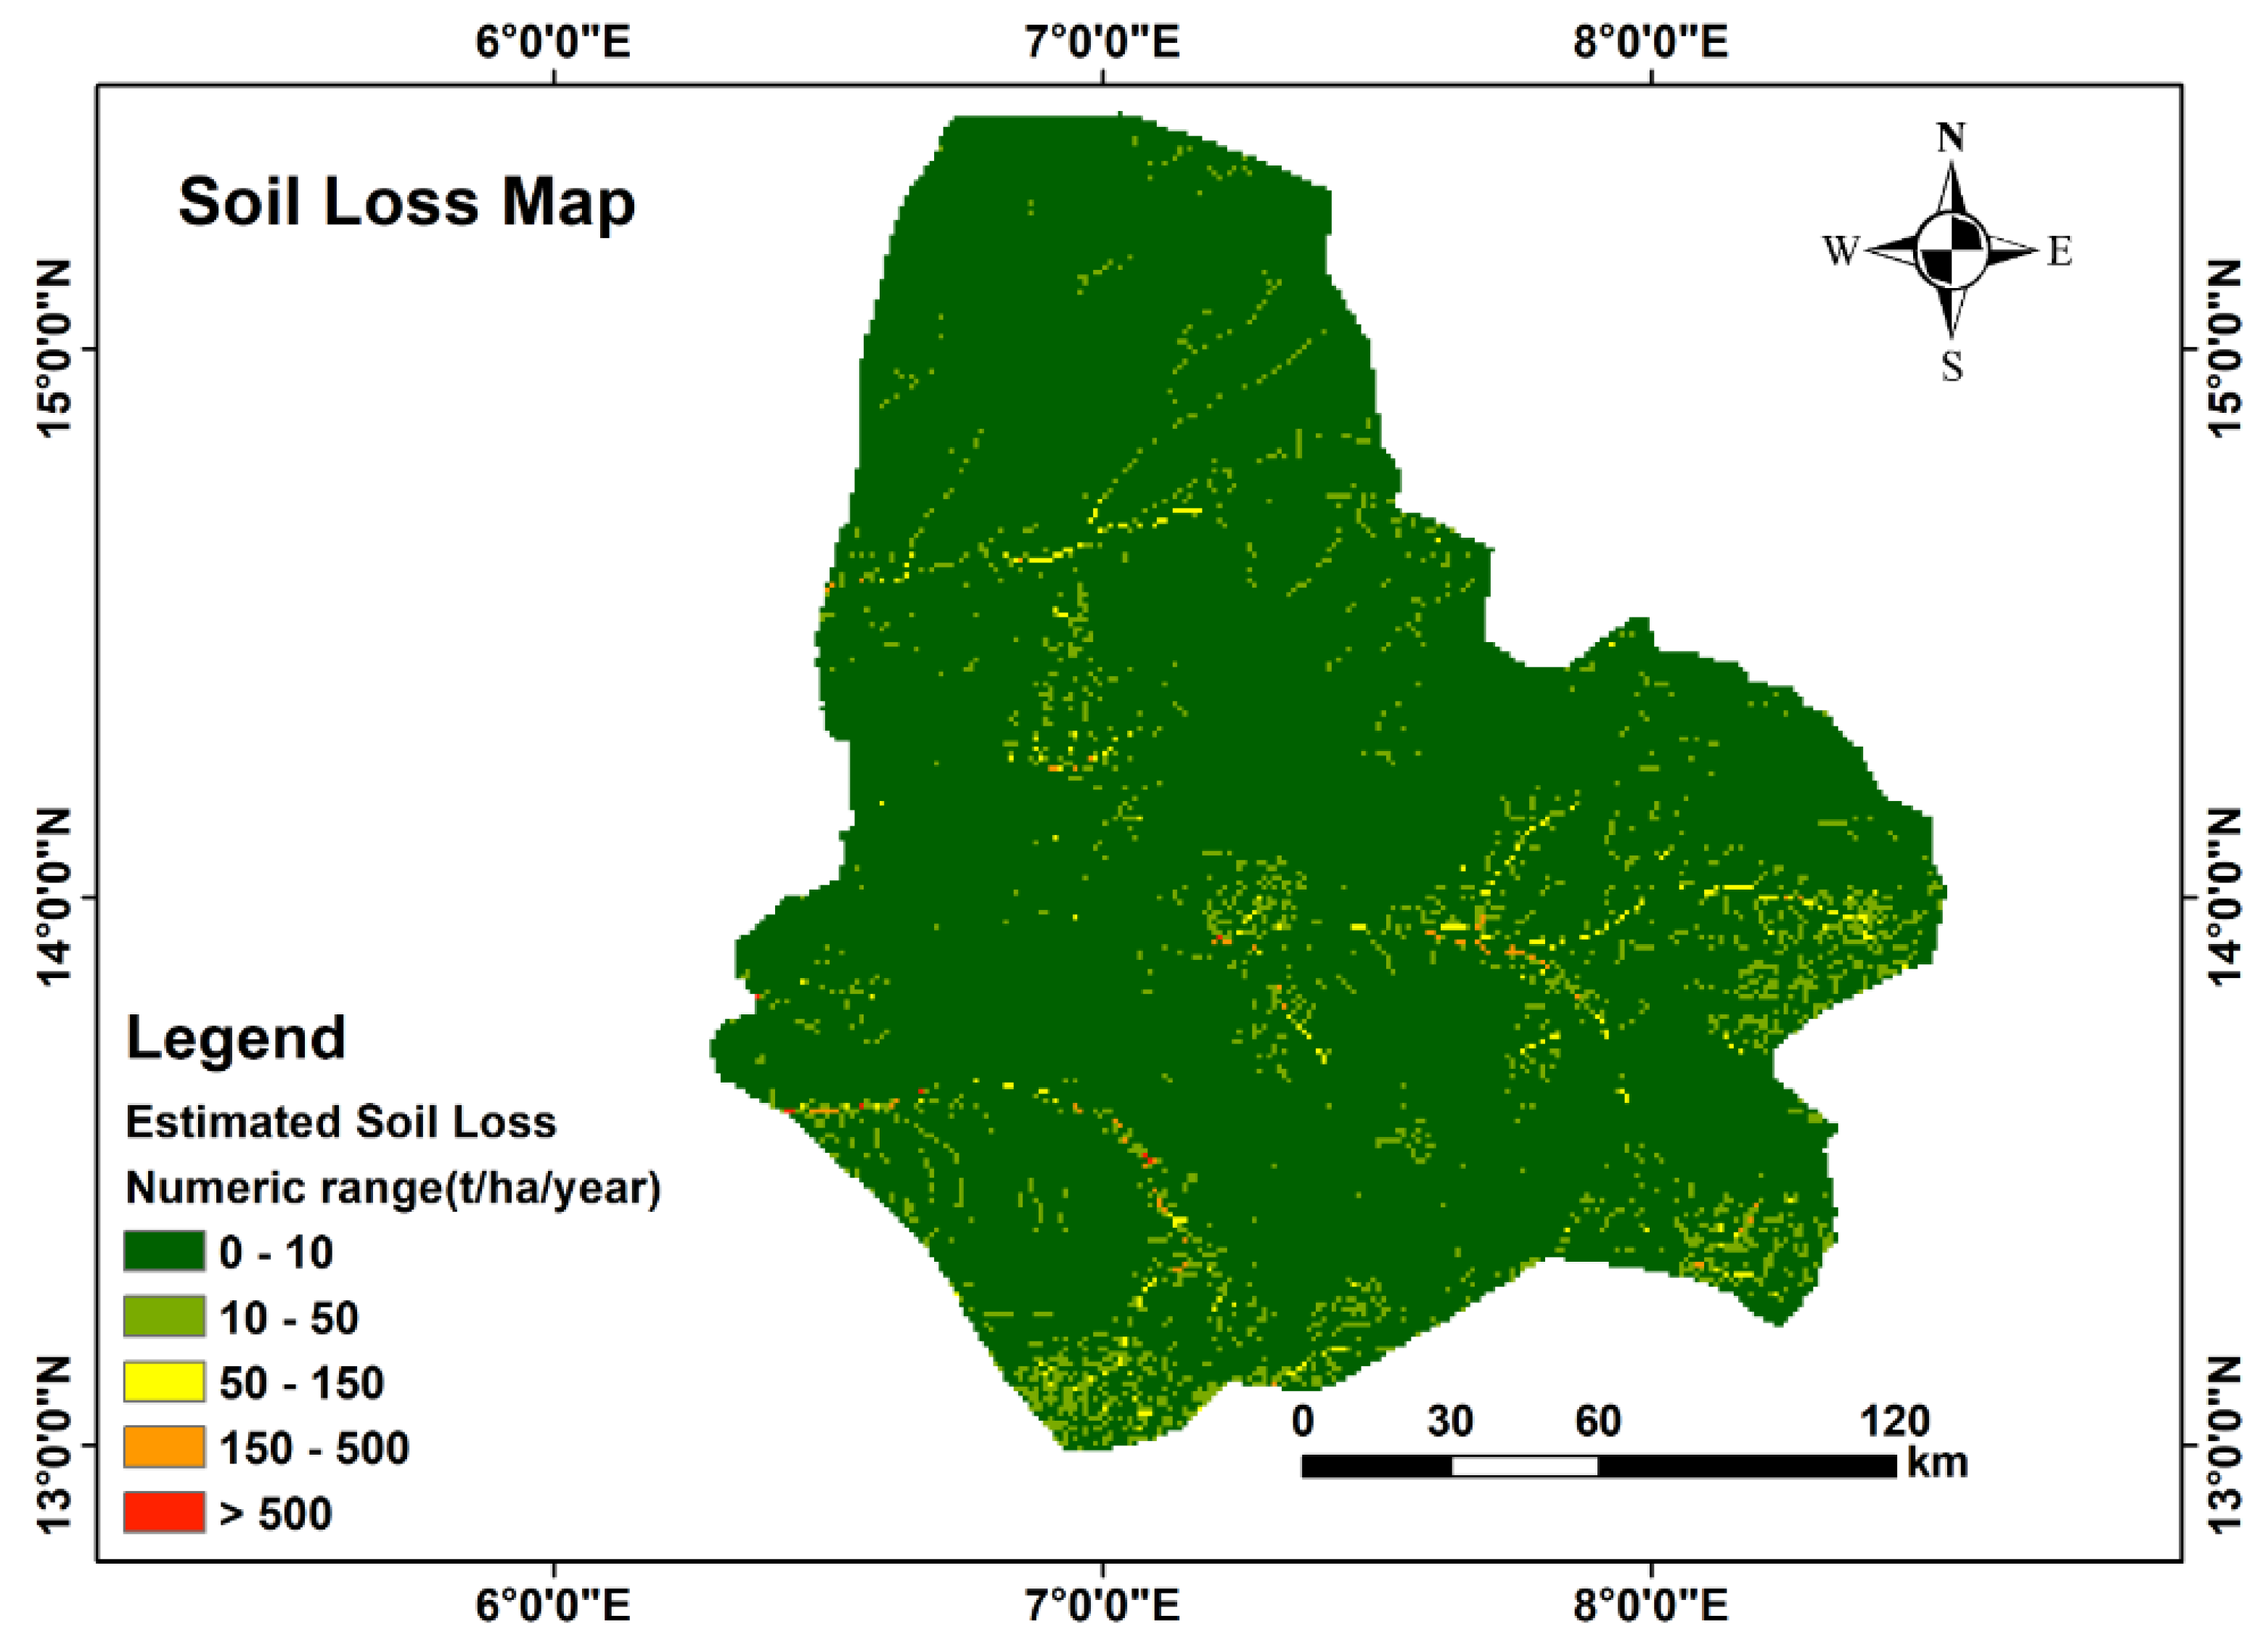
| No | Erosion Classes | Numeric Range (t/ha/year) | Soil Loss (t/year) |
|---|---|---|---|
| 1 | Low | 0–10 | 14.8 |
| 2 | Moderate | 10–50 | 85.2 |
| 3 | High | 50–150 | 237.1 |
| 4 | Very High | 150–500 | 533.5 |
| 5 | Severe | >500 | 944.9 |
Publisher’s Note: MDPI stays neutral with regard to jurisdictional claims in published maps and institutional affiliations. |
© 2021 by the authors. Licensee MDPI, Basel, Switzerland. This article is an open access article distributed under the terms and conditions of the Creative Commons Attribution (CC BY) license (https://creativecommons.org/licenses/by/4.0/).
Share and Cite
Sidi Almouctar, M.A.; Wu, Y.; Zhao, F.; Dossou, J.F. Soil Erosion Assessment Using the RUSLE Model and Geospatial Techniques (Remote Sensing and GIS) in South-Central Niger (Maradi Region). Water 2021, 13, 3511. https://doi.org/10.3390/w13243511
Sidi Almouctar MA, Wu Y, Zhao F, Dossou JF. Soil Erosion Assessment Using the RUSLE Model and Geospatial Techniques (Remote Sensing and GIS) in South-Central Niger (Maradi Region). Water. 2021; 13(24):3511. https://doi.org/10.3390/w13243511
Chicago/Turabian StyleSidi Almouctar, Mohamed Adou, Yiping Wu, Fubo Zhao, and Jacqueline Fifame Dossou. 2021. "Soil Erosion Assessment Using the RUSLE Model and Geospatial Techniques (Remote Sensing and GIS) in South-Central Niger (Maradi Region)" Water 13, no. 24: 3511. https://doi.org/10.3390/w13243511