
Subsurface Temperature Properties for Three Types of Permeable Pavements in Cold Weather Climates and Implications for Deicer Reduction


U.S. Geological Survey—Upper Midwest Water Science Center, 8505 Research Way, Middleton, WI 53562, USA
*
Author to whom correspondence should be addressed.
Water 2021, 13(24), 3513; https://doi.org/10.3390/w13243513
Submission received: 15 October 2021
/
Revised: 29 November 2021
/
Accepted: 3 December 2021
/
Published: 9 December 2021
(This article belongs to the Section Hydrology)
Abstract
:Permeable pavement has been shown to be an effective urban stormwater management tool although much is still unknown about freeze-thaw responses and the implications for deicer reduction in cold weather climates. Temperature data from the subsurface of three permeable pavement types—interlocking concrete pavers (PICP), concrete (PC), and asphalt (PA)—were collected over a seven-year period and evaluated. Temperature profiles of all pavements indicate favorable conditions to allow infiltration during winter rain and melting events, with subsurface temperatures remaining above freezing even when air temperatures were below freezing. Data show that PICP surpassed PC and PA with fewer days below freezing, higher temperatures on melt days, slower freeze and faster thaw times, and less penetration of freezing temperatures at depth.
Keywords:
permeable pavement; PICP; PC; PA; green infrastructure; deicers; temperature; infiltration; salt; chloride1. Introduction
Recent strategies in urban stormwater management have shifted from large, regional structures towards decentralized green infrastructure practices designed to reduce or delay peak flows of runoff by holding stormwater onsite, encouraging infiltration, and enhancing evapotranspiration [1]. Permeable pavement, in the form of permeable interlocking concrete pavers (PICP), pervious concrete (PC), and porous asphalt (PA), is one type of green infrastructure practice that functions like traditional pavement but simultaneously allows for treatment and management of stormwater by infiltrating runoff near its source [2]. Because of potential limitations in structural stability and support, permeable pavements are primarily used in walkways, parking lots, driveways, alleys, and low-volume residential streets. Modeling has indicated technical feasibility for some heavier duty applications [3] and model validation through full-scale load testing of PICP as well as project experience with PICP, PA, and PC has enabled expansion into street applications [4].Stormwater management goals for permeable pavement systems are often part of the design process [5], and stormwater runoff volume originating from impervious drainage areas can be significantly reduced by infiltrating through the pore spaces of a permeable pavement surface and be temporarily stored in the underlying aggregate base. For unlined permeable systems, exfiltration of stored runoff into native soils was shown to increase base flow in a nearby urban stream, indicating greater groundwater connectivity and potential water cycle rejuvenation [6,7,8]. Other studies noted how PA and PICP increased runoff lag time and decreased stormwater volume and peak flow compared to impermeable surfaces, in some cases by up to 90% [6,9,10]. Much of the volume reduction capabilities of permeable pavements can be attributed to the size of the contributing drainage area. A study of four different permeable pavements receiving only direct precipitation determined that virtually all rainwater had infiltrated through the permeable surfaces with almost no surface runoff [11]. Conversely, 16 and 32% reductions in stormwater volume were measured from two permeable pavement systems receiving runoff from catchments that were 7.2 and 2.2 times larger than the receiving permeable pavement area, respectively [12].
Permeable pavement has also been shown to be an effective tool to reduce the concentration and load of contaminants entrained in stormwater runoff. The primary mechanism is filtration of sediment and sedimentation-bound contaminants such as hydrocarbons, total metals, and total phosphorus [6,9,12,13,14,15,16]. Selbig and Buer [17] found that average removal rates ranged from 60 to 80% for total suspended solids, depending on the type of permeable surface. Despite the high efficiency in sediment removal, many studies report little to no treatment of dissolved-phase contaminants, particularly chloride, a contaminant often associated with application of chloride-based de-icing materials during winter months. Seasonally high contributions of chloride can have a lasting effect on residual underdrain concentrations over time; indeed, Selbig et al. [18] observed a cycle of elevated chloride concentrations and load associated with early snowmelt and spring runoff followed by gradual dilution from subsequent storms in a lined permeable system. Drake et al. [19] similarly observed attenuation and buffering of de-icing products by an unlined system utilizing PICP in an Ontario, Canada, parking lot, even when concentrations of chloride in snowmelt from the parking lot exceeded the acute toxicity threshold for aquatic organisms as defined by the U.S. Environmental Protection Agency [20]. Despite the initial sequestration of chloride-rich runoff, however, the eventual exfiltration over time was considered to pose a potential threat to underlying aquifers.
Although permeable pavement appears to provide little treatment for dissolved ions, it may still provide some water-quality benefit in cold weather climates where deicers are the primary form of treatment for snow and ice. Temperatures below the surface of permeable pavement have been shown to respond more rapidly to changes in ambient air temperature compared to impervious asphalt surfaces [6,17]. Because permeable pavement is porous, meltwater infiltrates into deeper layers of the system, thereby preventing formation of ice on the pavement surface. Kevern et al. [21] concluded that insulation from the aggregate base underneath pervious concrete was able to substantially delay the formation of a frost layer, and further noted that although permeability was reduced once a frost layer was formed, it was quickly restored in the presence of meltwater. Selbig and Buer [17] identified that temperatures just below the surface of PICP, PA, and PC closely followed diurnal changes in air temperature during winter, with rate and magnitude responding much faster in PA than in PC or PICP. A lag to daily peak temperature for PA was approximately 45 min behind air temperature compared to 60 and 90 min for PICP and PC, respectively. Temperatures at increasing depth below each surface were slower to respond; even after several days with air temperature remaining below 0 °C, temperature in the bottom layers declined but remained above freezing. These studies, as well as findings from Wenck [22], indicate the air spaces in the surface and porous aggregate base can function as thermal insulators, reducing thermal transfer from the surface down. Consensus from other works corroborate these findings, concluding that frost depth below permeable surfaces was shallower than impermeable surfaces, producing substantially less frost heave and potentially producing no frost heave in well drained pavements [23,24,25].
The transfer of meltwater away from the surface into the aggregate base of a permeable pavement system has led to investigations into minimum requirements of deicer required to maintain traction and safety for vehicles and pedestrians. Drake et al. [19] indicate, under mild conditions, deicer applications on PICP surfaces can be reduced by 50% compared to traditional impervious asphalt, while others have indicated up to 77% less deicer is required for permeable pavement to prevent snow and ice buildup while maintaining traction [6,23]; however, because of the conservative nature of chloride-based deicers in the environment, and the potential exposure to groundwater, treatment of permeable pavement surfaces with deicers is not recommended [5,26]. Erickson et al. [27] reported evidence that deicers may not be needed for permeable pavement to perform similarly to treated impermeable pavement; after surveying 22 paired impermeable and permeable pavement sites in Minnesota, USA, using these management conditions, they found all sites had either similar or no pooled water on both pavements or more pooled water on the impermeable pavement as snow and ice melted. None of the sites had less pooled water on the impermeable pavement compared to the permeable pavement. Other studies have indicated that exfiltration of stormwater into underlying soils increase moisture levels that increase the latent heat of the ground, thereby delaying freezing [28]. This, in combination with the infiltration of meltwater, creates a two-step process that leads to shorter periods and shallower penetration of frost [29]. More research would be beneficial to understand the response to freeze-thaw cycles during winter months and the associated implications for management of deicers in cold weather climates.
To better understand variations in winter temperature profiles in permeable pavements, the U.S. Geological Survey reviewed several years of continuous temperature data collected at a permeable pavement research facility in Madison, Wisconsin, USA. The research facility provided high-resolution temperature data in vertical profile for three commonly used permeable pavement surfaces: PICP, PC, and PA. The purpose of the study was to make use of a long-term dataset to support or refute conclusions made by previous studies on the thermal properties of permeable pavements and the implications of those properties on the management of snow and ice through application of de-icing agents. This study supports an ongoing effort to identify existing and new methods to mitigate urban nonpoint stormwater as well as provide high-resolution data important to understanding the urban component of the hydrologic cycle.
2. Materials and Methods
2.1. Site Description
In the summer of 2014, a permeable pavement test site was constructed adjacent to a 25-year-old parking lot on the northeast side of Madison, Wisconsin. The curbed, asphalt lot provides public parking for city of Madison employees as well as nearby dog park users. The parking lot drainage area was altered throughout site operation with asphalt berms that varied the ratio of impermeable surface runoff to permeable surface run on. During the winter, snow and ice were removed from the impermeable parking lot by conventional methods of plowing, sanding, and salting when needed. Vehicles were restricted to the parking lot only and prohibited from accessing the permeable surfaces. Snow accumulation that exceeded 5 cm was removed from the permeable test surfaces by a hand-operated snow thrower. Sand or salt was not applied on the permeable surfaces.
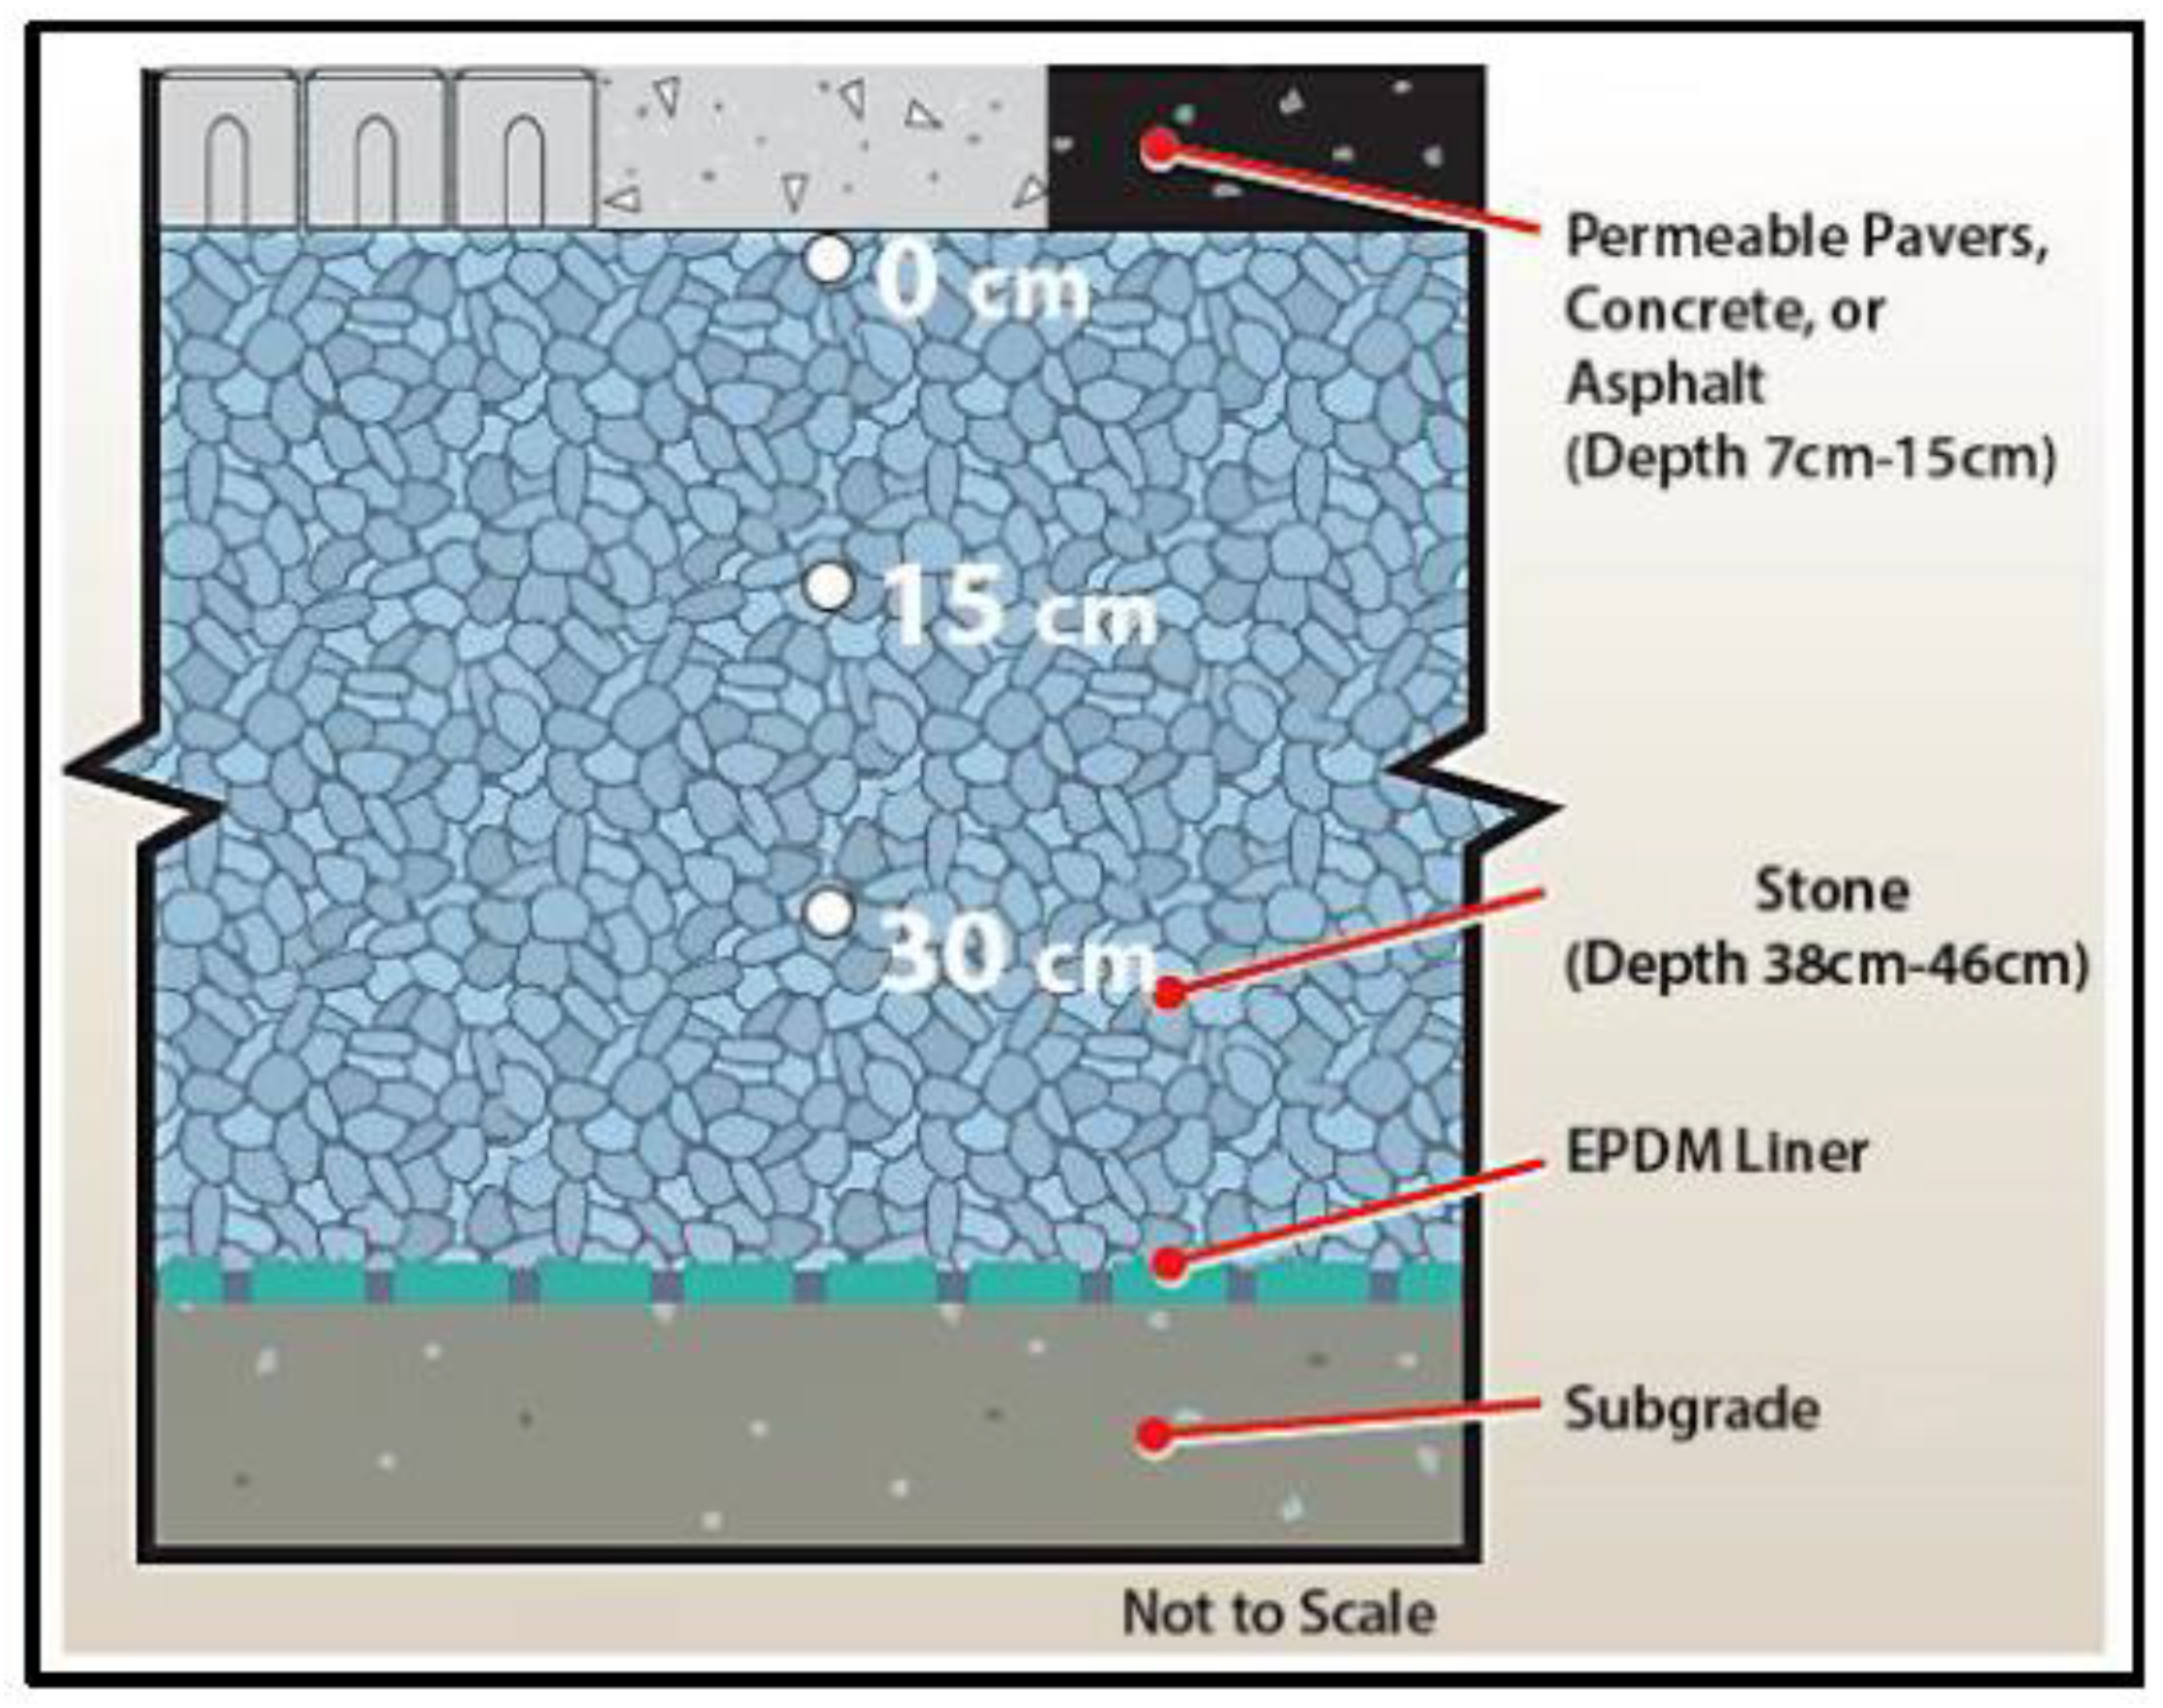
The test site was split into three individual plots to simultaneously evaluate common variations of permeable pavement—PICP, PC, and PA. A conceptual diagram with a general profile of the plots is shown in Figure 1. Each 46.5-square meter plot had a total depth of approximately 53 cm. Concrete walls were placed around the perimeter of each plot (subgrade) to prevent lateral exfiltration into underlying soils or between test plots. Similarly, rubberized berms were used at the surface to prevent cross contamination of surface flow between test plots above grade. Runoff that may have cascaded across each permeable surface as overflow was collected via surface grate and routed towards the monitoring vault. Each cell was lined with an impermeable ethylene propylene diene monomer (EPDM) membrane to prevent exfiltration and cross contamination with native soils. A 15 cm underdrain was placed directly upon the lined sloped base (approximately 2%), simultaneously routing filtered stormwater towards a monitoring vault and minimizing internal water storage. More detailed information on the research site can be found in Selbig et al. [17].
2.2. Temperature Data Collection
The monitoring period was from 21 August 2014 through 6 July 2021. Continuous temperature was recorded at 1-min intervals for the period of data collection using type T, special limits of error grade, insulated thermocouple wire with an accuracy of 0.5 °C [30]. During runoff events, water temperature was recorded and, in the absence of water, air temperature. Temperature data were measured at 78 individual points, including the inlet, underdrain outlet, and surface of each permeable pavements, as well as 27 thermocouples arranged in a 3 × 3 × 3 matrix embedded within the underlying aggregate base of each pavement test plot. The matrix consisted of nine sensor locations, evenly spaced out in a horizontal pattern. The uppermost sensors were situated immediately below the permeable pavement and two additional sensors were spaced vertically 15 and 30 cm below the pavement base (Figure 1).
Although temperature data were collected year-round, the focus of this study was on pavement response to cold weather conditions. Therefore, only data collected between 1 November and 30 April of each year were used for statistical evaluation. Data gaps are present at varying times for each of the pavement types due to factors such as periods of site reconstruction and equipment failure. Removal of these time periods across surface types produced temporally comparable datasets for each pavement type. Datasets were further corrected through removal of intermittent erroneous values, such as sudden and extreme changes in data values that could not be explained.
In this study, two different temperature datasets were evaluated. The first dataset, designated as the “simultaneous dataset”, included 303 days of cold weather data where all depths of all three permeable surface types were operating simultaneously. Evaluation of this temporally comparable dataset helped reveal patterns among pavement types and depths [31]. The second dataset, designated as the “unique dataset”, is a collection of all temperature data when equipment was working and includes the “simultaneous dataset.” This larger dataset had 853 days of data from PICP, 402 days from PC, and 815 days from PA and was used to help confirm patterns seen in the smaller dataset [31]. Air temperature and snow depth data from the National Oceanic and Atmospheric Administration (NOAA) were used to identify snow melt days. Of the 137 melt days identified, coinciding pavement temperature data were available for 103, 47, and 89 days at PICP, PC, and PA, respectively. The NOAA weather station number used was 72641014837, “Madison Dane Co Regional Airport, WI”, located 4.54 km northwest of the study site [32]. The complete dataset used in this study can be found at https://www.sciencebase.gov/catalog/item/61a93820d34eb622f699a7ad (accessed on 6 December 2021) [31].
2.3. Statistical Evaluation
Temperature data collected from within the permeable pavement matrices were evaluated as three independent depths within each plot. Data for the nine probes at each corresponding depth (0, 15, and 30 cm below the permeable base) were averaged to produce a single dataset representative of that particular depth. The resulting nine datasets are described using the permeable surface abbreviation as a prefix followed by the vertical location. For example, the average of all sensors at 15 cm below pervious concrete would be designated PC-middle. Daily temperature values for a given depth were calculated as an average of the one-minute data over a 24-h period. Summary statistics of both one-minute and daily values were used to characterize each depth in each pavement test plot.
3. Results
3.1. Daily Temperatures
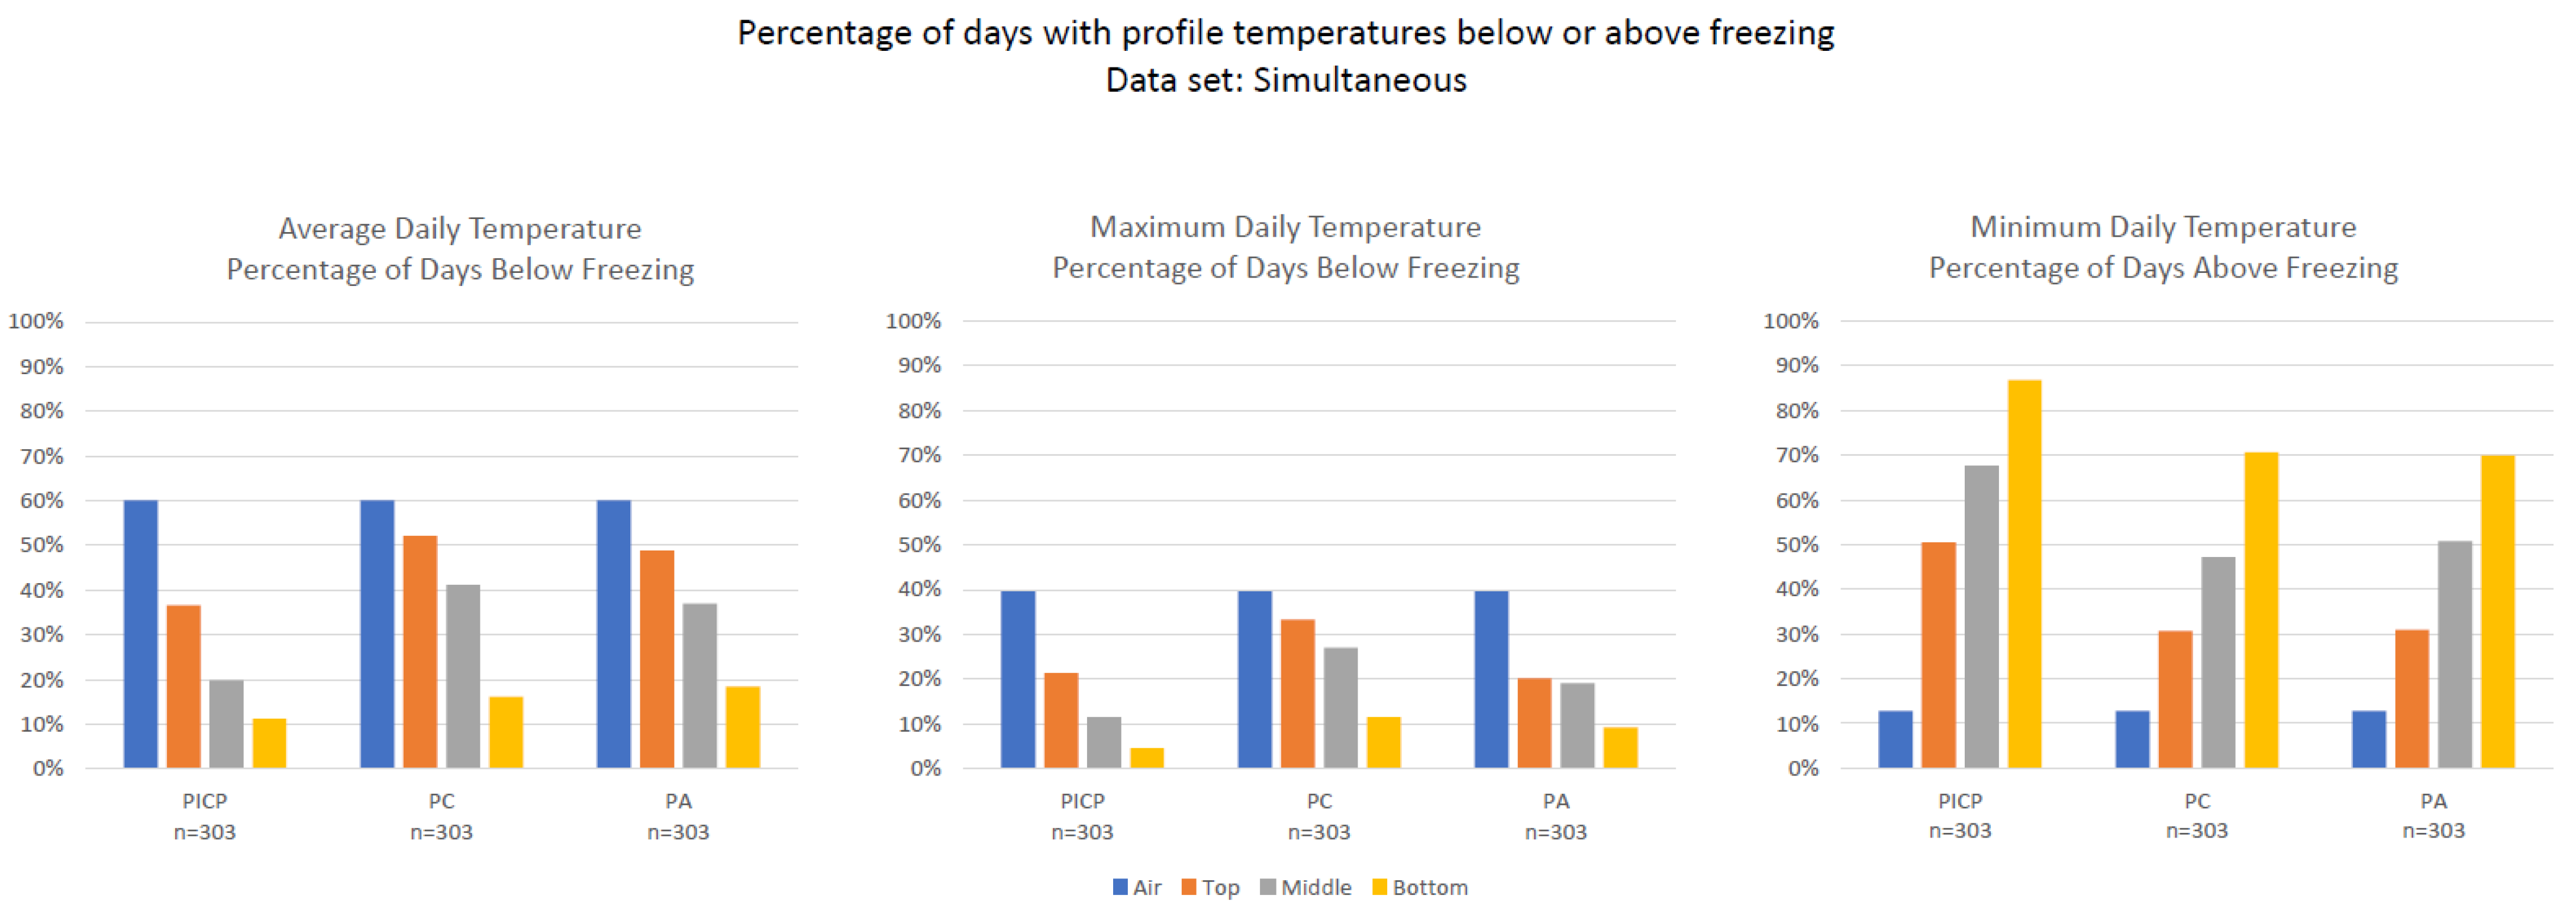
Daily values can be used to differentiate temperature responses among surface types and depths. There were 303 cold weather days where all depths of all three surface types were operating simultaneously. Evaluation of the “simultaneous dataset” where all systems are responding to the same external drivers (air temperature, solar insolation, surface wind speed, etc.) reveals a consistent pattern among pavement types as well as depths (Figure 2). As expected, temperature measured at the bottom of each permeable test plot consistently had the fewest number of days below freezing, followed by middle, then top. Temperatures for all surfaces at each depth remained above freezing for more days than air temperature was below freezing. Of the 182 days that average air temperature was below freezing, the PICP-top, -middle, and -bottom depths remained above freezing 42, 68, and 81% of the time, respectively; Similarly, PC remained above freezing for 20, 38, and 74%, and PA remained above freezing for 25, 45, and 74% of the time, respectively.
Aggregation of the data into measurements of daily average, maximum, and minimum temperatures allowed for more specific daily analysis. Days where the daily maximum temperature was below freezing indicated the corresponding depth was frozen for the entire day. Of the 303 days used in this analysis, 120 had a daily maximum air temperature that was below freezing. During this 120-day period, PICP-top, -middle, and -bottom were also below freezing for 65, 35, and 14 days, respectively; PC for 101, 82, and 35 days, respectively; and PA for 61, 58, and 28 days, respectively (Table 1).
A daily minimum temperature above freezing indicates the corresponding depth was thawed for the entire day. Under this scenario, daily minimum air temperature remained above freezing for only 39 of the 303 days. However, daily minimum temperatures at the PICP-top, -middle and -bottom were above freezing for 153, 205, and 263 days, respectively. Similar conditions were observed less frequently at PC-top, -middle, and -bottom where only 93, 143, and 214 days had daily minimums above freezing, respectively. PA-top, -middle, and -bottom was similar to PC at 94, 154, and 212 days, respectively (Table 1).
During periods when daily average air temperatures were below freezing, PICP had the fewest number of days with corresponding daily average temperatures that were also below freezing. This condition was observed at all depths in PICP. PC and PA responded similarly; however, the PC-top and -middle depths consistently had more days where daily average temperatures were below freezing. PICP remained completely below freezing for the fewest number of days for all depths compared to PC and PA, with the exception of PA-top, which was similar to PICP-top. Overall, PC remained completely frozen at all depths more frequently than PICP and PA. Compared to PC and PA, PICP also remained above freezing at all depths for the greatest number of days. PC and PA had similar numbers of days above freezing (Figure 2 and Table 1).
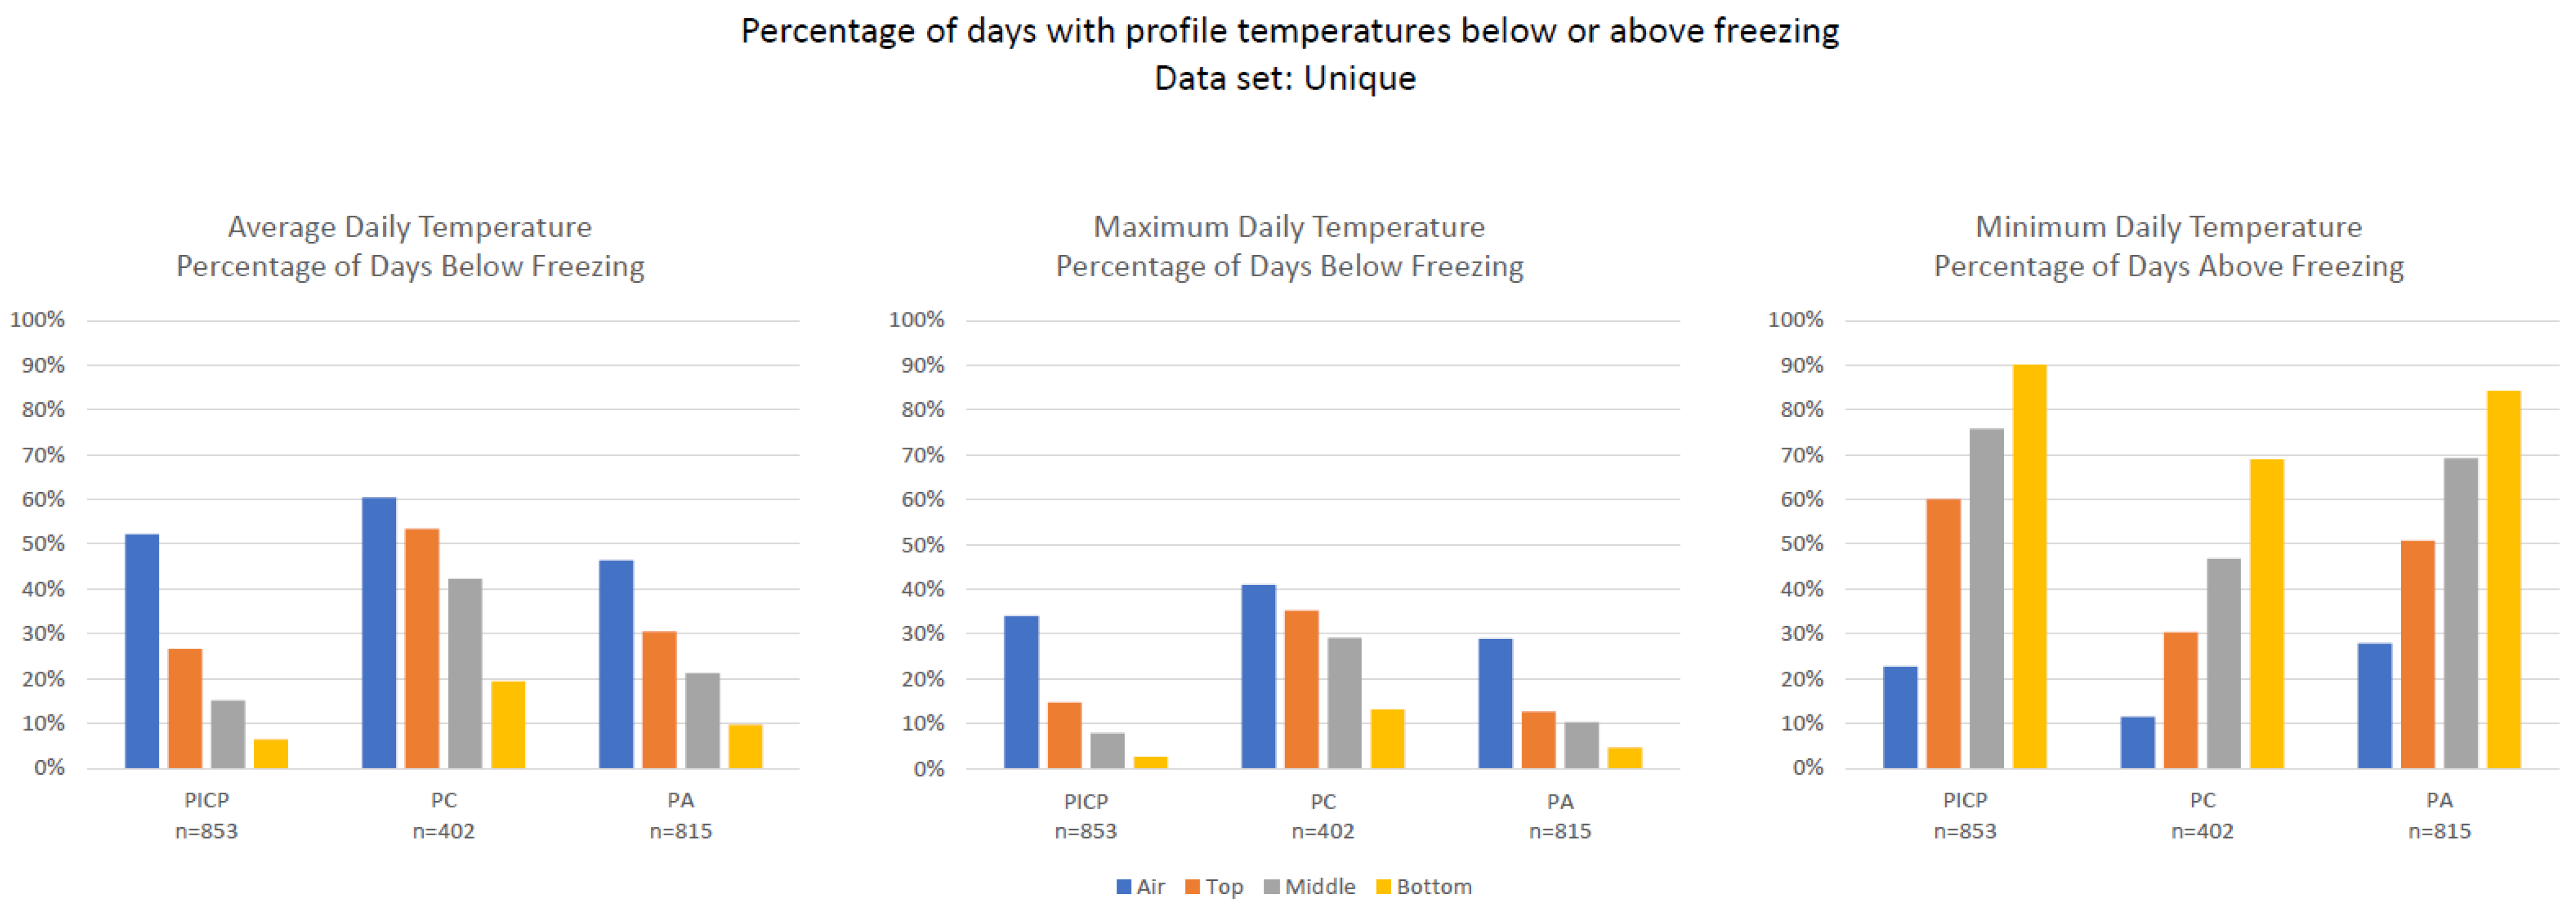
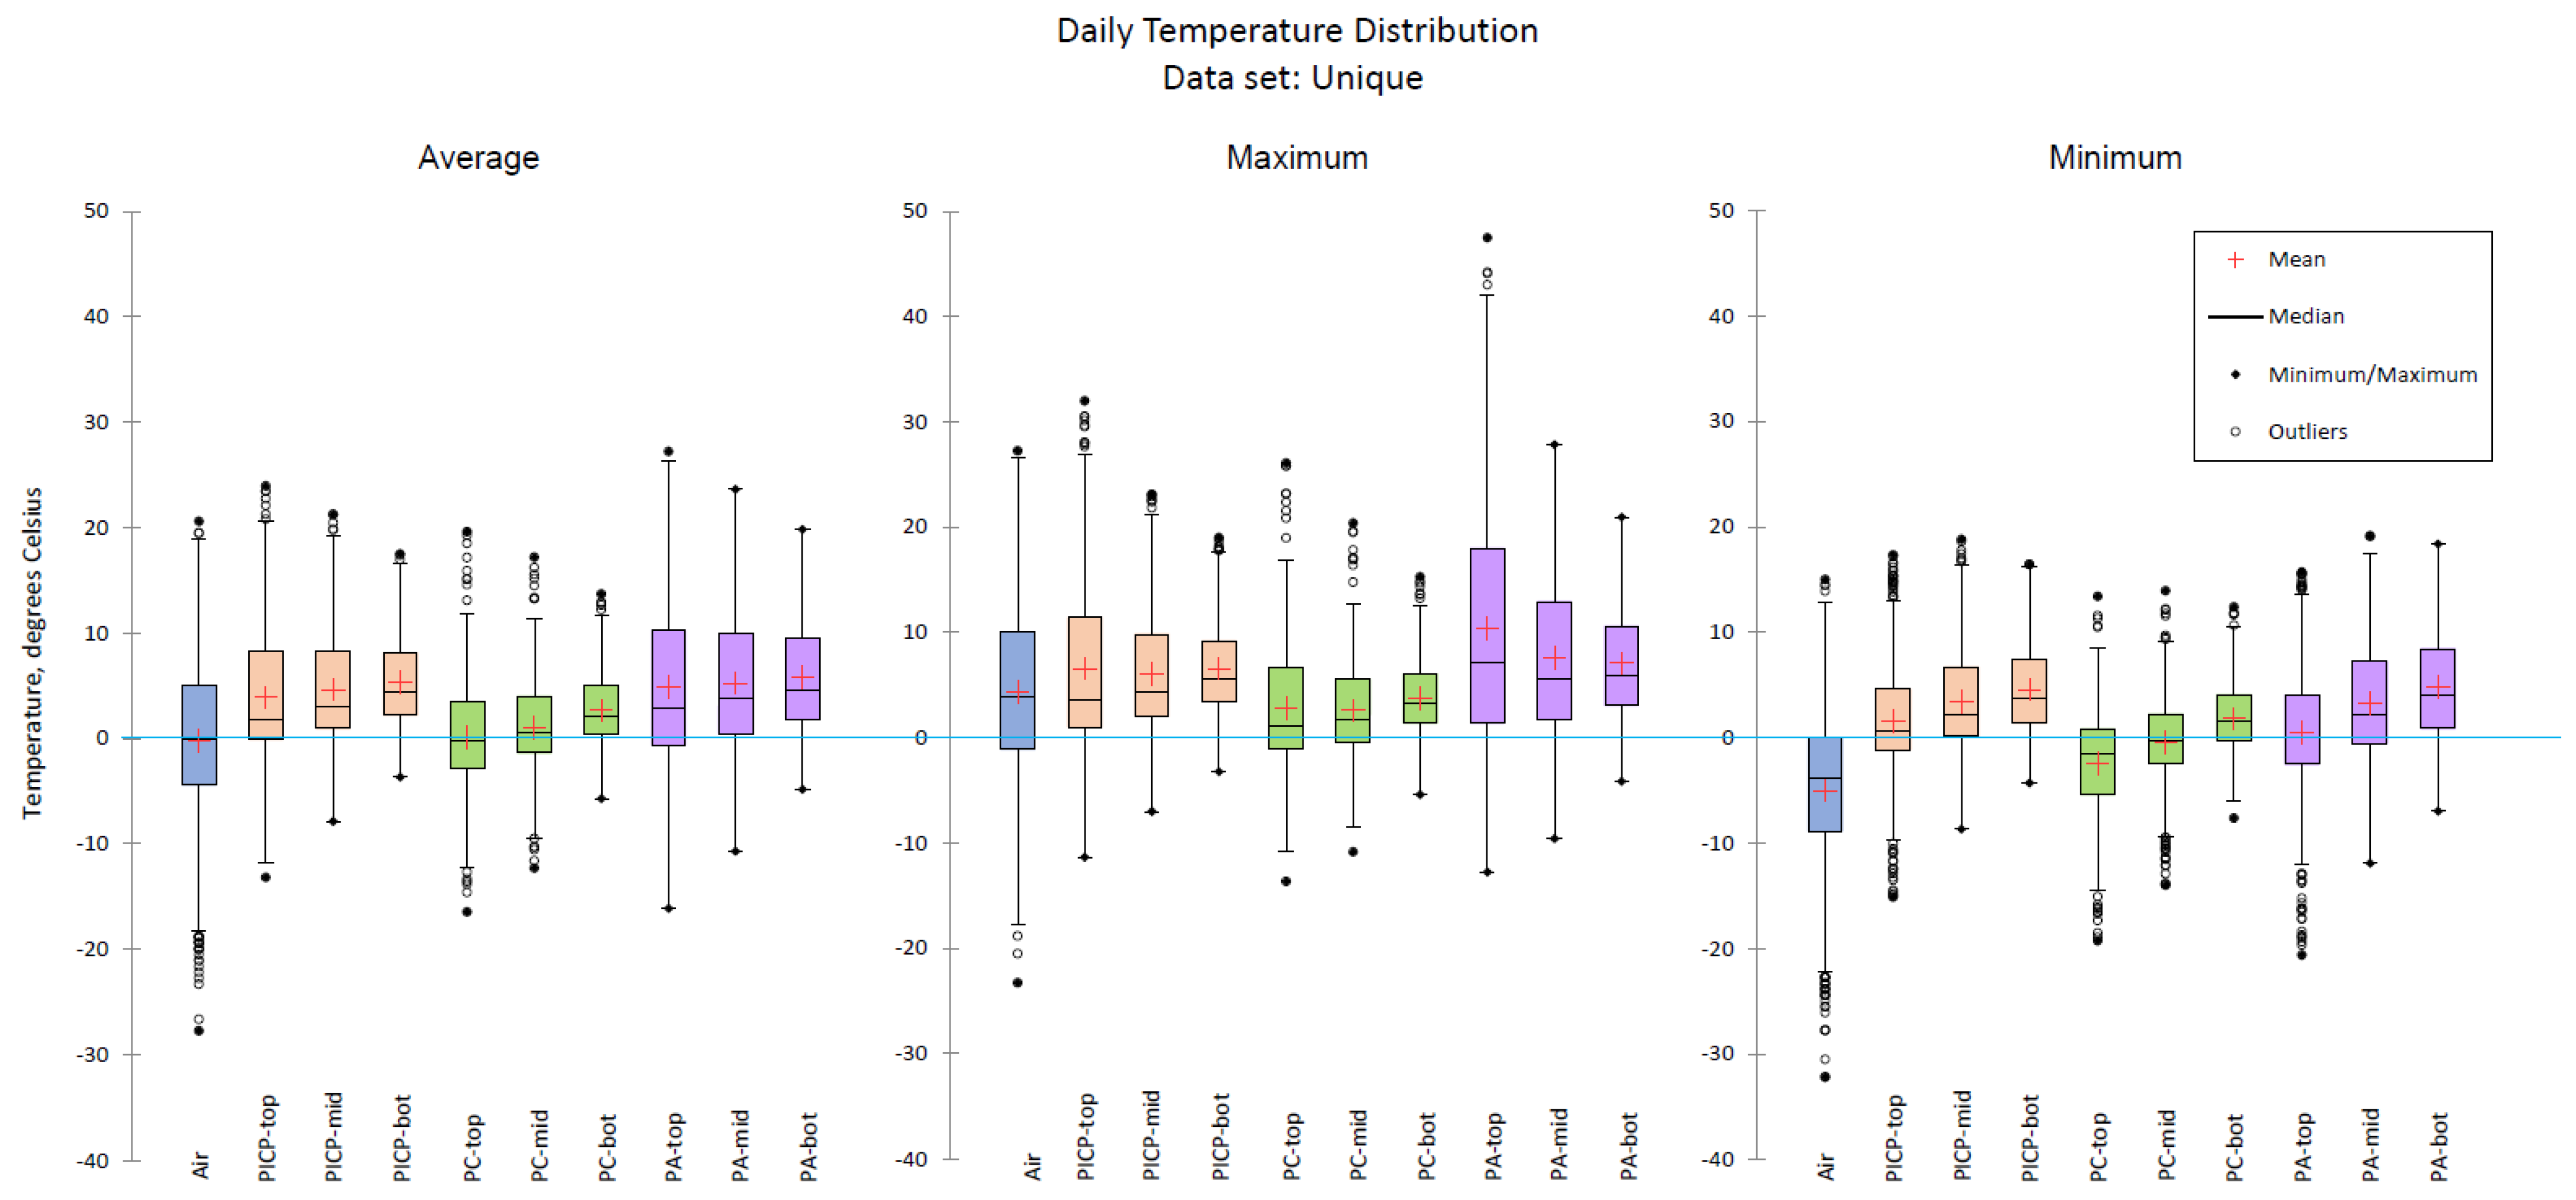
A broader cold weather dataset was available when utilizing times outside of simultaneous operation of all surfaces. Evaluation of the “unique dataset” (Figure 3 and Figure 4) revealed very similar patterns as the temporally comparable “simultaneous dataset” (Figure 2). This shows the response consistency of the systems. Utilizing this larger dataset showed the full range of daily temperatures that were analyzed throughout this study (Table 1 and Figure 4). This comparison reinforced that PC had lower daily temperatures at depth than counterparts in PICP and PA. Comparatively high daily temperatures could also be seen in the PA-top dataset while PICP continued to retain the highest percentage of above freezing days in comparison to PC and PA.
Days when melt occurred were identified using NOAA snow depth and air temperature data. A total of 137 melt days were identified. Of these, temperature data were available for 103, 47, and 89 days at PICP, PC, and PA, respectively. The daily maximum temperature for all permeable pavements at all depths was above freezing for at least 83% of the time. Under this condition, the permeable pavement is more likely to move meltwater through the permeable surface and underlying aggregate base instead of ponding and potentially re-freezing or running off untreated.
3.2. Freeze/Thaw: Lag Time
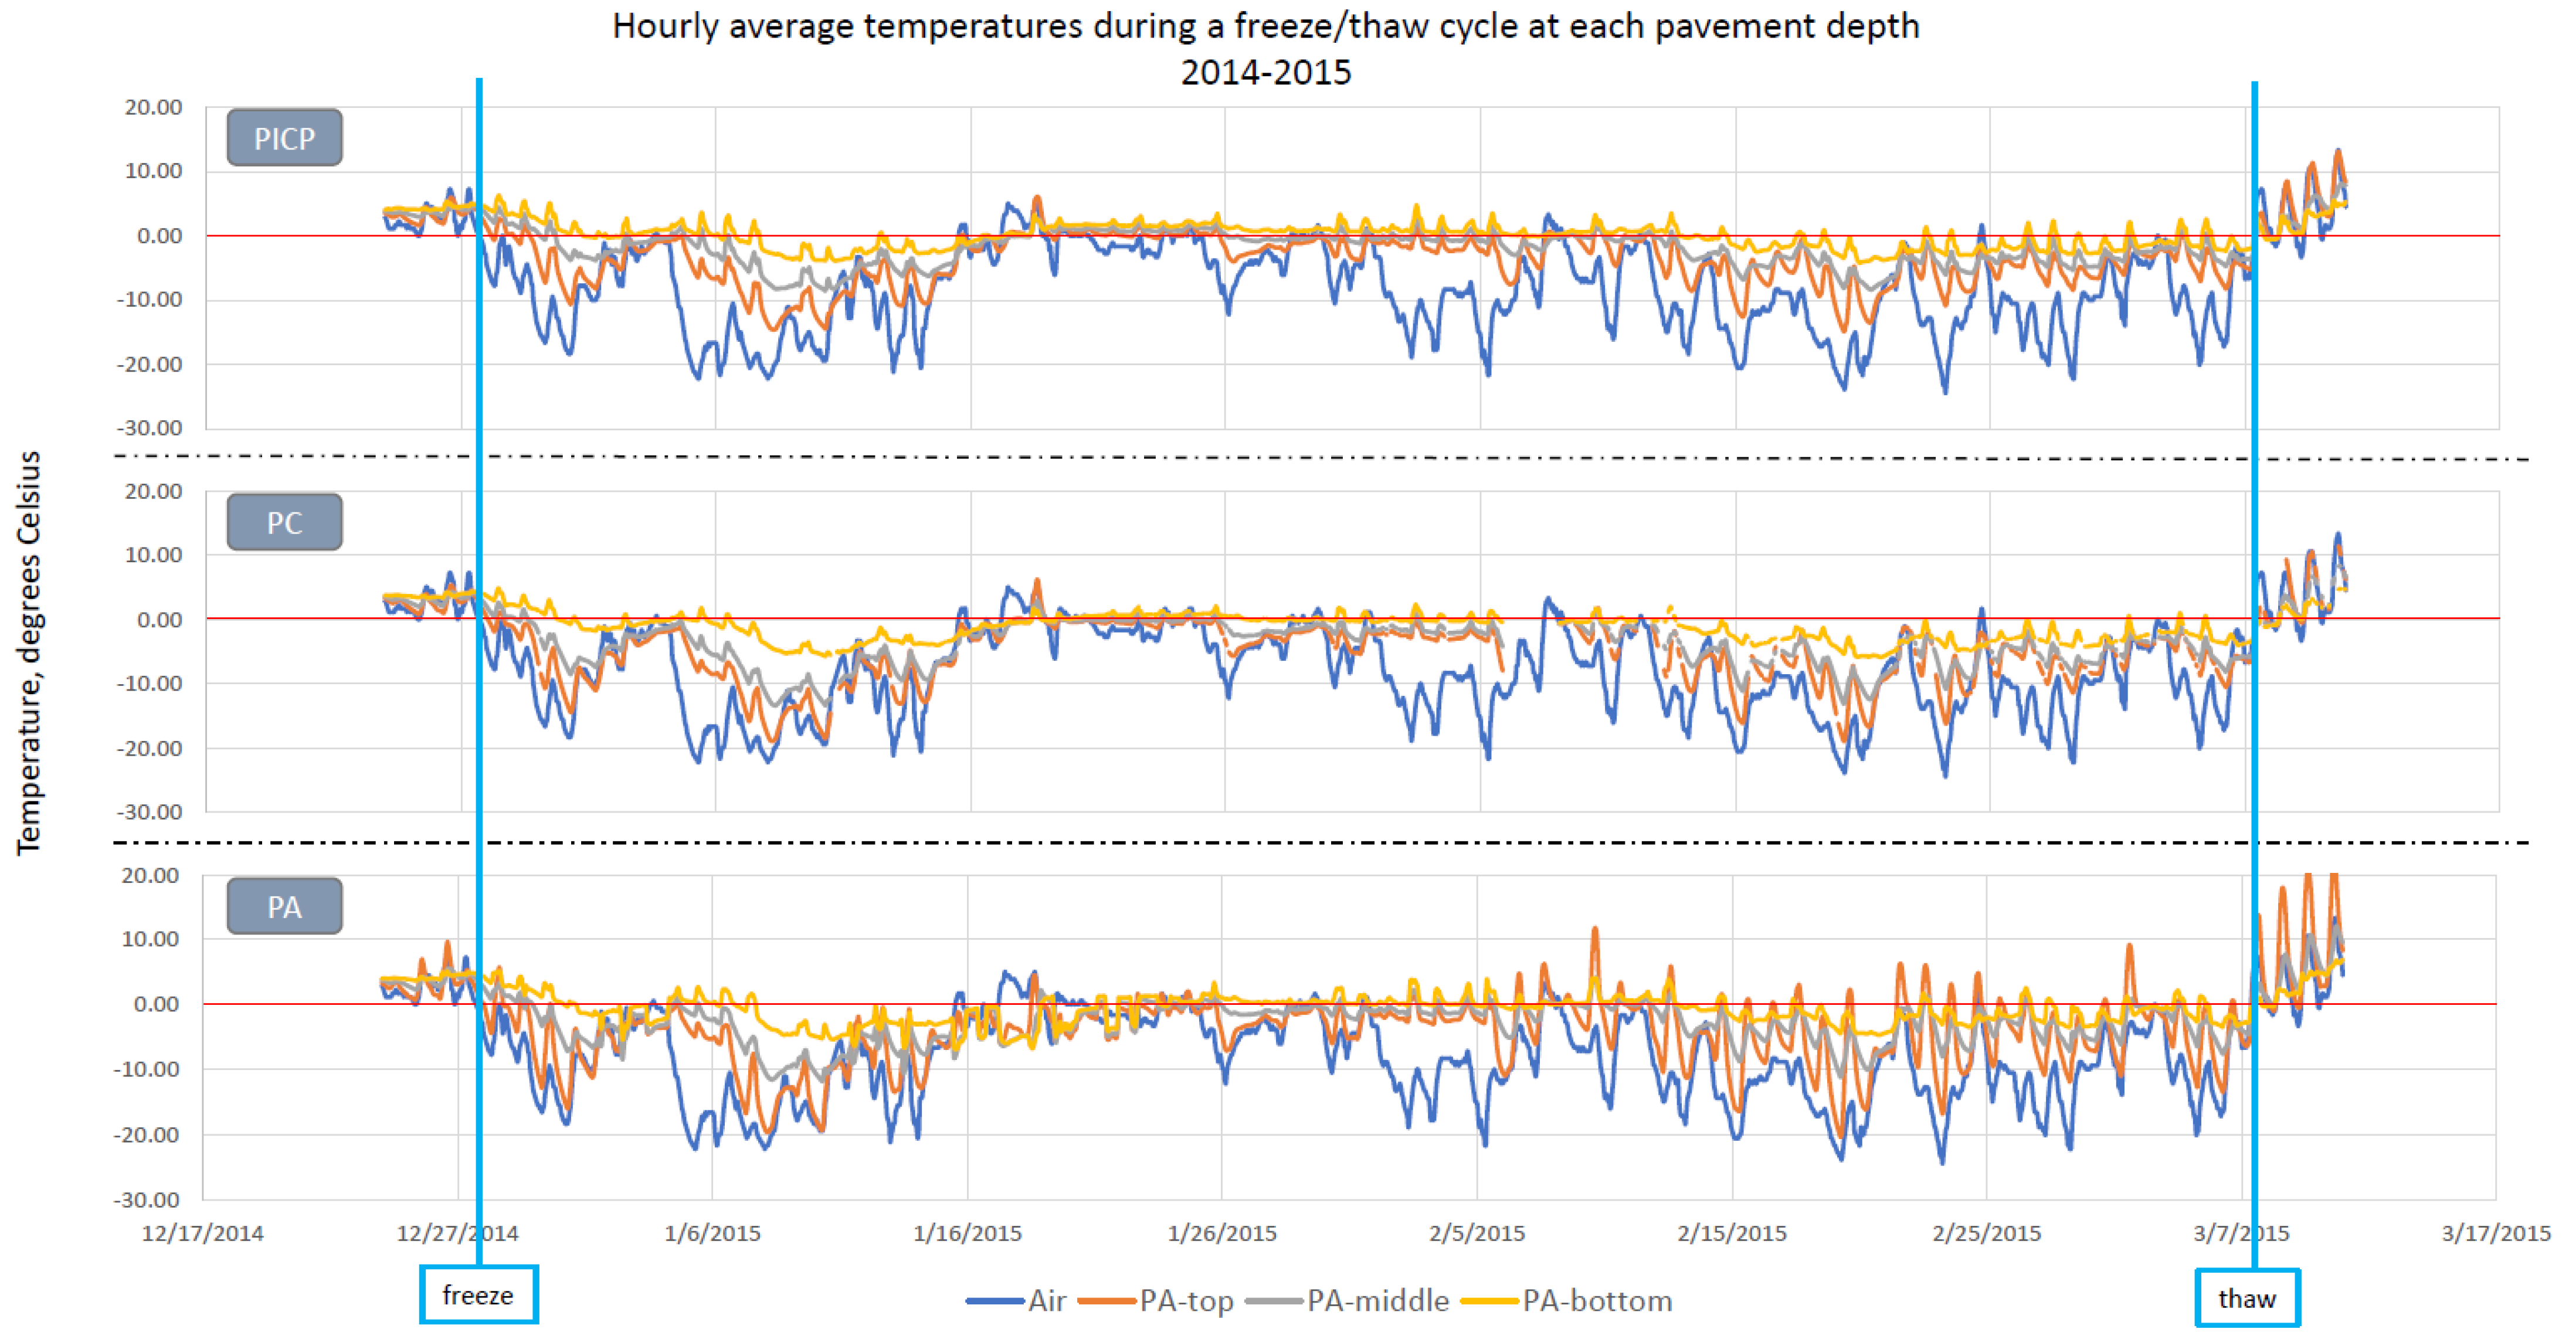
The rate at which a permeable pavement system moves from frozen to unfrozen, or vice-versa, can affect the system’s capacity to become available, or unavailable, for infiltration. During the analyzed timeframes (November–April) there were periods where all or most of the depths became frozen. During the winter of 2014–2015, the air temperature fell below freezing on 27 December 2014, and generally stayed below freezing until 7 March 2015 (referred to as 2014) (Figure 5). Although the milder winter of 2019–2020 resulted in daily air temperatures that fluctuated between freezing and non-freezing conditions on multiple occasions, two periods sustained air temperatures capable of bringing most of the pavement depths to a frozen state: 9 December 2019, to 20 December 2019 (referred to as 2019 A) and 4 February 2020, to 21 February 2020 (referred to as 2019 B). During these three periods, all depths at PICP froze once, while PC and PA completely froze all three times.
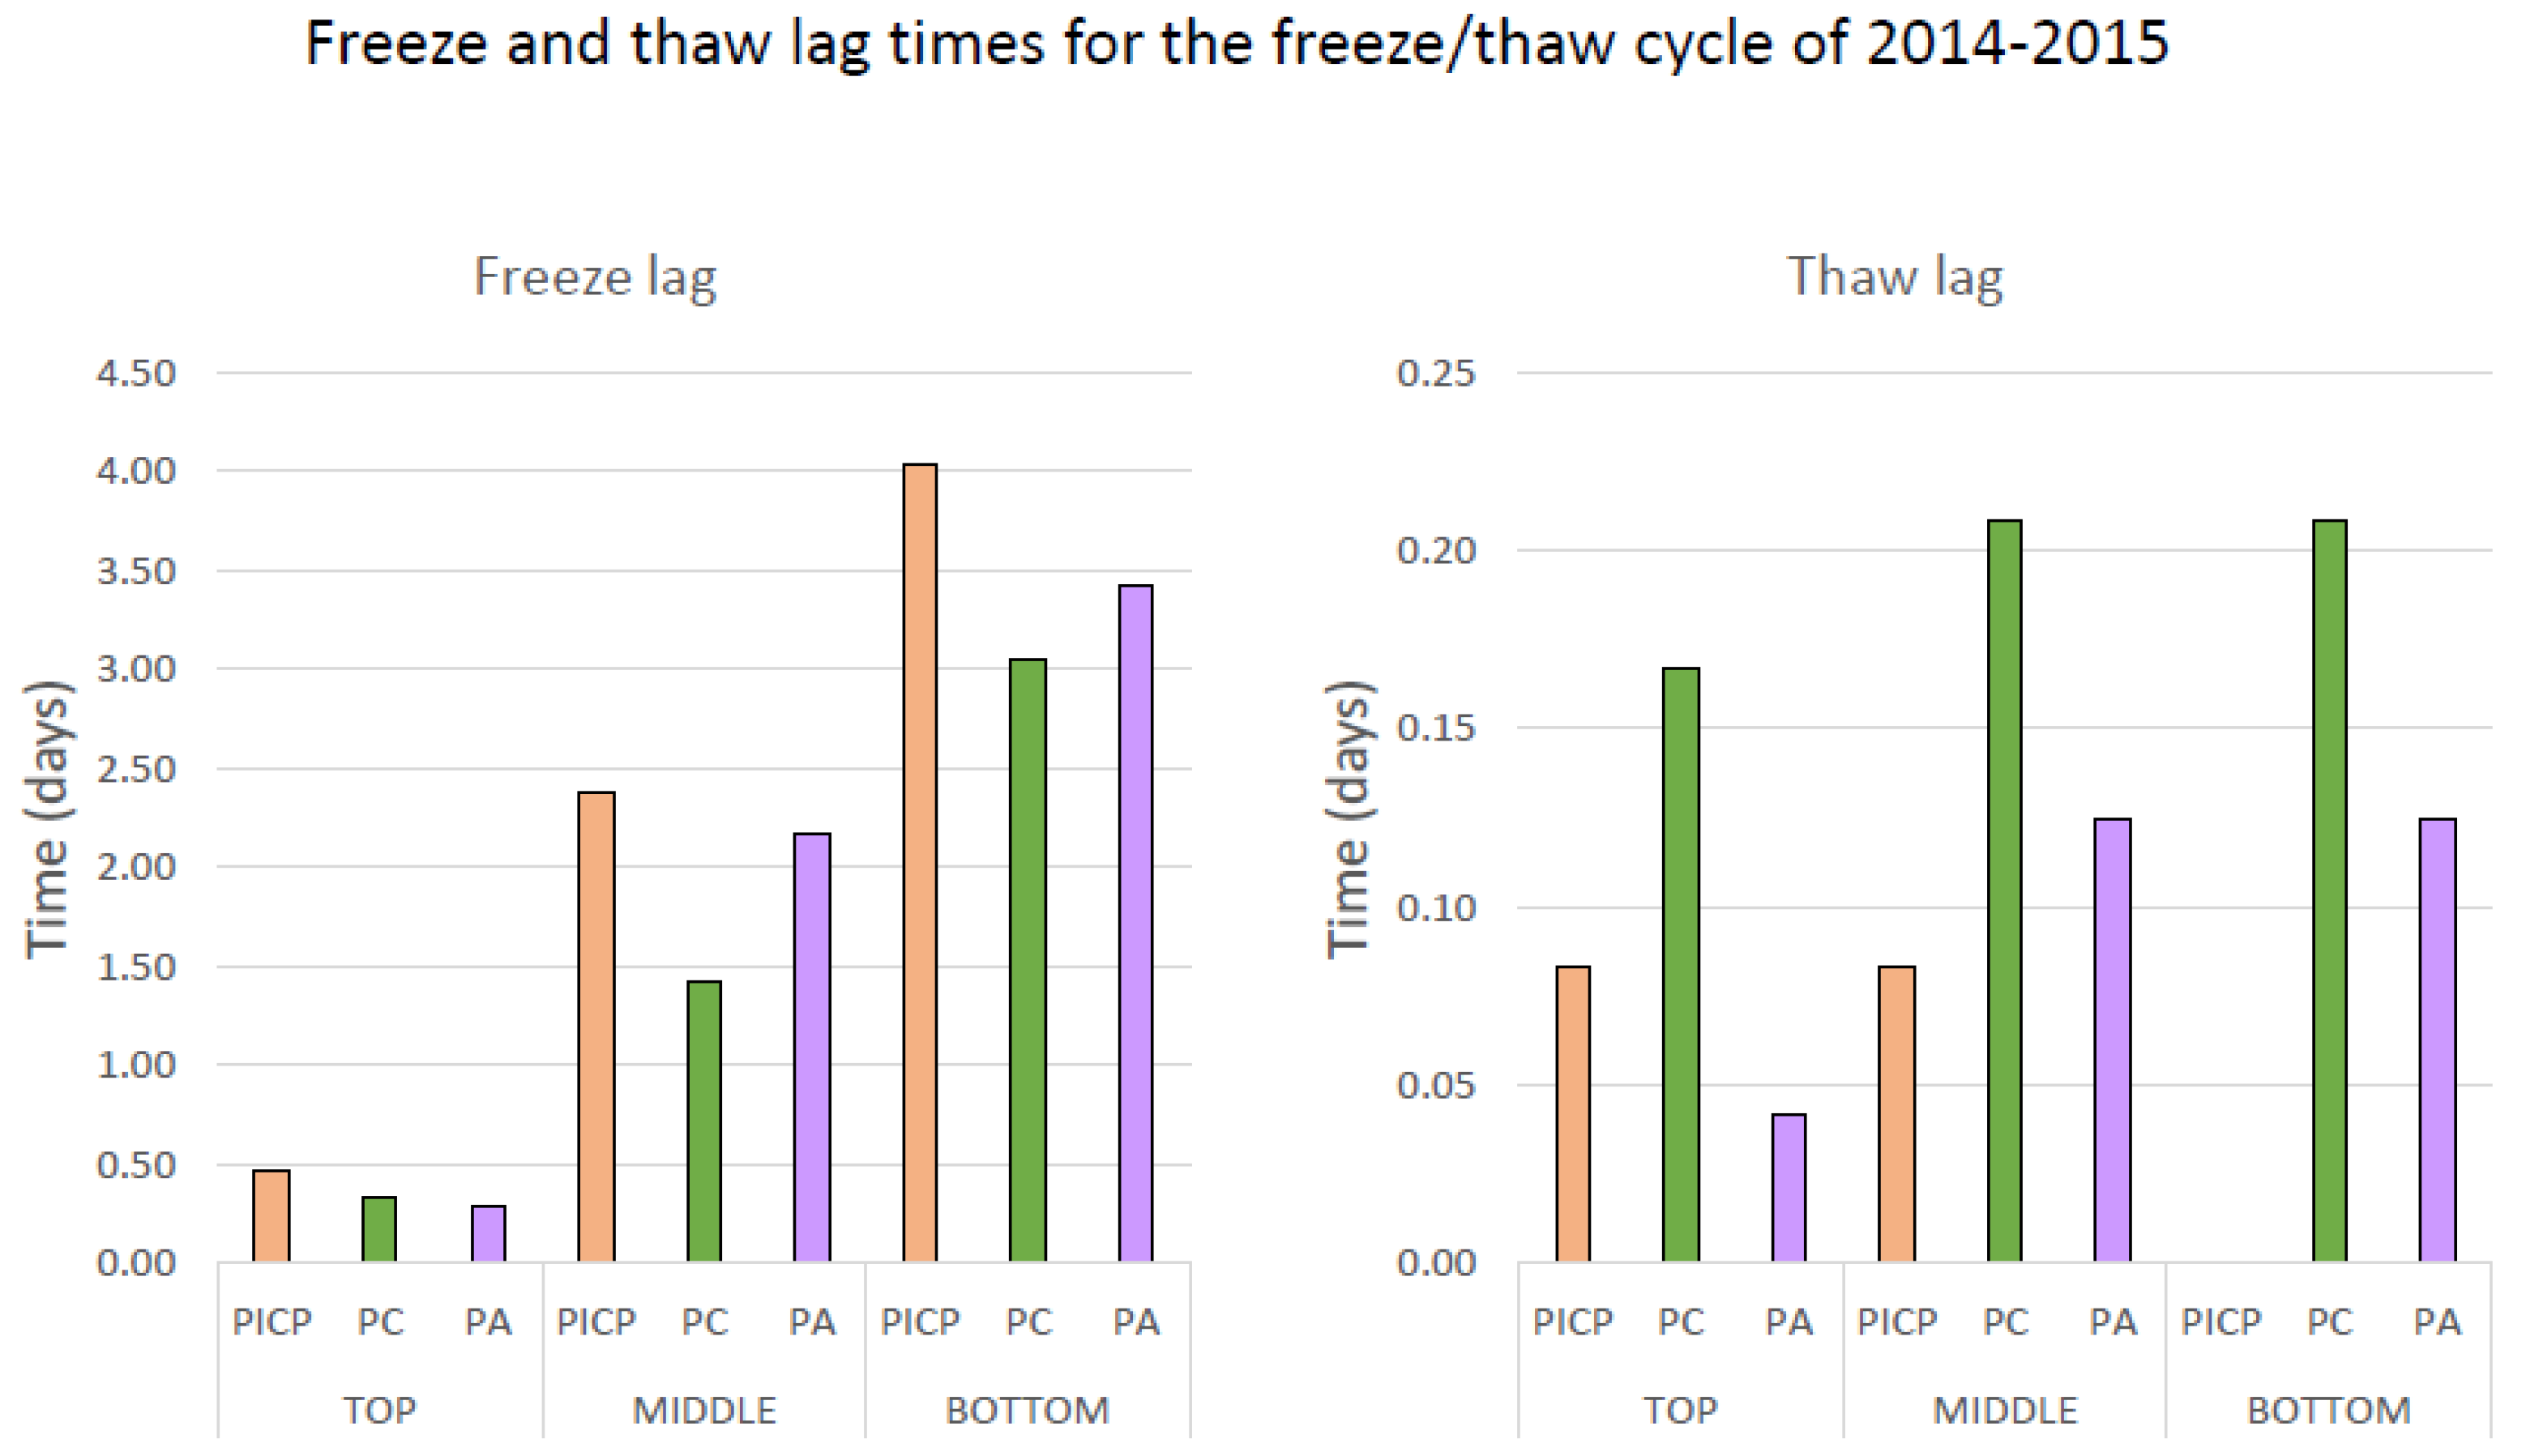
In 2014, when all surfaces froze completely and subsequently thawed, all three pavement types responded similarly (Figure 5 and Table 2). Top, middle, and bottom layers consistently froze in consecutive order and thaw lag times were consistently shorter than freeze lag times at all depths. Because corresponding depths reacted similarly in 2014, differences could be highlighted between the pavement types (Figure 6). PICP froze slowest, followed by PA, then PC; except at the top where PC and PA were similar. PC remained frozen the longest at all depths followed in order by PA and PICP except at the top where PICP and PA reversed roles and PA thawed first (Figure 6). Similar patterns were seen in 2019 B; however, 2019 A showed a reversal of the PC and PA responses with PC thawing more quickly overall (Table 2). These fluctuating periods show the resistance and susceptibility of each permeable pavement type to freezing temperatures. Overall, PICP showed more resistance to freezing and receptiveness to thawing than PC and PA.
The average freeze lag of the top depths (over all the three periods for all permeable pavements) was 13 h. This delay in freezing at the surface determines how long water will be able to continue to infiltrate through to the lower depths, thereby preventing ponding and surface ice formation. The average freeze lag times for the middle and bottom depths were 1 day 15 h and 3 days 22 h, respectively. When air temperature returned above freezing, a shorter amount of time transpired before each permeable pavement returned above freezing. The entire system ranged from less than 1 h for PICP to 3 days 5 h for PA. Middle and bottom depth average lag times were 1 day and 21 h, respectively. Average lag time for the top depth during thawing conditions was 20 h. As in freezing conditions, this time delay could be a limiting factor when determining how much water can infiltrate to lower depths.
4. Discussion
The vertical profile of the three permeable pavement systems frequently remained above freezing when surface air temperatures were below freezing (Figure 2 and Figure 3). Air within the pore spaces of the permeable system acted as an insulator, buffering the effects of freezing surface air temperatures [17,22]. Latent heat retained at depth, as seen through faster thawing times, may help keep the subsurface warmer than the surface. As shown by this dataset, temperatures within permeable pavement systems remain above ambient surface air temperatures during winter conditions for lengthy periods of time. Should temperatures in the underlying aggregate go below freezing, they were found to quickly return above freezing shortly after air temperatures also rise above freezing. Similarly, Kevern [21] and Wenck [22] saw temperatures at depth below permeable pavement surfaces remained higher than those in the impermeable counterparts. Regardless of temperature, void space can continue to remain open in permeable pavements and infiltration can occur, although at a reduced rate as temperatures become sub-zero [33].
PICP was shown to be less susceptible to the effects of freezing air temperatures than both PC and PA at all depths. When sustained below zero air temperatures occurred, PICP took longer to freeze at all depths. The deepest layer stayed above freezing for two of the three periods of sustained freezing temperatures analyzed, while PC and PA froze during all three periods. Thawing occurred either simultaneously or faster at PICP (Table 2). Although void spaces are approximately 10% for PICP and PC, and 20% for PA [17], PICP is limited to voids existing between pavers, as opposed to PC and PA that have void space evenly distributed across the entire surface. The disconnected nature of surface voids in PICP as well as the thermal mass of pavers may help insulate the aggregate from surface temperature fluctuations much better than more evenly porous surfaces (PC and PA).
Although PC and PA responded to ambient temperatures similarly, all depths of PC were completely frozen more often than PA. This is most apparent near the surface where PA and PICP were frozen for approximately 65% fewer days than PC. Overall, PC may remain colder due to the evenly porous nature of the pavement surface as well as decreased solar radiation absorbance and lower surface temperatures associated with higher albedo [3]. PA had higher daily temperatures than both PICP and PC. Most of this can be attributed to the relatively low albedo of PA (0.08) compared to PC (0.18–0.29) and PICP (0.25–0.28) as found by Li et al. [3]. Low albedo equates to increased solar radiation absorbance and higher surface temperatures, which in turn can affect subsurface temperatures. Impermeable asphalt has been shown to reach temperatures up to 5.6 °C higher than concrete pavements when receiving similar sun exposure [34]. In PA, this effect may be somewhat muted by void space insulation and material porosity, which reduces thermal mass and connectivity. The effect of surface albedo seems to dissipate with depth as middle and bottom layers show less extreme temperature swings and become closer to those seen at PICP. The transfer and escape of heat at depth seems to be more regulated by latent heat of the surrounding soils and aggregate pore space.
Although temperature alone cannot predict surface conditions (ice, snow, melt) [27], it does play a critical role in the functioning of a permeable pavement system. The implication of having unfrozen conditions in the underlying aggregate base of a permeable pavement installation is to promote infiltration of melt or rainwater from the surface during freeze-thaw periods. Removal of standing water through percolation into the permeable surface prevents re-freezing, which can cause hazardous conditions on the paved surface. If less, or no, ice forms on the surface, it becomes inherently safer and reduces the need for de-icing maintenance.
Chloride contamination of surface and groundwater is also of major concern, and at present, the only mitigation strategy is reduction of use. Several studies have shown that permeable pavements require substantially less salt application to maintain the same conditions as a traditional surface. When compared to traditional asphalt, the same level of safety was demonstrated with a 77% reduction at a PA lot in New Hampshire, USA [23] and a 50% reduction at a PICP lot in Toronto, Canada [19]. The current study shows that during days of melt, maximum temperatures are above freezing at all depths of the PICP 96% of the time. PA is similar at 93%, and PC remains thawed for 83% of melt days. For melt days when system temperatures do not surpass freezing, it is likely that some amount of infiltration is still able to occur. Roseen et al. [6] found that even with up to 71 cm of frost penetration of a PA site, there was no degradation of infiltration rates. While present science confirms the benefit of permeable pavement in road salt use reduction, it also shows that when salt is applied to permeable systems, there can be the unintended consequence of groundwater contamination. The proficiency of these systems to infiltrate water allows for rapid delivery to the native soils in an unlined system [35,36] and the potential for attenuation and exfiltration to lower aquifers [19]. Although permeable systems have been shown to reduce sediment, metals, and some nutrients [17,18], chloride is a dissolved constituent, and has not been shown to be effectively removed through these means [12,17,18]. With this consideration, ice management would ideally be tailored precisely, utilizing the infiltration benefits of permeable pavement to bring salt use to a minimum, or eliminating salt application when possible.
5. Conclusions
During freeze/thaw periods, the temperature profile of a permeable pavement system will be a determining factor of whether water can infiltrate. Infiltration during these times removes water from the surface that would otherwise potentially re-freeze. If there is little to no water to re-freeze, the paved surface will be less likely to require de-icing measures. Results of the analysis of temperature profiles for three different permeable pavement types (PICP, PC, and PA) over the course of seven winters show that all three types respond to ambient temperature in manners favorable to allow for infiltration. Each system was slow to freeze and quick to thaw. Subsurface temperatures rose above freezing on a vast majority of days with melt. Subsurface temperatures were consistently higher than air temperatures when air temperatures were below freezing. Data show the PICP system surpassed both PC and PA by having fewer days below freezing, higher temperatures on melt days, slower freeze and faster thaw times, and less penetration of freezing temperatures at depth. PA also surpassed PC by having fewer days below freezing, higher daily temperatures, and higher temperatures on melt days. PICP and PA had similar daily temperatures, and PC and PA had inconsistent freeze/thaw lag times. Although other factors can influence infiltration during freeze/thaw periods, these data show that permeable pavement systems have conducive temperature properties to infiltrate melt and rain during winter months. This study builds on an ongoing body of evidence that can be used to inform environmental managers about freeze-thaw responses of permeable pavement and the implications for the reduction of deicers in cold weather climates.
Author Contributions
All authors contributed in multiple ways to this project including but not limited to the following: Conceptualization, W.R.S. and N.H.B.; methodology, W.R.S. and N.H.B.; software, W.R.S.; validation, M.E.D., N.H.B. and W.R.S.; formal analysis, M.E.D.; investigation, N.H.B. and W.R.S.; resources, N.H.B. and W.R.S.; data curation, M.E.D. and W.R.S.; writing—original draft preparation, M.E.D., N.H.B. and W.R.S.; writing—review and editing, M.E.D., N.H.B. and W.R.S.; visualization, M.E.D., N.H.B. and W.R.S.; supervision, W.R.S.; project administration, N.H.B. and W.R.S.; funding acquisition, W.R.S. All authors have read and agreed to the published version of the manuscript.
Funding
Research was funded by the Interlocking Concrete Pavement Institute Foundation for Education and Research, Wisconsin Department of Natural Resources, Wisconsin Department of Transportation, County Materials Corporation, the City of Madison, and U.S. Geological Survey Cooperative Matching Funds. The Interlocking Concrete Pavement Institute Foundation for Education and Research provided the financial support necessary to complete this paper. Any use of trade, firm, or product names is for descriptive purposes only and does not imply endorsement by the U.S. Government.
Data Availability Statement
The data presented in this study are openly available at https://www.sciencebase.gov/catalog/item/61a93820d34eb622f699a7ad (accessed on 6 December 2021).
Acknowledgments
The authors would like to thank David Smith of the Interlocking Concrete Pavement Institute Foundation for Education and Research, Roger Bannerman of the Wisconsin Department of Natural Resources, Bob Roehrig and Jennifer Schaff of County Materials Corporation, John McCarthy of Graef Engineering, Chris Homburg of Homburg Construction, and Greg Fries and Tim Troester of the City of Madison. The authors also would like to thank Oldcastle Inc., Unilock, County Materials Corporation, Rock Roads, and Homburg Construction for donating materials and labor to install the permeable interlocking pavers, porous asphalt, and pervious concrete.
Conflicts of Interest
The authors declare no conflict of interest. The funders had no role in the design of the study; in the collection, analyses, or interpretation of data; in the writing of the manuscript, or in the decision to publish the results.
References
- Burns, M.J.; Fletcher, T.D.; Walsh, C.J. Hydrologic shortcomings of conventional urban stormwater management and opportunities for reform. Landsc. Urban Plan. 2012, 105, 230–240. [Google Scholar] [CrossRef]
- Drake, J.; Bradford, A.; Van Seters, T. Stormwater quality of spring-summer-fall effluent from three partial-infiltration permeable pavement systems and conventional asphalt pavement. J. Environ. Manag. 2014, 139, 69–79. [Google Scholar] [CrossRef]
- Li, H.; Harvey, J.T.; Holland, T.J.; Kayhanian, M. The use of reflective and permeable pavements as a potential practice for heat island mitigation and stormwater management. Environ. Res. Lett. 2013, 8, 015023. [Google Scholar] [CrossRef]
- Li, H.; Jones, D.; Wu, R.; Harvey, J.T. Development and HVS Validation of Design Tables for Permeable Interlocking Concrete Pavement: Final Report. University of California Pavement Research Center, Davis, Ca., UCPRC-RR-2014-04.2. 2014. Available online: http://www.ucprc.ucdavis.edu/PDF/UCPRC-RR-2014-04.pdf (accessed on 6 December 2021).
- Bethany, E.; Lindow, K.C.; Smith, D.R. (Eds.) Permeable Pavements: Reston, Va; American Society of Civil Engineers: Reston, VA, USA, 2015; p. 249. [Google Scholar] [CrossRef]
- Roseen, R.M.; Ballestero, T.P.; Houle, J.J.; Briggs, J.F.; Houle, K.M. Water quality and hydrologic performance of a porous asphalt pavement as a storm-water treatment strategy in a cold climate. J. Environ. Eng. 2012, 138, 81–89. [Google Scholar] [CrossRef]
- Roseen, R.M.; Houle, J.; Ballestero, T.P.; Puls, T. Pre-Construction, Construction, and Post-Construction Monitoring Report for Greenland Meadows for July 2007–October 2010; Durham, N.H., Ed.; The University of New Hampshire Stormwater Center: Durham, NH, USA, 2010; p. 15. Available online: https://www.unh.edu/unhsc/sites/unh.edu.unhsc/files/docs/2010%20UNH%20SC_Packard%20Monitoring%20interim%20report_final.b.pdf (accessed on 5 January 2018).
- Sansalone, J.; Kuang, X.; Ying, G.; Ranieri, V. Filtration and clogging of permeable pavement loaded by urban drainage. Water Res. 2012, 46, 6763–6774. [Google Scholar] [CrossRef]
- Gilbert, J.K.; Clausen, J.C. Stormwater runoff quality and quantity from asphalt, paver, and crushed stone driveways in Connecticut. Water Res. 2006, 40, 826–832. [Google Scholar] [CrossRef]
- Fassman, E.A.; Blackbourn, S. Urban runoff mitigation by a permeable pavement system over impermeable soils. J. Hydrol. Eng. 2010, 15, 475–485. [Google Scholar] [CrossRef]
- Brattebo, B.O.; Booth, D.B. Long-term stormwater quantity and quality performance of permeable pavement systems. Water Res. 2003, 37, 4369–4376. [Google Scholar] [CrossRef]
- Winston, R.J.; Al-Rubaei, A.M.; Blecken, G.T.; Viklander, M.; Hunt, W.F. Maintenance measures for preservation and recovery of permeable pavement surface infiltration rate—The effects of street sweeping, vacuum cleaning, high pressure washing, and milling. J. Environ. Manag. 2016, 169, 132–144. [Google Scholar] [CrossRef]
- Balades, J.D.; Legret, M.; Madiec, H. Permeable pavements—Pollution management tools. Water Sci. Technol. 1995, 32, 49–56. [Google Scholar] [CrossRef]
- Brown, C.; Chu, A.; van Duin, B.; Valeo, C. Characteristics of sediment removal in two types of permeable pavement. Water Qual. Res. J. Can. 2009, 44, 59–70. Available online: https://citeseerx.ist.psu.edu/viewdoc/download?doi=10.1.1.1058.9456&rep=rep1&type=pdf (accessed on 22 August 2021). [CrossRef] [Green Version]
- Lucke, T.; Beecham, S. Field investigation of clogging in a permeable pavement system. Build. Res. Inf. 2011, 39, 603–615. [Google Scholar] [CrossRef]
- Tirpak, A.; Winston, R.J.; Feliciano, M.; Dorsey, J.D. Stormwater quality performance of permeable interlocking concrete pavement receiving run-on from an asphalt traffic lane in a cold climate. Environ. Sci. Pollut. Res. 2020, 27, 21716–21732. [Google Scholar] [CrossRef] [PubMed]
- Selbig, W.R.; Buer, N. Hydraulic, Water-Quality, and Temperature Performance of Three Types of Permeable Pavement under High Sediment Loading Conditions; Scientific Investigations Report 2018–5037; U.S. Geological Survey: Reston, VA, USA, 2018; Volume 44. [Google Scholar]
- Selbig, W.R.; Buer, N.; Danz, M.E. Stormwater-quality performance of lined permeable pavement systems. J. Environ. Manag. 2019, 251, 13. [Google Scholar] [CrossRef]
- Drake, J.; Marvin, J.; Scott, J. De-icing Operations for Permeable Interlocking Concrete Pavements, Interlocking Concrete Pavement Institute Foundation for Education and Research. 2020, p. 58. Available online: https://www.researchgate.net/publication/340950433_De-icing_Operations_for_Permeable_Interlocking_Concrete_Pavements (accessed on 24 August 2021).
- U.S. Environmental Protection Agency. National Recommended Water Quality Criteria—Aquatic Life Criteria Table. 2012. Available online: https://www.epa.gov/wqc/national-recommended-water-quality-criteria-aquatic-life-criteria-table (accessed on 27 April 2021).
- Kevern, J.T.; Schaefer, V.R.; Wang, K. Temperature behavior of pervious concrete systems. J. Transp. Res. Board 2009, 2098, 94–101. [Google Scholar] [CrossRef]
- Wenck Associates, Inc. Porous Pavement Paired Intersection Study; Wenck Associates: Maple Plain, MN, USA, 2014; Available online: http://www.shinglecreek.org/uploads/5/7/7/6/57762663/paired_intersection_study_final_report.pdf (accessed on 23 September 2021).
- Zhang, K.; Kevern, J. Review of porous asphalt pavements in cold regions: The state of practice and case study repository in design, construction, and maintenance. J. Infrastruct. Preserv. Resil. 2021, 2, 1–17. [Google Scholar] [CrossRef]
- Weiss, P.T.; Kayhanian, M.; Khazanovich, L.; Gulliver, J.S. Permeable Pavements in Cold Climates: State of the Art and Cold Climate Case Studies, Minnesota Department of Transportation, MN/RC 2015-30. 2015, p. 375. Available online: https://www.lrrb.org/pdf/201530.pdf (accessed on 5 November 2021).
- Houle, K.M.; Roseen, R.M.; Ballestero, T.P.; Briggs, J.F.; Houle, J.J. Examinations of pervious concrete and porous asphalt pavements performance for stormwater management in northern climates. In Proceedings of the Low Impact Development International Conference, San Francisco, CA, USA, 17–21 May 2010; World Environmental and Water Resources Congress: Kansas City, MO, USA, 2009. Available online: http://ascelibrary.org/doi/abs/10.1061/41099%28367%29111 (accessed on 25 August 2021).
- Smith, D.R. Permeable Interlocking Concrete Pavements, 5th ed.; Interlocking Concrete Pavement Institute: Chantilly, VA, USA, 2017. [Google Scholar]
- Erickson, A.J.; Gulliver, J.S.; Herb, W.R.; Janke, B.D.; Nguyen, N.K. Permeable Pavement for Road Salt Reduction, Minnesota Department of Transportation, MN 2020-15. 2020, p. 155. Available online: https://www.dot.state.mn.us/research/reports/2020/202015.pdf (accessed on 24 August 2021).
- Backstrom, M.; Bergstrom, A. Draining function of porous asphalt during snowmelt and temporary freezing. Can. J. Civ. Eng. 2000, 27, 594–598. [Google Scholar] [CrossRef]
- Drake, J.A.P.; Bradford, A.; Marsalek, J. Review of environmental performance of permeable pavement systems: State of the knowledge. Water Qual. Res. J. Can. 2013, 48, 203–222. [Google Scholar] [CrossRef]
- Omega Engineering Inc. Wire Color Codes and Limits of Error. 2019. Available online: https://www.omega.com/en-us/colorcodes (accessed on 16 November 2021).
- Danz, M.E.; Buer, N.H.; Selbig, W.R. Cold-Weather Air and Subsurface Temperature Profiles of Three Different Permeable Pavements, Madison, Wisconsin (2014–2021). U.S. Geological Survey Data Release; 2021. Available online: https://www.sciencebase.gov/catalog/item/61a93820d34eb622f699a7ad (accessed on 6 December 2021).
- NOAA/NCDC. Local Climatological Data Station Details: Madison Dane Co Regional Airport, WI US, Subset Used: November 2014–April 2021. 2021. Available online: https://www.ncdc.noaa.gov/cdo-web/datasets/LCD/stations/WBAN:14837/detail (accessed on 3 May 2021).
- Backstrom, A. Ground temperature in porous pavement during freezing and thawing. J. Transp. Eng. 2000, 126, 375–381. [Google Scholar] [CrossRef]
- Cambridge Systematics, Inc. Cool Pavement Report: EPA Cool Pavements Study-Task 5 (pdf); Draft Report; Environmental Protection Agency: Washington, DC, USA, 2005; Available online: https://citeseerx.ist.psu.edu/viewdoc/download?doi=10.1.1.648.3147&rep=rep1&type=pdf (accessed on 2 September 2021).
- Pitt, R.; Clark, S.; Field, R. Groundwater contamination potential from stormwater infiltration practices. Urban Water 1999, 1, 217–236. [Google Scholar] [CrossRef]
- Wilde, F.D. Geochemistry and Factors Affecting Ground-Water Quality at Three Storm-Water-Management Sites in Maryland: Report of investigations No. 59; Prepared in Cooperation with the U.S. Department of the Interior Geological Survey, The Maryland Department of the Environment, and The Governor’s Commission on Chesapeake Bay Initiatives; Department of Natural Resources, Maryland Geological Survey: Baltimore, MD, USA, 1994; 201p. Available online: http://www.mgs.md.gov/publications/report_pages/RI_59.html (accessed on 1 September 2021).
Figure 1.
General vertical profile of permeable pavement test plots with temperature sensors shown at 0 (top), 15 (middle), and 30 (bottom) cm below permeable interlocking concrete pavers (PICP), pervious concrete (PC), and porous asphalt (PA) subsurfaces. Plots were lined with an impermeable ethylene propylene diene monomer (EPDM) membrane.

Figure 2.
Percentage of days between 1 November and 30 April 2014–2021, where daily profile average, maximum, and minimum temperatures were below or above freezing for surface air, PICP, PC, and PA surfaces. “Simultaneous” dataset is defined by days where all depths of all surfaces were recording. [n, number of days in each dataset].

Figure 3.
Percentage of days between 1 November and 30 April 2014–2021, where daily profile average, maximum, and minimum temperatures were below or above freezing for surface air PICP, PC, and PA surfaces. “Unique” dataset is defined by days where all depths of any single surface were recording. [n, number of days in each dataset].

Figure 4.
Boxplots with daily average, median, minimum, maximum, and outlier temperatures for surface air and three depths below the surface of PICP, PC, and PA surfaces. Dataset included 853 days for PICP, 402 days for PC, and 815 days for PA, encompassing 1269 days of air temperature data between 1 November and 30 April 2014–2021. The lower outlier < Q1 − (1.5 × QR) and Q3 + (1.5 × IQR) < upper outlier, where Q1 is quartile 1, Q3 is quartile 3, and IQR is the inner quartile range, in Microsoft Excel.

Figure 5.
Hourly average temperatures from 17 December 2014 to 17 March 2015 for surface air, PICP, PC, and PA sub-surfaces. Temperature for each depth are averages of the nine monitoring locations for each surface type.
Figure 5.
Hourly average temperatures from 17 December 2014 to 17 March 2015 for surface air, PICP, PC, and PA sub-surfaces. Temperature for each depth are averages of the nine monitoring locations for each surface type.

Figure 6.
Freeze and thaw lag times for three profile depths below PICP, PC, and PA surfaces during the winter of 2014–2015. Lag time is defined as the time elapsed between the hour air temperature falls below or rises above zero and the hour a given depth follows.
Figure 6.
Freeze and thaw lag times for three profile depths below PICP, PC, and PA surfaces during the winter of 2014–2015. Lag time is defined as the time elapsed between the hour air temperature falls below or rises above zero and the hour a given depth follows.


Table 1.
Number of days between 1 November and 30 April 2014–2021, with air temperatures below freezing and above freezing compared to the top, middle, and bottom depths of PICP, PC, and PA for both the “Simultaneous” dataset and the “Unique” dataset.
Table 1.
Number of days between 1 November and 30 April 2014–2021, with air temperatures below freezing and above freezing compared to the top, middle, and bottom depths of PICP, PC, and PA for both the “Simultaneous” dataset and the “Unique” dataset.
| Dataset | Surface Type | Average Temperature below Freezing | Maximum Temperature below Freezing | Minimum Temperature above Freezing | |||||||||
|---|---|---|---|---|---|---|---|---|---|---|---|---|---|
| Air | Top | Middle | Bottom | Air | Top | Middle | Bottom | Air | Top | Middle | Bottom | ||
| Simultaneous Dataset (Days) | PICP (n = 303) | 182 | 111 | 60 | 34 | 120 | 65 | 35 | 14 | 39 | 153 | 205 | 263 |
| PC (n = 303) | 182 | 158 | 125 | 49 | 120 | 101 | 82 | 35 | 39 | 93 | 143 | 214 | |
| PA (n = 303) | 182 | 148 | 112 | 56 | 120 | 61 | 58 | 28 | 39 | 94 | 154 | 212 | |
| Unique Dataset (Days) | PICP (n = 853) | 446 | 227 | 129 | 55 | 291 | 126 | 67 | 22 | 194 | 513 | 647 | 769 |
| PC (n = 402) | 243 | 215 | 170 | 78 | 165 | 142 | 117 | 53 | 46 | 122 | 188 | 277 | |
| PA (n = 815) | 378 | 249 | 173 | 79 | 236 | 104 | 85 | 38 | 227 | 414 | 564 | 687 | |
Table 2.
Freeze and thaw lag times for three profile depths below PICP, PC, and PA subsurfaces for 2014 (27 December 2014–7 March 2015), 2019 A (9 December 2019–20 December 2019), and 2019 B (4 February 2020–21 February 2020). Lag time is defined as the time elapsed between the time air temperature falls below or rises above zero and the time a given depth follows.
| Date | Lag | Top | Middle | Bottom | ||||||
|---|---|---|---|---|---|---|---|---|---|---|
| PICP | PC | PA | PICP | PC | PA | PICP | PC | PA | ||
| 2014 | Freeze Lag (Days) | 0.46 | 0.33 | 0.29 | 2.38 | 1.42 | 2.17 | 4.04 | 3.04 | 3.42 |
| Thaw Lag (Days) | 0.08 | 0.17 | 0.04 | 0.08 | 0.21 | 0.13 | <0.01 | 0.21 | 0.13 | |
| 2019 A | Freeze Lag (Days) | 0.58 | 0.33 | 0.25 | 1.54 | 1 | 1.13 | DNF | 8.46 | 3.79 |
| Thaw Lag (Days) | 0.96 | 1.92 | 2.08 | 0.88 | 1.92 | 3.17 | DNF | 0.88 | 3.21 | |
| 2019 B | Freeze Lag (Days) | 1.71 | 0.67 | 0.29 | 3.92 | 1.04 | 0.29 | DNF | 4.63 | 0.29 |
| Thaw Lag (Days) | TBA | 0.79 | 0.71 | TBA | 0.75 | TBA | DNF | TBA | DNF | |
DNF: Did not freeze. TBA: Thawed before air temperature >0 °C.
Publisher’s Note: MDPI stays neutral with regard to jurisdictional claims in published maps and institutional affiliations. |
© 2021 by the authors. Licensee MDPI, Basel, Switzerland. This article is an open access article distributed under the terms and conditions of the Creative Commons Attribution (CC BY) license (https://creativecommons.org/licenses/by/4.0/).
Share and Cite
MDPI and ACS Style
Danz, M.E.; Buer, N.H.; Selbig, W.R. Subsurface Temperature Properties for Three Types of Permeable Pavements in Cold Weather Climates and Implications for Deicer Reduction. Water 2021, 13, 3513. https://doi.org/10.3390/w13243513
AMA Style
Danz ME, Buer NH, Selbig WR. Subsurface Temperature Properties for Three Types of Permeable Pavements in Cold Weather Climates and Implications for Deicer Reduction. Water. 2021; 13(24):3513. https://doi.org/10.3390/w13243513
Chicago/Turabian StyleDanz, Mari E., Nicolas H. Buer, and William R. Selbig. 2021. "Subsurface Temperature Properties for Three Types of Permeable Pavements in Cold Weather Climates and Implications for Deicer Reduction" Water 13, no. 24: 3513. https://doi.org/10.3390/w13243513
Note that from the first issue of 2016, this journal uses article numbers instead of page numbers. See further details here.