Article

Bacterial Microbiomes in the Sediments of Lotic Systems Ecologic Drivers and Role: A Case Study from the Mureş River, Transylvania, Romania

by
Ioana Boeraş
1,†,
Alexandru Burcea
1,
Cristian Coman
2,
Doru Bănăduc
1,* and
Angela Curtean-Bănăduc
1,†
1
Applied Ecology Research Center, Lucian Blaga University of Sibiu, 550024 Sibiu, Romania
2
Branch of the National Institute of Research and Development for Biological Sciences, Institute of Biological Research Cluj-Napoca, 400015 Cluj-Napoca, Romania
*
Author to whom correspondence should be addressed.
The first and the last authors’ contributions are equal.
Water 2021, 13(24), 3518; https://doi.org/10.3390/w13243518
Submission received: 15 November 2021 / Revised: 3 December 2021 / Accepted: 8 December 2021 / Published: 9 December 2021
(This article belongs to the Special Issue Inland Aquatic Ecosystems and Conservation)

Abstract

:
Numerous sections of the Mureş River vary in terms of the abundance of nitrates, ammonia, and orthophosphates; and of correlated lotic sediment bacterial microbiome structures in terms of both diversity and abundance. This highlights the great versatility of microbiomes in being influenced by the physical-chemical characteristics of environments and their spatial changes. Bacteria microbiomes exhibit dynamic and shifting potential and significant tendencies toward self-organization and self-adaptation. These typical features represent an essential ecologic basis for lotic systems having to do with the use and reuse of various kinds of environmental resource as chemical substances. In this respect, trophic processes assure the river ecosystem optimum health ecologic status dynamic and trend, to be reached. The flexibility of shifting bacterial microbiomes is crucial in maintaining this ecological context’s vital role in biogeochemically sustaining other taxonomic groups, which are spatially and temporally continuous. This is especially important for nutrient cycle processes, even for rivers with high levels of negative human impact, in promoting a functional lotic system.

1. Introduction

Water bodies are profoundly important components of both natural and human systems [1,2,3,4]. Of these, lotic systems are the most diverse, dynamic, and essential for humans, and they are also profoundly influenced by human activity across our planet [5,6]. As a key resource for humans [7,8,9], lotic systems provide water for drinking, irrigation, industry, hydropower, transportation channels, areas for recreation and tourism, etc. However, they also work as a sink for human refuse, in acting as a buffer; they promote the recovery and maintenance of ecosystem health and balance [10,11,12,13,14,15,16,17]. In human impacted lotic systems, environmental flows are a vital tool for managing water in the water-energy-food nexus, environmental flows allocate water among competing uses, within the limits of availability, integrating the water needs of ecosystems with those of other sectors and stakeholders [18,19]. Overall, the water provided and managed within any lotic system, both from quantitative [20,21] and qualitative [22,23] characteristics perspective of an environmental flow, need in-depth knowledge of all the system’s components/compartments. Historically, the field of microbiome research has emerged from environmental microbiome research (microbial ecology) and it provides an interdisciplinary platform and useful approach tool for many fields of interest [24].
Lotic systems’ non-living and living components are characterized by a very high spatial and temporal variability, especially at least since the Industrial Ages [25,26,27,28,29]. This general set of issues exists in numerous subdivisions of the Danube Basin [30,31,32,33,34,35,36,37,38,39,40,41,42,43,44], making them relatively difficult to understand from the perspective of sustainability and management due to their complexity, self-organization, self-adaptation, homeostasis, resilience, autopoiesis, etc. The section of the Mureş River discussed in this paper is not an exception in these respects.
The Mureș River is the largest branch of the Tisza River in the Danube Basin, with a length of 761 km and basin surfaces area of 28,319 km2. Situated in the Carpathian Basin, mostly in the central-western part of Romania (longitude: between 20°11′ E and 25°44′ E; latitude between 45°14′ N and 47°08′ N). It also flows for a short distance in Hungary before entering the Tisza. This river passes through a diverse landscape in its Romanian course. The relief differs greatly differs, with mountains covering approximately 25% of it, approximately 55% consisting of lower highlands, approximately 15% being comprised of valleys and meadows, and approximately 5% being plains [45,46].
The Mureş River watershed was chosen for this research for various reasons: among them, its relatively large area and significance within the Danube Basin [47], the relatively large and important human population existing in this area, including major urban areas [45,46,48], the resulting human impacts and related problems in this basin [49,50,51,52,53,54,55,56]. These factors affect the diversity and the variability of environments over space and time and biocoenosis in the river and its watershed.
The impact of several pollutants has been assessed in terms of the Mureş River’s main features of biodiversity, including phytoplankton, zooplankton, macrozoobenthos, fish, and bacteria. The later has been investigated mainly by targeting specific groups, such as both general and fecal coliforms, fecal streptococci, etc. [57,58,59,60,61,62,63,64]. Overall, there have been relatively few studies of the bacterial communities in rivers across Romania, with only a single large-scale study covering the Danube River, including its Romanian section [65]. Other studies with to do with this river have mostly focused on narrow, targeted goals, such as pathogenic bacteria, coliforms associated with anthropic impact, or bacteria that are resistant to antibiotics [66,67].
In general, aquatic ecosystems are multidimensional, highly structured, and functionally complex [68,69,70,71,72,73,74]. Such complex adaptive systems imply diversity through a great number and wide variety of interdependent, yet autonomous, parts structured as networks. These also have the ability to change and learn from past events and experiences [75].
The ecological trend of the decreasing health of lotic systems around the World, including major ones [76,77,78,79] that are expected to have high resilience, raises a major concern at least in the scientific world about what management approaches should be used, as well as the potential weaknesses of the present scientific background used in the development of management strategies and actions [80]. Is there enough in-depth scientific knowledge to constitute a basis for real, viable management systems?
It is clear that a diversity of such ecosystem components are essential in providing complexity, self-organization, self-adaptation, homeostasis, resilience, autopoiesis, and dynamics of ecologic sustainability. Each component category is important in enriching and empowering lotic systems. However, a question still remains as to whether there are certain categories of components that more important than others. Which taxonomic groups comprise the communities with the greatest and most expedient capacity for self-organization? Which exhibit nonlinear adaptive behavior and are relatively less dependent on historical events, initial conditions, and present context? Which react and adapt in coordinated fashion to natural and anthropogenic stressors, support other categories of system components/taxonomic groups/communities, and make the ecosystem resilient?
This paper’s major objective is to highlight the bacteria taxonomic group/communities, as a principal decomposing functional compartment, more important than others at least from this paper approach perspective, without to diminish the other taxonomical groups and communities importance in a lotic system, based on the Mureş River study case.

2. Background

Bacteria, the earliest cellular life forms and the primary biomass on the planet, have achieved evolutionary success through rapid evolution, leading to great adaptability [81]. It is clear that accentuated temporal dynamics are a key to the success of bacteria as a taxonomic group. However, what is the role of spatial dynamics in terms of the success of the representatives of this group and the other taxonomic levels with which it is directly or indirectly related? What must be done in order to integrate bacteria into our understanding of lotic systems, as well as their assessment, monitoring, and management?
In general, sediments play an important role in the ecologic state of lotic systems [82,83,84]. The most important ecological processes in lotic systems, such as biogeochemical and nutrient cycling, are mainly accomplished by microbial communities in sediments [85,86,87], accounting for up to 90% of respiration [88,89,90,91,92]. The ability of lotic systems to maintain their biodegradation and bioremediation processes is linked to the diversity of microbial communities in sediments [93]. Despite the fact that river sediment microbiome is much more diverse than the water microbiome [94,95,96], it has still been poorly described [97,98]. Microbial communities are sensitive to changes in the environment physicochemical parameters [99,100,101,102] and can serve as indicators of ecological changes and degradation [103]. Beyond the indication value of the microbial biomes, we intend to reveal in this research their characteristics with to do with rapid adaptation. This characteristic has consequences for significant biogeochemical and nutrient cycling processes, which support other taxonomic groups/communities with less resilience in situations of natural and anthropic disturbance.
Microbial communities in river sediments are comprised of a core group of bacteria. Research on lotic bacterial communities show Proteobacteria and Actinobacteria to be the most abundant phyla [104,105,106,107,108,109,110,111]. Phyla including Bacteroidetes, Cyanobacteria, and Verrucomicrobia were also found to be well represented [112]. Betaproteobacteria is the class best represented numerically as demonstrated in studies of freshwater rivers across three different continents, such as the Elbe River in Europe [113], the Songhua River in Asia [114], and the Ipswich River in North America [115]. Betaproteobacteria was also the best represented class in studies of river sediment [116,117].
Microbiome composition and diversity, however, changes in concordance with natural and anthropic factors. Among the natural factors that have been shown to influence bacterial community composition are salinity, seasonality, temperature, and nutrients. Some studies have even shown a relationship among bacterial community diversity along the river, with diversity increasing downstream [118]. In addition to natural factors, anthropic influence also shapes the microbial communities in river ecosystems. Among the main anthropic influences are presence of wastewater treatment plants, pollution with heavy metals, and pollution from other types of industry and agriculture [119,120,121].
Knowledge of bacterial communities in lotic systems is more limited in comparison with lentic ones; however, knowledge of bacterial communities in river sediments from is even more limited. This only makes them even more important to study, especially given the fact that bacterial diversity research, such as that in the Tongue River (Montana, USA), have found their sediment samples to be the richest and most novel studied to date4.
The bio-complexity of lotic systems various across spatio-temporal scales can be understood in broad, often discontinuous, patterns along longitudinal and lateral dimensions of river networks, as well as local ecological patterns across various temporal and spatial scales [122], especially if the representatives of all major taxonomic groups are considered. Can bacteria be missed or be underestimated from such ecological approaches?
The ecological integrity of lotic ecosystems relies on both structure and function. Structural integrity mainly refers to the qualitative and quantitative composition of biological communities, and functional integrity concerns the rates, patterns, and importance of ecosystem-level processes [123].
Ecosystem size and complexity play comparable roles in regulating biodiversity and ecological status [124]. Can bacteria be missed or underestimated from studies which try to understand the lotic system’s complex structure and functional role?
In this study, we assess the diversity of microbial communities in sediments from sampling sites distributed through 761 km of the Mureş River. A molecular approach was applied for microbial taxonomic group identification and diversity characterization using Next-Generation Sequencing (NGS) of the 16S ribosomal RNA (rRNA) gene as marker. Thirteen sites were sampled and analyzed, and the differences among them were characterized by differences in the chemical characteristics of the sediments, revealing the adaptability characteristics of various microbial communities.

3. Materials and Methods

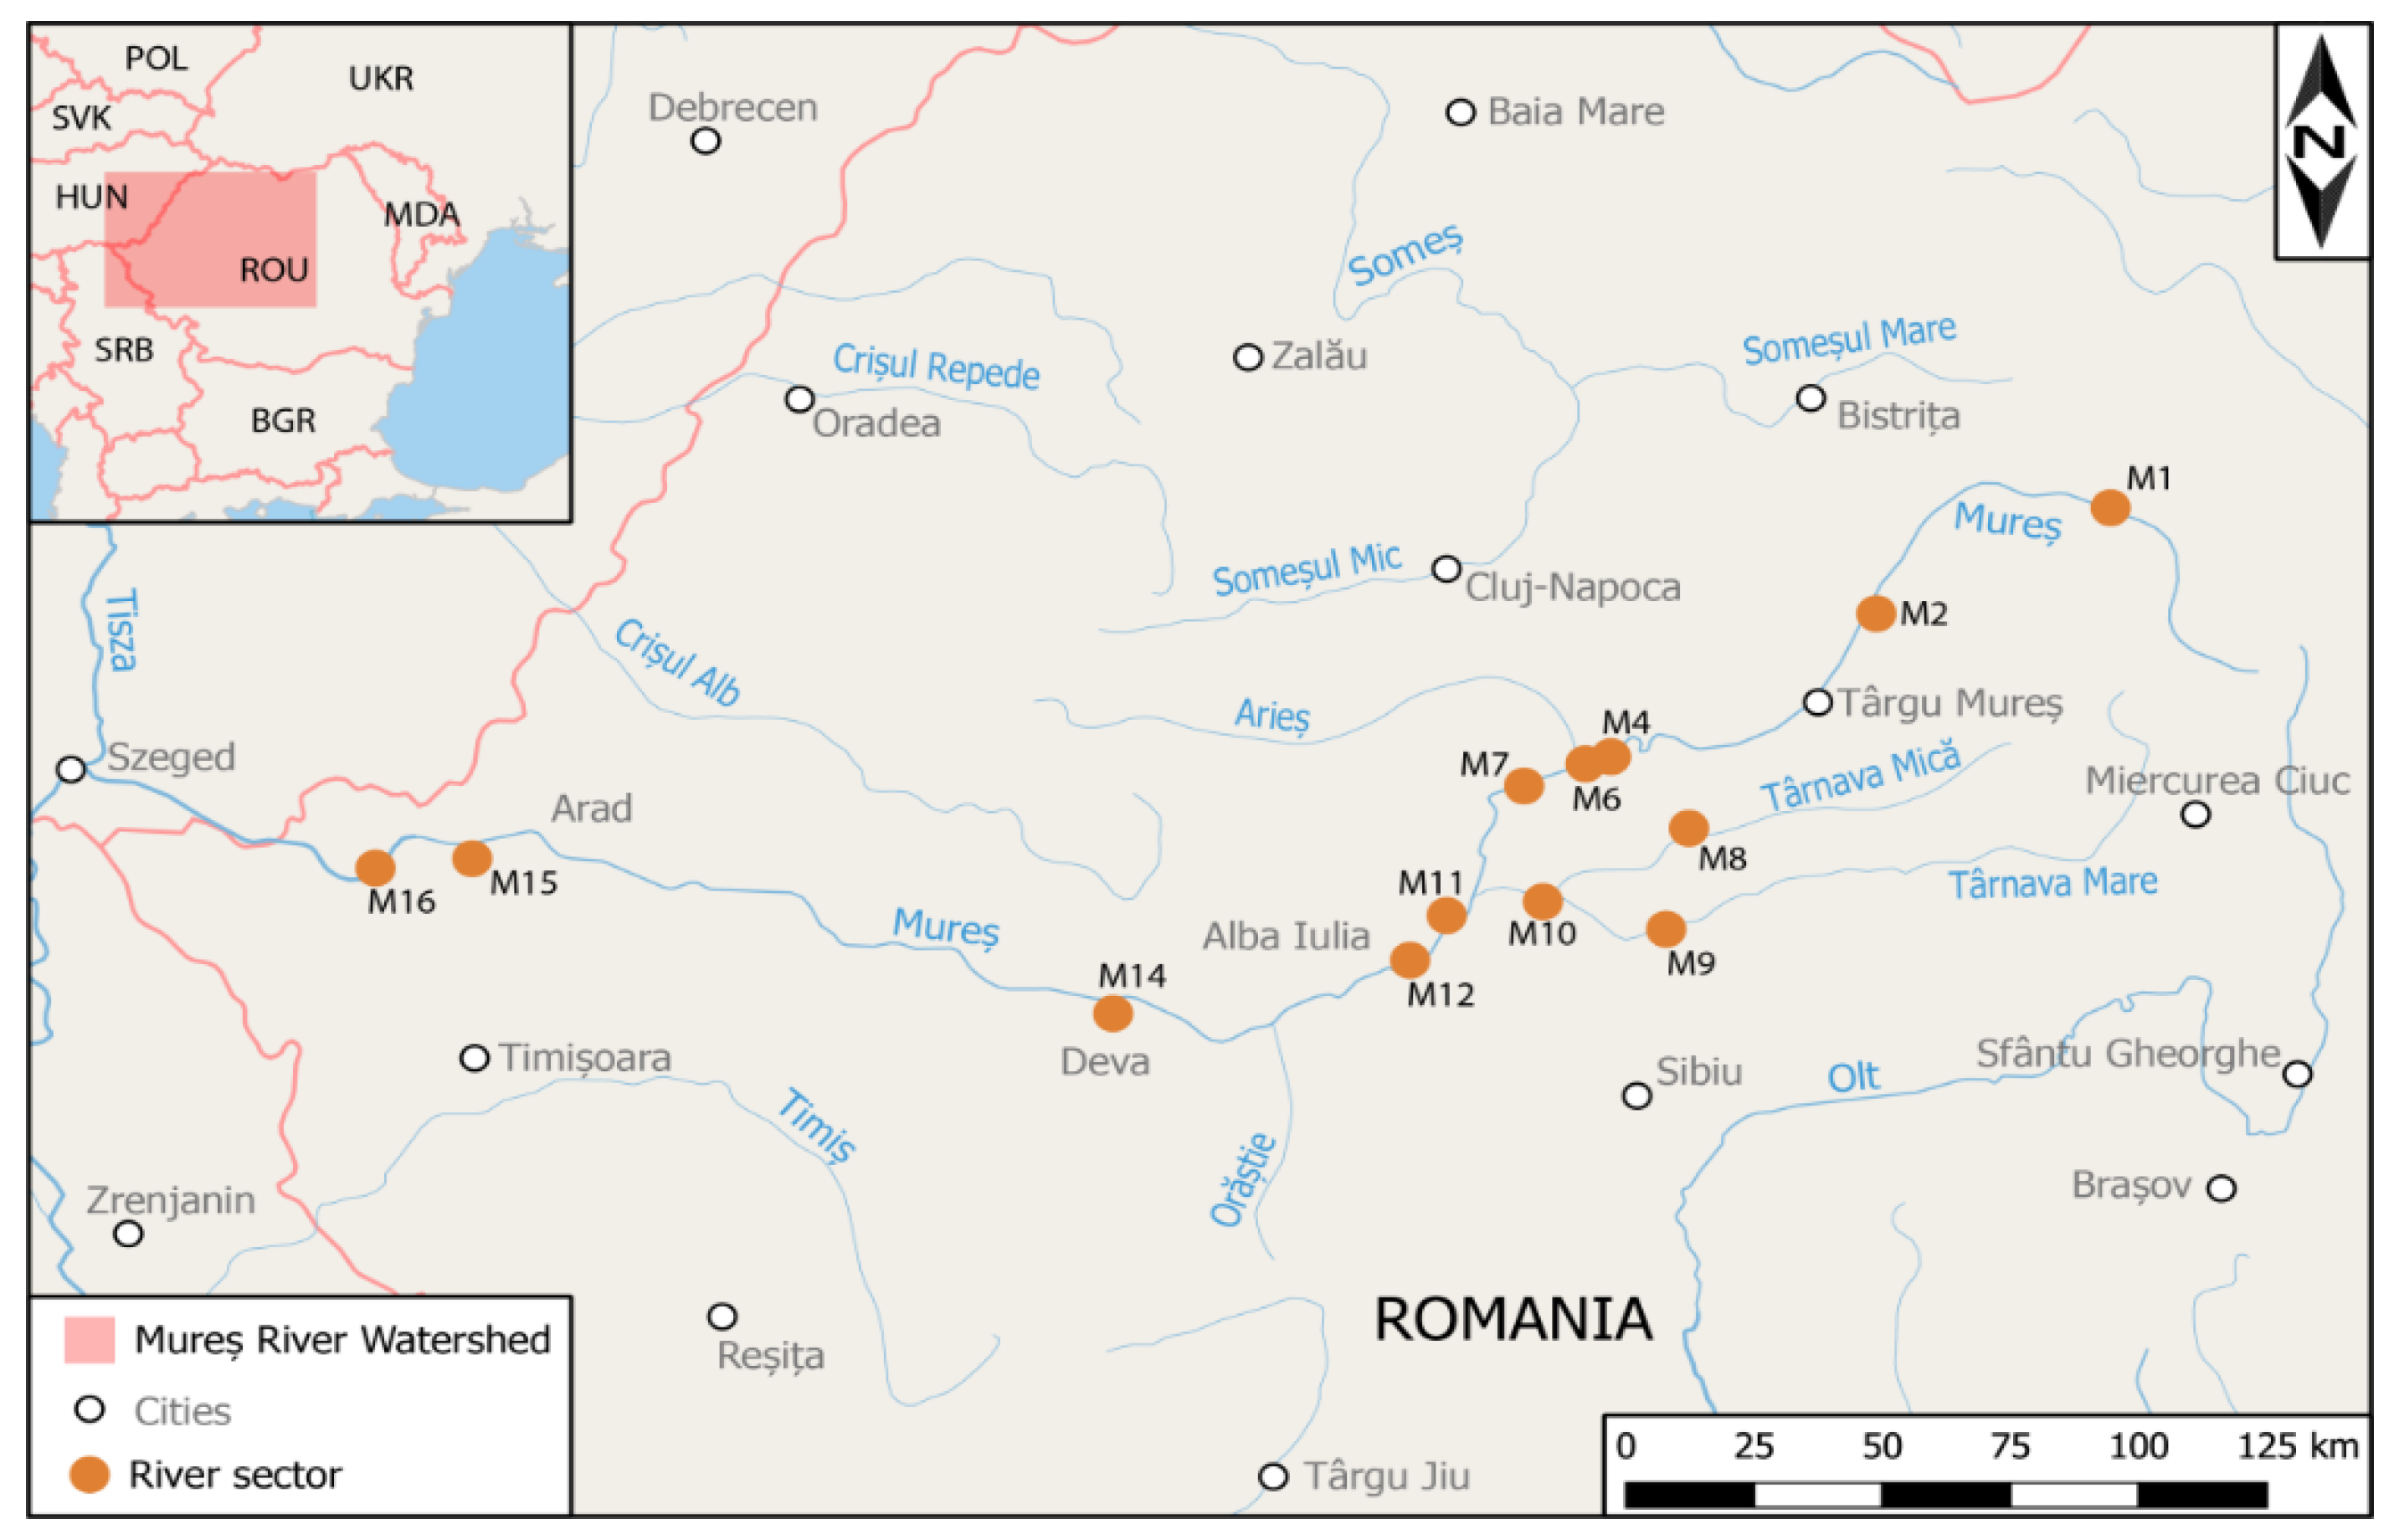
3.1. River Sector Sampling and Chemical Analysis

Sediment samples were collected along the Mureș River and its tributaries in the spring–fall of 2016, including 13 different river sectors (M1, M2, M4, M6, M7, M8, M9, M10, M11, M12, M14, M15, and M16; Figure 1).
In the altitude range of M1–645 m, the average width of the minor riverbed was 25 m (max. 30 m, min. 20 m). The river has a mountainous appearance, with a steep slope in the center of the riverbed. The substratum consists of boulders and medium-sized stones, and gravel and sandy areas appear toward the banks. There is a stand of willows on the banks.
In the altitude range of M2–358 m, the average width of the minor riverbed 90 m (max. 110 m, min. 70 m), and there is a relatively uniform linear flow. The substrate consists predominantly of medium-sized stones. Boulders appear in the center of the riverbed and, toward the bank, there is gravel covered with a bioderm and the presence of sandy surfaces. Riparian vegetation consists of willows.
In the altitude range of M4–277 m, the average width of the minor riverbed is 60 m (max. 80 m, min. 40 m). It has slower linear flow. The substrate consists of mud, clay, fine and sand; and, toward the center of the riverbed, there are surfaces with small, medium, and large stones on a marl bed. The banks are steep and covered in grassy vegetation and, on the right bank, there are willow trees.
In the altitude range of M6–268 m, the average width of the minor riverbed is 65 m (max. 85 m, min. 45 m). It has a slower smooth flow and, in the riverbed, there is a bottom threshold. The substrate is formed of large and medium stones on mud bed. The course is meandering and the riparian vegetation is grassy, though willow trees also appear in certain places.
In the altitude range of M7–259 m, the average width of the minor riverbed is 65 m (max. 85 m, min. 45 m) and the substratum consists of gravel on a bed of sand. On the banks, there are grassy vegetation and willow trees.
The altitude range of M8–197 m is downstream from the town of Târnăveni on the Târnava Mică River. The riverbed substrate is composed of pebbles and sand covered with mud and periphyton. The maximum riverbed width is 12 m.
The altitude range of M9–288 m is downstream from Copșa Mică on the Târnava Mare River. The riverbed substrate is composed of pebbles and sand covered with black mud and periphyton. The maximum riverbed width is 15 m and, in this sector, the river is meandered and connected with pools in the major riverbed.
The altitude range of M10–238 m altitude is downstream from Blaj on the Târnava River. In this river sector, the major riverbed is large and the minor riverbed reaches approximately 50 m. The river presents a net of secondary branches and backwaters, which in periods of flooding, connects with the minor riverbed. The river substrate is composed of pebbles and coarse sand in the center. Near the banks, there are surfaces with fine sand and clay covered with mud.
In the altitude range of M11–278 m, the average width of the minor riverbed is 70 m (max. 90 m, min. 50 m). The substrate consists predominantly of gravel on a bed of sand and mud, and sandy surfaces appear on the banks.
In the altitude range of M12–218 m, the average width of the minor riverbed is 75 m (max. 95 m, min. 55 m) and the substrate consists of gravel on a bed of sand. On the bank, the gravel is covered with bioderm.
In the altitude range of M14–171 m, the average width of the minor riverbed is 75 m (max. 90 m, min. 55 m) and the substrate consists of gravel on a bed of sand and mud. In the bed, there are depressions/pots and, on the banks, there is a strip of willows trees.
In the altitude range of M15–106 m, downstream from Arad, the average width of the minor riverbed is 80 m (max. 95 m, min. 65 m). The substrate consists of gravel on a bed of sand and mud. In the bed, there are depressions/pots and, on the banks, there is a strip of willow trees.
In the altitude range of M16–99 m, at Semlac, the average width of the minor riverbed is 85 m (max. 95 m, min. 70 m). The substrate consists of gravel on a bed of sand and mud. In the bed, there are depressions/pots and, on the banks, there is a strip of willow trees.
The sediment analyzed in this study was collected manually from the surface of the riverbed substrate (at 50 cm water depth) with the help of a plastic vessel. The supernatant was removed and 200 g of sediment were placed in the sample vessel and frozen in the field at −20 °C, and stored at −50 °C once transported to the laboratory. Levels of ammonium nitrogen, nitrates, and orthophosphates in the sediment samples were measured using spectrophotometric methods. Ammonium, nitrogen, and nitrates were extracted from 10 g of sediment using 50 mL of 0.2 M potassium chloride (KCl). The KCl solution was added to the sediment, agitated for 1 h, allowed to clarify by precipitation. The clear supernatant was then decanted, filtered, and used to measure the nitrogen content of the compounds. Ammonium nitrogen levels were measured using the spectrophotometric method specified in the SR ISO 7150-1 September 2001, while nitrates were quantified using the SR ISO 7890-3 March 2000. Phosphorus was extracted from 5 g sediment using 50 mL of 0.5 M sodium bicarbonate (NaHCO3). The solution was incubated for 30 min on a shaker, allowed to precipitate and then the clear supernatant was decanted and filtered. Orthophosphates were measured using the spectrophotometric method of ammonium molibdate according to SR EN ISO 6878 August 2008.

3.2. DNA Extraction and Quantification

From each river sector, DNA was extracted from the sediment samples in triplicate using 500 mg of sediment and the Quick-DNA Fecal/Soil Microbe Miniprep kit (Zymo Research, Irvine, CA, USA), following the manufacturer’s instructions. Briefly, sediment was weighted and added to the tube containing bashing beads and 750 μL of the bashing bead buffer. The tubes were vortexed at maximum speed for 20 min and then centrifuged for 1 min at 10,000× g. The supernatant was combined with the genomic lysis buffer and the lysate was loaded onto a spin column for DNA binding. After two steps of washing, DNA was eluted from the column with the DNA elution buffer. After a final cleaning step for humic acid removal, the amount of DNA was quantified using an 8000 NanoDrop (ThermoFisher, Waltham, MA, USA) and its quality assessed by electrophoresis on a 0.8% agarose gel, followed by storage at −20 °C. For microbial diversity investigations, DNA was sent to the LGC Group (Berlin, Germany) for Next-Generation Sequencing on an Illumina MySeq platform.

3.3. 16S rRNA Gene Metabarcoding Analysis

The gene for 16S ribosomal RNA was amplified using primers targeting the V3–V4 region [125] with specific adapters and barcodes for multiplexing. Libraries were demutiplexed using the Illumina bcl2fastq 2.17.1.14 conversion software (lllumina bcl2fastq San Diego, CA, USA). When the barcode distances between all libraries on the lane permitted, one or two mismatches or “Ns” were allowed in the barcode read. Reads with missing barcodes, one-sided barcodes, or conflicting barcode pairs were discarded. Additionally, reads shorter than 100 nucleotides were discarded. After sorting, the barcode and adapter sequences were removed. The next steps were performed using QIIME 2 workflow [126,127]. First, sequence quality control and feature table construction were carried out using the DADA2 plugin, which corrects amplicon sequence data and filters phiX reads and chimeric sequences [128]. In this step, nucleotides corresponding to the primer sequences were deleted and based on the quality of the reads, forward sequences were trimmed to a maximum length of 280 nucleotides, and reverse sequences to 240 nucleotides. Sequences were aligned with MAFFT [129], followed by a phylogenetic tree construction with FastTree 2 [130]. Replicated sequences at each sampling site were grouped by a mean-ceiling followed by rarefaction [131] to a maximum depth of 8291 sequences. We used a classifier that was developed based on our data using a Naïve Bayes method [132] with the used primer pair [125] and the Greengenes 13.8 database [133] at 99% identity. The generated classifier was then used to reference our sequences with the sklearn plugin [133].
The sequence data generated in this study were deposited in GenBank/NCBI Sequence Read Archive (SRI)/ under the accession number PRJNA761896 (https://www.ncbi.nlm.nih.gov/sra/PRJNA761896, accessed on 11 October 2021).

3.4. Statistical Analysis
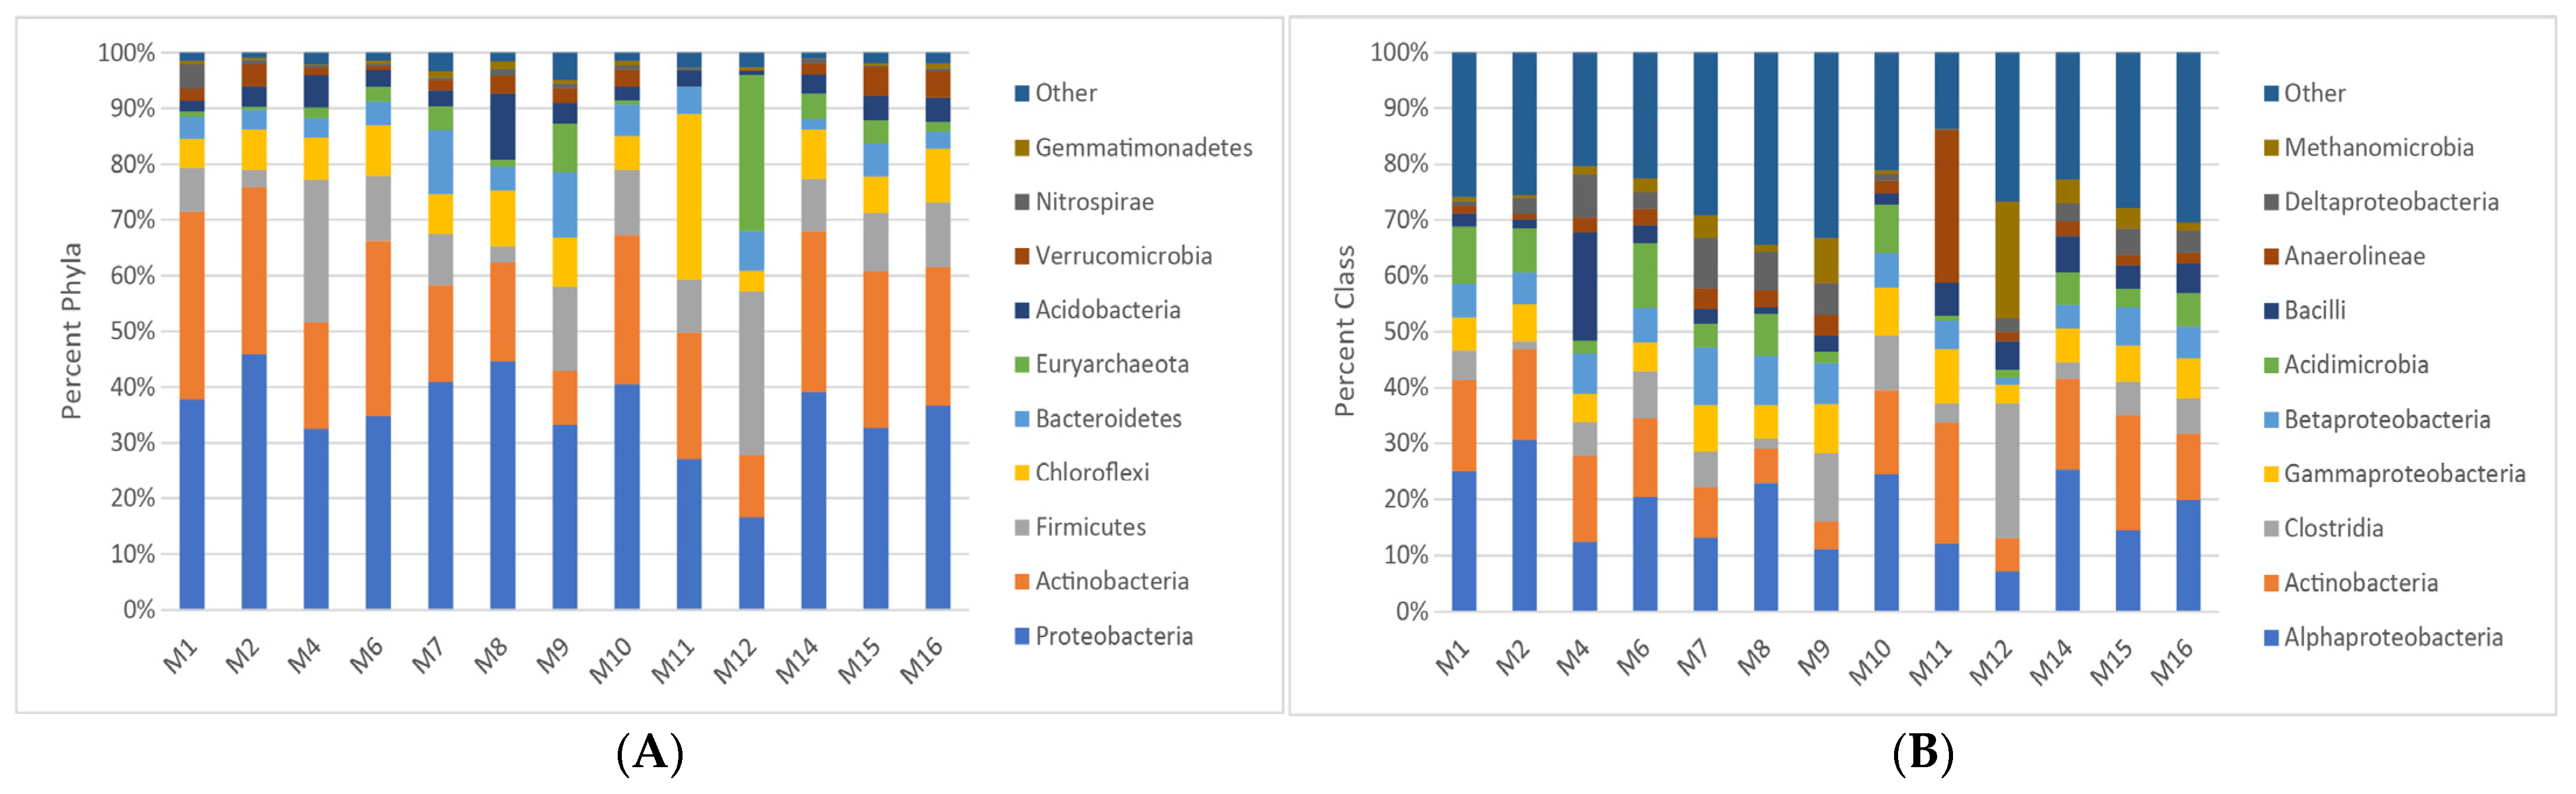
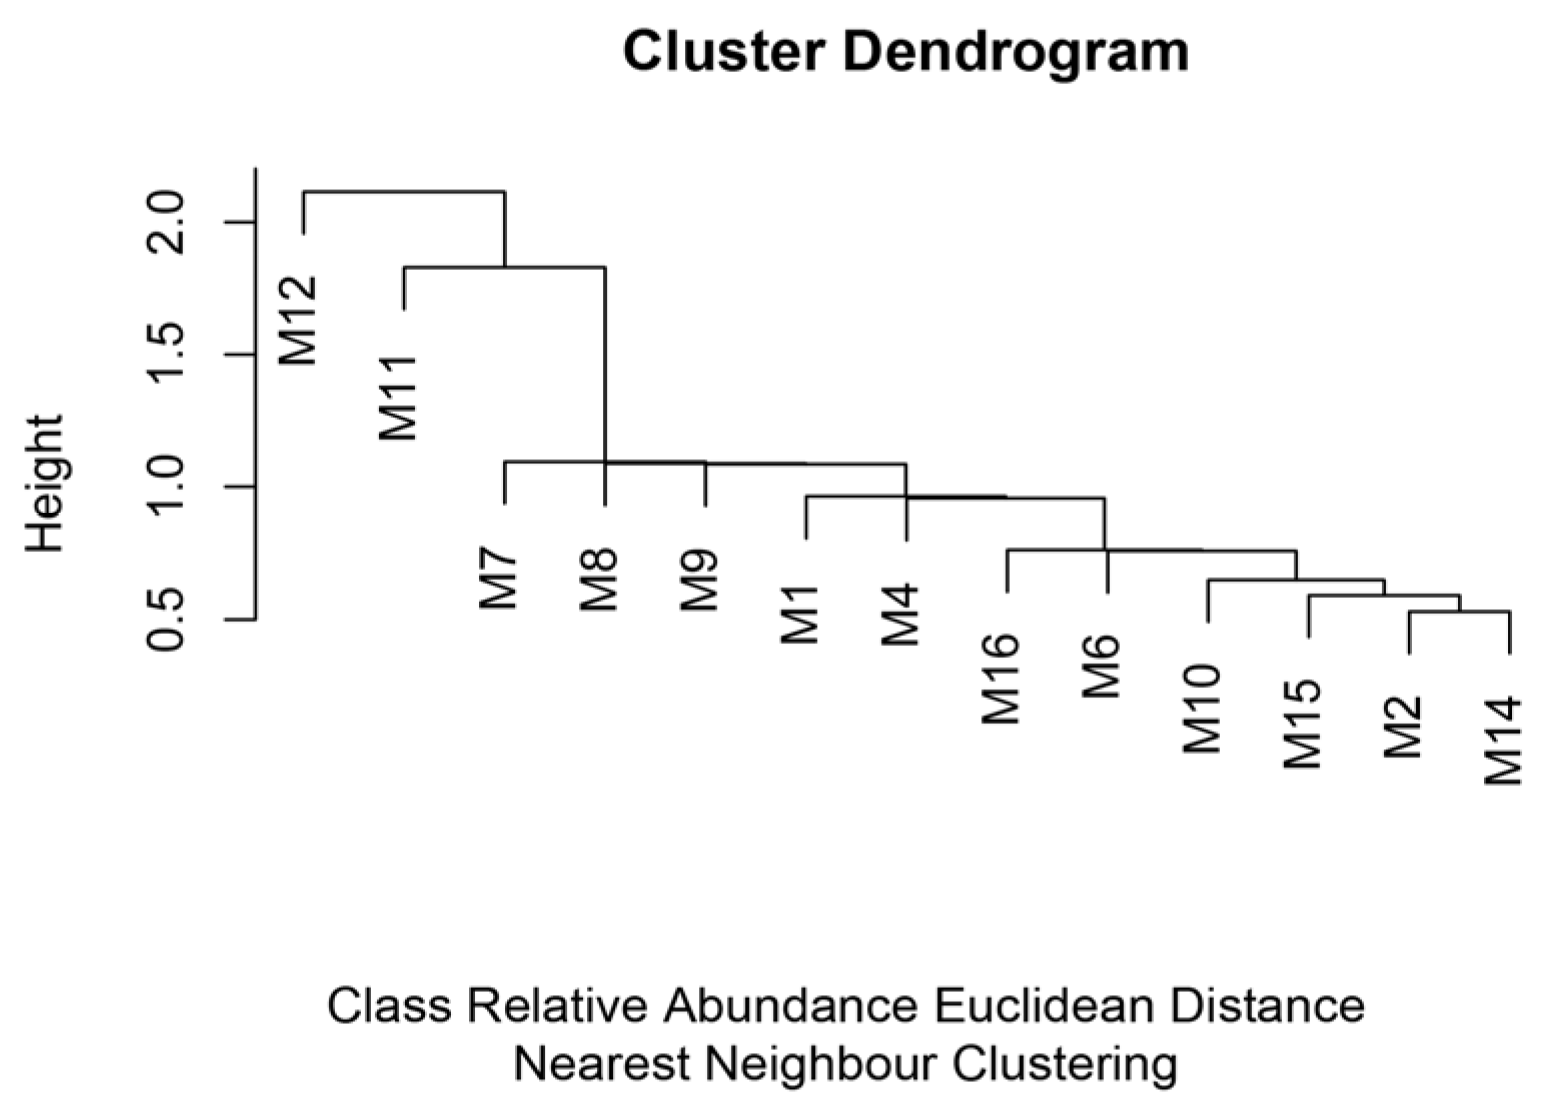
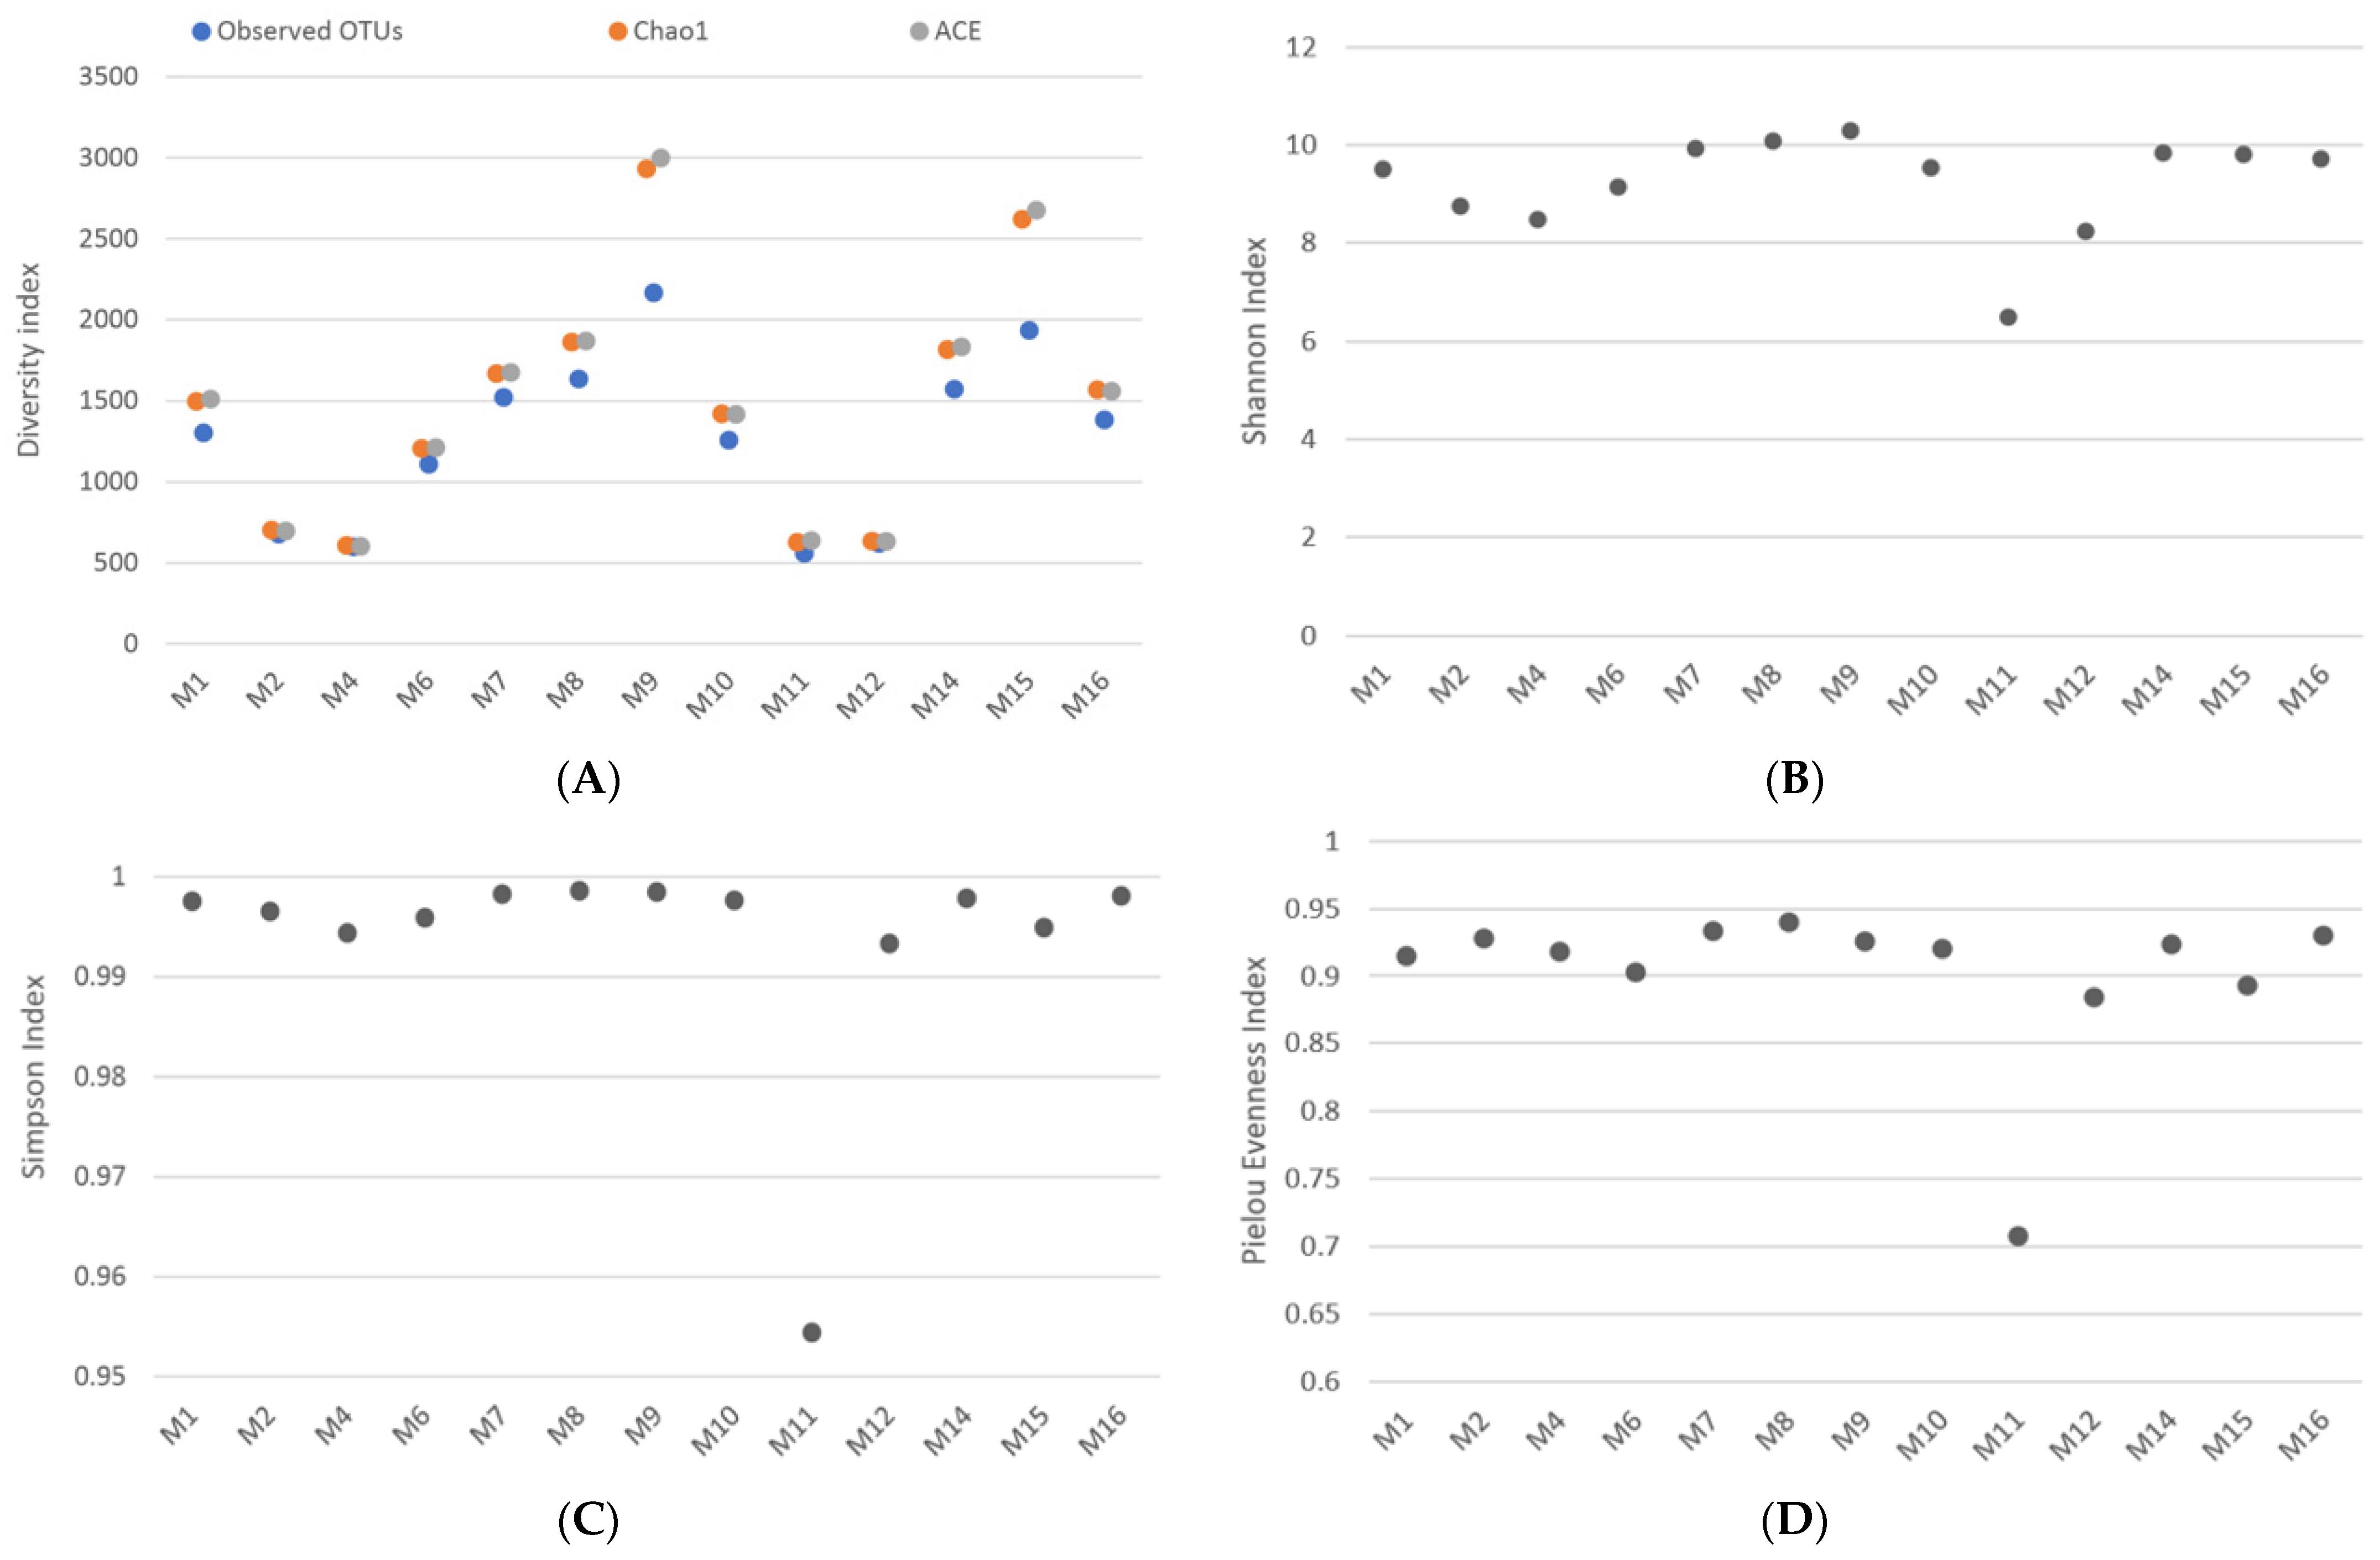
Alpha diversity metrics (observed OTUs Shannon [134], Chao [135], ACE [136], Simpson, and Pielou Evenness [137]), as well as beta-diversity metrics (unweighted UniFrac [138], generalized UniFrac [139]), weighted normalized UniFrac, weighted unnormalized UniFrac [140], Bray-Curtis [141], Euclidean [142], and Jaccard [143] distances were computed using the QIIME 2 diversity workflow. The Euclidean distance was calculated in R 3.5.3 and we employed the Nearest Neighbor clustering method [144] for river sector similitude analysis based on taxonomy and relative abundance. Data were graphed in QIIME 2 using Emperor plot [145] or in R using the ggplot2 package [146]. Canonical correspondence analysis, a constrained ordination method, of the species variability among samples, containing the sediment chemical composition as supplementary variables was done using Canoco 5.
First, we assayed for richness by looking at the Chao1 and ACE indexes. For species diversity we used the Shannon and Simpson indices, while for evenness we computed Pielou Evenness. To compare microbial community structures among the river sectors, we used beta-diversity metrics such as Bray-Curtis and unweighted UniFrac. To identify the bacterial communities in each river sector in relation to the chemical composition of the sediment, we used the ordination methods in Canoco5 and canonical correspondence analysis (CCA).

4. Results

A total of 774,897 high quality reads were obtained after sequencing with an average of 22,139.91 reads per sample replicate. Sequences not affiliated with Bacteria and Archaea were removed. Samples were grouped by mean-ceiling and rarefied to the lowest number of good quality reads (i.e., 8291 corresponding to sample M12) (Figure 2A,B).
The relative abundance of Bacteria and Archaea was calculated at each phylogenetic level for each sample location (Figure 3A,B).
The bacterial phylum Proteobacteria was found to be the most prevalent, with an average abundance of 35.5% in the sequencing libraries, the highest abundance being observed in M2 (45.85%) and the lowest in M12 (16.6%). The second most abundant bacterial phylum was Actinobacteria, at an average of 23.2%, with the highest abundance in sample M1 (33.8%) and the lowest in M9 (9.7%). This was followed by Firmicutes and Chloroflexi, with relative abundances of 12.1% and 9.2%, respectively. Firmicutes was disproportionately represented in the sequencing libraries, from a 3% abundance in M2 and M8, to 25% in M4 and 29% in M12—nearly a 10-fold increase. In the case of Chloroflexi, most sequencing libraries had abundances around the average of 9%, with the exception of M11, where a steep increase to 29.9% was observed. Other bacterial phyla that were well represented are Bacteroidetes (5.5%) and Acidobacteria (3.9%) (Figure 3A). Euryarchaeota, from the domain Archaea, also had a high average abundance in M12, with 28% of all phyla, seven times higher than its average abundance of 4.5%. The increased abundance of Firmicutes and Euryarchaeota in M12 was countered by a decreased abundance of Proteobacteria, the lowest in all the sequencing libraries investigated (Figure 2A). The best represented phyla are in agreement with other similar studies that find Proteobacteria as the best represented in river sediment.
At the class level, Alphaproteobacteria were the best represented, constituting 18.4% of all bacterial sequences analyzed. They were followed by Actinobacteria, with 13.3%, and Clostridia, with only 7.7%. Other well-represented classes of bacteria were Gammaproteobacteria (6.7%), Betaproteobacteria (6.2%), Acidimicrobia (5.5%), Bacili (4.8%), and Anaerolineae (4.3%) (Figure 3B). At the order level, the three most abundant were Actinomycetales, Rhizobiales, and Clostridiales. At the family, genus, and species levels there were greater differences among sampling sites, which renders their average levels basically irrelevant, with some families, genera, and species being better represented in some sequencing libraries to the detriment of others. A high percentage of reads could not be associated with any known taxonomic group, implying a high abundance of possible novel prokariotic taxa. However, a total of 756 amplicon sequence variants (ASV) could be identified at species level.
Of the 756 ASVs, 25 were present in all of the samples analyzed, displaying a wide distribution. The sum of all unique ASVs, including those found only in one sampling site, was 229 (30.29% of total). Overall, sites M11 and M12 exhibited microbial community compositions that appear most different from the others (Figure 4).
Species diversity in each river sector was assessed by computing multiple alpha diversity indices. First, we assayed for richness by looking at Chao1 and ACE indexes. We observed that M9 had the highest species richness, in contrast with the lowest richness in M11 (Figure 5A). These values mirrored the number of observed ASVs at each location (Figure 5A). For species diversity, Shannon and Simpson indices were used, while for evenness, the Pielou evenness index was computed. The Shannon index indicated M9 as the site with the highest species diversity while the Simpson index shows M8 to be the most diverse (Figure 5B,C). Sample M11 has the lowest species diversity based on these two indices (Figure 5B,C). Evenness measurements by the Pielou index shows M8 to have the highest level, while sample M11 remains the lowest (Figure 5D).
To compare microbial community structures between the river sectors, we used beta-diversity metrics such as Bray-Curtis and unweighted UniFrac The Bray-Curtis dissimilarity metrics shows us the differences in ASV abundance while unweighted UniFrac also takes into account the phylogenetic relatedness between the species present in each river sector. Results of the beta-diversity metrics were plotted with the Emperor Plots of the Principal Coordinates Analysis of the beta-diversity metrics was plotted using Emperor Plots in Qiime 2 (Figure 6). The Bray-Curtis distance shows most river sectors group together with a few sites being outliers (Figure 6A). Sectors M11 and M12 stand out as the most different from the others, while M1 and M2 form a distinct group, as well (Figure 6A). When phylogeny is taken into account using unweighted UniFrac, a similar pattern is observed (Figure 6B). Again, bacterial communities in most river sectors seem to be similar, which is underscored by their clustering on the plot. However, once again, river sectors M11 and M12 stand out from both the other sectors and from each other (Figure 6B).
To understand the possible drivers of bacterial community structure in the investigated sediments, a chemical analysis was performed, targeting nitrate, ammonia, and orthophosphate concentrations (Table 1).
We looked at how bacterial communities at each river sector relate to the chemical composition of the sediment using the ordination methods in Canoco5. Canonical correspondence analysis (CCA), a constrained ordination method, was chosen because it can directly extract the variation that is explainable by the measured environmental variables. In unconstrained ordination, the axes of maximum variation in species composition are extracted first, and then the environmental variables are fit to them. We find that total variation is 2.00969 and the explanatory variables account for 48.98%. The adjusted explained variation is 31.97%. The permutation test results on all axes show an f value of 2.9 and a p value of 0.009. As with the beta-diversity analysis presented above, we see most river sectors cluster together, while sectors M11 and M12 are divergent (Figure 7). However, this analysis shows that the bacterial community in river sector M11 correlates with high concentrations of orthophosphates while the bacterial community in river sector M12 correlates with high concentrations of ammonia (Figure 7). All other river sectors cluster at the intersection of the axes suggesting no marked influence by the sediment chemical composition (Figure 7). A slight negative correlation with the number of orthophosphates can be seen in sectors M2, M15, and M6 and with ammonia in sector M8 (Figure 7). If an unconstrained canonical analysis is employed, the results mirror the ones from constrained analysis in terms of variation and the extent to which the explanatory variables account for this variation (2.00969 and 48.98%, respectively).

5. Discussion

The continuous historical human presence and activities with negative effects on the Mureş River water are various and significant: numerous localities including big ones, forestry, timber production and wood processing, agriculture (crops and animal husbandry, pasture and hay, vineyards, orchards), non-ferrous industry, tools and machinery industry, chemical industry, metallurgy, glass, porcelain, ceramics and earthenware, pulp and paper, building materials, food, light industry (textiles, fur and footwear), etc. [45,147]. Therefore the diverse water quality along the studied river induce conditions for the diversity of the sediment microbiomes.
Microbial communities are an essential link in the lotic trophic chain. They are both shaped by the environment in which they live and, in turn, they shape their environment [148]. Our knowledge of the diversity of microorganisms in sediments from rivers is relatively limited for Romania. One major limitation is the inability to culture such microorganisms using classical culturing techniques. However, our knowledge of these organisms has increased exponentially with the advent of new high-throughput sequencing technologies [95,96]. In this study, we used the 16S ribosomal RNA gene as a barcode for identifying bacterial diversity in river sediments using an NGS approach. We observed that the bacterial communities’ diversity is conditioned and shaped by sediment chemical composition, i.e., nitrogen (nitrates, ammonia) and phosphorus (orthophosphates) concentrations.
When looking at the relative abundance of bacterial phyla in the different river sectors, we found Proteobacteria to be the most abundant. This result is in agreement with results from other similar studies [111,112,113,114]. Other phyla that were abundant in our study are Actinobacteria, Firmicutes, and Chloroflexi. Although these bacteria phyla are similarly abundant across most of the river sectors, some river sectors stand out by having other phyla dominant. In sector M11, there is a high abundance of Chloroflexi, while Proteobacteria and Firmicutes are less well represented compared to the other river sectors. This pattern can be associated with higher orthophosphate quantities. Sector M12 also exhibits a low abundance of Proteobacteria while Firmicutes and the Archaea phyla Euryarchaeota are much better represented compared to other sites, this structure can be associated with higher ammonia quantities. From the beginning, we see differences in bacteria abundance and diversity among the different river sectors.
The bio-ecological roles of the main identified taxa are diverse and complex, for example: Proteobacteria offer extreme metabolic diversity [148]; Actinobacteria play an essential role of recycling biomaterials by decomposing complex mixtures of polymers in dead plants and animals and fungal materials and in producing important bioactive natural metabolites [149]. The Firmicutes importance rely on their characteristic as biofertilizers, biocontrol agents, metals uptake enhancers [150] Chloroflexi provide the filamentous scaffolding around which flocs are formed, to feed on the debris from lysed bacterial cells, to ferment carbohydrates and to degrade other complex polymeric organic compounds to low molecular weight substrates to support their growth and that of other bacterial populations; also remove nitrogen and phosphorus [151], etc.
We see an almost perfect correlation between Chao1 and ACE, and a very strong correlation with the observed species. This suggests the sampling depth was appropriate and representative for the samples. As expected, the Chao1 and ACE indices are above the observed species. The more species in a sample, with the greater the difference between the observed species and Chao1 and ACE.
Sector M9 has the highest species richness and also the highest Shannon index value. This is expected since the Shannon index relies mostly on species richness. Sector M8 has the highest Simpson diversity because this index also takes into account the evenness of the species distribution. Since river sector M8 has a high level of species richness and the greatest species evenness, it is not surprising that it has the highest Simpson diversity index value. Sector M11 stands out as having the lowest species abundance, richness, diversity, and evenness. It is possible that due to the high orthophosphate concentration, few bacteria species/systematical categories can find their ecological optimum in these conditions. It has been shown that nutrient availability shapes bacterial community structure [152,153,154]. Our results show high orthophosphate levels are associated with low bacterial diversity.
Even at the outset, it is obvious that sectors M11 and M12 are divergent from the others. Just by visually looking at the community structure, these sectors stand out. When we then look at diversity, this difference is confirmed. First, we see through alpha diversity that M11 has very low species diversity. Then, beta-diversity further confirms that the M11 bacterial community is different from the other river sectors. M12 is not as striking, though it is just as divergent from the other samples, including M11. These are the two extremes: M12-species which prefer or are able to tolerate high levels of ammonia (nitrogen in this form), and M11-species which are associated with high levels of orthophosphates.
Out of 13 sampling sites, 2 stand out as being the most divergent in terms of bacterial community composition and one has the lowest diversity. These differences can be explained by differences in the chemical composition of the sediments at the respective sites and they reveal the adaptive characteristics of these microbial communities as a basis for the lotic ecosystem’s complexity, self-organization, self-adaptation, homeostasis, resilience, autopoesis, ecological status, changes over time, and (last but not least) uninterrupted ecologic connections and processes. All of these are needed to sustain the other community categories and the proper overall functioning of the lotic system.

6. Conclusions

More than 50% of the sampling stations (M1, M2, M4, M8, M9, M11, M12) along the Mureş River vary significantly in terms of sediment physical-chemical characteristics (nitrates, ammonia, and orthophosphates) and their correlated bacteria microbiome structure, diversity, and abundance at different taxonomical levels (from phylum to species). This reveals the highly flexibility/adaptability character of microbiomes in space and time in relation to the environment’s physical-chemical context and spatial changes.
The bacterial microbiome’s dynamic temporal and spatial flexibility reveals a high level of self-organization and a self-adapting capability. This characteristic represents a fundamental ecological base for lotic systems’ different environmental resource use (chemical substances) patterns and recycling through trophic processes. This assures the river ecosystem optimum health ecologic status dynamic and trend, to be potentially reached.
The easily shifting bacterial microbiome reveals this ecological compartment’s key role in sustaining other taxonomic groups through biogeochemical and nutrient cycles and processes, which are the not very fragmented in space and time. This is true even in lotic systems experiencing the negative effects of human activities.

Author Contributions

Conceptualization, I.B., D.B. and A.C.-B.; methodology, I.B. and A.B.; software, I.B. and A.B.; validation, I.B., D.B. and A.C.-B.; formal analysis, I.B., A.B., D.B. and A.C.-B.; investigation, I.B., C.C., D.B. and A.C.-B.; data curation, I.B. and A.B.; writing—original draft preparation, I.B., A.B., D.B. and A.C.-B.; writing—review and editing, I.B., A.B., C.C., D.B. and A.C.-B.; visualization, I.B., A.B., D.B. and A.C.-B.; supervision, I.B. and A.C.-B.; project administration, A.C.-B.; funding acquisition, A.C.-B. All authors have read and agreed to the published version of the manuscript.

Funding

This research was funded by Romanian National Council for Higher Education, Cercetare de excelenţă în ecotoxicologia farmaceuticelor, CNFIS-FDI-2019-0381. The co-author C.C. was supported by Norway Grants Call 2019 (RO-NO 2019)—Collaborative Research Projects, Contract No. 28/2020.

Institutional Review Board Statement

This paper was realized under the 2019–2021 institution scientifical and administrative approvals, consent and support.

Informed Consent Statement

All the co-authors checked and are agreed with this form of the accepted research paper.

Data Availability Statement

There are no supplementary data part or not of any publicly archived datasets analyzed or generated during the study.

Acknowledgments

The authors thank to Grant S. McCall (Center for Human-Environmental Research, New Orleans, LA, USA) for his scientific advice and English language checking of the manuscript. The authors also express their gratitude to Ecotur Sibiu Environmental Association (Sibiu, Romania), which paid the publication fee for this research paper.

Conflicts of Interest

The authors declare no conflict of interest.

Abbreviations

NGS—next-generation sequencing; RNA—ribonucleic acid; rRNA—ribosomal ribonucleic acid; KCl—potassium chloride; NaHCO3—sodium bicarbonate; DNA—deoxyribonucleic acid; QIIME—quantitative insights into microbial ecology; DADA—Data Analysis Decision Action; MAFFT—Multiple Alignment using Fast Fourier Transform; NCBI—National Center for Biotechnology Information; SRI—Sequence read archive; OTU—operational taxonomic units; ACE—Abundance-based Coverage Estimator; UniFrac—unique fraction metric; CCA—canonical correspondence analysis, ASV—amplicon sequence variants.

References

  1. Global Water Partnership (GWP). Toward Water Security: A Framework for Action to Achieve the Vision for Water in the 21st Century; Global Water Partnership (GWP): Stockholm, Sweden, 2000. [Google Scholar]
  2. International Union for the Conservation of Nature and Natural Resources (IUCN). Vision for Water and Nature. A World Strategy for Conservation and Sustainable Management of Water Resources in the 21st Century—Compilation of All Project Documents; International Union for the Conservation of Nature and Natural Resources (IUCN): Cambridge, UK, 2000. [Google Scholar]
  3. De Villiers, M. Water: The Fate of Our Most Precious Resource; A Mariner Book; Houghton Mifflin Company: Boston, MA, USA, 2001; pp. 1–368. [Google Scholar]
  4. Fernández, N.; Gershenson, C. Measuring Complexity in an Aquatic Ecosystem. In Advances in Computational Biology; Springer: Cham, Switzerland, 2013. [Google Scholar]
  5. Gough, P. From Sea to Source, International Guidance for the Restoration of Fish Migration Highways; Regional Water Authority Hunze en Aa’s: Veendam, The Netherlands, 2012; Chapter 1; pp. 21–27. [Google Scholar]
  6. Middleton, N. Rivers: A Very Short Introduction; Oxford University Press: Oxford, UK, 2012; pp. 1–127. [Google Scholar]
  7. Shiklomanov, I.A. Forthcoming World Water Resources at the Beginning of the 21st Century; Cambridge University Press: Cambridge, UK, 1992. [Google Scholar]
  8. Oprean, L. Apa Resursă Fundamentală a Dezvoltării Durabile. Metode şi Tehnici Neconvenţionale de Epurare şi Tratare a Apei; Coordinator Oprean, L.; Editura Academiei Române: București, Romania, 2012; Volume 1, Available online: https://appliedecologysibiu.files.wordpress.com/2016/02/lp-horea-olosutean-ro.pdf (accessed on 2 March 2021).
  9. Oprean, L. Apa Resursă Fundamentală a Dezvoltării Durabile. Metode şi Tehnici Neconvenţionale de Epurare şi Tratare a Apei; Coordinator Oprean, L.; Editura Academiei Române: București, Romania, 2012; Volume 2, Available online: https://doctorat.unibuc.ro/wp-content/uploads/sites/13/2019/01/l.-CV-SARBU.pdf (accessed on 2 March 2021).
  10. Brookes, A.; Gregory, K.; Dawson, F. An assessment of river channelization in England and Wales. Sci. Total Environ. 1983, 27, 97–111. [Google Scholar] [CrossRef]
  11. Kirchman, D.L. The uptake of inorganic nutrients by heterotrophic bacteria. Microb. Ecol. 1994, 28, 255–271. [Google Scholar] [CrossRef] [PubMed]
  12. Gregory, K. The human role in changing river channels. Geomorphology 2006, 79, 172–191. [Google Scholar] [CrossRef]
  13. Bai, Y.; Qi, W.; Liang, J.; Qu, J. Using high-throughput sequencing to assess the impacts of treated and untreated wastewater discharge on prokaryotic communities in an urban river. Appl. Microbiol. Biotechnol. 2013, 98, 1841–1851. [Google Scholar] [CrossRef] [PubMed]
  14. Ruiz-González, C.; Niño-García, J.P.; Del Giorgio, P.A. Terrestrial origin of bacterial communities in complex boreal freshwater networks. Ecol. Lett. 2015, 18, 1198–1206. [Google Scholar] [CrossRef] [PubMed]
  15. Curtean-Bănăduc, A.; Olosutean, H.; Bănăduc, D. Influence of Environmental Variables on the Structure and Diversity of Ephemeropteran Communities: A Case Study of the Timiş River, Romania. Acta Zool. Bulg. 2016, 68, 215–224. [Google Scholar]
  16. Curtean-Bănăduc, A.; Maric, S.; Gabor, G.; Didenko, A.; Rey Planellas, S.; Bănăduc, D. Hucho hucho (Linnaeus, 1758): Last natural viable population in the Eastern Carpathians—Conservation elements. Turk. J. Zool. 2019, 43, 215–223. [Google Scholar] [CrossRef]
  17. Curtean-Bănăduc, A.; Didenko, A.; Guti, G.; Bănăduc, D. Telestes souffia (Risso, 1827) species conservation at the Eastern limit of range. Appl. Ecol. Environ. Res. 2018, 16, 291–303. [Google Scholar] [CrossRef]
  18. IUCN Environmental Flows, Managing Water Allocation and Trade-Offs. Available online: https://www.iucn.org/downloads/water_briefing_eflows.pdf (accessed on 2 March 2021).
  19. Kuriqi, A.; Pinheiro, A.N.; Sordo-Ward, A.; Garrote, L. Water-energy-ecosystem nexus: Balancing competing interests at a run-of-river hydropower plant coupling a hydrologic–ecohydraulic approach. Energy Convers. Manag. 2020, 223, 113267. [Google Scholar] [CrossRef]
  20. Kuriqi, A.; Pinheiro, A.N.; Sordo-Ward, A.; Bejarano, M.D.; Garrote, L. Ecological impacts of run-of-river hydropower plants—Current status and future prospects on the brink of energy transition. Renew. Sustain. Energy Rev. 2021, 142, 110833. [Google Scholar] [CrossRef]
  21. Costea, G.; Push, M.T.; Bănăduc, D.; Cosmoiu, D.; Curtean-Bănăduc, A. A Review of Hydropower Plants in Romania: Distribution, Current Knowledge, and Their Effects on Fish in Headwater Streams. Renew. Sustain. Energy Rev. 2021, 54, 111003. [Google Scholar] [CrossRef]
  22. Bănăduc, D.; Joy, M.; Olosutean, H.; Afanasyev, S.; Curtean-Bănăduc, A. Natural and anthropogenic driving forces as key elements in the Lower Danube Basin—South-Eastern Carpathians—North-Western Black Sea coast area lakes, a broken stepping stones for fish in a climatic change scenario. Environ. Sci. Eur. 2020, 32, 73. [Google Scholar] [CrossRef]
  23. Curtean-Bănăduc, A.; Burcea, A.; Mihuţ, C.-M.; Bănăduc, D. The benthic trophic corner stone compartment in POPs transfer from abiotic environment to higher trophic levels—Trichoptera and Ephemeroptera pre-alert indicator role. Water 2021, 13, 1778. [Google Scholar] [CrossRef]
  24. Berg, G.; Rybakova, D.; Fischer, D.; Cernava, T.; Champomier Vergès, M.-C.; Charles, T.; Chen, X.; Cocolin, L.; Eversole, K.; Herrero Corral, G.; et al. Microbiome definition re-visited: Old concepts and new challenges. Microbiome 2020, 8, 103. [Google Scholar] [CrossRef] [PubMed]
  25. Meybeck, M. Global analysis of river systems: From Earth system controls to Anthropocene syndromes. Philos. Trans. R. Soc. B Biol. Sci. 2003, 358, 1935–1955. [Google Scholar] [CrossRef] [PubMed]
  26. Dudgeon, D.; Arthington, A.H.; Gessner, M.O.; Kawabata, Z.I.; Knowler, D.J.; Leveque, C. Freshwater biodiversity: Importance, threats, status and conservation challenges. Biol. Rev. 2005, 81, 163–182. [Google Scholar] [CrossRef]
  27. Dudgeon, D. Anthropocene Extinctions: Global Threats to Riverine Biodiversity and the Tragedy of the Freshwater Commons. In River Conservation: Challenges and Opportunities; Sabater, S., Elosegi, A., Eds.; Fundación BBVA: Bilbao, Spain, 2013; pp. 129–167. [Google Scholar]
  28. Steffen, W.; Crutzen, P.J.; McNeill, J.R. The Anthropocene: Are Humans Now Overwhelming the Great Forces of Nature? University of California Press: Los Angeles, CA, USA, 2007; Volume 36, pp. 614–621. [Google Scholar]
  29. Stevenson, R.J.; Sabater, S. Understanding global change in river ecosystems: Science to support policy in a changing world. Hydrobiologia 2010, 657, 3–18. [Google Scholar] [CrossRef]
  30. Schneider-Binder, E. The Habitats along the Upper Danube in Germany and Changes to Them Induced by Human Impacts. In Human Impact on Danube Watershed Biodiversity in the XXI Century. Geobotany Studies (Basics, Methods and Case Studies); Bănăduc, D., Curtean-Bănăduc, A., Pedrotti, F., Cianfaglione, K., Akeroyd, J., Eds.; Springer: Cham, Switzerland, 2020; pp. 27–48. [Google Scholar]
  31. Cianfaglione, K.; Pedrotti, F. Italy in the Danube Geography: Territory, Landscape, Environment, Vegetation, Fauna, Culture, Human Management and Outlooks for the Future. In Human Impact on Danube Watershed Biodiversity in the XXI Century. Geobotany Studies (Basics, Methods and Case Studies); Bănăduc, D., Curtean-Bănăduc, A., Pedrotti, F., Cianfaglione, K., Akeroyd, J., Eds.; Springer: Cham, Switzerland, 2020; pp. 87–118. [Google Scholar]
  32. Adámek, Z.; Jurajdová, Z.; Janáč, M.; Zahrádková, S.; Němejcová, D.; Jurajda, P. The Response of Fish Assemblages to Human Impacts along the Lower Stretch of the Rivers Morava and Dyje (Danube River Basin, Czech Republic). In Human Impact on Danube Watershed Biodiversity in the XXI Century. Geobotany Studies (Basics, Methods and Case Studies); Bănăduc, D., Curtean-Bănăduc, A., Pedrotti, F., Cianfaglione, K., Akeroyd, J., Eds.; Springer: Cham, Switzerland, 2020; pp. 135–150. [Google Scholar]
  33. Ćaleta, M.; Mustafić, P.; Zanella, D.; Buj, I.; Marčić, Z.; Mrakovčić, M. Human Impact on the Dobra River (Croatia). In Human Impact on Danube Watershed Biodiversity in the XXI Century. Geobotany Studies (Basics, Methods and Case Studies); Bănăduc, D., Curtean-Bănăduc, A., Pedrotti, F., Cianfaglione, K., Akeroyd, J., Eds.; Springer: Cham, Switzerland, 2020; pp. 151–168. [Google Scholar]
  34. Dekić, R.; Ivanc, A.; Ćetković, D.; Lolić, A. Anthropogenic Impact and Environmental Quality of Different Tributaries of the River Vrbas (Bosnia and Hertzegovina). In Human Impact on Danube Watershed Biodiversity in the XXI Century. Geobotany Studies (Basics, Methods and Case Studies); Bănăduc, D., Curtean-Bănăduc, A., Pedrotti, F., Cianfaglione, K., Akeroyd, J., Eds.; Springer: Cham, Switzerland, 2020; pp. 169–214. [Google Scholar]
  35. Guti, G. Assessment of Long-Term Changes in the Szigetköz Floodplain of the Danube River. In Human Impact on Danube Watershed Biodiversity in the XXI Century. Geobotany Studies (Basics, Methods and Case Studies); Bănăduc, D., Curtean-Bănăduc, A., Pedrotti, F., Cianfaglione, K., Akeroyd, J., Eds.; Springer: Cham, Switzerland, 2020; pp. 215–240. [Google Scholar]
  36. Ðikanović, V.; Nikčević, M.; Mićković, B.; Hegediš, A.; Mrdak, D.; Pešić, V. Anthropogenic Pressures on Watercourses of the Danube River Basin in Montenegro. In Human Impact on Danube Watershed Biodiversity in the XXI Century. Geobotany Studies (Basics, Methods and Case Studies); Bănăduc, D., Curtean-Bănăduc, A., Pedrotti, F., Cianfaglione, K., Akeroyd, J., Eds.; Springer: Cham, Switzerland, 2020; pp. 241–256. [Google Scholar]
  37. Lenhardt, M.; Snederevac-Lalić, M.; Hegediš, A.; Skorić, S.; Cvijanović, G.; Višnjić-Jeftić, Ž.; Djikanović, V.; Jovičić, K.; Jaćimović, M.; Jarić, I. Human Impacts on Fish Fauna in the Danube River in Serbia: Current Status and Ecological Implications. In Human Impact on Danube Watershed Biodiversity in the XXI Century. Geobotany Studies (Basics, Methods and Case Studies); Bănăduc, D., Curtean-Bănăduc, A., Pedrotti, F., Cianfaglione, K., Akeroyd, J., Eds.; Springer: Cham, Switzerland, 2020; pp. 257–280. [Google Scholar]
  38. Mišiková Elexová, E.; Makovinská, J. Assessment of the Aquatic Ecosystem in the Slovak Stretch of the Danube River. In Human Impact on Danube Watershed Biodiversity in the XXI Century. Geobotany Studies (Basics, Methods and Case Studies); Bănăduc, D., Curtean-Bănăduc, A., Pedrotti, F., Cianfaglione, K., Akeroyd, J., Eds.; Springer: Cham, Switzerland, 2020; pp. 281–300. [Google Scholar]
  39. Maślanko, W.; Ferencz, B.; Dawidek, J. State and Changes of Natural Environment in Polish Part of the Danube River Basin Poland. In Human Impact on Danube Watershed Biodiversity in the XXI Century. Geobotany Studies (Basics, Methods and Case Studies); Bănăduc, D., Curtean-Bănăduc, A., Pedrotti, F., Cianfaglione, K., Akeroyd, J., Eds.; Springer: Cham, Switzerland, 2020; pp. 301–326. [Google Scholar]
  40. Afanasyev, S.; Lyashenko, A.; Iarochevitch, A.; Lietytska, O.; Zorina-Sakharova, K.; Marushevska, O. Pressures and Impacts on Ecological Status of Surface Water Bodies in Ukrainian part of the Danube River Basin. In Human Impact on Danube Watershed Biodiversity in the XXI Century. Geobotany Studies (Basics, Methods and Case Studies); Bănăduc, D., Curtean-Bănăduc, A., Pedrotti, F., Cianfaglione, K., Akeroyd, J., Eds.; Springer: Cham, Switzerland, 2020; pp. 327–359. [Google Scholar]
  41. Bakiu, R. Drina River (Sava’s Tributary of Danube River) and Human Impact in Albania. In Human Impact on Danube Watershed Biodiversity in the XXI Century. Geobotany Studies (Basics, Methods and Case Studies); Bănăduc, D., Curtean-Bănăduc, A., Pedrotti, F., Cianfaglione, K., Akeroyd, J., Eds.; Springer: Cham, Switzerland, 2020; pp. 359–380. [Google Scholar]
  42. Kostov, V.; Slavevska-Stamenkovic, V.; Ristovska, M.; Stojov, V.; Marić, S. Characteristics of the Danube Drainage Area in the Republic of Macedonia. In Human Impact on Danube Watershed Biodiversity in the XXI Century. Geobotany Studies (Basics, Methods and Case Studies); Bănăduc, D., Curtean-Bănăduc, A., Pedrotti, F., Cianfaglione, K., Akeroyd, J., Eds.; Springer: Cham, Switzerland, 2020; pp. 381–392. [Google Scholar]
  43. Kenderov, L.; Trichkova, T. Long-Term Changes in the Ecological Conditions of the Iskar River (Danube River Basin, Bulgaria). In Human Impact on Danube Watershed Biodiversity in the XXI Century. Geobotany Studies (Basics, Methods and Case Studies); Bănăduc, D., Curtean-Bănăduc, A., Pedrotti, F., Cianfaglione, K., Akeroyd, J., Eds.; Springer: Cham, Switzerland, 2020; pp. 393–424. [Google Scholar]
  44. Curtean-Bănăduc, A.; Bănăduc, D. Human impact effects on Târnava Mare Basin Aquatic Biodiversity (Transylvania, Romania). In Human Impact on Danube Watershed Biodiversity in the XXI Century. Geobotany Studies (Basics, Methods and Case Studies); Bănăduc, D., Curtean-Bănăduc, A., Pedrotti, F., Cianfaglione, K., Akeroyd, J., Eds.; Springer: Cham, Switzerland, 2020; pp. 425–437. [Google Scholar]
  45. Posea, G. Enciclopedia Geografică a României; Ştiinţifică şi Enciclopedică: Bucureşti, Romania, 1982; p. 262. [Google Scholar]
  46. Mutihac, V. Structura Geologică a Teritoriului României; Editura Tehnicǎ: Bucharest, Romania, 1990. [Google Scholar]
  47. Diaconu, C.; Stănculescu, S. Rîurile României, Monografie Hidrologică; Institutul de Meteorologie și Hidrologie: București, Romania, 1971; pp. 1–750. [Google Scholar]
  48. Badea, L.; Bugă, D.; Cioflica, G.; Cucu, V.; Doniţă, I.; Gâştescu, P.; Iordan, I.; Morariu, T.; Niculescu, G.; Oancea, D.; et al. Geografia României, II, Geografia Umană şi Economic; Editura Academiei Republicii Socialiste România: Bucharest, Romania, 1984; pp. 1–543. [Google Scholar]
  49. Triebskorn, R.; Telcean, I.; Casper, H.; Farkas, A.; Sandu, C.; Stan, G.; Colărescu, O.; Dori, T.; Köhler, H.-R. Monitoring pollution in River Mureş, Romania, part II: Metal accumulation and histopathology in fish. Environ. Monit. Assess. 2007, 141, 177–188. [Google Scholar] [CrossRef]
  50. Curtean-Bănăduc, A.; Bănăduc, D. The Transylvanian Water Tower through history. Danub. News 2015, 17, 1–4. [Google Scholar]
  51. Curtean-Bănăduc, A.; Bănăduc, D.; Burcea, A.; Berg, V.; Lyche, J.L.; Gheorghe, L.M. Persistent organic pollutants in Mureş watershed. In The Impact of Persistent Organic Pollutants on Freshwater Ecosystems and Human Health; Curtean-Bănăduc, A., Ed.; Publisher Lucian Blaga, University of Sibiu: Sibiu, Romania, 2016; pp. 117–152. [Google Scholar]
  52. Burcea, A.; Boeraş, I.; Mihuţ, C.-M.; Bănăduc, D.; Matei, C.; Curtean-Bănăduc, A. Adding the Mureş River Basin (Transylvania, Romania) to the List of Hotspots with High Contamination with Pharmaceuticals. Sustainability 2020, 12, 10197. [Google Scholar] [CrossRef]
  53. Curtean-Bănăduc, A.; Burcea, A.; Mihuţ, C.-M.; Berg, V.; Lyche, J.L.; Bănăduc, D. Bioaccumulation of persistent organic pollutants in the gonads of Barbus barbus (Linnaeus, 1758). Ecotoxicol. Environ. Saf. 2020, 201, 110852. [Google Scholar] [CrossRef]
  54. Bănăduc, D.; Sas, A.; Cianfaglione, K.; Barinova, S.; Curtean-Bănăduc, A. The Role of Aquatic Refuge Habitats for Fish, and Threats in the Context of Climate Change and Human Impact, during Seasonal Hydrological Drought in the Saxon Villages Area (Transylvania, Romania). Atmosphere 2021, 12, 1209. [Google Scholar] [CrossRef]
  55. Curtean–Bănăduc, A.; Bănăduc, D.; Bucşa, C. Watersheds Management (Transylvania/Romania): Implications, Risks, Solutions. In Strategies to Enhance Environmental Security in Transition Countries; NATO Science for Peace and Security Series C-Environmental Security; Springer: Dordrecht, The Netherlands, 2007; pp. 225–238. ISBN 978-1-4020-5994-0. ISSN 1971-4668. [Google Scholar] [CrossRef]
  56. Bănăduc, D.; Curtean-Bănăduc, A.; Cianfaglione, K.; Akeroyd, J.R.; Cioca, L.-I. Proposed environmental risk management elements in a Carpathian valley basin, within the Roşia Montană European historical mining area. Int. J. Environ. Res. Public Health 2021, 18, 4565. [Google Scholar] [CrossRef] [PubMed]
  57. Mureş Water Directorate (MWD): Report for 2004—Annual Synthesis Concerning the Water Quality Protection in Mureş Hydrographic Basin, Vol. I and II. (1) (PDF) The Mureş River Ecosystem—Scientific Background Information as the Basis for a Catchment Approach in the Framework of IAD. Available online: https://www.researchgate.net/publication/242267567_The_Mures_River_ecosystem_-_scientific_background_information_as_the_basis_for_a_catchment_approach_in_the_framework_of_IAD (accessed on 15 August 2021).
  58. Köhler, H.-R.; Triebskorn, R.; Sandu, C. Monitoring pollution in the river Mureş. Bull. Int. Assoc. Danub. Res.-Danub. News 2005, 11, 1–6. [Google Scholar]
  59. Köhler, H.-R.; Sandu, C.; Scheil, V.; Nagy-Petrică, E.M.; Segner, H.; Telcean, I.; Stan, G.; Triebskorn, R. Monitoring Pollution in River MureŞ, Romania, Part III: Biochemical effect markers in fish and integrative reflection. Environ. Monit. Assess. 2006, 127, 47–54. [Google Scholar] [CrossRef]
  60. Sandu, C.; Farkas, A.; Musa-Iacob, R.; Ionică, D.; Parpală, L.; Zinevici, V.; Dobre, D.; Radu, M.; Presing, M.; Casper, H.; et al. Monitoring Pollution in River Mureş, Romania, Part I: How Aquatic Communities Are Affected; Environmental Monitoring and Assessment; Springer: Bucureşti, Romania, 2006. [Google Scholar]
  61. Bănăduc, D.; Oprean, L.; Bogdan, A. Fish species of community interest management issues in Natura 2000 site Sighişoara-Târnava Mare (Transylvania, Romania). Rev. Econ. 2011, 3, 23–27. [Google Scholar]
  62. Curtean-Bănăduc, A.; Bănăduc, D. Benthic macro-invertebrate and fish communities of some southern Tarnava Mare River tributaries (Transylvania, Romania). Transylv. Rev. Syst. Ecol. Res. 2007, 4, 135–148. [Google Scholar]
  63. Bănăduc, D. Fish associations—Habitats quality relation in the Târnave rivers ecological assessment. Transylv. Rev. Syst. Ecol. Res. 2005, 2, 123–136. [Google Scholar]
  64. Bănăduc, D.; Pânzar, C.; Bogorin, P.; Hoza, O.; Curtean-Bănăduc, A. Human impact on Tȃrnava Mare River and its effects on aquatic biodiversity. Acta Oecol. Carp. 2016, 9, 189–198. [Google Scholar]
  65. Savio, D.; Sinclair, L.; Ijaz, U.Z.; Parajka, J.; Reischer, G.; Stadler, P.; Blaschke, A.P.; Blöschl, G.; Mach, R.; Kirschner, A.; et al. Bacterial diversity along a 2600 km river continuum. Environ. Microbiol. 2015, 17, 4994–5007. [Google Scholar] [CrossRef]
  66. Lupan, I.; Carpa, R.; Oltean, A.; Kelemen, B.; Popescu, O. Release of Antibiotic Resistant Bacteria by a Waste Treatment Plant from Romania. Microbes Environ. 2017, 32, 219–225. [Google Scholar] [CrossRef] [Green Version]
  67. Florea, A.B. Antimicrobial susceptibility of Escherichia coli isolated from Arieş river (Romania). An. Univ. Oradea Fasc. Biol. 2011, 18, 34–38. [Google Scholar]
  68. Ward, J.V. The four-dimensional nature of lotic ecosystems. J. N. Am. Benthol Soc. 1989, 8, 2–8. [Google Scholar] [CrossRef]
  69. Del Monte-Luna, P.; Brook, B.W.; Zetina-Rejón, M.J.; Cruz-Escalona, V.H. The carrying capacity of ecosystems. Glob. Ecol. Biogeogr. 2004, 13, 485–495. [Google Scholar] [CrossRef]
  70. Cherry, J.A. Ecology of wetland ecosystems: Water, substrate, and life. Nat. Educ. Knowl. 2011, 3, 16. [Google Scholar]
  71. Afanasyev, S.A. Forming of Hydrobiota of the River Systems in the Territory of Ukraine in View of History of Hydrographic Net. Hydrobiol. J. 2015, 51, 3–12. [Google Scholar] [CrossRef]
  72. Fogarty, M.J.; Gamble, R.; Perretti, C.T. Dynamic Complexity in Exploited Marine Ecosystems. Front. Ecol. Evol. 2016, 4, 68. [Google Scholar] [CrossRef] [Green Version]
  73. Barinova, S. Empirical Model of the Functioning of Aquatic Ecosystems. Int. J. Oceanogr. Aquac. 2017, 1, 1–9. [Google Scholar] [CrossRef]
  74. Cianfaglione, K. Plant Landscape and Models of French Atlantic Estuarine Systems. Extended Summary of the Doctoral Thesis. Transylv. Rev. Syst. Ecol. Res. 2021, 23, 15–36. [Google Scholar]
  75. Zimmerman, B.; Lindberg, C.; Plsek, P. A Complexity Science Primer. In Edgeware: Insights from Complexity Science for Health Care Leaders, 2nd ed.; Zimmerman, B., Lindberg, C., Plsek, P., Eds.; VHA Inc.: Irving, TX, USA, 2001; pp. 3–20. [Google Scholar]
  76. Potter, P.E.; Hamblin, W.K. Big Rivers Worldwide; Brigham Young University Geology Studies: Provo, UT, USA, 2005. [Google Scholar]
  77. Best, J. Anthropogenic stresses on the world’s big rivers. Nat. Geosci. 2019, 12, 7–21. [Google Scholar] [CrossRef]
  78. Bănăduc, D.; Rey, S.; Trichkova, T.; Lenhardt, M.; Curtean-Bănăduc, A. The Lower Danube River—Danube Delta—North West Black Sea: A pivotal area of major interest for the past, present and future of its fish fauna—A short review. Sci. Total Environ. 2016, 545, 137–151. [Google Scholar] [CrossRef] [PubMed]
  79. Tockner, K.; Zarfl, C.; Robinson, C. Rivers of Europe, 2nd ed.; Elsevier: Bayern, Germany, 2021; p. 800. [Google Scholar]
  80. Dahm, C.; Bulton, A.; Correa, L.; Kingsford, R.; Jenkins, K.; Sheldon, F. The role of science in planning, policy and conservation of river ecosystems. In Rivers Conservation: Challenges and Opportunities; Sabater, S., Elosegi, A., Eds.; Fundación BBVA: Bilbao, Spain, 2013; p. 399. [Google Scholar]
  81. Amyes, S. What’s the Secret of Bacteria’s Success? Bacteria: A Very Short Introduction; Oxford University Press’s Academic Insights for the Thinking World: Oxford, UK, 2013. [Google Scholar]
  82. Maddock, I. The importance of physical habitat assessment for evaluating river health. Freshw. Biol. 1999, 41, 373–391. [Google Scholar] [CrossRef]
  83. Christoph, H.; Patrik, L.; Günther, U.; Ulrich, P.; Habersack, H. The Role of Sediment and Sediment Dynamics in the Aquatic Environment. In Riverine Ecosystems Management; Springer: Cham, Switzerland, 2018; pp. 151–169. [Google Scholar]
  84. Bănăduc, D.; Voicu, R.; Curtean-Bănăduc, A. Sediments as factor in the fate of the threatened endemic fish species Romanichthys valsanicola Dumitrescu, Bănărescu and Stoica, 1957 (Vâlsan River basin, Danube Basin). Transylv. Rev. Syst. Ecol. Res. 2020, 22, 15–30. [Google Scholar] [CrossRef]
  85. Battin, T.J.; Luyssaert, S.; Kaplan, L.A.; Aufdenkampe, A.K.; Richter, A.; Tranvik, L.J. The boundless carbon cycle. Nat. Geosci. 2009, 2, 598–600. [Google Scholar] [CrossRef]
  86. Findlay, S. Stream microbial ecology. J. N. Am. Benthol. Soc. 2010, 29, 170–181. [Google Scholar] [CrossRef] [Green Version]
  87. Madsen, E.L. Microorganisms and their roles in fundamental biogeochemical cycles. Curr. Opin. Biotechnol. 2011, 22, 456–464. [Google Scholar] [CrossRef] [PubMed]
  88. Vaqué, D.; Pace, M.L.; Findlay, S.; Lints, D. Fate of bacterial production in a heterotrophic ecosystem: Grazing by protists and metazoans in the Hudson Estuary. Mar. Ecol. Prog. Ser. 1992, 89, 155–163. [Google Scholar] [CrossRef]
  89. Naegeli, M.W.; Uehlinger, U. Contribution of the Hyporheic Zone to Ecosystem Metabolism in a Prealpine Gravel-Bed-River. J. N. Am. Benthol. Soc. 1997, 16, 794–804. [Google Scholar] [CrossRef]
  90. Gibert, J.; Mathieu, J.; Fournier, F. Groundwater/Surface Water Ecotones: Biological and Hydrological Interactions and Management Options, 1st ed.; Cambridge University Press: Cambridge, UK, 1997. [Google Scholar]
  91. Pusch, M.; Fiebig, D.; Brettar, I.; Eisenmann, H.; Ellis, B.K.; Kaplan, L.A.; Lock, M.A.; Naegeli, M.W.; Traunspurger, W. The role of micro-organisms in the ecological connectivity of running waters. Freshw. Biol. 1998, 40, 453–495. [Google Scholar] [CrossRef]
  92. Craft, J.A.; Stanford, J.A.; Pusch, M. Microbial respiration within a floodplain aquifer of a large gravel-bed river. Freshw. Biol. 2002, 47, 251–261. [Google Scholar] [CrossRef]
  93. Huber, D.H.; Ugwuanyi, I.R.; Malkaram, S.A.; Montenegro-Garcia, N.A.; Noundou, V.L.; Chavarria-Palma, J.E. Metagenome Sequences of Sediment from a Recovering Industrialized Appalachian River in West Virginia. Genome Announc. 2018, 6, e00350-18. [Google Scholar] [CrossRef] [Green Version]
  94. Gibbons, S.M.; Jones, E.; Bearquiver, A.; Blackwolf, F.; Roundstone, W.; Scott, N.; Hooker, J.; Madsen, R.; Coleman, M.; Gilbert, J.A. Human and Environmental Impacts on River Sediment Microbial Communities. PLoS ONE 2014, 9, e97435. [Google Scholar]
  95. Wang, Y.; Sheng, H.-F.; He, Y.; Wu, J.-Y.; Jiang, Y.-X.; Tam, N.F.-Y.; Zhou, H.-W. Comparison of the Levels of Bacterial Diversity in Freshwater, Intertidal Wetland, and Marine Sediments by Using Millions of Illumina Tags. Appl. Environ. Microbiol. 2012, 78, 8264–8271. [Google Scholar] [CrossRef] [Green Version]
  96. Thompson, L.R.; Sanders, J.G.; McDonald, D.; Amir, A.; Ladau, J.; Locey, K.J.; Prill, R.J.; Tripathi, A.; Gibbons, S.M.; Ackermann, G.; et al. A communal catalogue reveals Earth’s multiscale microbial diversity. Nature 2017, 551, 457–463. [Google Scholar] [CrossRef] [Green Version]
  97. Engel, A.S.; Meisinger, D.B.; Porter, M.L.; Payn, R.A.; Schmid, M.; Stern, L.A.; Schleifer, K.H.; Lee, N.M. Linking phylogenetic and functional diversity to nutrient spiraling in microbial mats from Lower Kane Cave (USA). ISME J. 2010, 4, 98–110. [Google Scholar] [CrossRef] [Green Version]
  98. Kristiansson, E.; Fick, J.; Janzon, A.; Grabic, R.; Rutgersson, C.; Weijdegård, B.; Söderström, H.; Larsson, D.J. Pyrosequencing of antibiotic-contaminated river sediments reveals high levels of resistance and gene transfer elements. PLoS ONE 2011, 6, e17038. [Google Scholar] [CrossRef]
  99. Zeglin, L.H.; Dahm, C.N.; Barrett, J.E.; Gooseff, M.; Fitpatrick, S.K.; Takacs-Vesbach, C.D. Bacterial Community Structure along Moisture Gradients in the Parafluvial Sediments of Two Ephemeral Desert Streams. Microb. Ecol. 2010, 61, 543–556. [Google Scholar] [CrossRef]
  100. Ramsey, P.W.; Rillig, M.C.; Feris, K.P.; Gordon, N.S.; Moore, J.N.; Holben, W.E.; Gannon, J.E. Relationship between communities and processes; new insights from a field study of a contaminated ecosystem. Ecol. Lett. 2005, 8, 1201–1210. [Google Scholar] [CrossRef]
  101. Feris, K.P.; Ramsey, P.W.; Frazar, C.; Rillig, M.C.; Gannon, J.E.; Holben, W.E. Structure and seasonal dynamics of hyporheic zone microbial communities in free-stone rivers of the estern United States. Microb. Ecol. 2003, 46, 200–215. [Google Scholar] [CrossRef]
  102. Feris, K.P.; Ramsey, P.W.; Frazar, C.; Rillig, M.; Moore, J.N.; Gannon, J.E.; Holben, W.E. Seasonal dynamics of shallow-hyporheic-zone microbial community structure along a heavy-metal contamination gradient. Appl. Environ. Microbiol. 2004, 70, 2323–2331. [Google Scholar] [CrossRef] [Green Version]
  103. Feris, K.P.; Ramsey, P.W.; Gibbons, S.M.; Frazar, C.; Rillig, M.C.; Moore, J.N.; Gannon, J.E.; Holben, W.E. Hyporheic microbial community development is a sensitive indicator of metal contamination. Environ. Sci. Technol. 2009, 43, 6158–6163. [Google Scholar] [CrossRef]
  104. Crump, B.C.; Armbrust, E.V.; Baross, J.A. Phylogenetic Analysis of Particle-Attached and Free-Living Bacterial Communities in the Columbia River, Its Estuary, and the Adjacent Coastal Ocean. Appl. Environ. Microbiol. 1999, 65, 3192–3204. [Google Scholar] [CrossRef] [Green Version]
  105. Zwart, G.; Crump, B.C.; van Kamst-Agterveld, M.P.; Hagen, F.; Han, S.K. Typical freshwater bacteria: An analysis of available 16S rRNA gene sequences from plankton of lakes and rivers. Aquat. Microb. Ecol. 2002, 28, 141–155. [Google Scholar] [CrossRef] [Green Version]
  106. Cottrell, M.T.; Waidner, L.A.; Yu, L.; Kirchman, D.L. Bacterial diversity of metagenomic and PCR libraries from the Delaware River. Environ. Microbiol. 2005, 7, 1883–1895. [Google Scholar] [CrossRef] [PubMed]
  107. Winter, C.; Hein, T.; Kavka, G.; Mach, R.L.; Farnleitner, A.H. Longitudinal Changes in the Bacterial Community Composition of the Danube River: A Whole-River Approach. Appl. Environ. Microbiol. 2007, 73, 421–431. [Google Scholar] [CrossRef] [PubMed] [Green Version]
  108. Lemke, M.J.; Lienau, E.K.; Rothe, J.; Pagioro, T.A.; Rosenfeld, J.; DeSalle, R. Description of Freshwater Bacterial Assemblages from the Upper Paraná River Floodpulse System, Brazil. Microb. Ecol. 2008, 57, 94–103. [Google Scholar] [CrossRef] [PubMed]
  109. Mueller-Spitz, S.R.; Goetz, G.W.; McLellan, S.L. Temporal and spatial variability in nearshore bacterioplankton communities of Lake Michigan. FEMS Microbiol. Ecol. 2009, 67, 511–522. [Google Scholar] [CrossRef] [PubMed] [Green Version]
  110. Newton, R.J.; Jones, S.E.; Eiler, A.; McMahon, K.D.; Bertilsson, S. A Guide to the Natural History of Freshwater Lake Bacteria. Microbiol. Mol. Biol. Rev. 2011, 75, 14–49. [Google Scholar] [CrossRef] [Green Version]
  111. Liu, Z.; Huang, S.; Sun, G.; Xu, Z.; Xu, M. Phylogenetic diversity, composition and distribution of bacterioplankton community in the Dongjiang River, China. FEMS Microbiol. Ecol. 2012, 80, 30–44. [Google Scholar] [CrossRef] [Green Version]
  112. Lv, X.; Yu, J.; Fu, Y.; Ma, B.; Qu, F.; Ning, K.; Wu, H. A meta-analysis of the bacterial and archaeal diversity observed in wetland soils. Sci. World J. 2014, 2014, 437684. [Google Scholar] [CrossRef] [PubMed] [Green Version]
  113. Böcklemann, U.; Manz, W.; Neu, T.R.; Szewzyk, U. Characterization of the microbial community of lotic organic aggregates (‘river snow’) in the Elbe River of Germany by cultivation and molecular methods. FEMS Microbiol. Ecol. 2000, 33, 157–170. [Google Scholar] [CrossRef]
  114. Liu, M.; Cheng, S.; Ou, D.; Yang, Y.; Liu, H.; Hou, L.; Gao, L.; Xu, S. Organochlorine pesticides in surface sediments and suspended particulate matters from the Yangtze estuary, China. Environ. Pollut. 2008, 156, 168–173. [Google Scholar] [CrossRef]
  115. Crump, B.C.; Hobbie, J.E. Synchrony and seasonality in bacterioplankton communities of two temperate rivers. Limnol. Oceanogr. 2005, 50, 1718–1729. [Google Scholar] [CrossRef]
  116. Köchling, T.; Sanz, J.L.; Galdino, L.; Florencio, L.; Kato, M.T. Impact of pollution on the microbial diversity of a tropical river in an urbanized region of northeastern Brazil. Int. Microbiol. 2017, 20, 11–24. [Google Scholar] [PubMed]
  117. Zhang, C.; Liu, L.; Ma, Y.; Li, F. Using isomeric and metabolic ratios of DDT to identify the sources and fate of DDT in Chinese agricultural topsoil. Environ. Sci. Technol. 2018, 52, 1990–1996. [Google Scholar] [CrossRef]
  118. Lozupone, C.A.; Hamady, M.; Kelley, S.T.; Knight, R. Quantitative and Qualitative β Diversity Measures Lead to Different Insights into Factors That Structure Microbial Communities. Appl. Environ. Microbiol. 2007, 73, 1576–1585. [Google Scholar] [CrossRef] [PubMed] [Green Version]
  119. Abia, A.L.K.; Alisoltani, A.; Keshri, J.; Ubomba-Jaswa, E. Metagenomic analysis of the bacterial communities and their functional profiles in water and sediments of the Apies River, South Africa, as a function of land use. Sci. Total Environ. 2018, 616, 326–334. [Google Scholar] [CrossRef]
  120. Su, Z.; Dai, T.; Tang, Y.; Tao, Y.; Huang, B.; Mu, Q.; Wen, D. Sediment bacterial community structures and their predicted functions implied the impacts from natural processes and anthropogenic activities in coastal area. Mar. Pollut. Bull. 2018, 131, 481–495. [Google Scholar] [CrossRef]
  121. Wang, L.; Zhang, J.; Li, H.; Yang, H.; Peng, C.; Peng, Z.; Lu, L. Shift in the microbial community composition of surface water and sediment along an urban river. Sci. Total Environ. 2018, 627, 600–612. [Google Scholar] [CrossRef] [PubMed]
  122. Thorp, J.H.; Thoms, M.C.; Delong, M.D. The riverine ecosystem synthesis: Biocomplexity in river networks across space and time. River Res. Appl. 2006, 22, 123–147. [Google Scholar] [CrossRef]
  123. Sridhar, K.R. Structural and Functional Attributes to Evaluate Lotic Ecosystems Health, in Recent Research Trends in Environmental Management; Prasad, A.G.D., Ed.; Daya Publishing House: Delhi, India, 2016; Chapter 2; pp. 8–24. [Google Scholar]
  124. Terui, A.; Kim, S.; Dolph, C.L.; Kadoya, T.; Miyazaki, Y. Ecosystem size and complexity dictate riverine biodiversity. bioRxiv 2021. [Google Scholar] [CrossRef]
  125. Sundberg, C.; Al-Soud, W.A.; Larsson, M.; Alm, E.; Yekta, S.S.; Svensson, B.H.; Sørensen, S.J.; Karlsson, A. 454 pyrosequencing analyses of bacterial and archaeal richness in 21 full-scale biogas digesters. FEMS Microbiol. Ecol. 2013, 85, 612–626. [Google Scholar] [CrossRef] [Green Version]
  126. McDonald, D.; Clemente, J.C.; Kuczynski, J.; Rideout, J.R.; Stombaugh, J.; Wendel, D.; Wilke, A.; Huse, S.; Hufnagle, J.; Meyer, F.; et al. The Biological Observation Matrix (BIOM) format or: How I learned to stop worrying and love the ome-ome. GigaScience 2012, 1, 2047–217X. [Google Scholar] [CrossRef] [Green Version]
  127. Bolyen, E.; Rideout, J.R.; Dillon, M.R.; Bokulich, N.A.; Abnet, C.C.; Al-Ghalith, G.A.; Alexander, H.; Alm, E.J.; Arumugam, M.; Asnicar, F.; et al. Reproducible, interactive, scalable and extensible microbiome data science using QIIME 2. Nat. Biotechnol. 2019, 37, 852–857. [Google Scholar] [CrossRef] [PubMed]
  128. Callahan, B.J.; Mcmurdie, P.J.; Rosen, M.J.; Han, A.W.; Johnson, A.J.A.; Holmes, S.P. DADA2: High-resolution sample inference from Illumina amplicon data. Nat. Methods 2016, 13, 581–583. [Google Scholar] [CrossRef] [PubMed] [Green Version]
  129. Katoh, K.; Standley, D.M. MAFFT multiple sequence alignment software version 7: Improvements in performance and usability. Mol. Biol. Evol. 2013, 30, 772–780. [Google Scholar] [CrossRef] [PubMed] [Green Version]
  130. Price, M.N.; Dehal, P.S.; Arkin, A.P. FastTree 2—Approximately Maximum-Likelihood Trees for Large Alignments. PLoS ONE 2010, 5, e9490. [Google Scholar] [CrossRef] [PubMed]
  131. Weiss, S.; Xu, Z.Z.; Peddada, S.; Amir, A.; Bittinger, K.; Gonzalez, A.; Lozupone, C.; Zaneveld, J.R.; Vázquez-Baeza, Y.; Birmingham, A.; et al. Normalization and microbial differential abundance strategies depend upon data characteristics. Microbiome 2017, 5, 27. [Google Scholar] [CrossRef] [Green Version]
  132. Pedregosa, F.; Varoquaux, G.; Gramfort, A.; Michel, V.; Thirion, B.; Grisel, O.; Blondel, M.; Prettenhofer, P.; Weiss, R.; Dubourg, V.; et al. Scikit-learn: Machine learning in Python. J. Mach. Learn. Res. 2011, 12, 2825–2830. [Google Scholar]
  133. DeSantis, T.Z.; Hugenholtz, P.; Larsen, N.; Rojas, M.; Brodie, E.L.; Keller, K.; Huber, T.; Dalevi, D.; Hu, P.; Andersen, G.L. Greengenes, a Chimera-Checked 16S rRNA Gene Database and Workbench Compatible with ARB. Appl. Environ. Microbiol. 2006, 72, 5069–5072. [Google Scholar] [CrossRef] [PubMed] [Green Version]
  134. Shannon, C.E.; Weaver, W. The Mathematical Theory of Communication; University of Illinois Press: Champaign, IL, USA, 1949. [Google Scholar]
  135. Chao, A. Nonparametric estimation of the number of classes in a population. Scand. J. Stat. 1984, 11, 265–270. [Google Scholar]
  136. Chao, A.; Lee, S.M. Estimating the number of classes via sample coverage. J. Am. Stat. Assoc. 1992, 87, 210–217. [Google Scholar] [CrossRef]
  137. Pielou, E.C. The measurement of diversity in different types of biological collections. J. Theor. Biol. 1966, 13, 131–144. [Google Scholar] [CrossRef]
  138. Lozupone, C.; Knight, R. UniFrac: A New Phylogenetic Method for Comparing Microbial Communities. Appl. Environ. Microbiol. 2005, 71, 8228–8235. [Google Scholar] [CrossRef] [Green Version]
  139. Chen, J.; Bittinger, K.; Charlson, E.S.; Hoffmann, C.; Lewis, J.; Wu, G.D.; Collman, R.G.; Bushman, F.D.; Li, H. Associating microbiome composition with environmental covariates using generalized UniFrac distances. Bioinformatics 2012, 28, 2106–2113. [Google Scholar] [CrossRef]
  140. Lozupone, C.A.; Knight, R. Global Patterns in Bacterial Diversity. Proc. Natl. Acad. Sci. USA 2007, 104, 11436–11440. [Google Scholar] [CrossRef] [PubMed] [Green Version]
  141. Sorensen, T.A. A method of establishing groups of equal amplitude in plant sociology based on similarity of species content and its application to analyses of the vegetation on Danish commons. Biol. Skar. 1948, 5, 1–34. [Google Scholar]
  142. Legendre, P.; De Cáceres, M. Beta diversity as the variance of community data: Dissimilarity coefficients and partitioning. Ecol. Lett. 2013, 16, 951–963. [Google Scholar] [CrossRef]
  143. Jaccard, P. Nouvelles recherches sur la distribution florale. Bull. Soc. Vaud. Sci. Nat. 1908, 44, 223–270. [Google Scholar]
  144. Cover, T.; Hart, P. Nearest neighbor pattern classification. IEEE Trans. Inf. Theory 1967, 13, 21–27. [Google Scholar] [CrossRef]
  145. Vázquez-Baeza, Y.; Pirrung, M.; Gonzalez, A.; Knight, R. EMPeror: A tool for visualizing high-throughput microbial community data. GigaScience 2013, 2, 2047–217X. [Google Scholar] [CrossRef] [Green Version]
  146. Wickham, H. ggplot2: Elegant Graphics for Data Analysis; Springer: New York, NY, USA, 2016; Available online: https://ggplot2.tidyverse.org (accessed on 22 February 2021).
  147. Kersters, K.; De Vos, P.; Gillis, M.; Swings, J.; Vandamme, P.; Stackebrandt, E. Introduction to the Proteobacteria. In The Prokaryotes; Dworkin, M., Falkow, S., Rosemberg, E., Schleifer, K.H., Stackebrandt, E., Eds.; Springer: New York, NY, USA, 2006; pp. 3–37. [Google Scholar]
  148. Michán, C.; Blasco, J.; Alhama, J. High-throughput molecular analyses of microbiomes as a tool to monitor the wellbeing of aquatic environments. Microb. Biotechnol. 2021, 14, 870–885. [Google Scholar] [CrossRef] [PubMed]
  149. Anandan, R.; Dharumadurai, D.; Manogaran, G.P. An introduction to Actinobacteria. In Actinobacteria—Basics and Biotechlological Applications; Dharumadurai, D., Jiang, Y., Eds.; IntechOpen: Tamil Nadu, India, 2016. [Google Scholar] [CrossRef] [Green Version]
  150. Hashmi, I.; Bindschedler, S.; Junier, P. Firmicutes Chapter in Beneficial Microbes in Agro-Ecology, Bacteria and Fungi; Academic Press: Cambridge, MA, USA, 2020; pp. 336–396. [Google Scholar]
  151. Speirs, L.B.M.; Rice, D.T.F.; Petrovski, S.; Seviour, R.J. The Phylogeny, Biodiversity, and Ecology of the Chloroflexi in Activated Sludge. Front. Microbiol. 2019, 10, 2015. [Google Scholar] [CrossRef] [Green Version]
  152. Ren, Z.; Qu, X.; Peng, W.; Yu, Y.; Zhang, M. Nutrients Drive the Structures of Bacterial Communities in Sediments and Surface Waters in the River-Lake System of Poyang Lake. Water 2019, 11, 930. [Google Scholar] [CrossRef] [Green Version]
  153. Lee, Z.M.-P.; Poret-Peterson, A.; Siefert, J.L.; Kaul, D.; Moustafa, A.; Allen, A.; Dupont, C.L.; Eguiarte, L.E.; Souza, V.; Elser, J.J. Nutrient Stoichiometry Shapes Microbial Community Structure in an Evaporitic Shallow Pond. Front. Microbiol. 2017, 8, 949. [Google Scholar] [CrossRef]
  154. Zeglin, L.H. Stream microbial diversity in response to environmental changes: Review and synthesis of existing research. Front. Microbiol. 2015, 6, 454. [Google Scholar] [CrossRef] [PubMed] [Green Version]
Figure 1. The map of the Mureş River watershed with the sample sites with geographical coordinates are: M1 (46 94567–025 29396), M2 (46 73324–024 70280), M4 (46 44489–024 04081), M6 (46 42958–023 97672), M7 (46 38317–023 82367), M8 (46 31335-024 24526), M9 (46 11949-024 19757), M10 (46 16397-023 88426), M11 (46 130371-023 64135), M12 (46 04262–023 55594), M14 (45 91626–022 81669), M15 (46 0849.06-021 1642.063), M16 (46 10957-020 94043).
Water 13 03518 g001
Figure 2. (A) The relationship between the sequencing depth and the number of OTUs observed after rarefaction to the lowest sample size. (B) The relationship between the sequencing depth and the Shannon index observed after rarefaction to the lowest sample size.
Water 13 03518 g002
Figure 3. (A) Bacterial diversity at phylum level at each river sector standardized to 100%. The taxonomic levels are represented in descending order from bottom to top, except the last group. (B) Bacterial diversity at the class level at each river sector standardized to 100%. The taxonomic levels are represented in descending order from bottom to top, except the last group.
Water 13 03518 g003
Figure 4. Cluster dendrogram of class relative abundance based on Euclidean distance and using nearest neighbor clustering.
Water 13 03518 g004
Figure 5. (A) Microbial alpha diversity plots for observed OTUs, Chao1, and ACE (M1–M16 sampling stations). (B) Microbial alpha diversity plots for the Shannon index (M1–M16 sampling stations). (C) Microbial alpha diversity plots for the Simpson index (M1–M16 sampling stations). (D) Microbial alpha diversity plots for the Pielou evenness index (M1–M16 sampling stations).
Water 13 03518 g005
Figure 6. (A) Microbial beta-diversity through Emperor Plots of the principal coordinates analysis output for Bray-Curtis distances. (B) Microbial beta-diversity through Emperor Plots of the principal coordinates analysis output for Unweighted UniFrac distances.
Water 13 03518 g006
Figure 7. ‘Constrained’ ordination using the CCA method; total variation = 2.00969; explanatory variables account for 48.98% (adjusted explained variation is 31.97%) (M1–M16 sampling stations).
Water 13 03518 g007
Table 1. Chemical composition of the sediment samples.
River SectorNitrates (μg/g)Ammonium (μg/g)Orthophosphates (μg/g)
M11.58640235.6367330.67308
M23.8693185.92244916.88462
M41.72691223.1877625.38462
M65.61423230.8204125.14423
M70.52247214.5346933.31731
M83.8889529.43265340.09615
M93.92883933.4734729.90385
M106.62546837.310246.97115
M111.6294622.249388102.5962
M124.846442156.367360
M143.41529721.7183738.60577
M150.4634831.44938817.01923
M167.687516.1265337.25962
Publisher’s Note: MDPI stays neutral with regard to jurisdictional claims in published maps and institutional affiliations.

