
Mechanism of Tsunami-Induced Erosion of Bridge-Abutment Backfill and Its Countermeasures


1
Department of Civil and Environmental Engineering, Nagoya University, Nagoya 464-8603, Japan
2
Department of Civil Engineering and Architecture, Nagoya University, Nagoya 464-8603, Japan
*
Author to whom correspondence should be addressed.
Water 2021, 13(24), 3529; https://doi.org/10.3390/w13243529
Submission received: 15 November 2021
/
Revised: 7 December 2021
/
Accepted: 8 December 2021
/
Published: 9 December 2021
(This article belongs to the Section Oceans and Coastal Zones)
Abstract
:Tsunamis can destroy bridges in coastal areas. Studies have attempted to unravel the mechanism of tsunami-induced damage and develop effective countermeasures against future tsunamis. However, the mechanisms of tsunami-induced erosion of bridge-abutment backfill and its countermeasures have not been studied adequately. This study investigates this topic using numerical analysis. The results show that the tsunami flowing down along the downstream wing of the abutment induces bedload sediment transport on the ogive section of the backfill on the downstream side of the abutment, resulting in the onset of backfill erosion. Sediment suspension and bedload sediment transportation occur when the backfill inside the abutment starts to flow out from below the downstream wing. This leads to subsidence of the backfill at the upstream side of the downstream wing. The subsequent backfill erosion is mainly caused by bedload sediment transport. Numerical experiments on countermeasures show that extending the wings downward can prevent the acceleration of backfill erosion in the presence of the abutment. A combination of multiple countermeasures, including extended wings, would be more effective in maintaining the stability of the abutment after a tsunami. This suggests the application of such countermeasures to actual bridges as an effective countermeasure against backfill erosion.
1. Introduction
Structures in coastal areas suffer severe damages due to tsunamis. For example, several forms of structural damage were observed during the 2004 Indian Ocean and 2011 Tohoku earthquake tsunamis, including the overturning and wall failure of reinforced-concrete buildings in coastal areas, local scouring around their foundations, separation of concrete panels and armor blocks of coastal dikes, collapse of seawalls and flood walls, washaway of roadways and railway bridge superstructures, failure of bridge piers, and damage induced by impact and damming of debris such as shipping containers, vessels, timber logs, boulders [1,2]. Studies have attempted to clarify the characteristics and mechanisms of tsunami-induced damage and develop effective countermeasures against future tsunamis. According to Nacházel et al. [3], the number of these studies rapidly increased after the 2004 Indian Ocean tsunami, 2011 Tohoku earthquake tsunami, and 2018 Sulawesi tsunami.
Research has also been conducted on bridge damage caused by tsunamis. Azadbakht and Yim [4] provided a comprehensive literature review of studies on this topic up to 2014. They also analyzed the time histories of the horizontal and vertical forces, and the overturning moment acting on five bridge superstructures located in CA, USA, using a finite-element analysis code, LS-DYNA. Based on the analysis, they proposed a new method for estimating the maximum horizontal, maximum downward vertical, and maximum uplift forces. Nakamura et al. [5] investigated the tsunami-induced pressure and load acting on a bridge superstructure using hydraulic model experiments and numerical simulations based on the hydraulic model. They used the results to propose estimation formulas for the temporal changes in the horizontal and vertical forces. Istrati et al. [6] experimentally investigated the tsunami-induced force acting on individual structural components of a bridge with open girders. The study assessed the risk of tsunamis to coastal bridges to include the distribution of tsunami loads to individual structural components. Istrati and Buckle [7] conducted large-scale hydraulic experiments to examine the effect of air trapped in the chambers of bridges on the tsunami load. This study showed that air entrapment affected the pattern and magnitude of wave pressures due to the cushioning effect, leading to a 39% average and 148% maximum increases in the total uplift force and a 32% average increase in the overturning moment.
In addition to research on the bridge superstructures mentioned above, studies focusing on the backfill of bridge abutments were conducted in terms of tsunami-induced erosion. Inoue et al. [8] and Yoshizaki et al. [9] conducted centrifuge model experiments to investigate the erosion of two types of abutments. These studies demonstrated the sliding of the slope of the backfill, especially on the downstream side, despite little damage to the crown because of an increase in wave pressure, and the average slide height relative to the initial backfill height was correlated with the velocity of the leading edge of the tsunami. These studies also suggested that the stability of concrete blocks covering the backfill could be assessed by the weight of the blocks, friction force based on Coulomb’s friction law, and lift force induced by the difference in flow velocity between the upper and lower sides of the blocks. Nakamura et al. [10] investigated the process of tsunami-induced backfill erosion using hydraulic model experiments and numerical analyses based on a three-dimensional (3D) coupled fluid–structure–sediment–seabed interaction model (FS3M) [11]. The study showed that the tsunami first eroded the ogive section of the backfill on the landward side of the downstream wing. When the erosion reached the lower end of the downstream wing, the backfill began to flow out from underneath. However, these studies did not investigate sediment transport and its driving force, i.e., bed shear stress. Hence, the mechanism of tsunami-induced backfill erosion remains unclear. They also did not present a method to protect the backfill from future tsunamis.
In this study, the mechanism of tsunami-induced backfill erosion of a bridge abutment and its countermeasures were investigated using FS3M. Specifically, FS3M was applied to the hydraulic model experiments by Nakamura et al. [10] and the mechanism of the backfill erosion was examined from numerical results. Subsequently, numerical experiments changing the configuration of the abutment were conducted using the same computational conditions and its effects on the backfill erosion were assessed to demonstrate the effectiveness as a countermeasure.
Section 2 provides a brief description of FS3M, for completeness, and explains the computational conditions for examining the erosion mechanism. Section 3 presents the numerical results in terms of sediment transport and the Shields parameters. Section 4 details the numerical experiments, along with various countermeasures and their effectiveness. Section 5 summarizes the conclusions.
2. Numerical Conditions for Erosion Mechanism
The validity of the 3D coupled fluid–structure–sediment–seabed interaction model (FS3M) [11] was verified through a comparison with the experimental results on tsunami-induced backfill erosion of a bridge abutment in terms of water surface fluctuations and surface profile changes in the backfill [10].
The FS3M is composed of a main solver and four modules, i.e., volume of fluid (VOF), immersed boundary (IB), sediment transport (ST), and finite element model (FEM) modules. The main solver is a large-eddy simulation (LES) model for computing an incompressible viscous air, water, pore–air, and pore–water multi-phase flow considering the surface profile evolution of a sediment bed. The VOF module is to track the air–water interface motion. The IB module is based on the body–force type of the IB method for fluid–structure interaction (FSI) analysis of movable objects. The ST module is to compute the surface profile evolution of the sediment bed induced by bedload and suspended sediment transport, and suspended sediment concentration that considers all transport processes (i.e., pickup, settling, advection, and diffusion). The FEM module is based on the u-p approximation of the Biot equation for the coupled soil–water analysis of the sediment bed. The VOF, IB, and ST modules are connected to the main solver through a two–way coupling procedure implemented at every time step to ensure fluid–structure–sediment interaction. Details of FS3M including governing equations can be found in [11,12].
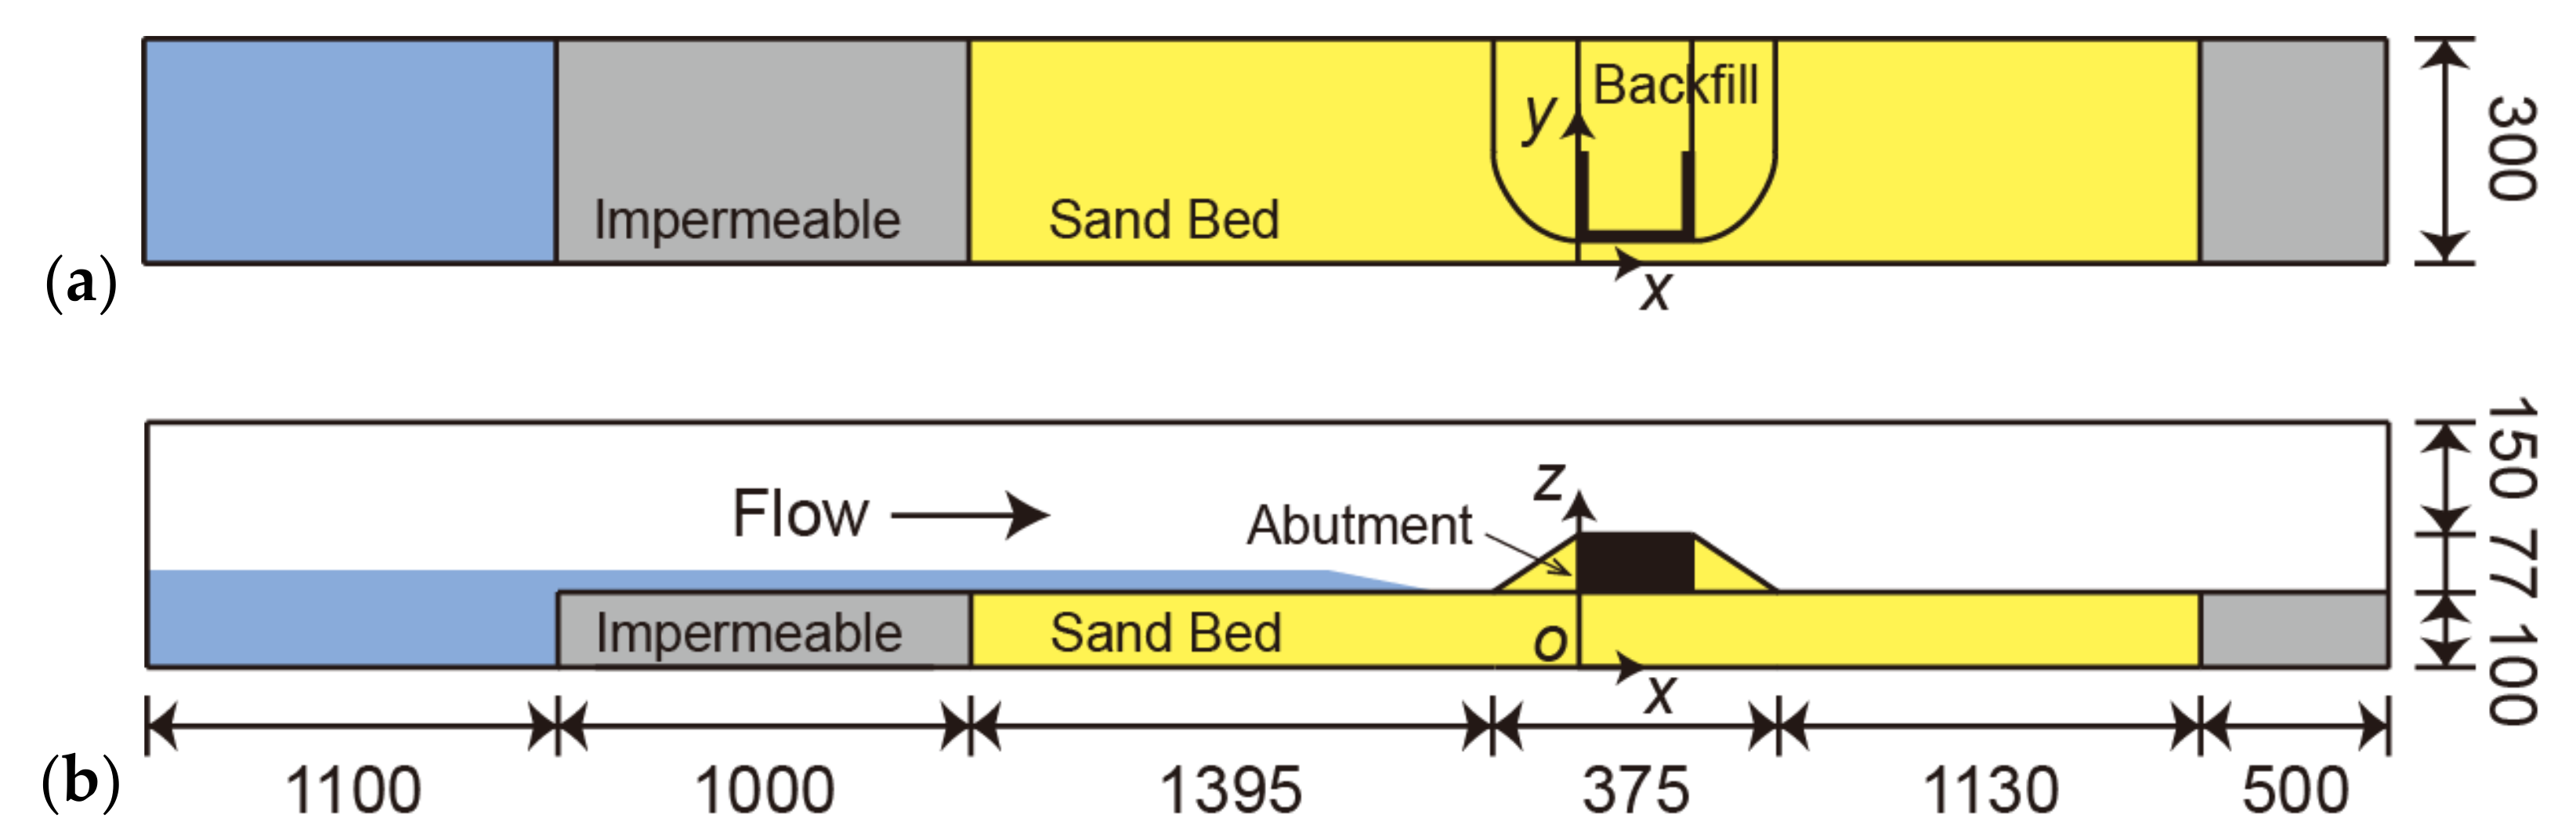
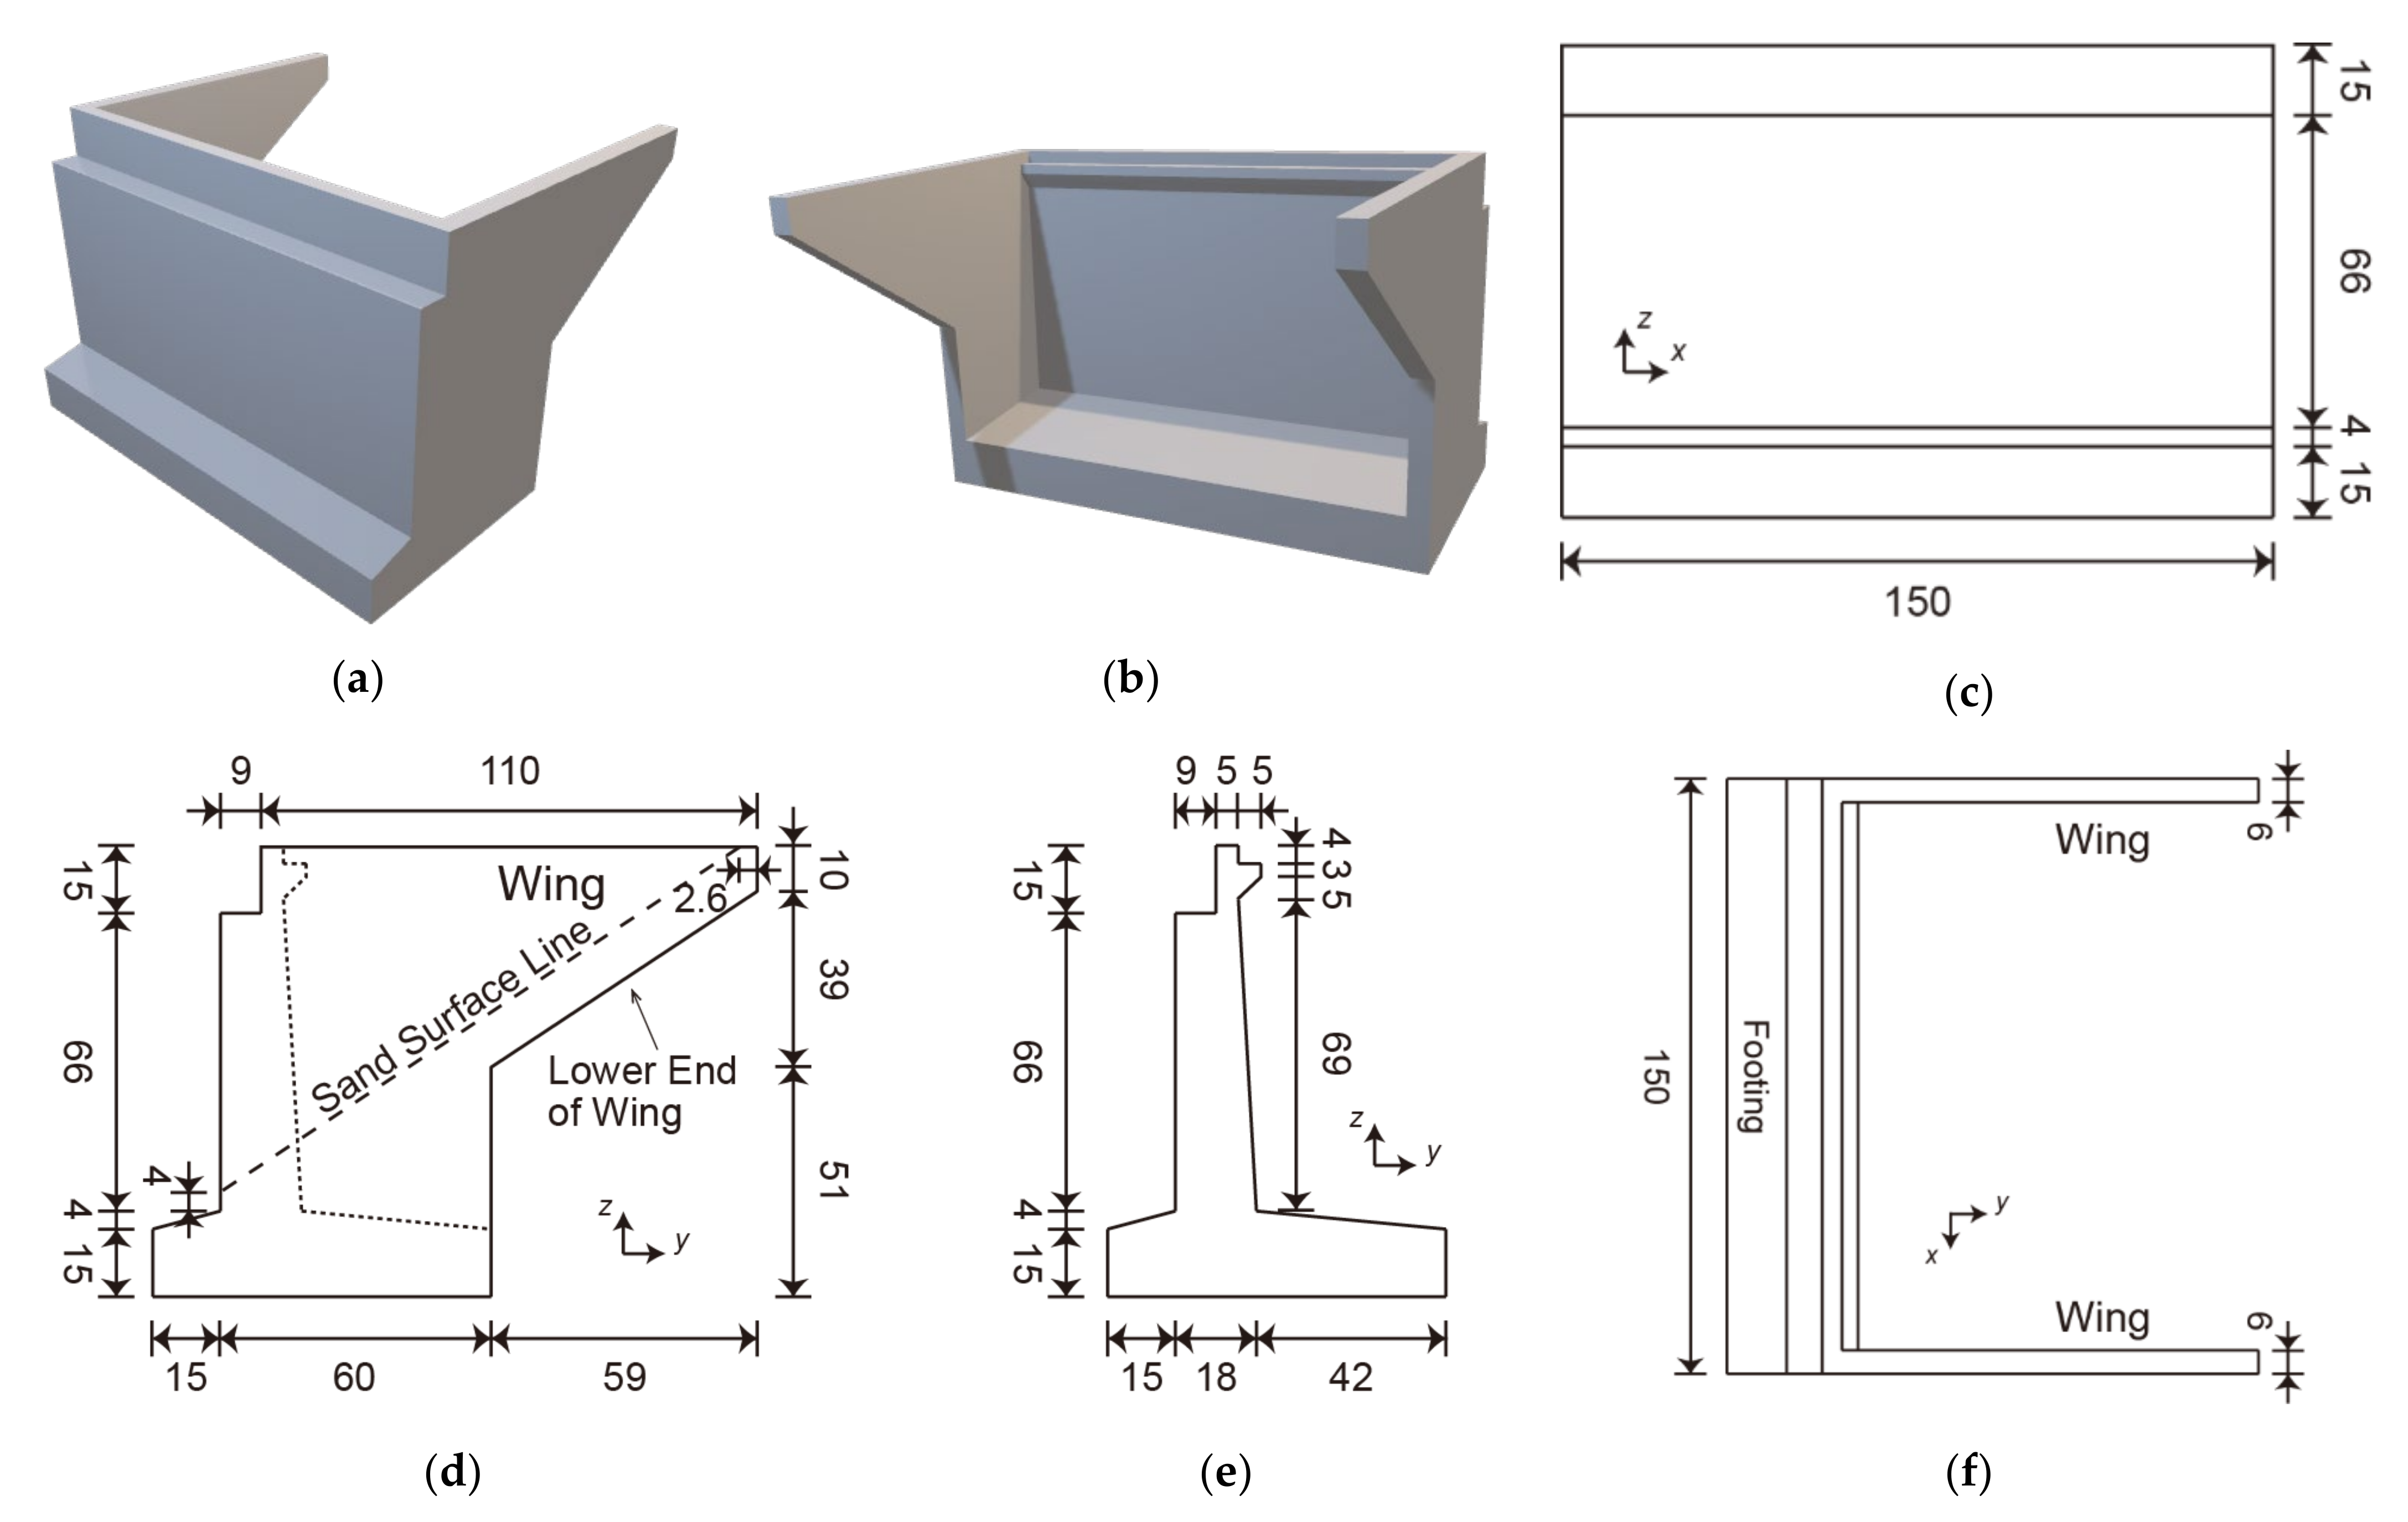
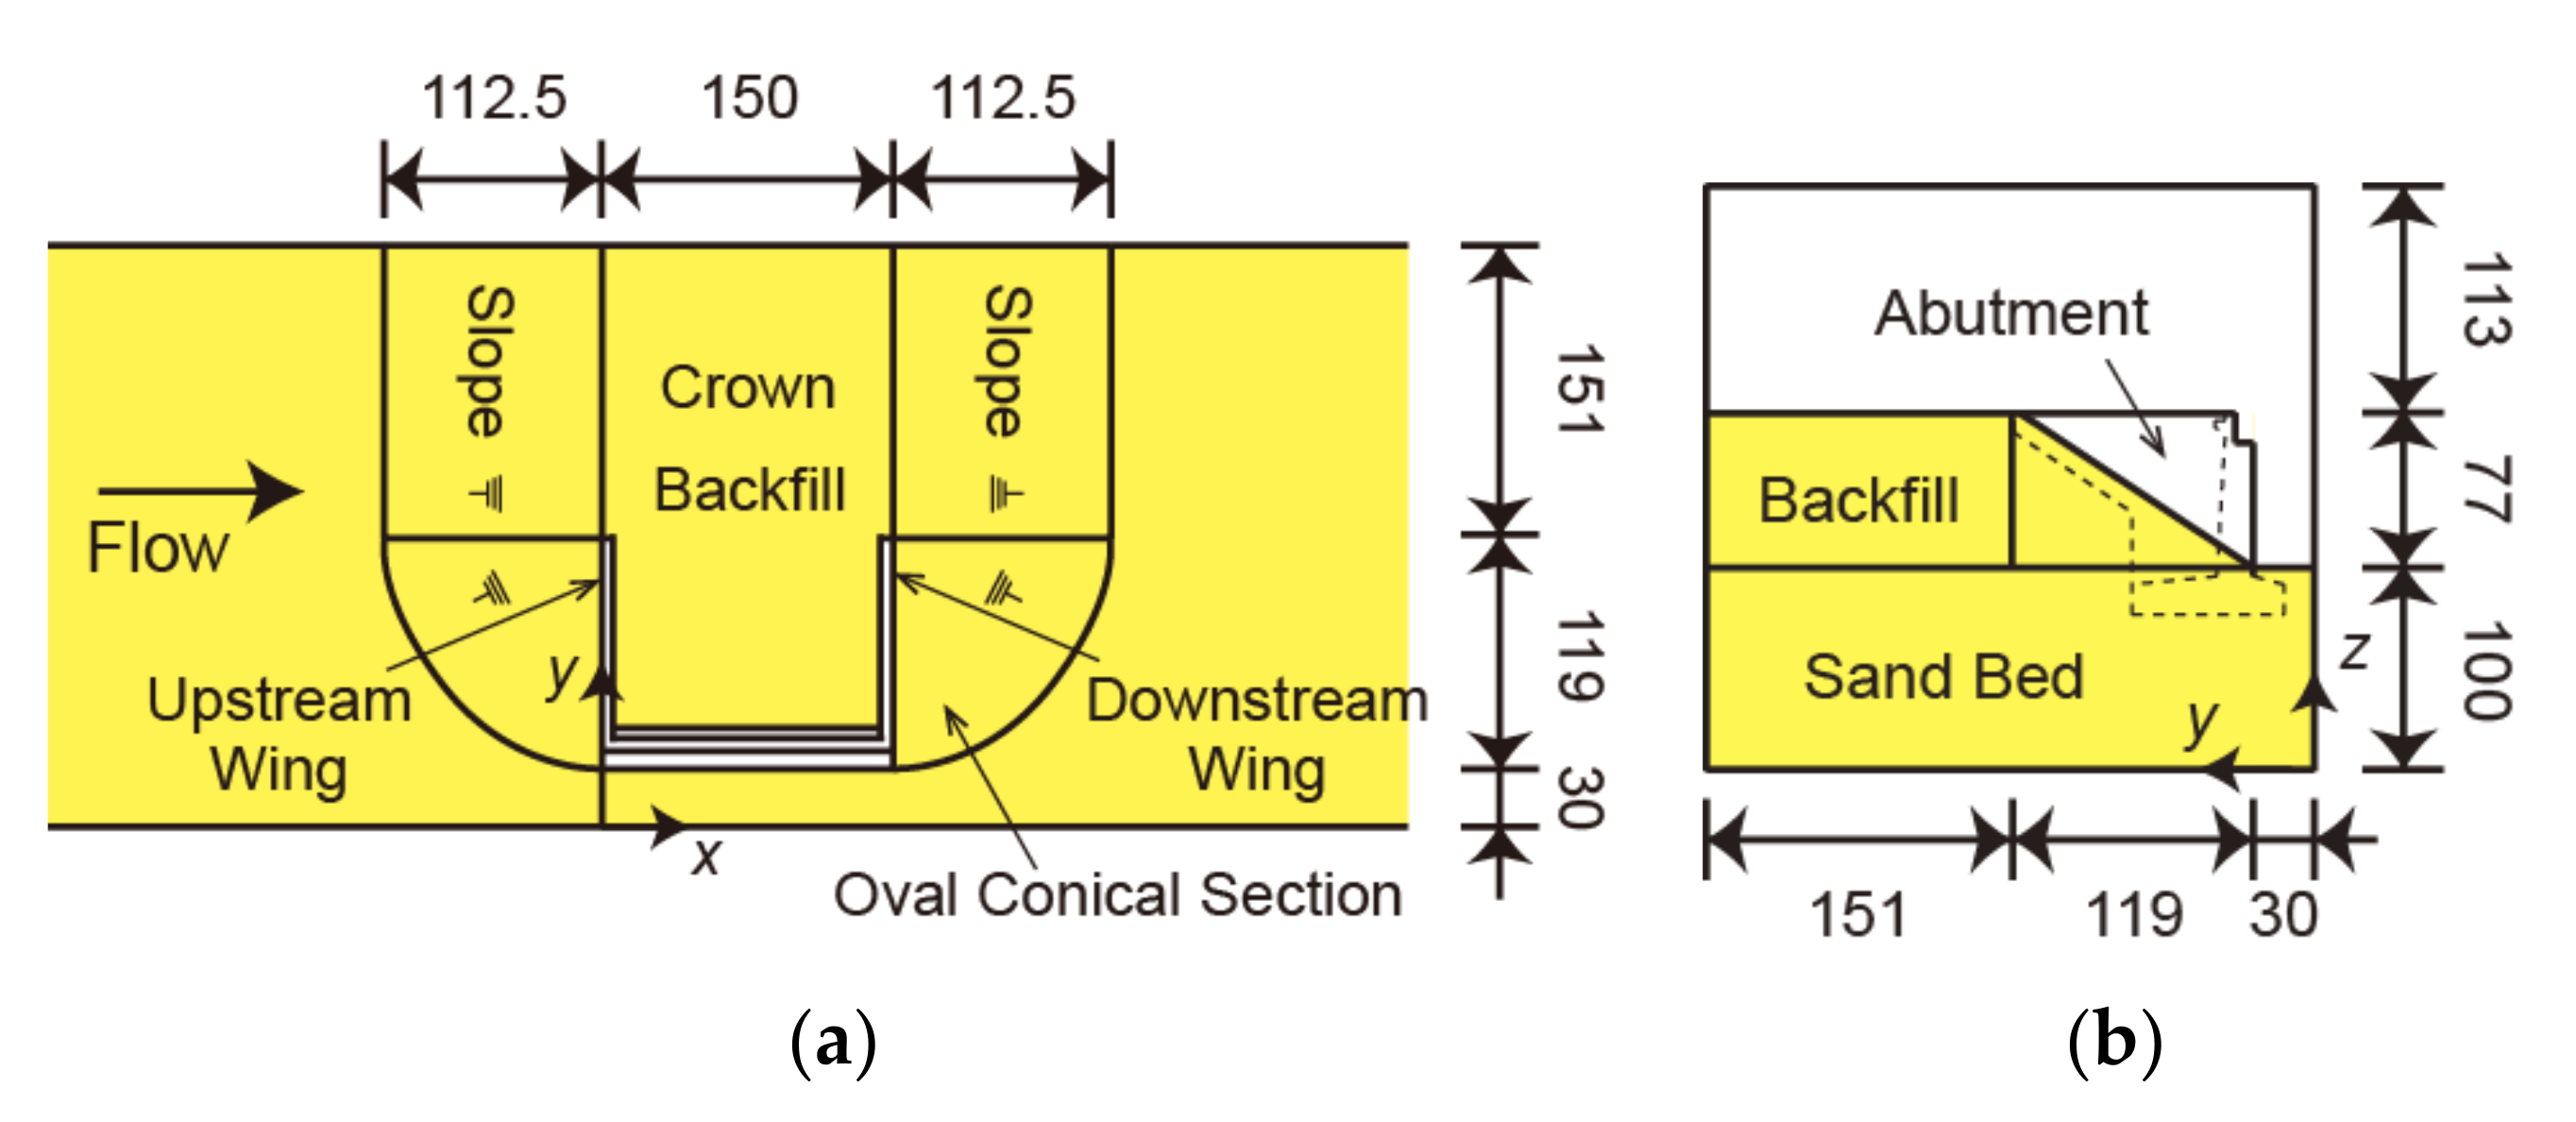
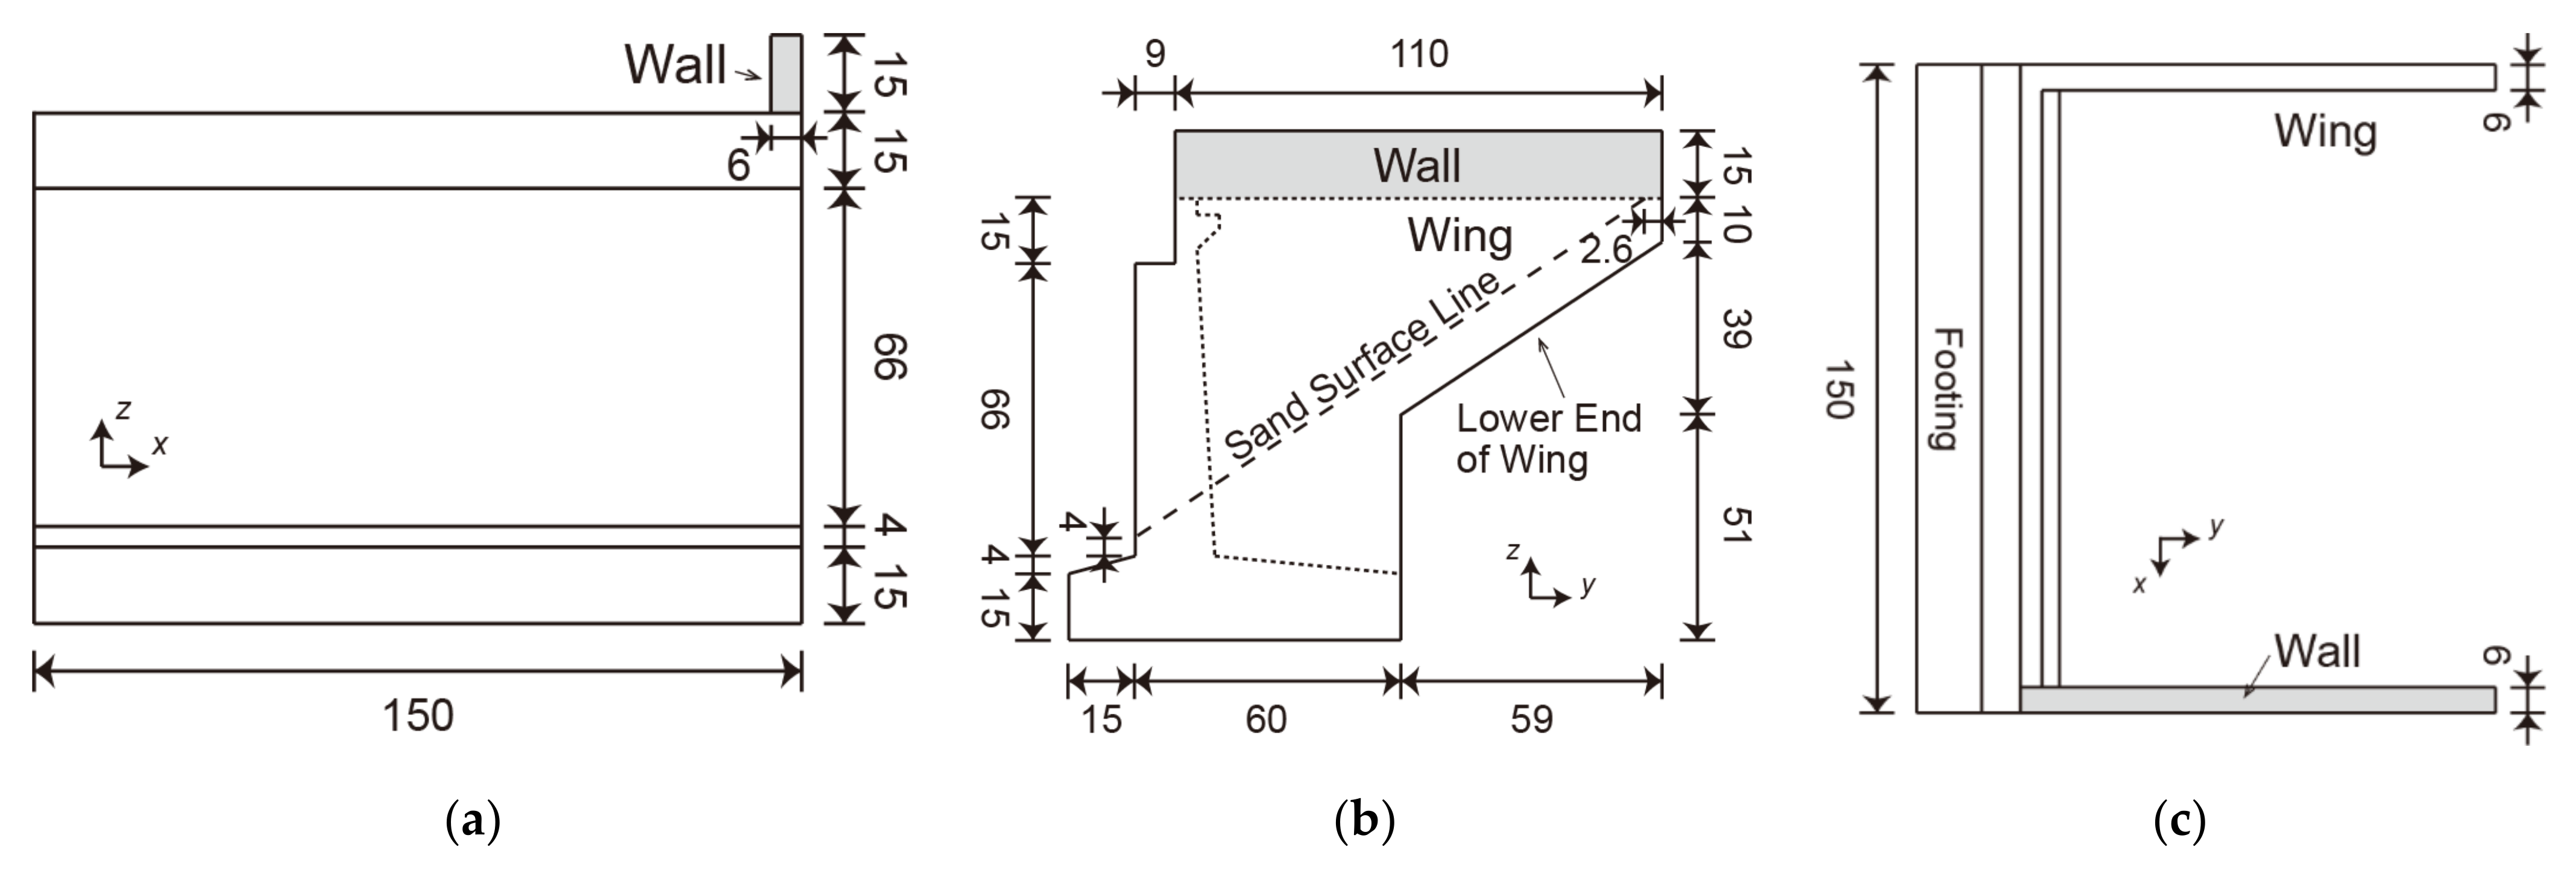
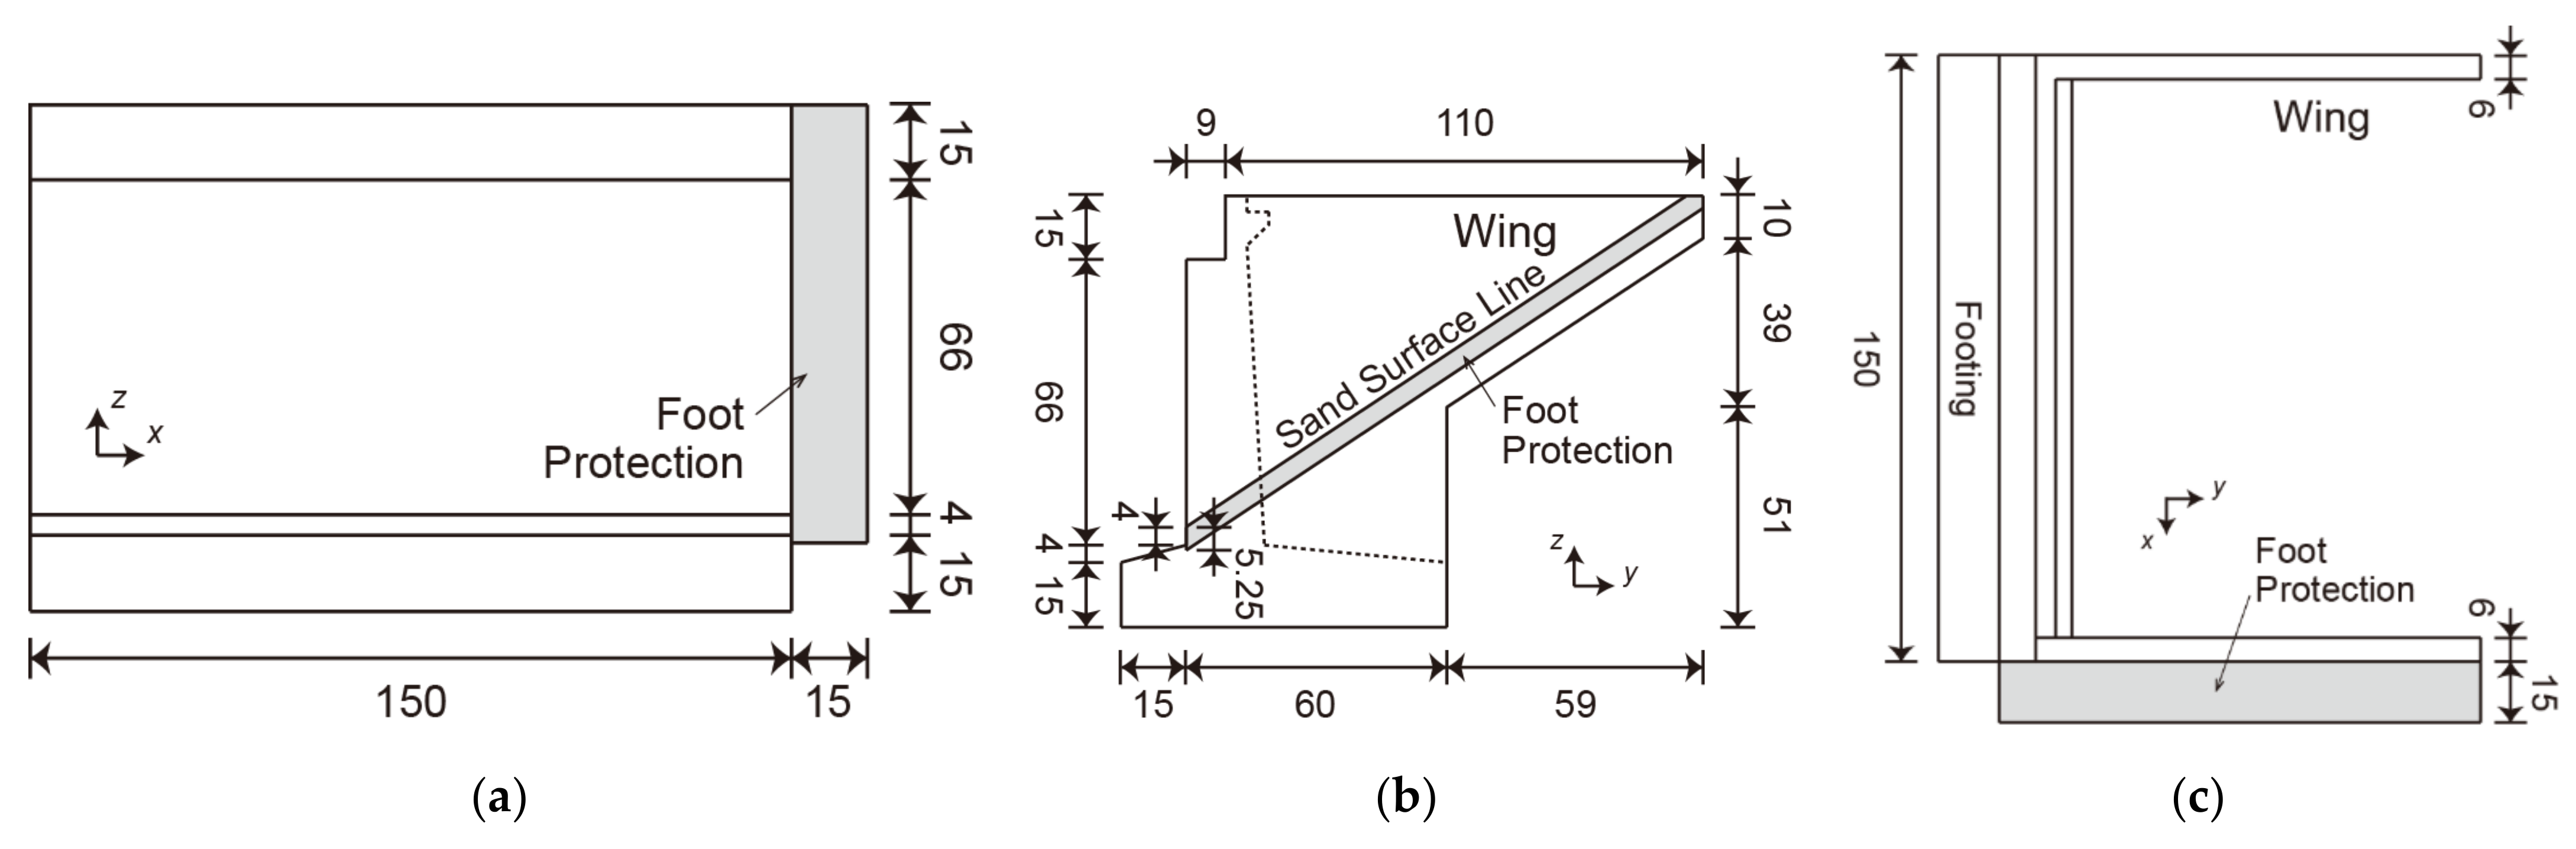
In this study, the FS3M was applied to the same computational domain, numerical cells, and boundary conditions as those used by Nakamura et al. [10]. Figure 1 illustrates the entire computational domain (length: 5.5 m, width: 0.30 m, height: 0.327 m). Figure 2 and Figure 3 illustrate the details of the bridge abutment and backfill (crown width: 150 mm, height: 77 mm, slope: 1/1.46). The bridge abutment and backfill were a 1/100-scale model of the Numata overpass in Iwate Prefecture, Japan, which was damaged during the 2011 Tohoku earthquake tsunami. In Nakamura et al. [10], such a small-scale model was used due to limited space at the facility. As depicted in Figure 1, a sand bed (length: 2.90 m, thickness: 0.10 m), abutment (Figure 2), and backfill (Figure 3) were set in the computational domain. The backfill had two quarter sections of an ogive on the upstream and downstream sides (left and right sides in Figure 3a) of the abutment. Table 1 lists the parameters of the porous material forming the sand bed and backfill, which have the same values as those of Nakamura et al. [10]. The critical Shields parameter for the horizontal bed and the settling velocity of sand particles were determined using Iwagaki’s formula [13] and Rubey’s equation [14], respectively. The x-, y-, and z-axes are defined in Figure 1. The horizontal along-channel direction with its origin on the upstream surface (left surface in Figure 1) of the abutment is defined as the x-axis; the horizontal cross-channel direction with its origin on the front surface (lower surface in Figure 1a) of the channel is defined as the y-axis, and the vertically upward direction with its origin on the bottom of the channel (Figure 1b) is defined as the z-axis.
The regions of the domains −0.15 ≤ x ≤ 0.60 m near the backfill, 0.039 ≤ y ≤ 0.049 m near the abutment wall, and 0.051 ≤ z ≤ 0.198 m near the backfill were divided into 7.5 mm × 5.0 mm × 1.75 mm uniform cells. The remainder of the domain was divided into non-uniform cells, with increasing cell length in all directions to decrease the computational cost. The upstream boundary was set as the inflow boundary, which provided the same unit-width flow rate of 0.0260 m3/s/m as the hydraulic model experiments for 30 s. The slip condition was applied to the surfaces of the abutment and bottom boundary, forward boundary, and backward boundary, the gradient-free condition to the downstream boundary, and the constant-pressure condition to the top boundary.
It should be noted that this study modeled the entire abutment, including the slab inside the abutment, which was not modeled by Nakamura et al. [10], assuming its small influence. However, although no figure is presented here, the numerical results were not significantly different from those of Nakamura et al. [10].
3. Mechanism of Backfill Erosion
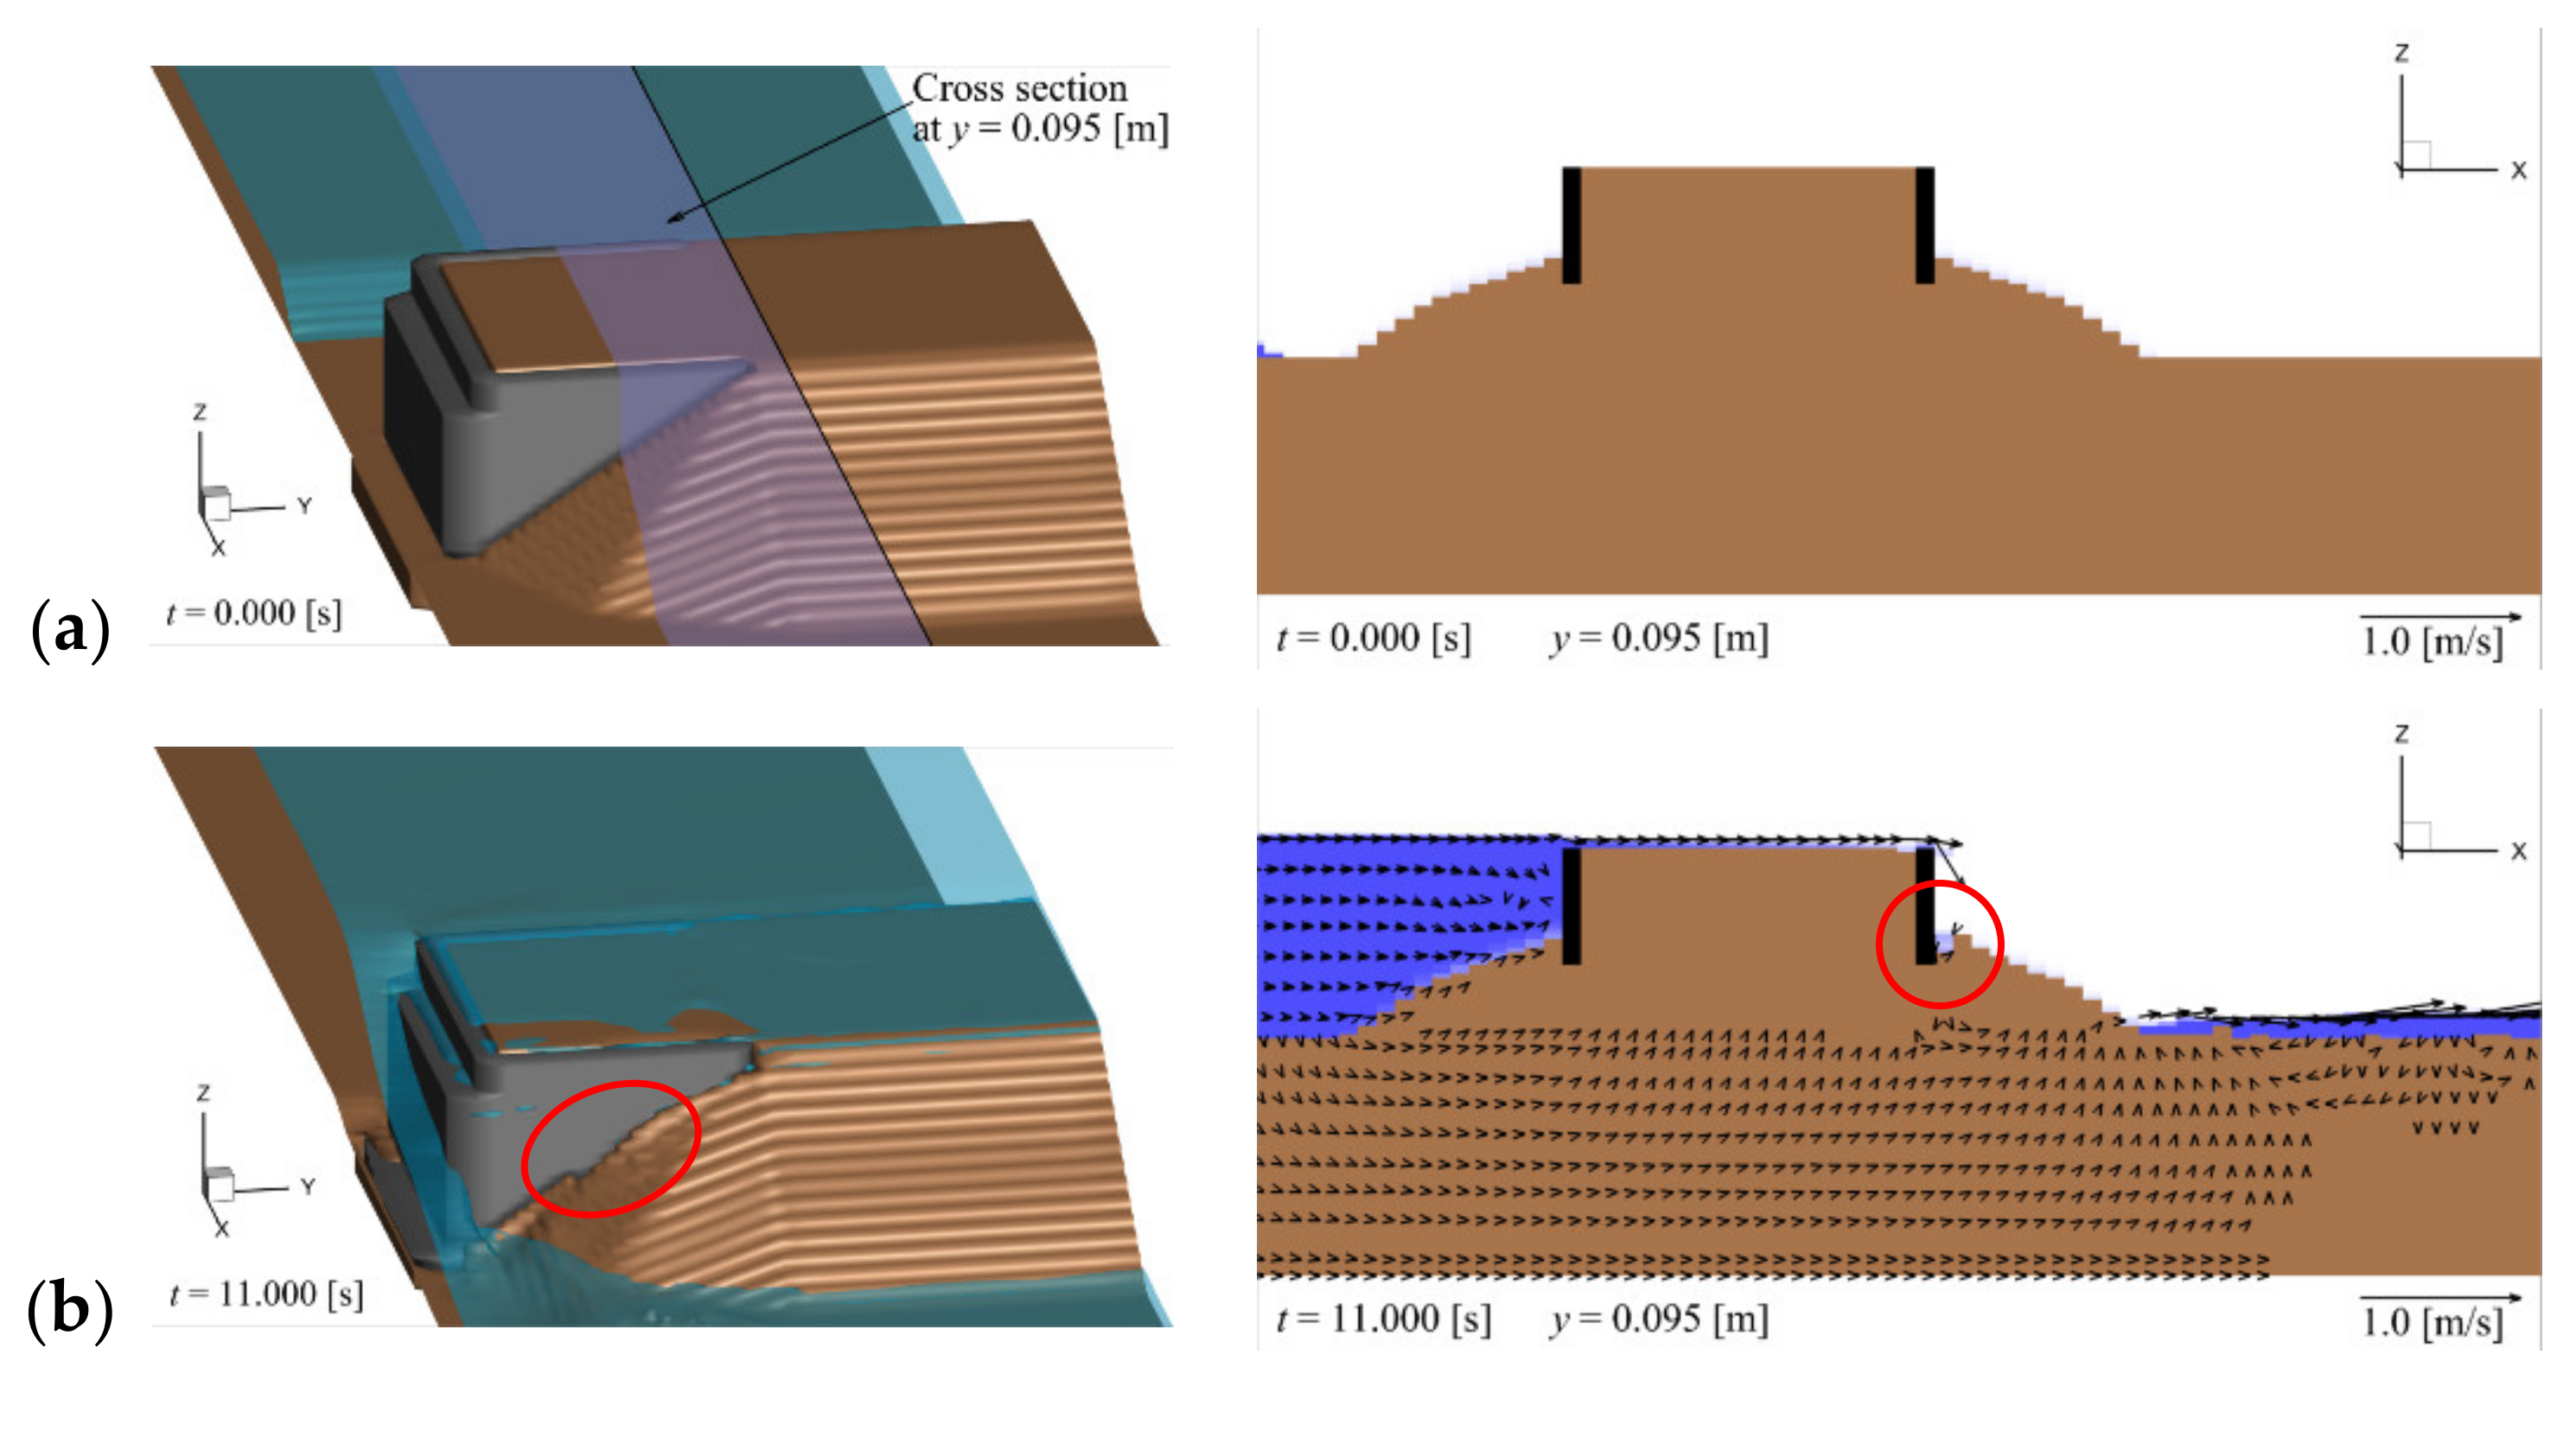
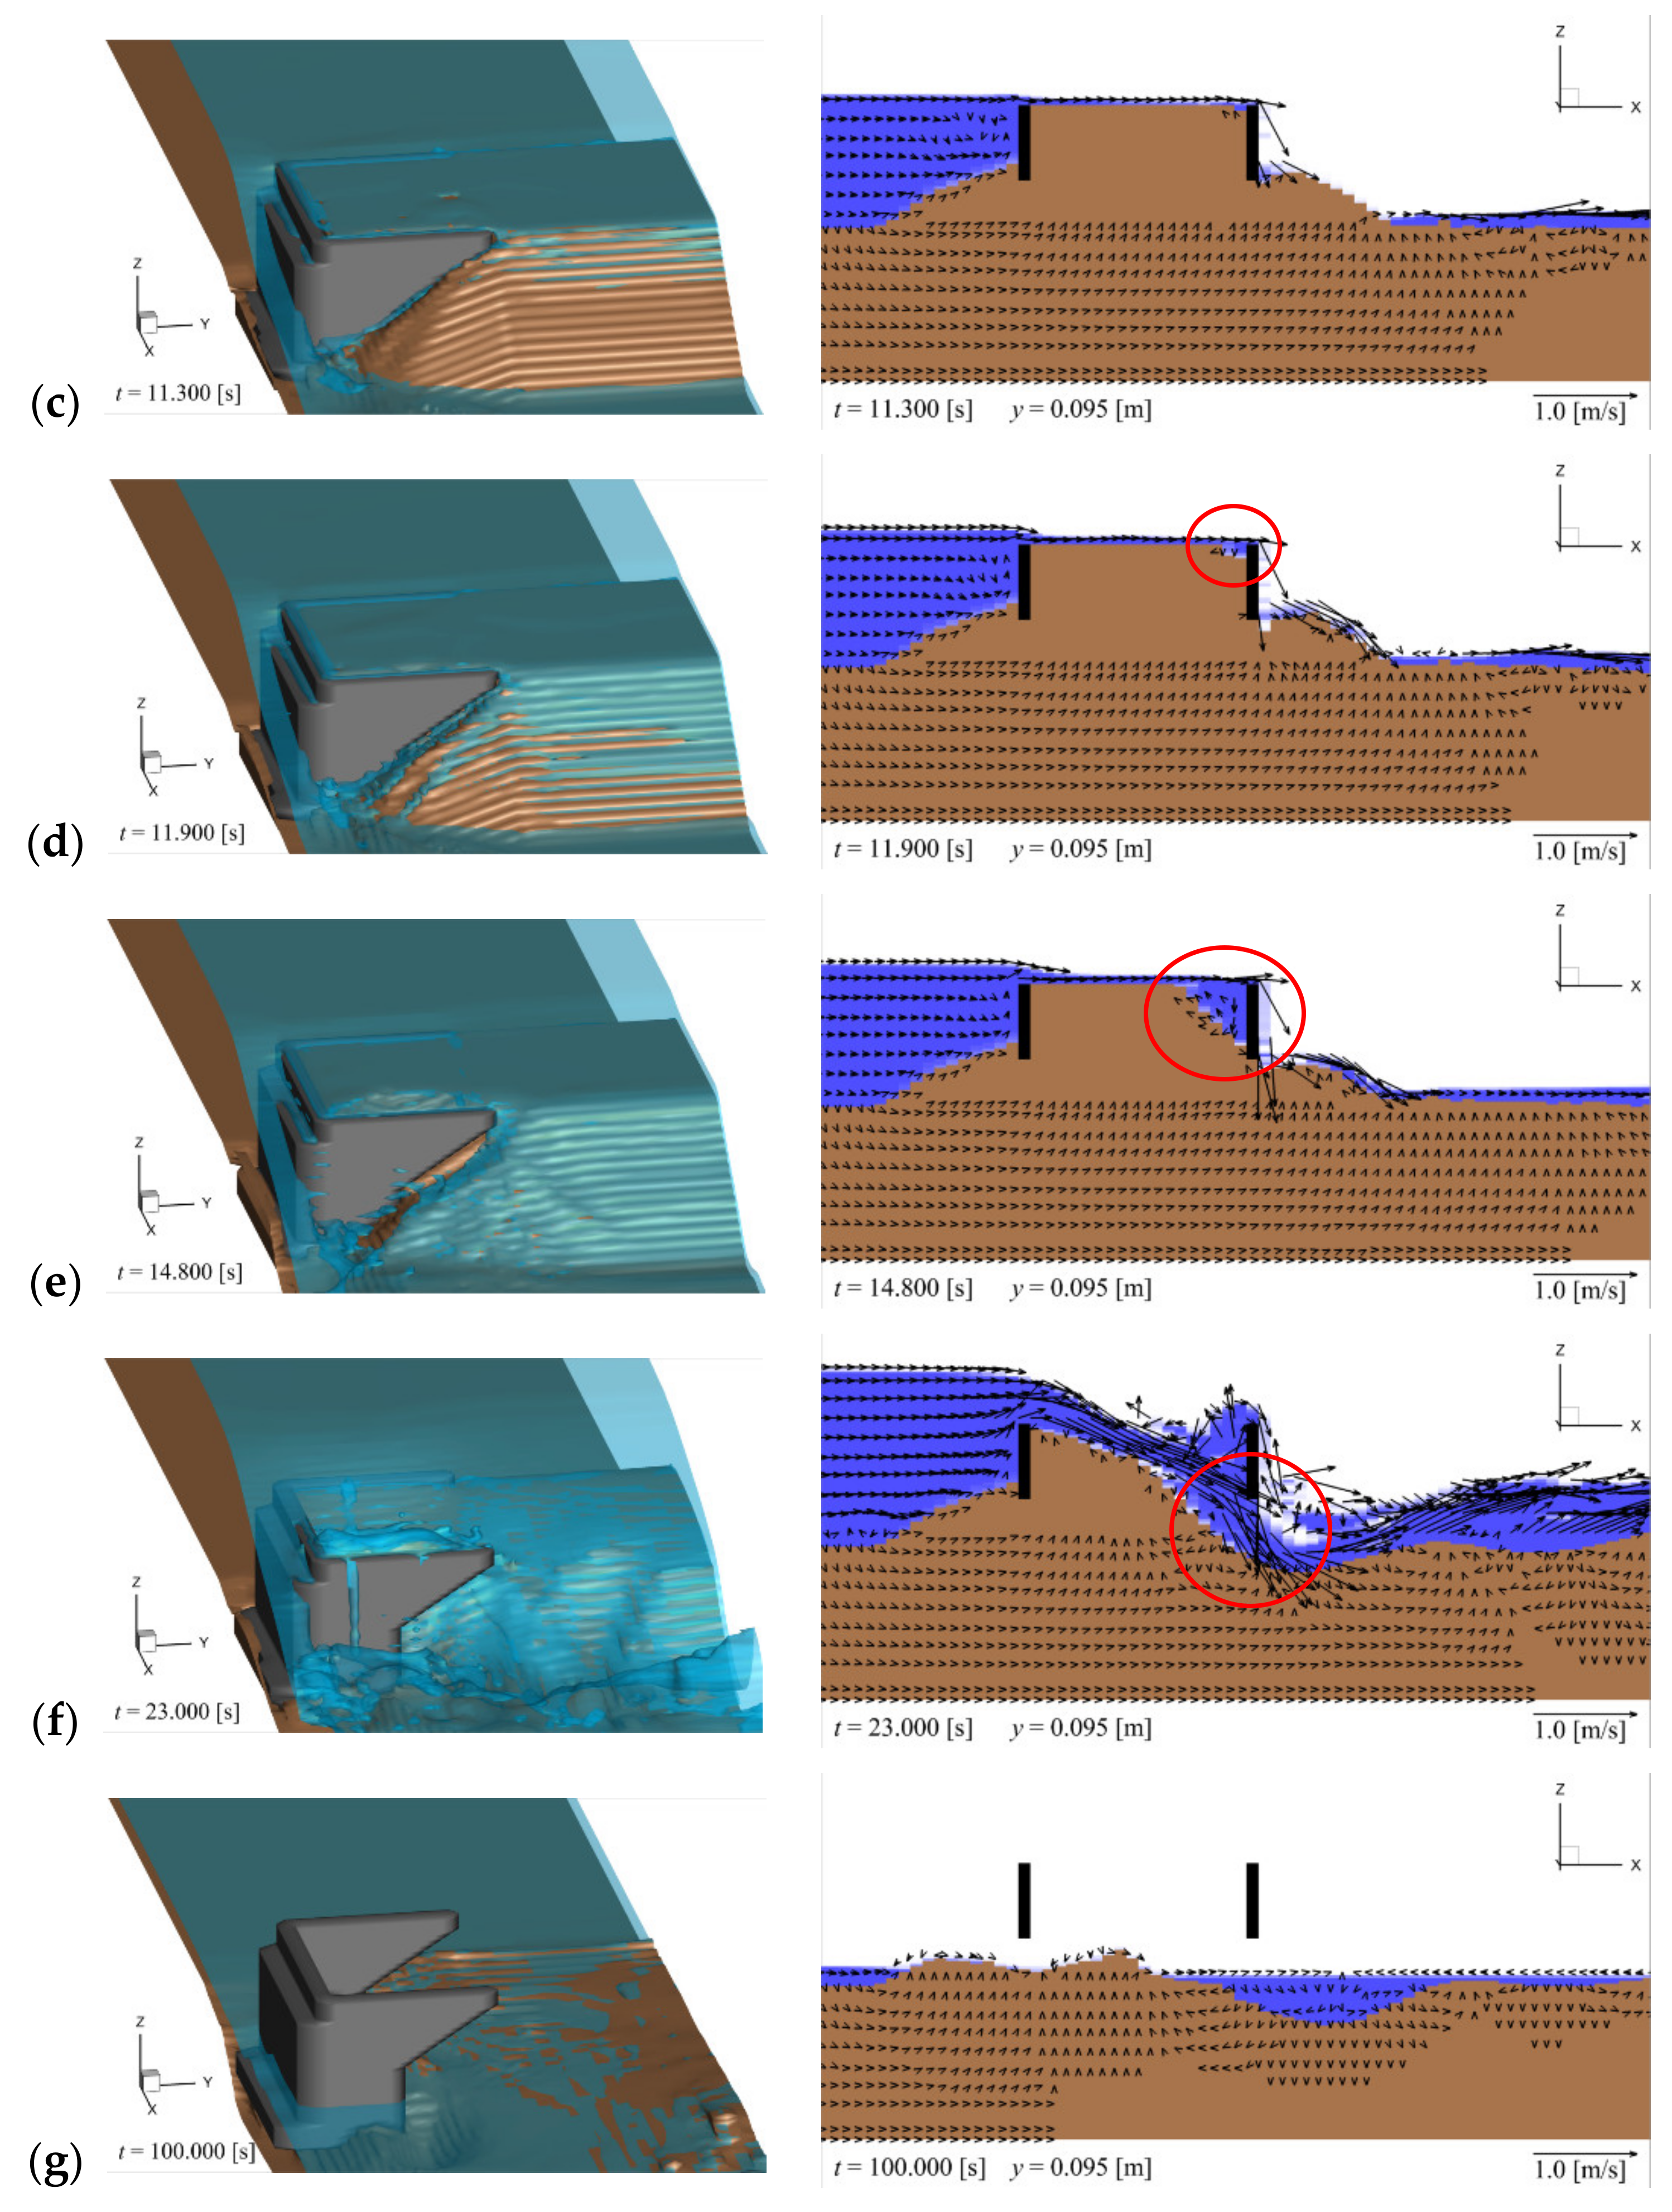
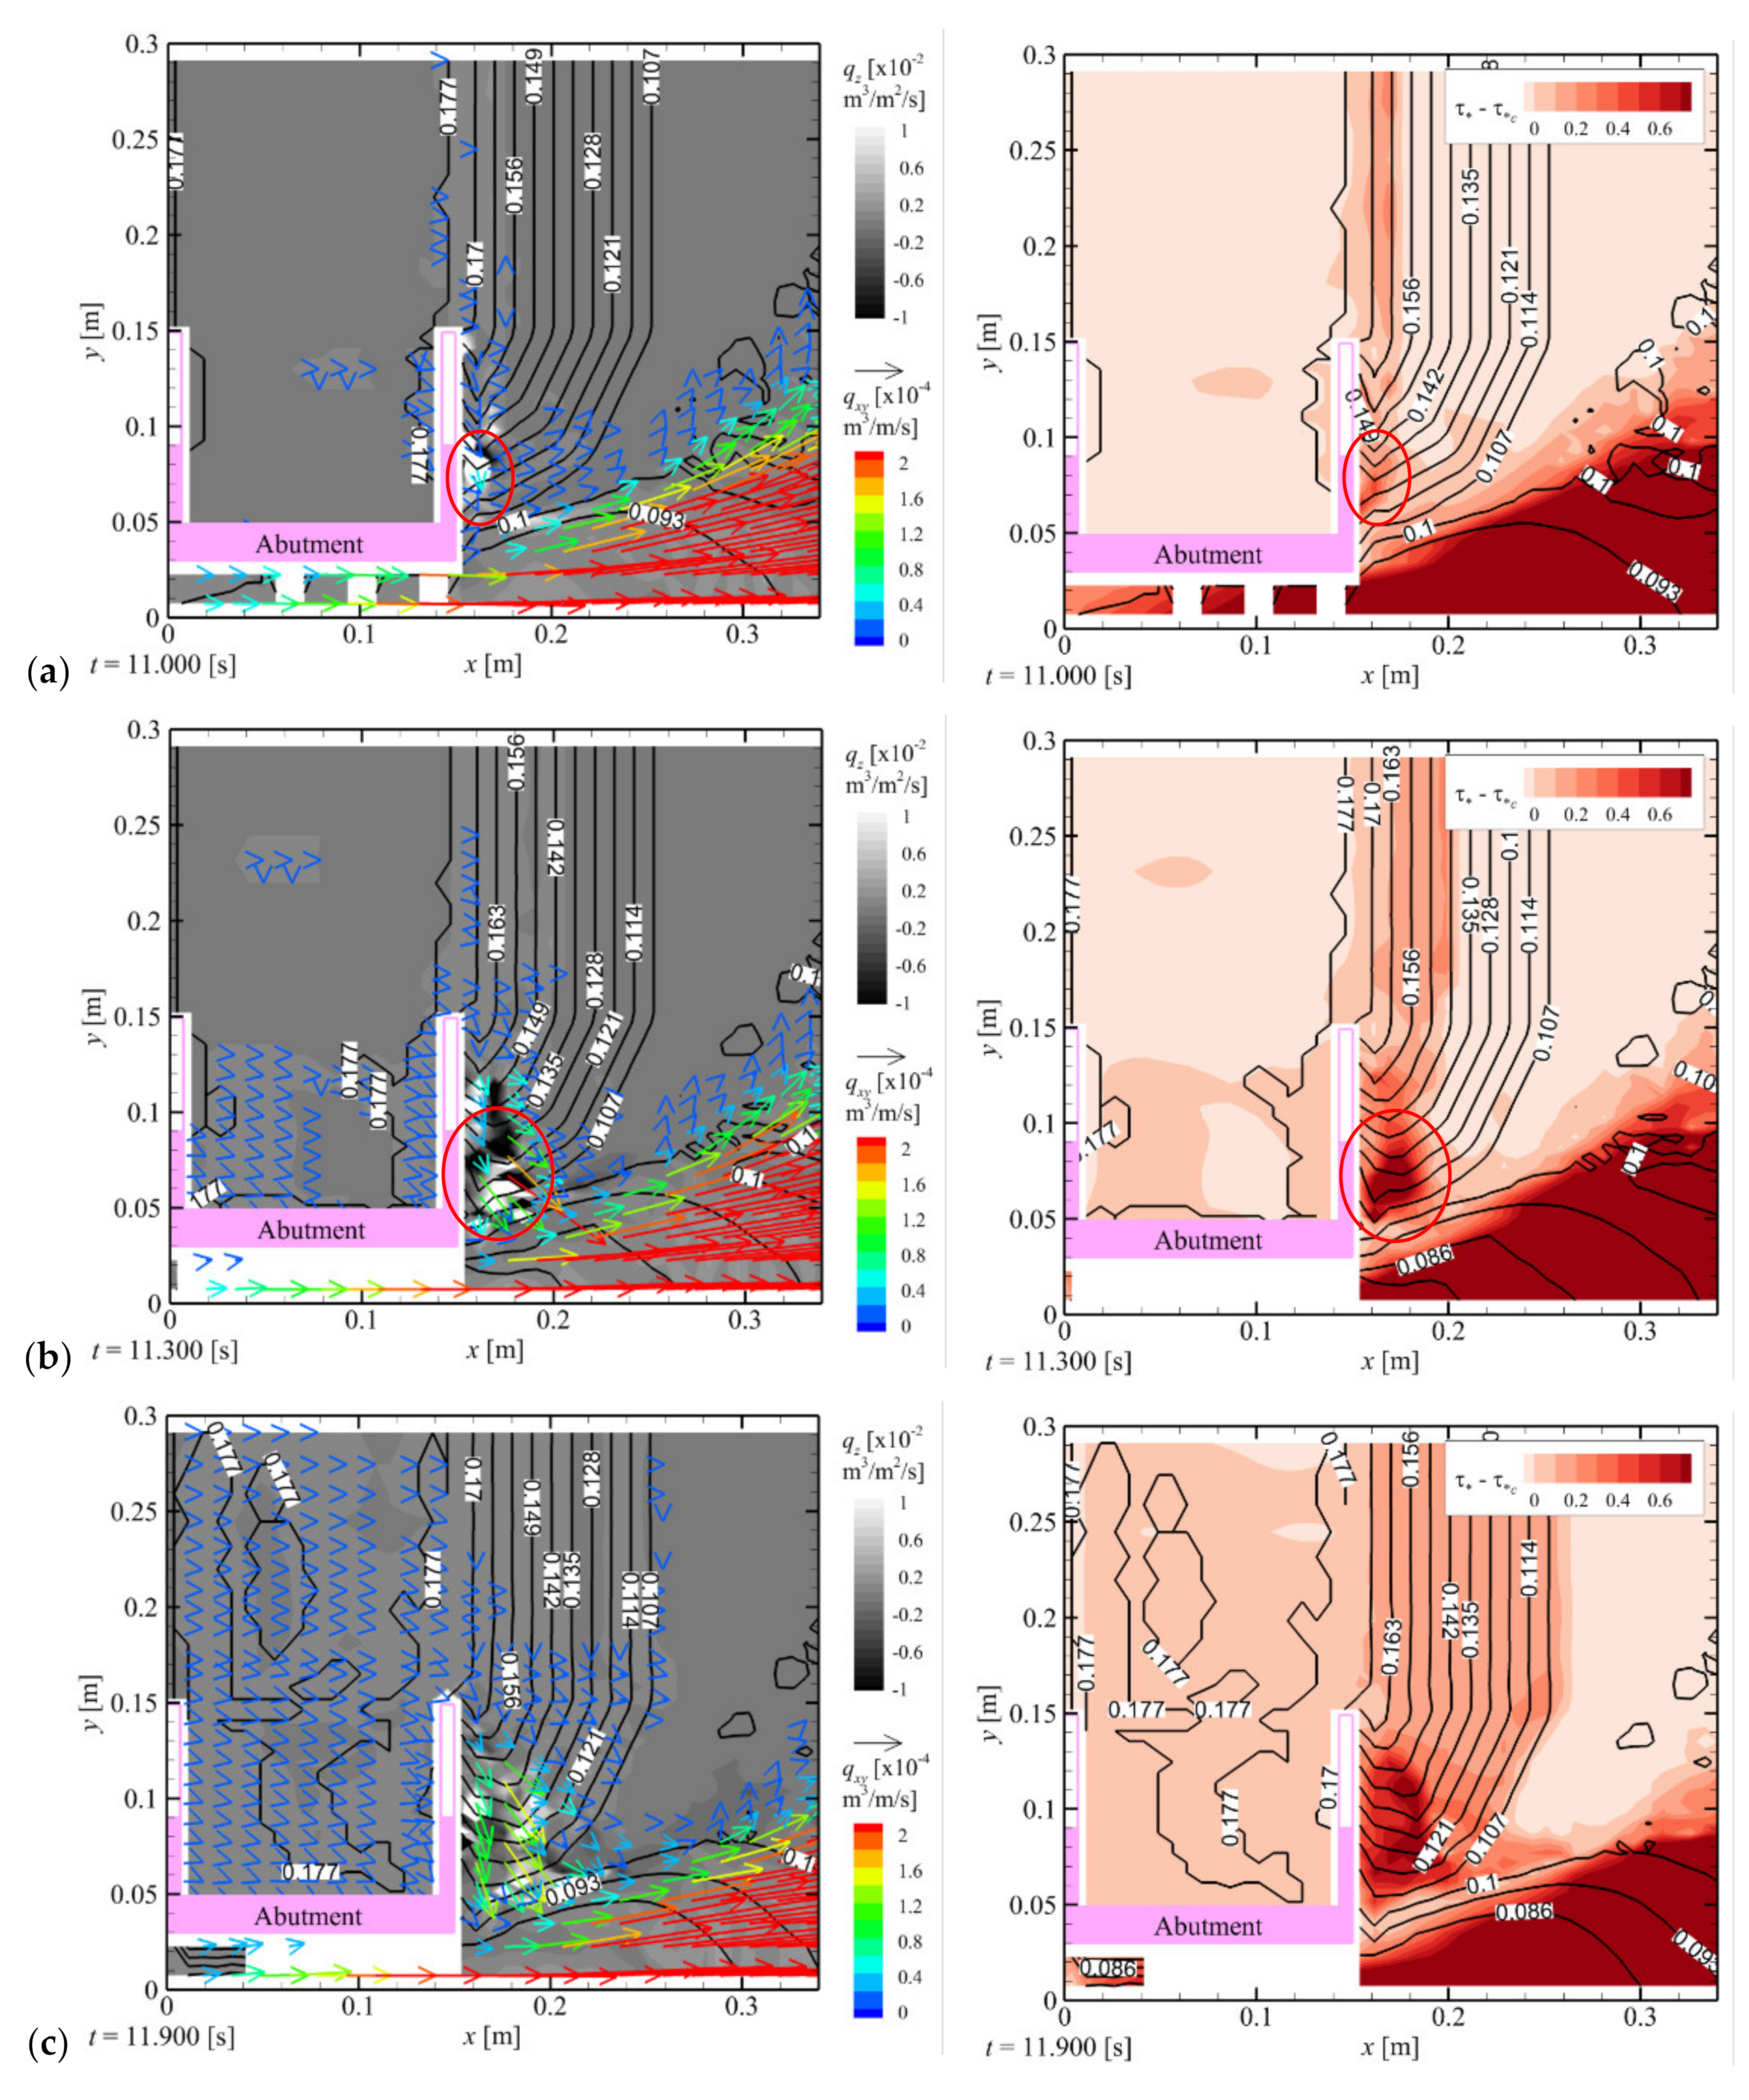
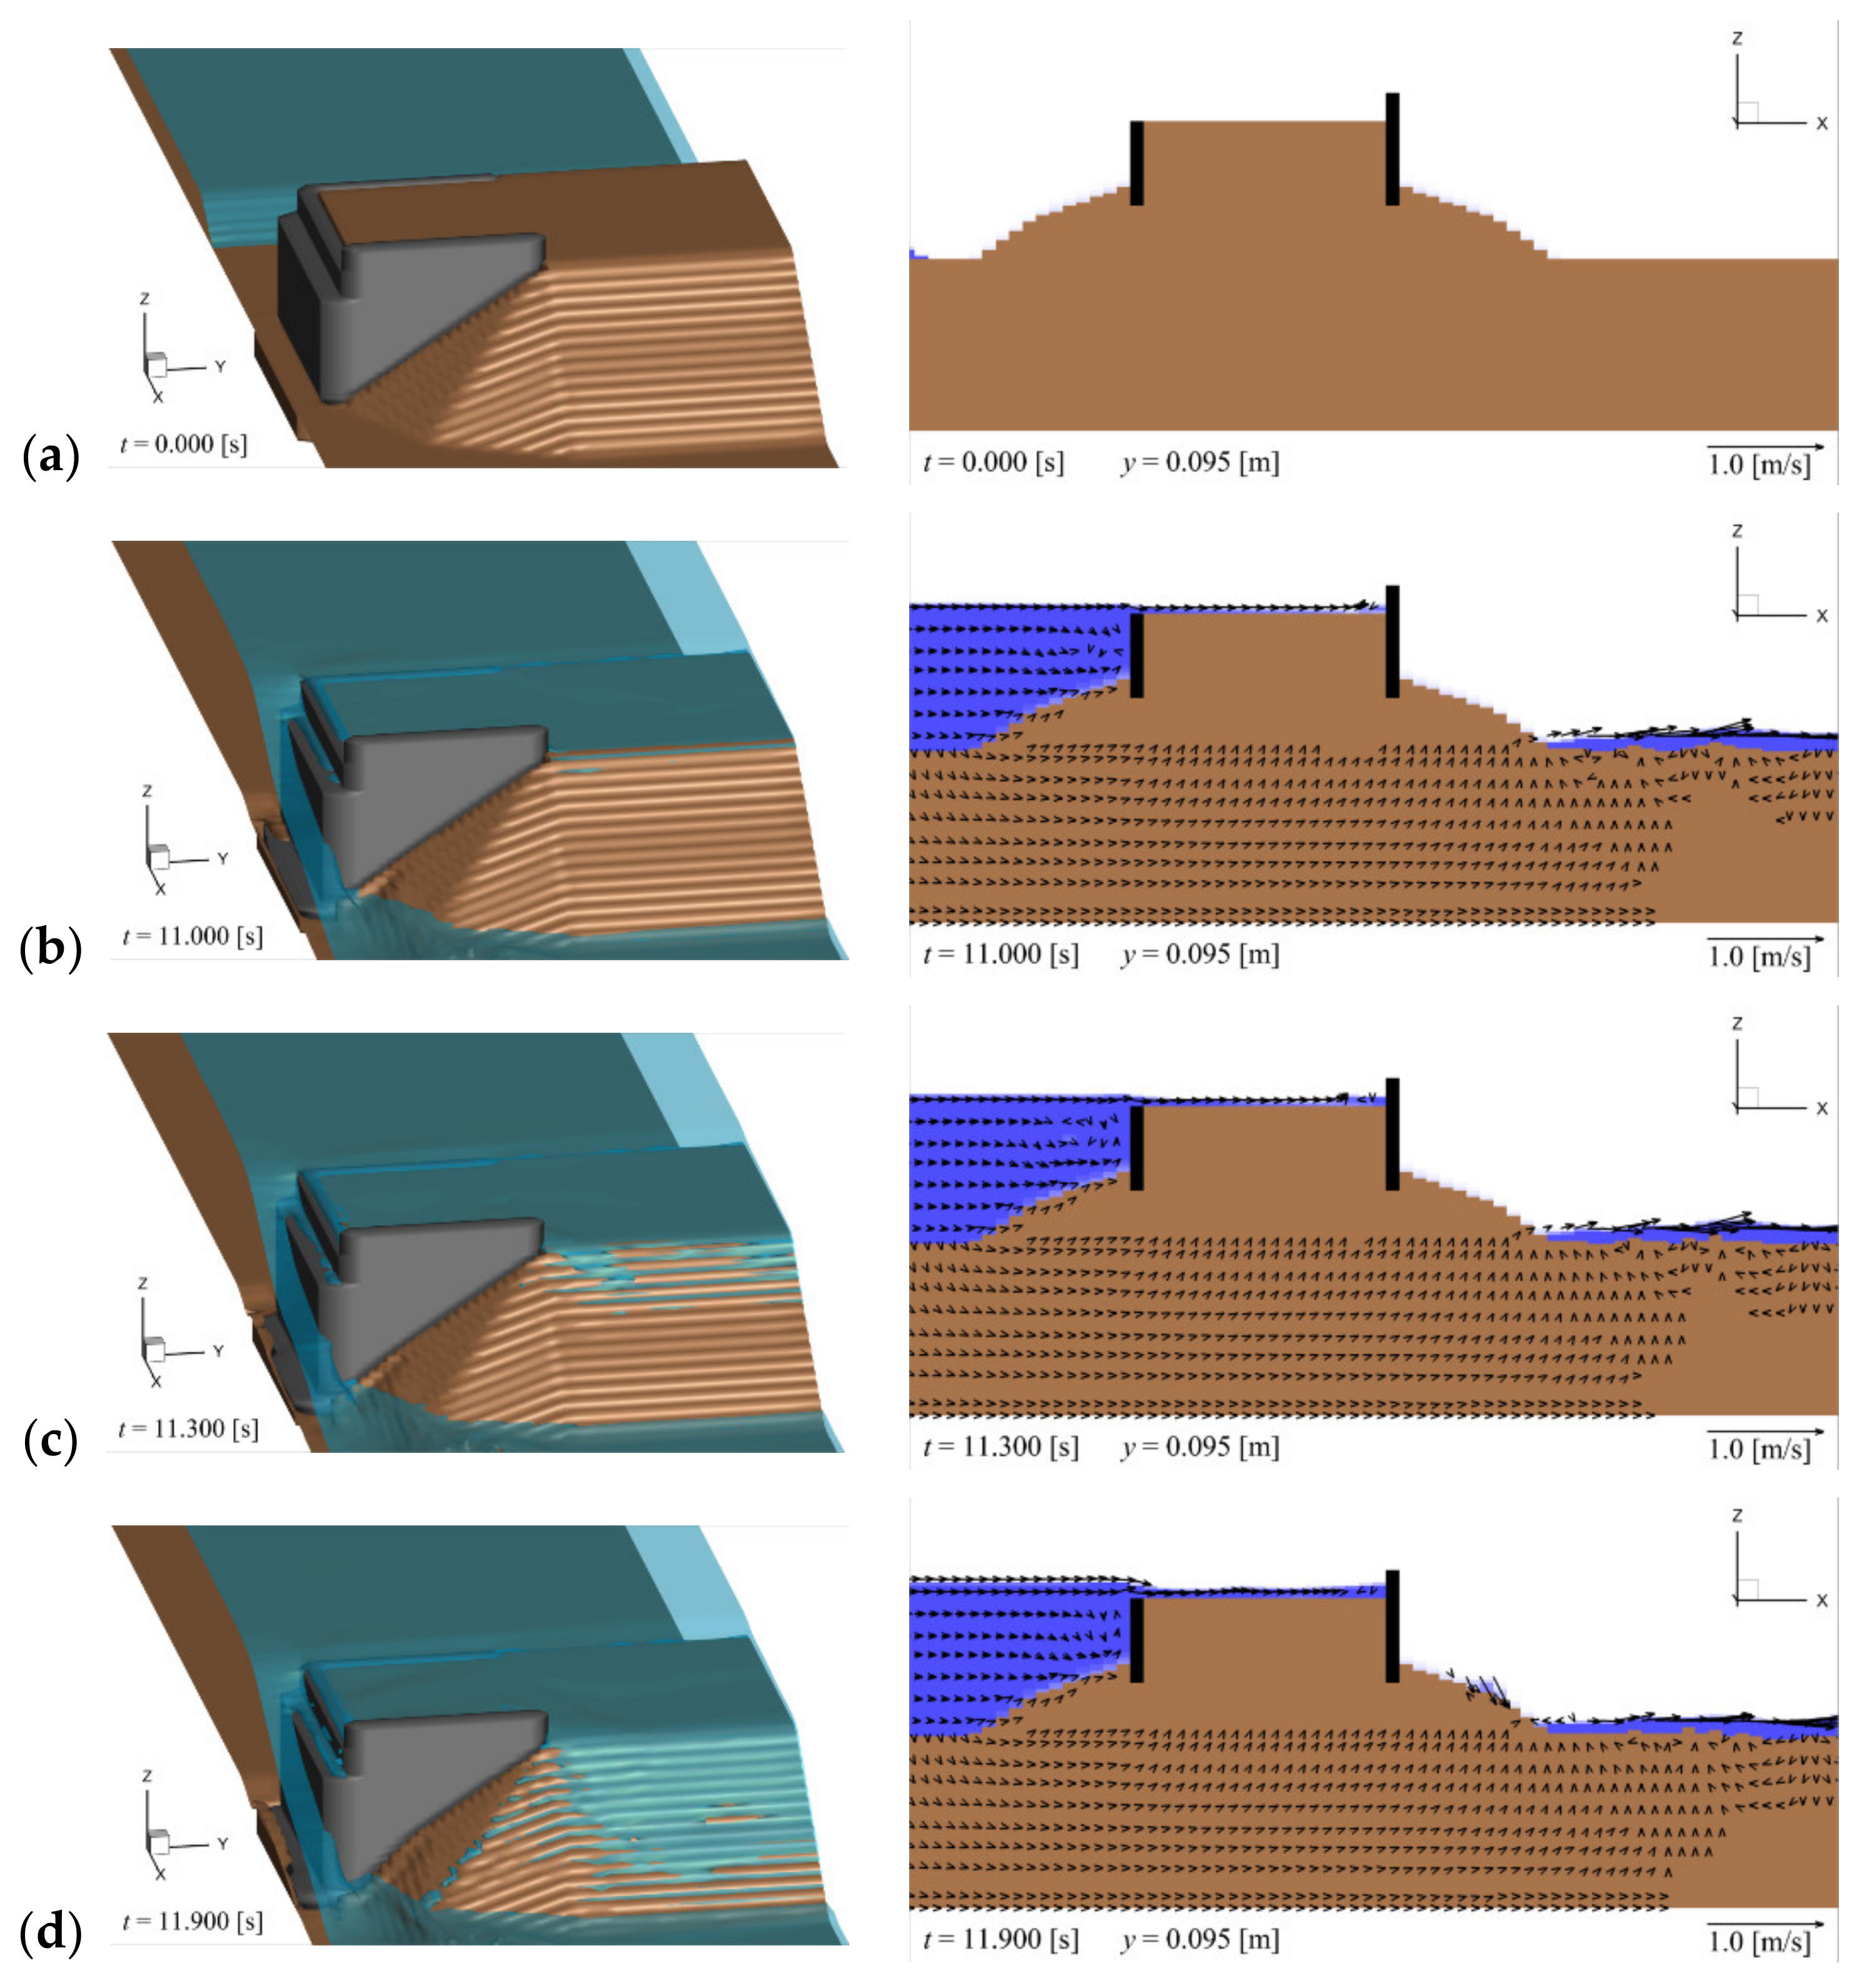
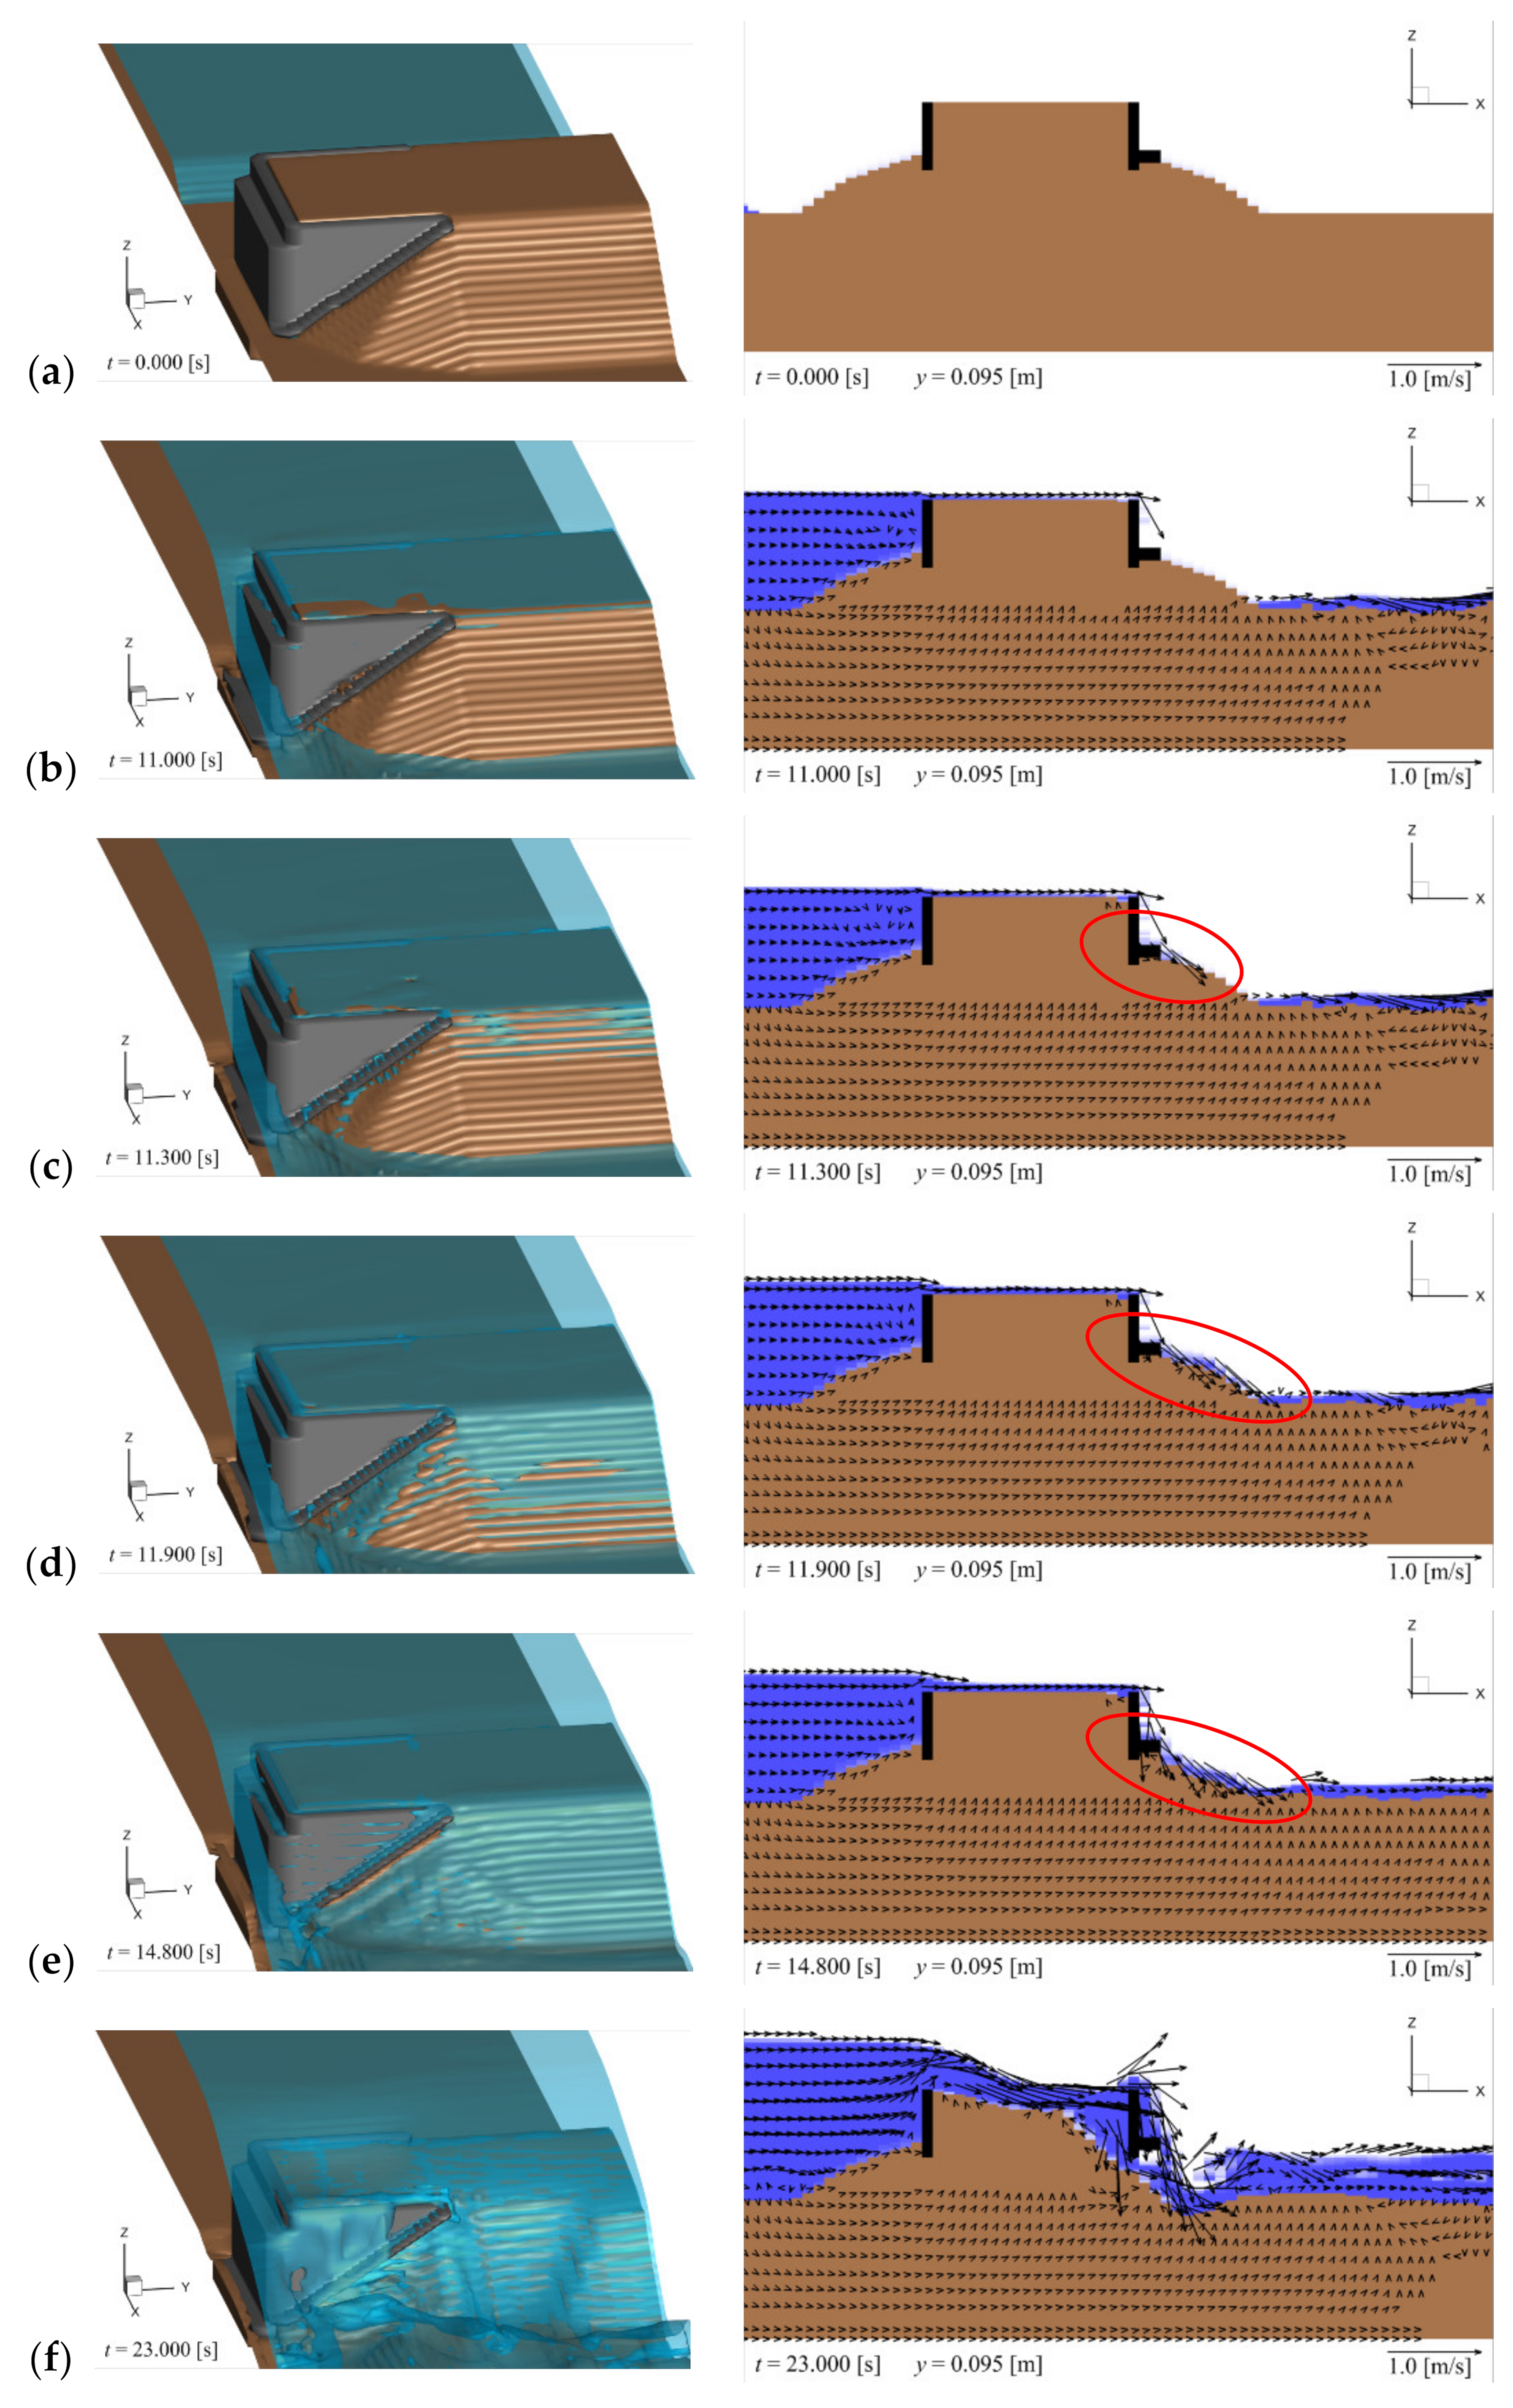
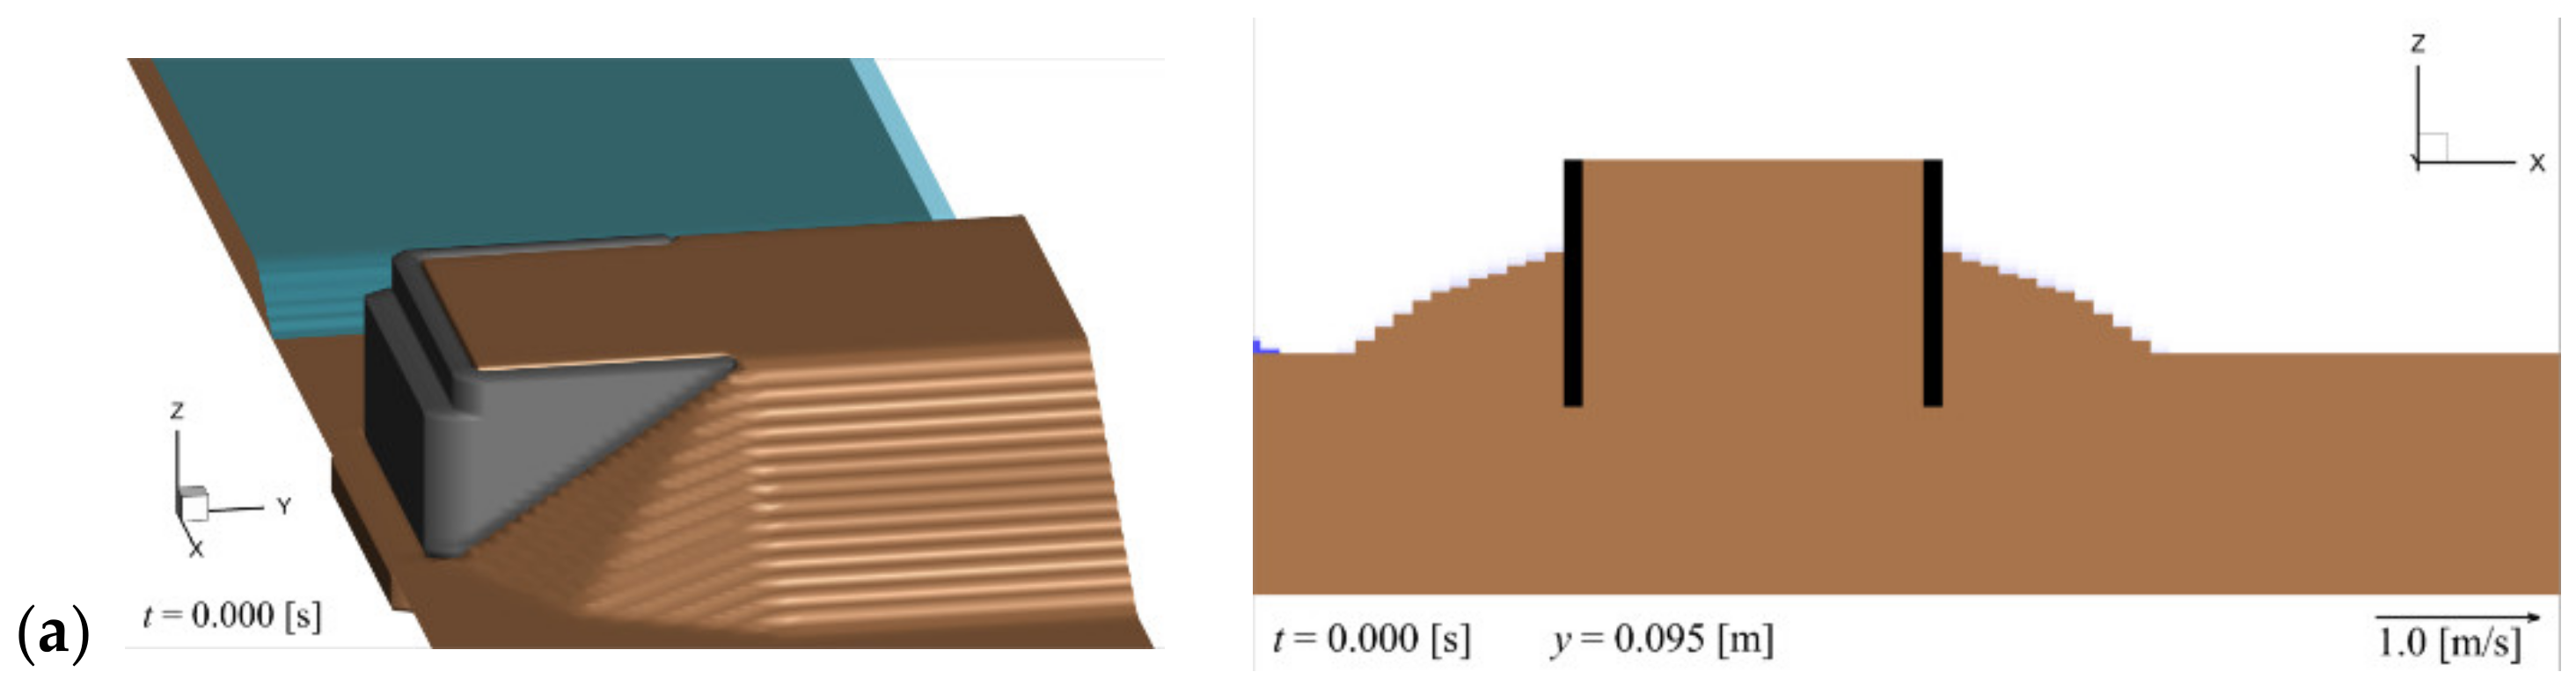
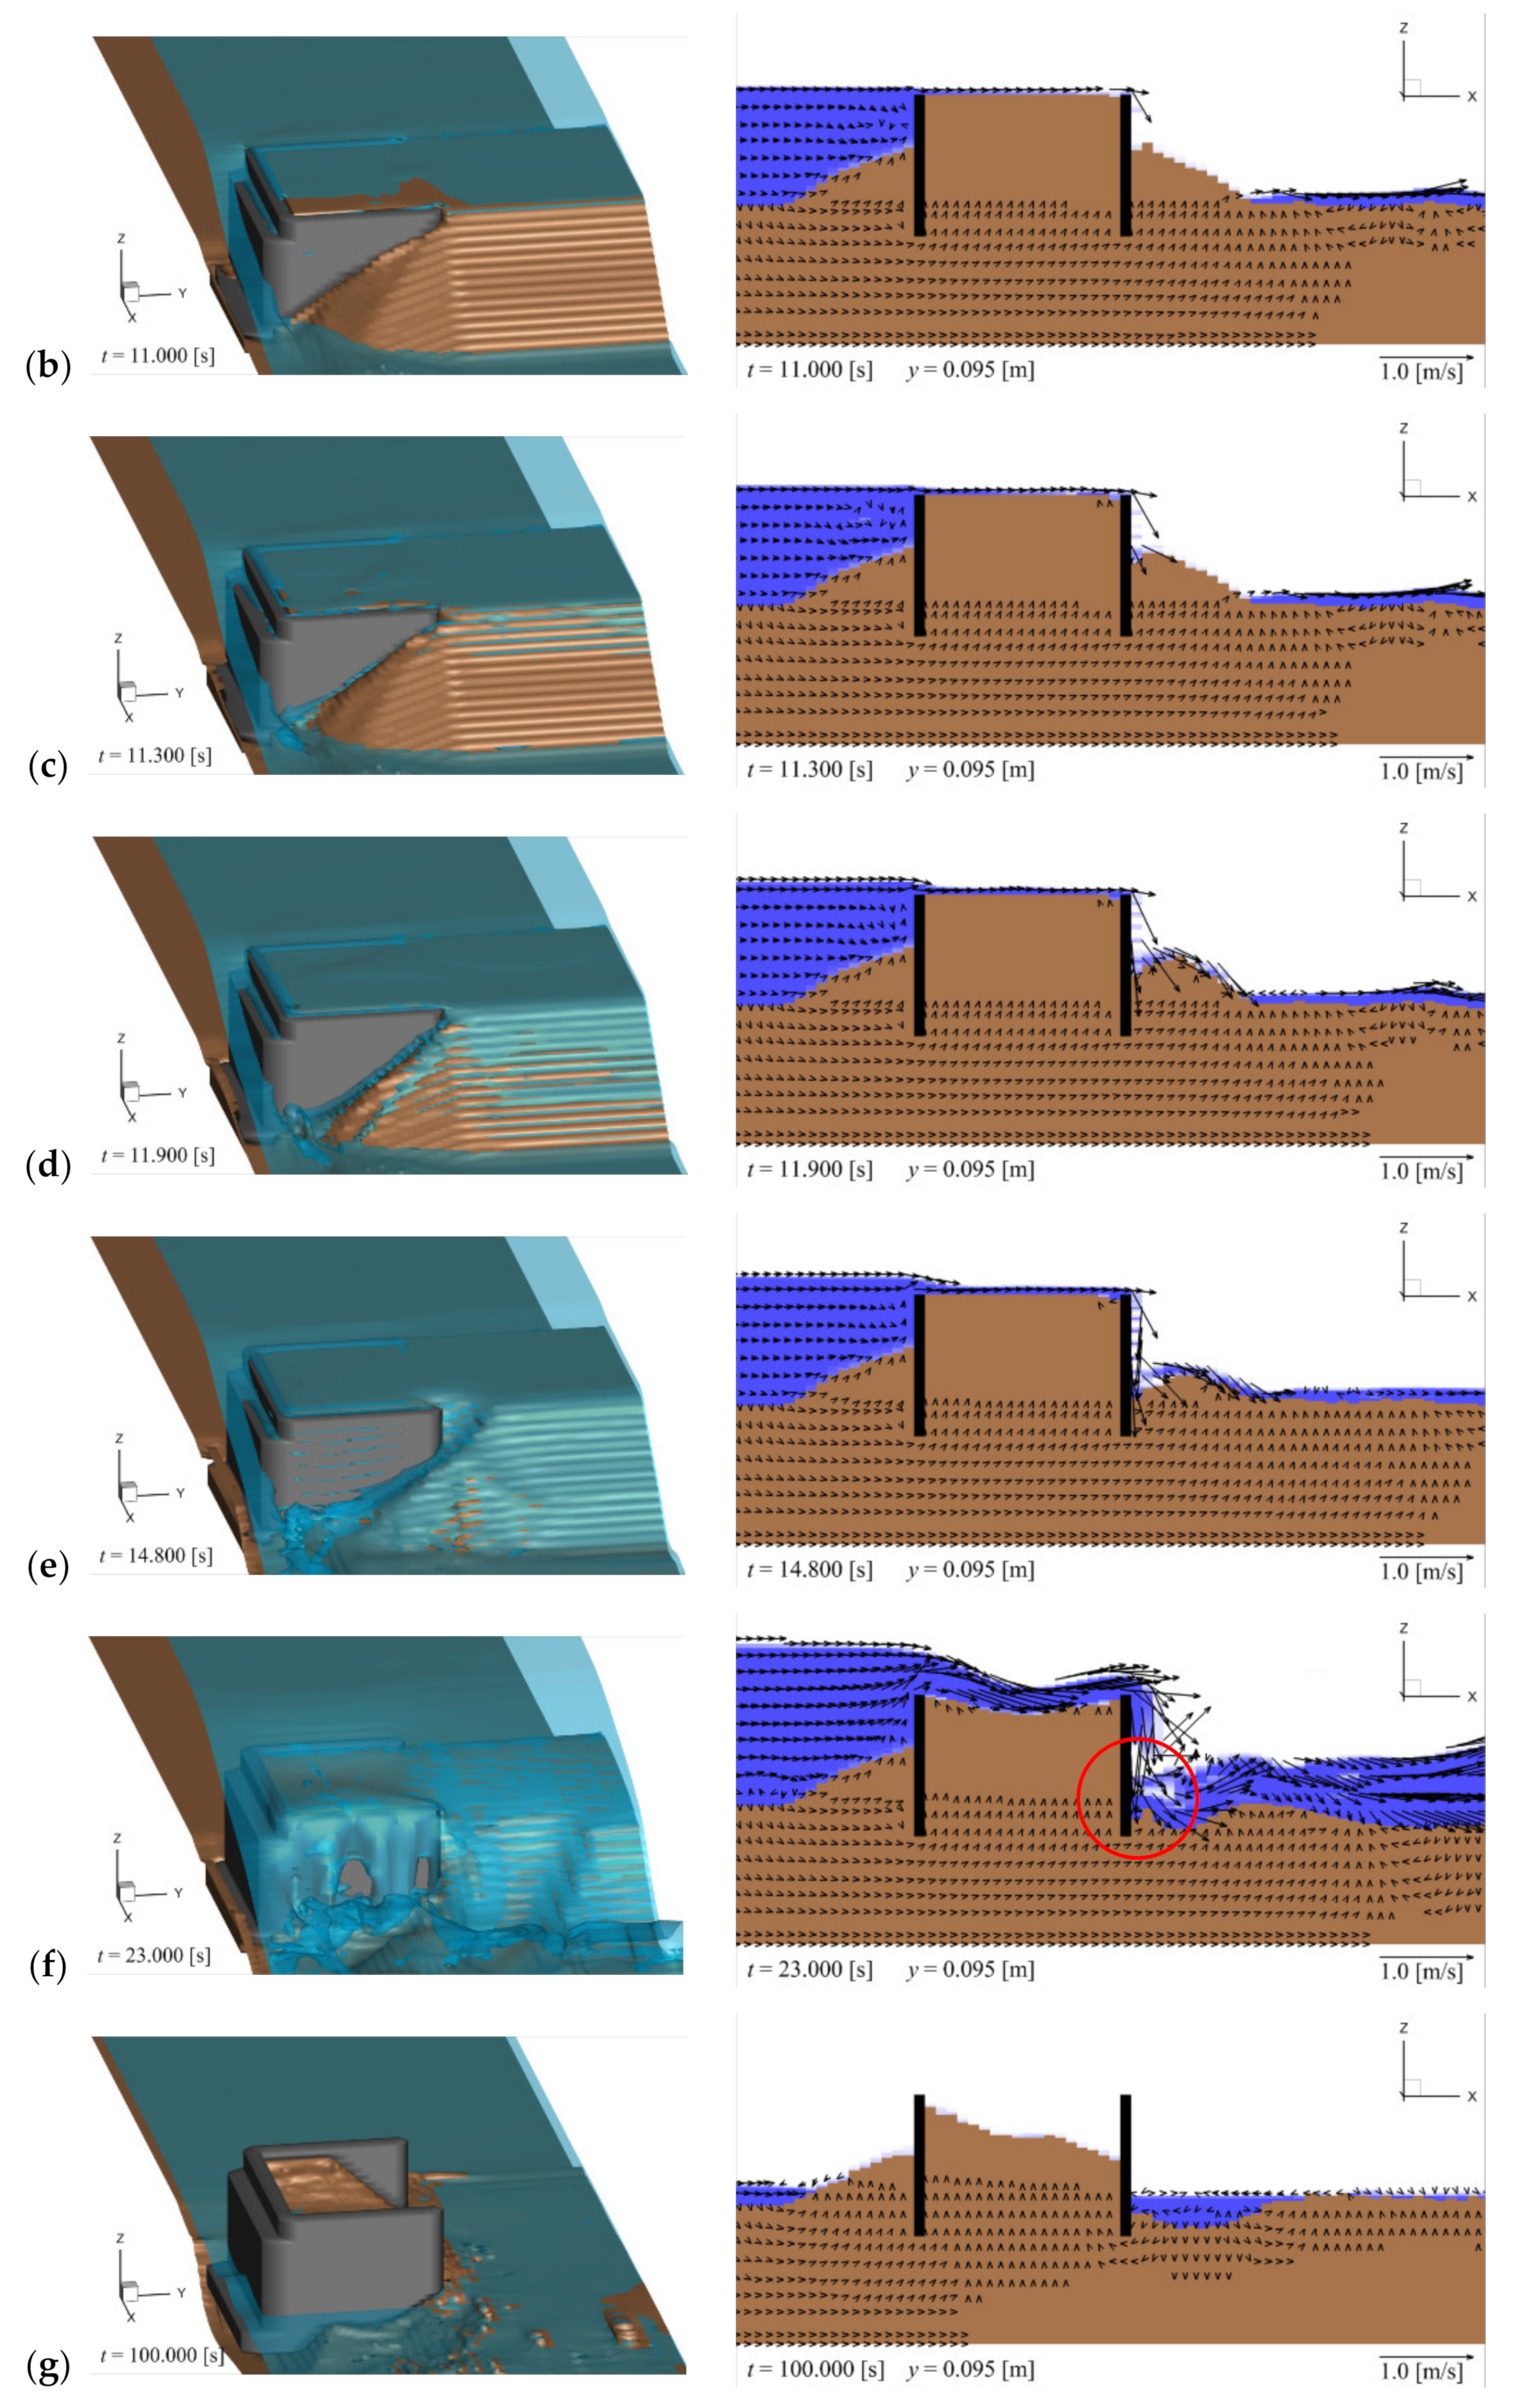
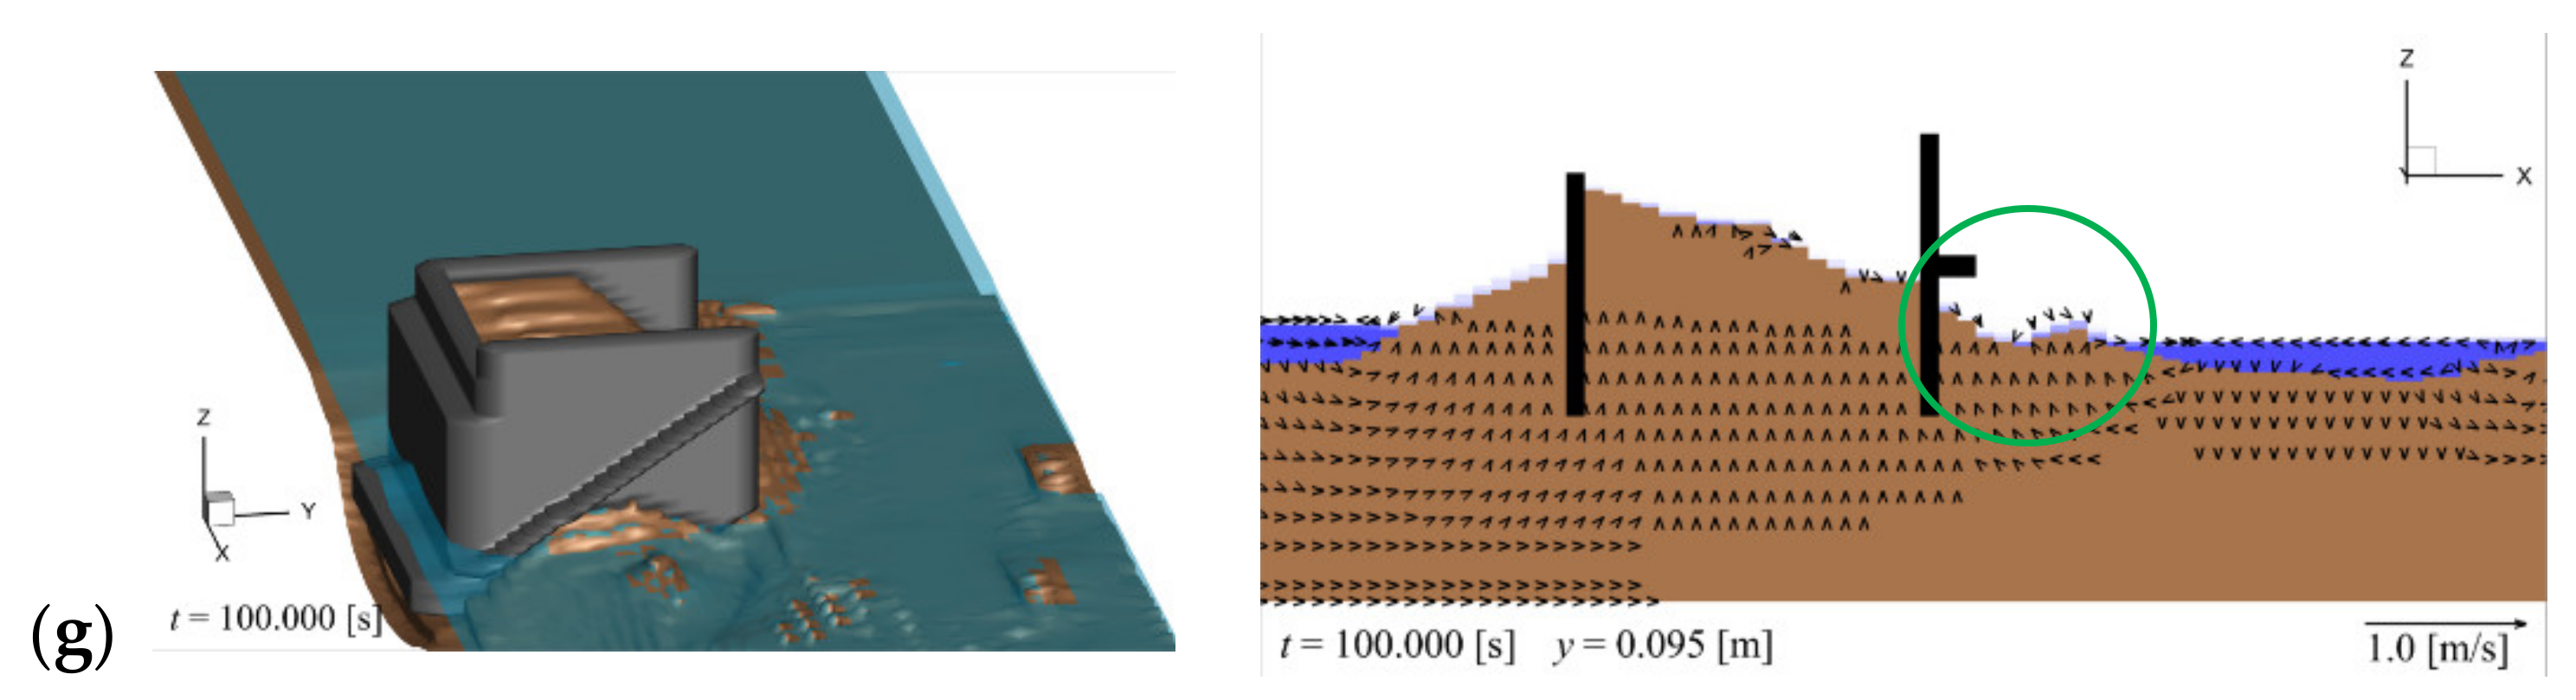
Figure 4 illustrates the backfill erosion and sand bed around the abutment. The left panel is a 3D view, where the abutment is shown in gray, the surface of the backfill and sand bed in brown, and the water surface in blue. The right panel is a cross-sectional view at y = 0.095 m, which corresponds to the cross-section around the joint of the abutment wings, as shown in the left panel of Figure 4a. The cross section of the wings is shown in black, the backfill and sand bed in brown, and the water in blue. The vectors represent the x- and z-components of the flow velocity. Figure 5 displays the values related to the sediment transport in the same case and at the same time as in Figure 4. The variables qxy, qz, τ*, and τ*c are listed in Table 2. When the value of qz is positive, it indicates that the amount of sediment pickup qp is larger than that of the sediment settlement qs. The contour lines in Figure 5 illustrate the backfill and sand bed elevation, the purple lines show the tops of the wings of the abutment, and the purple-filled boxes depict the top of the other part of the abutment.
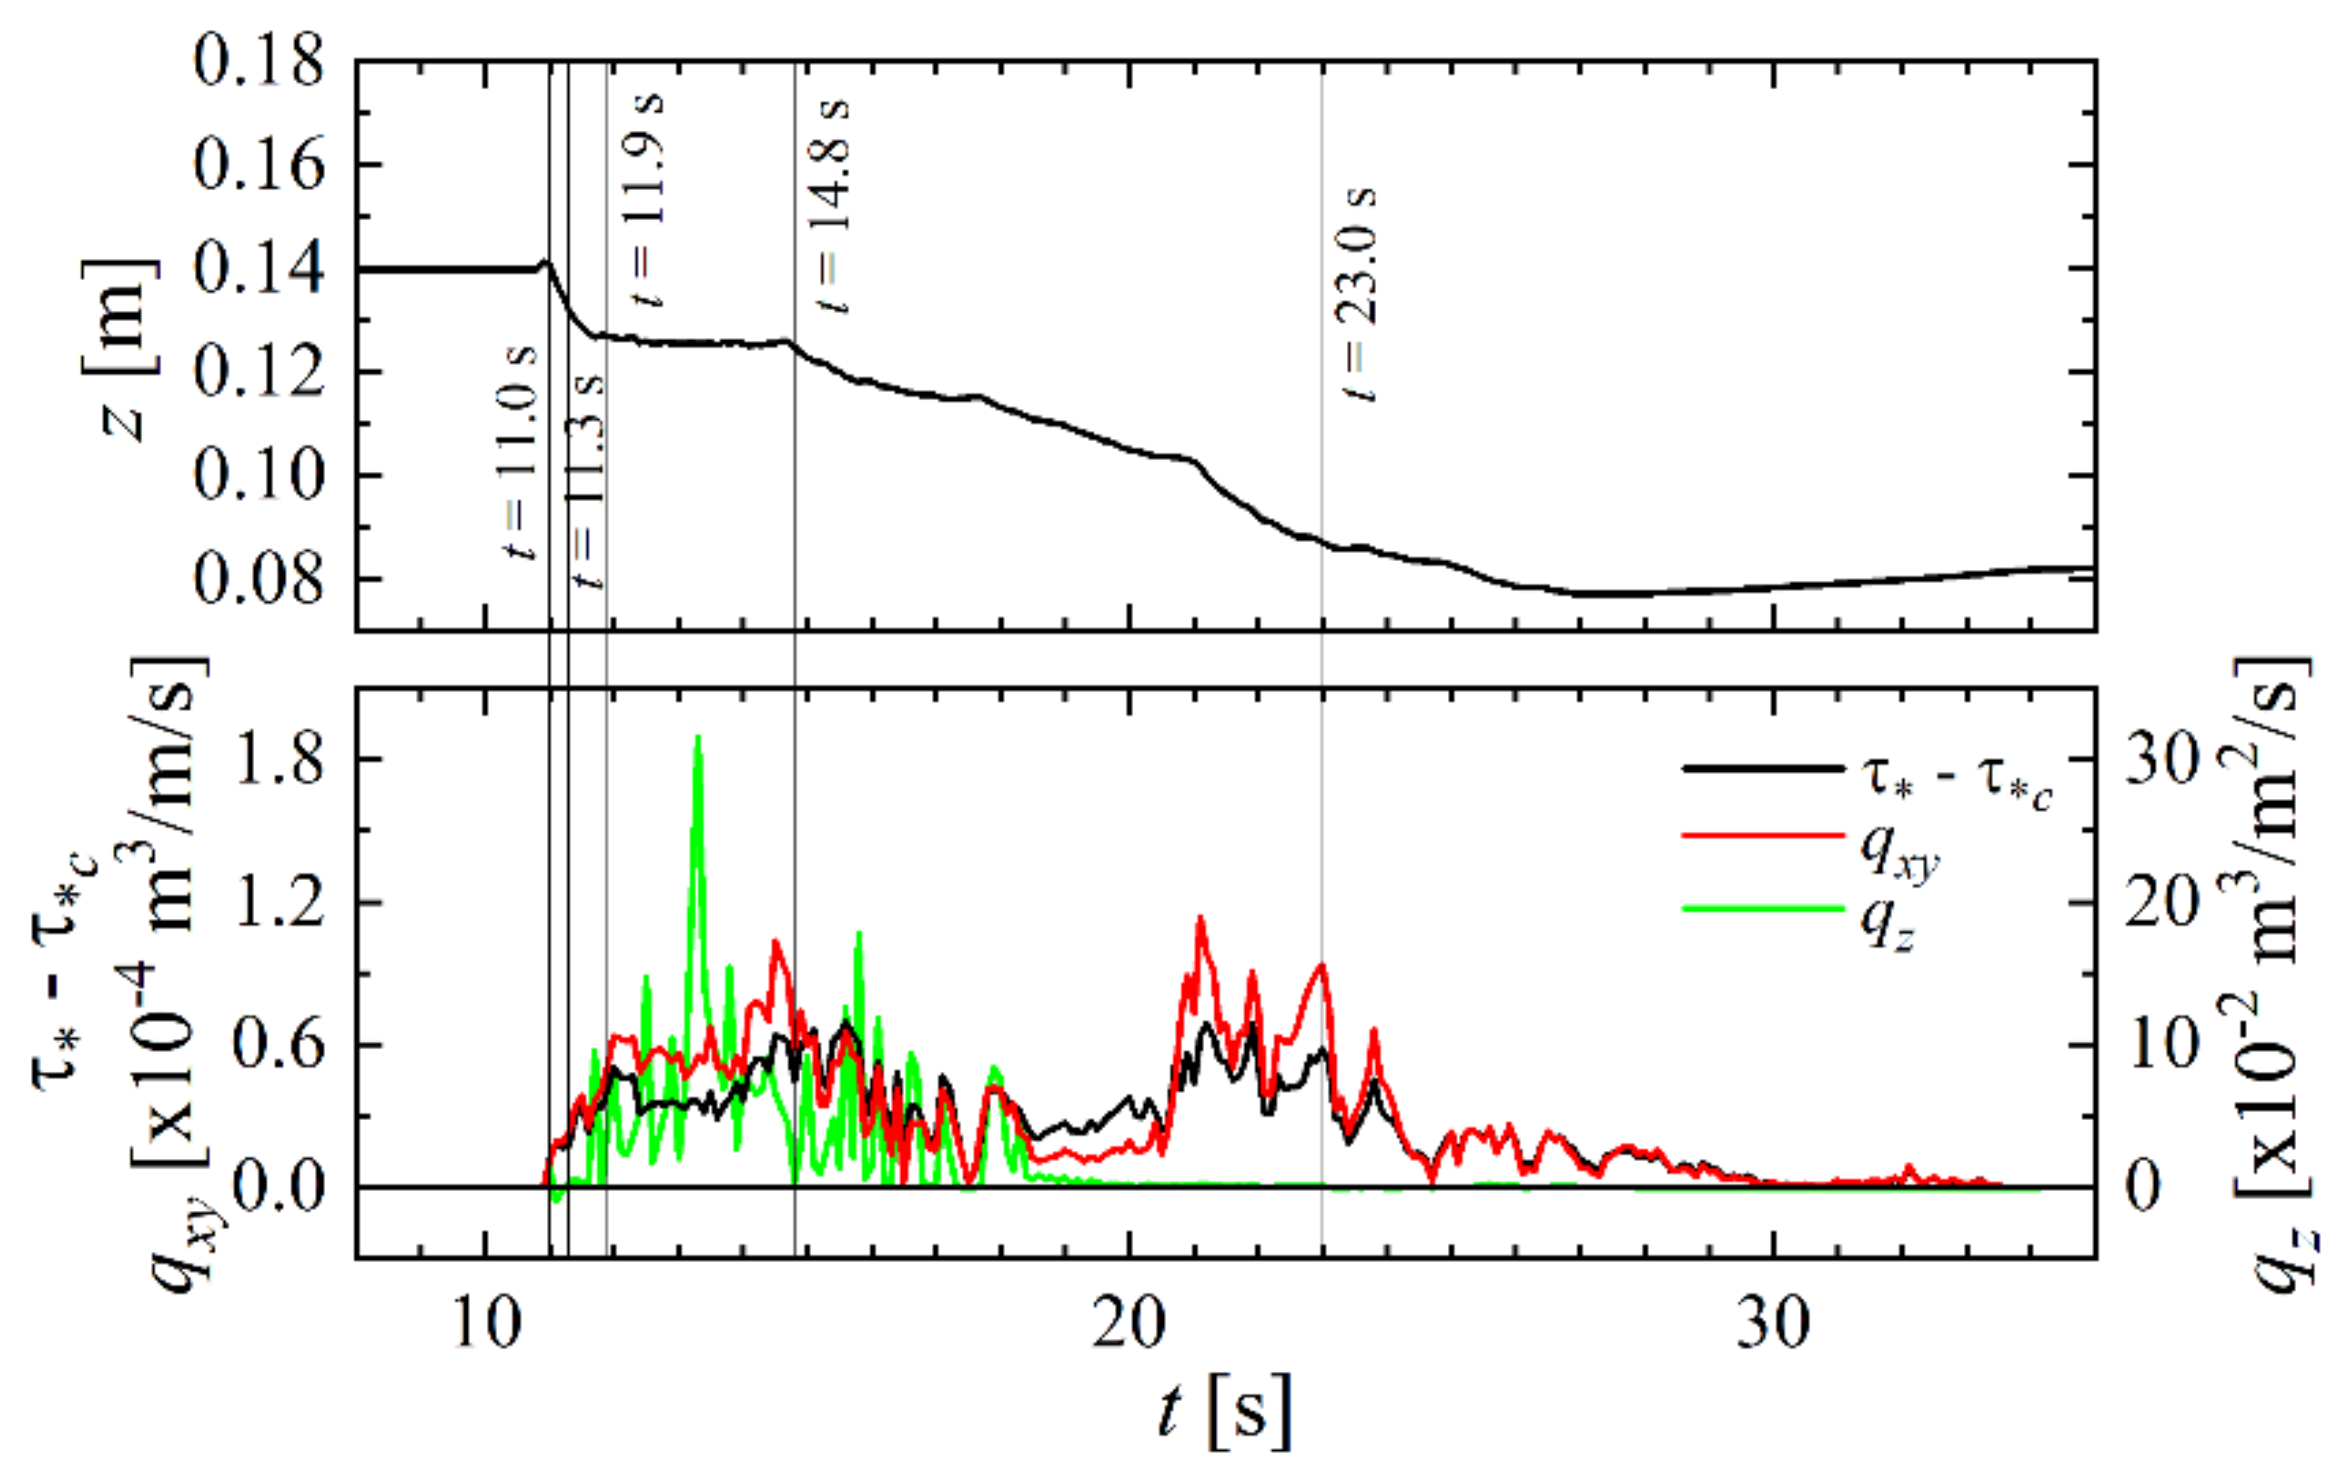
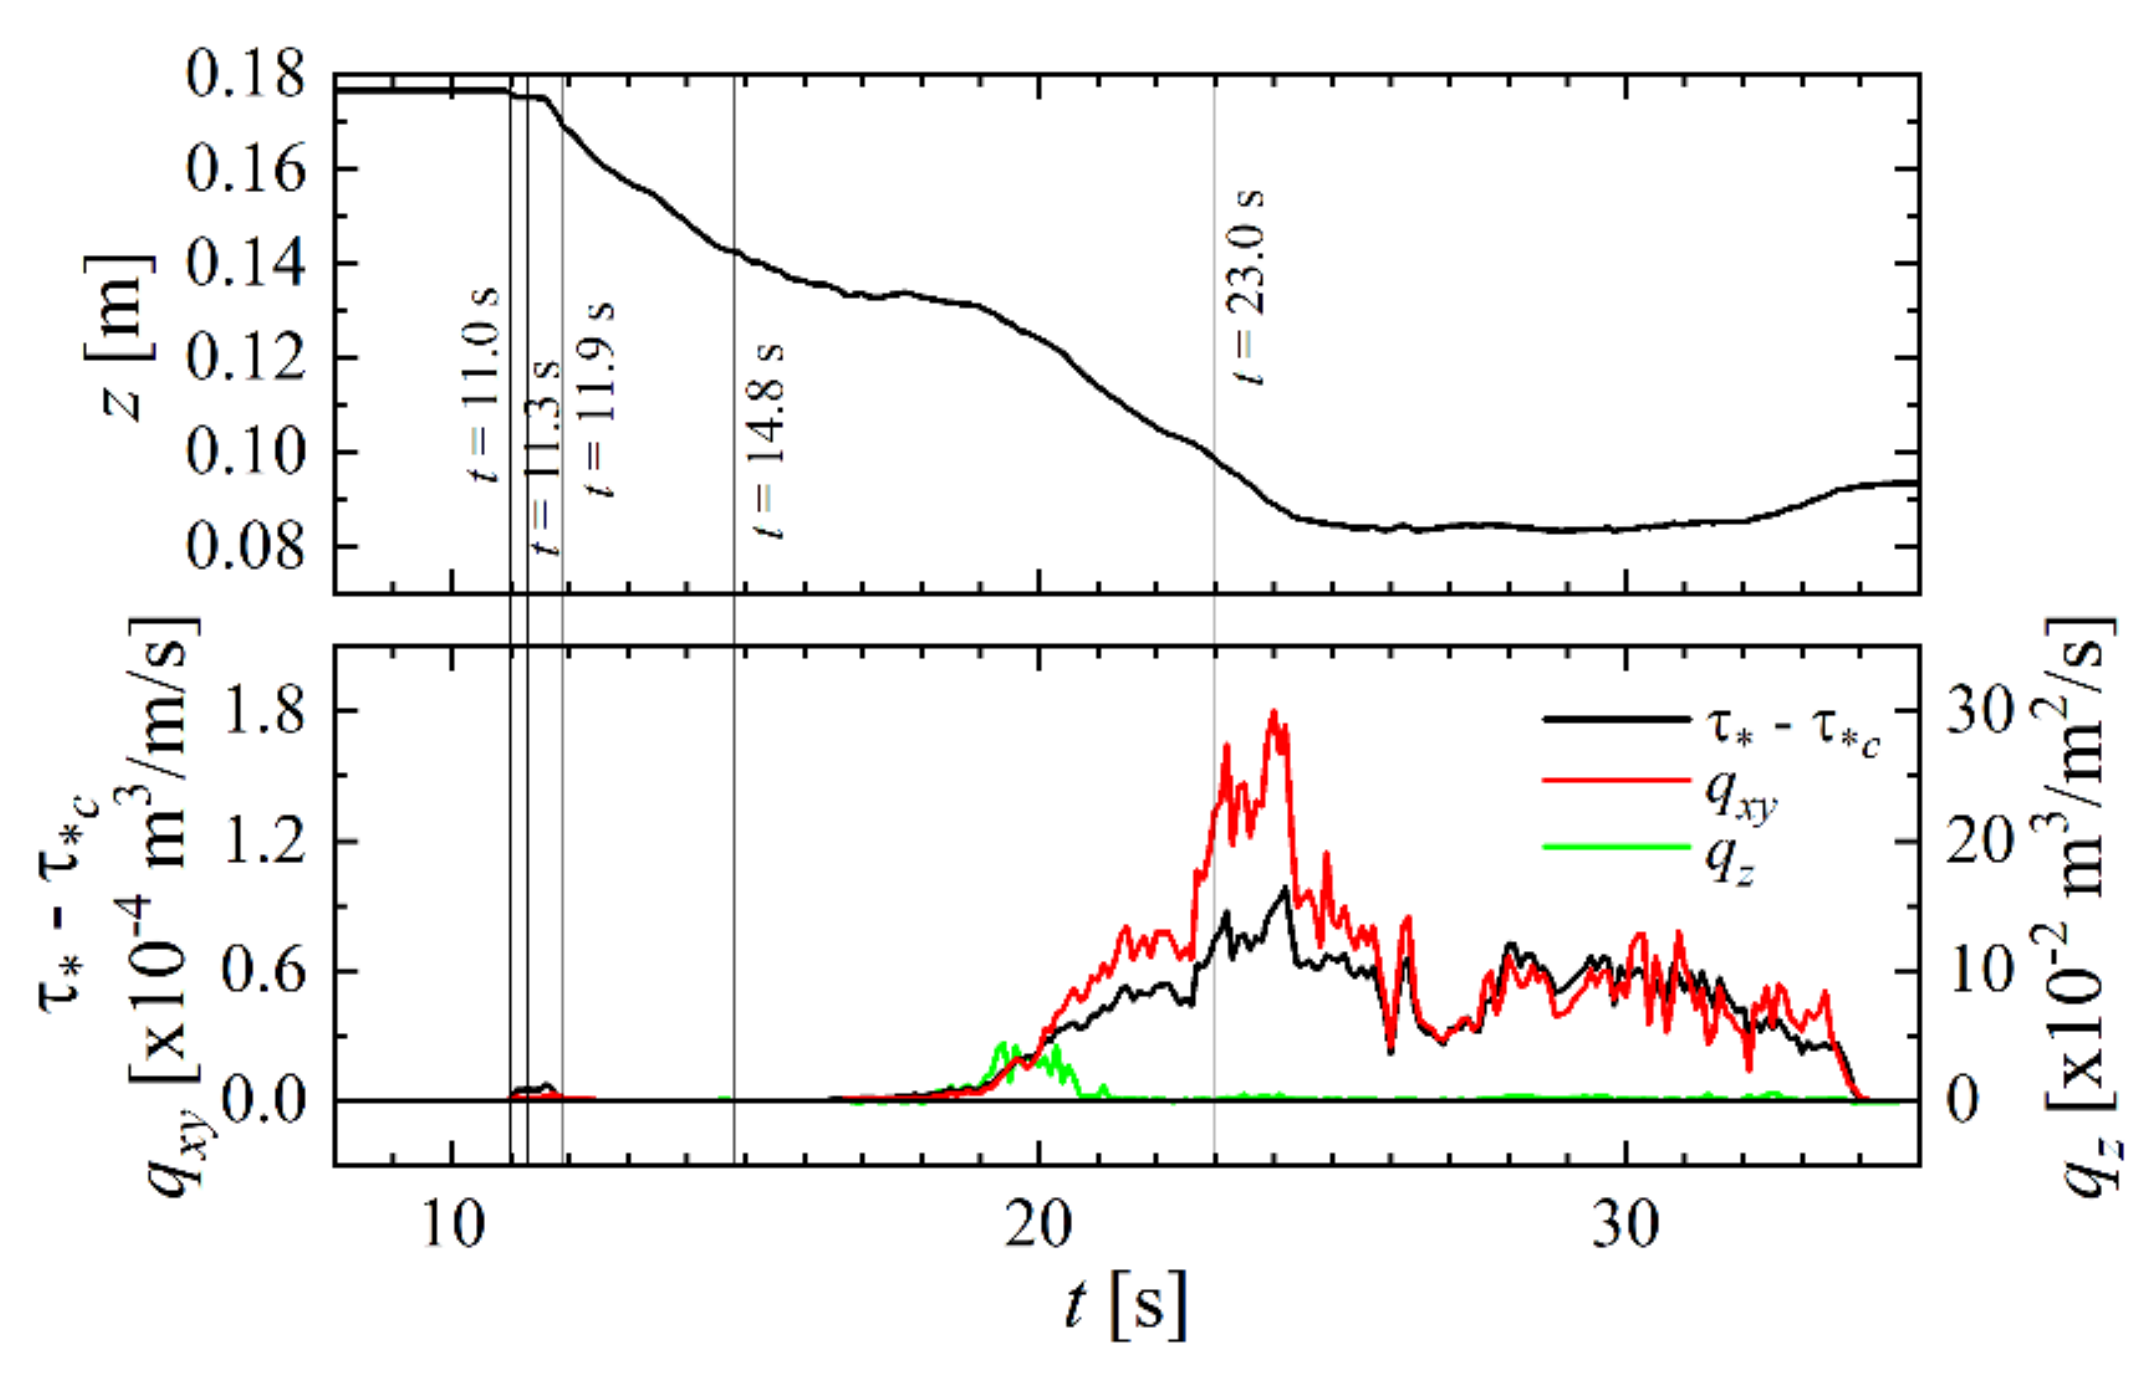
Figure 4b and Figure 5a illustrate the time t = 11.0 s immediately after the tsunami flowing over the abutment drops down along the downstream wing and reaches the surface of the ogive section of the backfill. The comparison of this scenario with the initial condition shown in Figure 4a reveals that erosion begins to occur on the downstream side of the joint of the downstream wing (red circle in Figure 4b). As illustrated in the right panel of Figure 5a, the value of τ* − τ*c slightly increases around the downstream side of the joint of the downstream wing (red circle in the right panel), owing to the downflow along the downstream wing. This causes the onset of bedload sediment transport qxy toward the lower right and an increase in the suspended sediment qz at the location of the subtle increase in τ* − τ*c (red circle in the left panel). Figure 6 illustrates the time series of the backfill elevation z, τ* − τ*c, qxy, and qz on the downstream side of the joint of the downstream wing (x = 0.158 m, y = 0.095 m). In the bottom panel of the figure, the values of τ* − τ*c (black line) and qxy (red line) begin to increase at approximately t = 11.0 s. In contrast, although the value of qz (green line) increases temporarily at approximately t = 11.0 s, no significant change is observed until shortly after t = 11.3 s. This causes the z value to decrease (black line in the top panel of Figure 6) and erosion to occur.
Figure 4c and Figure 5b depict the scenario at time t = 11.3 s where erosion on the downstream side of the abutment deepens and reaches the lower end of the downstream wing (see Figure 2d). As shown in Figure 5b, the increase in τ* − τ*c on the downstream side of the abutment (red circle in the right panel) is larger, and the area with the large τ* − τ*c is wider than that at t = 11.0 s. Simultaneously, the value of qxy becomes large (red circle in the left panel). The bottom panel of Figure 6 shows that the values of τ* − τ*c (black line) and qxy (red line) remain in the increasing state at t = 11.3 s. Immediately after, a sharp increase in qz (green line) occurs, indicating the onset of sediment pickup. Consequently, in the top panel of Figure 6, the backfill elevation z continues to decrease until shortly past t = 11.3 s. Subsequently, the backfill inside the abutment starts to flow out from below the downstream wing, and the backfill elevation starts to decrease at the upstream side of the downstream wing. Figure 7 illustrates the time series of the backfill elevation z, τ* − τ*c, qxy, and qz at the upstream side of the joint of the downstream wing (x = 0.135 m, y = 0.095 m). As shown in the figure, although the values of τ* − τ*c, qxy, and qz do not significantly change, the backfill elevation z begins to decrease shortly after t = 11.3 s because the backfill flows out from below the downstream wing, as mentioned above.
Figure 4d and Figure 5c depict the trend at time t = 11.9 s, where the backfill subsidence inside the abutment becomes distinct (red circle in the right panel of Figure 4d). In Figure 5c, the distributions of τ* − τ*c, qxy, and qz continue to follow the same trend as those on t = 11.3 s. However, the top panel of Figure 6 shows that the decrease in the elevation of the abutment z stops temporarily until t = 14.8 s on the downstream side of the downstream wing. In contrast, as shown in the top panel of Figure 7, the backfill elevation z continues to decrease on the upstream side of the downstream wing. This implies that the sediment is supplied from the upstream side to the downstream side of the downstream wing; hence, the backfill elevation z does not decrease on the downstream side.
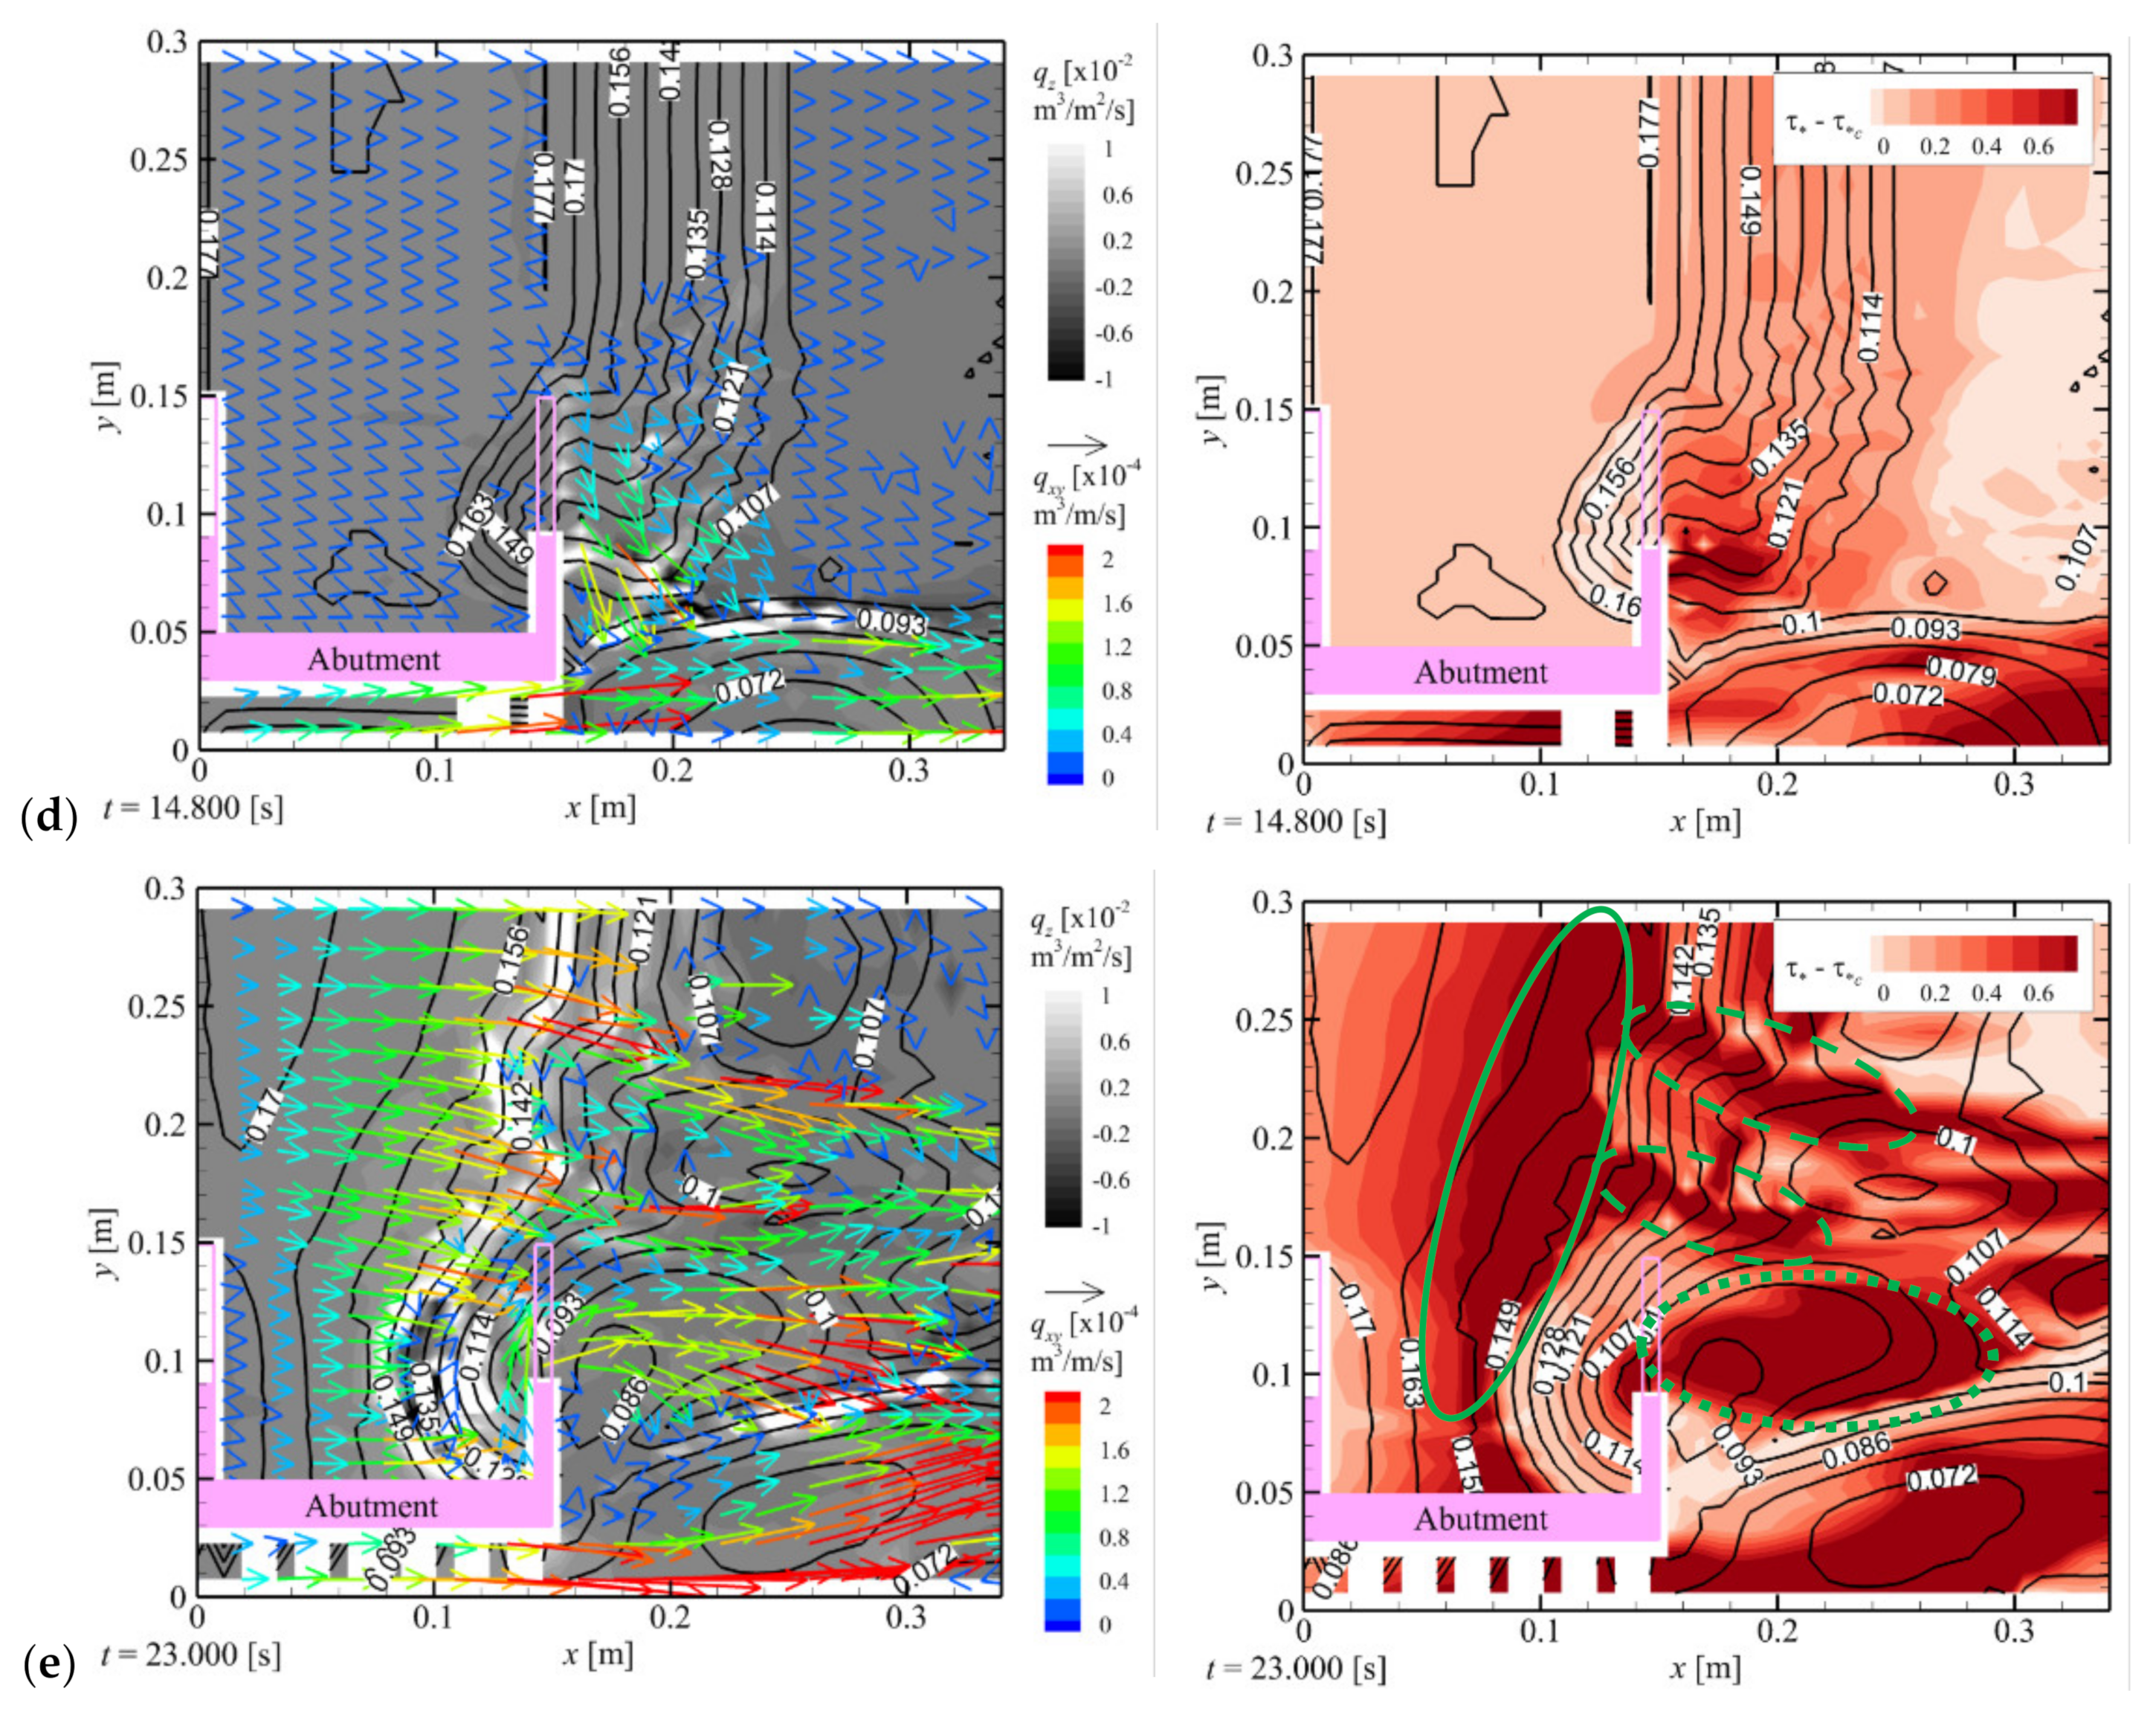
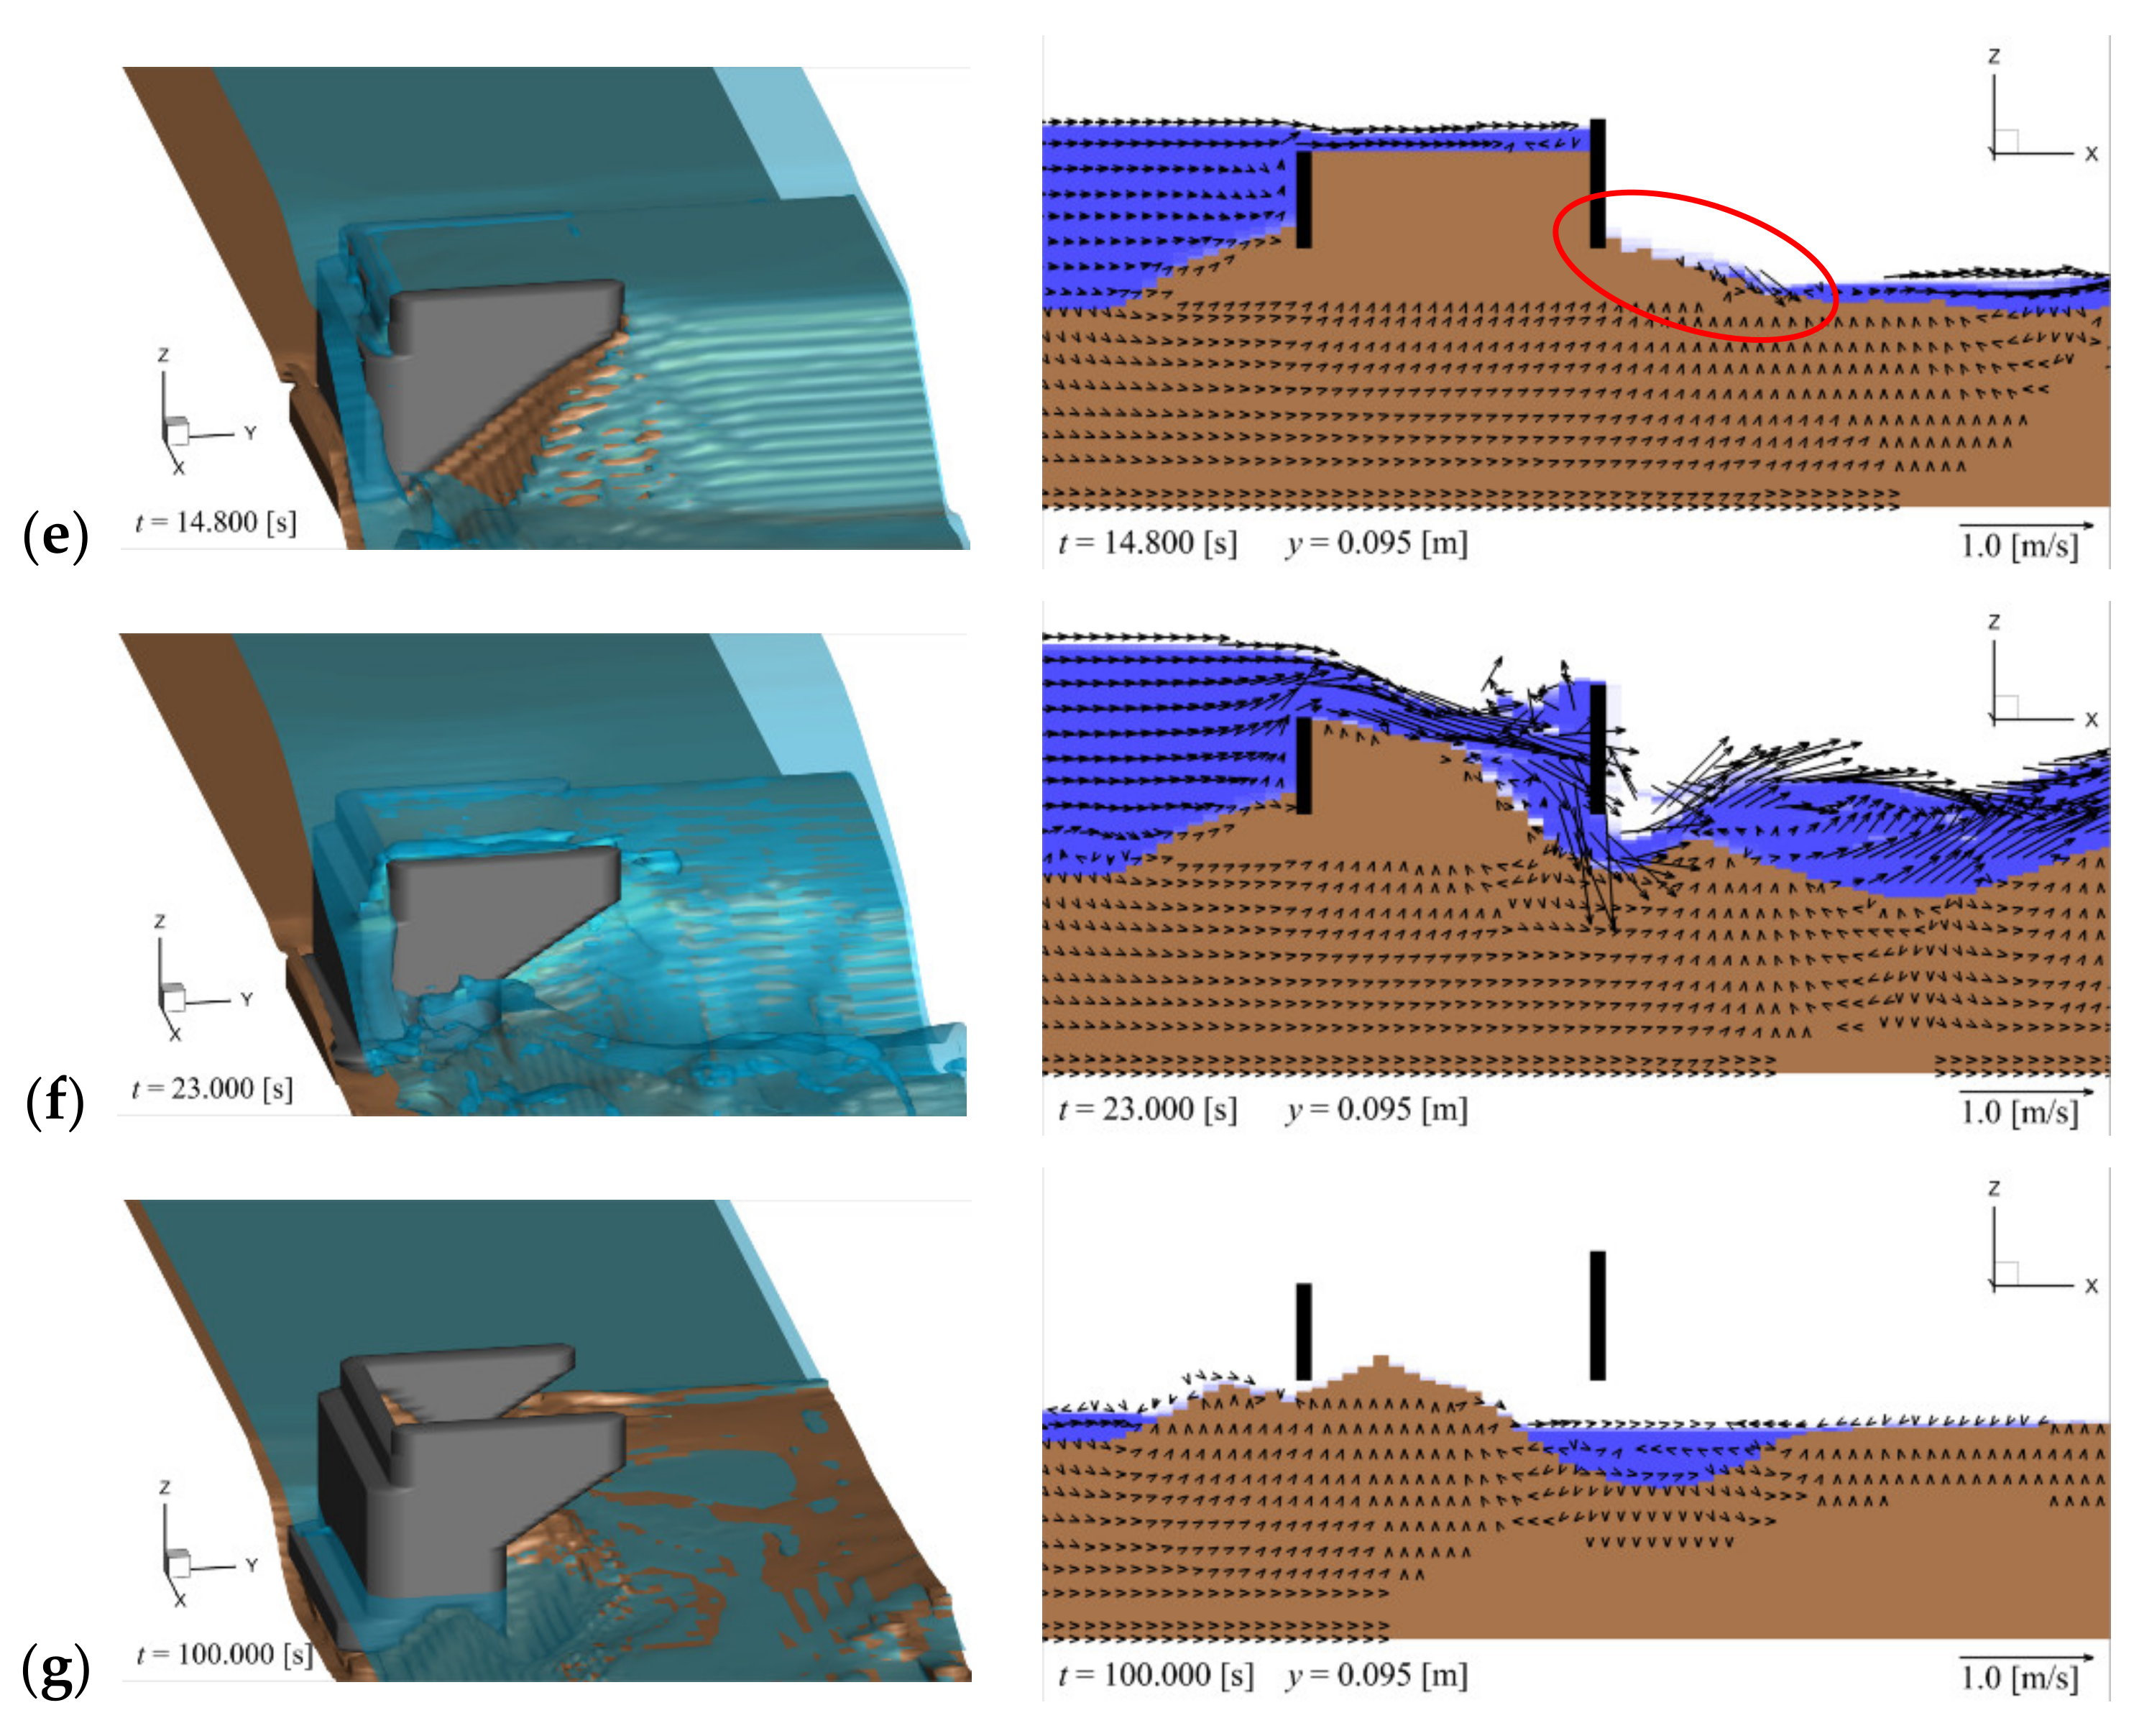
Figure 4e and Figure 5d illustrate the scenario at time t = 14.8 s, where the lower surface of the downstream wing is exposed. As shown in the right panel of Figure 4e, the backfill inside the abutment has a steep slope with an angle almost equal to the angle of repose (45.00°; see Table 1), while water accumulates between the backfill and the downstream wing (red circle). Subsequently, as depicted in Figure 7, a decrease in the backfill elevation z is gentler at the upstream side of the downstream wing. This implies a marginal decrease in the supply of sediment from the inside of the abutment. This again causes a decrease in the backfill elevation z on the downstream side of the downstream wing, as indicated in Figure 6. Interestingly, the left panel of Figure 4e and the contours of Figure 5d show that the backfill on the side away from the abutment remains mostly intact. This suggests that the presence of the abutment enhances the backfill erosion.
As observed in Figure 6, at approximately t = 20.0 s, the generation of the sediment pickup stops on the downstream side of the joint of the downstream wing because the value of qz (green line in the bottom panel) decreases to zero. Consequently, the decrease in the backfill elevation z (top panel) at this time is caused by bedload sediment transport qxy (red line in the bottom panel). In contrast, Figure 7 indicates that the value of τ* − τ*c (black line in the bottom panel) begins to increase at the upstream side of the joint of the downstream wing. This results in an increase in qxy (red line in the bottom panel) and a temporal increase in qz (green line in the bottom panel). The decrease in the backfill elevation z (top panel) becomes larger after approximately t = 20.0 s owing to the generation of bedload sediment transport and sediment pickup.
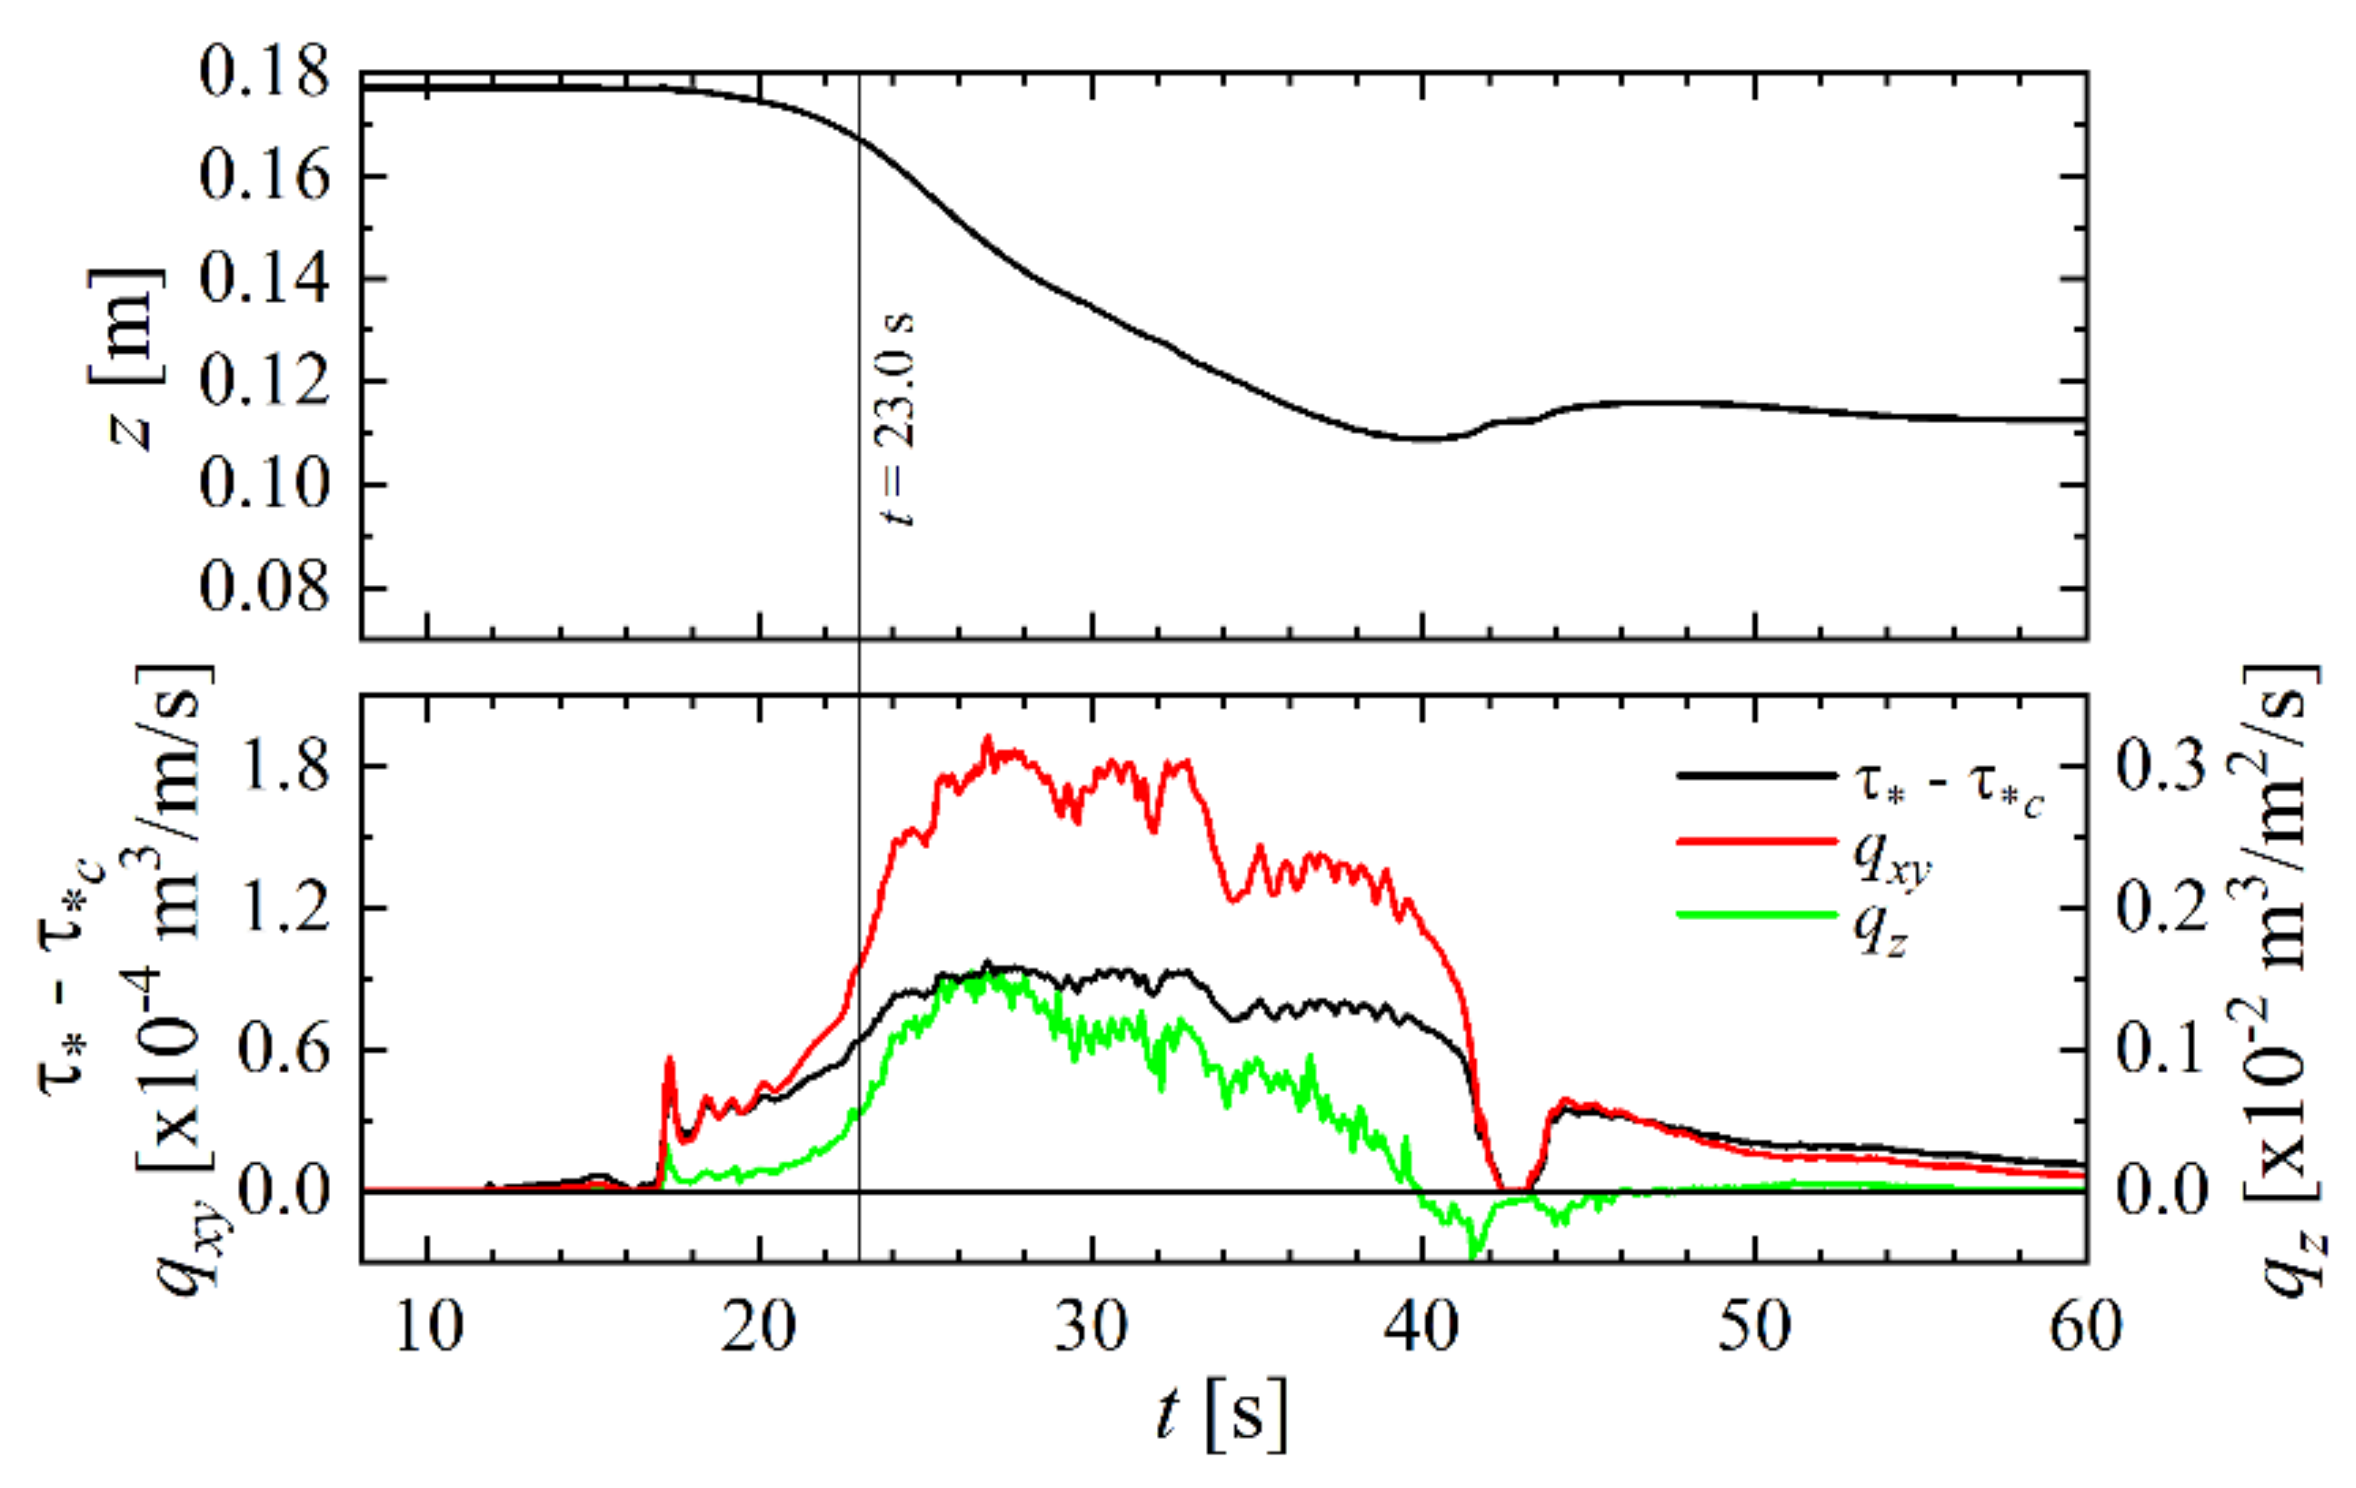
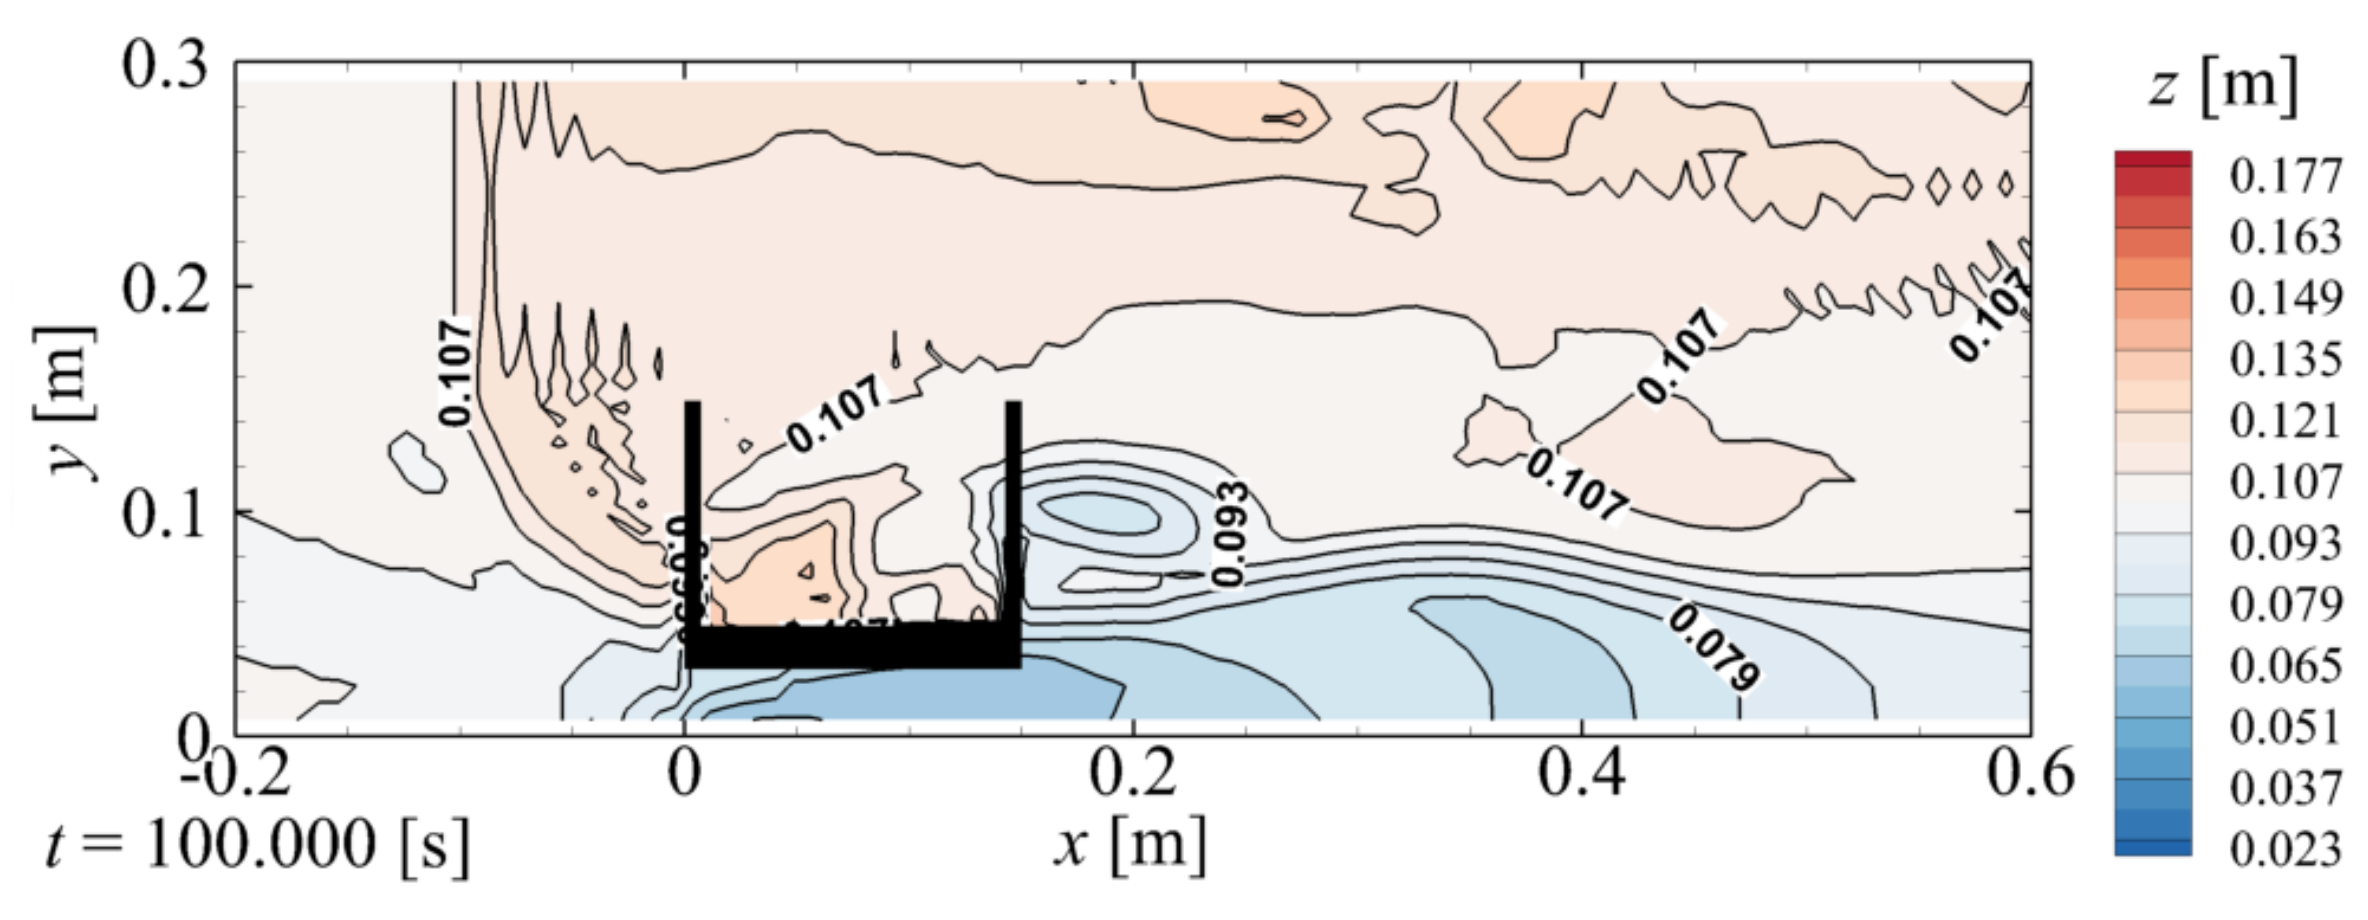
Figure 4f and Figure 5e illustrate the scenario at time t = 23.0 s where backfill erosion evolves inside the abutment. As shown in Figure 4f, the backfill around the downstream wing is lost, and the tsunami passes under the downstream wing (red circle in the right panel). Furthermore, as indicated in Figure 5e, the backfill on the side away from the abutment begins to be eroded. At this moment, the value of τ* − τ*c becomes large primarily around the downstream end of the crown of the backfill (green circle with solid line), along the ridge of the downstream slope (green circles with broken line), and at the scouring area downstream of the downstream wing (green circle with dotted line). This phenomenon leads to an increase in qxy at these locations, as shown in the left panel of Figure 5e. In addition, the value of qz also increases around the downstream end of the backfill crown. Figure 8 shows the time series of the backfill elevation z, τ* − τ*c, qxy, and qz at the center of the backfill crown away from the abutment (x = 0.075 m, y = 0.250 m). The ranges of t and qz in this figure are different from those in Figure 6 and Figure 7. Figure 8 indicates that the values of qxy and qz (red and green lines in the bottom panel) increase even at a position away from the abutment, resulting in a decrease in the elevation of the abutment z (top panel).
4. Effectiveness of Countermeasures against Backfill Erosion
Based on the mechanism of backfill erosion clarified in Section 3, numerical experiments were conducted for the following four countermeasures:
- A 15-mm-high impermeable wall was set on the downstream wall of the abutment to prevent the tsunami from flowing down (Figure 10). This was called countermeasure #1. This is based on the confirmation from Section 3 that the backfill on the downstream side of the joint of the downstream wing began to be eroded because of the tsunami flowing down along the downstream wing.
- A foot protection was set on the surface of the backfill on the downstream side of the abutment to prevent tsunamis flowing down along the downstream wing from eroding the backfill (Figure 11). For simplicity, the protection was assumed to be impermeable and fixed to the abutment. This was called countermeasure #2.
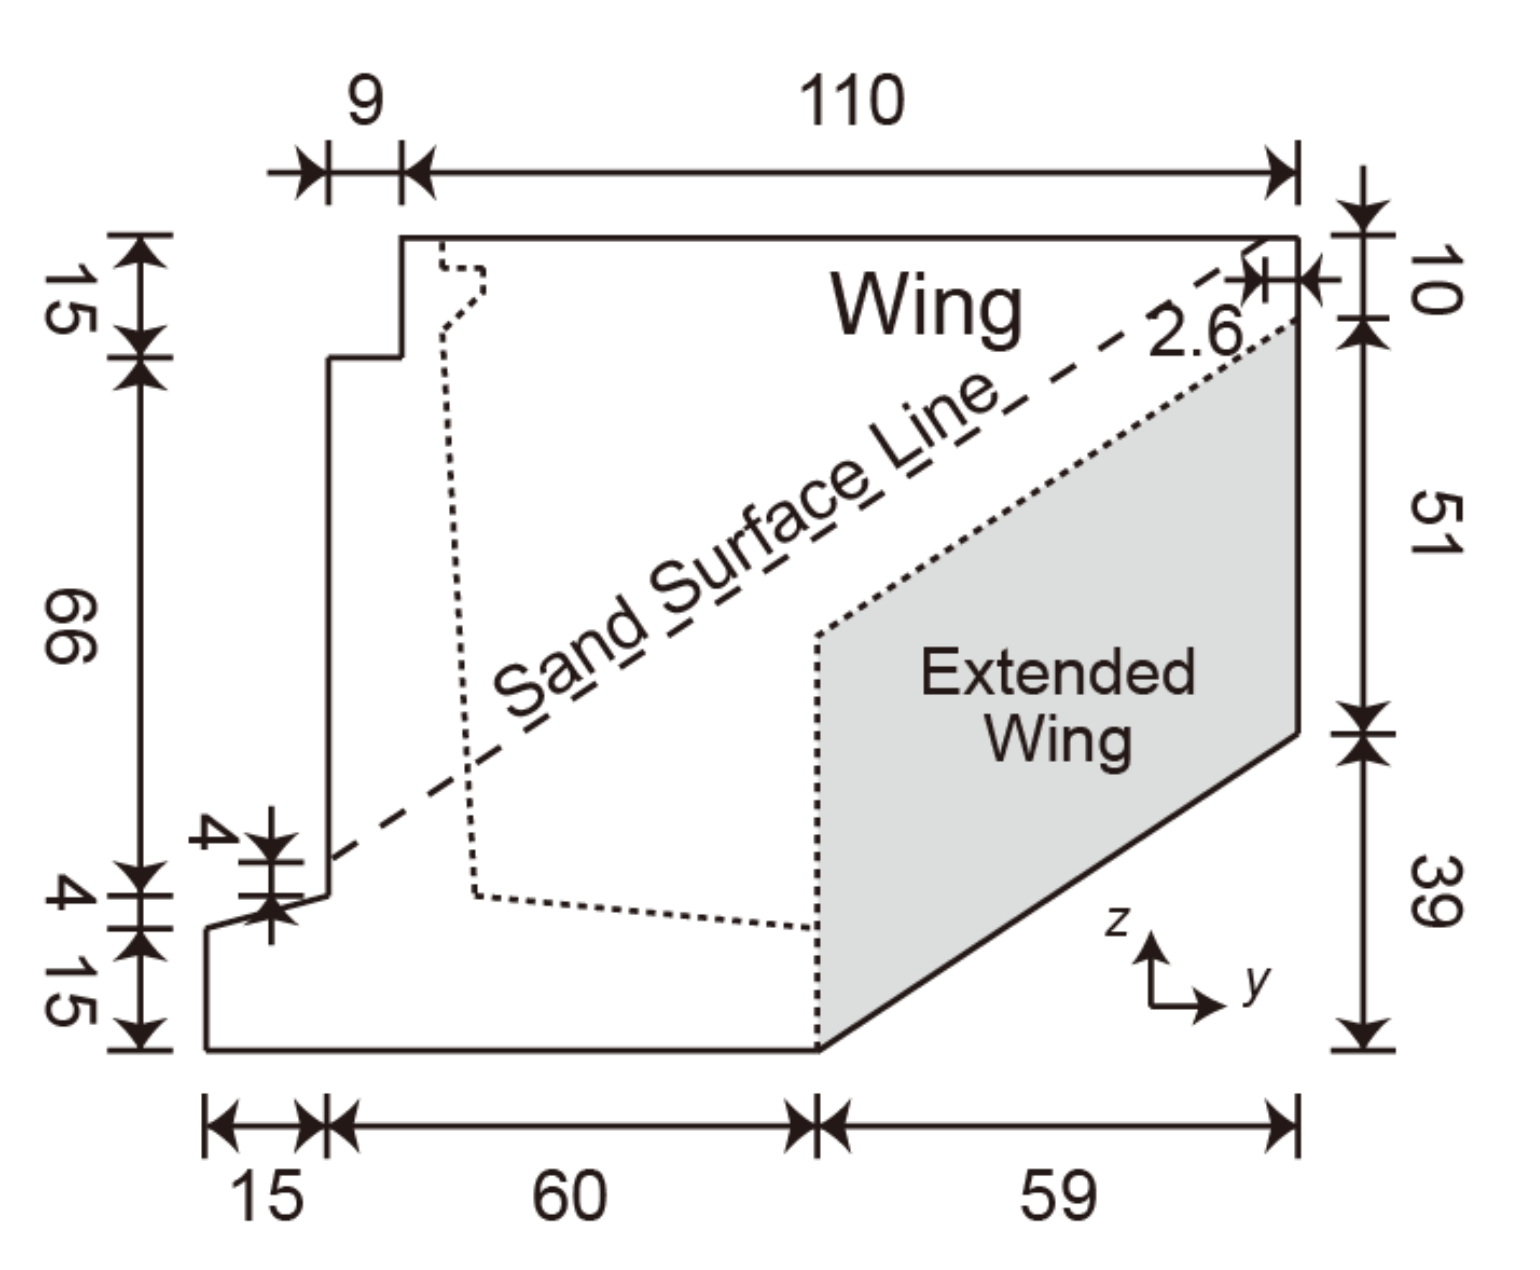
- The upstream and downstream wings were extended downward to prevent the backfill inside the abutment from flowing out (Figure 12). This was based on the confirmation in Section 3 that after erosion on the downstream side of the abutment reached the lower end of the downstream wing, the backfill inside the abutment began to flow out from below the downstream wing. This countermeasure indicates an increase in the depth of the soil cover on the wings. This was called countermeasure #3.
- Countermeasures #1 (wall), #2 (foot protection), and #3 (extended wings) were implemented simultaneously and called countermeasure #4.
The numerical conditions, except for the countermeasures, were set to be the same as those described in Section 3.
Figure 13 illustrates the backfill erosion and sand bed around the abutment with countermeasure #1 (wall). The left panel is a 3D view, and the right panel is a cross-sectional view at y = 0.095 m, which corresponds to the cross-section around the joint of the abutment wings. The figure indicates that the wall on the downstream wing of the abutment is higher than that on the upstream wing.
In the no-countermeasure case, as shown in Figure 4b, the tsunami flowing down along the downstream wing reaches the surface of the backfill, which begins to be eroded on the downstream side of the abutment at t = 11.0 s. At t = 11.3 s, as shown in Figure 4c, the backfill erosion reaches the lower end of the downstream wing. For countermeasure #1, Figure 13b–d show that backfill erosion does not occur on the downstream side of the abutment because the downflow along the downstream wing is prevented by the wall. However, as indicated in Figure 13e, the flow passing through the area with no wall radiates down the ogive section of the backfill, causing the onset of backfill erosion (red circle in the right panel). Subsequently, although the corresponding figure has not been presented here, the lower surface of the downstream wing was exposed approximately 3.5 s slower than in the no-countermeasure case (Figure 4e). However, Figure 13f indicates no significant difference in the erosion at t = 23.0 s between this case and the no-countermeasure case (Figure 4f). Finally, the backfill reached the state depicted in Figure 13g. Figure 14 illustrates the final backfill elevation z for countermeasure #1. A comparison with Figure 9 reveals that, although the implementation of countermeasure #1 marginally increased the quantity of the residual backfill inside the abutment, no significant change in the distribution of z occurred.
Figure 15 illustrates the backfill erosion and sand bed around the abutment with countermeasure #2 (foot protection). The figure illustrates the foot protection on the downstream side of the abutment.
As shown in Figure 15b, at t = 11.0 s, although the tsunami begins to flow down along the downstream wing, which is similar to the no-countermeasure case (Figure 4b), the backfill erosion on the downstream side of the abutment is not yet formed owing to the presence of the foot protection. Subsequently, as shown in Figure 15c–e, the backfill begins to be eroded on the downstream side of the foot protection (red circle in the right panel). Due to this delay in the erosion progress, the lower surface of the downstream wing is exposed approximately 6.4 s slower than in the no-countermeasure case (Figure 4e). However, at t = 23.0 s, as indicated in Figure 15f, the erosion is not significantly different from the no-countermeasure case (Figure 4f) and countermeasure #1 (Figure 13f). Finally, the backfill is eroded (Figure 15g). Figure 16 illustrates the final backfill elevation z with countermeasure #2. Similar to countermeasure #1, countermeasure #2 marginally increases the amount of the residual backfill inside the abutment compared with the no-countermeasure case (Figure 9). However, the effect of countermeasure #2 on the z value could not be understood.
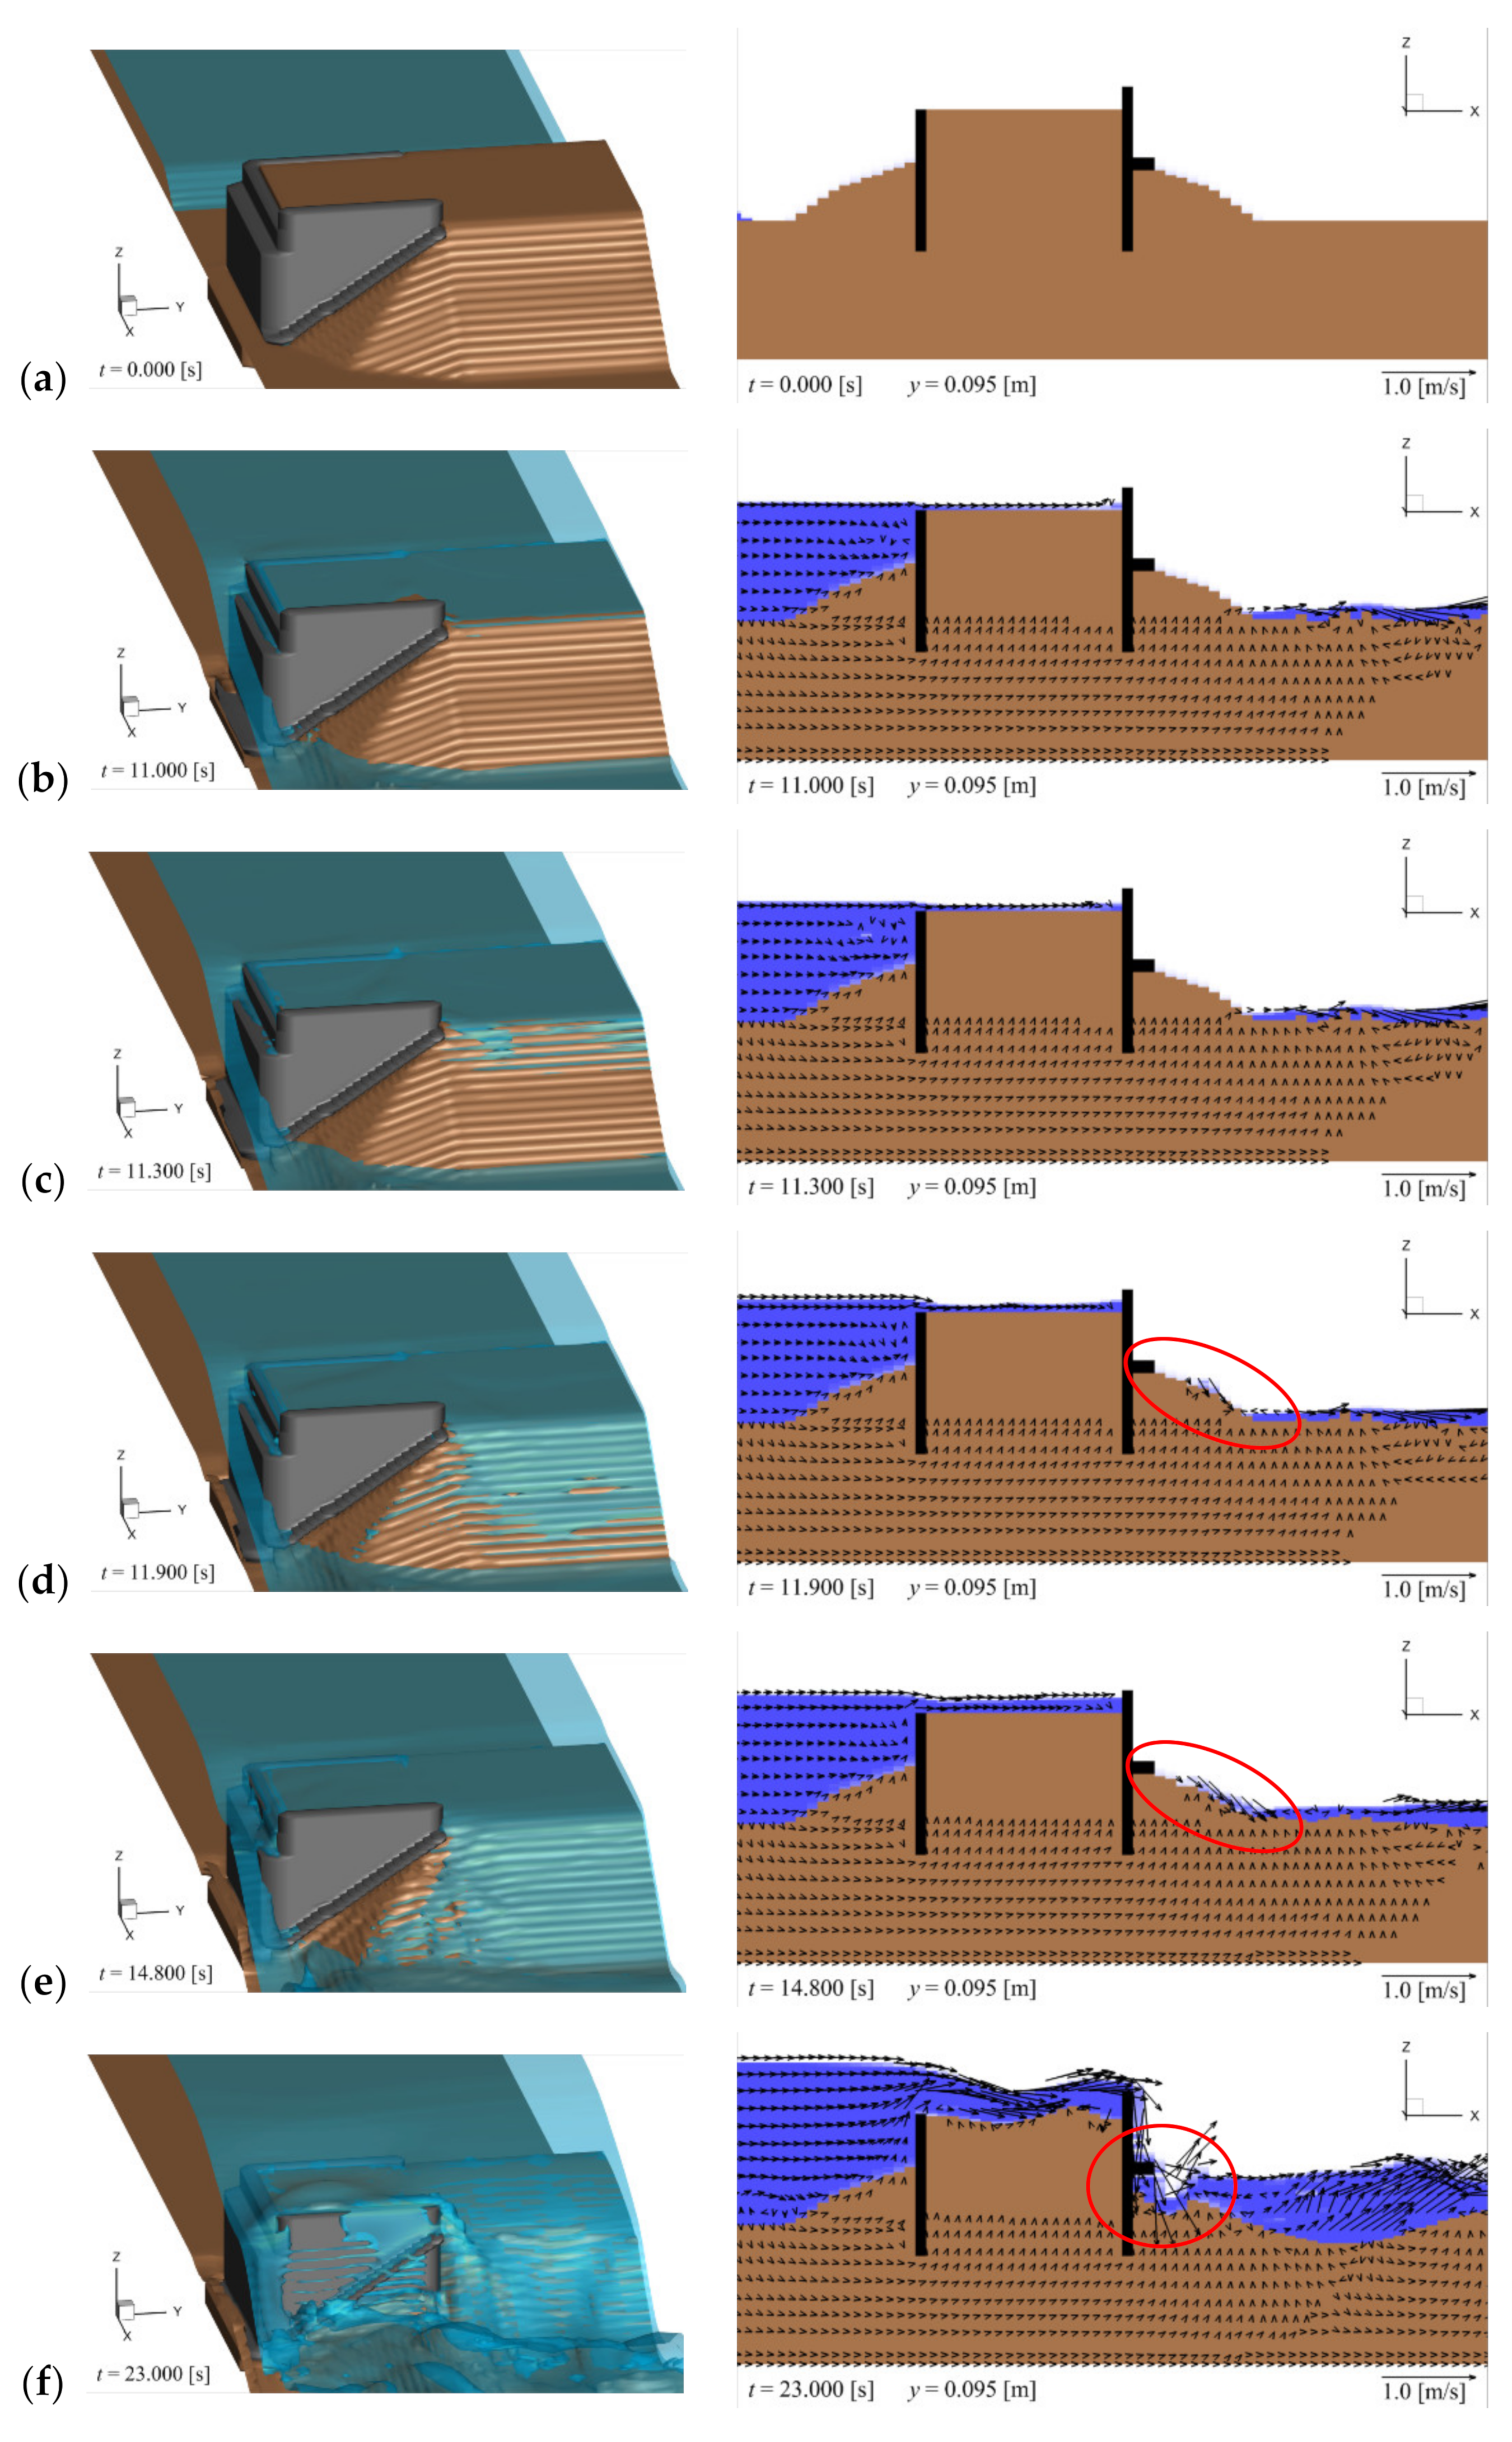
Figure 17 illustrates the backfill erosion and sand bed around the abutment with countermeasure #3 (extended wings). As observed in the figure, the wings are longer downward than the original wings (Figure 4).
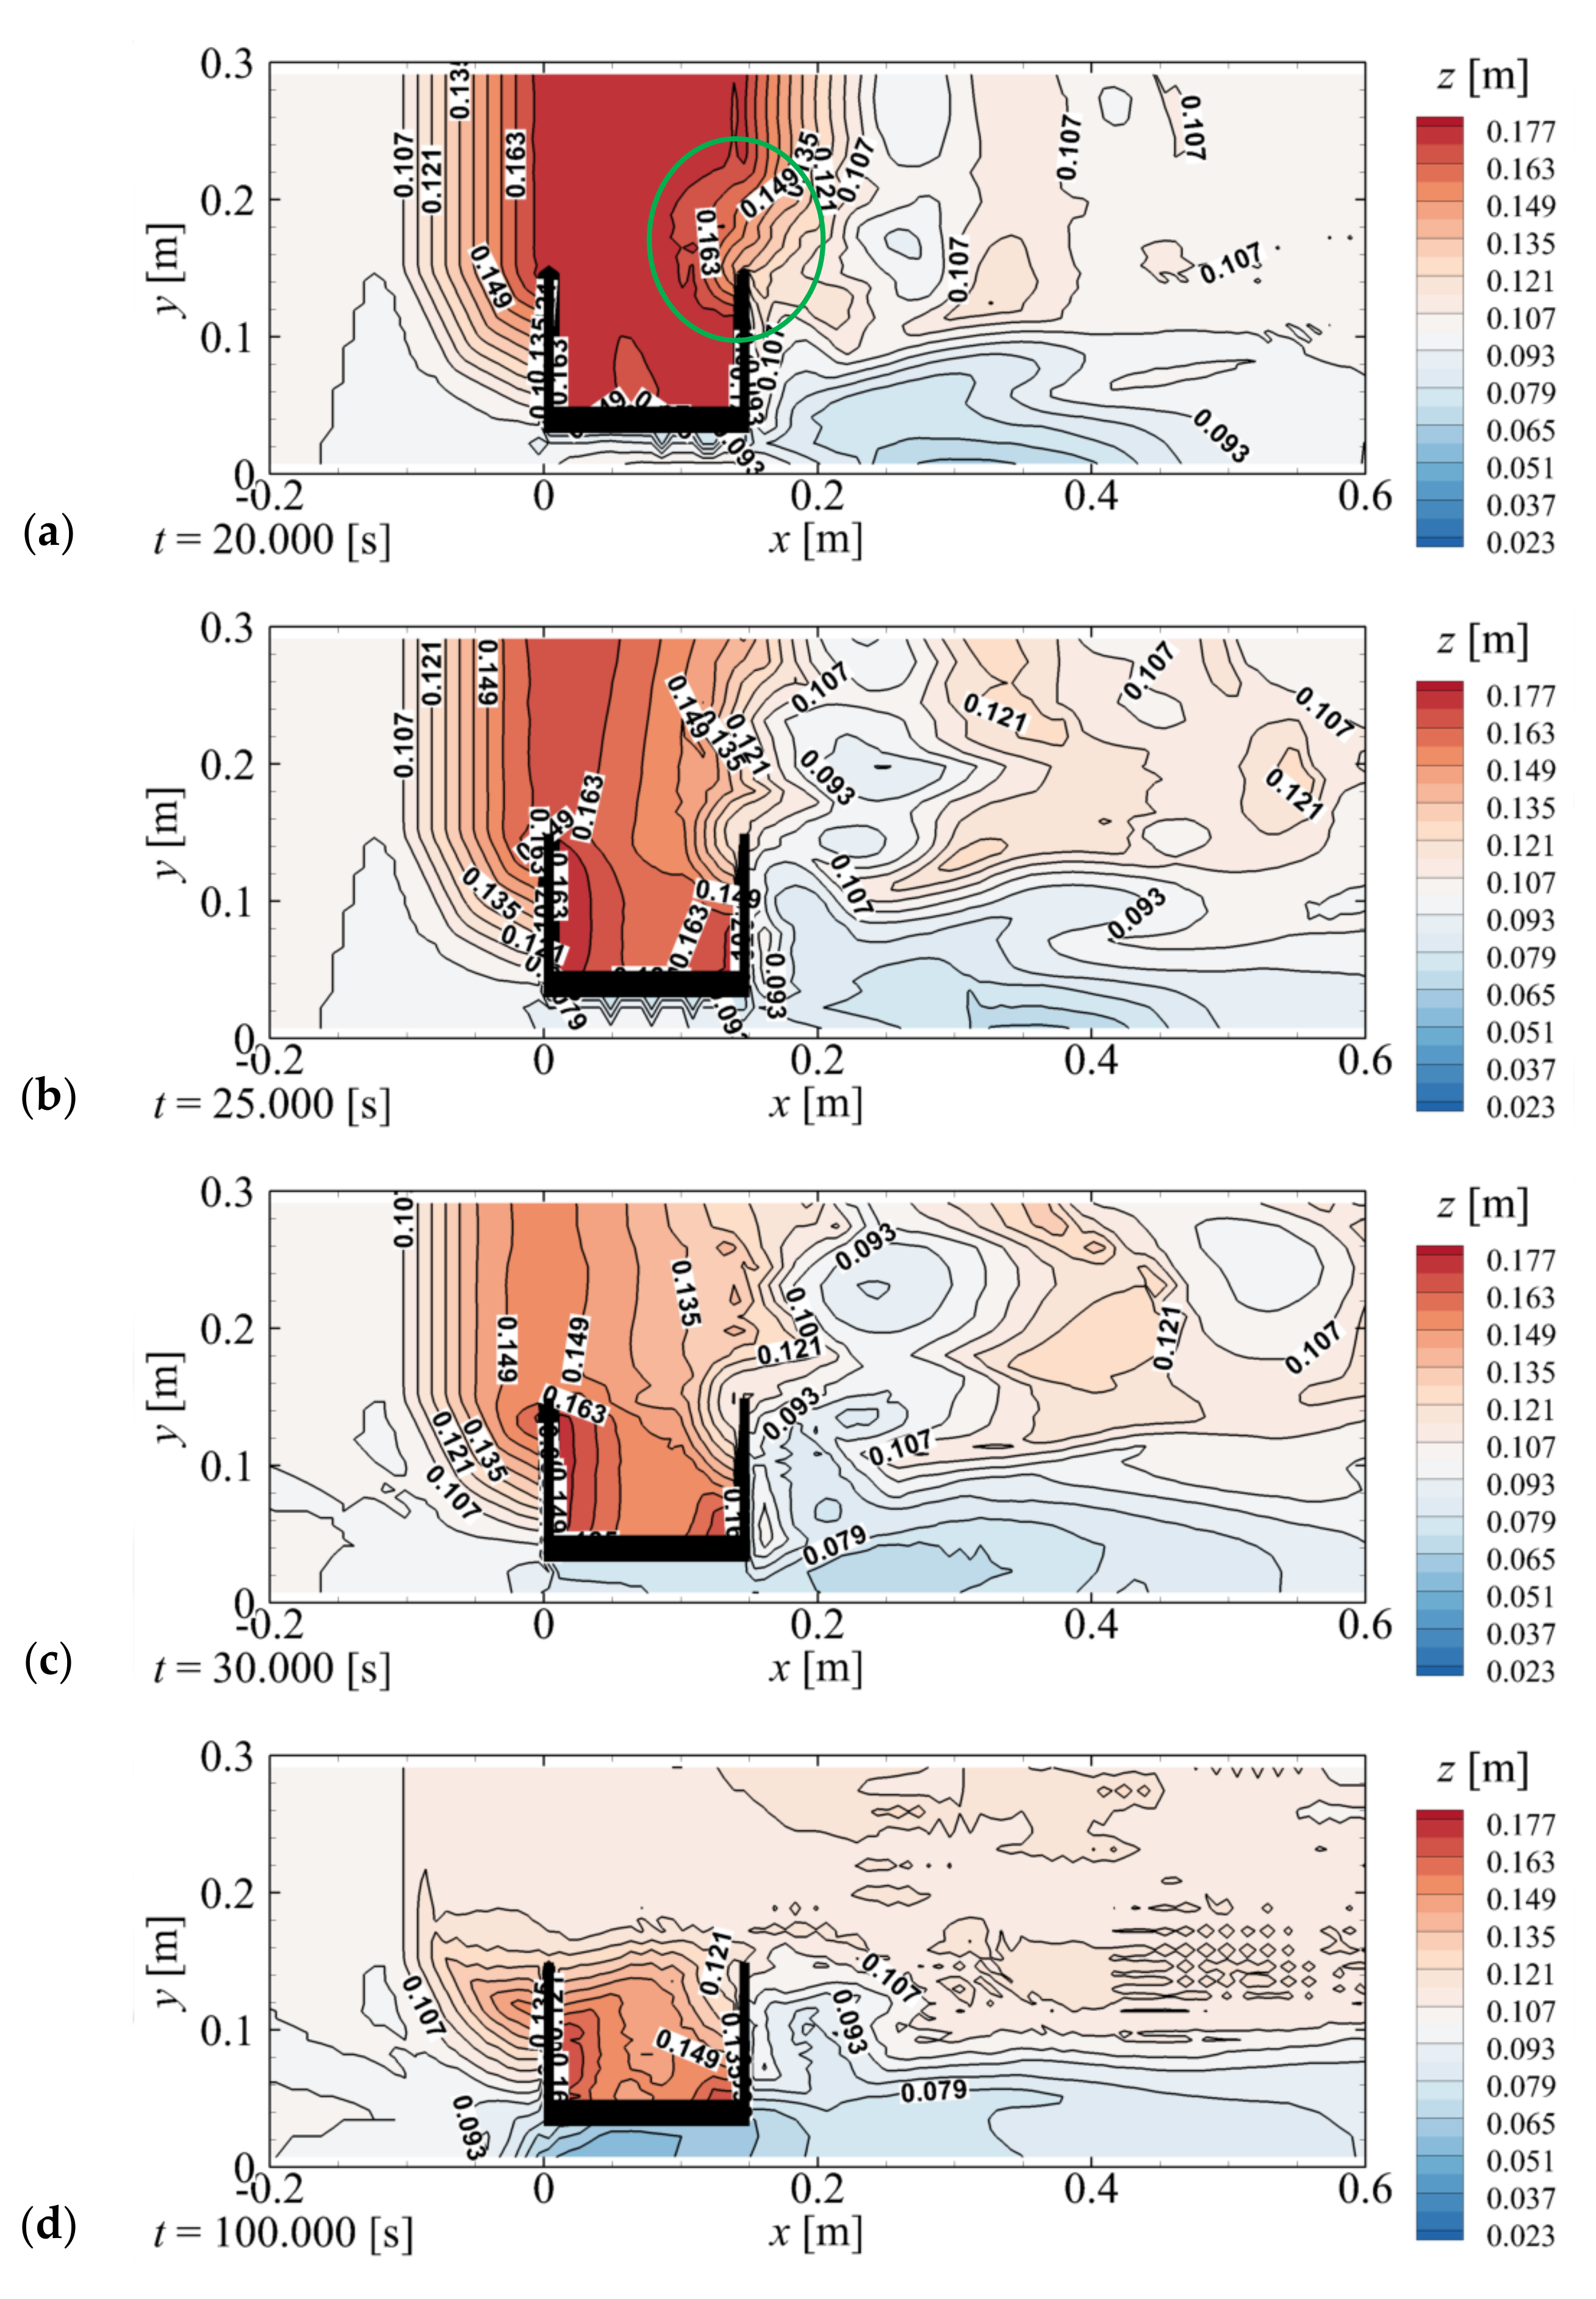
Similar to the no-countermeasure case (Figure 4), Figure 17b–f show that the backfill on the downstream side of the abutment begins to be eroded and deepened by the tsunami flowing down along the downstream wing. However, the erosion does not reach the lower end of the downstream wing even at t = 23.0 s (red circle in the right panel of Figure 17f). Despite subsequent erosion, the lower surface of the downstream wing is not fully exposed. This indicates that extending the downstream wing downward prevents the backfill inside the abutment from flowing out. Figure 18 shows the evolution of the elevation of the backfill z for countermeasure #3. As shown in Figure 18a, the backfill erosion begins near the tip of the downstream wing (green circle). However, as illustrated in Figure 18b,c, the contours of z = 0.149 and 0.163 m are located offshore (left side) on the side away from the abutment compared to the vicinity of the abutment. This indicates that backfill erosion is more advanced on the side away from the abutment. This suggests that countermeasure #3 can retard the acceleration of backfill erosion. As shown in Figure 17g and Figure 18d, although the backfill away from the abutment is finally lost, more backfill remains inside the abutment than in the cases of no countermeasure and countermeasures #1 and #2.
Figure 19 illustrates the backfill erosion and sand bed around the abutment with countermeasure #4 (wall, foot protection, and extended wings).
Figure 19b–d indicate that the wall prevents the tsunami from flowing along the downstream wing, which is the same as with countermeasure #1 (Figure 13b–d). Simultaneously, the flow passing through the area with no wall radiates down the ogive section of the backfill. This flow, as shown in Figure 19d,e, causes backfill erosion on the downstream side of the foot protection (red circle in the right panel), which is similar to the case with countermeasure #2 (Figure 15c–e). Figure 19f shows that the tsunami flowing over the wall deepens the erosion around the foot protection (red circle in the right panel). However, similar to the case with countermeasure #3, erosion in this case does not reach the lower end of the downstream wing. Figure 20 illustrates the final elevation of the backfill z with countermeasure #4. The figure shows the distributions of the z value inside the abutment on the upstream side of the abutment and on the side away from the abutment do not significantly change from the case with countermeasure #3 (Figure 18d). In contrast, as depicted in Figure 19g and Figure 20, the erosion on the downstream side of the abutment (green circles) is reduced comparable to the case with countermeasure #3 (Figure 17g and Figure 18d).
These results reveal that the effect of countermeasures #1 (wall) and #2 (foot protection) is limited to marginally prolonging the time until the entire lower surface of the downstream wing is exposed, i.e., approximately 3.5 s for countermeasure #1 and approximately 6.4 s for countermeasure #2. This suggests that these countermeasures could marginally increase the lead time until the abutment collapses. In contrast, countermeasure #3 (extended wings) can prevent the abutment from accelerating backfill erosion. This suggests that this countermeasure would be more effective if a tsunami were small enough to leave the backfill away from the abutment. In particular, countermeasure #4 (wall, foot protection, and extended wings) has the additional effect of preventing erosion on the downstream side of the abutment, which would be more suitable from the viewpoint of the stability of the abutment.
5. Conclusions
In this study, the mechanism of tsunami-induced backfill erosion of bridge abutments and its countermeasures were investigated through numerical analyses based on FS3M. The main conclusions of this study are summarized as follows:
- The backfill begins to be eroded on the downstream side of the joint of the downstream wing, owing to an increase in the bedload sediment transport qxy.
- After the backfill inside the abutment starts to flow out from below the downstream wing, the suspended sediment qz also increases, in addition to the bedload sediment transport qxy, leading to the subsidence of the backfill on the upstream side of the downstream wing.
- The subsequent backfill erosion is mainly caused by the bedload sediment transport qxy. Furthermore, the erosion of the downstream end of the backfill crown is affected by the suspended sediment qz, in addition to qxy.
- Extending the wings downward can prevent the abutment from accelerating the backfill erosion. This suggests that the extended wings would be more effective against shorter tsunamis.
- A combination of wall and foot protection, in addition to the extended wings, would be more suitable for maintaining the stability of the abutment after the tsunami.
However, this study focused on small-scale hydraulic model experiments, and therefore scale effects were unavoidable. Furthermore, the effectiveness of the countermeasures for other types of abutments was not discussed because this study was limited to the model of the Numata overpass. To address these issues, we recommend conducting further studies on a larger scale including a prototype scale.
Author Contributions
Conceptualization, T.N. and N.M.; methodology, T.N. and Y.-H.C.; software, T.N.; validation, T.N., Y.-H.C. and N.M.; formal analysis, C.S.; investigation, C.S.; writing—original draft preparation, T.N.; writing—review and editing, Y.-H.C. and N.M.; visualization, T.N. and C.S.; supervision, T.N.; project administration, T.N.; funding acquisition, T.N. All authors have read and agreed to the published version of the manuscript.
Funding
This study is supported by the Foundation of Public Interest of Tatematsu.
Institutional Review Board Statement
Not applicable.
Informed Consent Statement
Not applicable.
Conflicts of Interest
The authors declare no conflict of interest.
References
- Saatcioglu, M.; Ghobarah, A.; Nistor, I. Performance of structures in Indonesia during the December 2004 Great Sumatra earthquake and Indian Ocean tsunami. Earthq. Spectra 2006, 22, S295–S319. [Google Scholar] [CrossRef]
- Chock, G.; Robertson, I.; Kriebel, D.; Francis, M.; Nistor, I. Tohoku, Japan, Earthquake and Tsunami of 2011: Performance of Structures under Tsunami Loads; ASCE: Reston, VA, USA, 2013; 359p. [Google Scholar]
- Nacházel, T.; Babič, F.; Baiguera, M.; Čech, P.; Husáková, M.; Mikulecký, P.; Mls, K.; Ponce, D.; Salmanidou, D.; Štekerová, K.; et al. Tsunami-related data: A review of available repositories used in scientific literature. Water 2021, 13, 31. [Google Scholar] [CrossRef]
- Azadbakht, M.; Yim, S.C. Simulation and estimation of tsunami loads on bridge superstructure. J. Waterw. Port Coast. Ocean. Eng. 2015, 141, 04014031-1–04014031–20. [Google Scholar] [CrossRef]
- Nakamura, T.; Sawa, Y.; Mizutani, N. Study on the evaluation of temporal change in horizontal and vertical tsunami forces acting on a bridge superstructure. Coast. Eng. J. 2016, 58, 1640020. [Google Scholar] [CrossRef] [Green Version]
- Istrati, D.; Buckle, I.; Lomonaco, P.; Yim, S. Deciphering the tsunami wave impact and associated connection forces in open-girder coastal bridges. J. Mar. Sci. Eng. 2018, 6, 35. [Google Scholar] [CrossRef] [Green Version]
- Istrati, D.; Buckle, I. Role of trapped air on the tsunami-induced transient loads and response of coastal bridges. Geosciences 2019, 9, 36. [Google Scholar] [CrossRef] [Green Version]
- Inoue, T.; Miyamoto, K.; Yoshizaki, F.; Nagase, H.; Hirooka, A. Centrifuge model experiments on tsunami-induced damage mechanism of backfill of bridge abutment with different shapes. In Proceedings of the 49th Annual Meeting of Japan National Conference on Geotechnical Engineering, JGS, Kitakyushu, Japan, 15–17 July 2014; pp. 1897–1899. (In Japanese). [Google Scholar]
- Yoshizaki, F.; Fujioka, D.; Hirooka, A.; Nagase, H. Centrifuge model experiments on the effect of pseudo-tsunami flow on damage situation of abutment backfill. In Proceedings of the 50th Annual Meeting of Japan National Conference on Geotechnical Engineering, JGS, Sapporo, Japan, 1–4 September 2015; pp. 1177–1178. (In Japanese). [Google Scholar]
- Nakamura, T.; Nakai, Y.; Cho, Y.-H.; Mizutani, N. Modeling tsunami-induced erosion of bridge-abutment backfill. J. Mar. Sci. Eng. 2020, 8, 16. [Google Scholar] [CrossRef]
- Nakamura, T.; Mizutani, N. Development of fluid-sediment-seabed interaction model and its application. In Proceedings of the 34th International Conference on Coastal Engineering, ASCE, Seoul, Korea, 15–20 September 2014. 34, sediment.85, E93, 8p. [Google Scholar]
- Nakamura, T.; Yim, S.C.; Mizutani, N. Three-dimensional fluid-structure-sediment interaction modeling with application to local scouring around a movable cylinder. J. Offshore Mech. Arct. Eng. 2013, 135, 9. [Google Scholar] [CrossRef]
- Iwagaki, Y. Fundamental study on critical tractive force (I) Hydrodynamic study on critical tractive force. Trans. JSCE 1956, 41, 1–21, (In Japanese with English Abstract). [Google Scholar]
- Rubey, W.W. Settling velocities of gravel, sand, and silt particles. Amer. J. Sci. 1933, 25, 325–338. [Google Scholar] [CrossRef]
Figure 1.
Entire computational domain (unit: mm): (a) top view; (b) side view.

Figure 2.
Bridge abutment (unit: mm): (a) three-dimensional (3D) view (outside); (b) 3D view (inside); (c) front view; (d) side view; (e) cross-sectional view; (f) top view.
Figure 2.
Bridge abutment (unit: mm): (a) three-dimensional (3D) view (outside); (b) 3D view (inside); (c) front view; (d) side view; (e) cross-sectional view; (f) top view.

Figure 3.
Backfill (unit: mm): (a) top view; (b) side view.

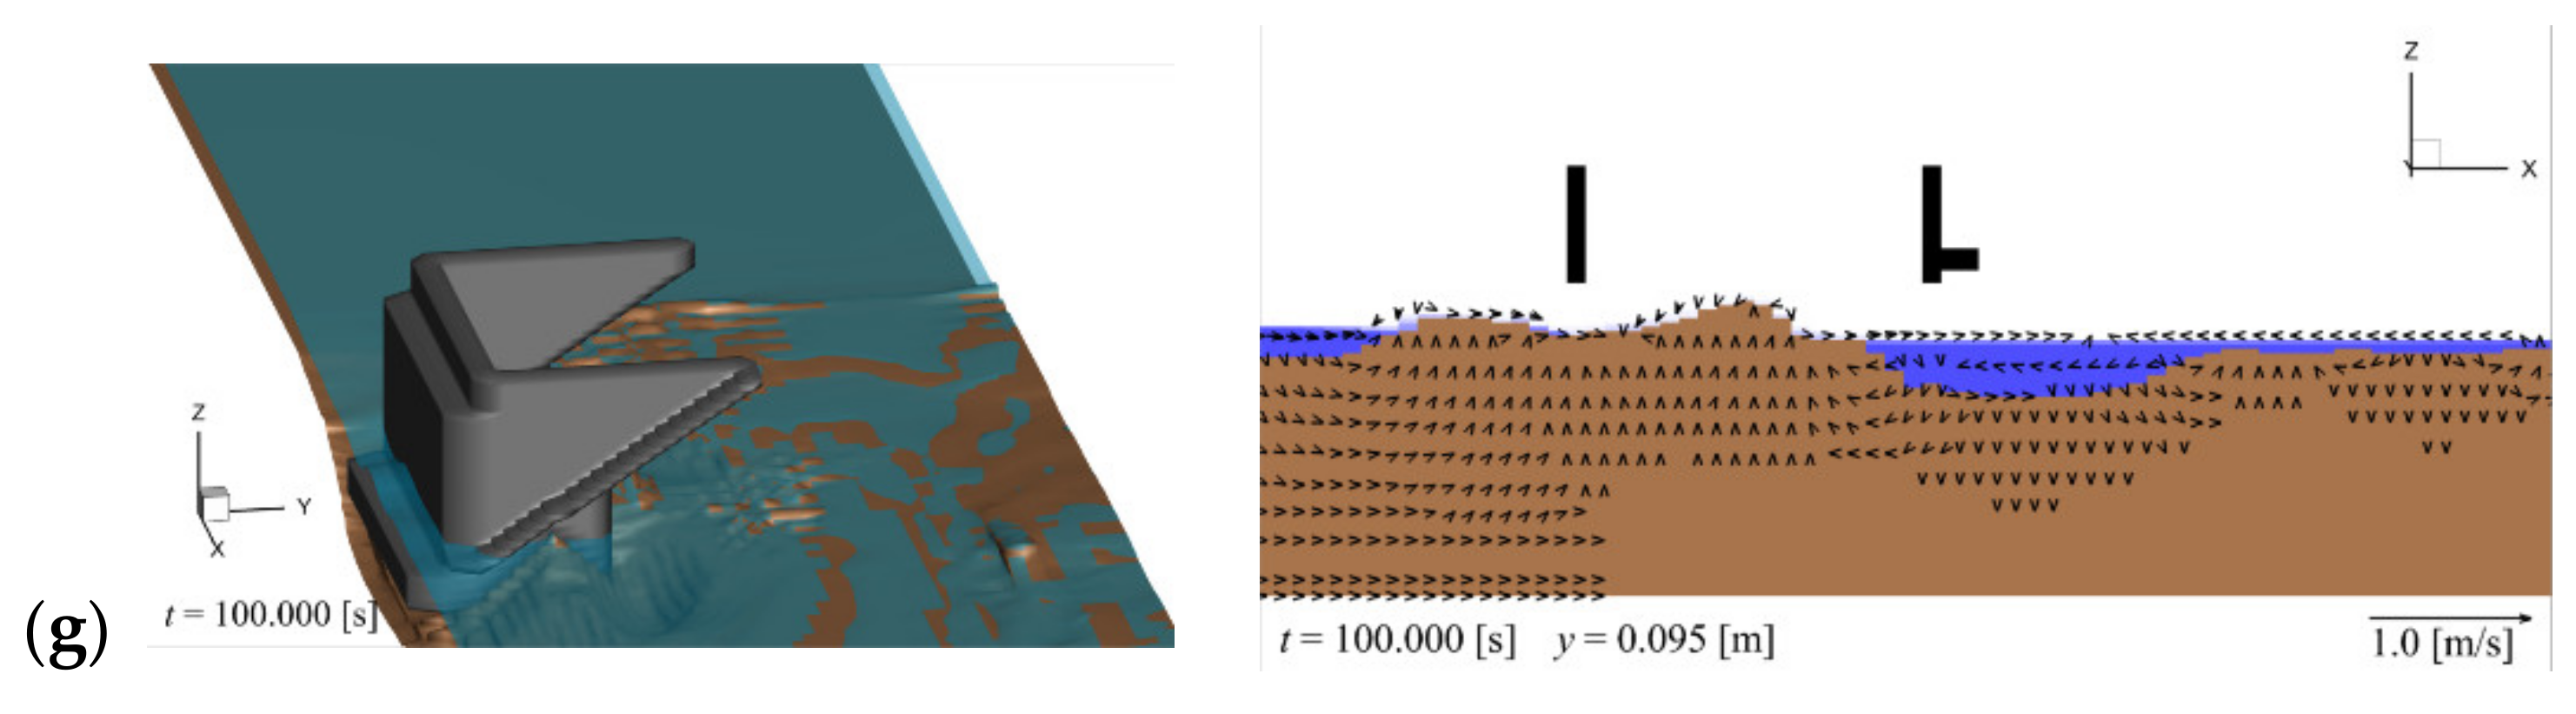
Figure 4.
Backfill erosion around the abutment (left panel: 3D view; right panel: cross-sectional view at y = 0.095 m): (a) t = 0.0 s (initial); (b) t = 11.0 s; (c) t = 11.3 s; (d) t = 11.9 s; (e) t = 14.8 s; (f) t = 23.0 s; (g) t = 100.0 s (final).
Figure 4.
Backfill erosion around the abutment (left panel: 3D view; right panel: cross-sectional view at y = 0.095 m): (a) t = 0.0 s (initial); (b) t = 11.0 s; (c) t = 11.3 s; (d) t = 11.9 s; (e) t = 14.8 s; (f) t = 23.0 s; (g) t = 100.0 s (final).


Figure 5.
Values related to sediment transport (left panel: bedload sediment transport qxy and difference between sediment pickup and settlement qz; right panel: difference between the Shields parameter τ* and critical Shields parameter τ*c): (a) t = 11.0 s; (b) t = 11.3 s; (c) t = 11.9 s; (d) t = 14.8 s; (e) t = 23.0 s.


Figure 6.
Time series of the backfill elevation z, difference between the Shields parameter and critical Shields parameter τ* − τ*c, bedload sediment transport qxy, and suspended sediment qz on the downstream side of the joint of the downstream wing (x = 0.158 m, y = 0.095 m).
Figure 6.
Time series of the backfill elevation z, difference between the Shields parameter and critical Shields parameter τ* − τ*c, bedload sediment transport qxy, and suspended sediment qz on the downstream side of the joint of the downstream wing (x = 0.158 m, y = 0.095 m).

Figure 7.
Time series of the backfill elevation z, difference between the Shields parameter and the critical Shields parameter τ* − τ*c, bedload sediment transport qxy, and suspended sediment qz at the upstream side of the joint of the downstream wing (x = 0.135 m, y = 0.095 m).
Figure 7.
Time series of the backfill elevation z, difference between the Shields parameter and the critical Shields parameter τ* − τ*c, bedload sediment transport qxy, and suspended sediment qz at the upstream side of the joint of the downstream wing (x = 0.135 m, y = 0.095 m).

Figure 8.
Time series of the backfill elevation z, difference between the Shields parameter and critical Shields parameter τ* − τ*c, bedload sediment transport qxy, and suspended sediment qz at the center of the backfill crown away from the abutment (x = 0.075 m, y = 0.250 m).
Figure 8.
Time series of the backfill elevation z, difference between the Shields parameter and critical Shields parameter τ* − τ*c, bedload sediment transport qxy, and suspended sediment qz at the center of the backfill crown away from the abutment (x = 0.075 m, y = 0.250 m).

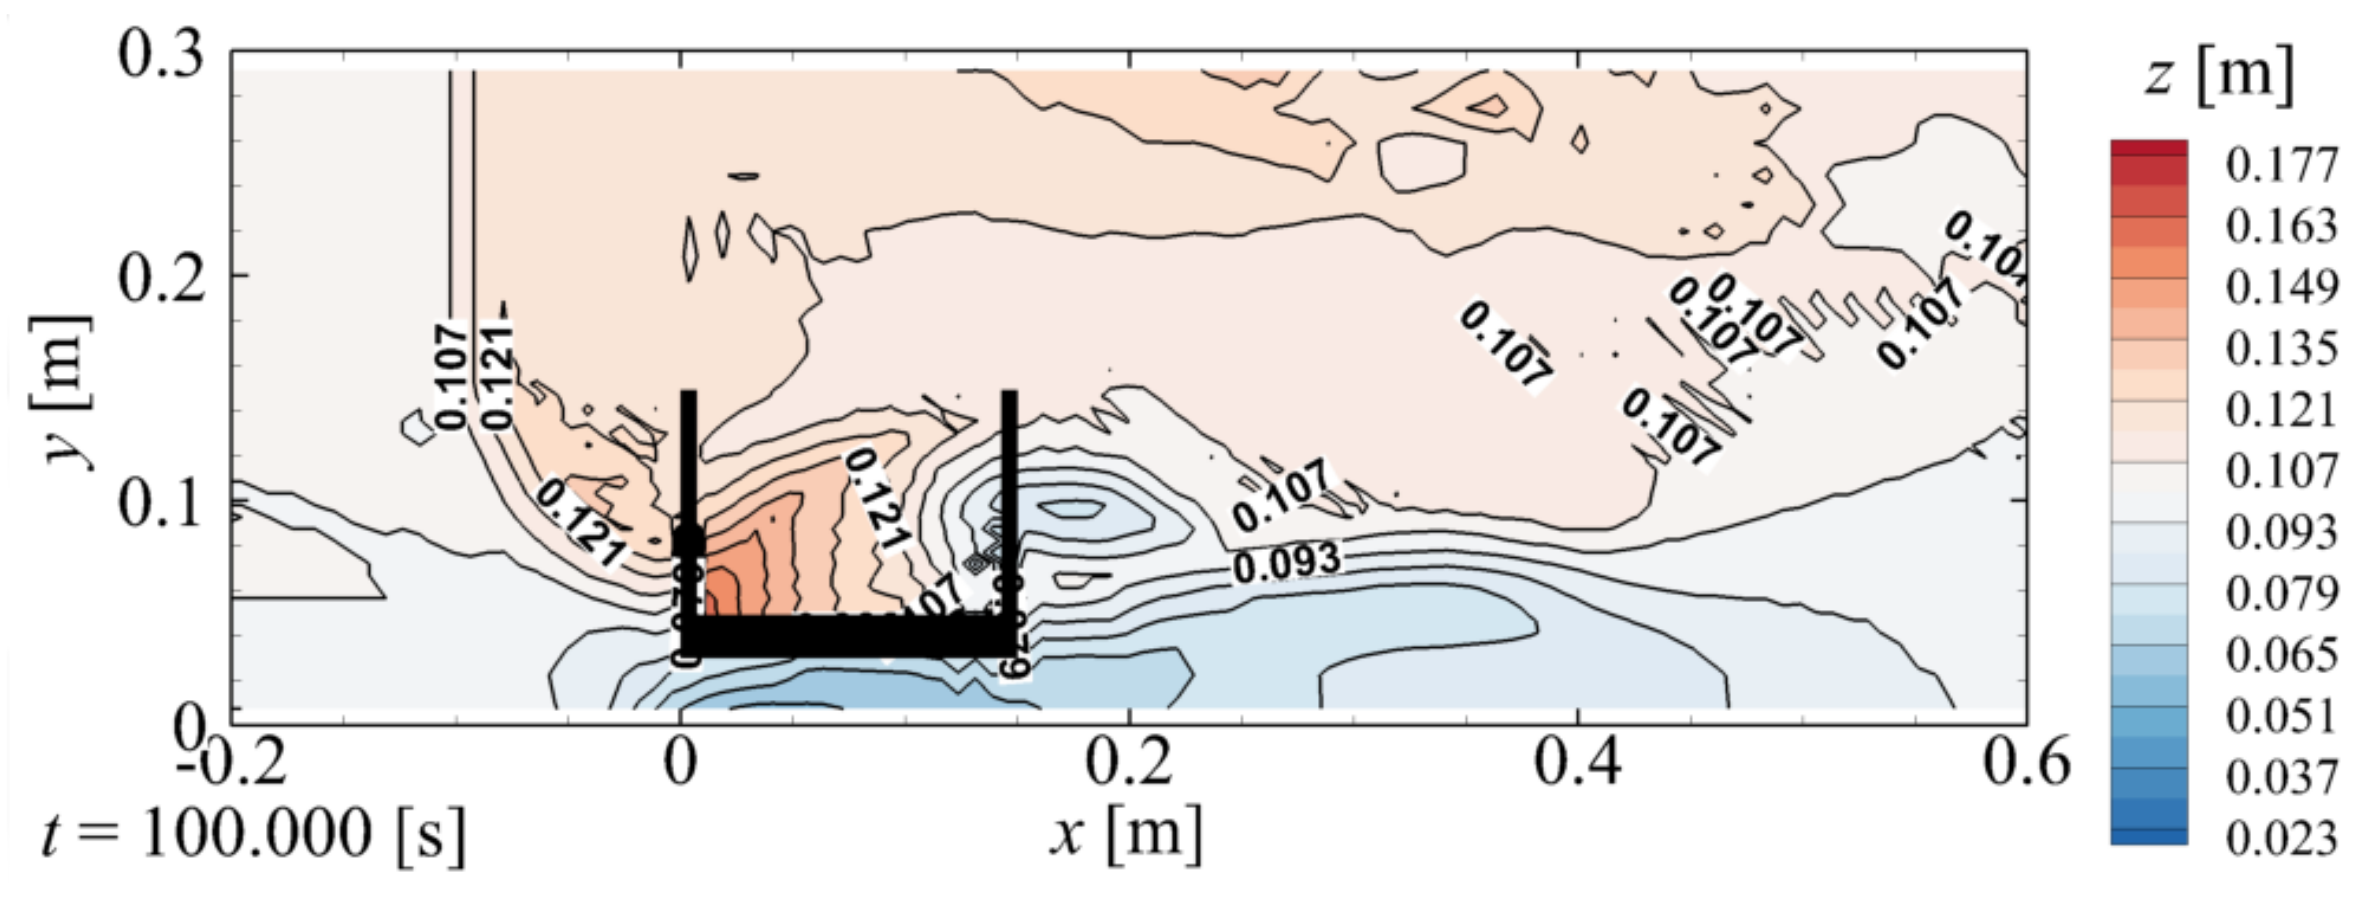
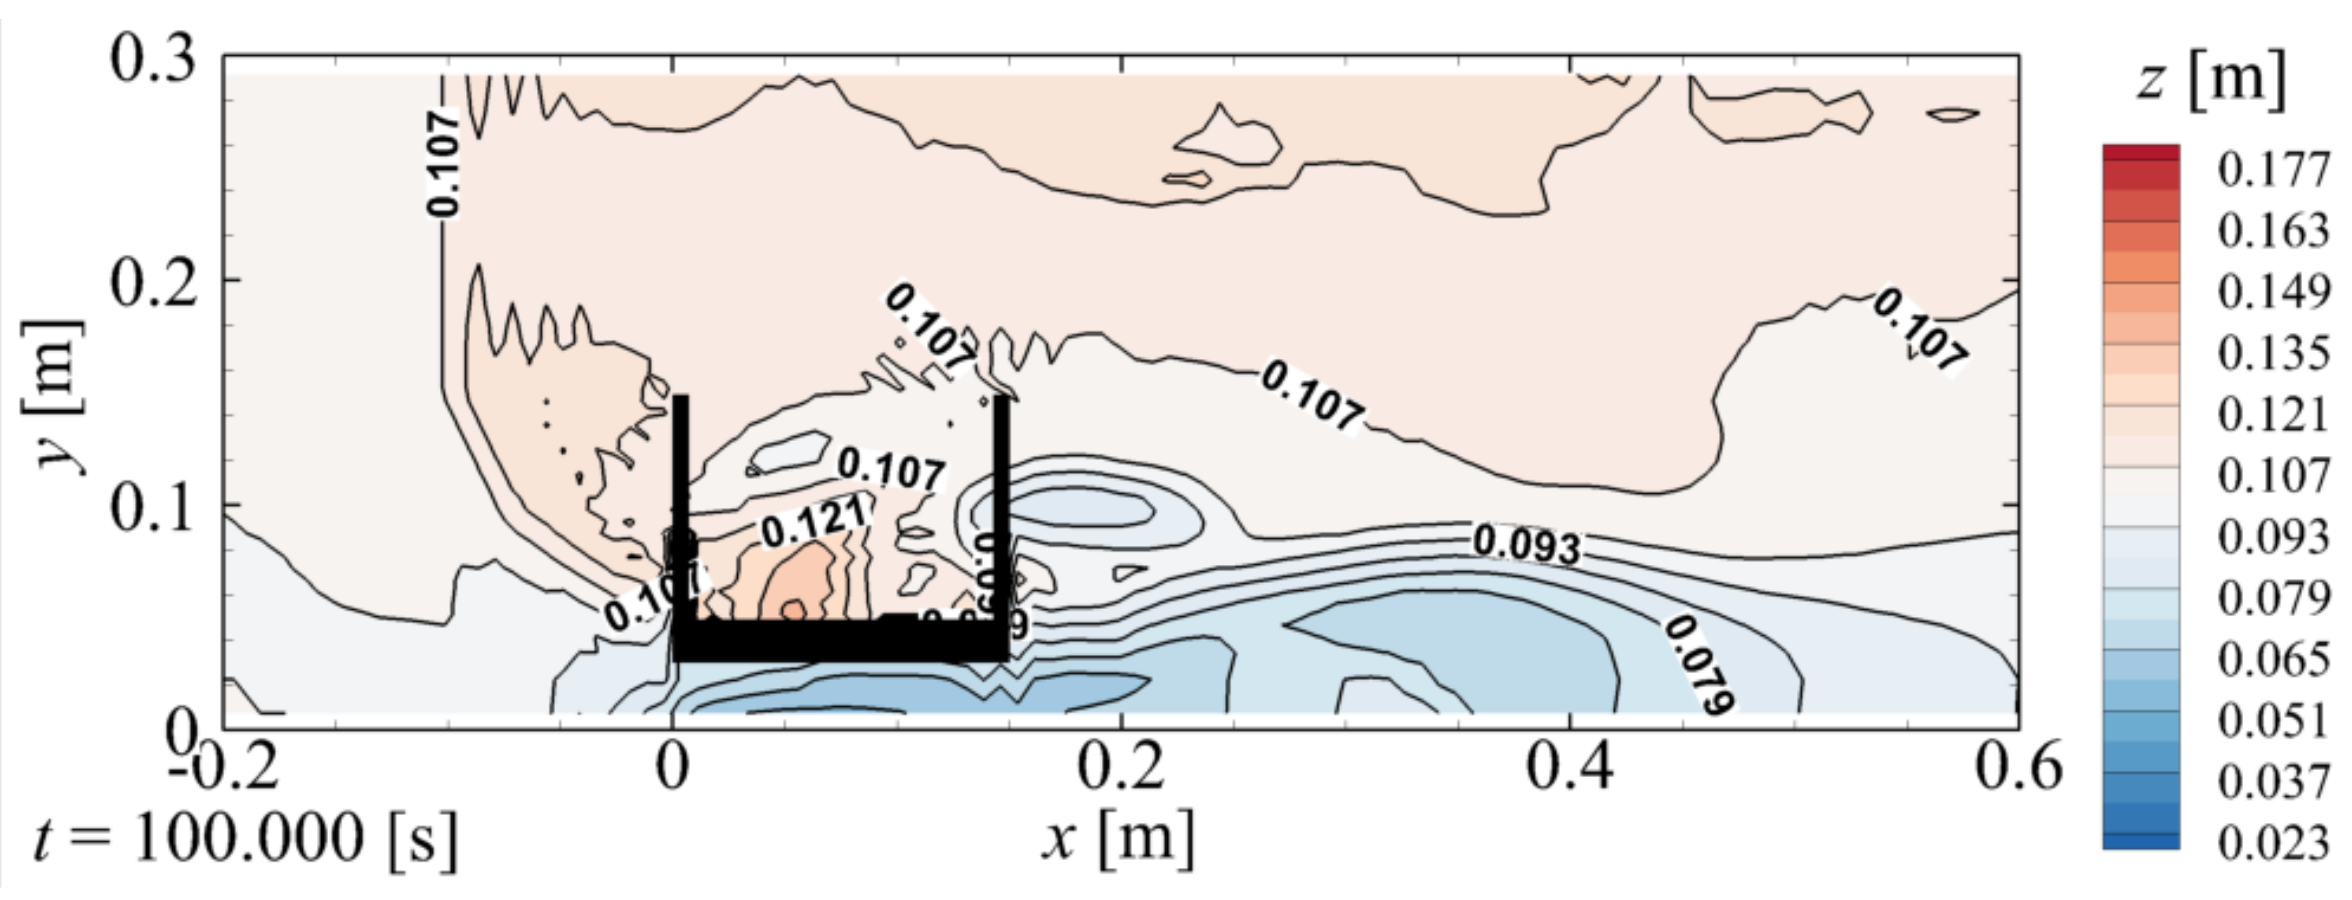
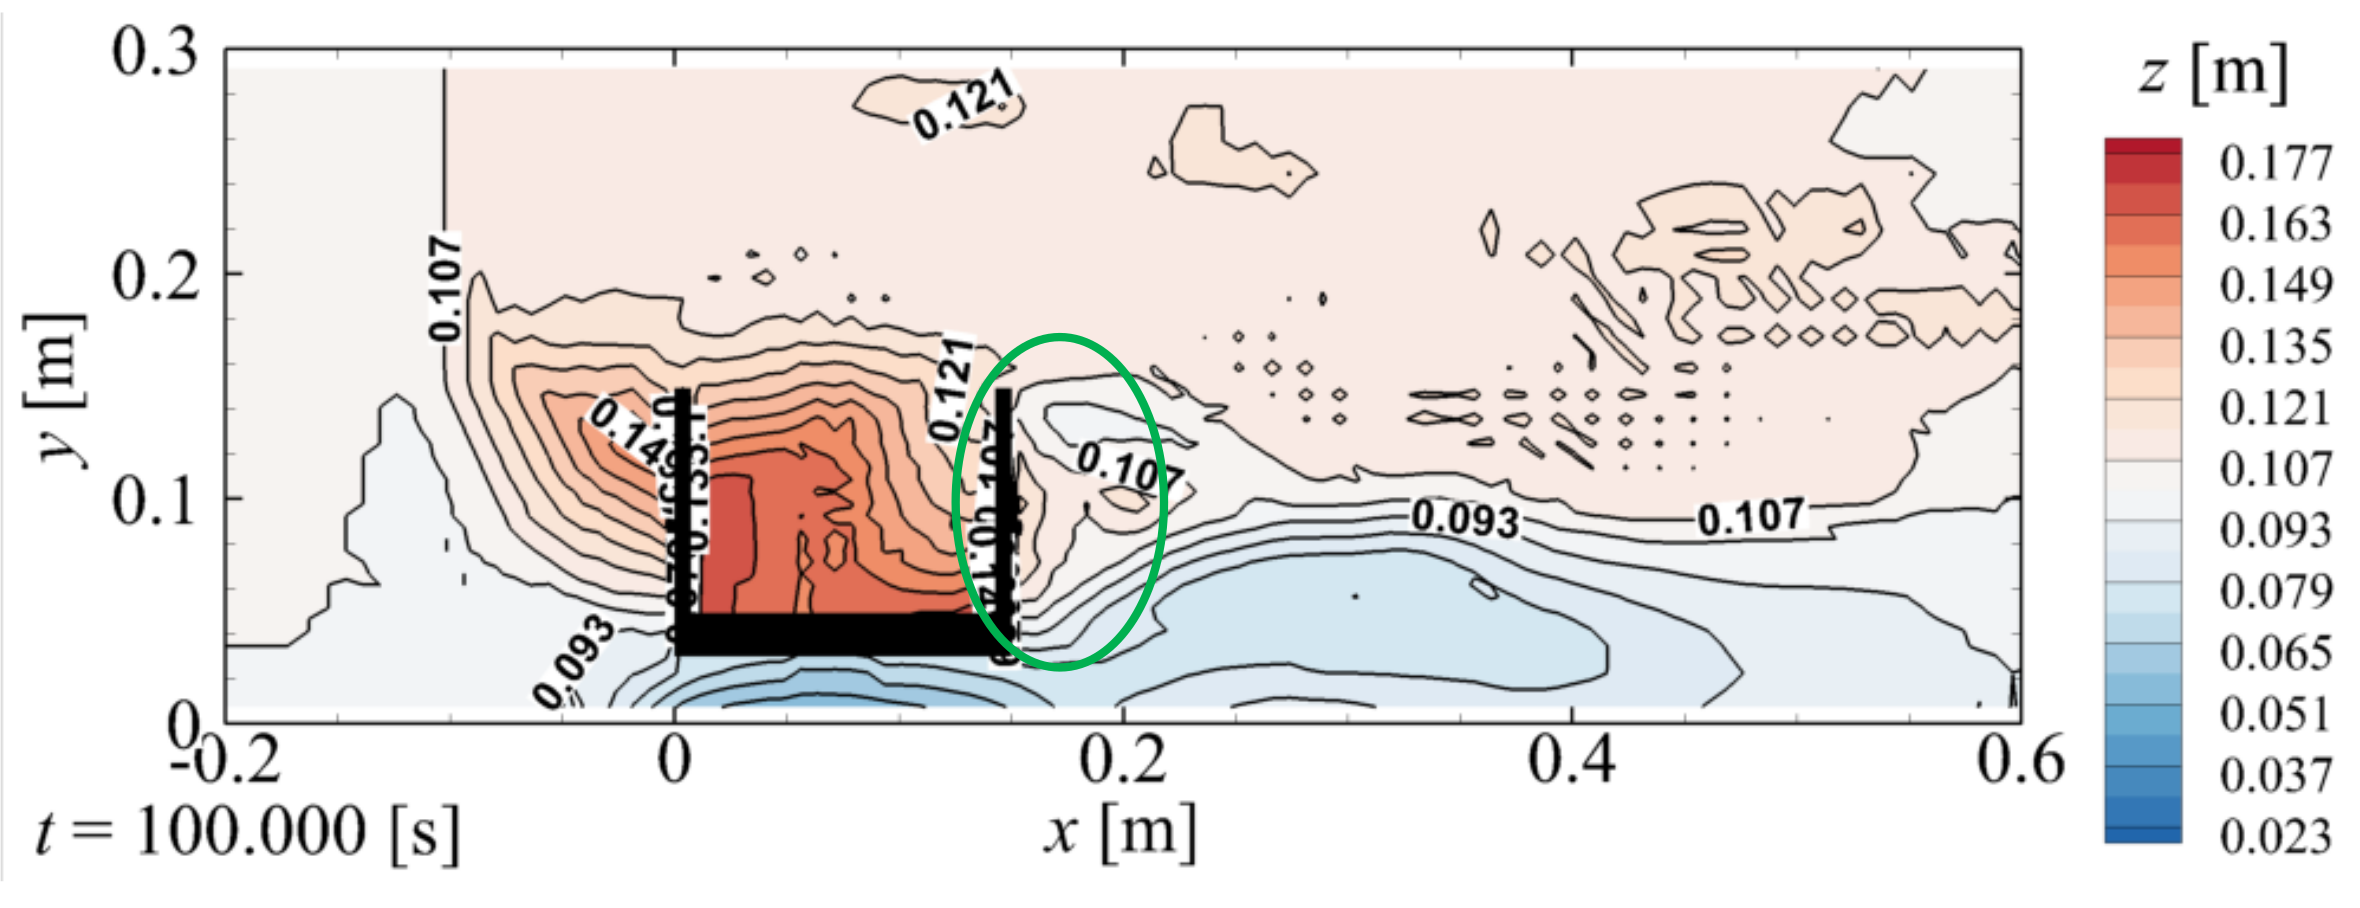
Figure 9.
Final elevation of the surface of the backfill z.

Figure 10.
Countermeasure #1. Bridge abutment with the wall (unit: mm): (a) front view; (b) side view; (c) top view.
Figure 10.
Countermeasure #1. Bridge abutment with the wall (unit: mm): (a) front view; (b) side view; (c) top view.

Figure 11.
Countermeasure #2. Bridge abutment with the foot protection (unit: mm): (a) front view; (b) side view; (c) top view.
Figure 11.
Countermeasure #2. Bridge abutment with the foot protection (unit: mm): (a) front view; (b) side view; (c) top view.

Figure 12.
Countermeasure #3. Bridge abutment with the extended wings (unit: mm).

Figure 13.
Backfill erosion around the abutment with countermeasure #1 (wall) (left panel: 3D view; right panel: cross-sectional view at y = 0.095 m): (a) t = 0.0 s (initial); (b) t = 11.0 s; (c) t = 11.3 s; (d) t = 11.9 s; (e) t = 14.8 s; (f) t = 23.0 s; (g) t = 100.0 s (final).
Figure 13.
Backfill erosion around the abutment with countermeasure #1 (wall) (left panel: 3D view; right panel: cross-sectional view at y = 0.095 m): (a) t = 0.0 s (initial); (b) t = 11.0 s; (c) t = 11.3 s; (d) t = 11.9 s; (e) t = 14.8 s; (f) t = 23.0 s; (g) t = 100.0 s (final).


Figure 14.
Final elevation of the surface of the backfill z for the abutment with countermeasure #1 (wall).
Figure 14.
Final elevation of the surface of the backfill z for the abutment with countermeasure #1 (wall).

Figure 15.
Backfill erosion around the abutment with countermeasure #2 (foot protection) (left panel: 3D view; right panel: cross-sectional view at y = 0.095 m): (a) t = 0.0 s (initial); (b) t = 11.0 s; (c) t = 11.3 s; (d) t = 11.9 s; (e) t = 14.8 s; (f) t = 23.0 s; (g) t = 100.0 s (final).
Figure 15.
Backfill erosion around the abutment with countermeasure #2 (foot protection) (left panel: 3D view; right panel: cross-sectional view at y = 0.095 m): (a) t = 0.0 s (initial); (b) t = 11.0 s; (c) t = 11.3 s; (d) t = 11.9 s; (e) t = 14.8 s; (f) t = 23.0 s; (g) t = 100.0 s (final).


Figure 16.
Final elevation of the surface of the backfill z for the abutment with countermeasure #2 (foot protection).
Figure 16.
Final elevation of the surface of the backfill z for the abutment with countermeasure #2 (foot protection).

Figure 17.
Backfill erosion around the abutment with countermeasure #3 (extended wings) (left panel: 3D view; right panel: cross-sectional view at y = 0.095 m): (a) t = 0.0 s (initial); (b) t = 11.0 s; (c) t = 11.3 s; (d) t = 11.9 s; (e) t = 14.8 s; (f) t = 23.0 s; (g) t = 100.0 s (final).
Figure 17.
Backfill erosion around the abutment with countermeasure #3 (extended wings) (left panel: 3D view; right panel: cross-sectional view at y = 0.095 m): (a) t = 0.0 s (initial); (b) t = 11.0 s; (c) t = 11.3 s; (d) t = 11.9 s; (e) t = 14.8 s; (f) t = 23.0 s; (g) t = 100.0 s (final).


Figure 18.
Elevation of the surface of the backfill z for the abutment with countermeasure #3 (extended wings): (a) t = 20.0 s; (b) t = 25.0 s; (c) t = 30.0 s; (d) t = 100.0 s (final).
Figure 18.
Elevation of the surface of the backfill z for the abutment with countermeasure #3 (extended wings): (a) t = 20.0 s; (b) t = 25.0 s; (c) t = 30.0 s; (d) t = 100.0 s (final).

Figure 19.
Backfill erosion around the abutment with countermeasure #4 (wall, foot protection, and extended wings) (left panel: 3D view; right panel: cross-sectional view at y = 0.095 m): (a) t = 0.0 s (initial); (b) t = 11.0 s; (c) t = 11.3 s; (d) t = 11.9 s; (e) t = 14.8 s; (f) t = 23.0 s; (g) t = 100.0 s (final).


Figure 20.
Final elevation of the surface of the backfill z for the abutment with countermeasure #4 (wall, foot protection, and extended wings).
Figure 20.
Final elevation of the surface of the backfill z for the abutment with countermeasure #4 (wall, foot protection, and extended wings).


Table 1.
Parameters of the sand bed and backfill.
| Parameter | Value |
|---|---|
| Median grain size | 0.2 mm |
| Density of sand particles | 2.65 × 10³ kg/m3 |
| Porosity | 0.40 |
| Critical Shields parameter for horizontal bed [13] | 0.0640 |
| Settling velocity of sand particles [14] | 26.9 mm/s |
| Static friction angle | 45.01° |
| Kinematic friction angle | 27.00° |
| Angle of repose | 45.00° |
| Criterion for starting a sand slide | 0.00° |
| Criterion for ending a sand slide | 0.01° |
| Groundwater level | z = 0.10 m |
| Saturation above the groundwater level | 28.8% |
| Residual saturation | 13.5% |
| Shape parameter α in the van Genuchten equation | 0.28 kPa−1 |
| Shape parameter n in the van Genuchten equation | 12.898 |
Table 2.
Values related to the sediment transport.
| Variable | Meaning | Unit |
|---|---|---|
| qxy | Bedload sediment transport per unit width and unit time | m3/m/s |
| qz | Difference between sediment pickup qp and settlement qs per unit area and unit time (i.e., qz = qp − qs) | m3/m2/s |
| τ* | Shields parameter | - |
| τ*c | Critical Shields parameter | - |
Publisher’s Note: MDPI stays neutral with regard to jurisdictional claims in published maps and institutional affiliations. |
© 2021 by the authors. Licensee MDPI, Basel, Switzerland. This article is an open access article distributed under the terms and conditions of the Creative Commons Attribution (CC BY) license (https://creativecommons.org/licenses/by/4.0/).
Share and Cite
MDPI and ACS Style
Nakamura, T.; Sugiyama, C.; Cho, Y.-H.; Mizutani, N. Mechanism of Tsunami-Induced Erosion of Bridge-Abutment Backfill and Its Countermeasures. Water 2021, 13, 3529. https://doi.org/10.3390/w13243529
AMA Style
Nakamura T, Sugiyama C, Cho Y-H, Mizutani N. Mechanism of Tsunami-Induced Erosion of Bridge-Abutment Backfill and Its Countermeasures. Water. 2021; 13(24):3529. https://doi.org/10.3390/w13243529
Chicago/Turabian StyleNakamura, Tomoaki, Chisato Sugiyama, Yong-Hwan Cho, and Norimi Mizutani. 2021. "Mechanism of Tsunami-Induced Erosion of Bridge-Abutment Backfill and Its Countermeasures" Water 13, no. 24: 3529. https://doi.org/10.3390/w13243529
Note that from the first issue of 2016, this journal uses article numbers instead of page numbers. See further details here.