
Analysis and Prediction of Sustainable Utilization of Water Resources in Chengde City Based on System Dynamics Model


1
School of Environmental Science and Engineering, Shandong University, Jinan 250100, China
2
School of Environment, Beijing Normal University, Beijing 100875, China
3
Foreign Environmental Cooperation Center, Ministry of Ecology and Environment, Beijing 100035, China
*
Author to whom correspondence should be addressed.
Water 2021, 13(24), 3534; https://doi.org/10.3390/w13243534
Submission received: 10 November 2021
/
Revised: 6 December 2021
/
Accepted: 6 December 2021
/
Published: 10 December 2021
(This article belongs to the Special Issue Advanced Research on Sustainable Water Resources Management and Planning under Climate Change)
Abstract
:In addition to the social economy and the rapid development of industry and agriculture, water demand is increasing and poses challenges in the over-exploitation of water resources. This research establishes a model to assess the sustainable exploitation of water resources based on system dynamics theory and STELLA software, which solves the imbalanced allocation of industrial water, agricultural water and domestic water. The model is composed of two parts: the water quantity system (including economy, population, water availability and water demand) and the water quality system (composed of the aquatic environment), which is suitable for Chengde City with a water resource shortage. The proposed model is established by data of Chengde City from 2007 to 2016 and is verified by 2017 data. Furthermore, in order to compare the water quality and water utilization of Chengde City under different development scenarios up to 2025, the sensitivity analysis of each variable (e.g., population) is carried out in this model, and thereby the water resource utilization scenarios are acquired. Specifically, four scenarios are designed and denoted: Scenario 1: keeping the status quo unchanged, Scenario 2: slowing down economic development and devoting more energy to environmental protection, Scenario 3: only focusing more on economic development and Scenario 4: aiming at steady and rapid economic growth and an eco-friendly environment. The results shows that Scenarios 2 and 3 facilitate high-effective water resource utilization compared with the current development, Scenario 1. Scenario 4 fosters the balance of water resources supply–demand in the future and preserves the water quality. This study provides an inspiring method for realizing the sustainable utilization and optimizing allocation of water resources in Chengde City.
1. Introduction
Water is crucial for human societal survival and development. Rapid economic growth has resulted in increasingly prominent water resource challenges. Water deficits seriously restrict the advancement of the social economy and even threaten the safety of drinking water for humans [1].
System dynamics (SD) was developed in 1956, using the system of scientific thought that all systems must have a structure that determines the function of the system, based on the feedback features of the internal system components as a result of each other. SD was derived from the system’s internal structure to find the root of the problem on the basis of the system’s internal elements of causal feedback characteristics, rather than external interference or random events to define the performance of the system [2]. At present, SD has been broadly employed in the study of sustainable advancement [3]. Within water resource management and sustainable water resource utilization, the water supply–demand balance and responses of water resources to the population and climate are widely applied [4]. Xu et al. adopted a systems dynamics method based on an object-oriented system to expand a water resource system model in the Yellow River Basin and evaluated the sustainability of the water resources system in the study area [5]. Srijana and Sajjad adopted the system dynamics model to study the influence of climate condition change and population growth on water resources in the semi-arid area of southern Nevada, which promoted the sustainable advancement of water resources through combining pricing policies and water saving [6]. Sušnik et al. established a system dynamics model for the water-deficient Kailouan region to evaluate the possible effect of water shortage and social–economic policies on complicated hydrological systems [7]. Mahdi Zarghami et al. employed the system dynamics approach to account for potential sources of water supply, water demand and management tools, and determined their impact on water scarcity based on their price differences. The influence of expanding a wastewater network on groundwater resources was further analyzed [8]. S.S. Dai et al. established a system dynamics model based on an object-oriented system to simulate the decision-making process of water resource exploration, thus capturing the relationship between water resource availability and the water demand evoked by industrial, agricultural production and population growth [9]. Sajjad Ahmad et al. combined a geographic information system (GIS) with system dynamics for developing the novel spatial system dynamics (SSD) method to simulate the temporal and spatial dynamic processes based on feedback, which provided one modeling framework for developing models that differ conceptually. In addition, complex feedback-based dynamic processes can be modeled in space and time [10].
The main challenge for optimizing the water resources allocation in a region is the uneven distribution of the water supply and demand [11]. In order to address this challenge, Qin Huanhuan et al. build a sustainable water resource utilization model based on the STELLA software [12]. The STELLA software can deal with dynamic, nonlinear, and complex high-order problems by interactively simulating the system dynamics diagram [13,14]. Their model includes five subsystems, i.e., population system, industrial and tertiary systems, agricultural subsystem, water resources subsystem and water environment subsystem, which are applied to a water shortage city named Longkou in China. Furthermore, they have established another model to evaluate the supply and demand of water resources in Longkou City by using the total water demand, water shortage, gross domestic product (GDP) and chemical oxygen demand (COD) emissions as indicators. On the basis of this, they propose solutions to the water scarcity problem in the future development of Longkou. Wei Tong et al. have applied the system dynamics software STELLA to develop a water supply and demand system model to simulate the dynamic interactions between urban water demands and society, economy, climate, and water conservation in Macao [15]. Wang Binglong et al. have proposed an integrated approach by imprecise optimization modeling and orthogonal experimental design. Their mode is used for water resource management under uncertain conditions, e.g., the randomness in water availability and so on. They utilize the system dynamics software STELLA modeling and combine with imprecise two-stage stochastic planning and confidence constrained planning. In this manner, they succeed to obtaining optimal solutions to support water resources allocation from multiple sources to quite a number of users in Dalian city over multiple years [16]. However, most of the current investigation ignores the risk of water pollution caused by industry, agriculture, etc. due to the underdevelopment economy. The varied water quality is not considered in the model which reduces the reliability of the water allocations in practice.
In order to address the above-mentioned problems, a systematic dynamic model of the sustainable water resource utilization is established for describing the law of water supply and demand changes in Chengde from 2017 to 2025. In this paper, Chengde City, China, is chosen to establish a water resource sustainable utilization model consisting of water quality and water quantity, including economy, subsystems of population, and water supply and demand. We use this model to simulate the water resource supply and demand system of Chengde City and to analyze variables with a large effect on water supply and demand. Furthermore, by adjusting these variables, the supply and demand of water quantity and quality are simulated and predicted in the future. On this basis, the corresponding scheme is proposed to act as a reference for reducing water resource shortage and determining the optimal water resources allocation in Chengde City, and feasible suggestions are also proposed for the logical management and planning of Chengde City’s water resources to attain the sustainable utilization of water resources.
2. Research Methods
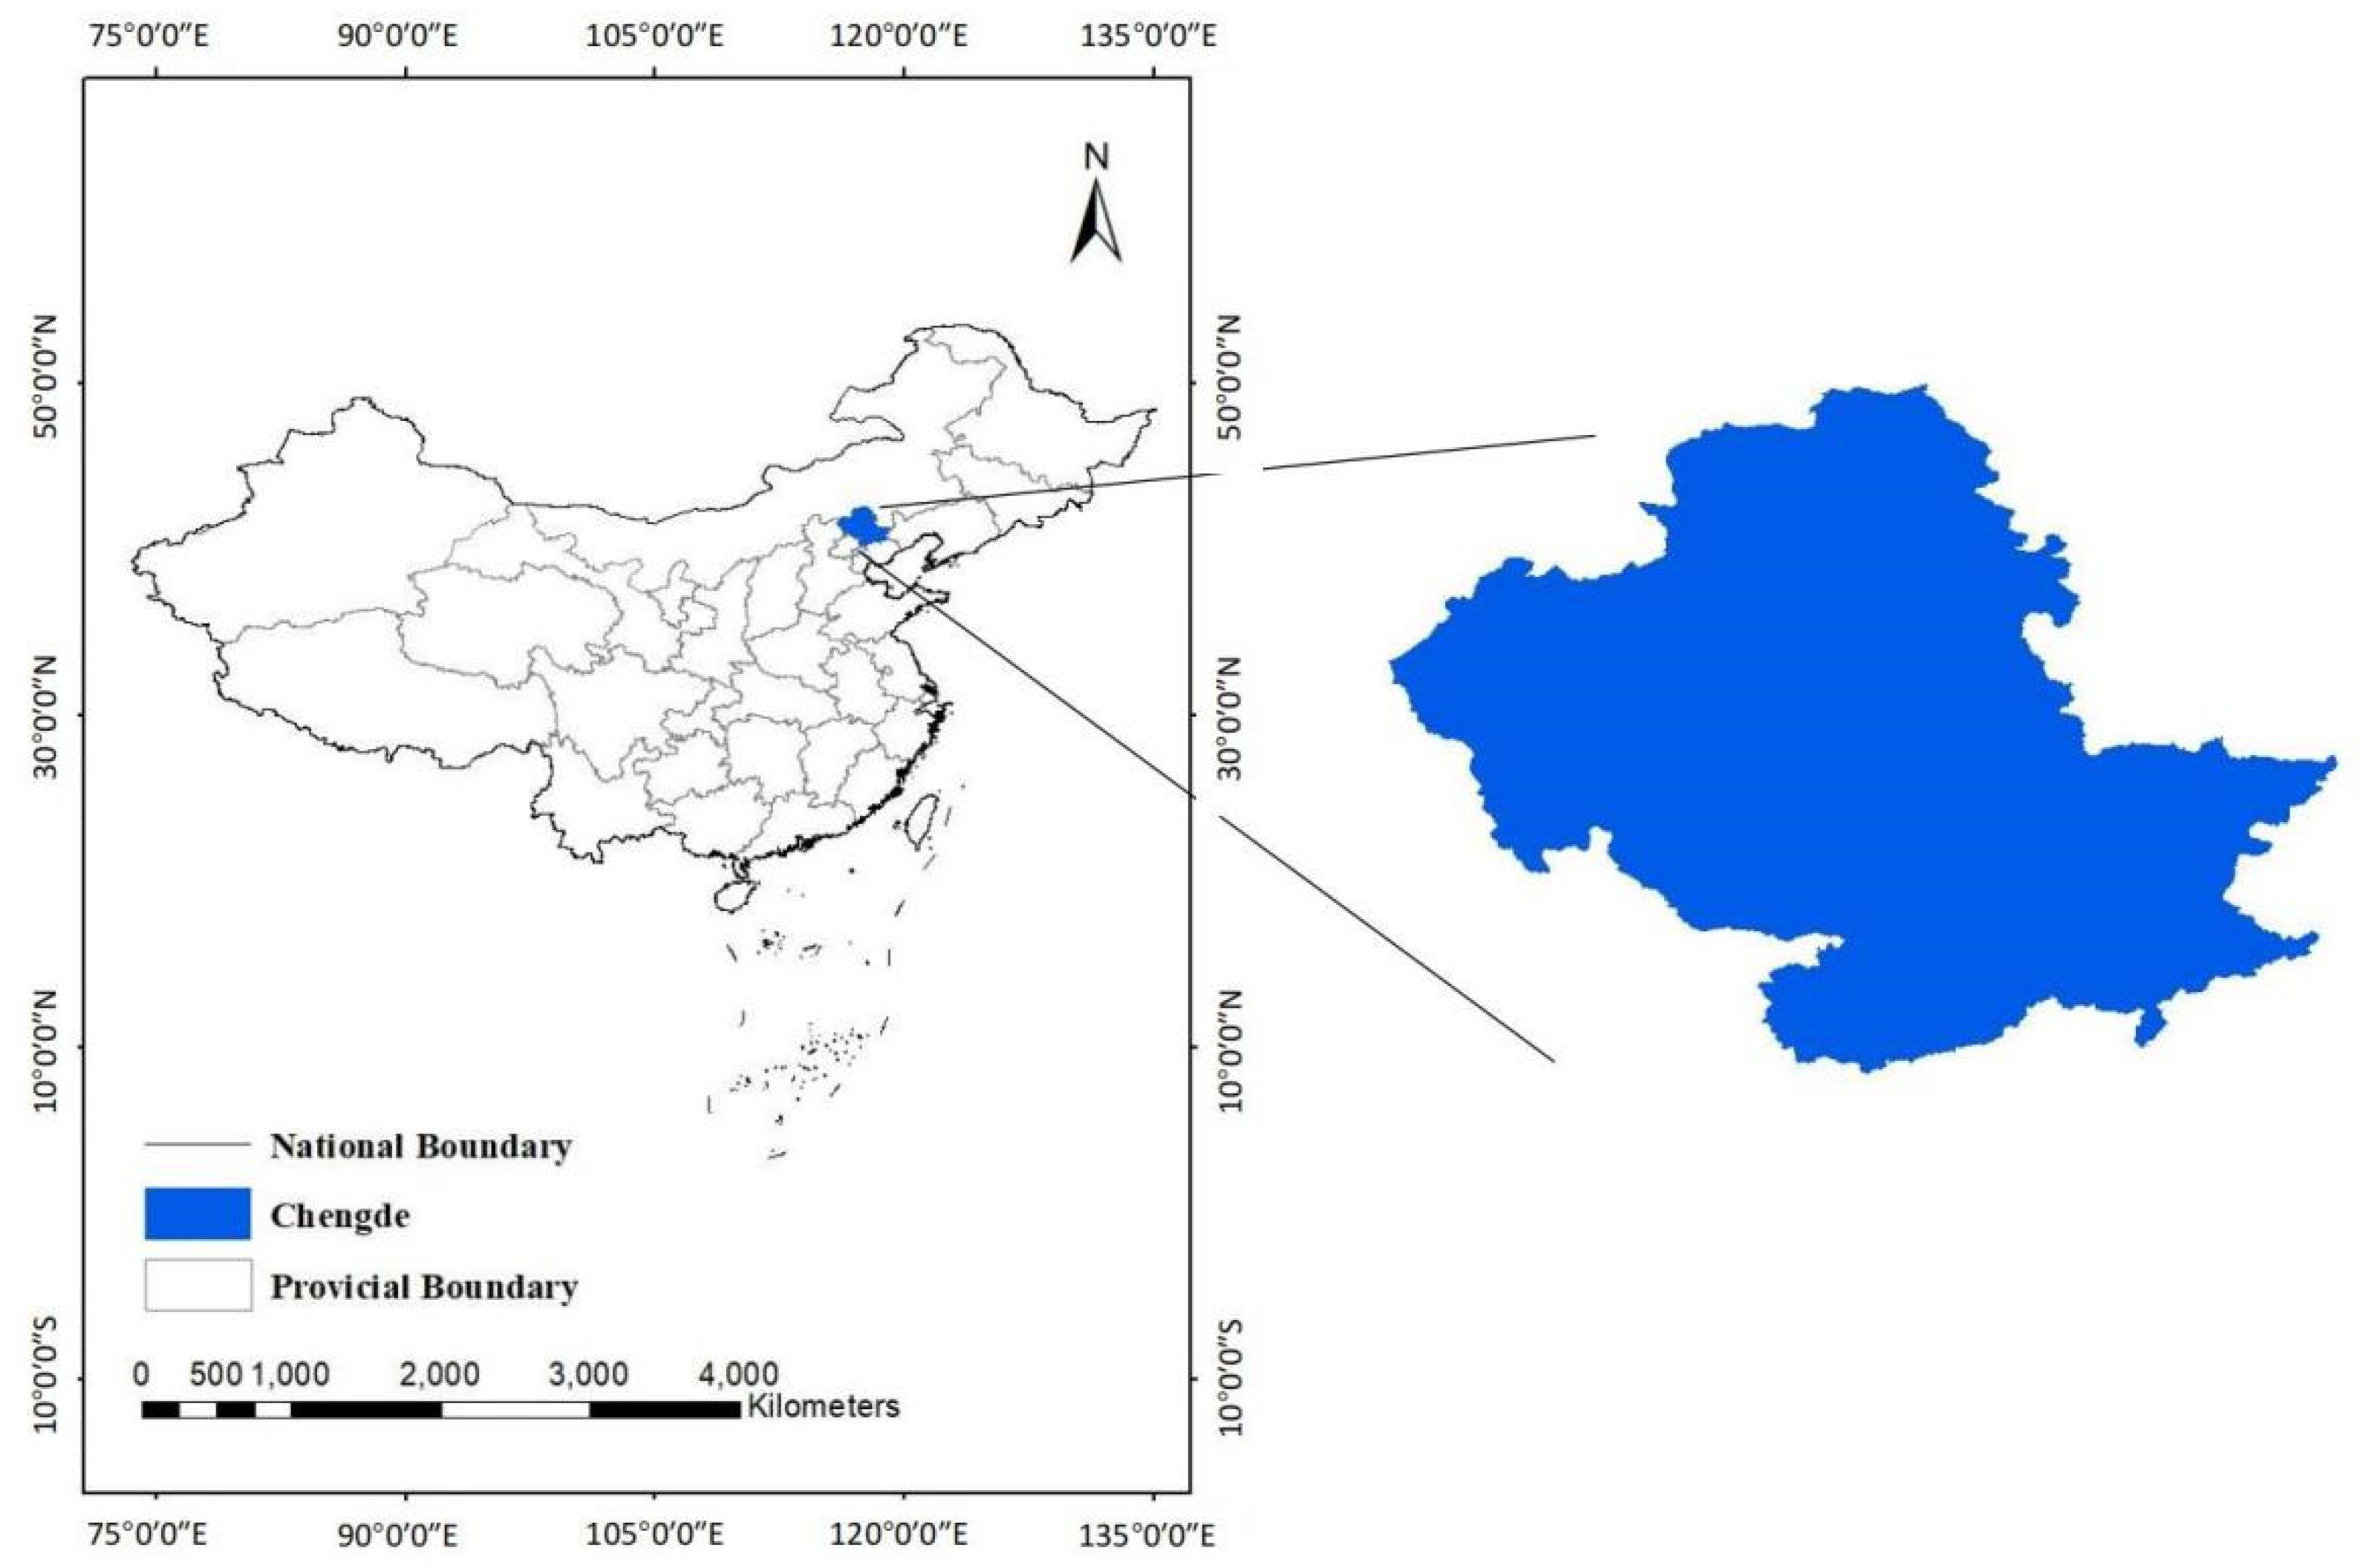
2.1. Research Area
Water resources of Chengde (as shown in Figure 1) are relatively scarce due to insufficient capacity for local water supplies and uneven allocation that the water resources are mostly distributed on the edge of the city, being remote from the water demands. Furthermore, it is obvious in Appendix A Table A1 that the total population is growth steady, which causes the increasing of the water demands. For example, the total population reached 3,833,000 in 2016, an increase of 44.7‰ compared to 2007. Besides, with the industrial water requiring extra purification approach to reduce the risk of water pollution and continual development of the living standards of Chengde City, the consumption of water has been increasing year by year. However, the water supply of Chengde City has not increased, but rather has decreased over time. For example, the total water supply was approximately 8.9312 billion m3 in 2016, a mean decrease of 9.2% over 2007. Groundwater resources were 5.0450 billion m3, an average decrease of 14.1% over 2007. (The above data are listed in Table A1 in Appendix A at the end of the text). Moreover, it is found in Table A1 of Appendix A that the sustainable recycling supply of the water resources needs to be further improved.
The average precipitation of Chengde in the past 20 years was approximately 534 mm. The city’s average multi-year water resources are 3.5 billion cubic meters, but the available water resources per capita is 765 m3, which is lower than the international water scarcity standard of 1000 m3 per capita. Furthermore, the agricultural water intensively appears in April-May, but this period normally suffers from drought. On the contrary, the precipitation during the year is mainly concentrated in the flood season between July and August, which accounts for 70% to 80% of the annual precipitation [11].
2.2. Data and Processing
The study area of the present research is Chengde City, and the simulation period is between 2007 to 2025, and the base year is 2007. The data employed in the present survey are from Chengde Yearbook, Chengde Environmental Quality Bulletin, Chengde Water Resources Bulletin, Chengde National Economic and Social Development Statistical Bulletin and Chengde Environmental Statistical Annual Report, etc.
The selection and evaluation of data allow the division of criteria into the initial value of state variable, constant value and table function value corresponding to different parameter properties. Appendix A Table A1 summarizes the raw data. Problems such as data source collection and division will inevitably lead to some missing values, but the goal of this paper is to simulate future trends based on existing data such that the method of use will be avoided in order to improve the accuracy of results [17].
2.3. Methods
The paper mainly concentrates on a system for the sustainable exploitation of urban water resources, which involves two major factors: water quantity and water quality. Furthermore, the above two factors should be classified into the system as subsystems to strengthen the accuracy of this research. To elaborate, the water quantity subsystem should include economic, supply–demand, and population factors. The two most important and common pollutants, i.e., biochemical oxygen demand and ammonia nitrogen contaminants, are selected as the assessment indices for the water quality subsystem. These two elements can lay the foundation for establishing the system dynamics model of sustainable water resource utilization in Chengde City.
Before the system dynamics model is defined, the system analysis of the research object is first conducted to determine the modeling objectives, subsequently, the system boundary and each variable of the system is determined according to the system dynamics principles and methods based on the modeling objectives. Furthermore, the variables are categorized into state variables, rate variables and auxiliary variables according to the system element properties [18]. Figure 2 shows a schematic diagram of modelling the water allocations in Chengde City. First, we collect data on water resources, population, economy, and water environment in Chengde city and processed the data of each of the four aspects in a comprehensive and detailed way according to the research subjects. Secondly, we define and build the model according to the system dynamics principle. Finally, we analyze the results of the model runs and propose water allocation recommendations. The main procedures include three parts: (i) data collection: demographic, water resources, economic, and water environment data; (ii) mode establishment: water supply, water demand, population, economic, and water environment system; (iii) water allocation strategies: water conservation, industrial structure adjustment, even level source, and scientific management.
2.3.1. Study Area System Definition
Based on the characteristics of the current water resource exploitation in Chengde City and the accuracy and availability of data from the related information, the interrelationships among diverse parameters affecting the sustainable utilization of water resources are scrutinized [19], and the model system boundary is ascertained as the whole of Chengde City, including eight counties of Weichang County, Fengning County, Luanping County, Longhua County, Chengde County, Pingquan County, Xinglong County, Kuancheng County, Shuangqiao District, Shuangluan District, Yingzi District and three municipal districts. STELLA, as a special modeling software for system dynamics, is used to establish the water resource system dynamics flow diagram of Chengde, which contains the two water quantity and quality subsystems. The water system comprises four sub-modules, namely, population, industry, agriculture, water resource supply, and water resource demand, which are interrelated and mutually influenced.
2.3.2. Modeling
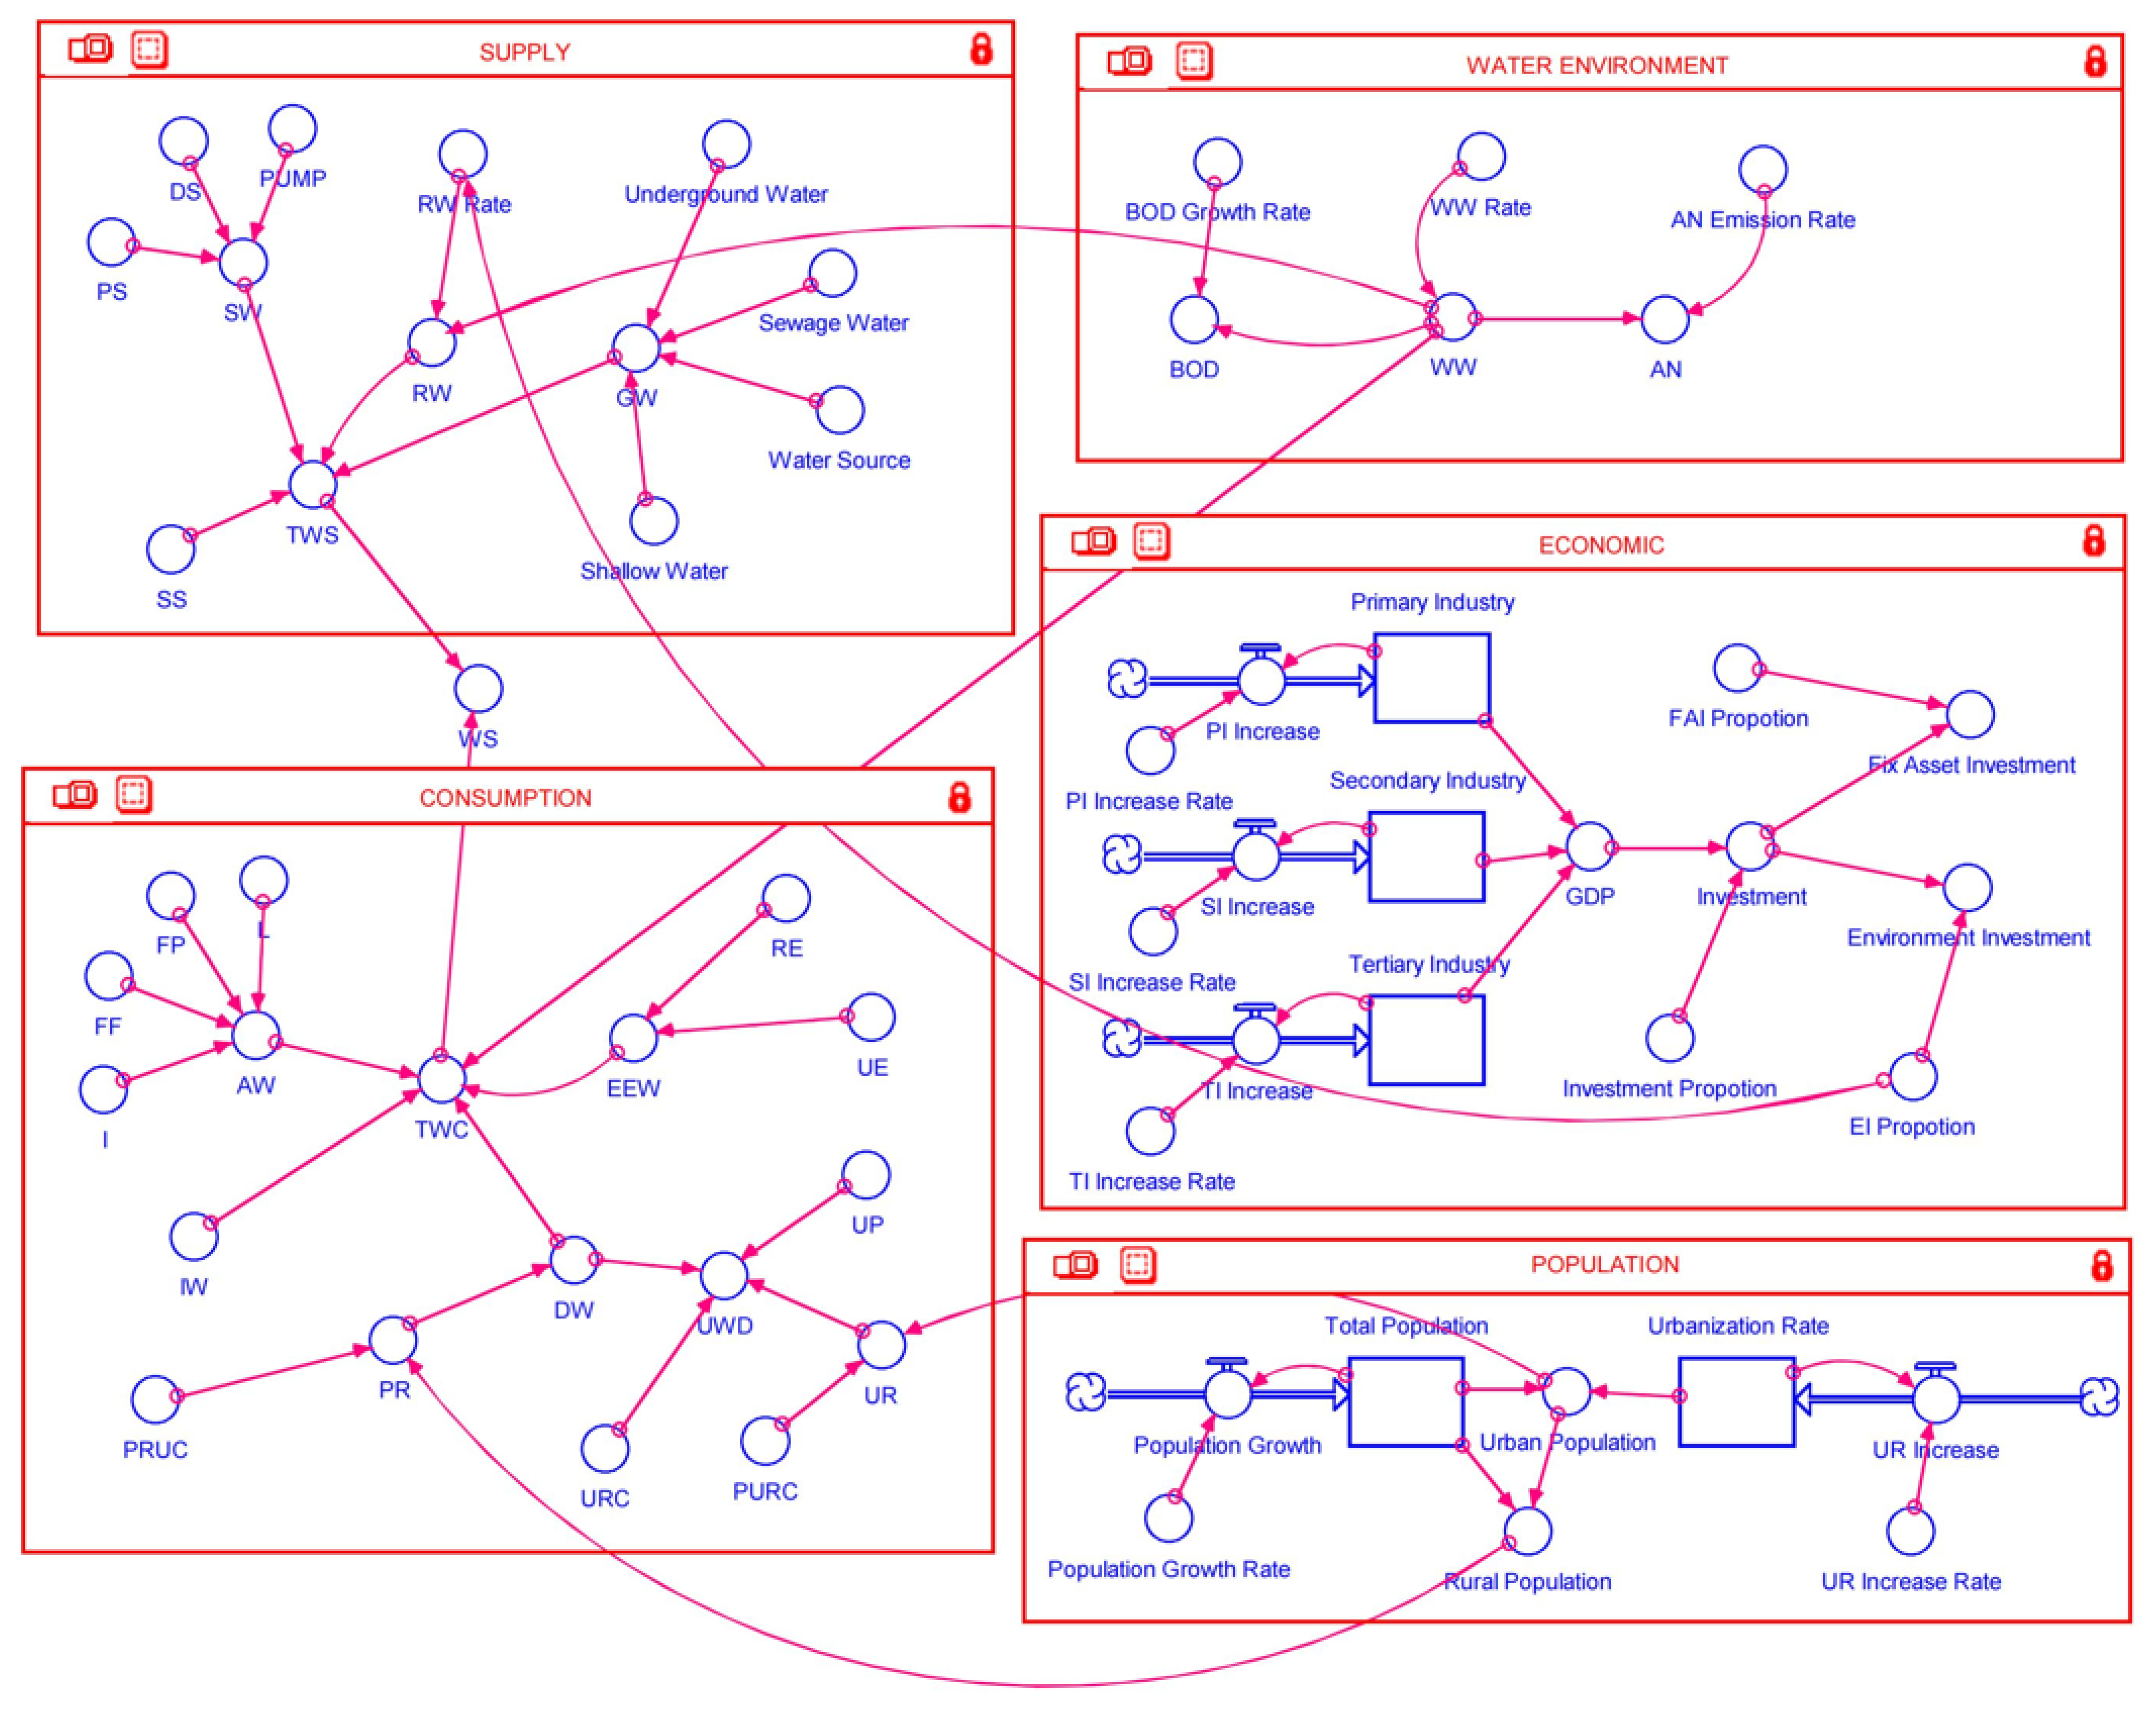
Causality analysis is a qualitative analysis of the system. It allows the initial construction of the main structure of the system dynamics model and further defines the functional relationships between the system variables, thus forming the basis of the system operation [20]. This system dynamics model is based on the administrative boundary of Chengde City as the model boundary, with a time scale of 2007 to 2016 and a time step of 1 year. The simulation period is from 2021 to 2025 with a time step of 1 year, and the year 2007 is used as the base year. This model is established by the distribution of water resources and water demand in Chengde City and is composed of five sub-system models: (i) population subsystem; (ii) economic subsystem; (iii) water supply subsystem; (iv) water demand subsystem; (v) water environment system. According to the relationship between subsystems, the system is simulated using the STELLA software package, and the overall model structure is obtained as shown in Figure 3.
- Population subsystem
The population subsystem mainly examines the influence of a changing population on water resources, the environment, and the economy. Indicators of the change in population include total population and the rate of population growth. Issues such as the rural and urban populations and the rate of urbanization mainly reflect population distribution and urban progress.
The total population is chosen as the flow variable of the population subsystem. As shown in Figure 4, its stock is primarily influenced by the mortality rate, birth rate, and in-migration and out-migration. The total population comprises the rural and urban populations, with differences between urban and rural populations in terms of domestic water demand and wastewater discharge, and the urbanization process will increase the water demand. Therefore, it is essential to introduce the urbanization rate into the population subsystem to correlate the population subsystem with several other subsystems to make the data more accurate.
In the population subsystem, total population is the state variable (a set of variables that fully describe the motion system), the increase in population is the rate variable (a variable used to indicate how fast the cumulative effect changes), and the remaining variables are auxiliary variables.
The population subsystem structure is illustrated in Figure 4 and the variables are shown in Table 1.
- 2.
- Economy subsystem
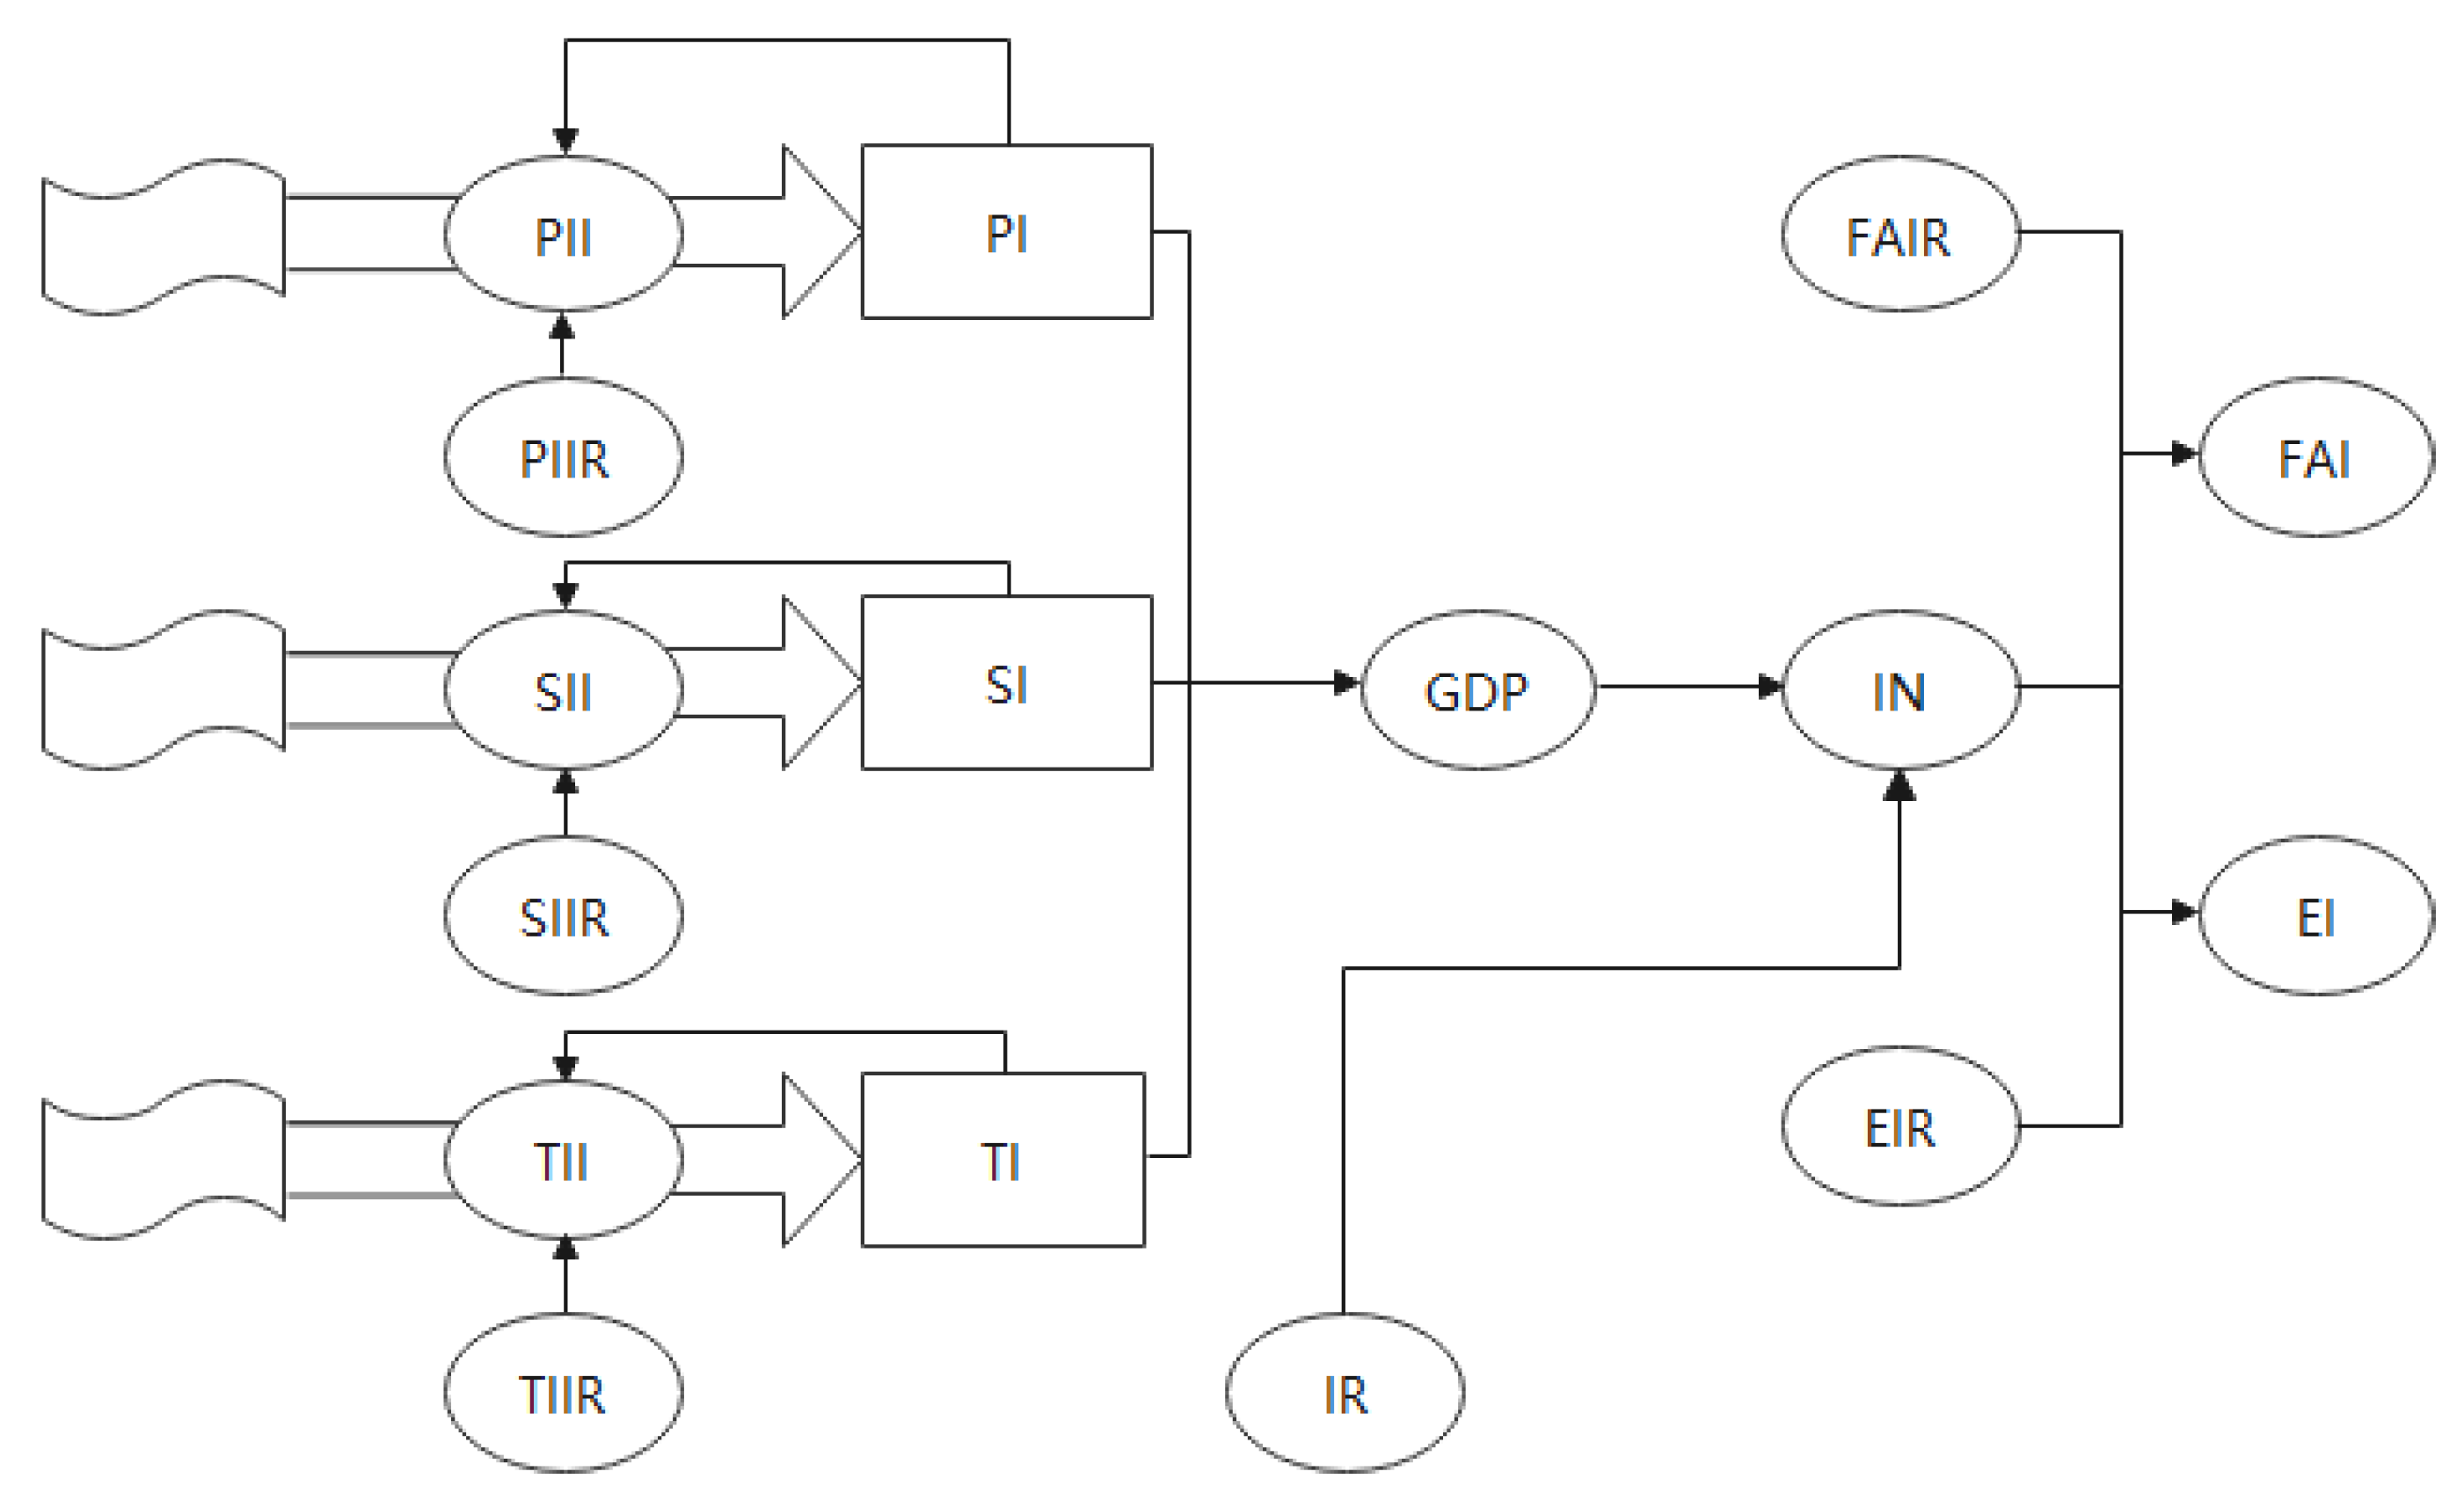
The economic subsystem focuses on the influence of changes in the growth of the economy on water resources, the environment, and the population. The growth of the economy is analyzed by taking the growth of the industrial economy as an example: it will enhance the amount of water used by industry, thus deepening the water resources supply–demand imbalance, while the waste gas, wastewater and waste residue produced by industry will cause serious pollution to water resources if they are discharged without reasonable treatment. However, growth in the economy can also improve the technology used in production, augment the rate of industrial water reuse, and subsequently facilitate industrial advancement.
The agricultural and industrial economies show similar development. The development of the agricultural economy will enhance the sown area of crops, which will induce the overall arable land area to change, making some changes in the amount of irrigation water, while the discharge of wastewater will also increase. However, improving the yield per unit area requires the increased application of pesticides and chemical fertilizers, which will cause more serious land pollution. However, economic growth can also promote the innovation of agricultural technology, and the new technology will further promote the development of agriculture [21].
Therefore, investment in environmental conservation should be increased concurrently with economic development. A focus on economic development only while ignoring environmental pollution is not only inconsistent with the concept of green ecological development but will also hinder the sustainable advancement of the economy. The state variables in the economic subsystem are GDP and total industrial water utilization. Meanwhile, the rate variables are the increases in GDP and industrial water utilization, whereas the remaining variables are auxiliary variables [22].
The structure of the economic subsystem is illustrated in Figure 5 and the variables are shown in Table 2.
- 3.
- Water supply subsystem
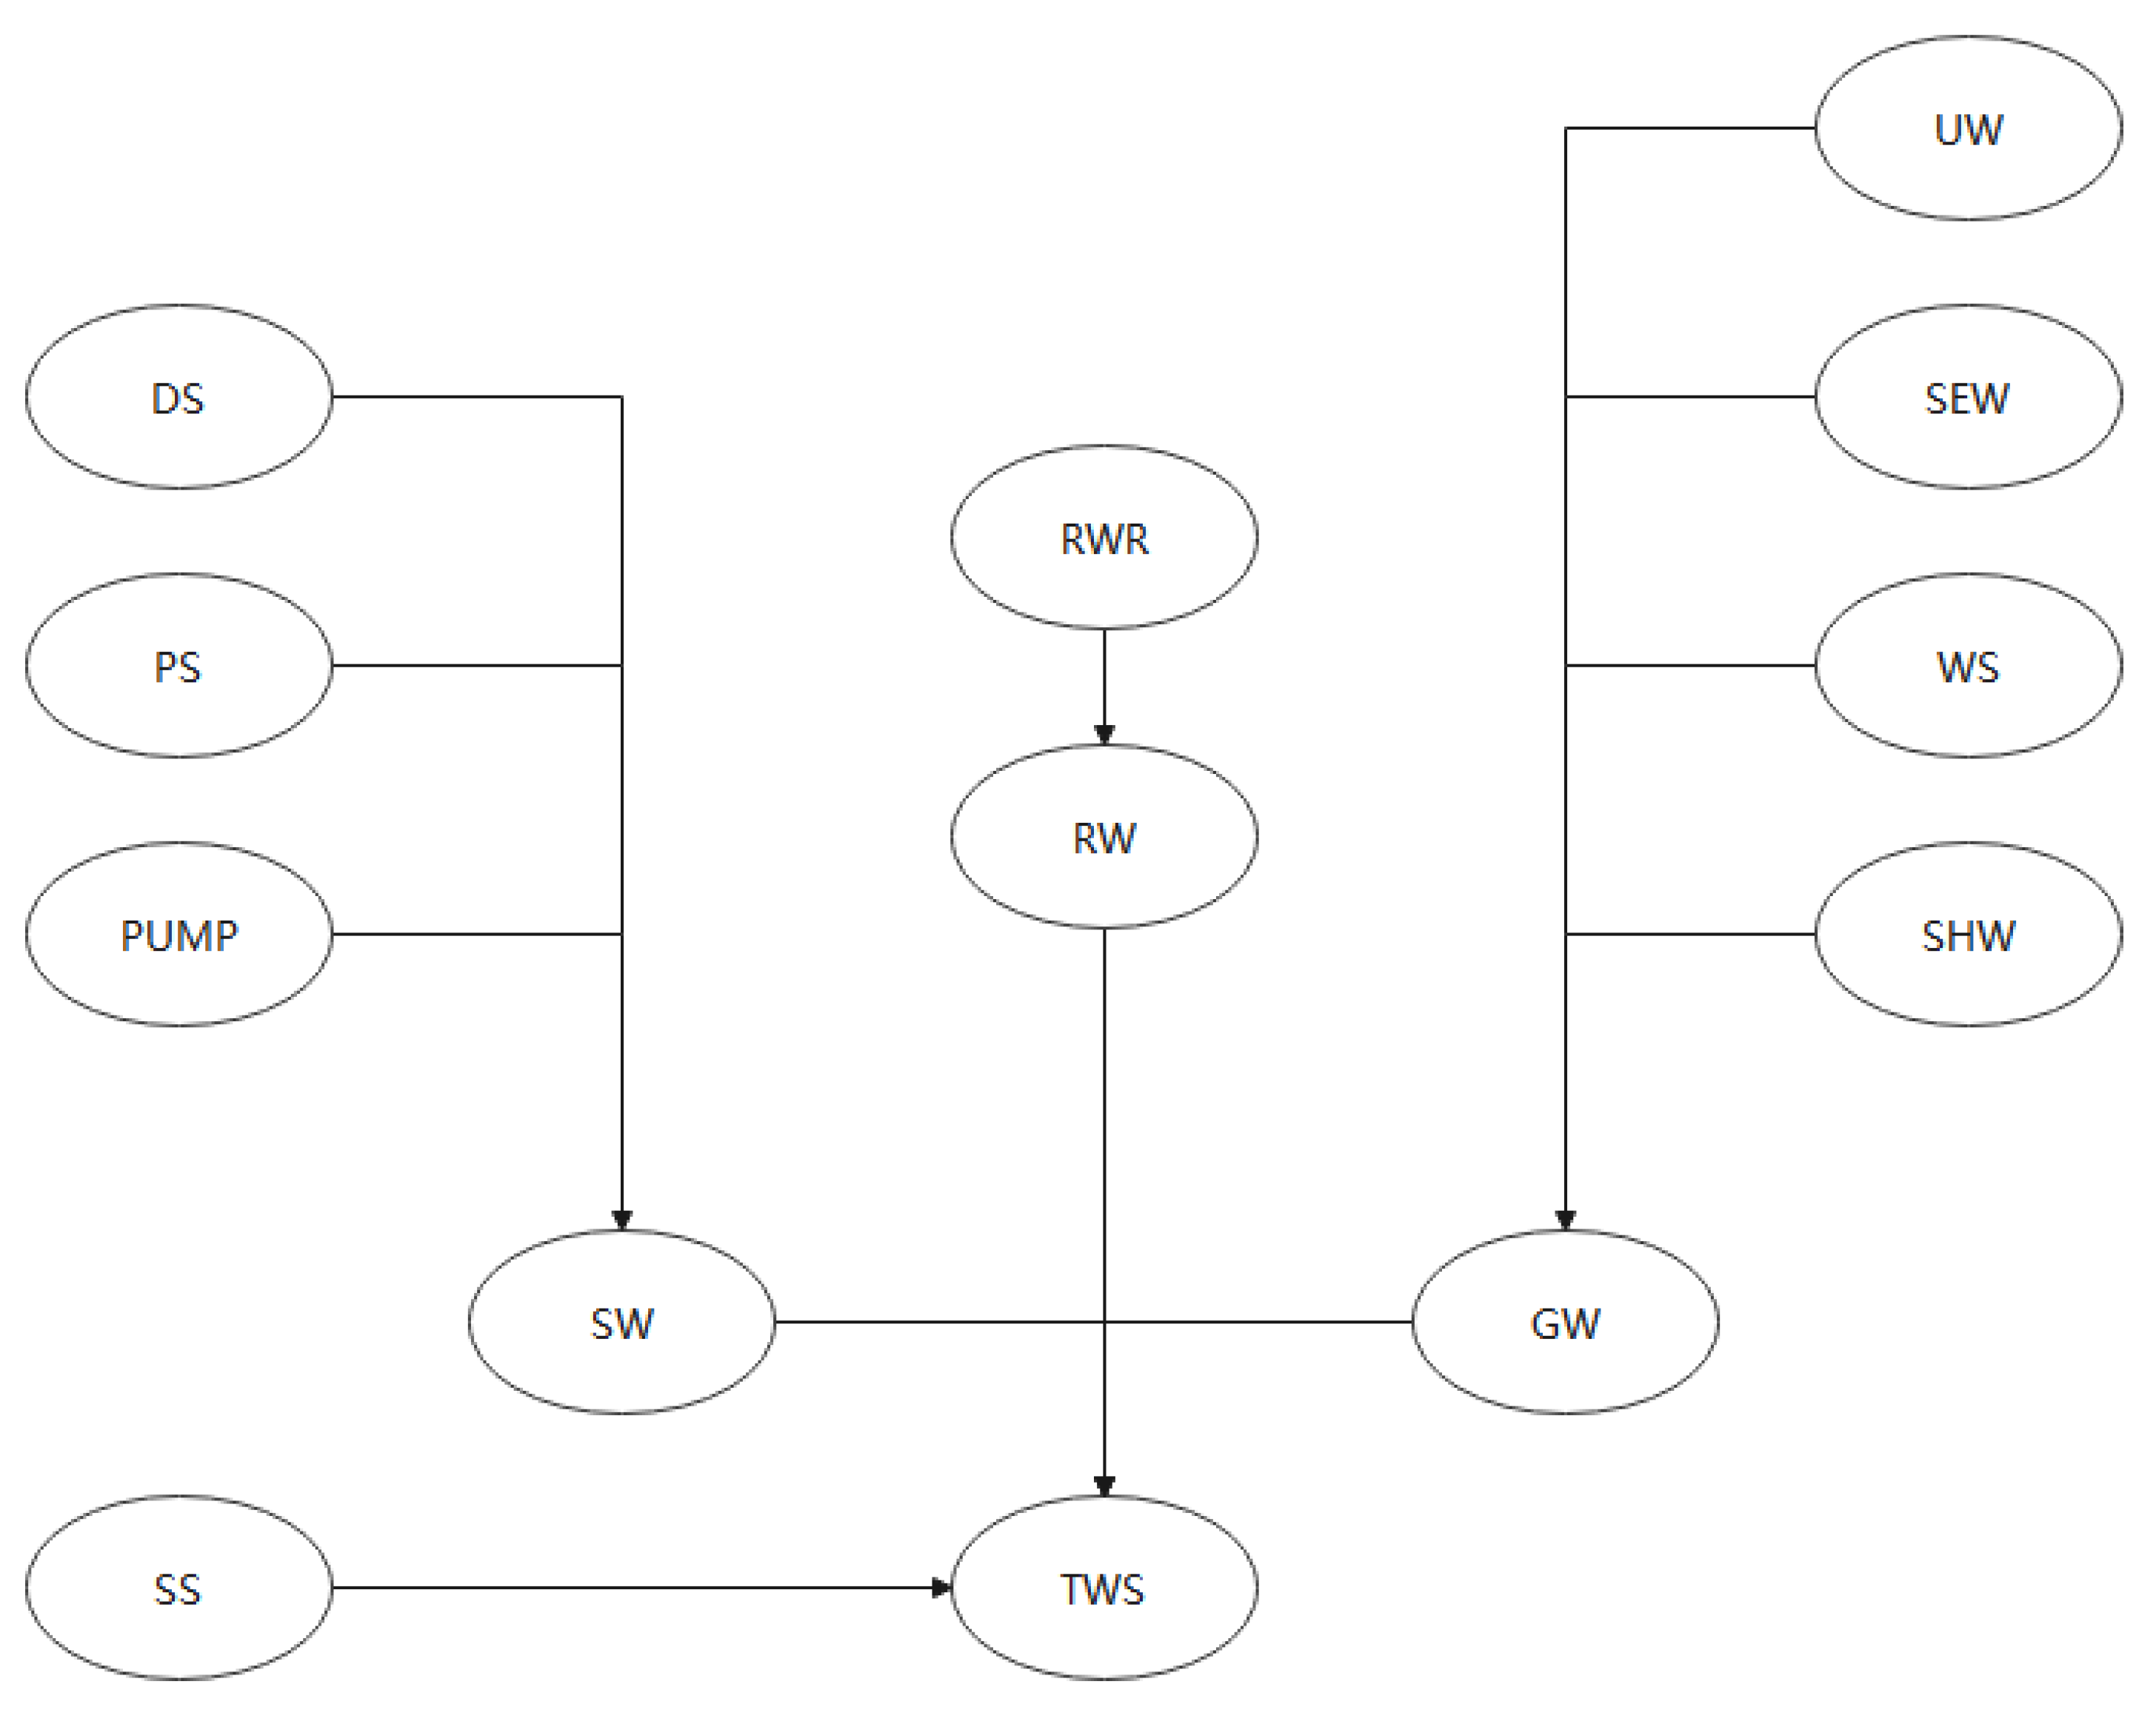
The water resource supply subsystem mainly examines the general trend of domestic, industrial, agricultural and ecological water supply and demand trends. The influence of the water resource system on the population, economy and environment systems is discussed. The water resource supply subsystem comprises four components: groundwater, surface water, seawater desalination, and re-use of sewage. The direct exploitation of sea water is counted separately and excluded from total water supply.
Surface water comprises mainly two parts. The first is local surface water and inbound water, the main uses of which included for agricultural irrigation, forest and fruit water, livestock water, fishpond water and ecological water. The second is the water consumption obtained through some projects, which is the main water source for urban life, industry and urban ecology. The water supply of underground water sources includes shallow water and deep water.
The amount of reuse of treated wastewater refers to the amount of reuse after centralized treatment in the wastewater treatment plant. This excludes the excluding the quantity of reused treated wastewater within the enterprise. The treated wastewater is mainly applied in agriculture and ecology, where the deeply treated wastewater is mainly utilized for industrial production. The regression analysis of the rate of investments in environmental protection and the rate of wastewater reuse was performed by using a mathematical computer program. The rate of sewage reuse could be estimated on the basis of the current year’s environmental protection investment rate, and the greater the environmental protection investment rate, the greater the sewage reuse rate. The desalinated water supply is the quantity of freshwater produced from seawater after desalination.
The structure of the water resource supply subsystem is illustrated in Figure 6 and the variables are shown in Table 3.
- 4.
- Water resource demand subsystem
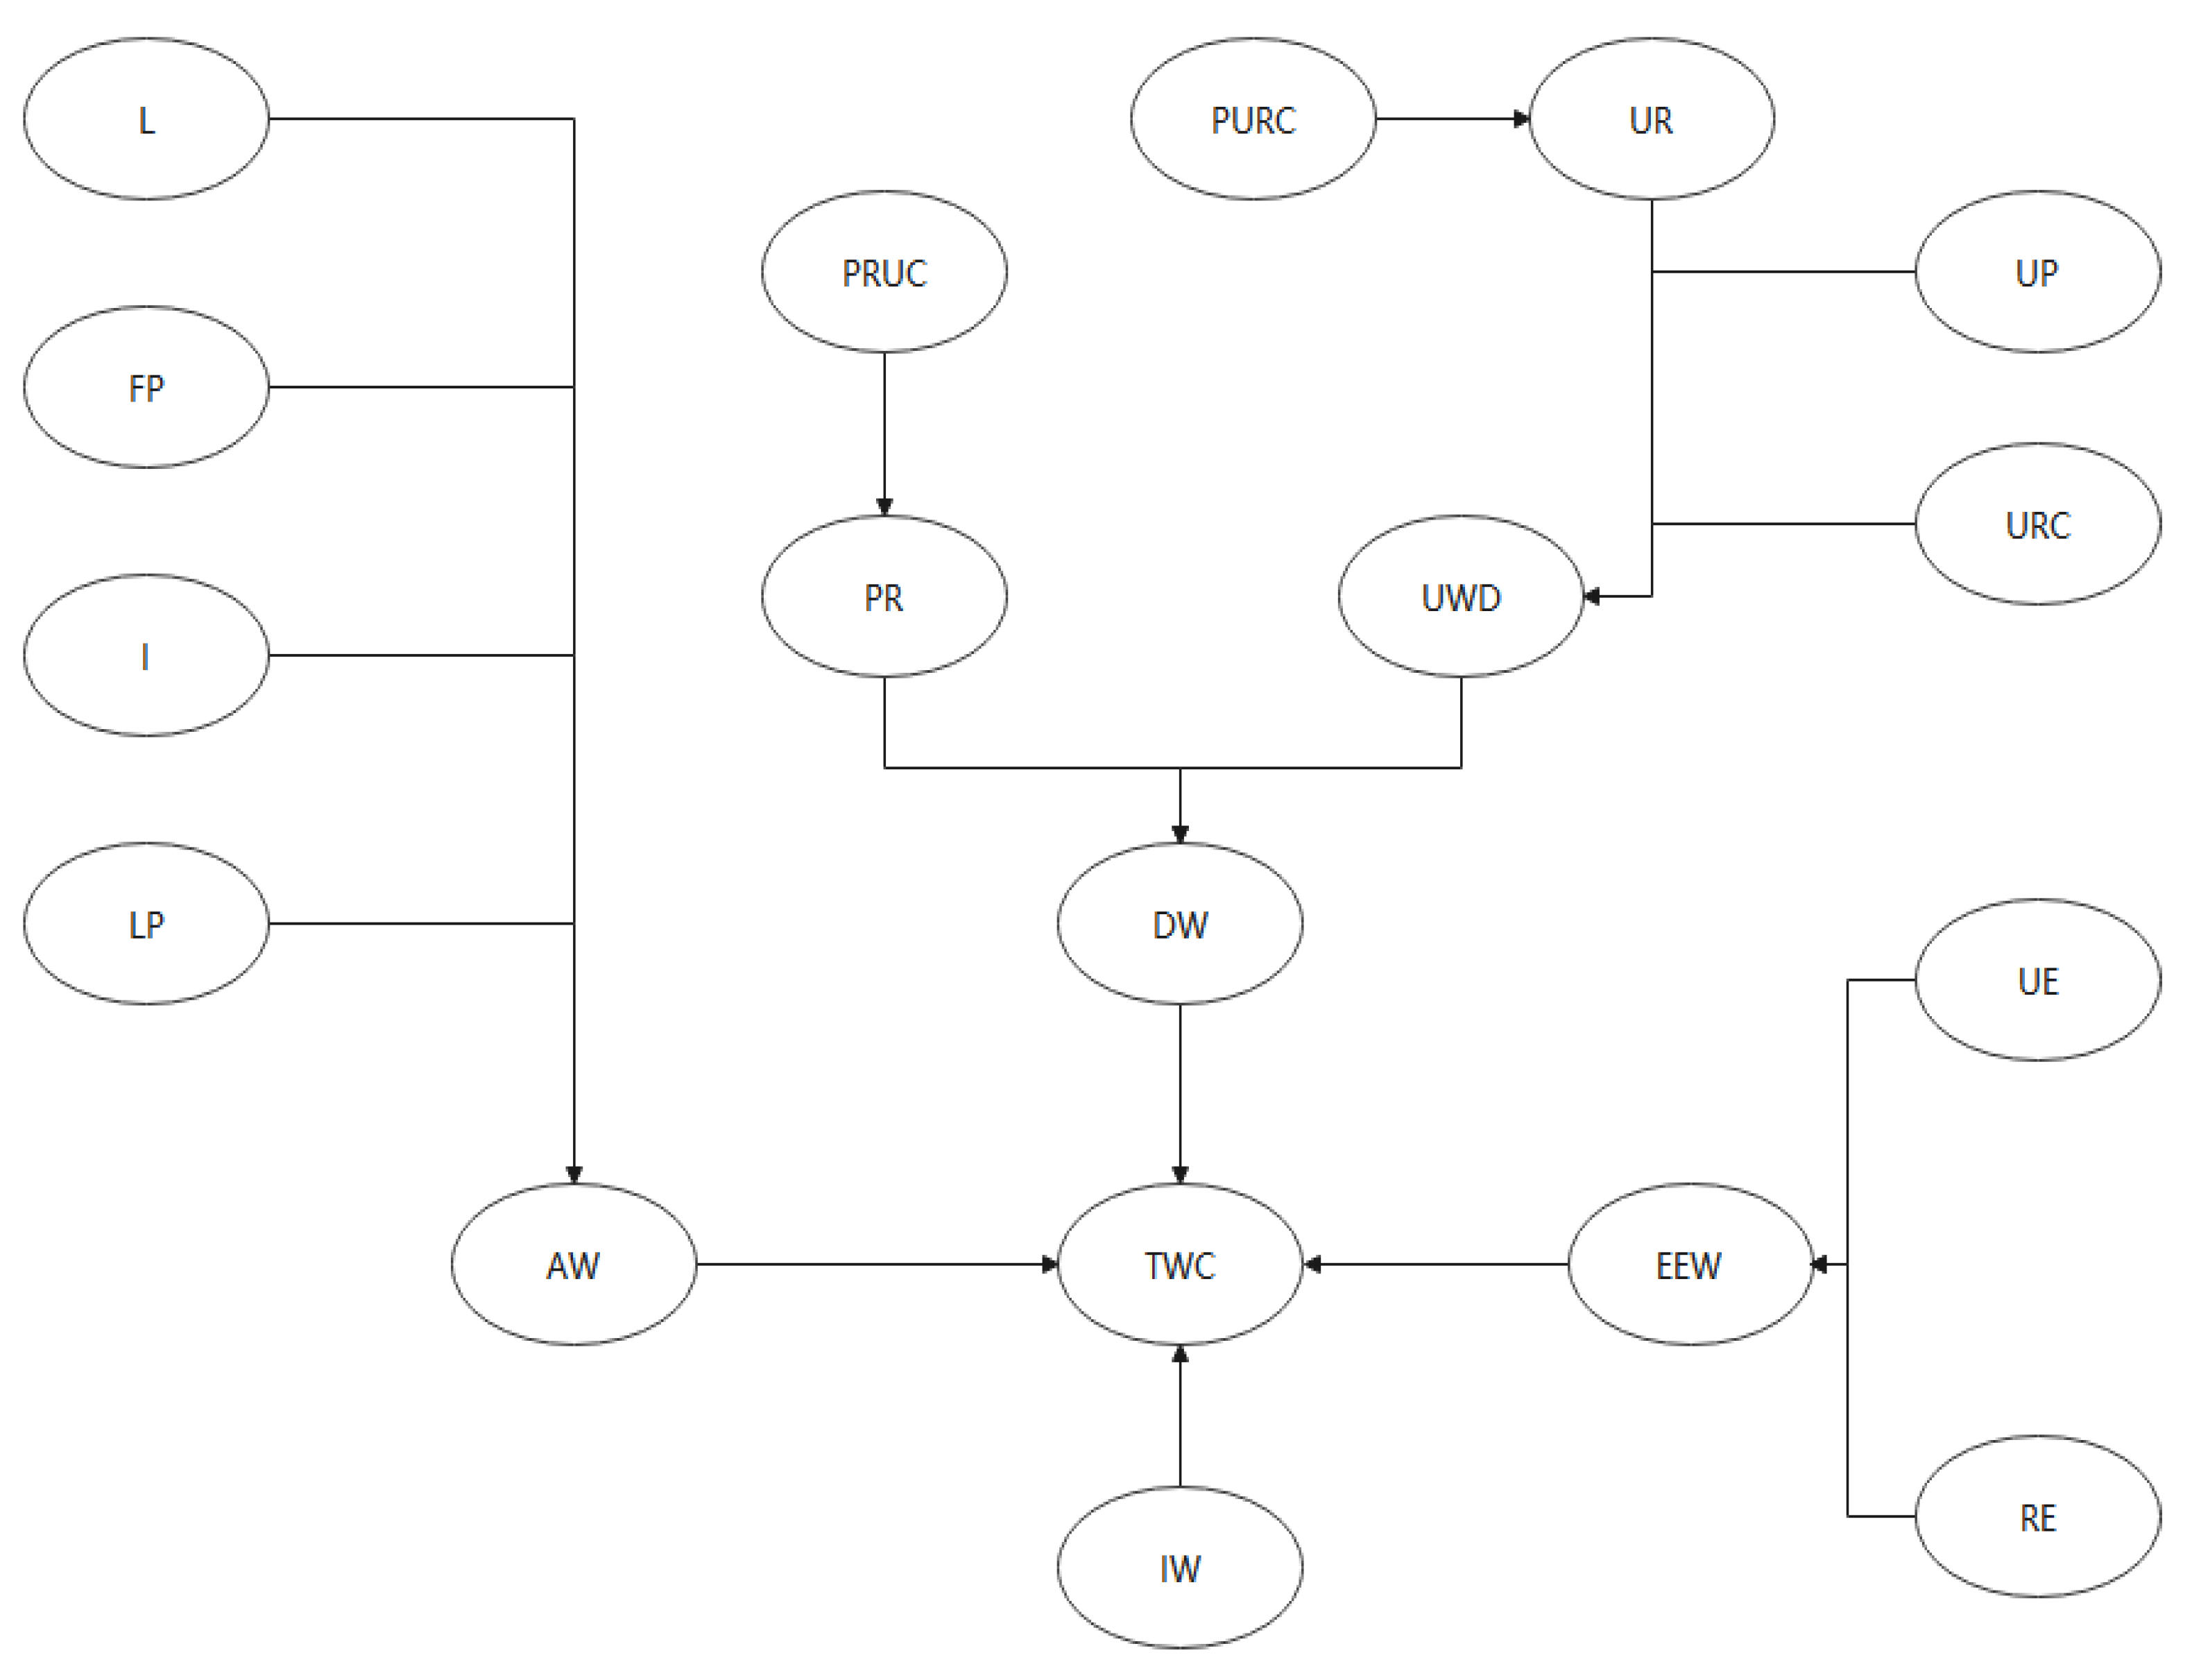
The system takes water resource usage as the index. Water resource utilization relates to the total gross amount of water taken by all types of water consumers, comprising the loss of water transportation, which is counted according to the four categories of daily use, agriculture, industry and ecological environment, excluding the direct amount of seawater. Agricultural water comprises irrigation water, fishpond water, and livestock water. Industrial water includes two parts: a tap water network and an unconventional water source. Among them, the tap water pipe network comprises groundwater self-prepared wells and water lifting projects, and the unconventional water sources including a direct supply of seawater desalination and the reuse of deep treated sewage. Residential water is composed of urban and rural water. The sum of the two is the amount of water used for residential purposes.
Residential domestic water = urban residential domestic water + rural residential domestic water
Water for the ecological environment mainly includes water diversion from Luan River to Haihe River, recycled water to supplement the landscape river, and a restricted quantity of groundwater for the urban environments.
- 5.
- Water environment subsystem
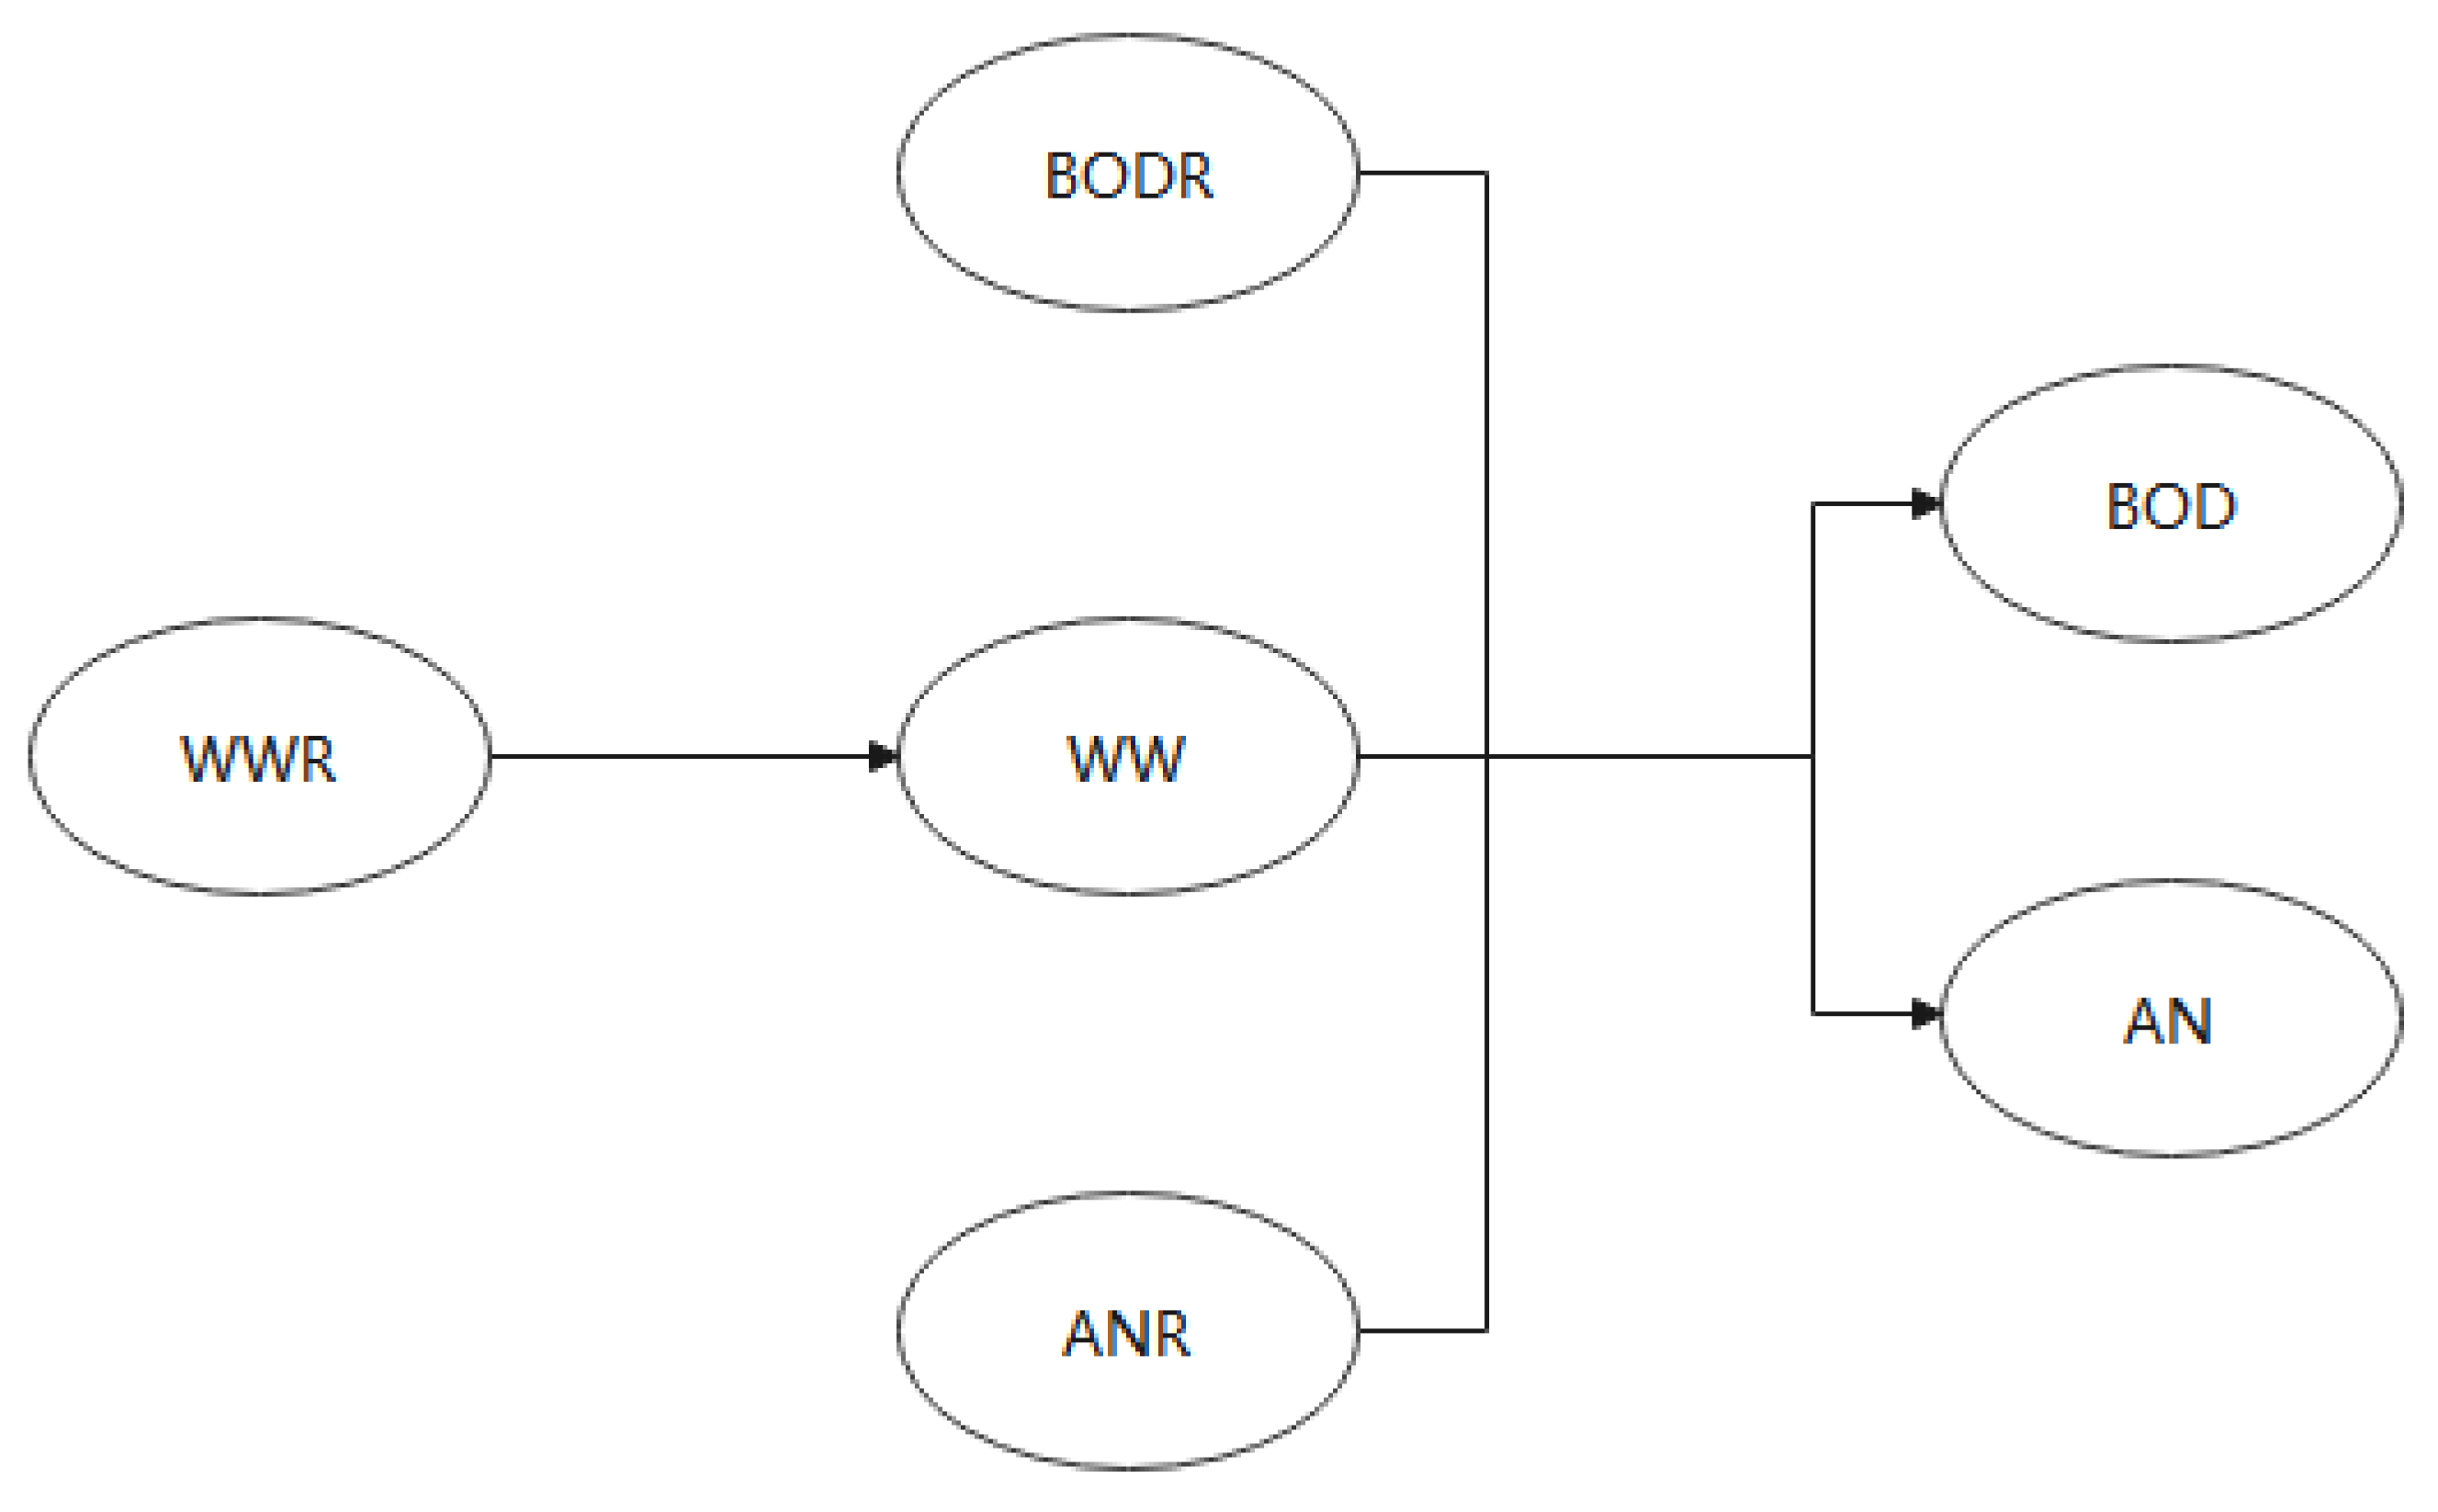
This subsystem includes two major factors, biochemical oxygen demand emissions and ammonia nitrogen emissions, and reflects the degree of pollution of the local water environment by domestic and industrial wastewater [23]. Biochemical oxygen demand emissions and NH4-N emissions originate from agricultural, industrial, domestic, and ecological water, which is the total amount of local water use. In the environmental subsystem, we mainly consider pollution of wastewater among the quantifiable “three wastes” pollution. Regarding the present situation of water contamination in Chengde City, the specific discharge of biochemical oxygen demand and ammonia nitrogen contaminants in wastewater should be considered along with wastewater pollution. The growth of population will enhance the discharge of pollutants, and at the same time will aggravate the problem of environmental pollution, and once the environment is critically contaminated, it will cause a higher mortality rate, which will inhibit growth of the population. The same applies to economic development. For example, rapid development of the industrial economy can result in a rapid increase in industrial wastewater, solid waste, and waste gas pollution such that serious pollution inhibits sustainable economic development. However, if we can increase the level of environmental protection investment at the time of economic advancement, we are able to effectively diminish the economic losses induced by environmental contamination.
2.3.3. Model Calibration and Validation
The system dynamics model is guided by qualitative analysis and supported by quantitative analysis. This requires that in the modeling process, the model must be closely integrated with the actual situation, thoroughly investigated and researched to maximize the collection and use of information and statistical data about the system and its problems. The validation tests performed in the system dynamics modeling process are mainly historical tests, i.e., historical parameters are input into the model and simulation results are obtained after running. The actual results are compared with the actual behavior data to verify the degree of agreement, and then the reliability and accuracy of the model behavior can be judged [24].
The inspection items include population subsystem, economic subsystem (including agriculture, industry, and tertiary industry), aquatic environment subsystem and the water resources subsystem. The variables tested mainly include SW, RW, SD, TWS, GW, DW, AW, IW, EEW, TWC, BOD, AN, WW, total population, rural population, urban population, environment investment, fix asset investment and GDP.
2.3.4. Sensitivity Analysis
The role of sensitivity analysis is to identify the factors that have a great influence on the sustainable utilization of water quality and quantity in Chengde City from 2007 to 2025. Therefore, conducting a sensitivity analysis of relevant models is required [25]. Here, 10 state variables, including the farmland effective irrigation coefficient, residential rate of growth in the water quota, sewage recovery rate and public water demand growth rate, are chosen as relevant sensitivity analysis parameters. The rate of water shortage is taken as the response target of sensitivity, and Formula (1) is adopted for the assessment.
S2θ = (Δx/x*)/(Δθ/θ0)
In the formula, when sensitivity S2θ shows that θ is near the θ0, the meaning of this formula is that the ratio of the rate of change in state variable x to the original value x* and the rate of change in criterion θ is relative to θ0. If the parameter sensitivity is greater than 1, it indicates that the water resource supply–demand balance shows greater sensitivity to this criterion, and the greater the absolute value, the more sensitive it is. On the contrary, if the parameter sensitivity is less than 1, it indicates lower sensitivity, with the value positively related to the sensitivity.
2.3.5. Scenario Analysis
Several high sensitivity variables are selected as decision variables to compare and explore the sustainable utilization of water resources in Chengde under various advancement strategies. The four scenarios are set to examine sustainable water resources development in Chengde from 2021 to 2025 through different values of decision variables. These four situations include: (1) status quo; (2) water supply; (3) economic development; (4) comprehensive consideration.
Scenario 1 is the unchanged status quo type, i.e., the existing situation remains unchanged, and no measures are taken during the whole process.
Scenario 2 is a water supply type on the basis of the status quo. It will reduce the rate of economic development to a certain extent, increase the rate of investment in urbanization and environmental protection, reduce the rate of the generation of wastewater, and increase the rate of wastewater recycling.
Scenario 3 is the economic advancement type. It focuses solely on economic development and accommodates other related indicators, such as the growth rate of tertiary GDP and so on, to a higher level than the current one.
Scenario 4 is the comprehensive consideration type, which is the comprehensive consideration of the population, economic, technological development levels and other factors, focusing on long-term development. All indicators are focused and coordinated throughout the entire process.
3. Results and Discussion
3.1. Model Calibration Results
The model is calibrated on the basis of the data for water supply reported in Chengde Water Resources Bulletin from 2011 to 2014, and the relative error is evaluated. The outcomes are illustrated in the Appendix B Table A2.
3.2. Model Validation Results
Model validation uses water supply–demand data from the 2016 Chengde Water Resources Bulletin. As shown in Table 6, the results after relative errors are calculated.
The model simulations are consistent with the historical development data [26], with errors within 10%. The calibrated model represents the research system. Therefore, the calibrated model parameters are applied within model prediction.
3.3. Results of Model Sensitivity Analysis
As shown in Table 7, the sensitivity analysis demonstrates that the rate of urbanization, rate of investment in environmental protection, wastewater generation rate and GDP growth rate of the tertiary industry are the four most sensitive variables.
3.4. Scenario Simulation Results
In this paper, four variables with the highest sensitivity are selected as decision variables, which are the rate of urbanization, the rate of environmental protection investment, the rate of wastewater generation, and the rate of GDP growth for the tertiary industry.
3.4.1. Analysis of Water Demand and Supply
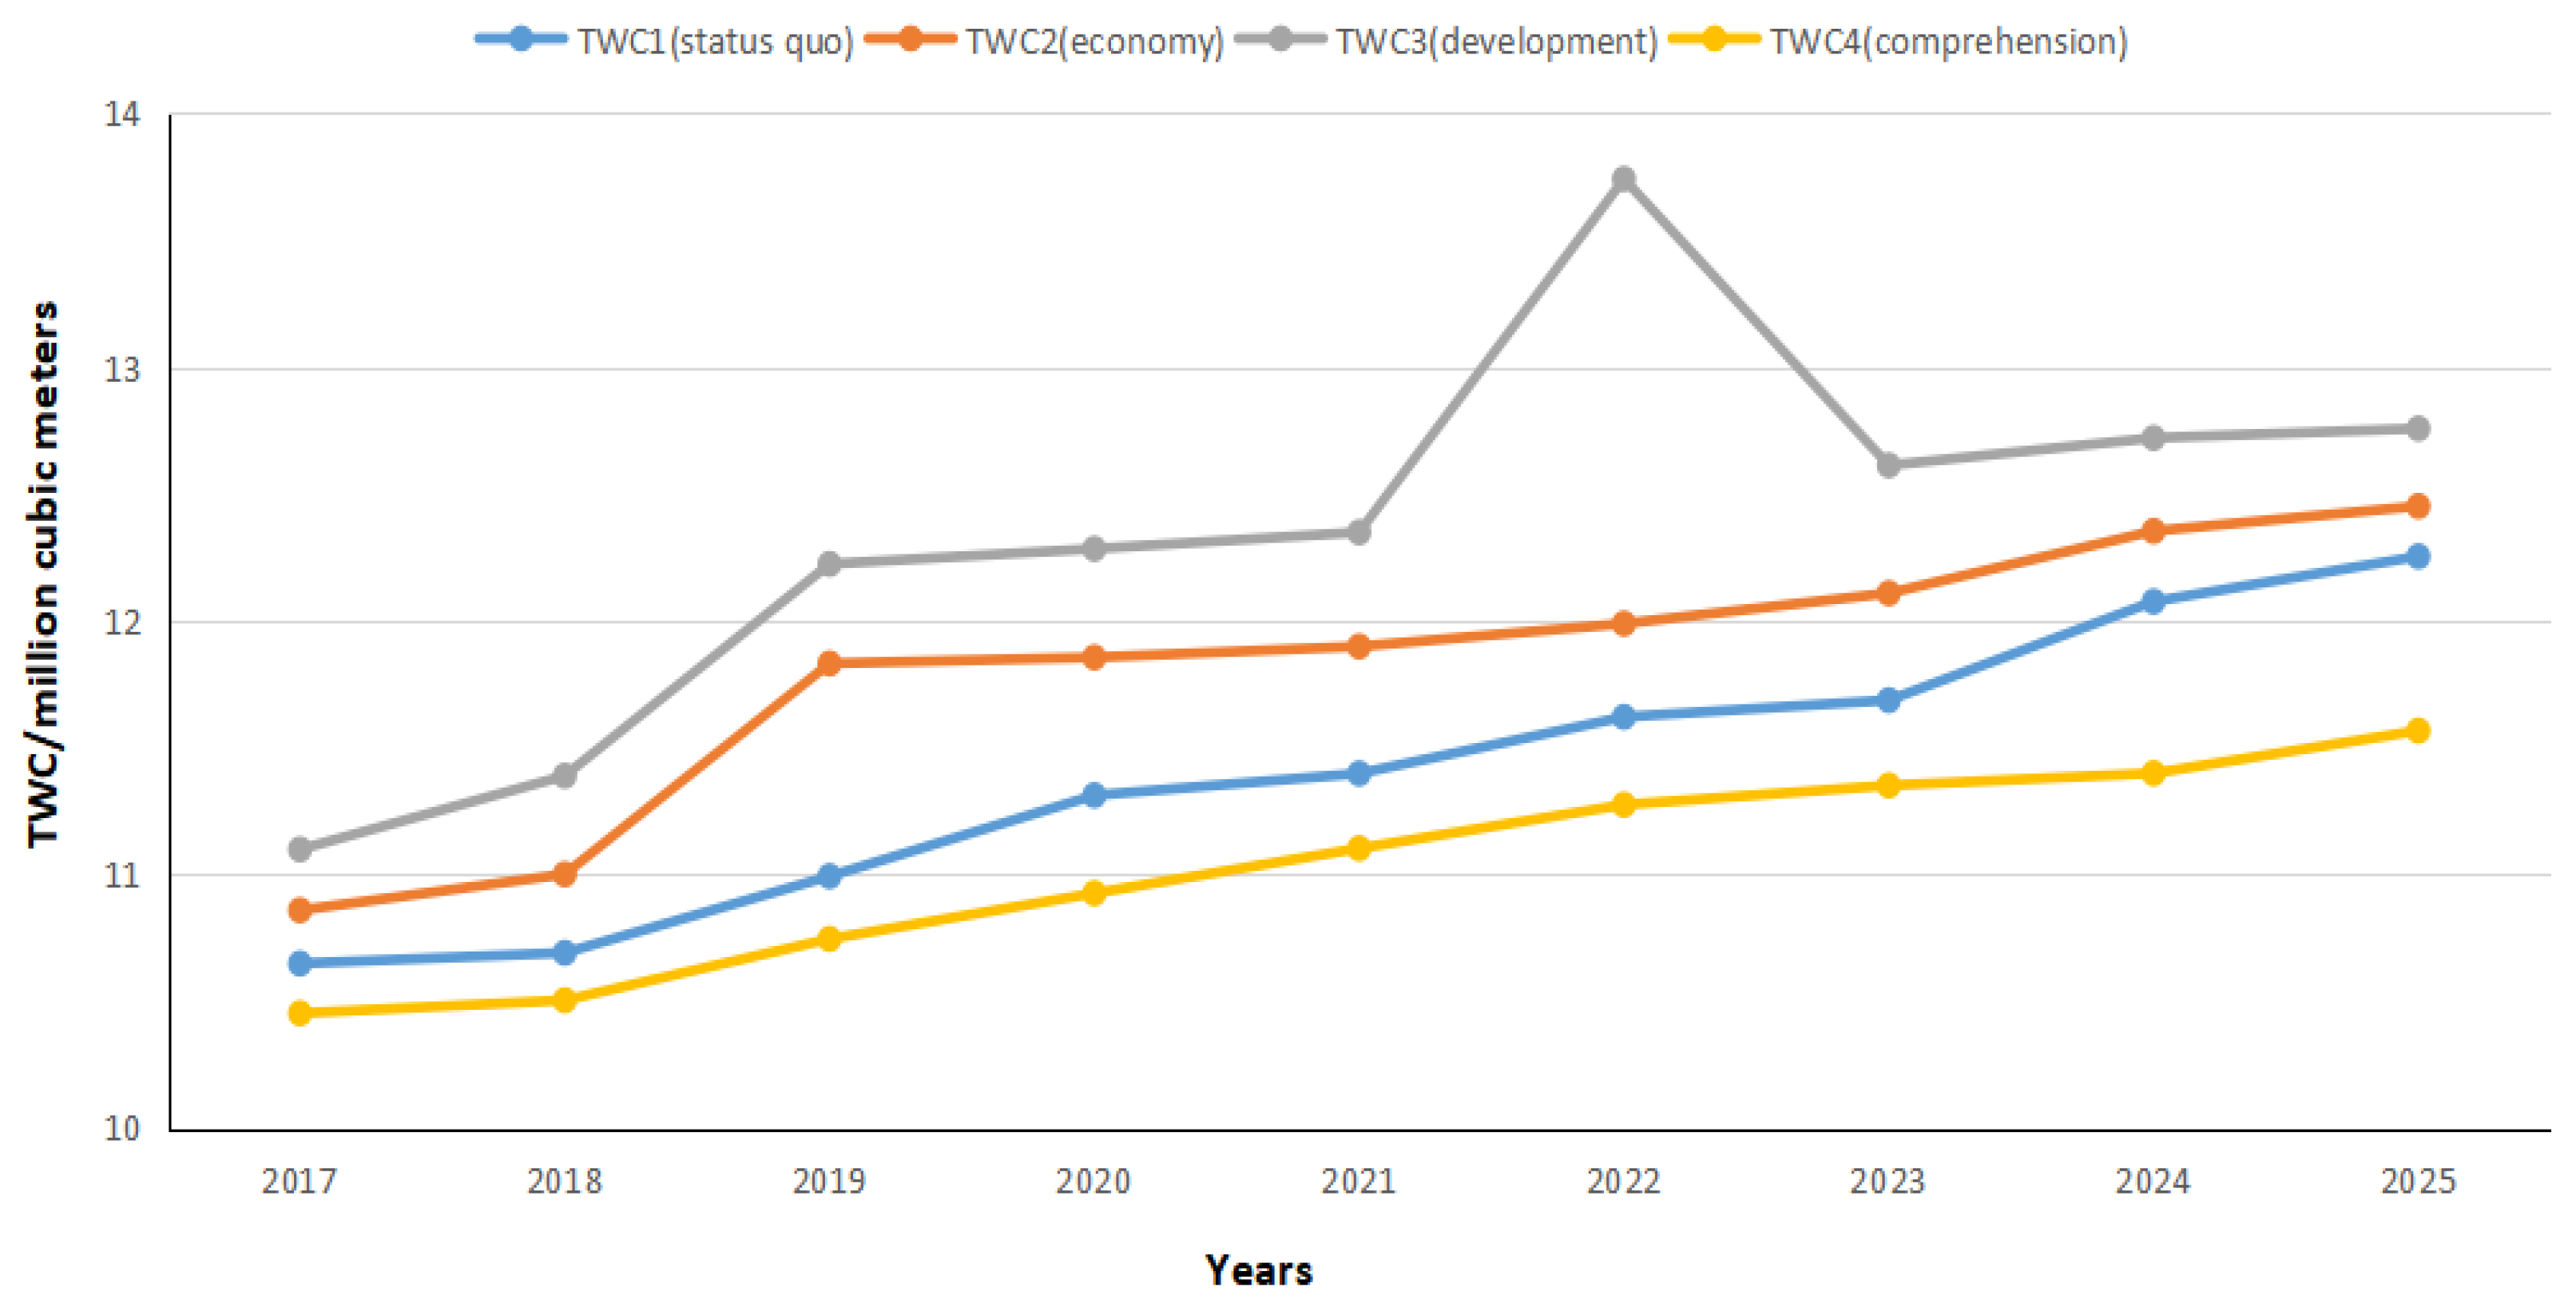
As illustrated in Figure 9, the total water utilization of the status quo type increases gradually and at a comparatively stable rate overall. This is probably because the increase in local water supply capacity has had an impact on residents’ water consumption habits, which has resulted in an enhancement in their total water consumption. The economic development type showed a small difference in total water consumption over the initial three years and the status quo type, and then gradually widens the gap to reach a peak in 2021 and then starts to decline, probably because the further economic development promotes the improvement of technology and thus saves some water resources, which is a more ideal scenario. The total water utilization of the integrated type shows a slowly increasing trend and is less than that of the status quo type by 68.4 Mm3 in 2025. At the same time, it has the slowest rate of growth for water utilization among the four scenarios and has a comparative advantage in being used to solve the long-term water shortage conflict.
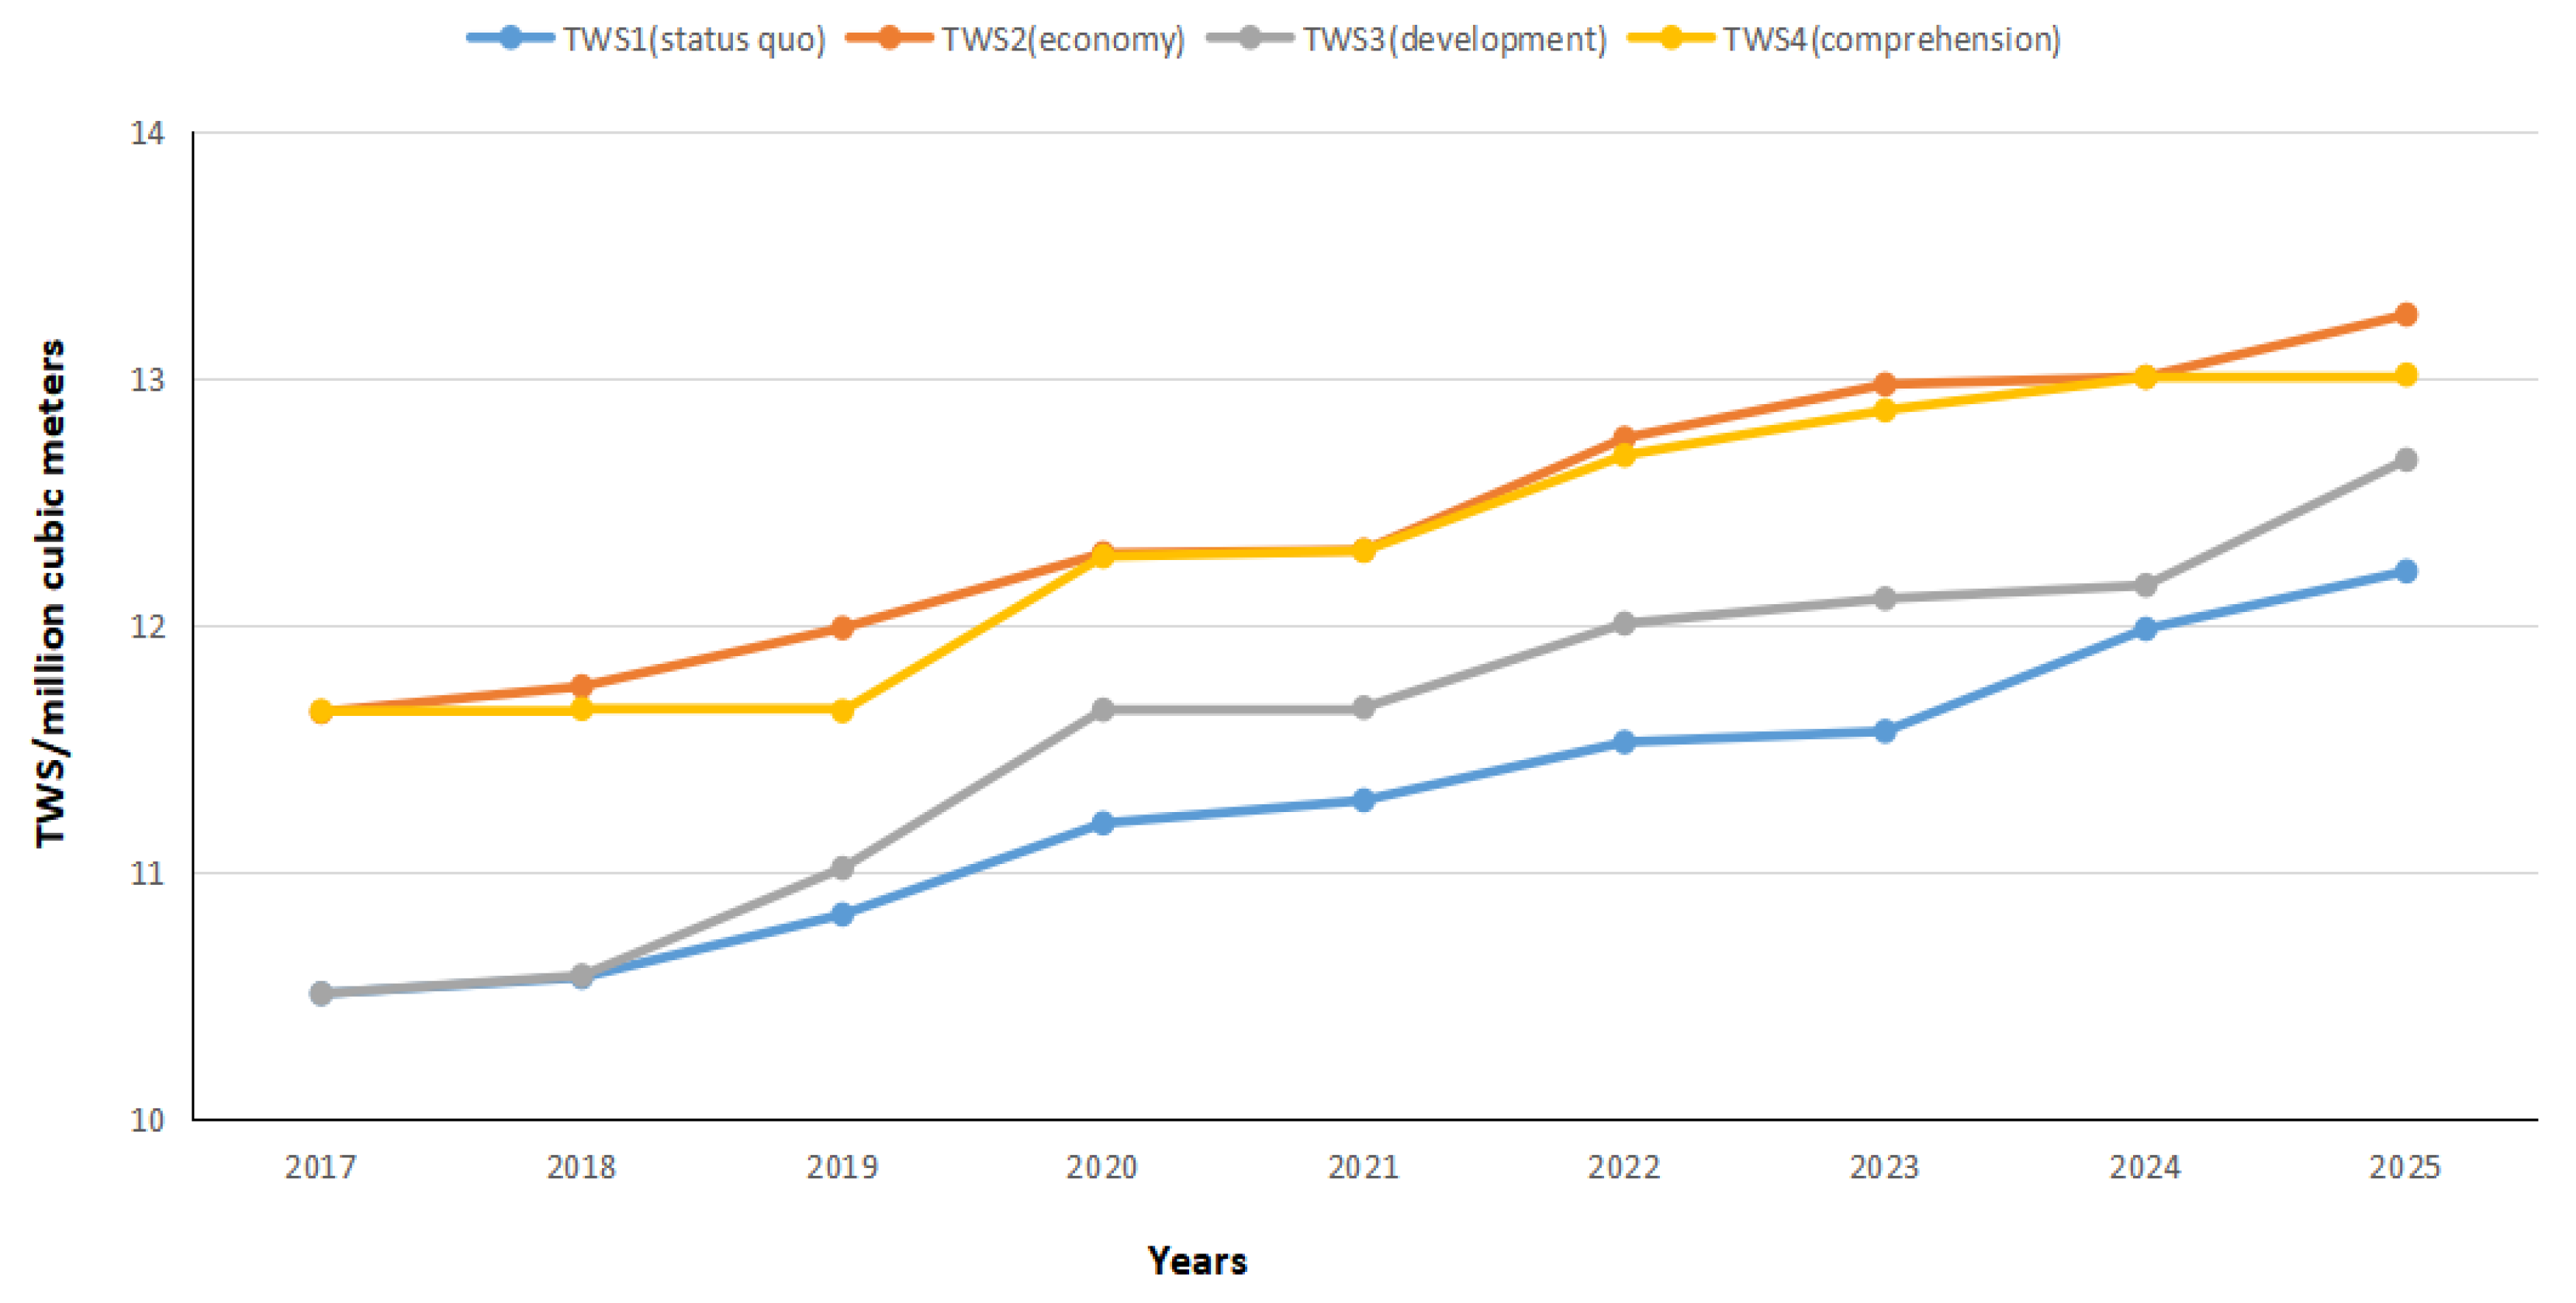
As demonstrated in Figure 10, among the four scenarios, the total water supply volume of the status quo type shows a slow growth trend, with a total water supply volume of 1221.6 Min 2025. The water supply type has a total water supply volume of 1325.7 Min 2025, which is the maximum among the four scenarios. This could be attributed to it having less wastewater, and the wastewater reuse rate is not much different from that of the status quo type, which makes the secondary use of wastewater correspondingly less, and at the same time, the water supply volume increases, and under the simultaneous effect of both, the water supply volume will be larger. The economic development type has a total water supply volume of 1301.3 Min 2025, and the water supply volume of this option is slightly larger than that of the status quo maintenance type until 2019, and slightly higher than that of the status quo maintenance type in the latter years. This phenomenon occurs as the impact of this option on industrial water use is slower to take effect than that of the status quo maintenance type, and industrial water use produces the most wastewater. The total water supply volume of the integrated type is below only the water supply type and will exceed the status quo type by 45.2 by 2025.
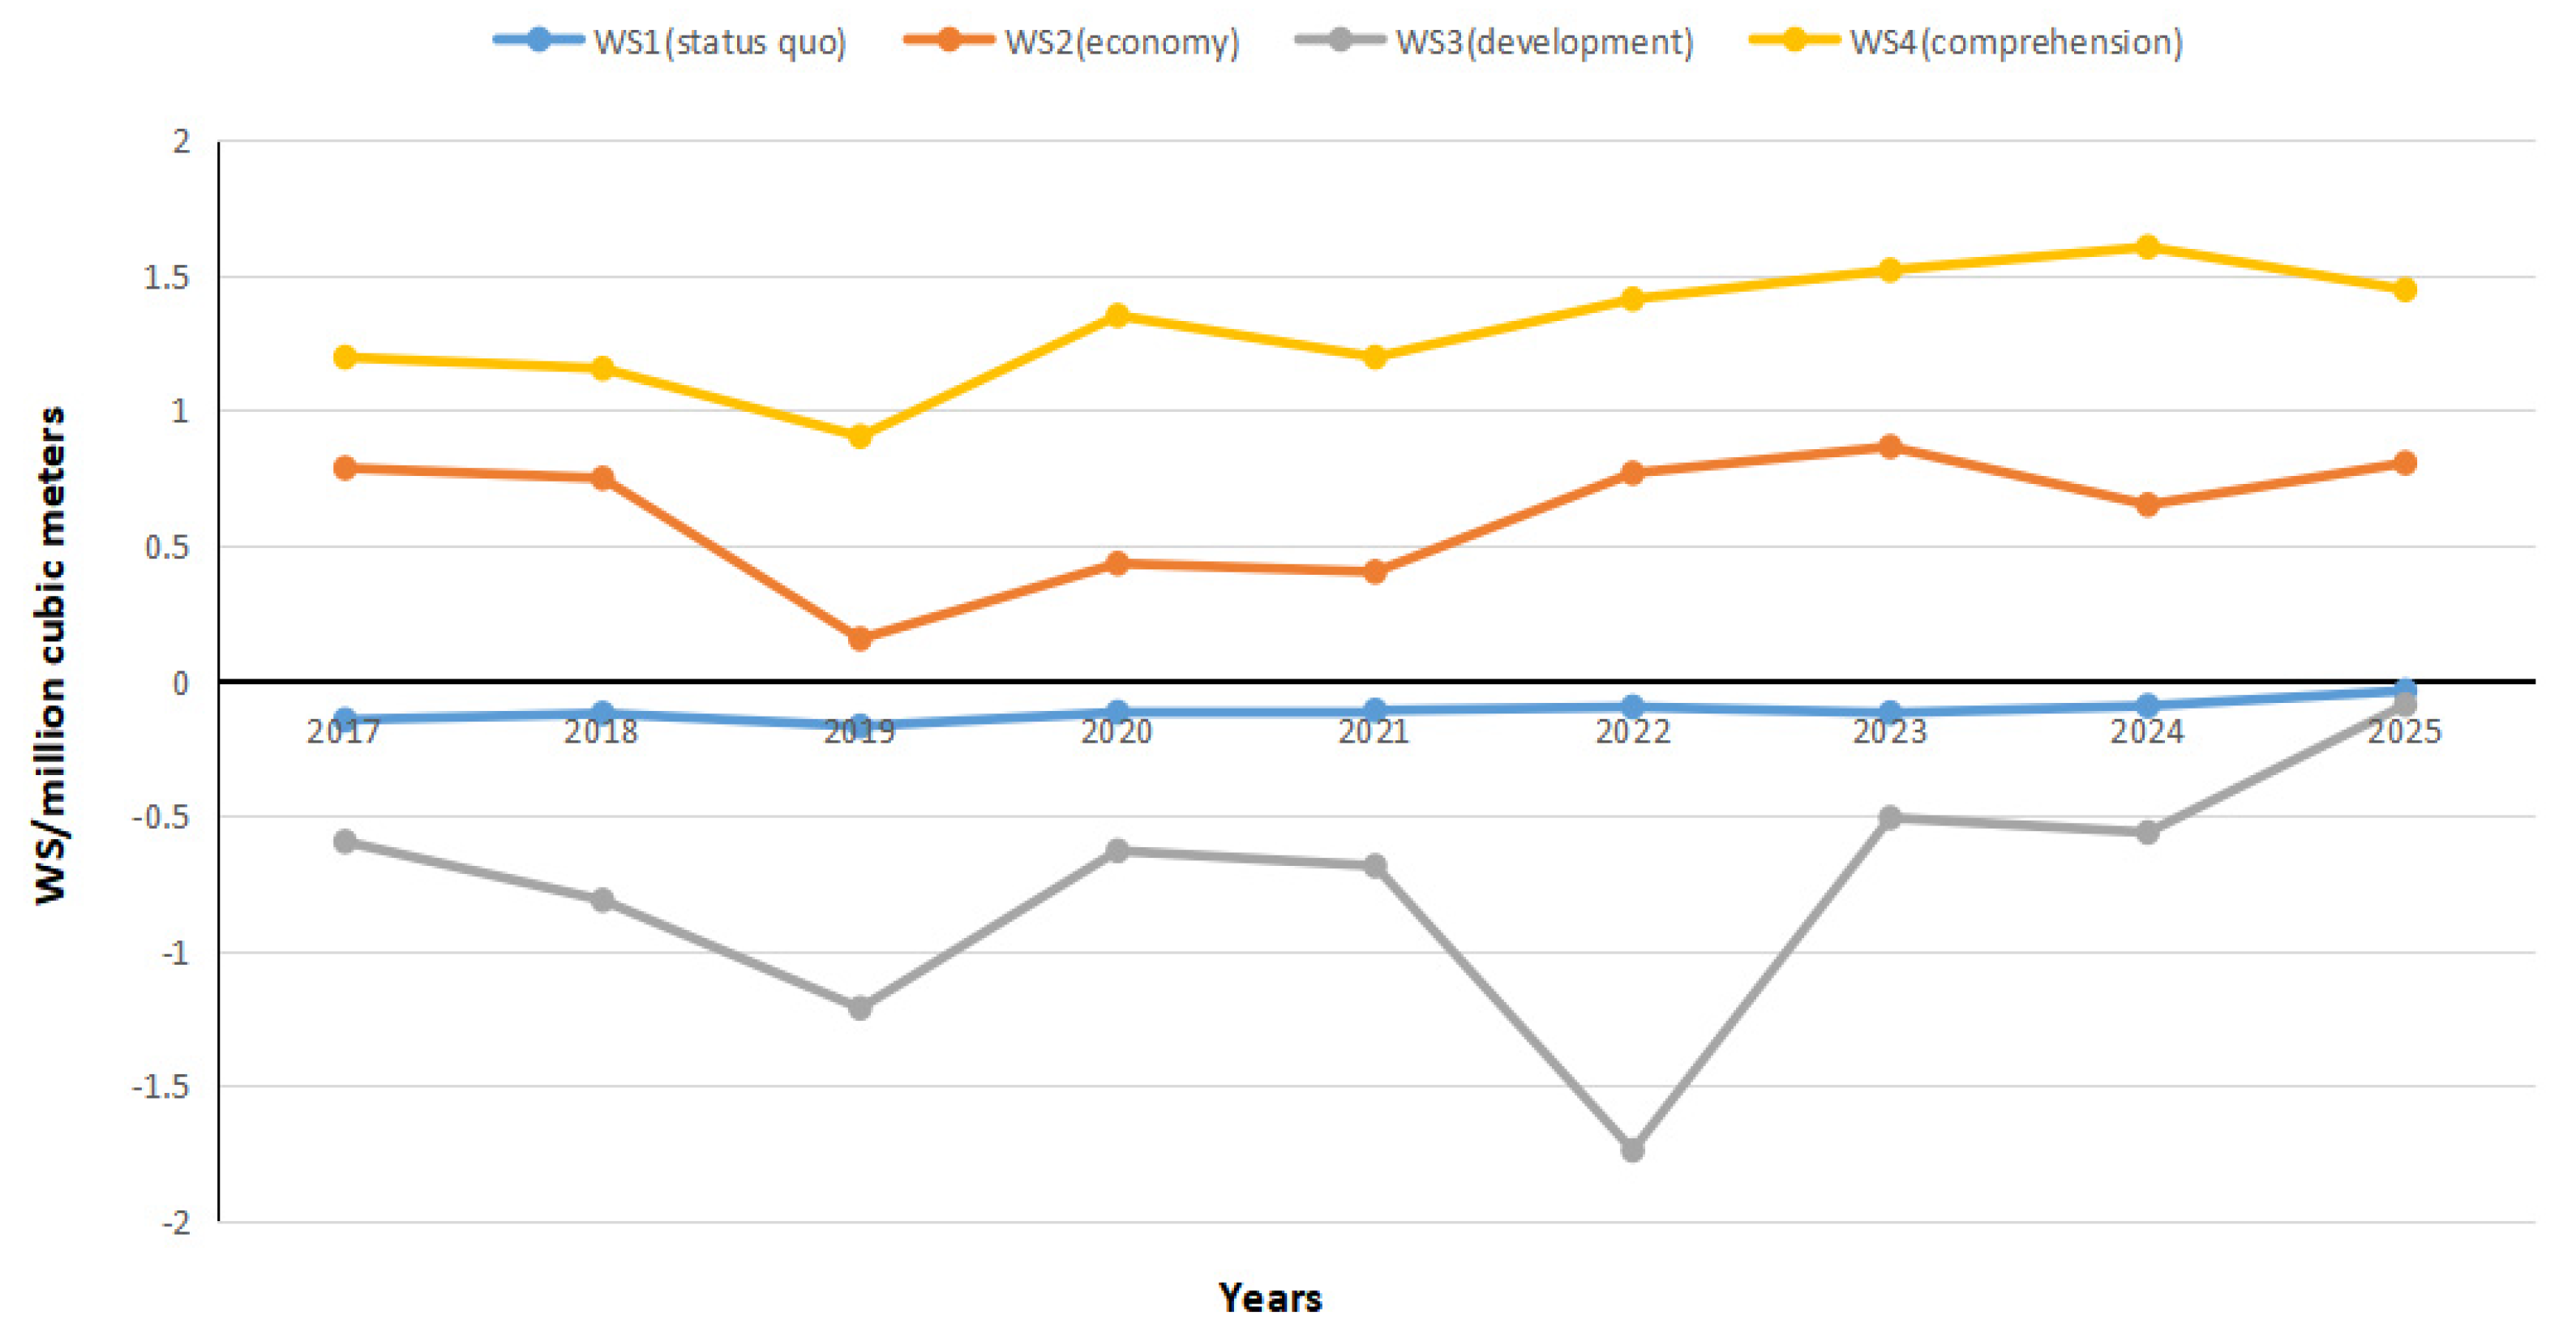
The difference between water supply and demand is a significant parameter for evaluating the pressure of water supply. As demonstrated in Figure 11, in all four scenarios, the water supply and demand differential is consistently negative for the status quo type. Moreover, the difference will only reach the minimum value of −3.8 Mm3 in 2025, which indicates that the problem of water supply and demand in Chengde is obvious and requires a reasonable water allocation strategy. The water supply type is effective in solving the water shortage problem and the difference between supply and demand has been positive. However, according to Figure 11, we can see that the threshold is reached in 2019, and additional technical and financial support is needed at a later stage to maintain a positive margin, which is a worrying prospect. The economic development type has a negative supply–demand differential, with a differential of −56.9 Mm3 at the beginning, which fluctuates widely and is always less than demand, causing greater pressure on water supply and increasing competition for water resources in each subsystem. The comprehension’s supply and demand differential has a better performance in the first year, and all of them have positive values. More importantly, its value is greater than that of the water supply type, which can solve the water allocation problem more reasonably.
3.4.2. Water Quality
If the development of the status quo is maintained according to scenario 1, the total wastewater discharge and BOD and ammonia nitrogen discharge in Chengde slowly decrease, and the degree of water pollution in Chengde has been ameliorated. Under scenario 2, the total BOD and ammonia nitrogen emissions in Chengde continue to decline, but the increase in wastewater emissions is large, indicating that economic development is able to contribute to BOD and ammonia nitrogen emissions. In scenario 3, the lowest increase in wastewater discharge; however, BOD and ammonia nitrogen emissions increased, indicating that industrial sources have a greater constraint on wastewater discharge. In scenario 4, the decline of BOD and ammonia nitrogen emissions is the highest between the 4 situations, with a 6.3% decrease in BOD emissions and a 11.8% decrease in ammonia nitrogen emissions. Furthermore, it also has a relatively low rate of increase in effluent discharge. Therefore, scenario 4 can be considered as the optimal solution for the sustainable development of water environment in Chengde.
3.4.3. Analysis by Synthesis
The first scenario is status quo type. All parameters of the status quo type are unchanged, and the scheme is used as a comparison scheme for the modeled results of other schemes. Current trends in development indicates that there is a rising trend in water demand year by year, and the total water exploitation reaches 1225.4 Mm3 in 2025, which is 160.5 Mm3 more than 2017, and the total water supply is 1221.6 Mm3, which is 167.1 Mm3 more than 2017, and the surplus of water supply is negative 38 Mm3 in 2025. However, implementation of development according to the trend of integrated consideration type will result in the water resources in Chengde being better conserved as well as utilized, which is optimal for the sustainable exploitation of water resources among the four scenarios.
The second scenario is water supply type. Water supply type improves water supply capacity from the viewpoint of the population, economy and environment. According to the current situation type, it reduces the speed of economic advancement, improves the rate of investment in environmental conservation and urbanization rate, reduces wastewater generation, and thus improves the recycling efficiency of water resources. The total water consumption in 2025 is 1245.2 Mm3, and the surplus of supply and demand is 0.805 Mm3. Compared with the status quo type, it can be concluded that the water supply has increased to a specific extent and the utilization of water resources has been improved. The water supply type has a better and faster water supply effect, and this is an adjustment plan with lower cost. Its disadvantage is that it needs to make a big improvement at the beginning, and it is weak at the later stage. At the same time, due to the limited water supply capacity, increasing water supply requires an increase in the economic input cost, which is not worth the loss.
The third scenario is the economic development type, which focuses on economic development and adjusts the economic growth rate and other related indicators higher than the current level. The total water supply of the economic advancement type in 2025 is 1266.8 Mm3. The type of economic development aims to suitably inhibit the speed of industrial development while vigorously developing the tertiary industry. The total water demand is 1275.8 Mm3, and its surplus of supply and demand is negative 9 Mm3, which is an improvement in water resource utilization in comparison with the status quo type. The economic development type promotes a reduction in water consumption and is more consistent with the trend in economic development in Chengde. Its drawback is only industrial water consumption can be reduced, with little impact on the consumption of other sectors, such as the public water supply and agriculture.
Scenario 4 is a comprehensive type. In other words, it takes into account factors including economy, population, and level of technological development; focuses on long-term development; and reconciles all indicators in the middle. The comprehensive type is a scenario formed according to water conservation, adjustment of the structure of industry and open source. The 2025 total water consumption is 1156.7 Mm3, total water supply is 1301.3 Mm3 and its surplus of supply and demand is 144.6 Mm3, which means that it can better meet water demand.
It can be seen that the comprehensive approach can comprehensively consider measures such as adjustment of the industrial structure, water conservation, and water recycling, thereby effectively reducing water consumption and improve water supply, and finding a solution to the challenge of water consumption in Chengde. The effect is excellent, which promotes sustainable development. The drawback is that the integrated type requires measures in all aspects, and it is not possible to focus human, material and financial resources on improving a certain aspect.
In general, the most reasonable and effective solution is the integrated type.
3.5. Discussion
According to the above analysis, Scenario 4 can achieve a proper allocation of water resources in Chengde City. Specifically, in terms of water quantity, the water demand rate decreases by 4.4% and the water supply rate increases by 1.1%. Meanwhile, in terms of water quality, the BOD emission rate of water resources is reduced by 6.3%, and the ammonia emission rate is reduced by 11.8%.
In conclusion, taking water quality changes into account is the strength of our model, and the model simulations are consistent with the historical development data with errors within 10% in Section 3.1 and Section 3.2. However, the complexity, systemic and specific nature of sustainable water resources utilization means that the theoretical and applied research on sustainable water resources utilization at this stage cannot meet the practical needs. Meanwhile, the short time step of the data series in this paper will also have an impact on the accuracy of the prediction results of the model; thus, a few issues need further in-depth study. Therefore, when examining the sustainable use of water resources in the future, we can attempt to combine various mathematical models with system dynamics models to complement each other’s strengths and weaknesses, as to achieve more reasonable and accurate predictions on the trend of water resources use.
4. Conclusions and Suggestions
4.1. Conclusions
This paper establishes a model for the sustainable use of water resources and considers in detail the effects of population, economy, water quality and quantity on water use in Chengde to achieve an efficient allocation of water resources in this city. The concrete water resources state of five departments of Chengde City is considered comprehensively, and a system dynamics model is constructed to simulate the water resource exploitation situation in Chengde City. The achieved outcomes illustrate that there are some problems in the water resource supply and demand in Chengde City. Therefore, in order to ameliorate the current status of water resources in Chengde City, four parameters are chosen to develop four scenarios to simulate water resources development in Chengde City from 2017 to 2025. Out of all the strategies, scenario 4 (comprehensive type) is shown to be the optimal allocation that most favored the sustainable advancement of water resources.
Conclusively, scenario 4 is an essential way to resolve the water resource challenges. Depending on an increasing water supply has specific restrictions and does not fully resolve the challenge of water shortage, nor does it promote sustainable water resources utilization. An enhancement in water supply is needed, and at the same time, will increase water saving. The traditional methods of increasing water supply in Chengde are water transfer projects as well as water lifting projects, but they are more costly and dependent. Further open-source methods are required for using in rainwater harvesting and sewage reuse. Realizing the sustainable development of water resources requires an expectation to start from these two aspects, becoming familiar with advanced technology, and reducing the burden of the water supply system by increasing investment [27].
4.2. Suggestions
Based on the results of the current study, there are several suggestions for the utilization of water resources in Chengde City, namely, water conservation, industrial structure adjustment, even level source and scientific management, the core of which is to ameliorate the efficacy of water resource utilization and reduce the waste and pollution of water resources.
- Water conservation: water conservation measures are less costly and effective, and can effectively relieve the pressure on water supply, while reducing the sewage discharge, which is conducive to the enhancement of the water environment and is the only approach to sustainably utilize water resources.
- Adjustment of industrial structures: The advancement degree for the tertiary industry is an essential symbol of industrial structure optimization and economic modernization. Enhancing the proportion of the tertiary industry is able to substantially diminish total water utilization. Hence, for industries that consume remarkable amounts of water, including the textile, petrochemical, and iron and steel machinery industries, the water consumption quota should be strictly regulated. Projects with low efficiency and high water consumption should be eliminated, or a mandatory reduction in water consumption can be considered to encourage the water saving in industries and the construction of ecological industrial parks. High-tech industries and other industries with high efficiency and low water consumption a should be given priority.
- Open source: Water projects constitute the traditional method to improve water supply in Chengde City. However, this approach has a high cost and strong dependence. Only by improving the water supply capacity of the city can the challenge of water deficits be fundamentally overcome. The development potential of groundwater and surface water in Chengde City is limited; in particular, recovery of deep groundwater is complicated in a short period of time after exploitation. However, non-traditional water sources have low utilization rates, and there remains a large space for development. Based on Chengde’s own situation, there is a larger availability of non-traditional water sources: processed rainwater and sewage.
- Strengthened water resource planning management: The water department should continuously refine and improve relevant regulations and laws and the system of water resource management according to the change in realistic conditions, increase government department supervision at all levels and rationally manage water resources. Rewards can be given to units or individuals with good performance and penalties to units or individuals with substandard performance. We should continue to study the advanced technology and experience from abroad and explore the sustainable water resource utilization model that suits the actual situation by combining with the current situation in the local area.
- For specific needs: Water resource utilization planning can consider the method of determining the demand by designing the water supply in accordance with available water resources, combined with the actual water consumption; coordinating the relationship among environment, economy, and water resources; rationally allocating water resources; and determining reasonable water consumption quotas, while water consumption units allocate water in accordance with the quotas, which can effectively ensure a water supply–demand balance and minimize unnecessary wastes.
Author Contributions
C.L. conceived and designed the research; B.W. and Y.T. wrote the paper and analyzed the data; X.L. contributed reagents, materials, and analysis tools. All authors have read and agreed to the published version of the manuscript.
Funding
This study is supported by GEF Mainstreaming Integrated Water and Environment Management (P145,897-3-03).
Institutional Review Board Statement
Not applicable.
Informed Consent Statement
Not applicable.
Data Availability Statement
Restrictions apply to the availability of these data. Data are available from the authors with the permission of third party.
Acknowledgments
We would like to extend special thanks to the editor and reviewers for insightful advice and comments on the manuscript.
Conflicts of Interest
The authors declare no conflict of interest.
Appendix A

Table A1.
Raw data of water supply, water environment, demand, pollution and economy of Chengde City from 2007 to 2016.
Table A1.
Raw data of water supply, water environment, demand, pollution and economy of Chengde City from 2007 to 2016.
| Project | Years | |||||||||
|---|---|---|---|---|---|---|---|---|---|---|
| 2007 | 2008 | 2009 | 2010 | 2011 | 2012 | 2013 | 2014 | 2015 | 2016 | |
| Population/10,000 | 366.9 | 369.38 | 371.91 | 372.96 | 374.31 | 376.92 | 378.15 | 380.74 | 382.35 | 383.3 |
| Natural growth rate /‰ | 8.75 | 5.1 | 7.5 | 4 | 4.8 | 8.3 | 4.2 | 8.2 | 5.5 | 6.6 |
| Urbanization rate/% | 26.57 | 36.81 | 26.88 | 39.41 | 40.71 | 41.92 | 43.27 | 44.5 | 46.8 | 49 |
| GDP/Ten thousand yuan | 5,698,112 | 7,436,757 | 7,601,136 | 8,889,619 | 11,042,013 | 11,819,213 | 12,720,917 | 13,425,500 | 13,587,278 | 14,385,741 |
| Added value of primary industry/Ten thousand yuan | 917,872 | 1,084,660 | 1,133,566 | 1,394,058 | 1,655,462 | 1,851,577 | 2,104,025 | 2,257,413 | 2,356,416 | 2,377,858 |
| Added value of second industry/Ten thousand yuan | 3,025,958 | 4,090,300 | 3,922,877 | 4,537,041 | 6,054,324 | 6,253,952 | 6,436,988 | 6,710,434 | 6,364,173 | 6,587,818 |
| Tertiary industry value/Ten thousand yuan | 1,754,282 | 2,261,797 | 2,544,693 | 2,958,520 | 3,332,227 | 3,713,684 | 4,179,904 | 4,457,653 | 4,866,689 | 5,420,065 |
| Fixed-asset investment/Ten thousand yuan | 3,002,795 | 3,903,663 | 5,672,020 | 7,512,872 | 8,300,152 | 10,221,292 | 12,269,171 | 14,271,480 | 15,351,492 | 16,327,796 |
| Investment in environmental protection/Ten thousand yuan | 52,187 | 53,216 | 51,546 | 58,995 | 60,125 | 59,987 | 62,113 | 61,201 | 63,854 | 66,589 |
| Per capita disposable income/yuan | 9439.6 | 10,861.28 | 11,950.99 | 13,212 | 15,037.6 | 16,832.2 | 20,637 | 20,983 | 22,885 | 24,856 |
| Surface water supply/100 Mm3 | 3.9731 | 3.85 | 3.72 | 3.675 | 3.6275 | 3.6007 | 3.6726 | 4.0146 | 3.9622 | 3.7637 |
| Groundwater supply/100 Mm3 | 5.8692 | 6.31 | 5.9345 | 5.9734 | 5.5821 | 5.4793 | 5.3193 | 5.2431 | 4.9968 | 5.045 |
| Sewage treatment amount/100 M m3 | - | - | - | - | 0.0818 | 0.0819 | 0.1407 | 0.2048 | 0.1198 | - |
| Total water supply/100 Mm3 | 9.8405 | 10.16 | 9.67 | 9.6694 | 9.2961 | 9.1617 | 9.1367 | 9.4688 | 9.0829 | 8.9312 |
| Localized surface and inbound water/100 Mm3 | 1.4824 | 1.4824 | 1.1272 | 1.1347 | 1.7973 | 1.3547 | 1.7631 | 1.1059 | 1.2391 | 1.246 |
| Shallow groundwater/100 Mm3 | 5.8692 | 6.31 | 5.9345 | 5.9734 | 5.5821 | 5.4793 | 5.3193 | 5.2431 | 4.9968 | 5.045 |
| Deep water/100 Mm3 | 0 | 0 | 0 | 0 | 0 | 0 | 0 | 0 | 0 | 0 |
| Water consumption in agriculture, forestry, fishery and animal husbandry/100 Mm3 | 6.7788 | 6.54 | 6.78 | 6.2463 | 5.6266 | 5.7969 | 5.8349 | 6.0974 | 5.6622 | 5.9347 |
| Industrial water consumption/100 Mm3 | 1.5124 | 1.97 | 1.65 | 1.8122 | 2.0546 | 2.034 | 1.9755 | 2.0054 | 1.7208 | 1.612 |
| Domestic water consumption/100 Mm3 | 1.5493 | 1.65 | 1.24 | 1.6109 | 1.615 | 1.633 | 1.6822 | 2.472 | 1.7 | 1.8 |
| Urban public water consumption/100 Mm3 | 0.1775 | 0.1901 | 0.1951 | 0.2212 | 0.2555 | 0.2838 | 0.304 | 0.2931 | 0.2859 | 0.3069 |
| Household water consumption/100 Mm3 | 0.9252 | 0.9884 | 0.9874 | 1.1235 | 1.0836 | 0.9901 | 0.9628 | 1.0006 | 0.9715 | 0.9885 |
| Urban residents’ water consumption/100 Mm3 | 0.4076 | 0.4283 | 0.4358 | 0.4624 | 0.4738 | 0.4826 | 0.4766 | 0.4982 | 0.4686 | 0.4786 |
| Rural residents’ water consumption/100 Mm3 | 0.5176 | 0.5601 | 0.5516 | 0.5611 | 0.5098 | 0.5075 | 0.4862 | 0.5024 | 0.5029 | 0.5023 |
| Ecological environment water consumption/100 Mm3 | 0.0269 | 0.0308 | 0.0543 | 0.0389 | 0.0498 | 0.0569 | 0.0595 | 0.0703 | 0.0765 | 0.089 |
| Urban environmental water consumption/100 Mm3 | 0.0269 | 0.0303 | 0.538 | 0.0389 | 0.0498 | 0.0569 | 0.0595 | 0.0603 | 0.0675 | 0.0689 |
| Total water consumption/100 Mm3 | 9.8045 | 10.16 | 9.67 | 9.6694 | 9.2961 | 9.1617 | 9.1367 | 9.4668 | 9.0829 | 8.9312 |
Appendix B
Table A2.
Determining table of water resource supply, water environment, demand, economy, and population in Chengde City from 2011 to 2014.
Table A2.
Determining table of water resource supply, water environment, demand, economy, and population in Chengde City from 2011 to 2014.
| Years | Projects | SW | SS | RW | GW | TWS | AW | DW | EEW | IW | TWC |
|---|---|---|---|---|---|---|---|---|---|---|---|
| 2011 | Actual value/ 100 Mm3 | 3.628 | 0.005 | 1.520 | 5.319 | 10.472 | 5.626 | 2.615 | 0.047 | 2.054 | 10.472 |
| Analog value/ 100 Mm3 | 3.523 | 0.005 | 1.450 | 4.956 | 9.934 | 5.619 | 2.614 | 0.045 | 2.032 | 10.310 | |
| Relative error/% | 2.894 | 0.000 | 0.258 | 6.824 | 5.137 | 0.331 | 0.005 | 4.255 | 0.687 | 1.254 | |
| 2012 | Actual value/ 100 Mm3 | 3.601 | 0.004 | 1.487 | 5.275 | 10.367 | 5.753 | 2.512 | 0.056 | 1.956 | 10.367 |
| Analog value/100 Mm3 | 3.559 | 0.004 | 1.412 | 4.755 | 9.730 | 5.712 | 2.497 | 0.054 | 1.878 | 10.141 | |
| Relative error/% | 1.166 | 0.000 | 6.753 | 9.857 | 6.125 | 0.856 | 0.813 | 3.571 | 3.564 | 2.456 | |
| 2013 | Actual value/ 100 Mm3 | 3.672 | 0.005 | 1.413 | 5.331 | 10.421 | 5.596 | 2.631 | 0.062 | 2.132 | 10.421 |
| Analog value/ 100 Mm3 | 3.594 | 0.005 | 1.296 | 4.864 | 9.759 | 5.543 | 2.512 | 0.059 | 1.989 | 10.103 | |
| Relative error/% | 2.124 | 0.000 | 6.543 | 8.760 | 6.324 | 0.978 | 6.94 | 4.838 | 6.564 | 3.645 | |
| 2014 | Actual value/ 100 Mm3 | 4.014 | 0.003 | 1.265 | 5.263 | 10.545 | 5.697 | 2.546 | 0.053 | 2.249 | 10.545 |
| Analog value/ 100 Mm3 | 3.954 | 0.003 | 1.159 | 4.798 | 9.914 | 5.588 | 2.436 | 0.048 | 2.065 | 10.137 | |
| Relative error/% | 1.494 | 0.000 | 8.379 | 9.689 | 5.563 | 1.913 | 4.321 | 9.432 | 3.637 | 3.998 | |
| Years | Projects | AN | BOD | WW | TP | RP | UP | EI | FAI | GDP | |
| 2011 | Actual value/ 100 Mm3 | 2.482 | 22.152 | 5.951 | 0.374 | 0.121 | 0.254 | 148.372 | 8300.152 | 11,564.985 | |
| Analog value/ 100 m3 | 2.573 | 23.551 | 5.423 | 0.374 | 0.121 | 0.254 | 160.527 | 8255.635 | 11,459.364 | ||
| Relative error/% | 3.662 | 6.314 | 8.931 | 0 | 0 | 0 | 8.195 | 6.253 | 0.563 | ||
| 2012 | Actual value/ 100 Mm3 | 2.451 | 21.433 | 5.921 | 0.376 | 0.115 | 0.261 | 220.922 | 11,546.785 | 15,004.331 | |
| Analog value/ 100 Mm3 | 2.394 | 21.621 | 5.844 | 0.371 | 0.111 | 0.260 | 239.931 | 11,454.934 | 14,998.112 | ||
| Relative error/% | 2.392 | 0.874 | 1.371 | 1.329 | 0.358 | 0.388 | 8.591 | 1.456 | 1.563 | ||
| 2013 | Actual value/ 100 Mm3 | 2.385 | 20.911 | 5.991 | 0.378 | 0.104 | 0.274 | 240.562 | 13,047.761 | 16,554.321 | |
| Analog value/ 100 Mm3 | 2.155 | 19.642 | 6.351 | 0.374 | 0.099 | 0.265 | 217.911 | 11,840.41 | 17,885.996 | ||
| Relative error/% | 9.831 | 6.071 | 6.072 | 1.336 | 4.846 | 3.284 | 9.411 | 9.254 | 2.663 | ||
| 2014 | Actual value/ 100 Mm3 | 1.574 | 10.335 | 6.771 | 0.381 | 0.091 | 0.290 | 201.983 | 14,785.364 | 17,448.326 | |
| Analog value/ 100 Mm3 | 1.642 | 10.272 | 6.793 | 0.379 | 0.088 | 0.291 | 197.141 | 12,546.358 | 15,777.653 | ||
| Relative error/% | 4.691 | 0.612 | 0.351 | 1.324 | 0.329 | 0.344 | 2.394 | 4.832 | 4.987 |
References
- Li, Y.-H.; Chen, P.-Y.; Lo, W.-H.; Tung, C.-P. Integrated water resources system dynamics modeling and indicators for sustainable rural community. Paddy Water Environ. 2015, 13, 29–41. [Google Scholar] [CrossRef]
- Xi, X.; Poh, K.L. Using System Dynamics for Sustainable Water Resources Management in Singapore. Procedia Comput. Sci. 2013, 16, 157–166. [Google Scholar] [CrossRef] [Green Version]
- Yang, J.; Lei, K.; Khu, S.; Meng, W. Assessment of Water Resources Carrying Capacity for Sustainable Development Based on a System Dynamics Model: A Case Study of Tieling City, China. Water Resour. Manag. 2015, 73, 885–899. [Google Scholar] [CrossRef]
- Xi, X.; Poh, K.L. A Novel Integrated Decision Support Tool for Sustainable Water Resources Management in Singapore: Synergies Between System Dynamics and Analytic Hierarchy Process. Water Resour. Manag. 2014, 29, 1329–1350. [Google Scholar] [CrossRef]
- Xu, Z.X.; Takeuchi, K.; Ishidaira, H.; Zhang, X.W. Sustainability Analysis for Yellow River Water Resources Using the System Dynamics Approach. Water Resour. Manag. 2002, 16, 239–261. [Google Scholar] [CrossRef]
- Dawadi, S.; Ahmad, S. Evaluating the impact of demand-side management on water resources under changing climatic conditions and increasing population. J. Environ. Manag. 2013, 114, 261–275. [Google Scholar] [CrossRef] [PubMed]
- Sušnik, J.; Vamvakeridou-Lyroudia, L.S.; Savić, D.A.; Kapelan, Z. Integrated System Dynamics Modelling for water scarcity assessment: Case study of the Kairouan region. Sci. Total Environ. 2012, 440, 290–306. [Google Scholar] [CrossRef]
- Zarghami, M.; Akbariyeh, S. System dynamics modeling for complex urban water systems: Application to the city of Tabriz, Iran. Resour. Conserv. Recycl. 2012, 60, 99–106. [Google Scholar] [CrossRef]
- Dai, S.; Li, L.; Xu, H.; Pan, X.; Li, X. A system dynamics approach for water resources policy analysis in arid land: A model for Manas River Basin. J. Arid Land 2012, 5, 118–131. [Google Scholar] [CrossRef]
- Ahmad, S.; Simonovic, S.P. Spatial System Dynamics: New Approach for Simulation of Water Resources Systems. J. Comput. Civ. Eng. 2004, 18, 331–340. [Google Scholar] [CrossRef]
- Chengde Municipal Water Bureau. Chengde City Water Resource Bulletin; Chengde Municipal Water Bureau: Chengde, China, 2016; pp. 4–22. (In Chinese) [Google Scholar]
- Qin, H.H.; Zhang, B.Q.; Meng, F.H. Study on water resource supply and demand in Longkou city based on system dynamics. J. Water Resour. Water Eng. 2017, 28, 45–49, 57. (In Chinese) [Google Scholar]
- Robinson, S.B. Stella: Modelling and Simulation Software. BYTE 1986, 13, 277–278. [Google Scholar]
- Thiriez, H. Stella. Eur. J. Oper. Res. 1998, 2, 286–287. [Google Scholar]
- Wei, T.; Lou, I.; Yang, Z.; Li, Y. A system dynamics urban water management model for Macau. China. J. Environ. Sci. 2016, 50, 117–126. [Google Scholar] [CrossRef] [Green Version]
- Wang, B.; Cai, Y.; Yin, X.; Tan, Q.; Hao, Y. An Integrated Approach of System Dynamics, Orthogonal Experimental Design and Inexact Optimization for Supporting Water Resources Management under Uncertainty. Water Resour. Manag. 2017, 31, 1666–1694. [Google Scholar] [CrossRef]
- Kim, T.J.; Wurbs, R.A. Development of monthly naturalized flow using Water Rights Analysis Package (WRAP)-based methods. KSCE J. Civ. Eng. 2011, 15, 1299–1307. [Google Scholar] [CrossRef]
- Tohid, E.; Ivana, H.; Harou, J.J. Tracking trade transactions in water resource systems: A node-arc optimization formulation. Water Resour. Res. 2013, 49, 3038–3043. [Google Scholar]
- Gohari, A.; Madani, A.M. System Dynamics Evaluation of Climate Change Adaptation Strategies for Water Resources Management in Central Iran. Water Resour. Manag. 2017, 31, 1413–1434. [Google Scholar] [CrossRef] [Green Version]
- Nazarialamdarloo, T.; Jamali, H.A.; Nazari, B.; Emamjomeh, M.M.; Karyab, H. A system dynamics approach for water resources management with focusing on domestic water demand. Environ. Health Eng. Manag. J. 2020, 7, 229–235. [Google Scholar] [CrossRef]
- Zhang, B.W. Analysis on the change characteristics of water use structure in Chengde. J. Water Sci. Technol. Econ. 2015, 21, 64–68. (In Chinese) [Google Scholar]
- Li, T.; Liu, Q.; Sui, P. Water resources change and sustainability assessment in Hebei province. J. China Agric. Univ. 2021, 26, 11–20. (In Chinese) [Google Scholar]
- Xu, Z.Q.; Liu, X.Y.; Yuan, P.; Zhang, M.L.; Xiao, S.H.; Liao, C.G. Study on dynamic change of water environment carrying capacity in Nanjing. Study Methodol. Environ. Sci. 2019, 32, 557–564. (In Chinese) [Google Scholar]
- Beall, A.; Fiedler, F.; Boll, J.; Cosens, B. Sustainable Water Resource Management and Participatory System Dynamics. Case Study: Developing the Palouse Basin Participatory Model. Sustainability 2011, 3, 720–742. [Google Scholar] [CrossRef] [Green Version]
- Qin, H.H.; Zheng, C.M.; He, X.; Refsgaard, J.C. Analysis of Water Management Scenarios Using Coupled Hydrological and System Dynamics Modeling. Water Resour. Manag. 2019, 33, 4849–4863. [Google Scholar] [CrossRef]
- Bao, C.; He, D. Scenario Modeling of Urbanization Development and Water Scarcity Based on System Dynamics: A Case Study of Beijing-Tianjin-Hebei Urban Agglomeration, China. Int. J. Environ. Res. Public Health 2019, 16, 3834. [Google Scholar] [CrossRef] [PubMed] [Green Version]
- Liu, Y.M. Analysis of Water Resources Optimization and Protection Scheme in Chengde City Center. Water Sci. Eng. Technol. 2015, 34, 34–35. (In Chinese) [Google Scholar]
Figure 1.
Location of Chengde City of China.

Figure 2.
Technical route.

Figure 3.
Sustainable model of utilization for water resources in Chengde City.

Figure 4.
Population subsystem model of Chengde City.

Figure 5.
Economic subsystem model of Chengde City.

Figure 6.
Model of water resource supply subsystem in Chengde City.

Figure 7.
Subsystem model of water resource demand in Chengde City.

Figure 8.
Water environment subsystem model of Chengde City.

Figure 9.
Changes of total water use under four simulated conditions in Chengde City from 2017 to 2025.
Figure 9.
Changes of total water use under four simulated conditions in Chengde City from 2017 to 2025.

Figure 10.
Total water supply changes under four simulated conditions in Chengde City from 2017 to 2025.
Figure 10.
Total water supply changes under four simulated conditions in Chengde City from 2017 to 2025.

Figure 11.
Trends of water supply and demand gaps over time under four simulated scenarios in Chengde from 2017–2025.
Figure 11.
Trends of water supply and demand gaps over time under four simulated scenarios in Chengde from 2017–2025.

Table 1.
Population system variable.
| Number | Variable Name | Explanation |
|---|---|---|
| 1 | Total population | Number of residents in population at year-end |
| 2 | Population growth | The number of new people added each year |
| 3 | Population growth rate | The ratio of the annual increase of population to the annual total population reflects the speed of population change |
| 4 | Urban population | Urban population |
| 5 | Rural population | Rural population |
| 6 | Urbanization rate | The urbanization level is reflected by the ratio of urban population to total population |
| 7 | UR increase | The increment in the urban population: total population ratio reflects the growth in the urbanization level |
| 8 | UR increase rate | The increase rate of the urban population: total population ratio reflects the urbanization level growth rate |
Table 2.
Economy system variable.
| Number | Variable Name | Explanation |
|---|---|---|
| 1 | GDP | The monetary value of all final outputs of a region’s economy during a given period |
| 2 | PI increase | The added value per unit output of the primary industry over a specific period |
| 3 | SI increase | The added value per unit output of the secondary industry over a certain period |
| 4 | TI increase | The added value per unit output of the tertiary industry over a certain period |
| 5 | Fix asset investment | The amount of work and expenses associated with the construction and purchase of fixed assets by an enterprise in a given period |
| 6 | FAI proportion | The proportion of the total investment in fixed assets in the total investment |
| 7 | Environment investment | Investments made to protect and improve environmental quality and prevent ecological deterioration |
| 8 | EI proportion | Investment in environmental protection as a proportion of total investment |
| 9 | Investment | Total investment in fixed assets and environmental conservation over a certain period |
| 10 | Investment proportion | Total investment as a proportion of GDP |
| 11 | PI increase rate | The ratio of the growth in the output of the primary industry over a certain period to the data in the base period |
| 12 | SI increase rate | The ratio of the growth in the output of the secondary industry over a certain period to the data in the base period |
| 13 | TI increase rate | The ratio of the growth in the output of the tertiary industry over a certain period to the data in the base period |
Table 3.
Water supply system variable.
| Number | Variable Name | Explanation |
|---|---|---|
| 1 | SW | The amount of water supplied on the surface of the earth’s crust and exposed to the atmosphere |
| 2 | GW | The amount of water supplied to a saturated aquifer below the surface of the ground |
| 3 | RW | The amount of wastewater or sewage that is returned to a production system or household post-secondary and advanced treatment |
| 4 | SS | The amount of fresh water obtained by processing rainwater |
| 5 | TWS | The total amount of water provided to the user, including water loss |
| 6 | Pump | The amount of water supplied through the water lifting project |
| 7 | DS | The amount of water supplied by drinking water projects |
| 8 | PS | Quantity of water flowing into the region from upstream |
| 9 | SS | The amount of water from atmospheric precipitation and surface runoff permeation |
| 10 | Water source | River storage for provision of water for domestic purposes, industry, and agriculture |
| 11 | Underground water | The amount of water buried in the previous layer beneath the first impervious layer |
| 12 | Sewage water | Water that is reused after treatment of sewage |
Table 4.
Water demand system variable.
| Number | Variable Name | Explanation |
|---|---|---|
| 1 | AW | Total water use for irrigation and rural livestock |
| 2 | FF | The total amount of water applied for forest fruit trees |
| 3 | I | Total amount of water used for irrigation |
| 4 | FP | The total amount of water used for fishpond farming |
| 5 | L | The total amount of water used by rural livestock |
| 6 | IW | The total amount of production water employed in the industrial production procedure and the daily water utilized by workers in the factory |
| 7 | DW | The total amount of water used for public services and households |
| 8 | UP | Total water use for urban public services |
| 9 | UWD | Total domestic water consumption |
| 10 | URC | Total water use in urban public construction |
| 11 | UR | Total domestic water consumption of urban residents |
| 12 | PR | Total domestic water consumption of rural residents |
| 13 | PURC | Per capita urban domestic water utilization |
| 14 | PRUC | Per capita rural domestic water utilization |
| 15 | EEW | The minimum water required for sustaining or rehabilitating and developing the ecological environment |
| 16 | UE | Water consumption to maintain the urban ecological environment |
| 17 | RE | Water consumption to maintain the rural ecological environment |
| 18 | TWC | The total water quantity utilized in an area |
Table 5.
Water environment system variable.
| Number | Variable Name | Explanation |
|---|---|---|
| 1 | BOD | Total water consumption on BOD emission scale function |
| 2 | AN | The total amount of water used is a scale function of ammonia nitrogen emissions |
| 3 | BODR | The rate at which BOD is discharged from wastewater |
| 4 | ANR | The rate at which ammonia nitrogen is discharged from wastewater |
| 5 | WW | Wastewater content within the total water used |
| 6 | WWR | Wastewater as a proportion of total water used |
| 7 | RW rate | Sewage or wastewater re-used for the production system or domestic use after secondary processing and advanced processing as a proportion of total water used |
Table 6.
Table showing model verification for water resource supply, water environment, demand, economy and population in Chengde City in 2016.
Table 6.
Table showing model verification for water resource supply, water environment, demand, economy and population in Chengde City in 2016.
| Years | Projects | SW | SS | RW | GW | TWS | AW | DW | EEW | IW | TWC |
|---|---|---|---|---|---|---|---|---|---|---|---|
| 2016 | Actual value/M m3 | 3.764 | 0.004 | 1.432 | 5.116 | 10.316 | 5.435 | 2.013 | 0.052 | 2.816 | 10.316 |
| Analog value/M m3 | 3.678 | 0.004 | 1.389 | 4.954 | 10.025 | 5.332 | 1.994 | 0.049 | 2.647 | 10.019 | |
| Relative error/% | 2.284 | 0.000 | 3.002 | 3.167 | 2.820 | 1.895 | 1.043 | 5.769 | 6.001 | 2.879 | |
| Years | Projects | AN | BOD | WW | TP | RP | UP | EI | FAI | GDP | |
| 2016 | Actual value/M m3 | 2.476 | 21.547 | 5.876 | 0.359 | 0.154 | 0.257 | 230.145 | 15,274.691 | 18,549.193 | |
| Analog value/M m3 | 2.339 | 21.021 | 5.536 | 0.359 | 0.149 | 0.249 | 229.556 | 14,946.602 | 18,487.221 | ||
| Relative error/% | 2.95 | 2.441 | 5.786 | 0.000 | 3.246 | 3.112 | 0.260 | 2.148 | 0.334 |
Table 7.
Main parameter sensitivity of the model.
| Parameter | Sensitivity |
|---|---|
| Rate of natural growth | 0.05 |
| Rate of growth in the urbanization rate | 4.98 |
| Rate of investment | 1.25 |
| Rate of environmental investment | 3.36 |
| Rate of investment in fixed assets | −0.56 |
| Wastewater production rate | 4.23 |
| Recycle rate of wastewater | 0.01 |
| Rate of GDP of primary industry | −0.31 |
| Rate of GDP growth of secondary industry | 0.46 |
| Rate of GDP growth of tertiary industry | 2.12 |
Publisher’s Note: MDPI stays neutral with regard to jurisdictional claims in published maps and institutional affiliations. |
© 2021 by the authors. Licensee MDPI, Basel, Switzerland. This article is an open access article distributed under the terms and conditions of the Creative Commons Attribution (CC BY) license (https://creativecommons.org/licenses/by/4.0/).
Share and Cite
MDPI and ACS Style
Wang, B.; Tian, Y.; Li, X.; Li, C. Analysis and Prediction of Sustainable Utilization of Water Resources in Chengde City Based on System Dynamics Model. Water 2021, 13, 3534. https://doi.org/10.3390/w13243534
AMA Style
Wang B, Tian Y, Li X, Li C. Analysis and Prediction of Sustainable Utilization of Water Resources in Chengde City Based on System Dynamics Model. Water. 2021; 13(24):3534. https://doi.org/10.3390/w13243534
Chicago/Turabian StyleWang, Bofan, Yutong Tian, Xuanjin Li, and Chunhui Li. 2021. "Analysis and Prediction of Sustainable Utilization of Water Resources in Chengde City Based on System Dynamics Model" Water 13, no. 24: 3534. https://doi.org/10.3390/w13243534
Note that from the first issue of 2016, this journal uses article numbers instead of page numbers. See further details here.