
Responses of Net Anthropogenic N Inputs and Export Fluxes in the Megacity of Chengdu, China
by
 ,
,
Yao Ding
1,2 ,
,
Chengyue Lai
2,
Qing Shi
2,
Lili Ouyang
2,
Zhaoli Wang
2,
Gang Yao
1,3 and
Binyang Jia
4,* 1
College of Architecture & Environment, Sichuan University, Chengdu 610065, China
2
Institute of Water Environment, Chengdu Institute of Environmental Protection, Chengdu 610072, China
3
Institute for Environmental Engineering, RWTH Aachen University, 52062 Aachen, Germany
4
Chengdu Environmental Emergency Command and Support Center, Chengdu 610066, China
*
Author to whom correspondence should be addressed.
Water 2021, 13(24), 3543; https://doi.org/10.3390/w13243543
Submission received: 5 November 2021
/
Revised: 3 December 2021
/
Accepted: 7 December 2021
/
Published: 11 December 2021
(This article belongs to the Special Issue Application of Data-Driven Methods for Analyzing Complex Environmental and Ecological Data)
Abstract
:Anthropogenic N inputs have become progressively more problematic and have profoundly affected the water quality in megacities throughout China. Thus, to design and implement appropriate megalopolis watershed management, it is important to understand the relationship between N inputs and exports and to identify the N pollution sources. To that end, in this work, the net anthropogenic N inputs (NANI) in Chengdu City were estimated based on statistical data collected between 1970 and 2019. N input fluxes and pollution sources were estimated through sample collection and field measurements that were performed between 2017 and 2019, while nitrate () was identified using stable isotope and Bayesian model (SIAR) analysis. The NANI was found to be affected primarily by livestock and poultry consumption of N rich feed. Moreover, the N export fluxes and runoff showed a high degree of correlation. Notably, fluxes exhibited a significant increase over the course of the study period, such that, by 2019, the total N fluxes (18,883.85 N kg/) exceeded the NANI (17,093.87 N kg/). The results indicate that although livestock and poultry farming were the original primary sources of NANI, their contributions declined on an annual basis. Moreover, with the emphasis placed on point source management in Chengdu City, domestic sewage discharge has been significantly reduced. Therefore, N retention in groundwater is thought to be the factor driving the N flux increase. These findings are pivotal to solving the N pollution problem in megacities like Chengdu (China).
1. Introduction
Balancing population growth, industrial development, and environmental quality is a challenge that is experienced on a global scale [1,2,3,4,5]. Among a plethora of issues, rapid urbanization has led to surface runoff pollution problems—such as pollutants flowing from paved roads into rivers with rainwater, industrial and domestic sewage discharge, atmospheric deposition pollution, and excessive fertilizer application [6,7,8,9,10]. The Yangtze River is considered the birthplace of Chinese civilization and is a strategic economic development area in China. As the furthest upstream megacity in the Yangtze River Basin, Chengdu City water pollution directly impacts economic development and water quality in the Yangtze River’s lower reaches.
N inputs from anthropogenic activities have affected the global N cycle worldwide [11,12,13]. As such, nitrate () pollution in surface water has gradually attracted attention from the scientific community. This study is particularly relevant because decision makers in most Chinese cities disregard nitrate pollution and are, therefore, unable to propose appropriate control measures in the context of global nitrate pollution. Notably, is the main form of N in surface water [14,15,16], and excessive inputs can lead to eutrophication. Furthermore, long-term consumption poses a serious threat to human health (e.g., gastric cancer [16,17,18] and blue baby syndrome [19,20,21]). Moreover, once the water environment is polluted with , self-purification is unlikely to occur [22,23,24]. To ensure that the water quality remains healthy, it is particularly important to clarify the source(s) of in surface water and explore its transformation pathway. surface water sources are complex and varied, and include: precipitation, soil N mineralization, field fertilization, septic tank discharge, manure, domestic sewage, and industrial wastewater [25,26,27,28]. The N and O isotope compositions in that originate from different sources present distinct characteristics, which can be used to identify the sources and analyze the N cycling process [15,29]. As compared to source pollution models (e.g., SWAT, AGNPS, etc.), using - and - to identify nitrate sources is simpler and faster [30,31], and was therefore the selected method for this investigation.
The goal of this study was to estimate the net anthropogenic N inputs (NANI) and the -N export fluxes of the Yangtze River Basin in Chengdu. Moreover, the N pollution sources were investigated based on dual stable isotopes (- and -) to determine the response relationship between anthropogenic activities and environmental water quality. The results presented herein can be used to support watershed management in megacities, enrich the global isotope database, and promote the development of isotope geochemistry research.
2. Materials and Methods
2.1. Study Area
As one of the seven megacities located in China, Chengdu has a population of 20.94 million—68.74% of whom are from 15–59 years old. Thus, Chengdu’s Working Age population is numerically superior to those of Beijing and Shanghai. Furthermore, the urbanization rate has reached a total of 77%, which is lower than that of China’s other megacities. Both of these values emphasize Chengdu’s extensive development potential. In 2020, Chengdu’s GDP was 1.77 trillion CNY, the 8th highest in China.
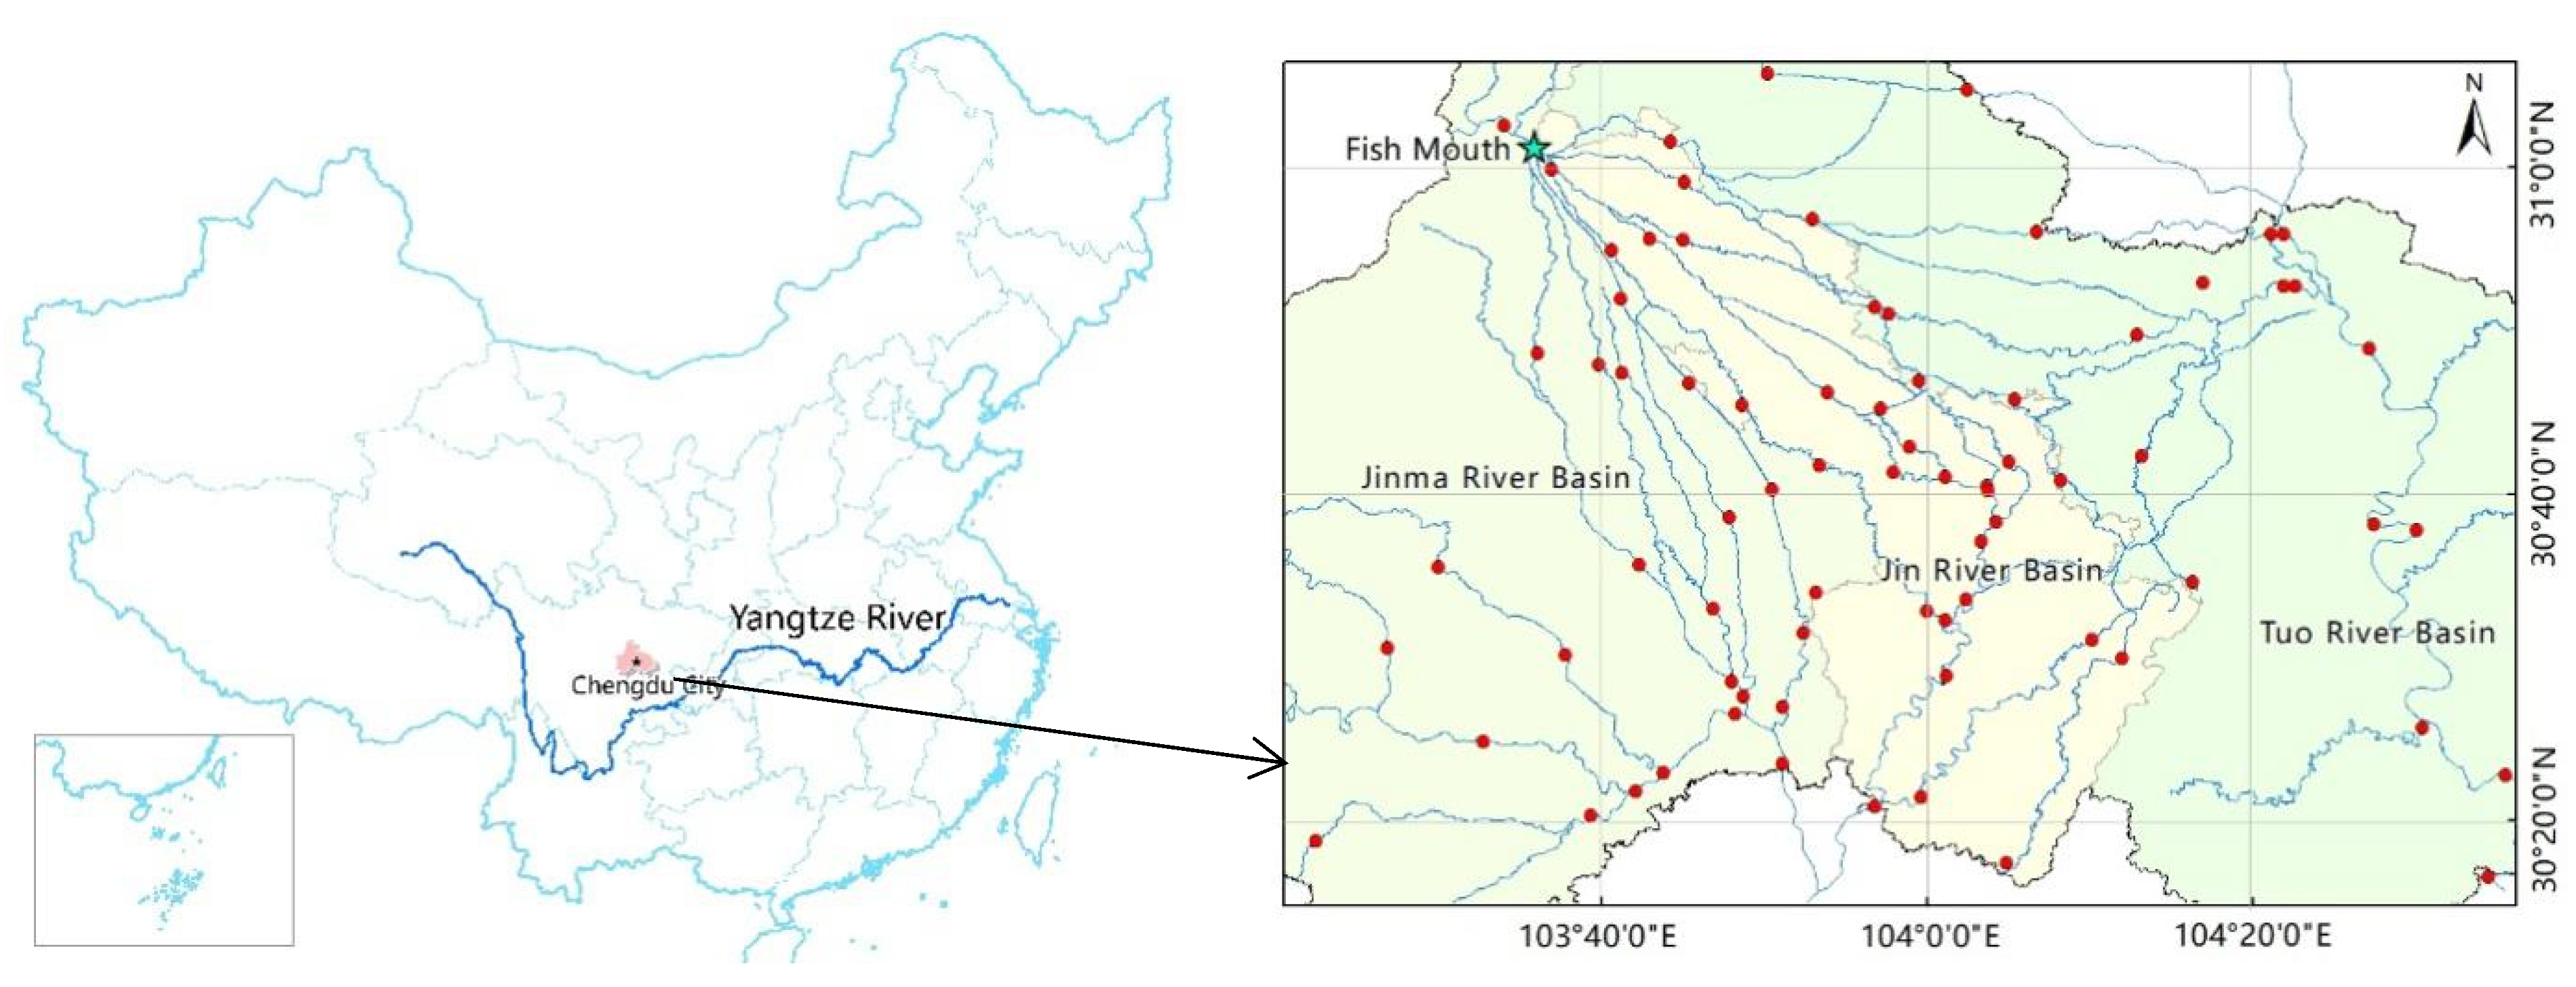
Chengdu was built in the upper reaches of the Yangtze River Basin (Figure 1) and covers an area of 14,335 . It is located within the subtropical humid monsoon climate zone, and experiences an average annual temperature of 15.2–16.6 °C and an annual rainfall of 800–1400 mm. Interestingly, Chengdu straddles two water systems, the Minjiang River and the Tuojiang River. The Minjiang River, which was once considered the Yangtze River’s main stream, divides into the Jinma River Basin (JM) and the Jinjiang River Basin (J) at the Dujiangyan Fish Mouth (i.e., part of a famous ancient water project). Since ancient times, fish mouths have provided a steady flow of water to the J throughout the year, allowing agricultural irrigation and preventing floods. Excess water flows to the JM, which is mainly used for flood discharge. Although the Tuojiang River has its own water system, it actually draws water from the Minjiang River. Notably, the JM, J, and Tuojiang River Basin (T) account for 44.43%, 15.94%, and 39.63% of the total watershed, respectively.
2.2. Calculation of the NANI
The NANI values in three watersheds were quantified based on sampling conducted between 1970 and 2020. Data for 1980, 1990, 2000, and 2010–2019 were obtained from the Chengdu Statistical Yearbook, while data for 1970 were estimated by time-line interpolation. Most of the values were traced to food/feed inputs, agricultural fixation, fertilizer application, and atmospheric deposition. This relationship is mathematically expressed as [32,33]:
where = food/feed N inputs, = fertilizer N inputs, = N from crop fixation, and = N from atmospheric deposition. All the variables are presented in .
2.2.1. Calculation of
The values were calculated by summing the anthropogenic and livestock N consumption (i.e., the positive N fluxes into the study area), and then subtracting the livestock and agricultural crop N production (i.e., the negative N fluxes from the study area). This formula is mathematically expressed as [32,33]:
where and represent the N consumption from food (anthropogenic) and feed (livestock), respectively, while and are the N contents in livestock/poultry products and agricultural crop products, respectively. All the variables are presented in .
was estimated based on the population size and the protein-N content of the food intake. As such, was calculated separately for urban and rural populations. In contrast, was calculated according to the amount of livestock and poultry and their respective N intake level. represented the N production from animals—i.e., in meat, milk, and eggs—while represented the N content of the crop harvest in the catchment. The values of these variables were estimated by multiplying the production quantity by the N content produced by each animal and crop. The livestock and poultry species considered here included mainly pigs, cattle, sheep, rabbits, and poultry, while the agricultural crop products were mainly paddy, wheat, corn, rapeseed, and potato. Spoilage and inedible components were assumed to cause a 10% loss in the amount of products available for consumption.
2.2.2. Calculation of
was mainly derived from urea-N and combined fertilizers. It is a scalar number representing the quantity of N fertilizer and the N content of combined fertilizers (~32.2%) [32].
2.2.3. Calculation of
was estimated by multiplying the area of each N-fixing crop by its N fixation rate and summing all the results. The N-fixing crops within the study area mainly included soybean, rice, and peanut plants—each of which exhibited N fixation rates of 9600, 4480, and 8000 N kg/, respectively [32].
2.2.4. Calculation of
-N, -N, and atmospheric organic nitrogen (AON) were considered when calculating . The inorganic N deposition data were derived from a dataset in the China Science Data Network, which is based on data collected between 1996 and 2015. This dataset, which depicts the spatial arrangement of inorganic N deposition in China, was the first of its type to be openly accessible, and currently is considered the most reliable, given the available options. AON deposition was assumed to be 15% of the total inorganic N deposition [32]. Missing yearly data were calculated by linear difference.
2.3. River N Export Fluxes
Monthly flow, total nitrogen (TN), and ammonia-N (-N) data from 2011 to 2016 were obtained from the Central Monitoring Station in Chengdu. Based on the 2017–2019 data, which were empirically obtained (Section 2.4.), -N was determined by calculating the difference between TN and -N (-N = (TN − -N) × 0.87. The following formula was used to quantify the N export fluxes (3):
where F represents the riverine N export fluxes (, Q = runoff (), C = annual average N concentration (mg/L), and A = the basin area () [34]. Moreover, “” and “3.17” are the conversion factors for converting mg/L to kg/ and seconds (s) to annual (a).
2.4. Sample Collection and Analysis
From 2017–2019, every month, 75 samples were collected along the full length of the watershed in Chengdu (Figure 1). At each sample site, the water flow was measured using doppler ultrasonography (RiverSurvey M9, SonTek, San Diego, CA, USA). Next, water samples were collected and analyzed for , , nitrite (), and TN. and were measured using ion chromatography (883 Basic IC, Metrohm, HeriSau, Switzerland), while the concentrations were determined by spectrophotometry (722N, Shanghai Jingke, Shanghai, China). The TN was digested with alkaline K persulfate and analyzed by spectrophotometry (UV752, Shanghai Jingke, Shanghai, China) after reducing the -N to -N.
The and analysis was performed after the water samples were filtered in situ with disposable filter devices (0.45 μm pore size, 25 mm diameter, Whatman, GD/X, Maidstone, UK), frozen, and stored at <4 °C in PET centrifuge tubes (15 mL, Sterile, Corning, NY, USA). The - and - were determined via the bacterial denitrification method using an isotope mass spectrometer (MAT 253, ThermoFisher, Waltham, MA, USA) [27,35,36].
2.5. Bayesian Model in R (SIAR) Mixing Model Estimation
The source contributions to the river water samples were quantified using the SIAR mixing model, which can be mathematically expressed as follows [37,38]:
where Xij is the isotope value j of the mixture i (i = 1, 2, 3, …, i and j = 1, 2, 3, …, j); Pk is the proportion of source k (which needs to be estimated by the SIAR model); Sjk is the source value k on isotope j (k = 1, 2, 3, …, k) and is normally distributed, with a mean value = μjk and standard deviation = ωjk [39]; and Cjk is the fractionation factor for isotope j on source k and is normally distributed, with a mean value = λjk and standard deviation = τjk. In addition, εij is the residual error, which represents the additional, unquantified variation between individual mixtures and is normally distributed, with a mean value = 0 and standard deviation = σj [40].
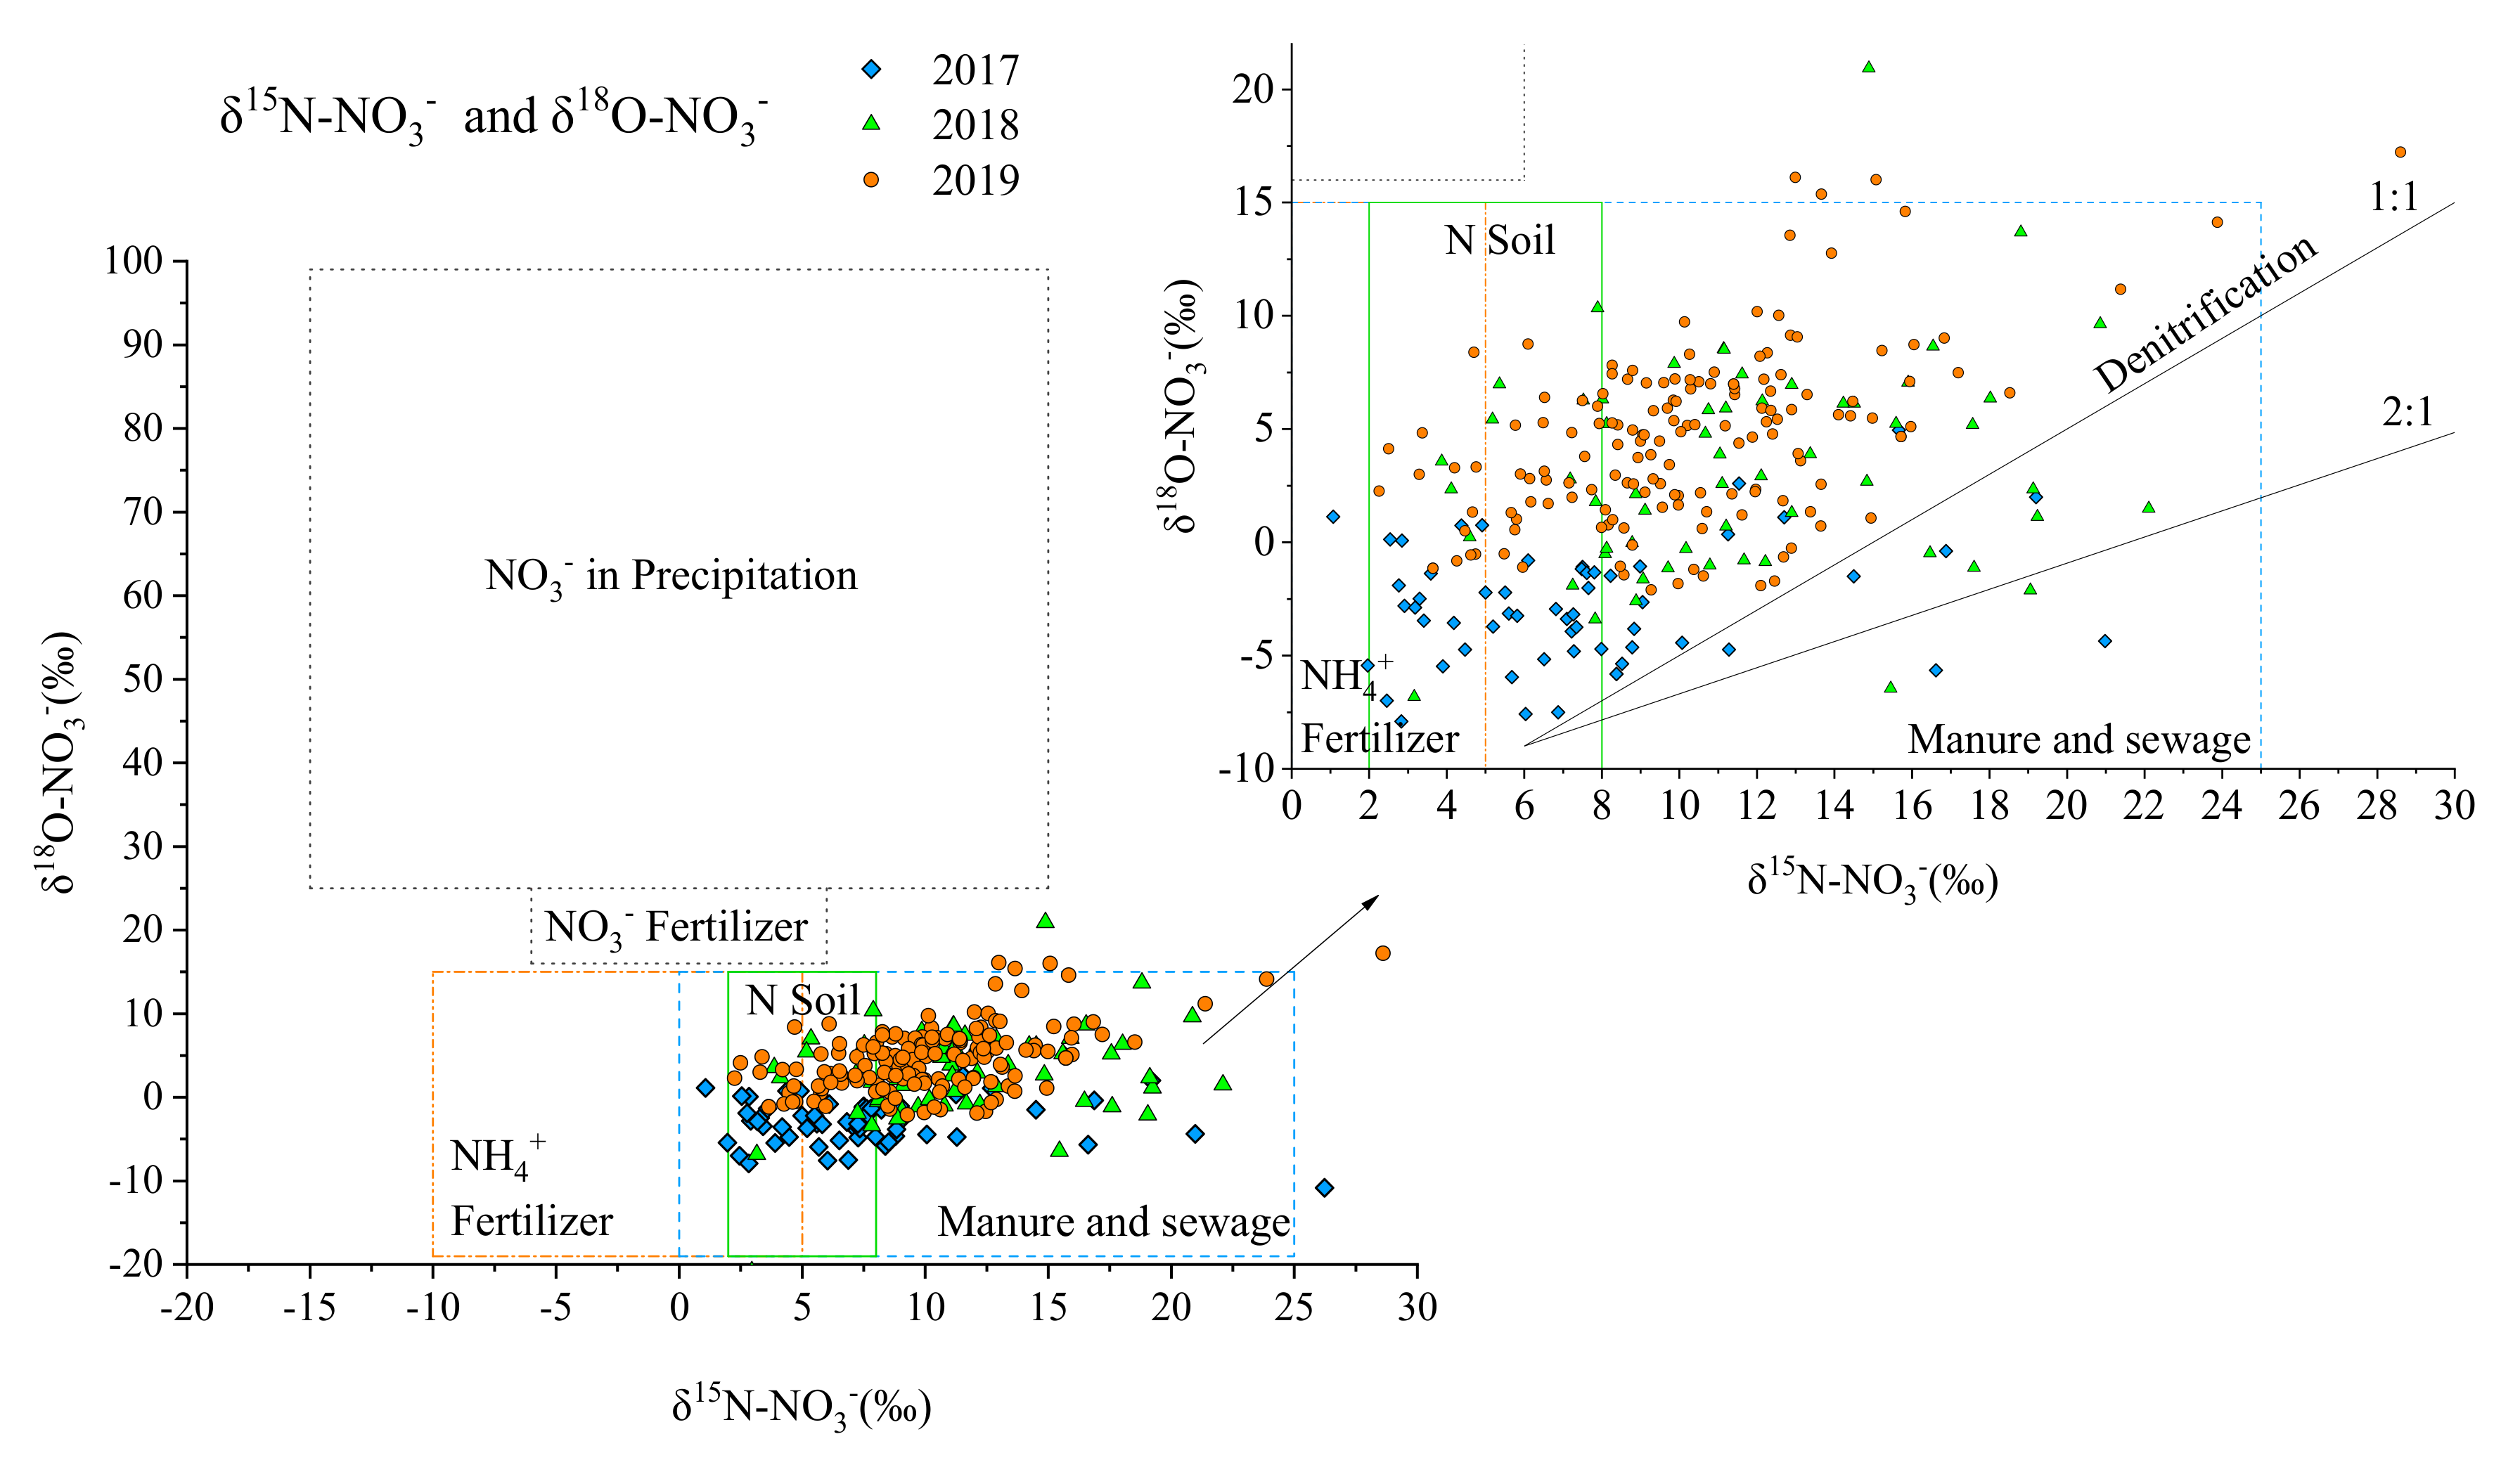
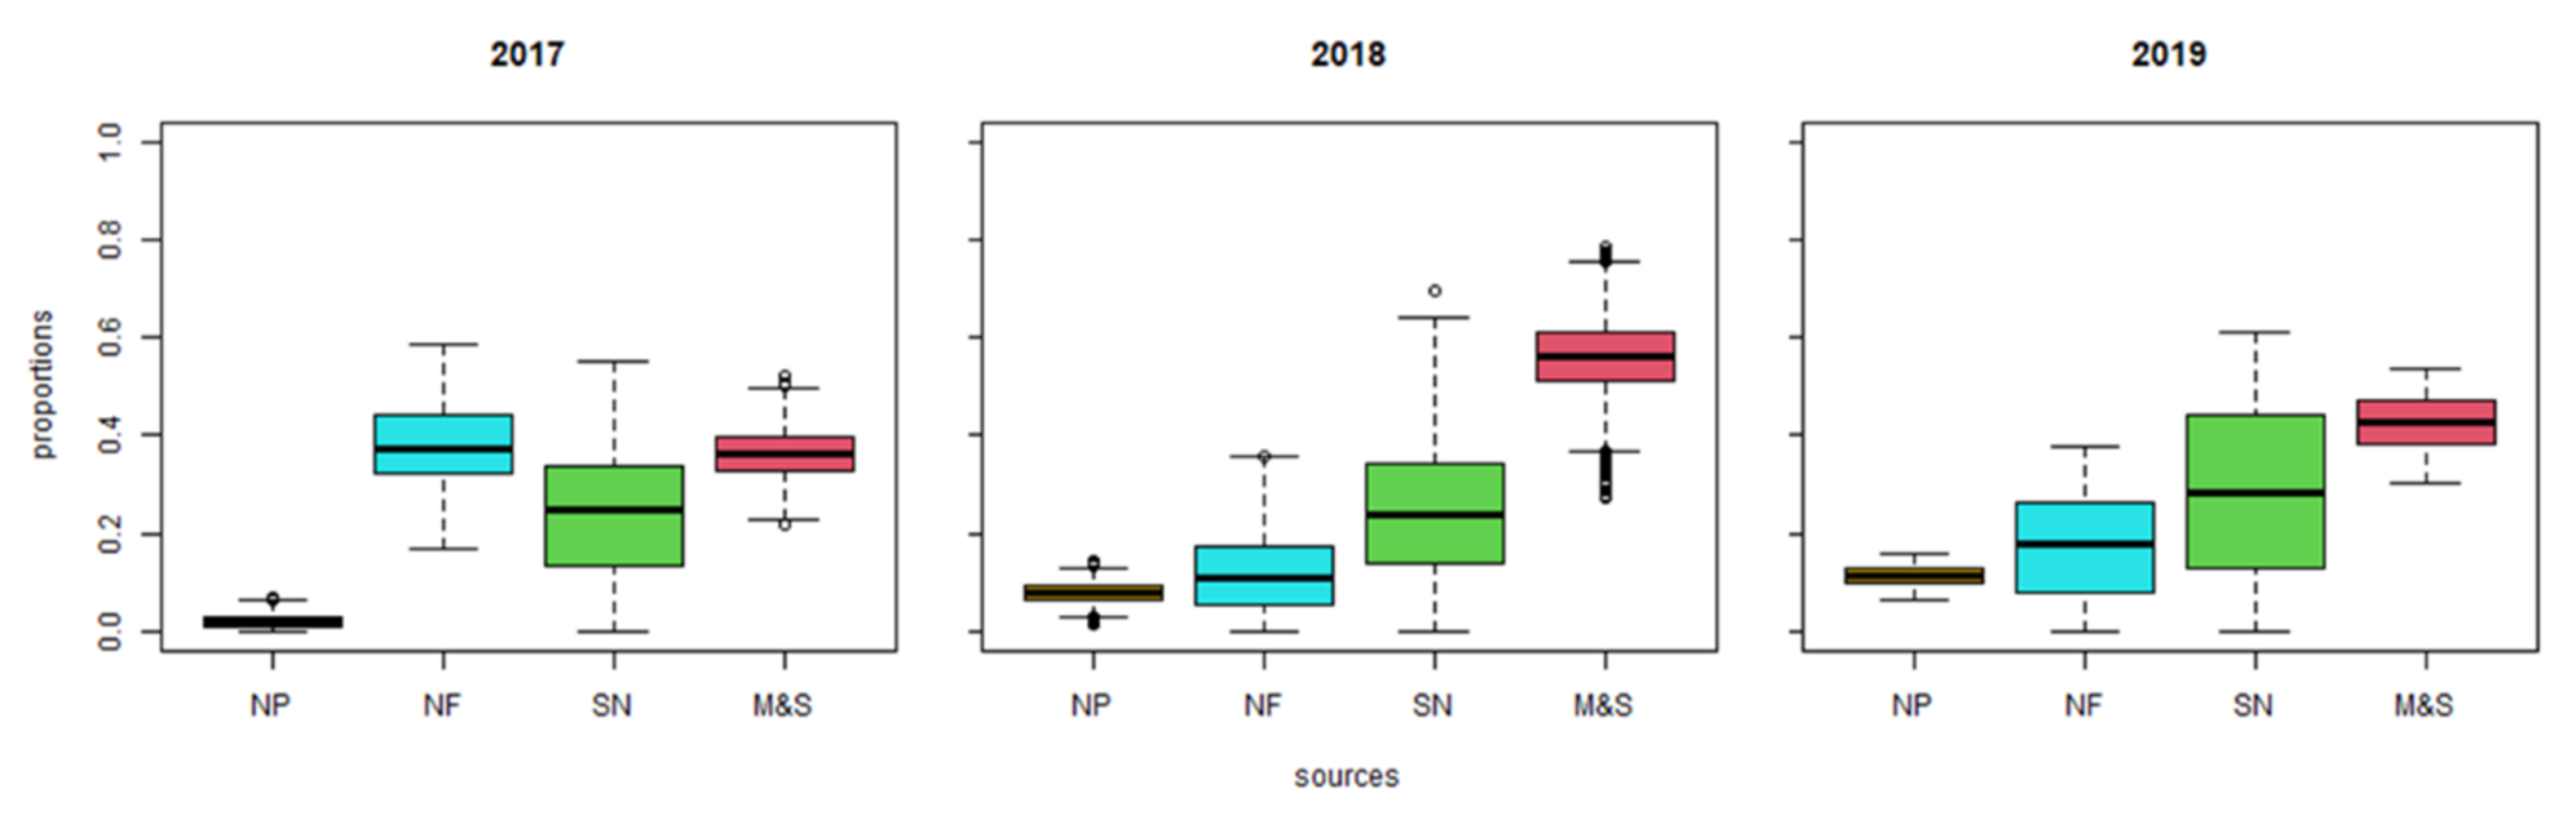
The contributions from each source in the Chengdu City watershed were estimated based on the measured - (‰) and - (‰) values. Specific isotope values were considered to determine the contribution of four potential sources: precipitation (NP), fertilizer nitrification (NF), soil N (SN), and manure and sewage (M & S). These specific isotope values were obtained through monitoring and from published literature (Table 1). The fractionation factor value (Cjk) in Equation (2) was assumed to be 0, because denitrification could not to occur in the stream water (DO > 2 mg/L).
3. Results
3.1. Variation of the NANI in Chengdu between 1970 and 2019
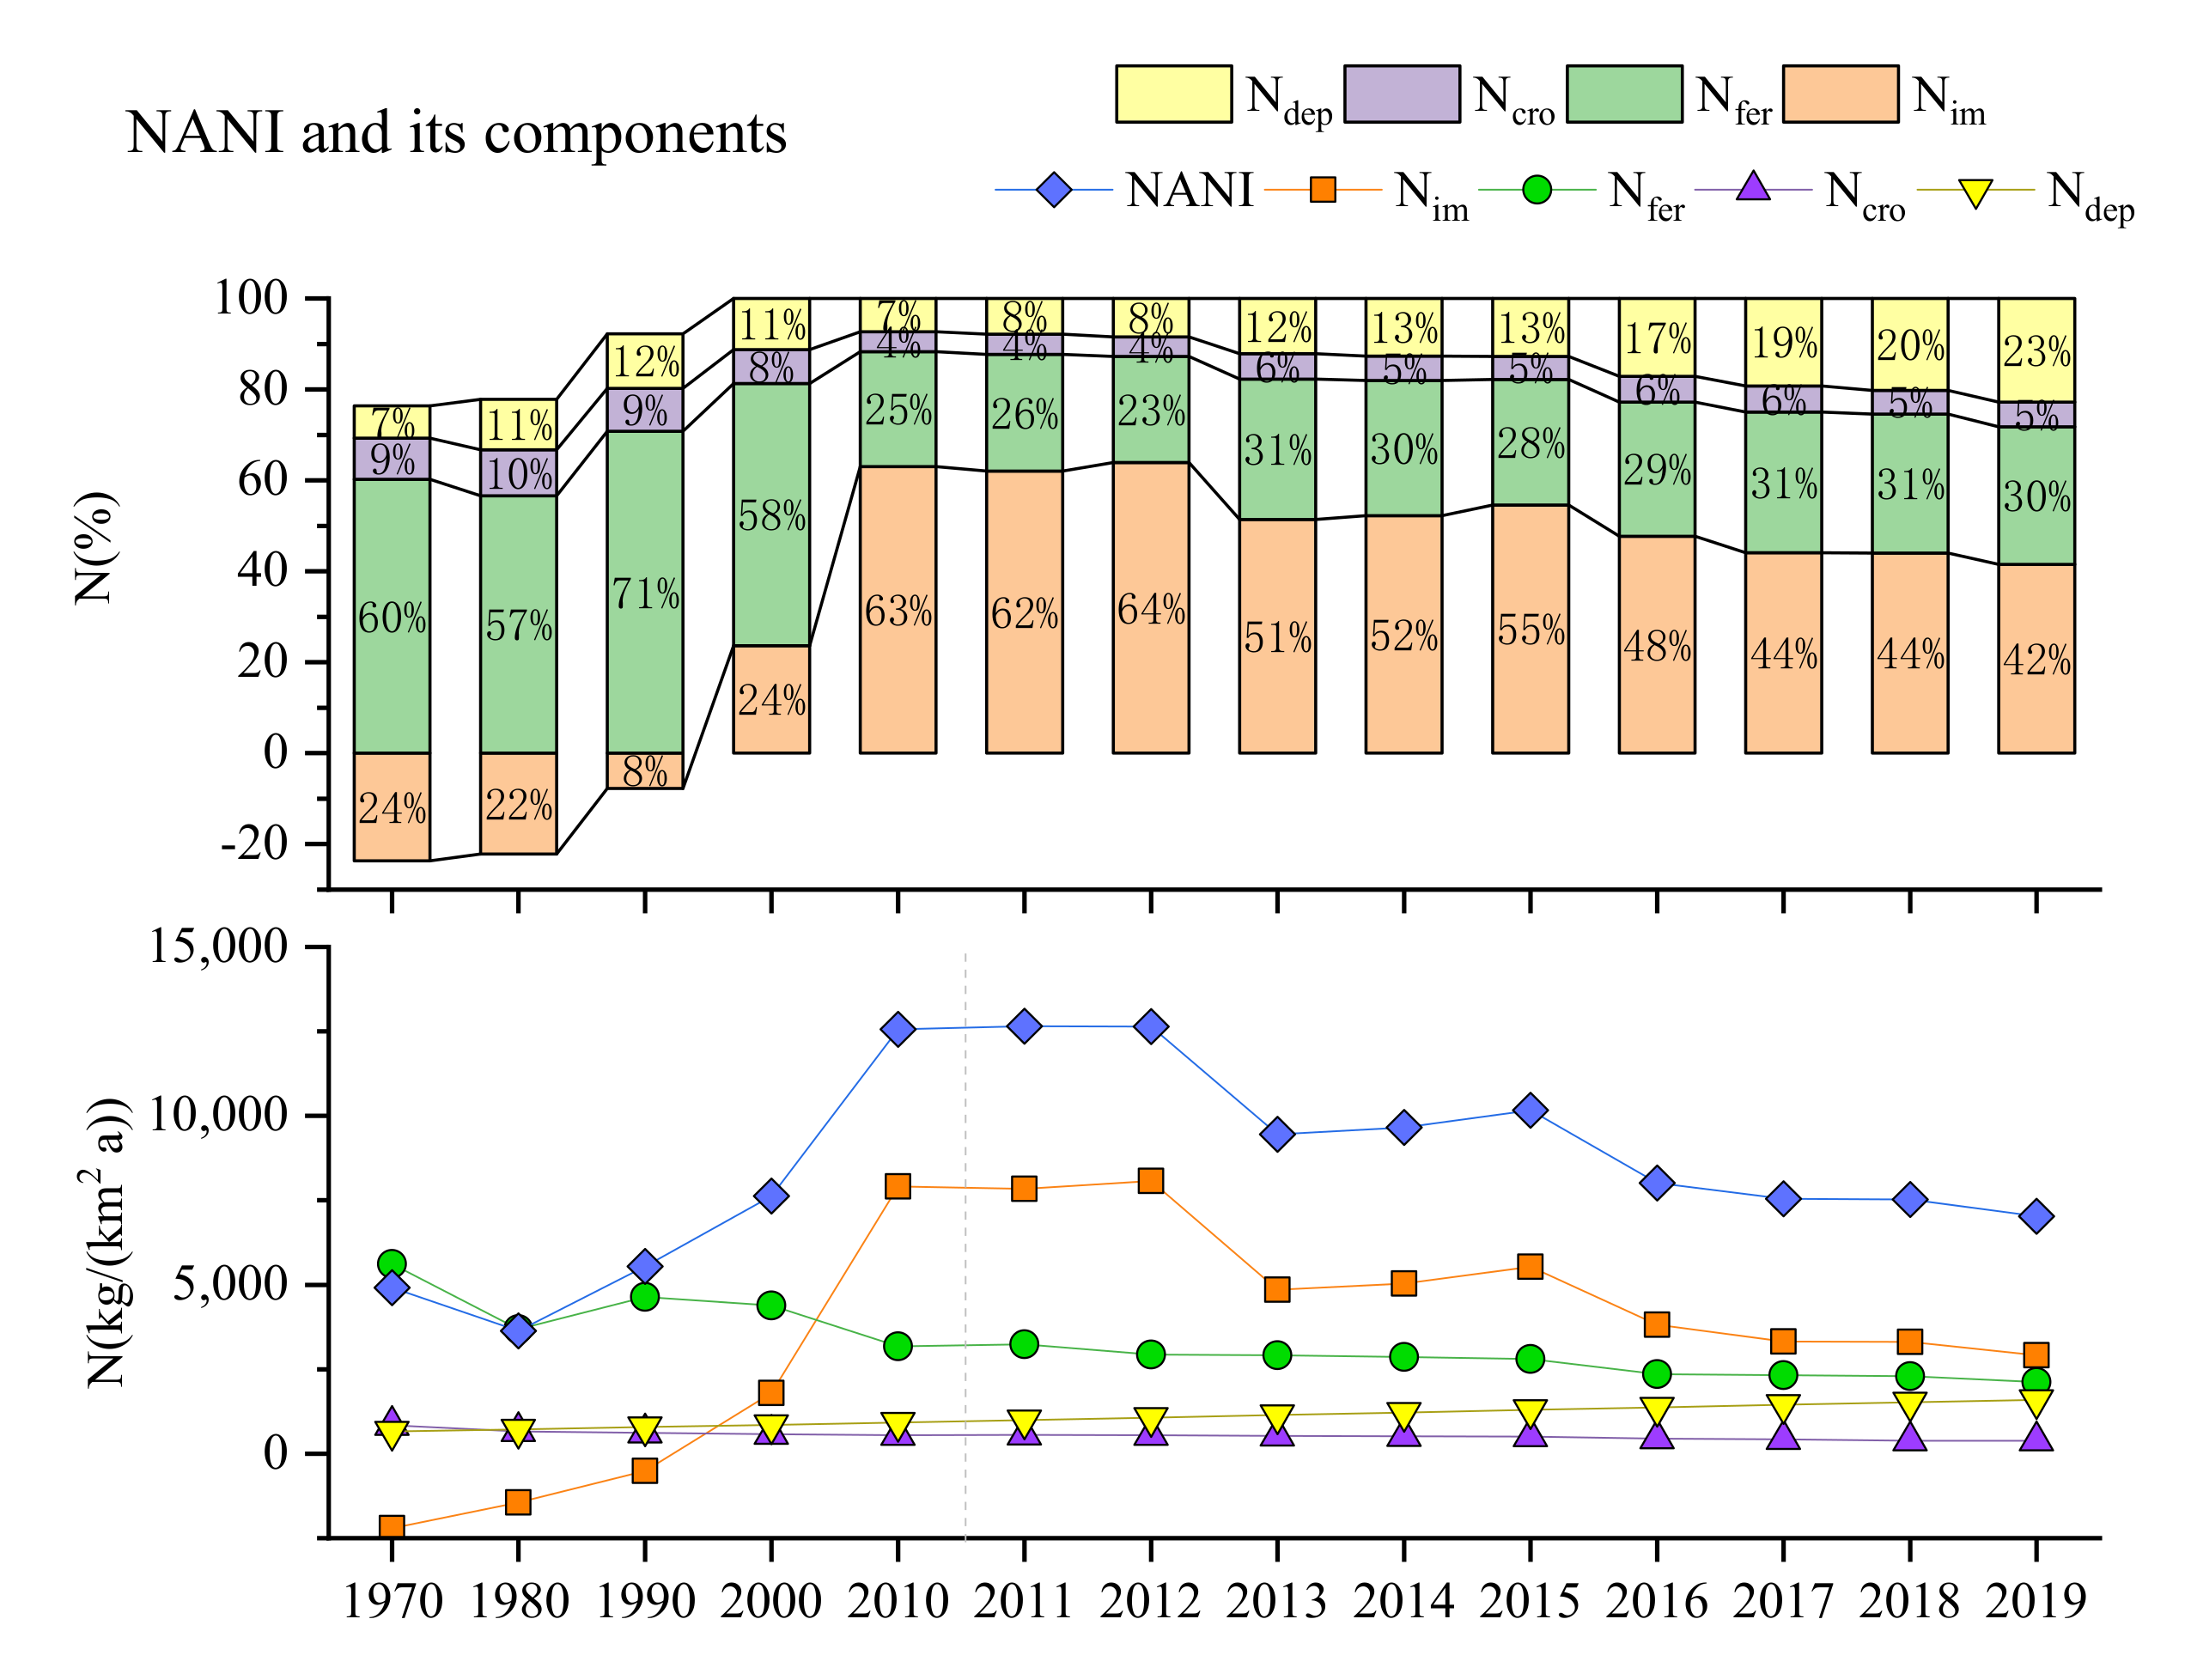
The 2010 NANI values in Chengdu reflected a change in N inputs derived from anthropogenic activity. The NANI increased between 1970 and 2010, and its cascade declined after 2010 (Figure 2). Over the first four decades, the NANI multi-year average value was 18,429.06 N kg/(), significantly higher than the average for China as a whole (11,109 N kg/()). Furthermore, the NANI value more than doubled—increasing from 10,261.27 N kg/() in 1970 to 26,047.28 N kg/() in 2010. Additionally, during this period, the increased significantly due to rapid population growth in Chengdu. In contrast, since 2010, the has decreased significantly—from 15,819.39 N kg/() to 6837.71 N kg/()—while the has been declining yearly due to an accelerated rate of urbanization and a continuous decrease in cultivated land use. Notably, prior to 2010, the was the most important NANI component, yet since 2010, the has maintained the position of prominence. The contribution, which is related to the interpolation calculation, increased steadily each year. Private car ownership is very common in Chengdu (4.39 million private cars, 2019), and in China, it is second only to Beijing (4.97 million private cars, 2019). Given that private car ownership has increased three-fold over the past decade, the is expected to continue increasing.
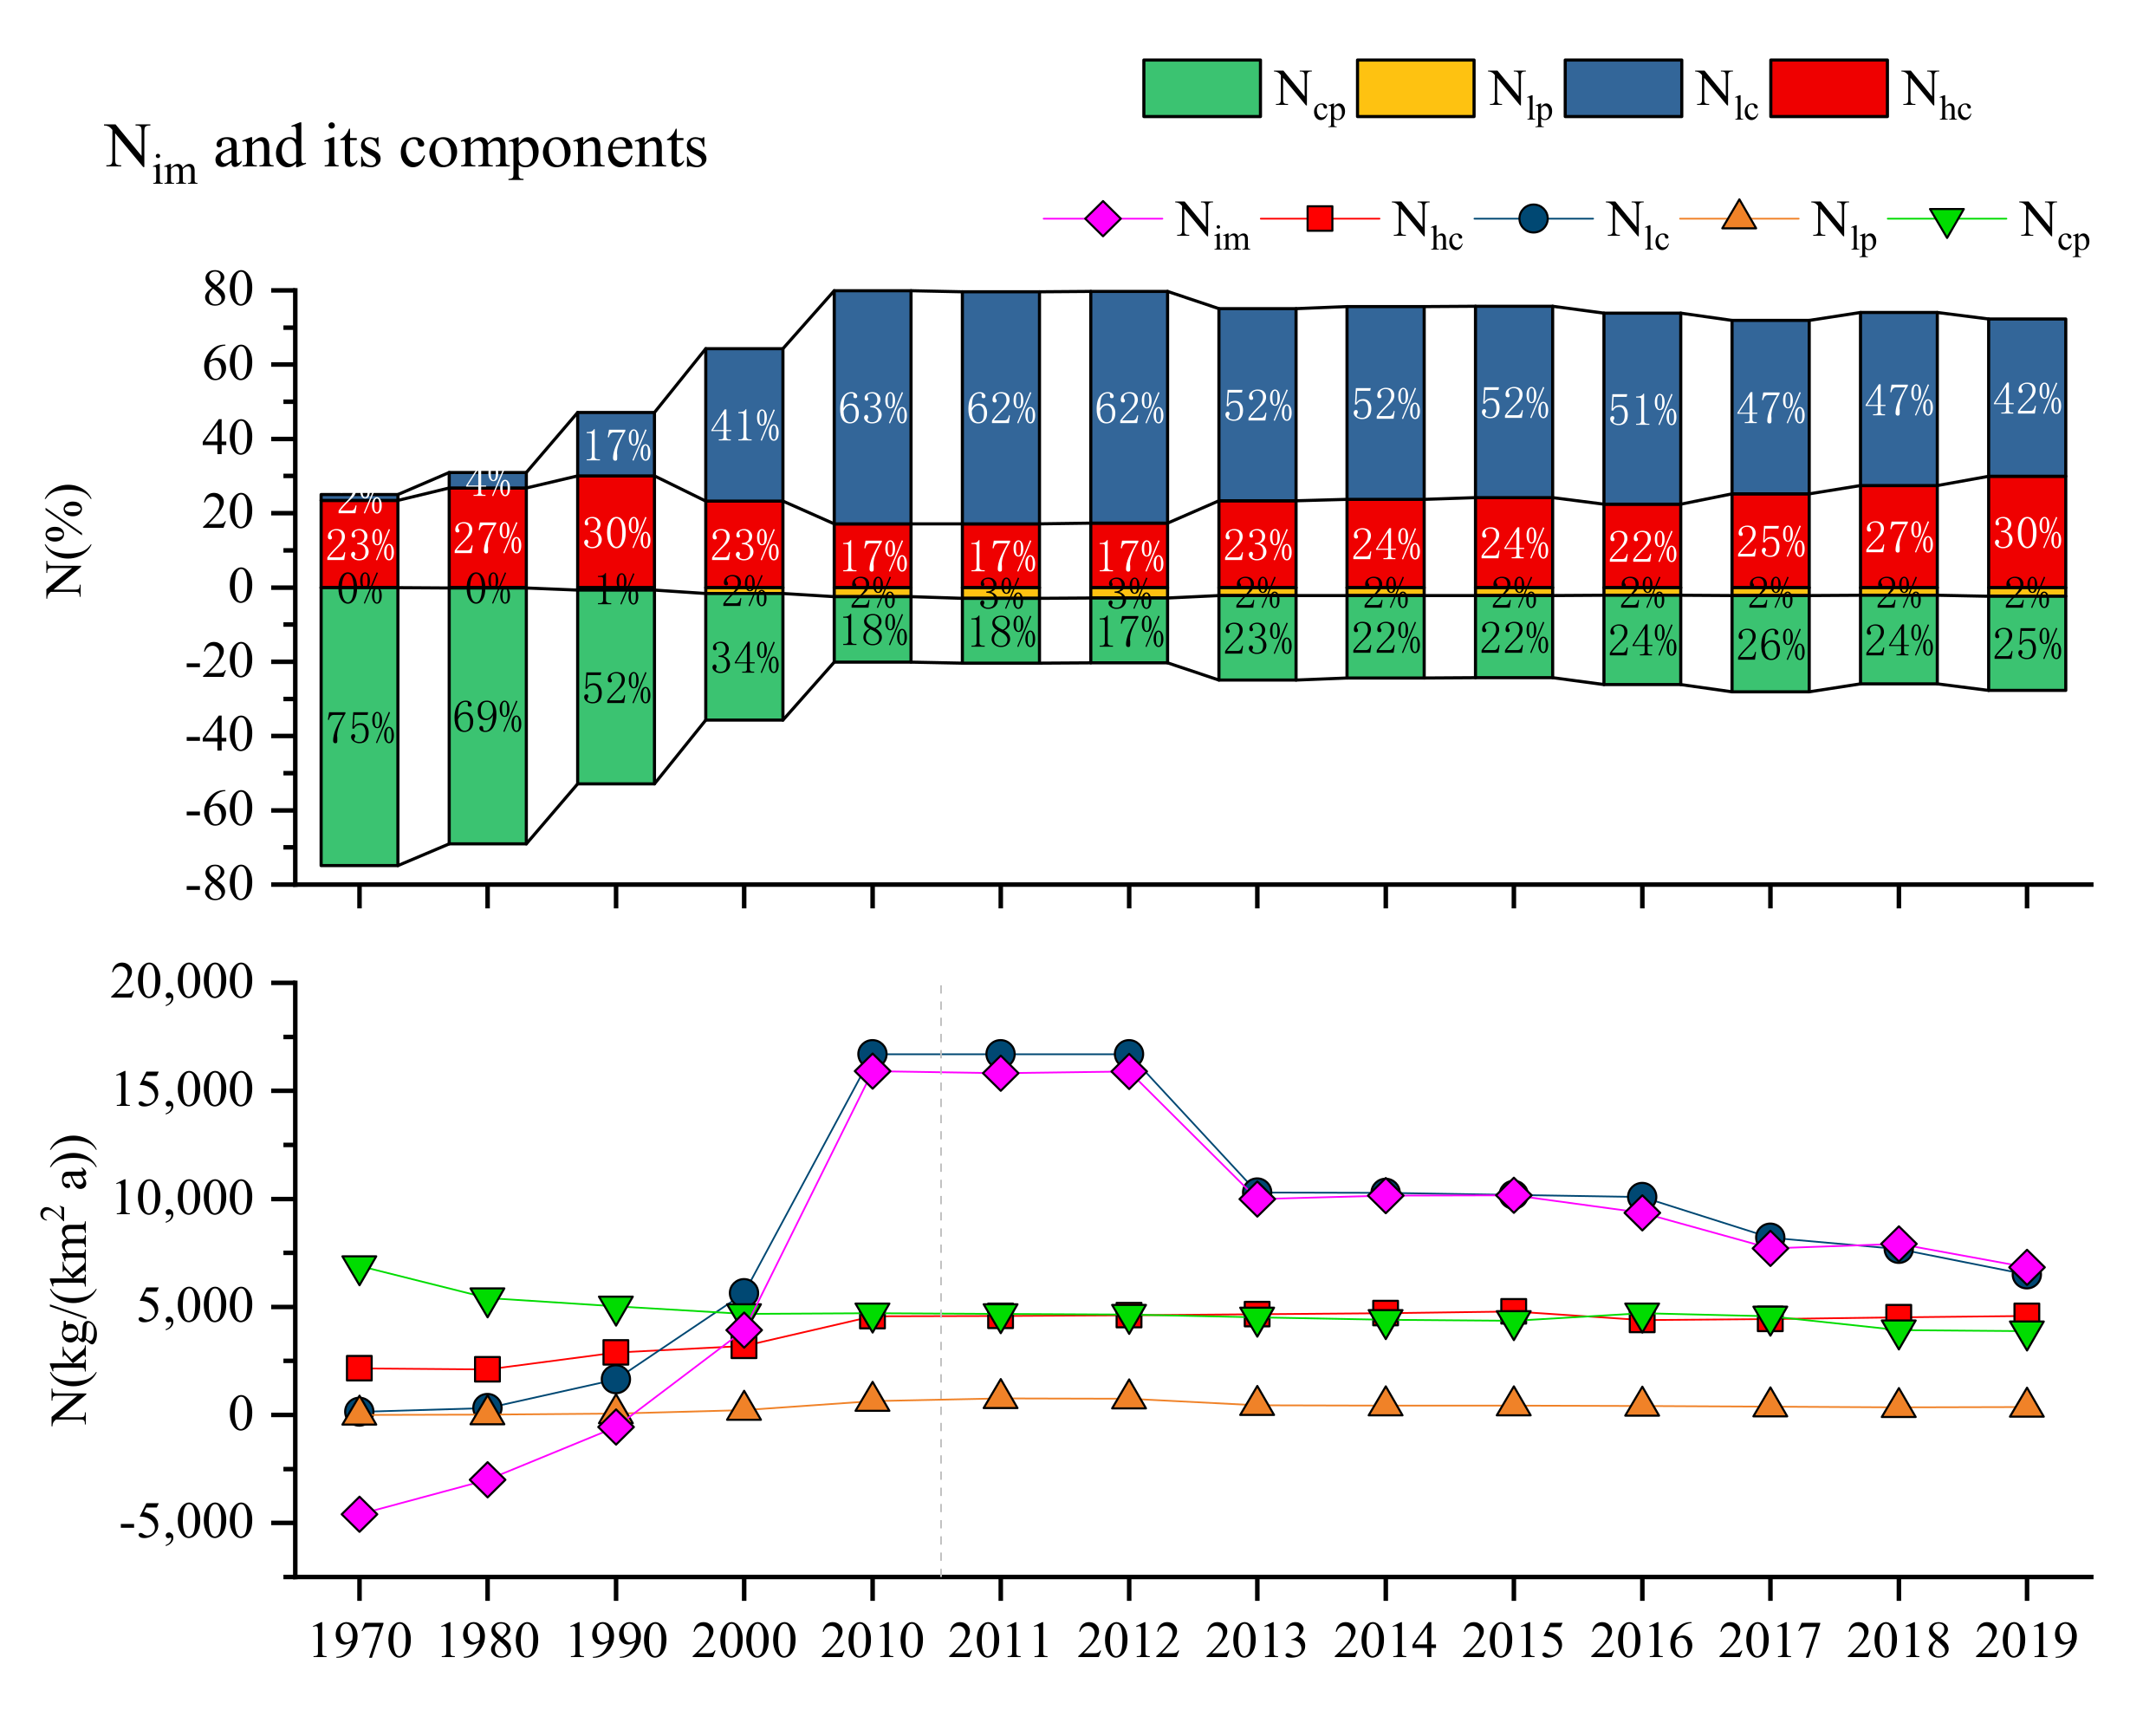
Between 1970 and 2019, the NANI and the followed similar trends (Figure 2), and the components of followed similar trends to those of the and (Figure 3). These results indicate that N consumption in livestock and poultry feed was a leading contributor to both the and the NANI. This finding is consistent with the extensive pig market in Chengdu (1.58 million pigs sold, 2019), which is generally substantially larger than in other Chinese megacities. For example, in 2019, the total number of pigs sold in Peking = 0.13 million, Shanghai = 0.57 million, and Wuhan = 1.05 million (Chinese (2020), Chengdu (2020) and Wuhan (2020) Statistical Yearbooks). Prior to 2010, the slowly increased, eventually stabilizing at ~4582.01 N kg/(). Since 2010, despite the considerable population increase, no significant changes in the were observed, as the land area also expanded. Furthermore, between 1970 and 2019, the decreased yearly in response to the decrease in cultivated area and crop yield. Before 2000, agriculture and animal husbandry were well developed in Chengdu. However, as the degree of urbanization increased, the percentage of people participating in these activities significantly decreased. Finally, from 1970–2019, the dominant components shifted from crop N production, which decreased from 72–25%, to livestock and poultry feed N consumption, which increased from 2–42%.
3.2. Variations in the Riverine TN Export Fluxes between 2011 and 2019
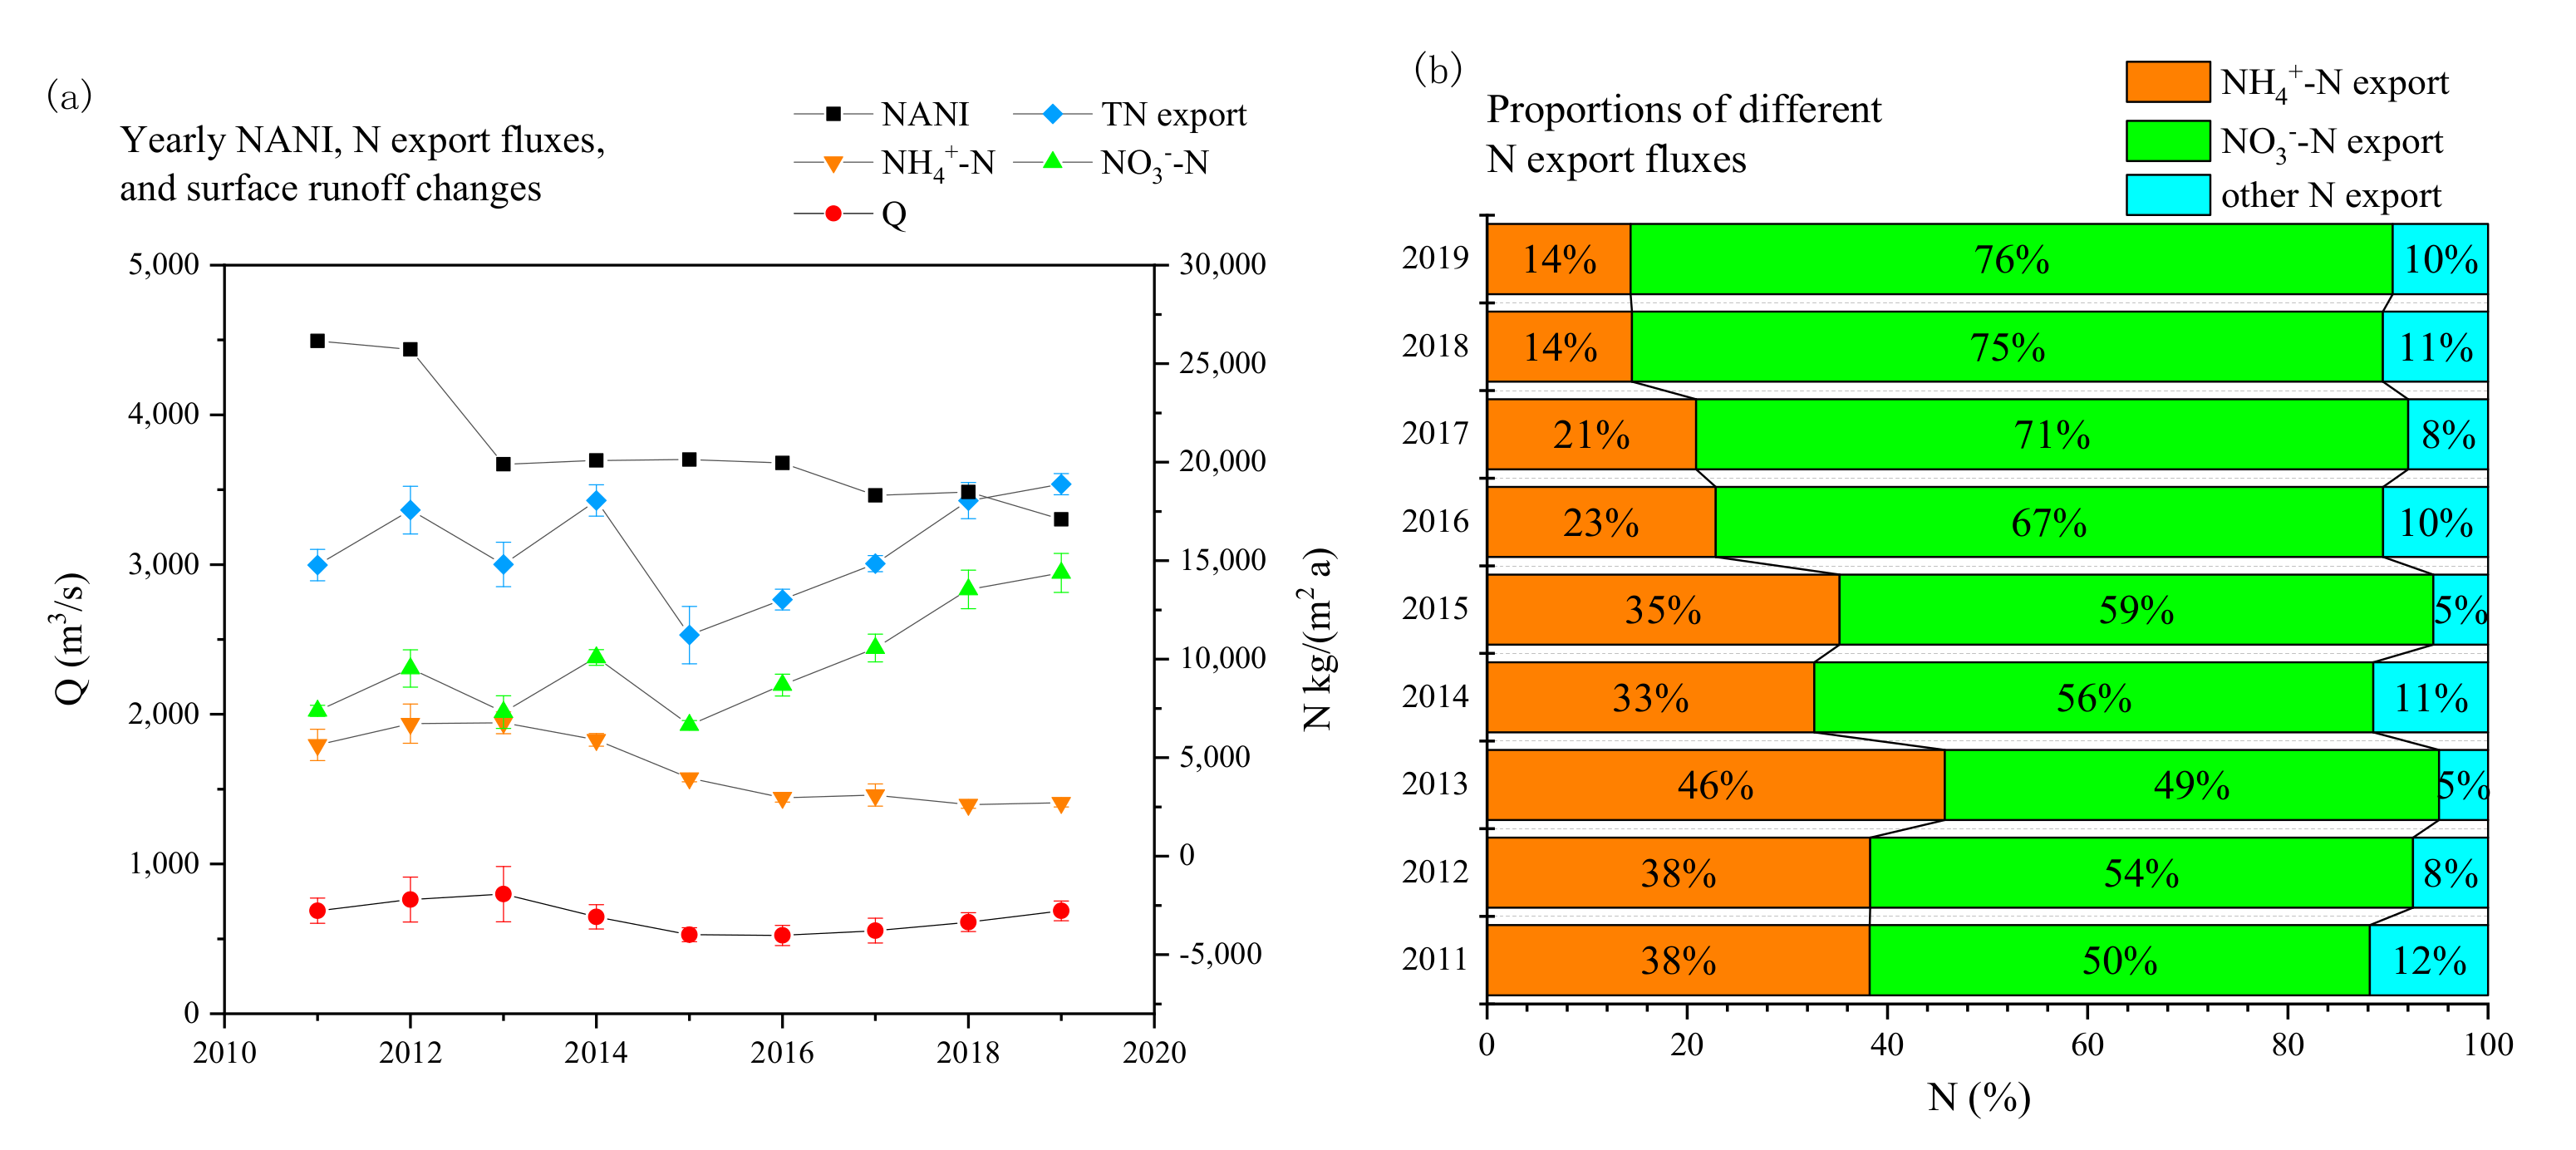
Figure 4 shows that N export fluxes fluctuated between 2011 and 2014 (average value = 15,692.07 N ), decreased significantly in 2015, and then gradually increased through 2019. -N export fluxes were the main contributors (49–76%) to the TN and showed a similar trend. The -N export fluxes’ variation trend was similar to that of surface runoff, suggesting that the former was controlled by the latter. Notably, the TN export fluxes showed an overall opposite trend to that of the NANI, and in 2019, their values exceeded those of the NANI. Given these results, it can be inferred that N retention is occurring in the study area.
3.3. Identifying the -N Pollution Sources Using Data from 2017–2019
Previous studies have highlighted the prominence of -N pollution in recent years and its close relationship to urban development. Dual stable isotopes (e.g., - and -) are known as good tracers of pollution in rivers. In this work, the dual stable isotope approach was used in combination with the SIAR model to estimate the contribution rates of different -N sources (Figure 5 and Figure 6). The results showed that the -N export fluxes increased significantly between 2017 and 2019, and that the main contributing sources changed during the same period. Specifically, the contribution from fertilizers decreased significantly, while those of M & S became more prominent. In addition, soil erosion also provided a steady contribution (Figure 5 and Table 2). These results are consistent with those from previous investigations.
4. Discussion
4.1. Relationships between N Budgets in the Chengdu City River Systems
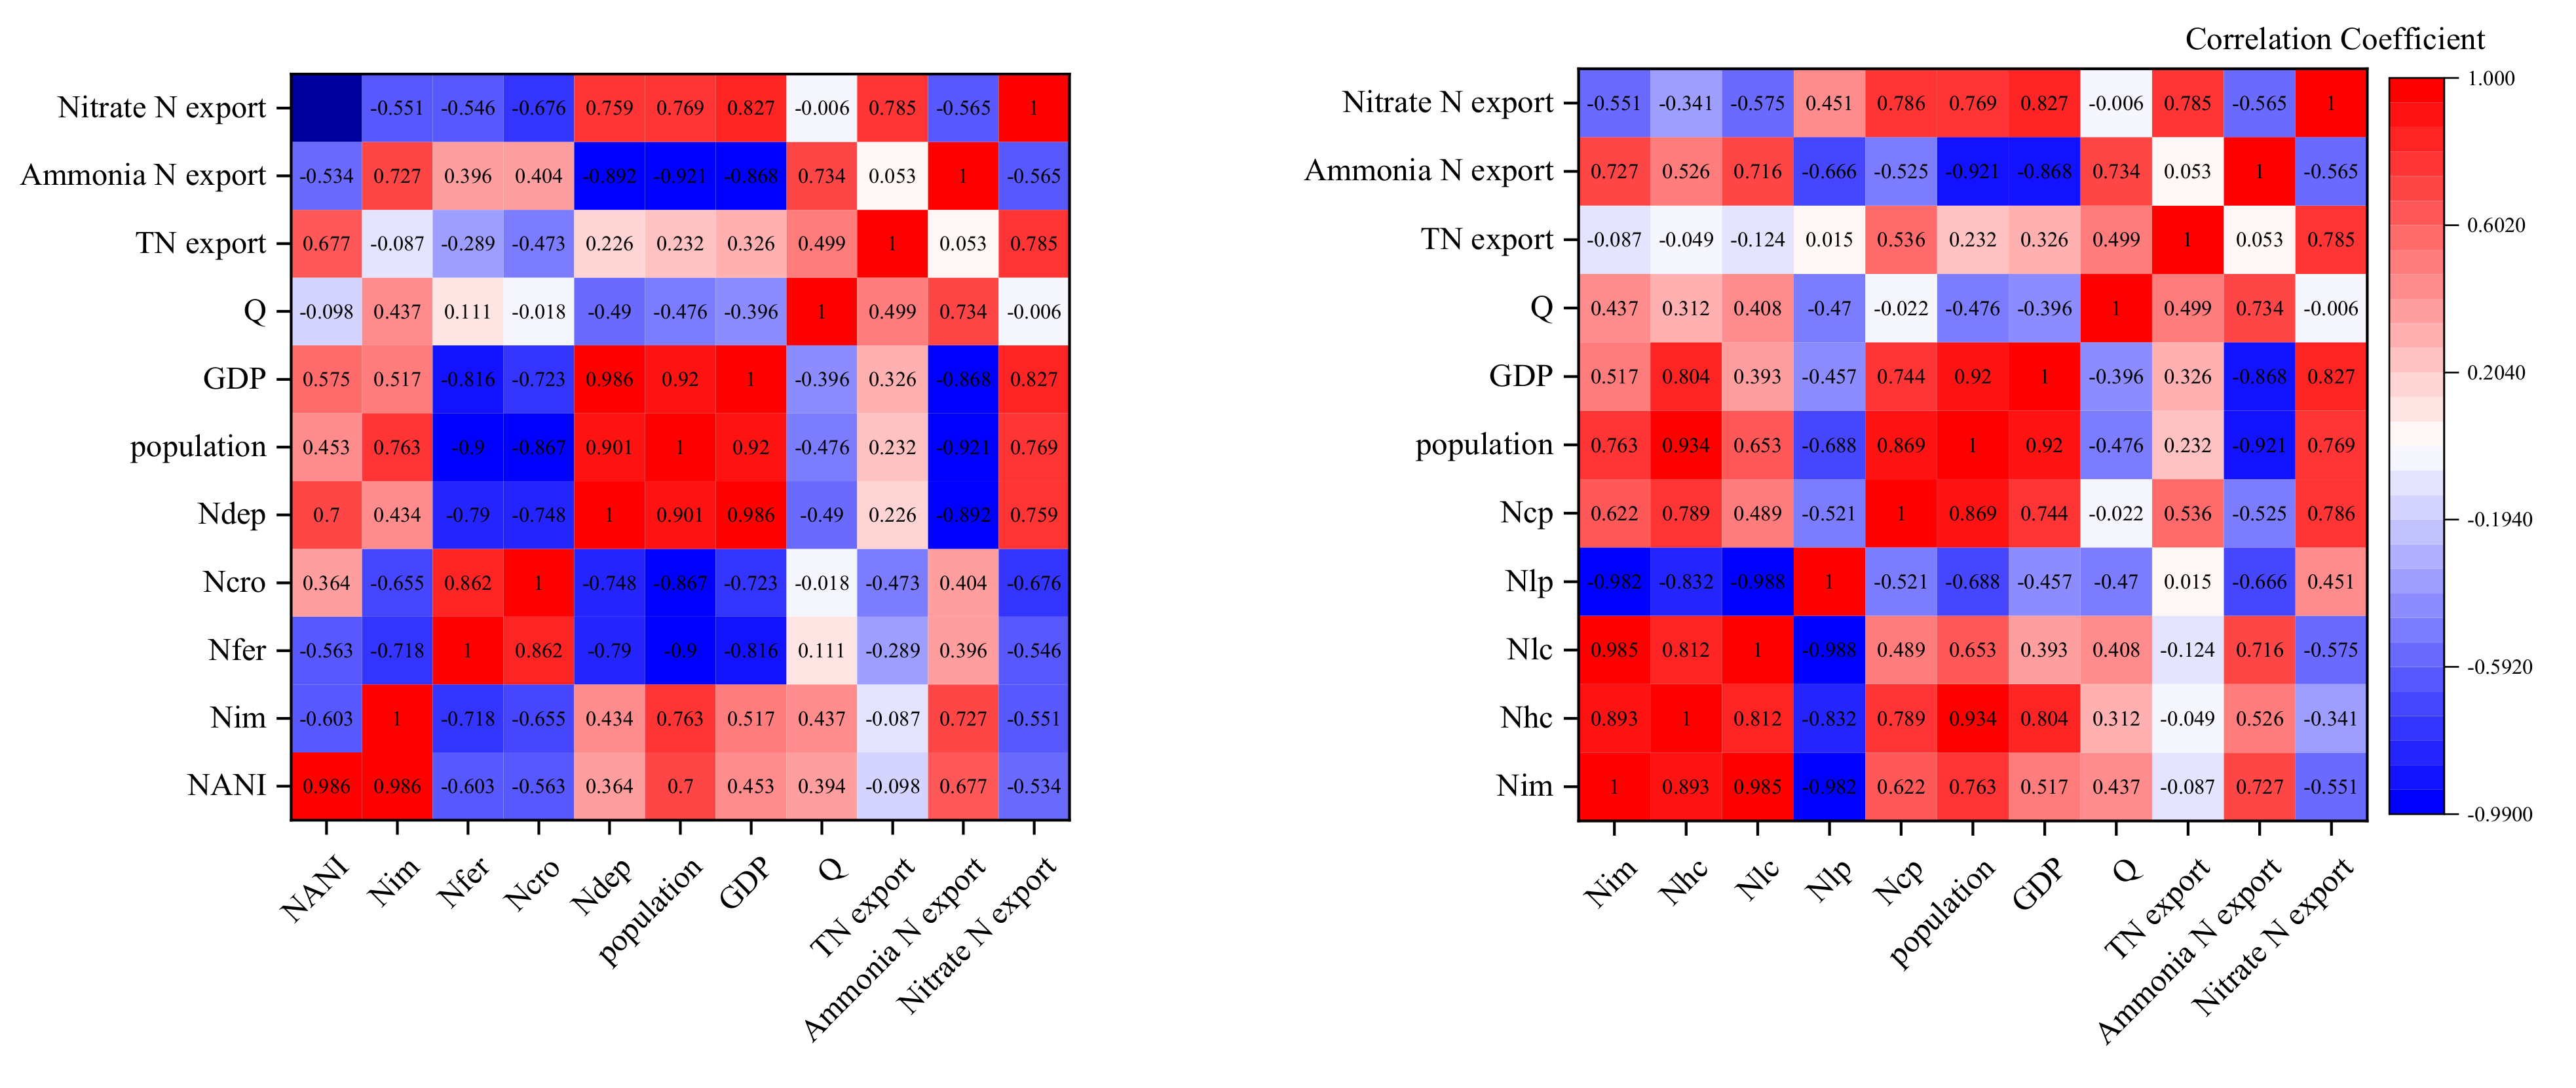
To further confirm the relationship between the N budget and anthropogenic activities (e.g., population and GDP), several correlation analyses were carried out. Anthropogenic activity indicators and N inputs data were used to analyze the 1970–2019 period, and surface runoff and N export data were used to analyze the 2011–2019 period. As shown in Figure 7, a significant correlation was observed between the TN and the -N export fluxes ( = 0.785, p < 0.05). Moreover, there were simultaneous significant correlations between the -N export fluxes and the crop N products (= 0.786, p < 0.05), the crop N fixation (= −0.676, p < 0.05), the atmospheric deposition (= 0.759, p < 0.05), the human population ( = 0.827, p < 0.01), and the GDP (= 0.763, p < 0.05). In addition, the -N export fluxes were correlated with the NANI ( = 0.677, p < 0.05), the ( = 0.727, p < 0.05), the (= 0.716, p < 0.05), the (= −0.892, p < 0.01), the human population (= −0.921, p < 0.01), the GDP (= −0.868, p < 0.01), and the flow (= 0.734, p < 0.05).
In summary, both the -N and -N export fluxes appeared to reflect changes in the human population and in the economic development. Notably, the -N export fluxes were significantly affected by agriculture and atmospheric deposition, while those of -N were significantly affected by animal husbandry. Furthermore, the NANI and were significantly correlated with the -N export fluxes, indicating that human activities heavily contributed to content.
4.2. Changes in N Inputs, Outputs, and Sources in Response to Urban Development and Management
Prior to 2010, Chengdu was a third-tier Chinese city that lacked subways and economic development zones. As such, it was not included among China’s top 10 GDP cities. On 12 May 2008, the city experienced a massive earthquake, which triggered a large scale rebuilding effort soon after the disaster. Since 2010, 13 subway lines have been constructed and Chengdu’s GDP has tripled. Moreover, the city now holds a top spot among China’s new first-tier cities. Overall, since 2010, Chengdu’s population, economy, and urban area have rapidly developed, and variations in the NANI and its components reflect these changes. Specifically, food N consumption increased with population growth, and as arable land acreage decreased, the amount of crops and fertilizer use decreased in parallel. Independent from the food N variations, NANI values were always related to N consumption in livestock and poultry feed (an aspect that has been neglected in previous studies).
In June 2017, Chengdu’s municipality issued the “Ten Water Control Measures” work plan and set a goal of remediating 296 black and smelly river sections by the end of 2020. Following publication of this work plan, agricultural non-point source sewage discharge, which would normally enter the river, has been regulated through ditches, and fertilizer pollution has been effectively controlled. In fact, since 2017, Chengdu’s sewage treatment plant has been upgraded, resulting in lower N emissions, and the amount of N input from anthropogenic activity has been decreasing yearly. Livestock/poultry breeding and domestic sewage are unlikely to be the main cause of the observed increase in N outputs. Alternatively, this trend might be explained by the gradual release of N trapped in groundwater into the river. This explanation is supported by the fact that an analysis of 13 groundwater samples in Chengdu exhibited - and - values of 15.9 ± 8.0 ‰ and 4.6 ± 8.1 ‰, respectively. Using the same tracer method in this study showed that, as with surface water, the main source of in groundwater is M & S. These results strongly indicate that groundwater significantly contributes to the content in surface runoff.
4.3. Key Conversion of River N
The results described in Section 3.2 and Section 3.3 suggest, to a certain extent, the occurrence of N retention in the study area. Notably, nitrification and denitrification are key processes involved in N retention in rivers. In particular, nitrification is the process by which autotrophic microorganisms convert to via N oxidation, resulting in little N isotope fractionation. Theoretically, one third of the O in the produced by nitrification is derived from dissolved oxygen (DO) [48], whereas the remaining two thirds are derived from water and are produced during the oxidation of to [49,50]. This relationship can be expressed as follows: - = 2/3 -H2O + 1/3 -air [51]. In this study, the values of the newly formed indicated that nitrification was the main factor determining formation. Considering the value for atmospheric O (23.5‰) and the typical values of precipitation in Chengdu (ranging from −16.7 to 1.9‰) [52], the calculated theoretical - values derived from nitrification in Chengdu City’s river water ranged from −3.3 to 9.1‰. These data support the presence of nitrification reactions in surface water. Figure 6 shows that the measured - values for the samples collected between 2018 and 2019 were consistent with the theoretical nitrification values. However, most of the samples collected in 2017 depict values outside this range. Implementation of the “Ten Water Control Measures” activities in 2017 is a possible cause of this phenomenon. In that year, a large input of -N led to increased nitrification and, hence, to the formation of higher amounts of - from water O. The water was low in -, resulting in low - levels.
Denitrification plays an important role in the N cycle, as it can lead to a significant fractional distillation of N isotopes. A significant negative relationship is known to occur between - and -. As such, -/- ratios, which typically range from 2:1 to 1:1, have traditionally been used to diagnose denitrification [53]. However, we observed a significant positive relationship between - and - ( = 0.384, p < 0.01), with a linear regression slope of 0.31 (which deviated from the denitrification value range). Furthermore, the DO concentration in surface water was much higher than that ideal for denitrification (<1 mg O2/L) [54]. Therefore, the denitrification process can reasonably be ignored in this study, as a considerable amount of -N w—retained in the water system due to the dominance of nitrification. In this study, no significant inverse relationship was observed between and . This indicates that nitrification did not contribute much of the detected in surface runoff. As such, most of the was derived from direct inputs. These findings support the groundwater contribution hypothesis presented in Section 4.2.
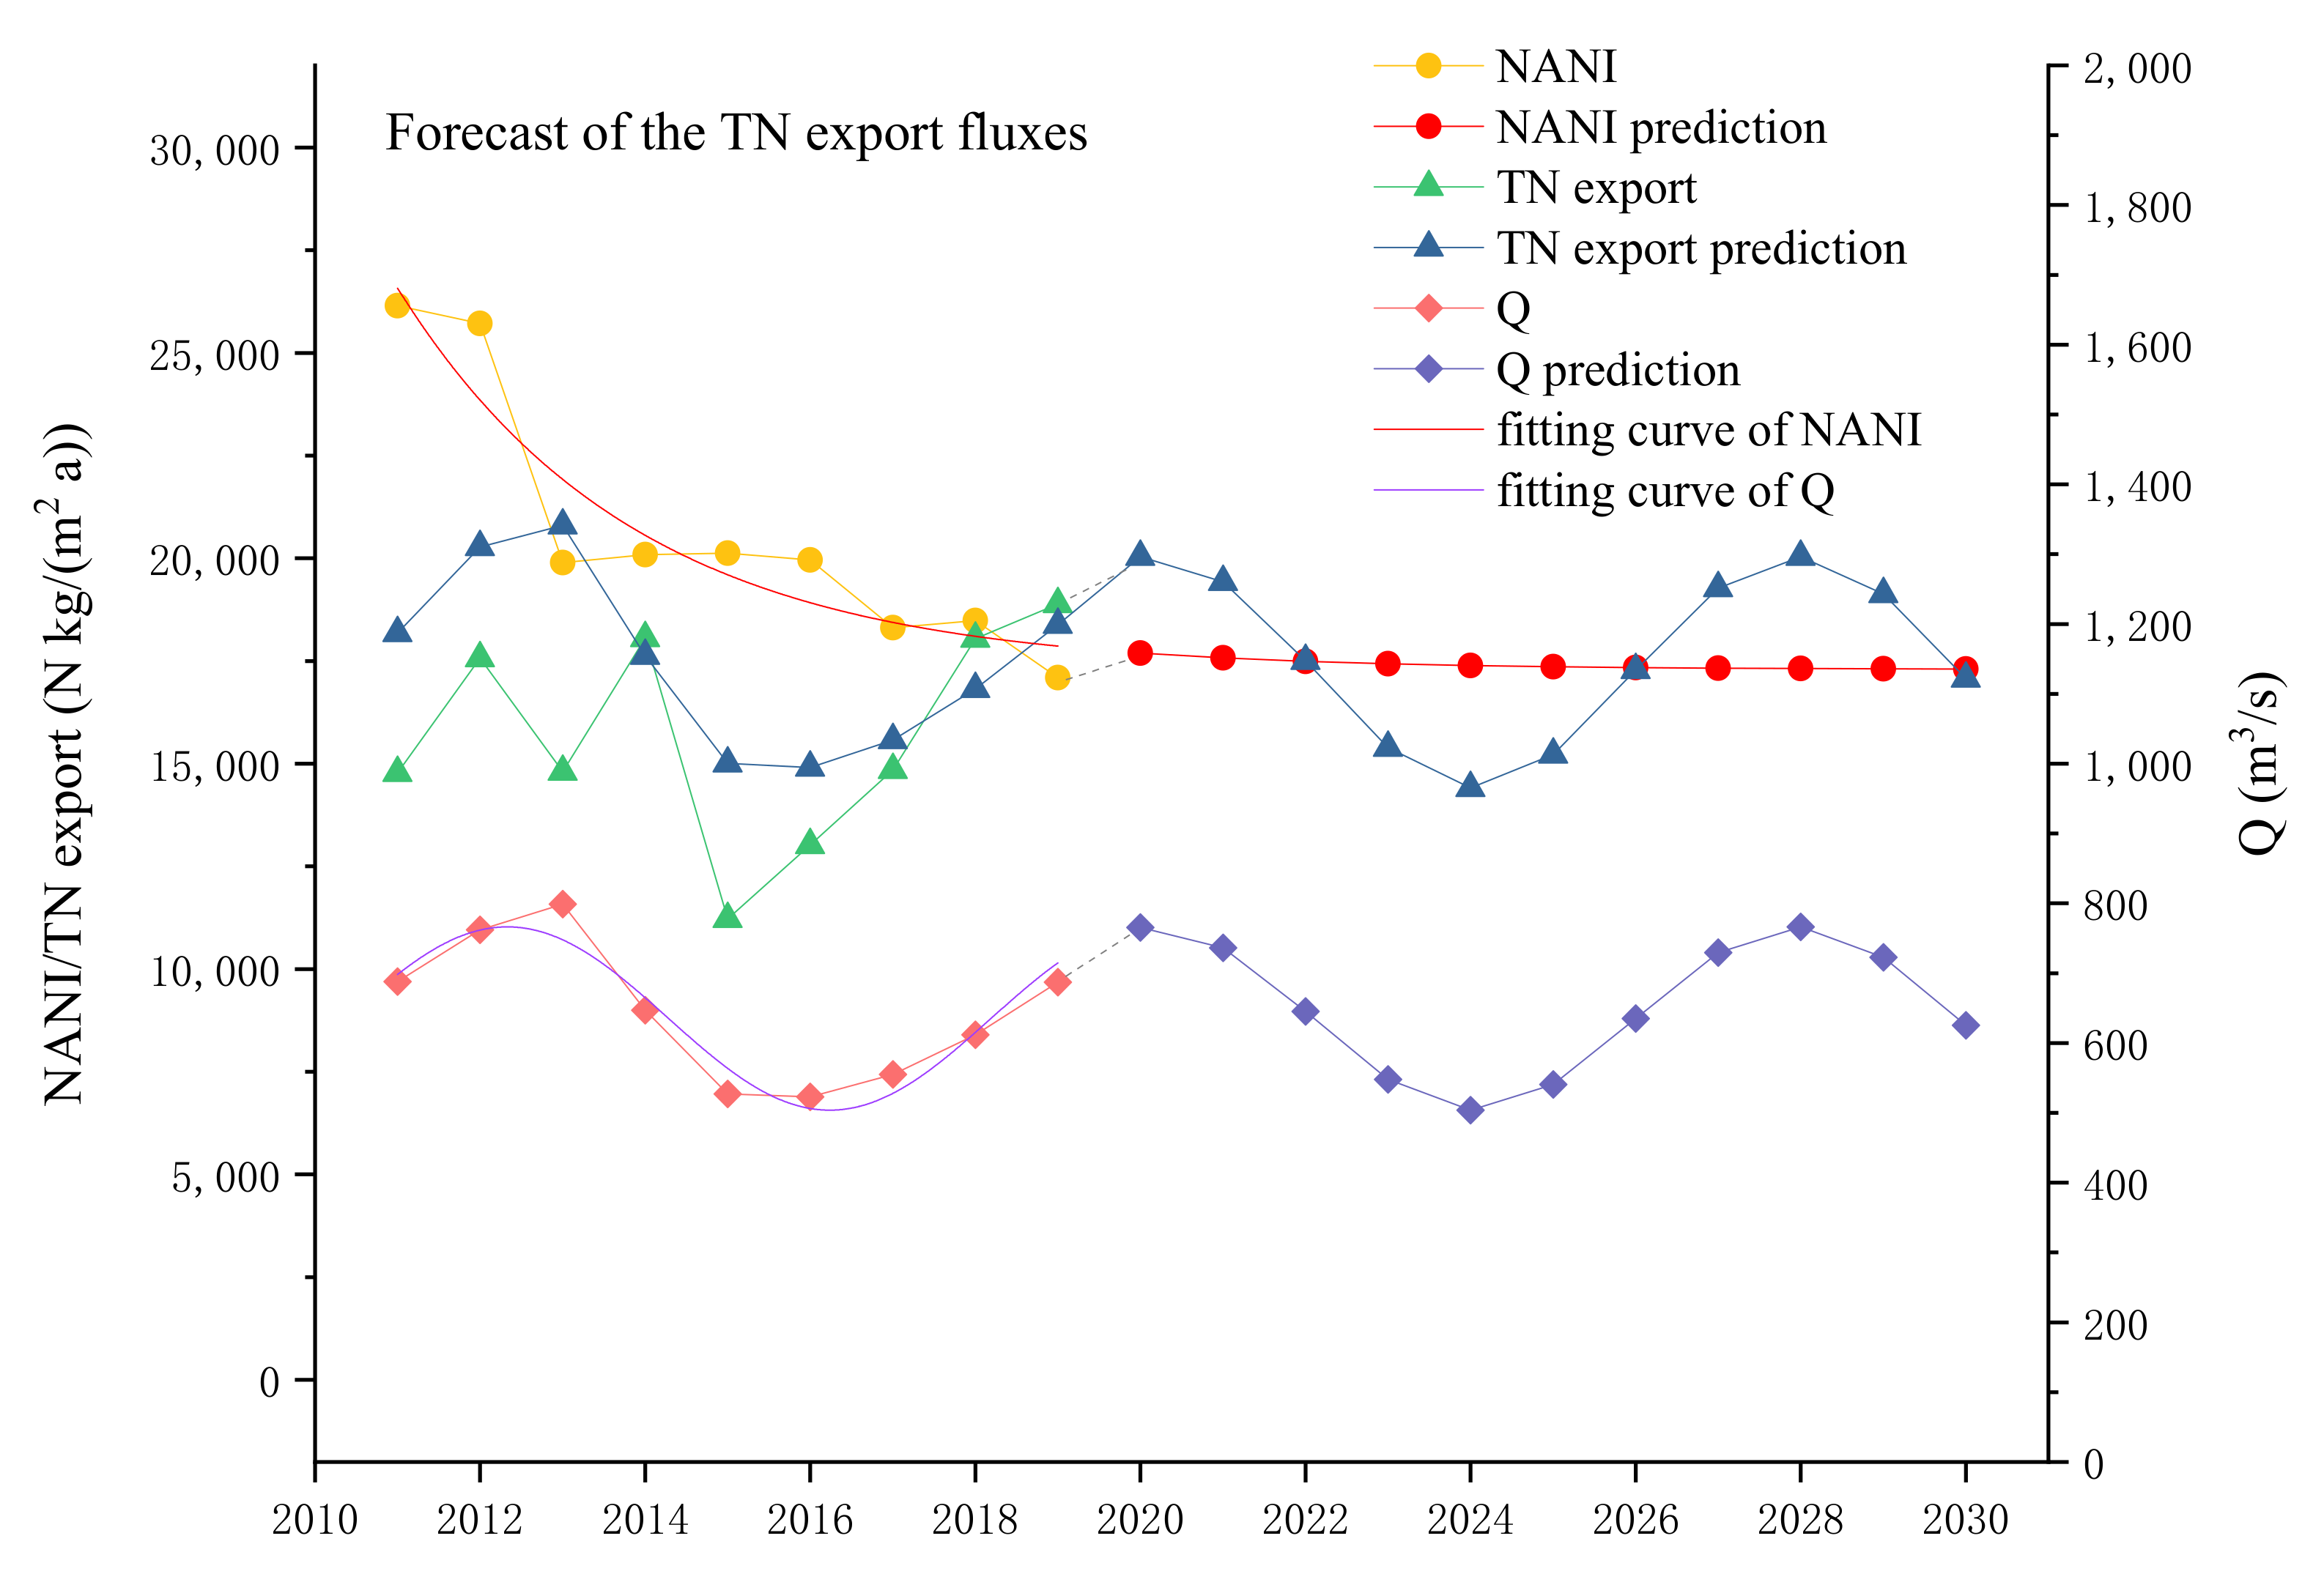
4.4. Prediction of N Retention
According to Section 2.3, the 2011–2019 measured runoff data from the Yangtze River Basin in Chengdu City and the corresponding NANI data were applied to iterate to convergence using the multiple regression model. This process is mathematically expressed as:
Figure 8 shows that the TN export fluxes predicted using Equation (5) were basically consistent with the values measured between 2011 and 2019; hence, they reliably reflect the river N output. Based on Figure 4 and Figure 6, it can be inferred that over the next ten years the NANI will continue to decrease, while the TN will fluctuate with surface runoff. Furthermore, these predictions indicate that during the next decade, the average NANI value will reach 17,412.74 N kg/(), while the TN export fluxes will equal 17,709.37 N kg/(). Thus, these two variables will approximately counterbalance each other.
5. Conclusions
This study focused on the NANI characteristics for the period 1970–2019, the N export fluxes for the period 2011–2019, and the sources for the period 2017–2019. Given the four decades analyzed during this investigation, evolution of the NANI can be divided into two main stages: a first stage marked by a significant increase (1970–2010) and a second stage marked by a steep decline (2010–2019). Since 2010, has been the leading source of NANI in the Chengdu City river basin (52.3%), while has been the leading source of (53.0%). According to the data for the 2011–2019 period, the -N export fluxes increased significantly toward the end of this period, and consequently, the N output exceeded the NANI value. Based on the isotopic tracing results, the sources of the TN export fluxes changed at the end of the period. Fertilizer contributions decreased significantly, and that of M & S became dominant. Considering this information in conjunction with the actual environmental management and the N budget characteristics, we suggest that a reverse excess of N output was more likely caused by N retention. Given these results, groundwater monitoring should be included in future environmental management strategies. This study also showed that the -N export fluxes were significantly and positively correlated with both population and economic indicators. As such, future urbanization development should consider -N pollution. The significant correlation observed between pollution and atmospheric deposition also highlights the need of monitoring atmospheric N deposition and N pollution. Overall, the results of this study deepen our understanding of N sources, fluxes, long-term changes, and future trends in the context of megacities and underscore the need to promote development of environmental management within these locales.
Author Contributions
Conceptualization, Y.D. and C.L.; methodology, Y.D.; software, Q.S.; validation, Y.D., C.L. and L.O.; formal analysis, Y.D.; investigation, L.O.; resources, B.J. and Z.W.; data curation, Y.D.; writing—original draft preparation, Y.D.; writing—review and editing, Y.D.; visualization, Q.S.; supervision, G.Y. and B.J.; project administration, B.J.; funding acquisition, B.J. All authors have read and agreed to the published version of the manuscript.
Funding
This research was jointly funded and analytically supported by the National Science Foundation of China (41473013 and 41627802) and the Water Pollution and Technology Foundation Project of the Chengdu Ecological Environment Bureau entitled “Source Analysis of Surface Water Pollutions in Chengdu City”.
Institutional Review Board Statement
Not applicable.
Informed Consent Statement
Not applicable.
Data Availability Statement
The data presented in this study are available on request from the corresponding authors.
Acknowledgments
We are grateful to the Chinese Academy of Geological Sciences (CAGS) for the stable isotope data.
Conflicts of Interest
The authors declare no conflict of interest. The funders had no role in the design of the study; in the collection, analyses, or interpretation of data; in the writing of the manuscript, or in the decision to publish the results.
Abbreviations
| NANI | net anthropogenic N input |
| SIAR | bayesian model |
| GDP | gross domestic product |
| JM | Jinma River Basin |
| J | Jin River Basin |
| T | Tuo River Basin |
| TN | total N |
| -N | ammonia-N |
| nitrate | |
| nitrite | |
| DO | dissolved oxygen |
| represents the food/feed N inputs | |
| the fertilizer N inputs | |
| the N from crop fixation | |
| the N from atmospheric deposition | |
| the N from aquaculture | |
| the food N consumption | |
| the feed N consumption | |
| the N content of livestock/poultry products | |
| the N content of agricultural crop products | |
| NP | atmospheric deposition |
| NF | chemical fertilizers |
| SN | soil organic N nitrification |
| M & S | manure and sewage |
| Q | the runoff |
References
- Liu, Y.; Yang, L.; Jiang, W. Coupling Coordination and Spatiotemporal Dynamic Evolution between Social Economy and Water Environmental Quality—A Case Study from Nansi Lake Catchment, China. Ecol. Indic. 2020, 119, 106870. [Google Scholar] [CrossRef]
- Zhang, H.; Zhu, Z.; Fan, Y. The Impact of Environmental Regulation on the Coordinated Development of Environment and Economy in China. Nat. Hazards 2018, 91, 473–489. [Google Scholar] [CrossRef]
- Cui, X.; Fang, C.; Liu, H.; Liu, X. Assessing Sustainability of Urbanization by a Coordinated Development Index for an Urbanization-Resources-Environment Complex System: A Case Study of Jing-Jin-Ji Region, China. Ecol. Indic. 2019, 96, 383–391. [Google Scholar] [CrossRef]
- Lu, C.; Yang, J.; Li, H.; Jin, S.; Pang, M.; Lu, C. Research on the Spatial-Temporal Synthetic Measurement of the Coordinated Development of Population-Economy-Society-Resource-Environment (PESRE) Systems in China Based on Geographic Information Systems (GIS). Sustainability 2019, 11, 2877. [Google Scholar] [CrossRef] [Green Version]
- Puppim De Oliveira, J.A.; Doll, C.N.H.; Kurniawan, T.A.; Geng, Y.; Kapshe, M.; Huisingh, D. Promoting Win-Win Situations in Climate Change Mitigation, Local Environmental Quality and Development in Asian Cities through Co-Benefits. J. Clean. Prod. 2013, 58, 1–6. [Google Scholar] [CrossRef]
- Martinelli, L.A.; Howarth, R.W.; Cuevas, E.; Filoso, S.; Austin, A.M.Y.T.; Donoso, L.; Huszar, V.; Keeney, D.; Lara, L.L.; Llerena, C.; et al. Sources of Reactive Nitrogen Affecting Ecosystems in Latin America and the Caribbean: Current Trends and Future Perspectives. Biodegradation 2006, 79, 3–24. [Google Scholar] [CrossRef]
- Gu, B.; Dong, X.; Peng, C.; Luo, W.; Chang, J.; Ge, Y. The Long-Term Impact of Urbanization on Nitrogen Patterns and Dynamics in Shanghai, China. Environ. Pollut. 2012, 171, 30–37. [Google Scholar] [CrossRef] [Green Version]
- Liu, C.; Wang, Q.; Zou, C.; Hayashi, Y.; Yasunari, T. Recent Trends in Nitrogen Flows with Urbanization in the Shanghai Megacity and the Effects on the Water Environment. Environ. Sci. Pollut. Res. 2015, 22, 3431–3440. [Google Scholar] [CrossRef]
- Zhang, W.S.; Swaney, D.P.; Li, X.Y.; Hong, B.; Howarth, R.W.; Ding, S.H. Anthropogenic Point-Source and Non-Point-Source Nitrogen Inputs into Huai River Basin and Their Impacts on Riverine Ammonia-Nitrogen Flux. Biogeosciences 2015, 12, 4275–4289. [Google Scholar] [CrossRef] [Green Version]
- Pickett, S.T.A.; Cadenasso, M.L.; Grove, J.M.; Boone, C.G.; Groffman, P.M.; Irwin, E.; Kaushal, S.S.; Marshall, V.; McGrath, B.P.; Nilon, C.H.; et al. Urban Ecological Systems: Scientific Foundations and a Decade of Progress. J. Environ. Manag. 2011, 92, 331–362. [Google Scholar] [CrossRef]
- Zhao, H.; Yuan, M.; Strokal, M.; Wu, H.C.; Liu, X.; Murk, A.; Kroeze, C.; Osinga, R. Impacts of Nitrogen Pollution on Corals in the Context of Global Climate Change and Potential Strategies to Conserve Coral Reefs. Sci. Total Environ. 2021, 774, 145017. [Google Scholar] [CrossRef]
- Deng, L.; Peng, C.; Zhu, G.; Chen, L.; Liu, Y.; Shangguan, Z. Positive Responses of Belowground C Dynamics to Nitrogen Enrichment in China. Sci. Total Environ. 2018, 616–617, 1035–1044. [Google Scholar] [CrossRef]
- Vitousek, P.M.; Aber, J.D.; Howarth, R.W.; Likens, G.E.; Matson, P.A.; Schindler, D.W.; Schlesinger, W.H.; Tilman, D.G. Human Alteration of the Global Nitrogen Cycle: Sources and Consequences. Ecol. Appl. 1997, 7, 737–750. [Google Scholar] [CrossRef] [Green Version]
- Divers, M.T.; Elliott, E.M.; Bain, D.J. Quantification of Nitrate Sources to an Urban Stream Using Dual Nitrate Isotopes. Environ. Sci. Technol. 2014, 48, 10580–10587. [Google Scholar] [CrossRef]
- Bu, H.; Song, X.; Zhang, Y.; Meng, W. Sources and Fate of Nitrate in the Haicheng River Basin in Northeast China Using Stable Isotopes of Nitrate. Ecol. Eng. 2017, 98, 105–113. [Google Scholar] [CrossRef]
- Zhang, X.; Zhang, Y.; Shi, P.; Bi, Z.; Shan, Z.; Ren, L. The Deep Challenge of Nitrate Pollution in River Water of China. Sci. Total Environ. 2021, 770, 144674. [Google Scholar] [CrossRef]
- Danni, S.O.; Bouchaou, L.; Elmouden, A.; Brahim, Y.A.; N’da, B. Assessment of Water Quality and Nitrate Source in the Massa Catchment (Morocco) Using δ 15N and δ 18O Tracers. Appl. Radiat. Isot. 2019, 154, 108859. [Google Scholar] [CrossRef]
- Joossens, J.V.; Hill, M.J.; Elliott, P.; Stamler, R.; Stamler, J.; Lesaffre, E.; Dyer, A.; Nichols, R.; Kesteloot, H. Dietary Salt, Nitrate and Stomach Cancer Mortality in 24 Countries. Int. J. Epidemiol. 1996, 25, 494–504. [Google Scholar] [CrossRef]
- Santamaria, P. Nitrate in Vegetables: Toxicity, Content, Intake and EC Regulation. J. Sci. Food Agric. 2006, 86, 10–17. [Google Scholar] [CrossRef]
- Knobeloch, L.; Salna, B.; Hogan, A.; Postle, J.; Anderson, H. Blue babies and nitrate-contaminated well water. Environ. Health Perspect. 2000, 7, 675–678. [Google Scholar] [CrossRef]
- Fewtrell, L. Drinking-Water Nitrate, Methemoglobinemia, and Global Burden of Disease: A Discussion. Environ. Health Perspect. 2004, 112, 1371–1374. [Google Scholar] [CrossRef] [Green Version]
- Rassam, D.W.; Pagendam, D.E.; Hunter, H.M. Conceptualisation and Application of Models for Groundwater-Surface Water Interactions and Nitrate Attenuation Potential in Riparian Zones. Environ. Model. Softw. 2008, 23, 859–875. [Google Scholar] [CrossRef]
- Zhang, Y.; Shi, P.; Song, J.; Li, Q. Application of Nitrogen and Oxygen Isotopes for Source and Fate Identification of Nitrate Pollution in Surfacewater: A Review. Appl. Sci. 2018, 9, 18. [Google Scholar] [CrossRef] [Green Version]
- Zhao, H.; Xiao, Q.; Miao, Y.; Wang, Z.; Wang, Q. Sources and Transformations of Nitrate Constrained by Nitrate Isotopes and Bayesian Model in Karst Surface Water, Guilin, Southwest China. Environ. Sci. Pollut. Res. 2020, 27, 21299–21310. [Google Scholar] [CrossRef]
- Kendall, C. Tracing Nitrogen Sources and Cycling in Catchments; Elsevier: Amsterdam, The Netherlands, 1998. [Google Scholar]
- Kelly, B.; Mtiti, E.; McIntyre, P.B.; Vadeboncoeur, Y. Stable Isotopes Reveal Nitrogen Loading to Lake Tanganyika from Remote Shoreline Villages. Environ. Manag. 2017, 59, 264–273. [Google Scholar] [CrossRef]
- Yin, C.; Yang, H.; Wang, J.; Guo, J.; Tang, X.; Chen, J. Combined Use of Stable Nitrogen and Oxygen Isotopes to Constrain the Nitrate Sources in a Karst Lake. Agric. Ecosyst. Environ. 2020, 303, 107089. [Google Scholar] [CrossRef]
- Onodera, T.; Komatsu, K.; Kohzu, A.; Kanaya, G.; Mizuochi, M.; Syutsubo, K. Evaluation of Stable Isotope Ratios (δ15N and δ18O) of Nitrate in Advanced Sewage Treatment Processes: Isotopic Signature in Four Process Types. Sci. Total Environ. 2021, 762, 144120. [Google Scholar] [CrossRef]
- Xue, D.; Botte, J.; de Baets, B.; Accoe, F.; Nestler, A.; Taylor, P.; van Cleemput, O.; Berglund, M.; Boeckx, P. Present Limitations and Future Prospects of Stable Isotope Methods for Nitrate Source Identification in Surface- and Groundwater. Water Res. 2009, 43, 1159–1170. [Google Scholar] [CrossRef]
- Xu, S.; Kang, P.; Sun, Y. A Stable Isotope Approach and Its Application for Identifying Nitrate Source and Transformation Process in Water. Environ. Sci. Pollut. Res. 2016, 23, 1133–1148. [Google Scholar] [CrossRef]
- Grabb, K.C.; Ding, S.; Ning, X.; Liu, S.M.; Qian, B. Characterizing the impact of Three Gorges Dam on the Changjiang (Yangtze River): A story of nitrogen biogeochemical cycling through the lens of nitrogen stable isotopes. Environ. Res. 2021, 195, 110759. [Google Scholar] [CrossRef]
- Zhong, W.; Wang, S.; Dong, Y.; Ni, Z.; Fan, Y.; Wu, D. Trends of the Response-Relationship between Net Anthropogenic Nitrogen and Phosphorus Inputs (NANI/NAPI) and TN/TP Export Fluxes in Raohe Basin, China. Chemosphere 2022, 286, 131662. [Google Scholar] [CrossRef] [PubMed]
- Han, Y.; Feng, G.; Swaney, D.P.; Dentener, F.; Koeble, R.; Ouyang, Y.; Gao, W. Global and Regional Estimation of Net Anthropogenic Nitrogen Inputs (NANI). Geoderma 2020, 361, 114066. [Google Scholar] [CrossRef]
- Chen, F.; Hou, L.; Liu, M.; Zheng, Y.; Yin, G.; Lin, X.; Li, X.; Zong, H.; Deng, F.; Gao, J.; et al. Net Anthropogenic Nitrogen Inputs (NANI) into the Yangtze River Basin and the Relationship with Riverine Nitrogen Export. J. Geophys. Res. Biogeosci. 2016, 121, 451–465. [Google Scholar] [CrossRef] [Green Version]
- Weigand, M.A.; Foriel, J.; Barnett, B.; Oleynik, S.; Sigman, D.M. Updates to Instrumentation and Protocols for Isotopic Analysis of Nitrate by the Denitrifier Method. Rapid Commun. Mass Spectrom. 2016, 30, 1365–1383. [Google Scholar] [CrossRef] [PubMed] [Green Version]
- Mcilvin, M.R.; Casciotti, K.L. Technical Updates to the Bacterial Method for Nitrate Isotopic Analyses. Anal. Chem. 2011, 83, 1850–1856. [Google Scholar] [CrossRef] [PubMed]
- Kou, X.; Ding, J.; Li, Y.; Li, Q.; Mao, L.; Xu, C.; Zheng, Q.; Zhuang, S. Tracing Nitrate Sources in the Groundwater of an Intensive Agricultural Region. Agric. Water Manag. 2021, 250, 106826. [Google Scholar] [CrossRef]
- Parnell, A.C.; Inger, R.; Bearhop, S.; Jackson, A.L. Source Partitioning Using Stable Isotopes: Coping with Too Much Variation. PLoS ONE 2010, 5, e9672. [Google Scholar] [CrossRef]
- Liu, X.L.; Han, G.; Zeng, J.; Liu, M.; Li, X.Q.; Boeckx, P. Identifying the Sources of Nitrate Contamination Using a Combined Dual Isotope, Chemical and Bayesian Model Approach in a Tropical Agricultural River: Case Study in the Mun River, Thailand. Sci. Total Environ. 2021, 760, 143938. [Google Scholar] [CrossRef]
- Hu, J.; Liu, W.; Xing, M.; Li, Y. Using a Nitrogen and Oxygen Isotopic Approach to Identify Nitrate Sources and Cycling in the Wei River of Northwestern China. Hum. Ecol. Risk Assess. 2019, 25, 755–771. [Google Scholar] [CrossRef]
- Ding, J.; Xi, B.; Gao, R.; He, L.; Liu, H.; Dai, X.; Yu, Y. Identifying Diffused Nitrate Sources in a Stream in an Agricultural Field Using a Dual Isotopic Approach. Sci. Total Environ. 2014, 484, 10–18. [Google Scholar] [CrossRef]
- Lu, L.; Cheng, H.; Pu, X.; Liu, X.; Cheng, Q. Nitrate Behaviors and Source Apportionment in an Aquatic System from a Watershed with Intensive Agricultural Activities. Environ. Sci. Process. Impacts 2015, 17, 131–144. [Google Scholar] [CrossRef]
- Kendall, C.; Elliott, E.M.; Wankel, S.D. Tracing anthropogenic inputs of nitrogen to ecosystems. In Stable Isotopes in Ecology and Environmental Science, 2nd ed.; Blackwell Publishing Ltd.: Oxford, UK, 2007; pp. 375–449. [Google Scholar] [CrossRef]
- Black, A.S.; Waring, S.A. The Natural Abundance of 15n in the Soil-Water System of a Small Catchment Area. Aust. J. Soil Res. 1977, 15, 51–57. [Google Scholar] [CrossRef]
- Widory, D.; Kloppmann, W.; Chery, L.; Bonnin, J.; Rochdi, H.; Guinamant, J.L. Nitrate in Groundwater: An Isotopic Multi-Tracer Approach. J. Contam. Hydrol. 2004, 72, 165–188. [Google Scholar] [CrossRef]
- Kellman, L.M. A Study of Tile Drain Nitrate—δ15N Values as a Tool for Assessing Nitrate Sources in an Agricultural Region. Nutr. Cycl. Agroecosyst. 2005, 71, 131–137. [Google Scholar] [CrossRef]
- Liu, J.; Shen, Z.; Yan, T.; Yang, Y. Source Identification and Impact of Landscape Pattern on Riverine Nitrogen Pollution in a Typical Urbanized Watershed, Beijing, China. Sci. Total Environ. 2018, 628–629, 1296–1307. [Google Scholar] [CrossRef]
- Ma, P.; Liu, S.; Yu, Q.; Li, X.; Han, X. Sources and Transformations of Anthropogenic Nitrogen in the Highly Disturbed Huai River Basin, Eastern China. Environ. Sci. Pollut. Res. 2019, 26, 11153–11169. [Google Scholar] [CrossRef]
- Zhang, H.; Yang, Y.; Zou, J.; Wen, Y.; Gao, C. The Sources and Dispersal of Nitrate in Multiple Waters, Constrained by Multiple Isotopes, in the Wudalianchi Region, Northeast China. Environ. Sci. Pollut. Res. 2018, 25, 24348–24361. [Google Scholar] [CrossRef]
- Böttcher, J.; Strebel, O.; Voerkelius, S.; Schmidt, H.L. Using Isotope Fractionation of Nitrate-Nitrogen and Nitrate-Oxygen for Evaluation of Microbial Denitrification in a Sandy Aquifer. J. Hydrol. 1990, 114, 413–424. [Google Scholar] [CrossRef]
- McMahon, P.B.; Böhlke, J.K. Regional Patterns in the Isotopic Composition of Natural and Anthropogenic Nitrate in Groundwater, High Plains, U.S.A. Environ. Sci. Technol. 2006, 40, 2965–2970. [Google Scholar] [CrossRef] [Green Version]
- Hu, Y.; Liu, G.D.; Meng, Y.C.; Zhang, W.J.; Xia, C.C. Analysis of Stable Hydrogen and Oxygen Isotope Characteristics and Vapor Sources of Event-Based Precipitation in Chengdu. Huanjing Kexue Environ. Sci. 2019, 40, 1179–1187. [Google Scholar] [CrossRef]
- Xuan, Y.; Tang, C.; Cao, Y. Mechanisms of Nitrate Accumulation in Highly Urbanized Rivers: Evidence from Multi-Isotopes in the Pearl River Delta, China. J. Hydrol. 2020, 587, 124924. [Google Scholar] [CrossRef]
- Soto, D.X.; Koehler, G.; Wassenaar, L.I.; Hobson, K.A. Spatio-Temporal Variation of Nitrate Sources to Lake Winnipeg Using N and O Isotope (δ15N, δ18O) Analyses. Sci. Total Environ. 2019, 647, 486–493. [Google Scholar] [CrossRef]
Figure 1.
Location of the sampling points.

Figure 2.
Changes in the NANI and its components in Chengdu between 1970 and 2019. Top: percentages; Bottom: absolute values.
Figure 2.
Changes in the NANI and its components in Chengdu between 1970 and 2019. Top: percentages; Bottom: absolute values.

Figure 3.
Changes in the and its components in Chengdu between 1970 and 2019. Above: percentages; below: absolute values.
Figure 3.
Changes in the and its components in Chengdu between 1970 and 2019. Above: percentages; below: absolute values.

Figure 4.
Variations in the riverine N export fluxes in the study area between 2011 and 2019. (a) Yearly NANI, N export fluxes, and surface runoff changes; (b) Proportions of different N export fluxes.
Figure 4.
Variations in the riverine N export fluxes in the study area between 2011 and 2019. (a) Yearly NANI, N export fluxes, and surface runoff changes; (b) Proportions of different N export fluxes.

Figure 5.
The dual stable isotopes of contained in the whole Chengdu basin. Data are derived from a variety of sources, including atmospheric deposition (NP), chemical fertilizers (NF), soil organic N nitrification (SN), and manure and sewage (M & S) [25,43].

Figure 6.
Proportional contributions of four sources between 2017 and 2019. The boxplot illustrates the 5th, 50th, and 95th medians, which were derived using the method described in [47].
Figure 6.
Proportional contributions of four sources between 2017 and 2019. The boxplot illustrates the 5th, 50th, and 95th medians, which were derived using the method described in [47].

Figure 7.
Correlation between the NANI, its components, and social development indicators in Chengdu.
Figure 7.
Correlation between the NANI, its components, and social development indicators in Chengdu.

Figure 8.
Forecast of the TN export fluxes for the next ten years (2020–2030).


Table 1.
- and - values of various sources.
| Sources | n | - (‰) | - (‰) | |||
|---|---|---|---|---|---|---|
| Mean | SD | Mean | SD | |||
| in precipitation (NP) | 26 | 2.3 | 5.4 | 30.9 | 9.4 | |
| Fertilizer N (NF) | 12 | −3.5 | 9.1 | −1.1 | 2.1 | |
| Soil N (SN) a | - | 4.6 | 4.4 | −0.3 | 6.8 | |
| Manure and sewage (M & S) | Manure | 8 | 22.9 | 8.4 | 3.1 | 5.0 |
| Sewage | 50 | 14.4 | 7.8 | −1.9 | 4.7 | |
| Total | 58 | 15.58 | 8.4 | −1.3 | 4.9 | |
Table 2.
Estimation of different N source contributions.
| Year | Category | NP | NF | SN | M & S |
| 2017 | Low 95% hdr | 0.00 | 0.27 | 0.01 | 0.27 |
| High 95% hdr | 0.05 | 0.52 | 0.43 | 0.45 | |
| mode | 0.01 | 0.33 | 0.31 | 0.35 | |
| mean | 0.02 | 0.38 | 0.23 | 0.36 | |
| 2018 | Low 95% hdr | 0.04 | 0.00 | 0.01 | 0.42 |
| High 95% hdr | 0.12 | 0.25 | 0.45 | 0.70 | |
| mode | 0.08 | 0.03 | 0.22 | 0.57 | |
| mean | 0.08 | 0.12 | 0.24 | 0.56 | |
| 2019 | Low 95% hdr | 0.08 | 0.00 | 0.04 | 0.33 |
| High 95% hdr | 0.14 | 0.32 | 0.57 | 0.50 | |
| mode | 0.09 | 0.05 | 0.50 | 0.37 | |
| mean | 0.11 | 0.15 | 0.33 | 0.41 | |
| 2017–2019 | Low 95% hdr | 0.05 | 0.01 | 0.02 | 0.34 |
| High 95% hdr | 0.11 | 0.35 | 0.57 | 0.53 | |
| mode | 0.08 | 0.16 | 0.35 | 0.44 | |
| mean | 0.08 | 0.19 | 0.29 | 0.43 |
Publisher’s Note: MDPI stays neutral with regard to jurisdictional claims in published maps and institutional affiliations. |
© 2021 by the authors. Licensee MDPI, Basel, Switzerland. This article is an open access article distributed under the terms and conditions of the Creative Commons Attribution (CC BY) license (https://creativecommons.org/licenses/by/4.0/).
Share and Cite
MDPI and ACS Style
Ding, Y.; Lai, C.; Shi, Q.; Ouyang, L.; Wang, Z.; Yao, G.; Jia, B. Responses of Net Anthropogenic N Inputs and Export Fluxes in the Megacity of Chengdu, China. Water 2021, 13, 3543. https://doi.org/10.3390/w13243543
AMA Style
Ding Y, Lai C, Shi Q, Ouyang L, Wang Z, Yao G, Jia B. Responses of Net Anthropogenic N Inputs and Export Fluxes in the Megacity of Chengdu, China. Water. 2021; 13(24):3543. https://doi.org/10.3390/w13243543
Chicago/Turabian StyleDing, Yao, Chengyue Lai, Qing Shi, Lili Ouyang, Zhaoli Wang, Gang Yao, and Binyang Jia. 2021. "Responses of Net Anthropogenic N Inputs and Export Fluxes in the Megacity of Chengdu, China" Water 13, no. 24: 3543. https://doi.org/10.3390/w13243543
Note that from the first issue of 2016, this journal uses article numbers instead of page numbers. See further details here.