
The Influence of Landcover and Climate Change on the Hydrology of the Minjiang River Watershed
by
 , and
, and
Haroon Rashid
1 ,
,
Kaijie Yang
1,
Aicong Zeng
1,
Song Ju
1,
Abdur Rashid
2,
Futao Guo
1 and
Siren Lan
1,* 1
College of Forestry, Fujian Agriculture and Forestry University, Fuzhou 350002, China
2
Department of Soil and Environmental Sciences, The University of Agriculture, Peshawar 25130, Pakistan
*
Author to whom correspondence should be addressed.
Water 2021, 13(24), 3554; https://doi.org/10.3390/w13243554
Submission received: 26 November 2021
/
Revised: 8 December 2021
/
Accepted: 9 December 2021
/
Published: 12 December 2021
Abstract
:Changes in the climate and landcover are the two most important factors that influence terrestrial hydrological systems. Today, watershed-scale hydrological models are widely used to estimate the individual impacts of changes in the climate and landcover on watershed hydrology. The Minjiang river watershed is an ecologically and economically important, humid, subtropical watershed, located in south-eastern China. Several studies are available on the impacts of recent climate change on the watershed; however, no efforts have been made to separate the individual contributions of climate and landcover changes. This study is an attempt to separate the individual impacts of recent (1989–2018) climate and landcover changes on some of the important hydrological components of the watershed, and highlight the most influential changes in climate parameters and landcover classes. A calibrated soil and water assessment tool (SWAT) was employed for the study. The outcomes revealed that, during the study period, water yield decreased by 6.76%, while evapotranspiration, surface runoff and sediment yield increased by 1.08%, 24.11% and 33.85% respectively. The relative contribution of climate change to landcover change for the decrease in the water yield was 95%, while its contribution to the increases in evapotranspiration, surface runoff and sediment yield was 56%, 77% and 51%, respectively. The changes in climate parameters that were most likely responsible for changes in ET were increasing solar radiation and temperature and decreasing wind speed, those for changes in the water yield were decreasing autumn precipitation and increasing solar radiation and temperature, those for the increase in surface runoff were increasing summer and one-day maximum precipitation, while those for the increasing sediment yield were increasing winter and one-day maximum precipitation. Similarly, an increase in the croplands at the expense of needle-leaved forests was the landcover change that was most likely responsible for a decrease in the water yield and an increase in ET and sediment yield, while an increase in the amount of urban land at the expense of broadleaved forests and wetlands was the landcover change that was most likely responsible for increasing surface runoff. The findings of the study can provide support for improving management and protection of the watershed in the context of landcover and climate change.
1. Introduction
A watershed is a complex system that encompasses a variety of subsystems, each with distinct vegetation–biogeochemical–hydrological interactions. Any systematic change in its components produces direct as well as indirect impacts that propagate throughout the system [1]. Climate and landcover are essential components in a watershed system. In response to climate change, the hydrological cycle is expected to alter as increasing temperatures accelerate evaporation [2]. Changes in the climate can cause chronic and periodic water shortages [3]. Climate change is reported to impact the quality, quantity and availability of water. It can alter the flow regime and change nutrient and sediment yield [4]. The rising temperatures that are associated with precipitation can trigger stress in the water balance, resulting in wetter and drier rainy seasons, and increase the number and intensity of extreme flashfloods and droughts [3]. Changes in the landcover can produce impacts on the quality and quantity of water and surface runoff [5].
According to the Intergovernmental Panel on Climate Change [6], each of the last four decades has been successively warmer than any decade that has preceded it, while, globally, average precipitation over land has increased. According to the Food and Agriculture Organization [7], global population growth, urbanization and increasing demand for food are leading to large-scale landcover transformations. By the year 2050, to meet food demand, agricultural production will have to increase by 60 percent from 2005/2007 levels. Therefore, highlighting the consequences of recent changes in the climate and landcover on watershed systems is vital for sustainable watershed management.
The Minjiang river watershed is a humid, subtropical, forest-dominated watershed, and is one of the largest watersheds in China. It is an abundant water resource and plays a great role in socio-economic development and provides opportunities for generating hydroelectricity, navigation, irrigation, fishing, recreation and biodiversity conservation [8]. Frequent conversions of different forest covers into non-forest land occurred in the watershed, with non-forest classes gaining land from coniferous forest areas [9]. The occurrence of flash floods has risen sharply since 1988 [10]. The watershed has been suffering from large-scale environmental, social and economic damage due to flooding and soil erosion since the 1990s. Flooding and water pollution in the watershed are thought by the local population to be caused by the overlogging of natural forests and the discharge of untreated waste into the water bodies [8]. Research on the influence of climate change has been conducted using river gauge data in the past [11]. However, understanding the effects of climate change on hydrology requires a quantitative separation of the influencing factors, including landcover, reservoir/dam management, etc.
To separate and quantify the individual impacts of changes in landcover and climate, researchers can use spatially distributed hydrological models, such as the soil and water assessment tool (SWAT). The SWAT is a watershed-scale, physically based, continuous-time hydrologic and water quality model. A large body of literature on the applicability and performance of the model in different watersheds of the world is available. Recently, many researchers have employed the SWAT model to evaluate the individual impacts of changes in landcover and climate on watersheds around the globe, for example, the authors of [12] quantified the impacts of land-use changes on runoff and soil erosion using the SWAT model on the Yanhe River Basin in the Loess Plateau, and found a reduction in river flow and sediment load due to the conversion of croplands to forests. While using the SWAT model, Lotz et al. [13] found that surface runoff and evapotranspiration (ET) were mainly determined by landcover. The authors of [14] used the SWAT model to assess the effects of landcover changes on the hydrology of the Andalien river of Chile, and found an increasing trend in ET and surface flows with a significant decrease in percolation and lateral flow. They reported that the exotic plantations are the reason for these trends. The authors of [15] used the SWAT model on the Jinsha River Basin to study the response of the runoff to climate and landcover changes, and reported that landcover changes had little effect on the hydrological processes compared to climate change. The authors of [16] investigated the impacts of landcover changes on the water balance of the Jhelum River Basin using SWAT, and found that afforestation has reduced the water yield and surface runoff, while enhanced ET and increased snow cover in some subbasins caused an increase in water yield. The authors of [17] analyzed the impacts of landcover changes on surface runoff and sediment yield in the upper Tapi River subbasin, India, using SWAT, and found that landcover changes resulted in an increase in surface runoff, water yield, and sediment yield. The authors of [18] assessed the impacts of climate and landcover changes on streamflow in the Xinanjiang Basin, in east China, with SWAT, and found that the impacts of climate and land-use changes on monthly mean streamflow were sensitive to the impervious areas. Besides SWAT, other hydrological models are also employed by various researchers for this purpose, such as INVEST [19,20,21], HEC_HMS [22,23], and VIC [24], etc. However, no such study has been conducted on the Minjiang river watershed. Therefore, this study aims to employ the SWAT model to evaluate and quantify the influence of changes in landcover and climate that have occurred during the past few decades on the hydrology of the Minjiang river watershed, and further highlight the changes in climate parameters and landcover classes which were most likely responsible for changing the watershed’s hydrology.
2. Materials and Methods
2.1. Minjiang River Watershed
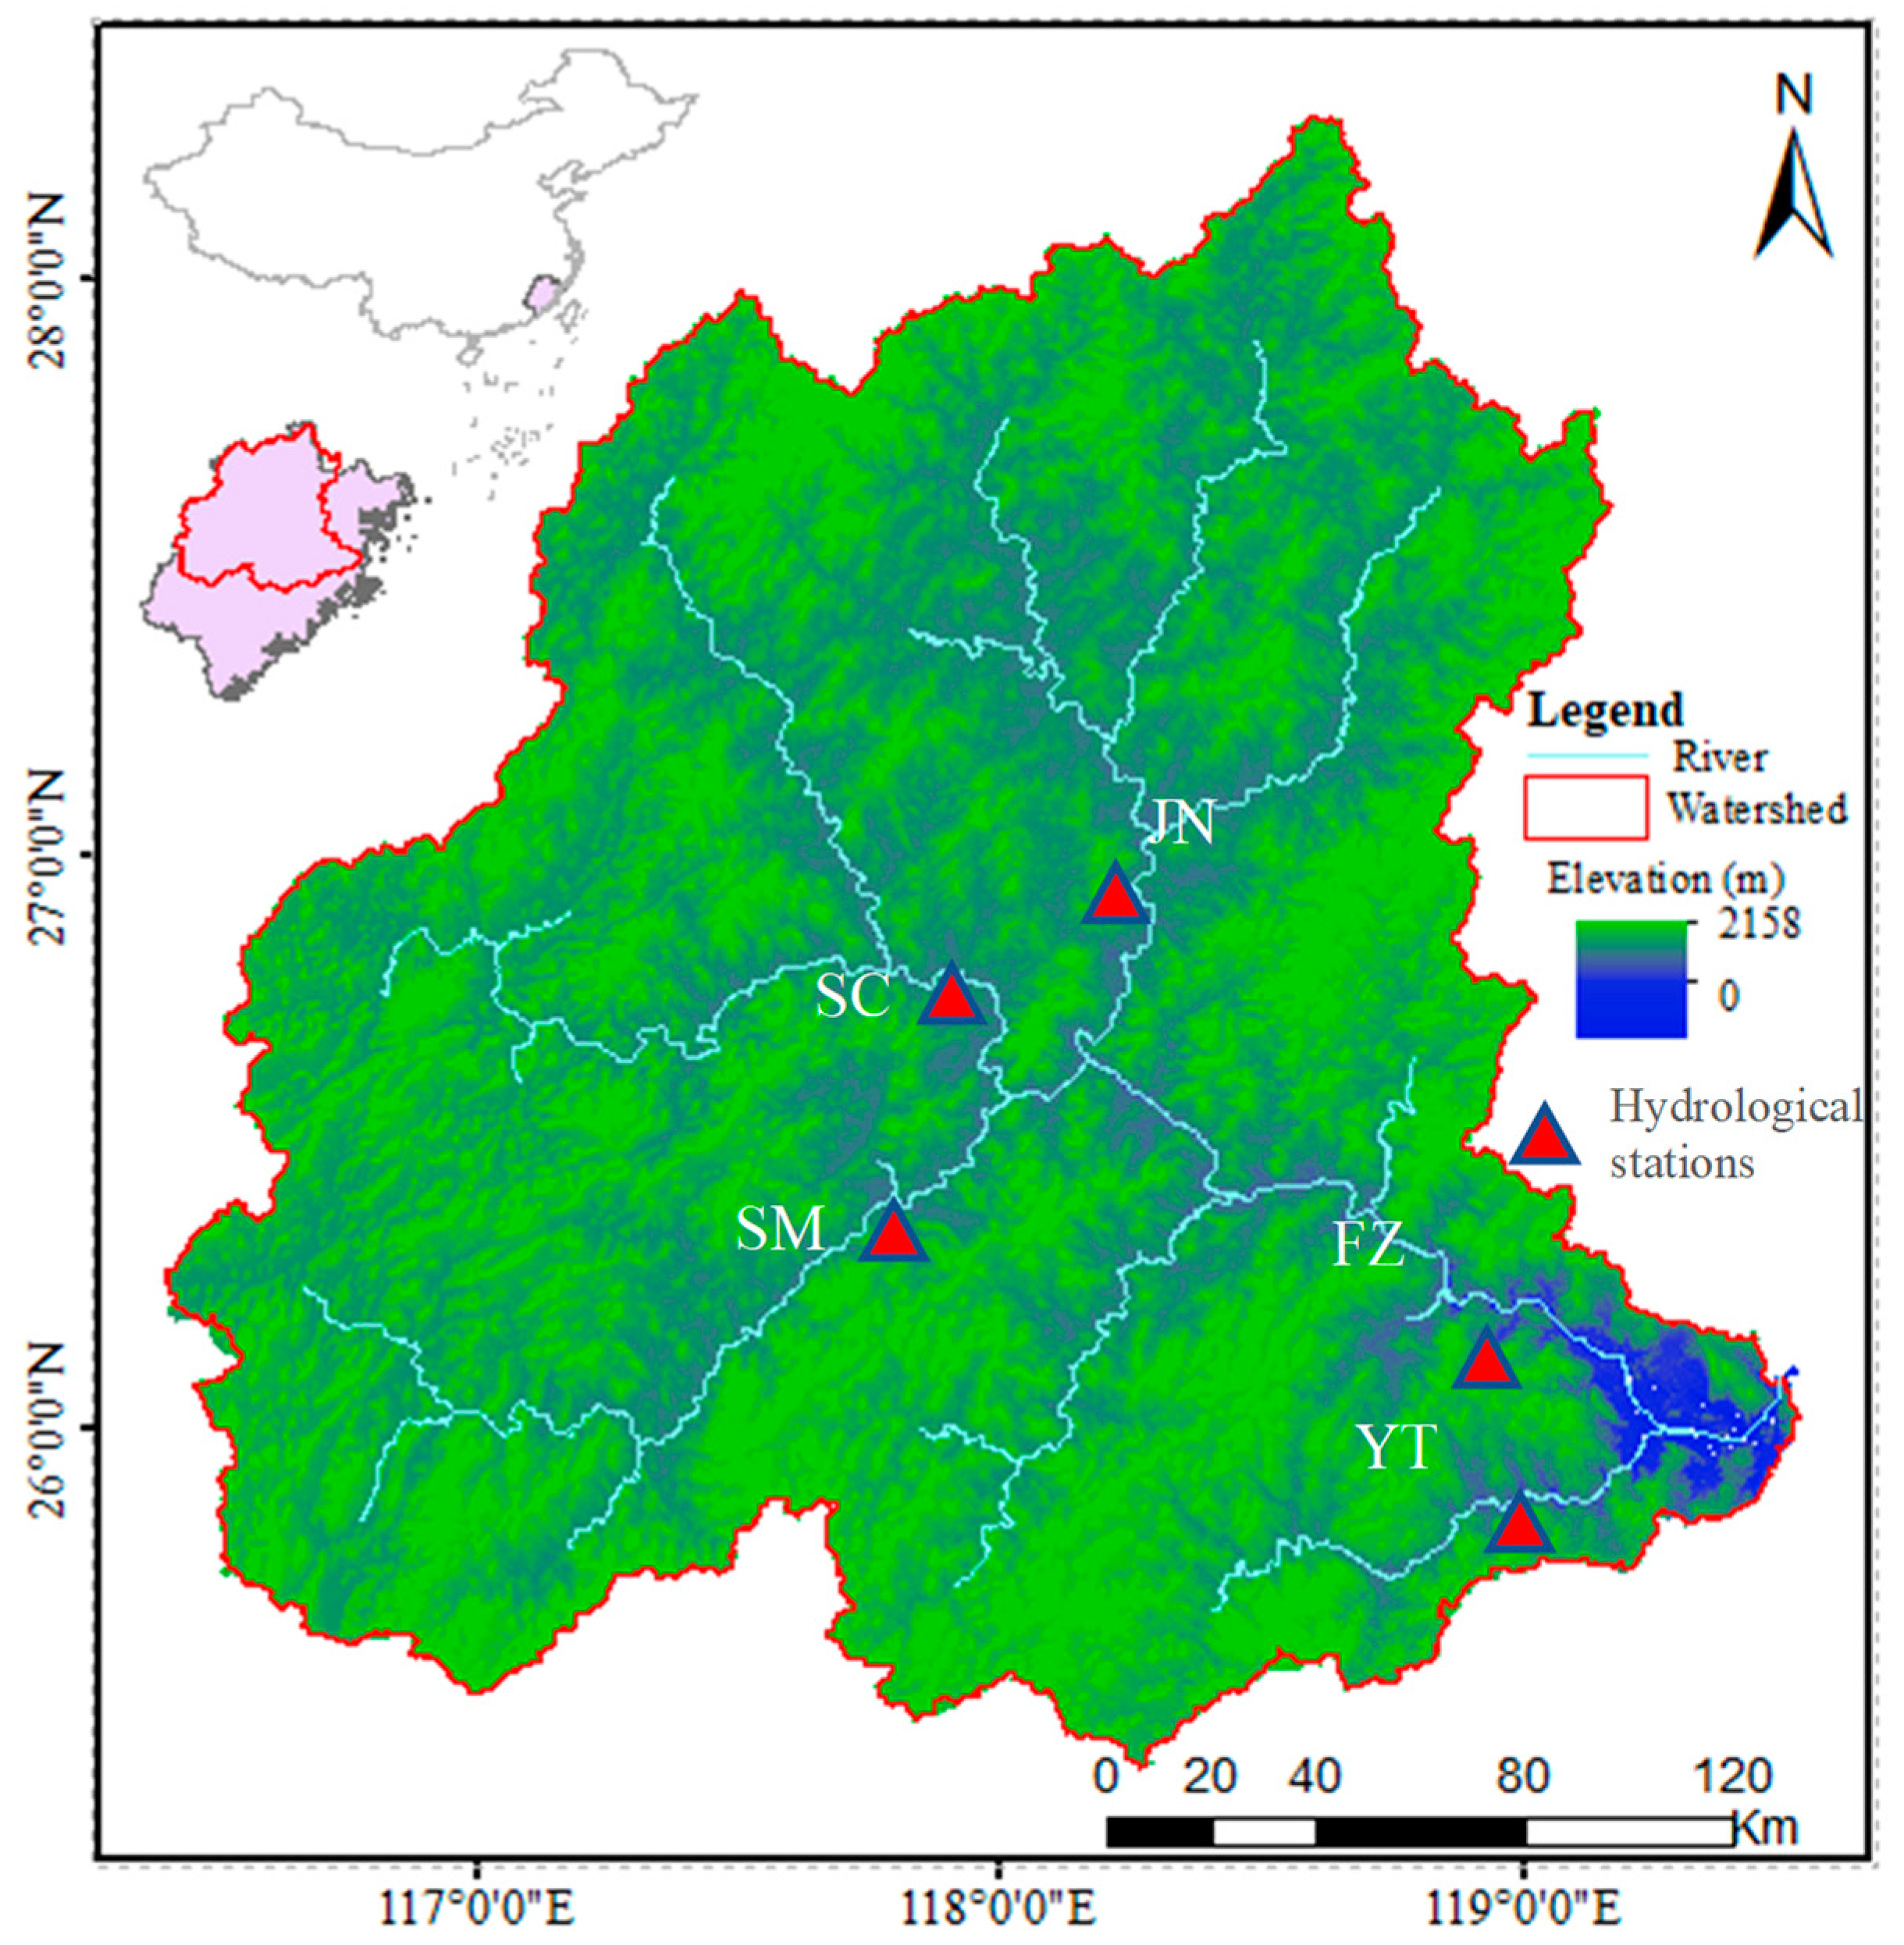
The Minjiang river watershed is located between 116°30′ and 119°30′ E and 25°20′ and 28°25′ N, in the Fujian province of China (Figure 1). It covers an area of about 60,900 km2. The elevation ranges from 0 to 2158 m, with a mean value of 528. The Minjiang river watershed has a humid, subtropical climate, and is influenced by the east Asian monsoons. The mean annual temperature ranges from 5−10 °C in January and 25−30 °C in July. Abundant rainfall occurs between March and June. The soil type of the watershed is mainly red soil, and the terrain is hilly and steep, meaning that it is prone to soil erosion and landslides. More than 50% of the land is covered by coniferous forests.
2.2. SWAT Model Input Data
The input data used to construct the SWAT model database for the watershed are given in Table 1, and discussed below:
- (1)
- The digital elevation model (DEM) used in this study is from SRTM (30 m resolution). Subbasin, river formation, and slope classification was performed using the DEM.
- (2)
- The meteorological data used in this study is “China Meteorological Assimilation Driving Datasets for the Soil and Water Assessment Tool” (CMADS) version L-V1, downloaded from the website www.cmads.org, accessed on 5 July 2020. It is a reanalysis dataset, consisting of daily precipitation, maximum and minimum temperature, wind speed, solar radiation and relative humidity. Data sources for the CMADS series include 40,000 regional automatic stations under China’s national automatic and business assessment centers [25,26,27].
- (3)
- The soil map used in this study is the harmonized world soil database (HWSD) from the Food and Agriculture Organization [7]. Most of the soil properties were available in the database. Soil erodibility factor (USLE k) was calculated using the soil erodibility equation (values ranging from 0.13–0.18). Bulk density (BD), available water capacity (Sol AWC) and soil hydraulic conductivity were calculated using the SPAW hydrology model.
- (4)
- The landcover maps used in this study are satellite-based remote sensing data from the European Space Agency’s climate change initiative (CCI-LC). This dataset describes 37 original landcover categories, classified based on the United Nations landcover classification system. The spatial resolution of the CCI-LC is 300 m and the estimated accuracy is 75.4% [28]. Recently, many studies have used the ESA CCI-LC for exploring the landcover information worldwide on different scales [29,30,31]. The Minjiang river watershed consists of nine landcover categories. Default parameter values of the SWAT model database were used. The landcover classes and some of the important parameter values, i.e., cover factor of the universal soil loss equation (c factor), leaf area index (LAI) and leaf conductance (GSI), are given in Table 2.
- (5)
- Thirty-eight reservoirs were included in the model. Most of the reservoirs were operational before our study period but some reservoirs were built in the middle, e.g., the large Shuikou reservoir in Mingqin county became operational in 1993.

Table 1.
SWAT model Input data, types and sources.
| Data | Type | Source |
|---|---|---|
| DEM | SRTM_30m | USGS_earthexplorer.com (accessed on 5 July 2020) |
| Soil map | HWSD | FAO.org (accessed on 5 July 2020) |
| Landcover maps | ESA-LC_300m | European Space Agency (https://climate.copernicus.eu/ accessed on 5 July 2020) |
| Meteorological data | Daily | CMADS.org (CMADS. L, 1979–2018) accessed on 5 July 2020 |
Table 2.
Landcover classes in the watershed and some of the vegetation parameters.
| Landcover Categories | Acronyms | C Factor | LAI | GSI |
|---|---|---|---|---|
| Cropland | CRL | 0.2 | 3.5 | 0.005 |
| Crop-woodland (cropland < 50%) | CRW | 0.003 | 4 | 0.004 |
| Evergreen broadleaved forests | FOB | 0.001 | 5 | 0.002 |
| Needle-leaved forests | FON | 0.001 | 5 | 0.002 |
| Mixed forests | FOM | 0.001 | 5 | 0.002 |
| Shrub-grassland | SRB | 0.003 | 2 | 0.002 |
| Wetland | WTL | 0.001 | 5 | 0.002 |
| Urban areas (medium density) | URL | - | - | - |
| Water bodies | WTR | - | - | - |
2.3. SWAT Model Setup and Calibration
The SWAT model is GIS based with interfaces for ArcGIS and QGIS. Structurally, the model divides a watershed into subbasins, with input values for each subbasin grouped into climate, hydrologic response units (HRUs), main channel and ponds/reservoirs. The HRUs are lumped land areas which are the product of a distinct combination of land use, slope and soil type within the subbasin. We used the ArcGIS version of SWAT. Four raster images of the years 1992, 2004, 2010 and 2018, with a spatial resolution of 300 m, were used in this study (Table 2). Unique combinations of land use, soil and slope classes were calculated for each land-use raster on a yearly basis (Table 3) using SWAT-LUT software [32]. The Minjiang river watershed was divided into 35 subbasins and 4100 HRUs.
The calibration process of the model consist of changing sensitive parameter values to minimize the difference between the observed and simulated values for flow, sediments and other modeled parameters [33]. The calibration and validation period was 1989–2018 with a warmup period of ten years (1979–1988). We used monthly observed streamflow data for one location (FZ), and yearly data for four locations (YT, SC, SM, JN) (Figure 1). Moreover, yearly sediment loading data for the abovementioned five stations within the watershed were used to assess the model performance when simulating soil erosion and sediment transport. The observed stream flow and sediment loading data were provided by the Fujian department of water resources. Sequential uncertainty fitting (SUFI-2) algorithm, which is part of the SWAT-CUP software [34], was used for sensitivity analysis and calibration of the model. The SUFI-2 algorithm enables the sensitivity analysis, calibration, validation and uncertainty analysis of SWAT simulations. The sensitivity analysis of the SWAT input parameters can be carried out using either local or global sensitivity. Local sensitivity analysis allows a single parameter to change while keeping the other parameters constant. Global sensitivity analysis means changing all of the parameters together. In SUFI-2, a multiple regression system regresses the Latin hypercube-generated parameters against an objective function to determine the sensitivity of the parameters. In this study, we used the global sensitivity analysis for calibration and two objective functions for evaluating the performance, i.e., the coefficient of determination (R2) and Nash–Sutcliffe efficiency [35].
2.4. Evaluating the Influence of Climate and Landcover Changes
2.4.1. Separating the Influence of Climate and Landcover Changes
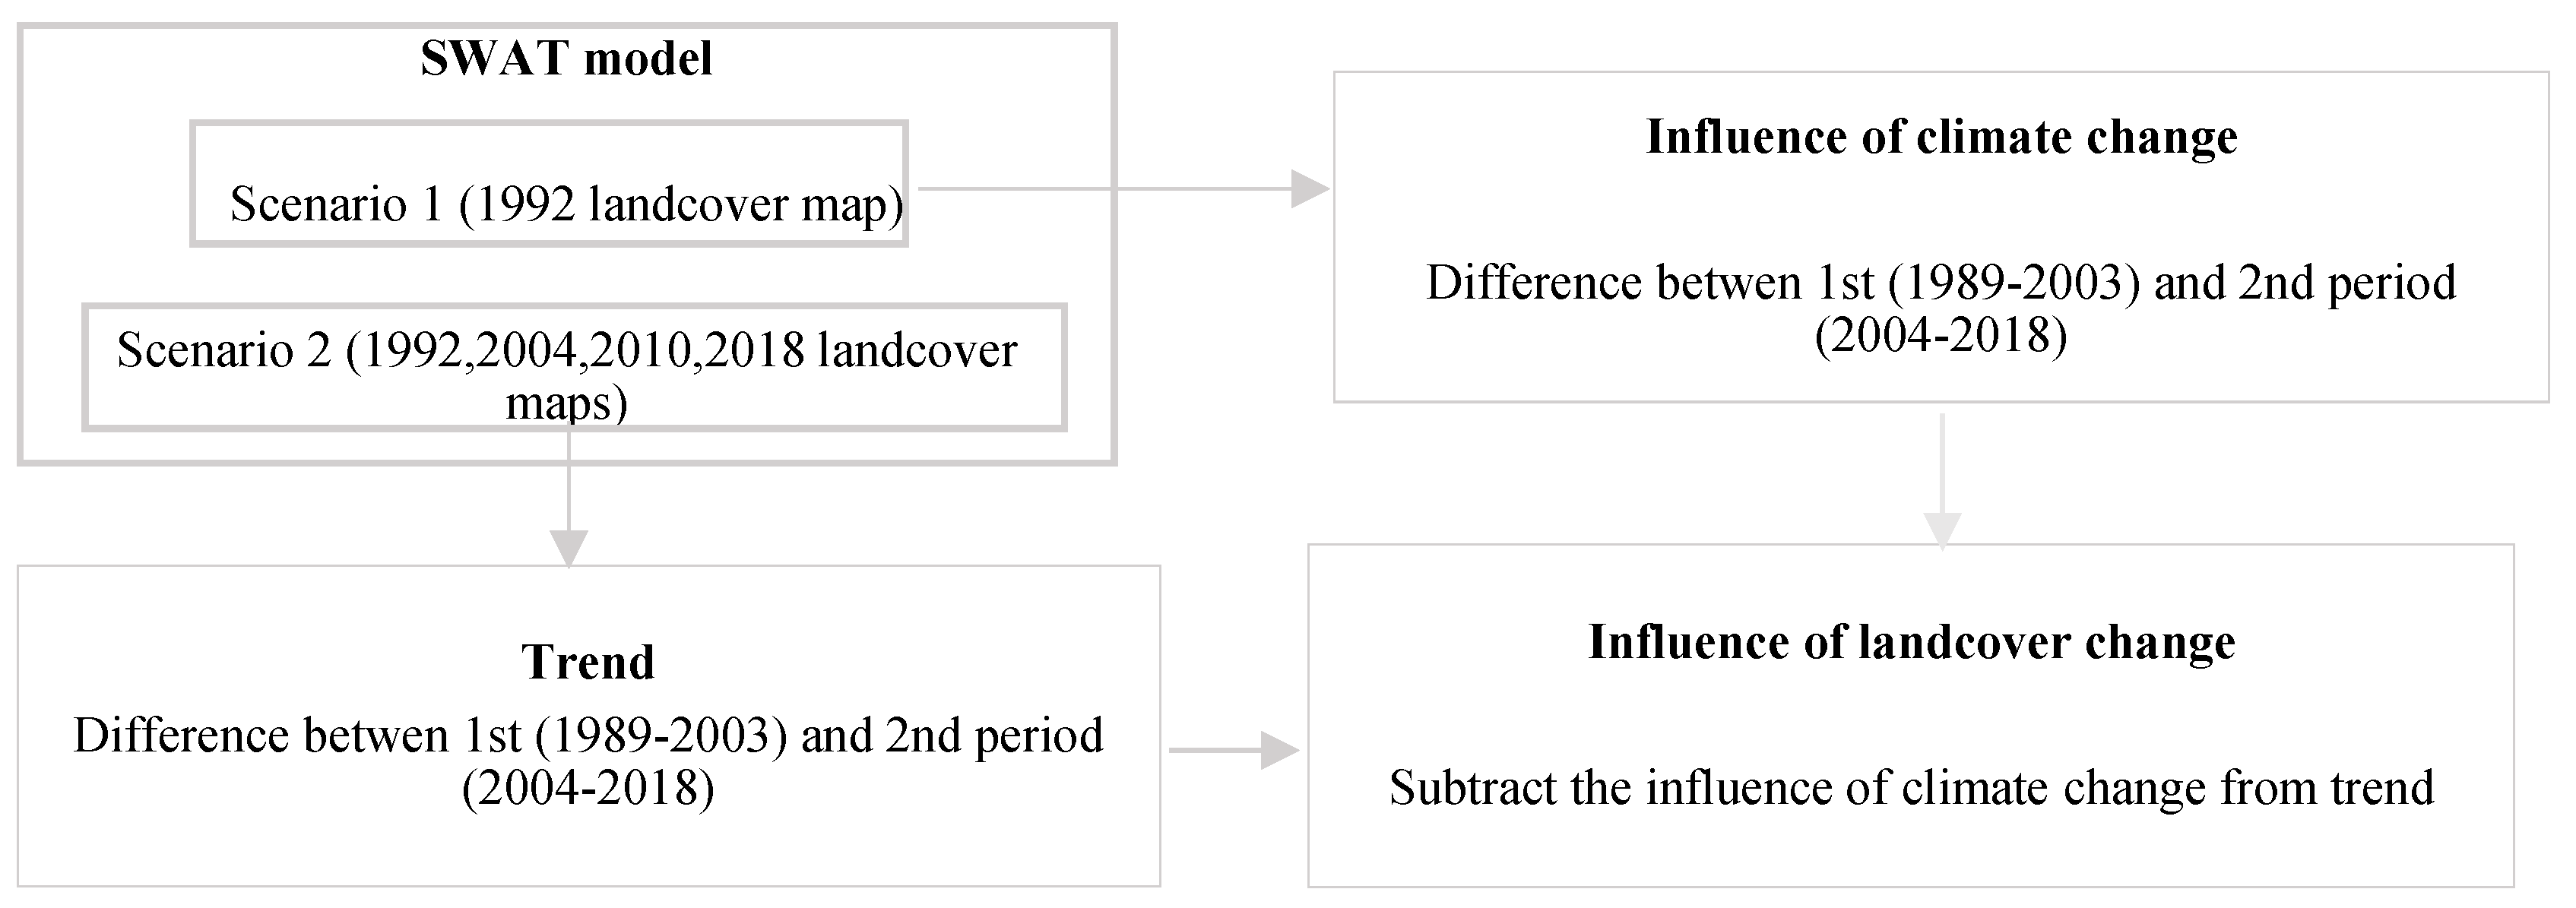
To evaluate the influence of climate and landcover changes, we followed two steps. In the first step, we separated the influence of changes in the climate and changes in landcover by running the SWAT model with two different scenarios. In the first scenario, we used the 1992 landcover map in the years 1992, 2004, 2010 and 2018. In the second scenario, we used the landcover maps of 1992, 2004, 2010 and 2018 in their respective years using the SWAT-LUT tool. The variation in the first scenario was caused by climate change, because there was no landcover change, while that in second scenario was caused by climate and landcover change combined. To isolate the influence of landcover change, we subtracted the variation in the first scenario from the variation in the second. To calculate the variation, we can use (1) trend analysis, or (2) divide the study period into two equal parts and obtain the difference. Both approaches will lead us to the same results (Figure 2). We used the second approach because of its simplicity.
In the second step, we identified the most influential changes in the climate parameters and landcover classes by correlating the variations in the hydrological parameters of the subbasins with changes in the climate parameters and landcover classes (Figure 3). This step is a comparison of the subbasins regarding, for example, the degree to which water yield increased in the watershed in response to landcover change. Once the change is confirmed, we need to identify the landcover change that is responsible for this increase. For this purpose, we can compare the landcover changes of the two subbasins with the highest increase and the lowest increase. This way we can identify the landcover change that is associated with water yield in the watershed.
2.4.2. Hydrological Parameters
We selected four hydrological parameters to be simulated by the SWAT model: evapotranspiration (ET), water yield, surface runoff and sediment yield. ET is the loss of water to the atmosphere. Three different methods for the estimation of ET are available in the SWAT model. We selected the Penman–Monteith method, which is widely used, because it considers the effects of precipitation, wind speed, temperature, solar radiation and relative humidity. Water yield is the water leaving the watershed in the form of surface, lateral and groundwater flow. Surface runoff or overland flow is the water flowing over soil, vegetation or other ground cover instead of infiltrating the ground. The SWAT model uses the SCS curve number method for surface runoff estimation. Sediment yield refers to the amount of sediment that is exported along with flowing water by a watershed over a given period. The SWAT model uses the modified universal soil loss equation (MUSLE) for the estimation of soil erosion. A detailed description of the methods and equations used in the SWAT model is given in the SWAT theoretical documentation [36].
2.4.3. Climate Parameters and Landcover Classes
The primary motivation of the study was to determine the causes of changes in the hydrological parameters; hence, our intention was to first analyze changes in the hydrological parameters and then attribute them to changes in the climate and landcover as discussed in Section 2.4.1. The method used to analyze the changes in the climate parameters and landcover classes was the same as that used to analyze the changes in the hydrological parameters, i.e., the study period was divided into two equal parts, and to analyze changes in the landcover, the study period was divided into two landcover maps. Moreover, a spatial correlation analysis was carried out to highlight the relationships between the differences between the two periods relating to the hydrological parameters, the differences between the two periods relating to the climate parameters and the differences in the landcover classes of the two landcover maps. The climate parameters that were considered in this study were average temperature, solar radiation, wind speed, relative humidity, one-day maximum precipitation and seasonal precipitation, i.e., spring (March–April), summer (May–August), autumn (September–October) and winter (November–February). Similarly, all the landcover classes were considered except water bodies (Table 2). Water bodies were excluded because of no change.
3. Results and Discussion
3.1. SWAT Model Calibration and Performance
The river flow data from all of the stations mostly matched using the default parameters, therefore a validation step was not needed. The performance of the model when simulating the sediment loading was affected by the reservoirs, because these artificially managed structures disturb the natural stream flow and thus limit the amount of sediment that is transported. We used the observed data for the years 1989–2009 for calibration, and the years 2011–2018 for validation. We selected the sensitive parameters using the SUFI2 algorithm from the SWAT-CUP software to find the best fitted values. The parameter descriptions and fitted values are given in Table 4. All of the parameters belonged to the main channel except two, i.e., ADJ_PKR and CH_NI, which belonged to the tributary channels. The most sensitive parameters were the normal concentration of sediments (RES_NSED) in the reservoir and the peak rate factor (PRF) of the main channel. RES_NSED ranged from 50 (FZ) to 142 mg/L in YT. The difference among the stations may be related to the capacity of the reservoir. The authors of [37] set the value at 15 mg/L of RES_NSED to calibrate sediment concentration in the upper Danube basin. The peak rate factor of the main channel ranged from 0.55 in FZ to 1.16 in SC. Since this parameter is mostly influenced by the reservoirs that regulate the high flows, the variation among the stations can be attributed to the size of the reservoir and the amount of the river discharge. The third most sensitive parameter was CH_N2, which ranged from 0.015 in YT to 0.036 in SC. This parameter denotes the roughness of the main channel. Since the river flows through dense forests and vegetation in the uplands of SC, this could be the cause of the variation among the stations.
After calibration, we found that there was good agreement between the observed and simulated sediment loading values during the calibration and validation in all of the stations. The highest agreement between the observed and simulated sediment loading values was in JN with an NSE value of 0.71 for calibration and 0.82 for validation. The lowest agreement was found in YT with an NSE value of 0.6 in calibration and 0.7 for validation (Table 5). The differences in the levels of agreement among the stations can be caused by the number and distance of the reservoirs from the monitoring station, because reservoirs are managed artificially, hence it is not possible for the model to simulate. In addition, the agreement among the flow data influences the sediment calibration. The year 2010 was skipped from calibration, because the model highly underestimated the sediment loading values in all of the stations except YT. It is possible that the watershed experienced large-scale landslides in the watershed in 2010, and the SWAT model cannot simulate landslides and mudflows, as mentioned by other researchers [37,38].
Uncertainties in hydrological simulations are widely reported [39,40,41], especially as they affect the calibration of the model, which sometimes becomes difficult when using a single value for the sensitive parameters. Therefore, experts recommend using a range of parameter values rather than a single value. However, in our case, the streamflow data matched without calibration, and during the sediment calibration, the most sensitive parameters were mostly related to the main channel and the reservoirs. Additionally, the parameters which we are intended to study for the impacts of climate and landcover change are all subbasin parameters, and hence they are not affected by these two kinds of parameters, i.e., the main channel and reservoirs. Moreover, reporting uncertainties in the calibration parameters becomes very important when observed data from a single station is used for the calibration of large watersheds because different parts of the watershed may have differences in the input parameters. However, in our study, we used observed data from five different locations across the watershed, and a separate calibration process was carried out for each location. Thus, we obtained five different parameter values for most of the calibrated parameters, which reveals the uncertainty in the parameters within the watershed.
3.2. The Impacts of Climate and Landcover Change
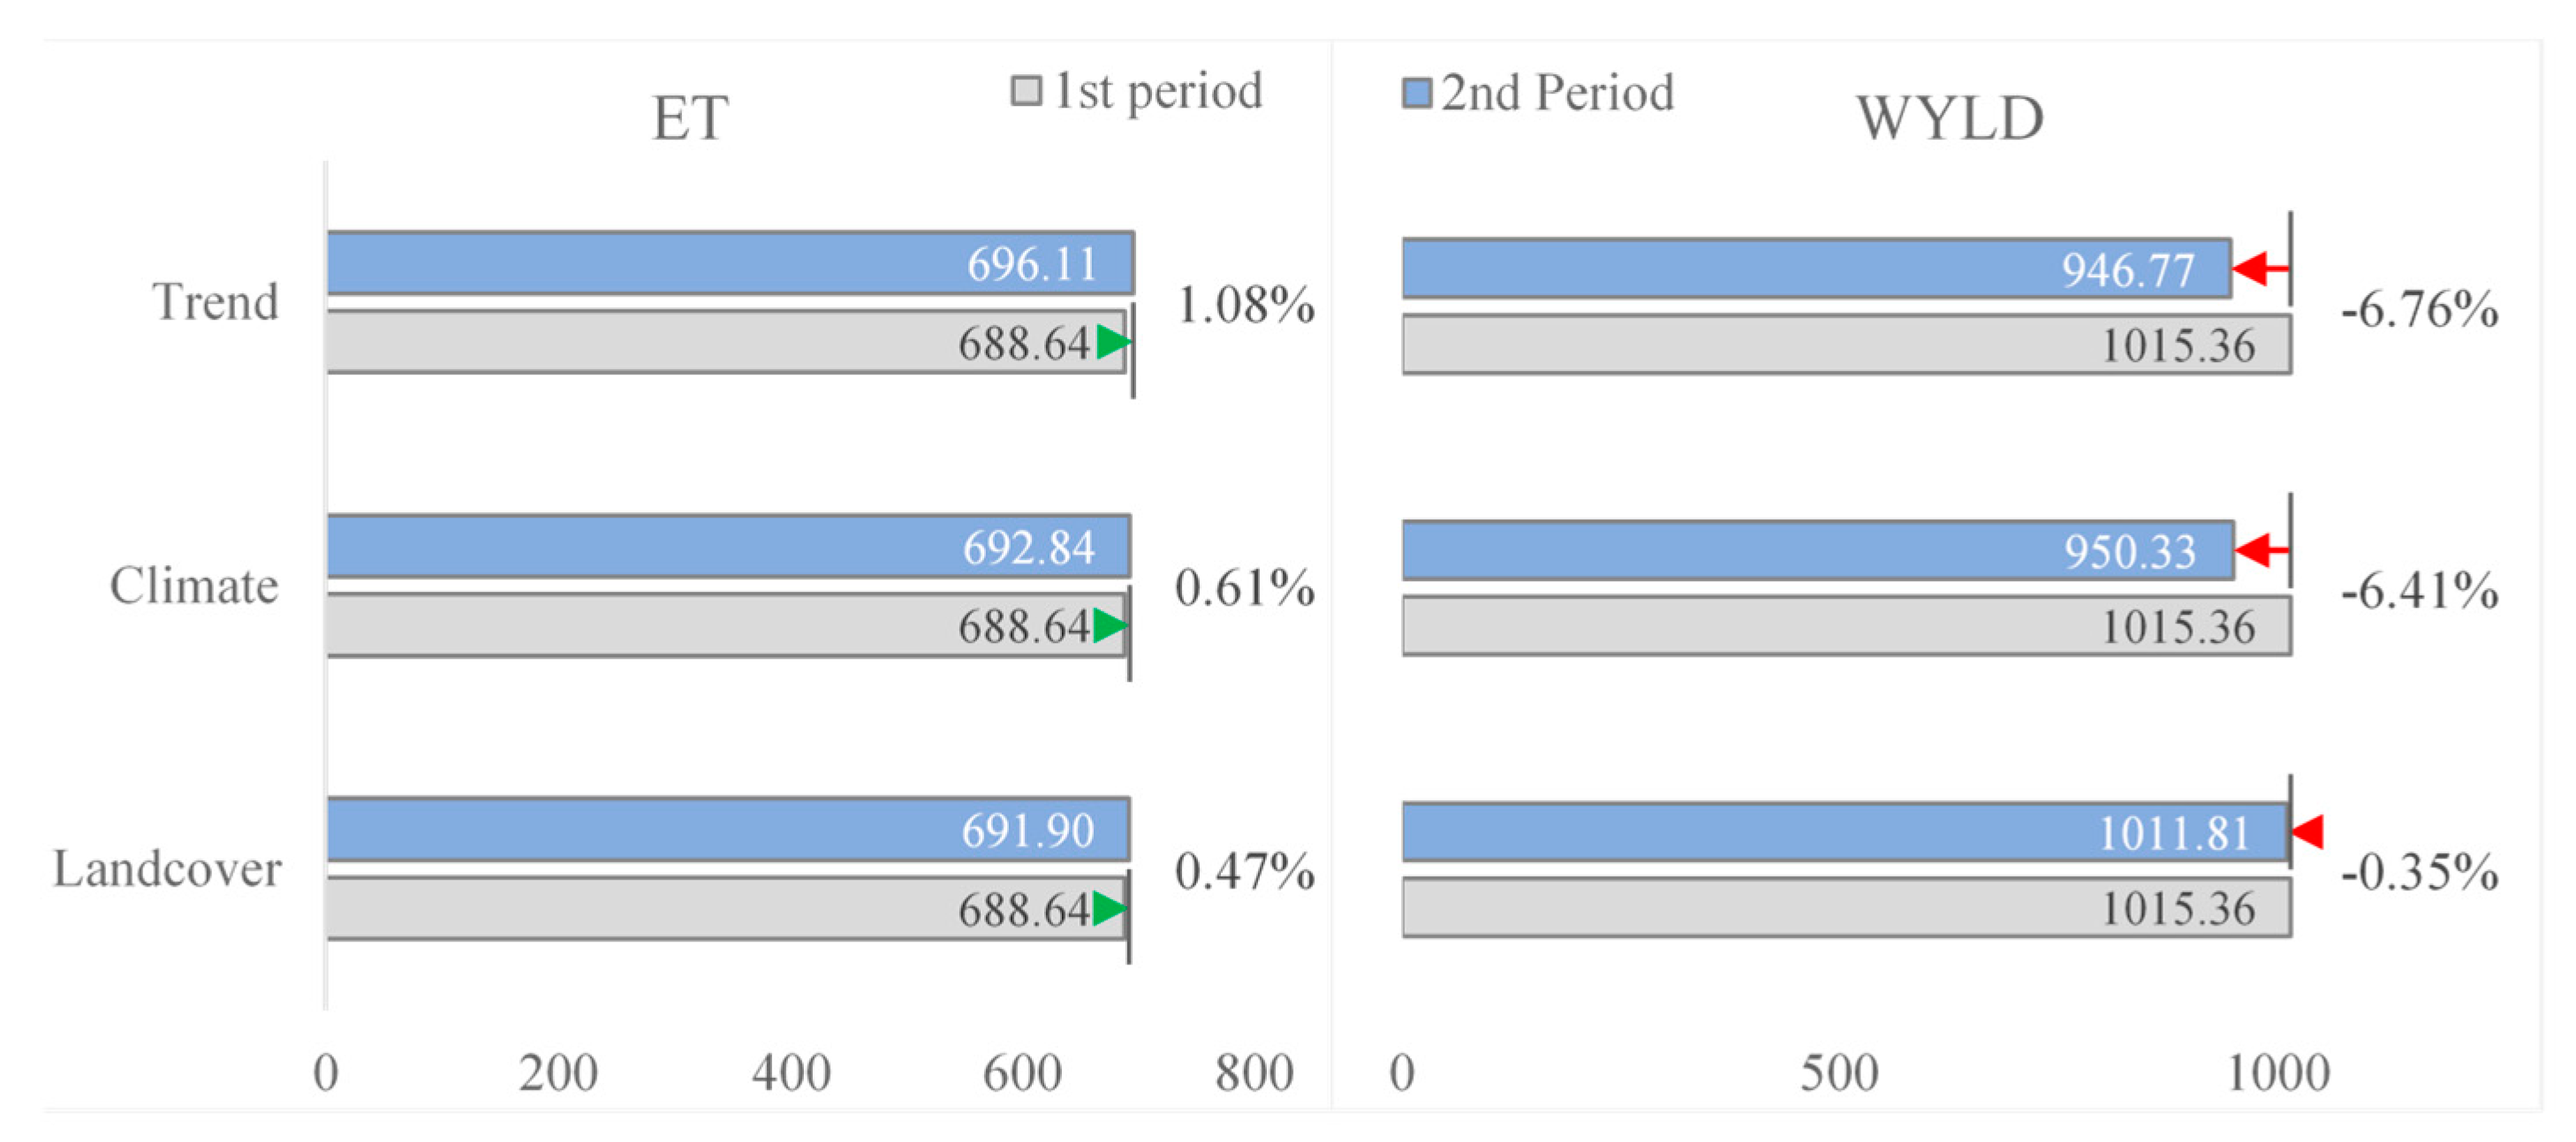
On average, the watershed receives about 1688 mm precipitation every year, and the water balance is mainly dominated by water yield (60%). Approximately 40% of the precipitation water is evaporated back into the atmosphere in the form of evapotranspiration (ET). Changes in the climate and landcover (during 1989–2018) caused an increase in ET and a decrease in water yield. The watershed experienced a 1.08% increase in ET, of which 0.61% and 0.47% was due to changes in climate and landcover, respectively. Water yield decreased by −6.76%, of which −6.41% was due to climate change and −0.35% was due to landcover change. The influence of landcover changes on ET and water yield was smaller than that of climate change in the watershed (Figure 4).
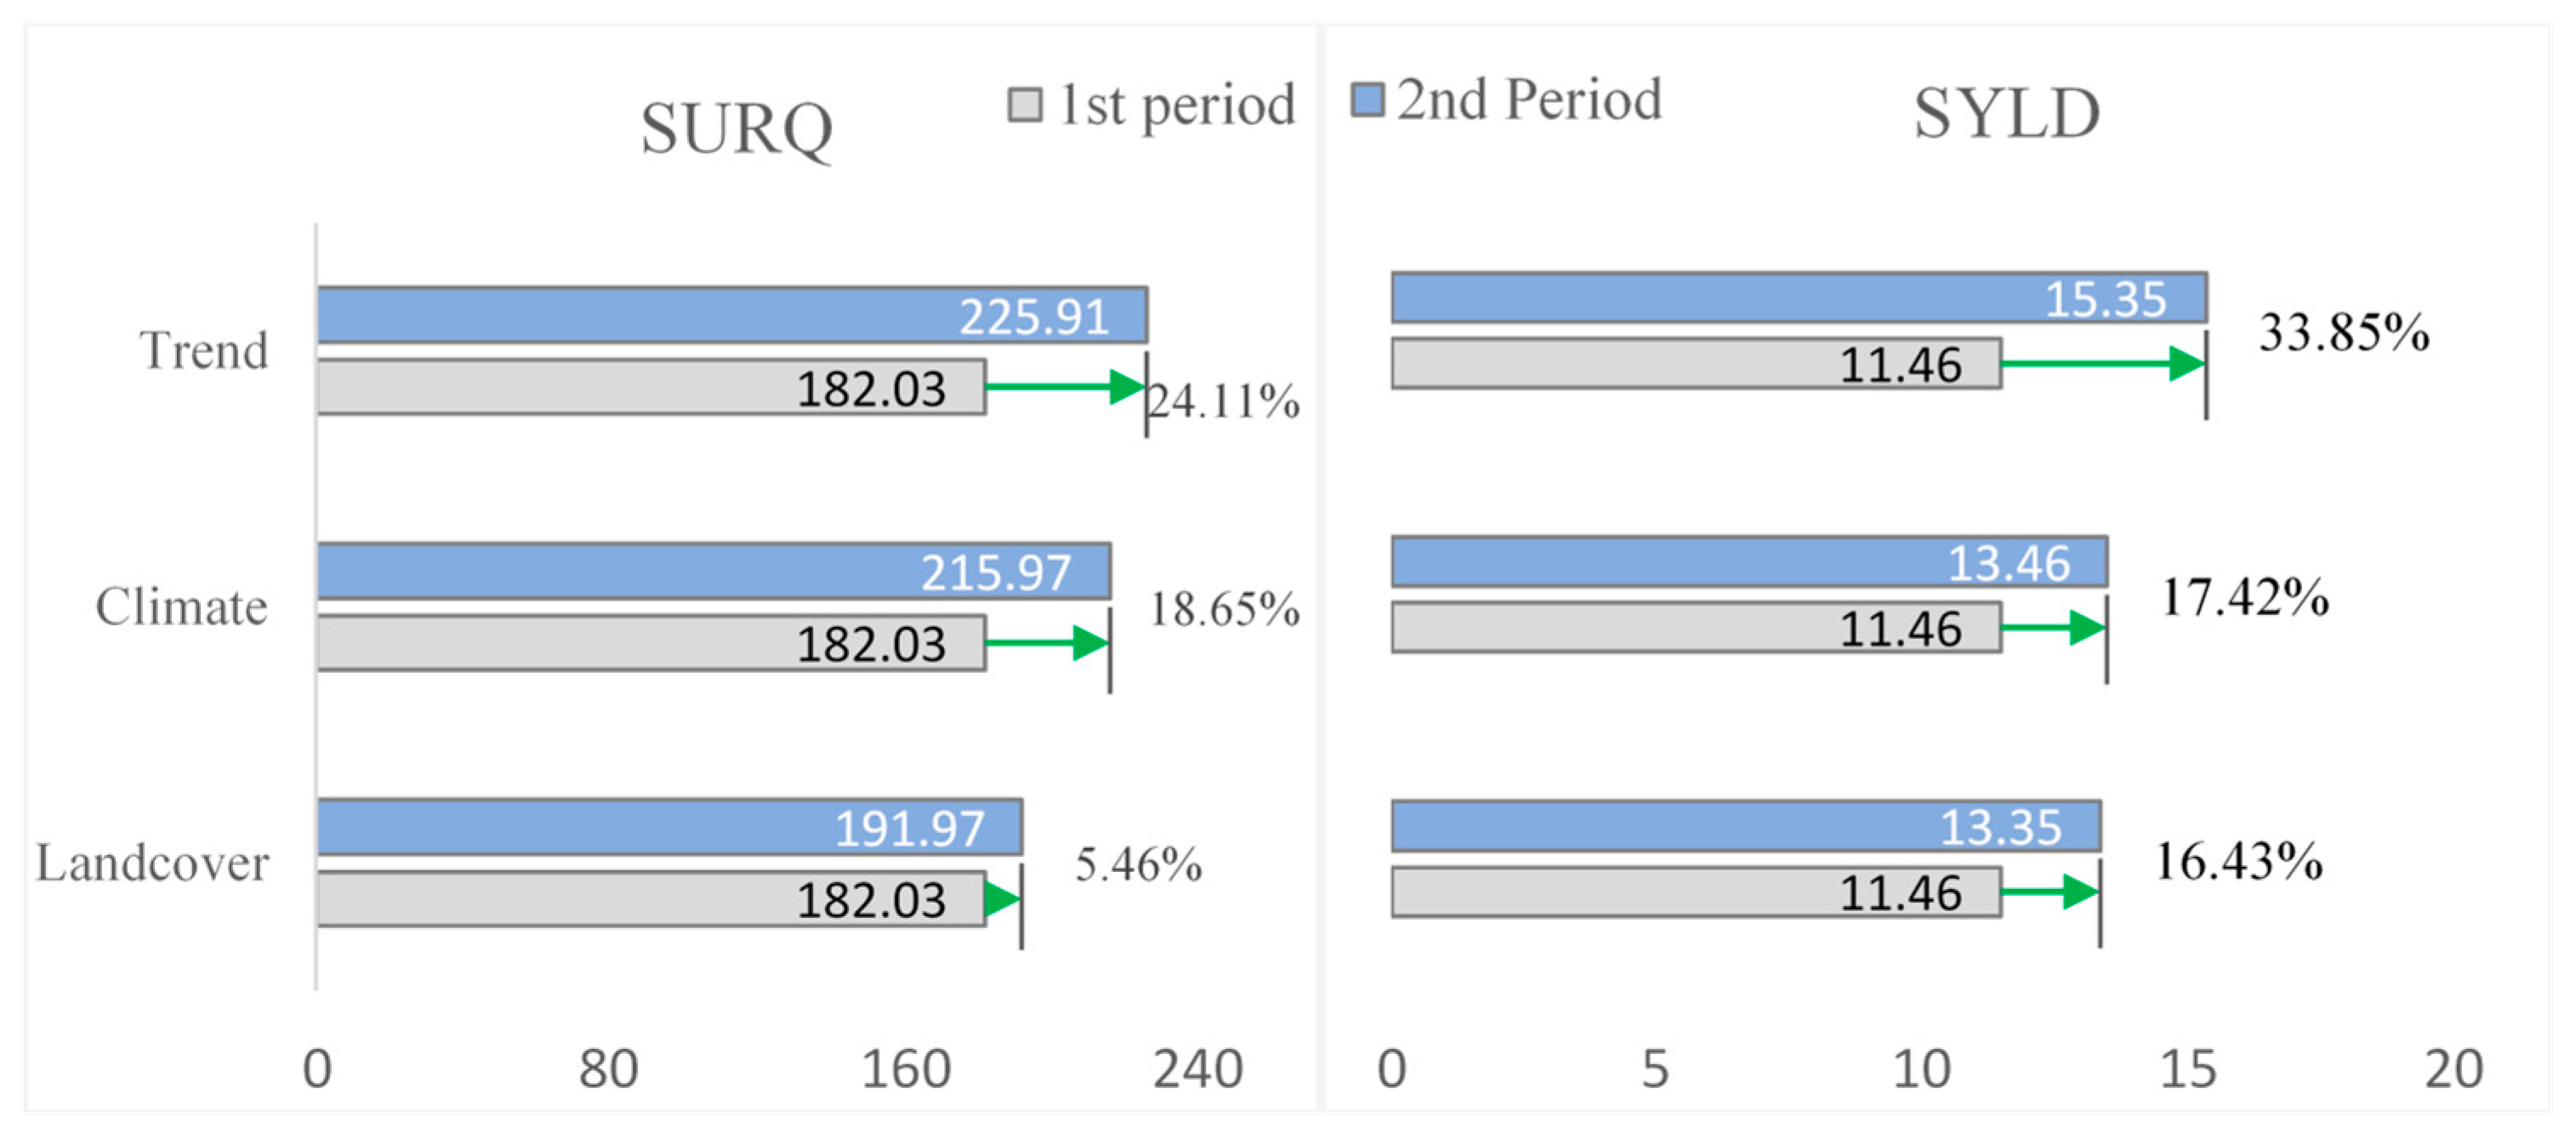
Surface runoff or overland flow refers to the water flowing over soil, vegetation or other ground cover instead of infiltrating the ground. The Minjiang river watershed is highly forested, and thus has a high infiltration rate. On average, about 200 mm (20%) of the total water yield (1000 mm) flows into the river channels in the form of surface runoff, while the remaining 80% of the water yield is in the form of lateral and groundwater flow through infiltration. The watershed yields about 12.5 t/ha of sediments per year. Surface runoff and sediment yield increased during the study period. Surface runoff increased by 24.11%, of which 18.65% was due to changes in the climate, while 5.46% was due to landcover change. Sediment yield increased by 33.85%, of which 17.42% was due to climate change and 16.43% was due to landcover change (Figure 5).
3.2.1. Contribution of Different Climate Parameters
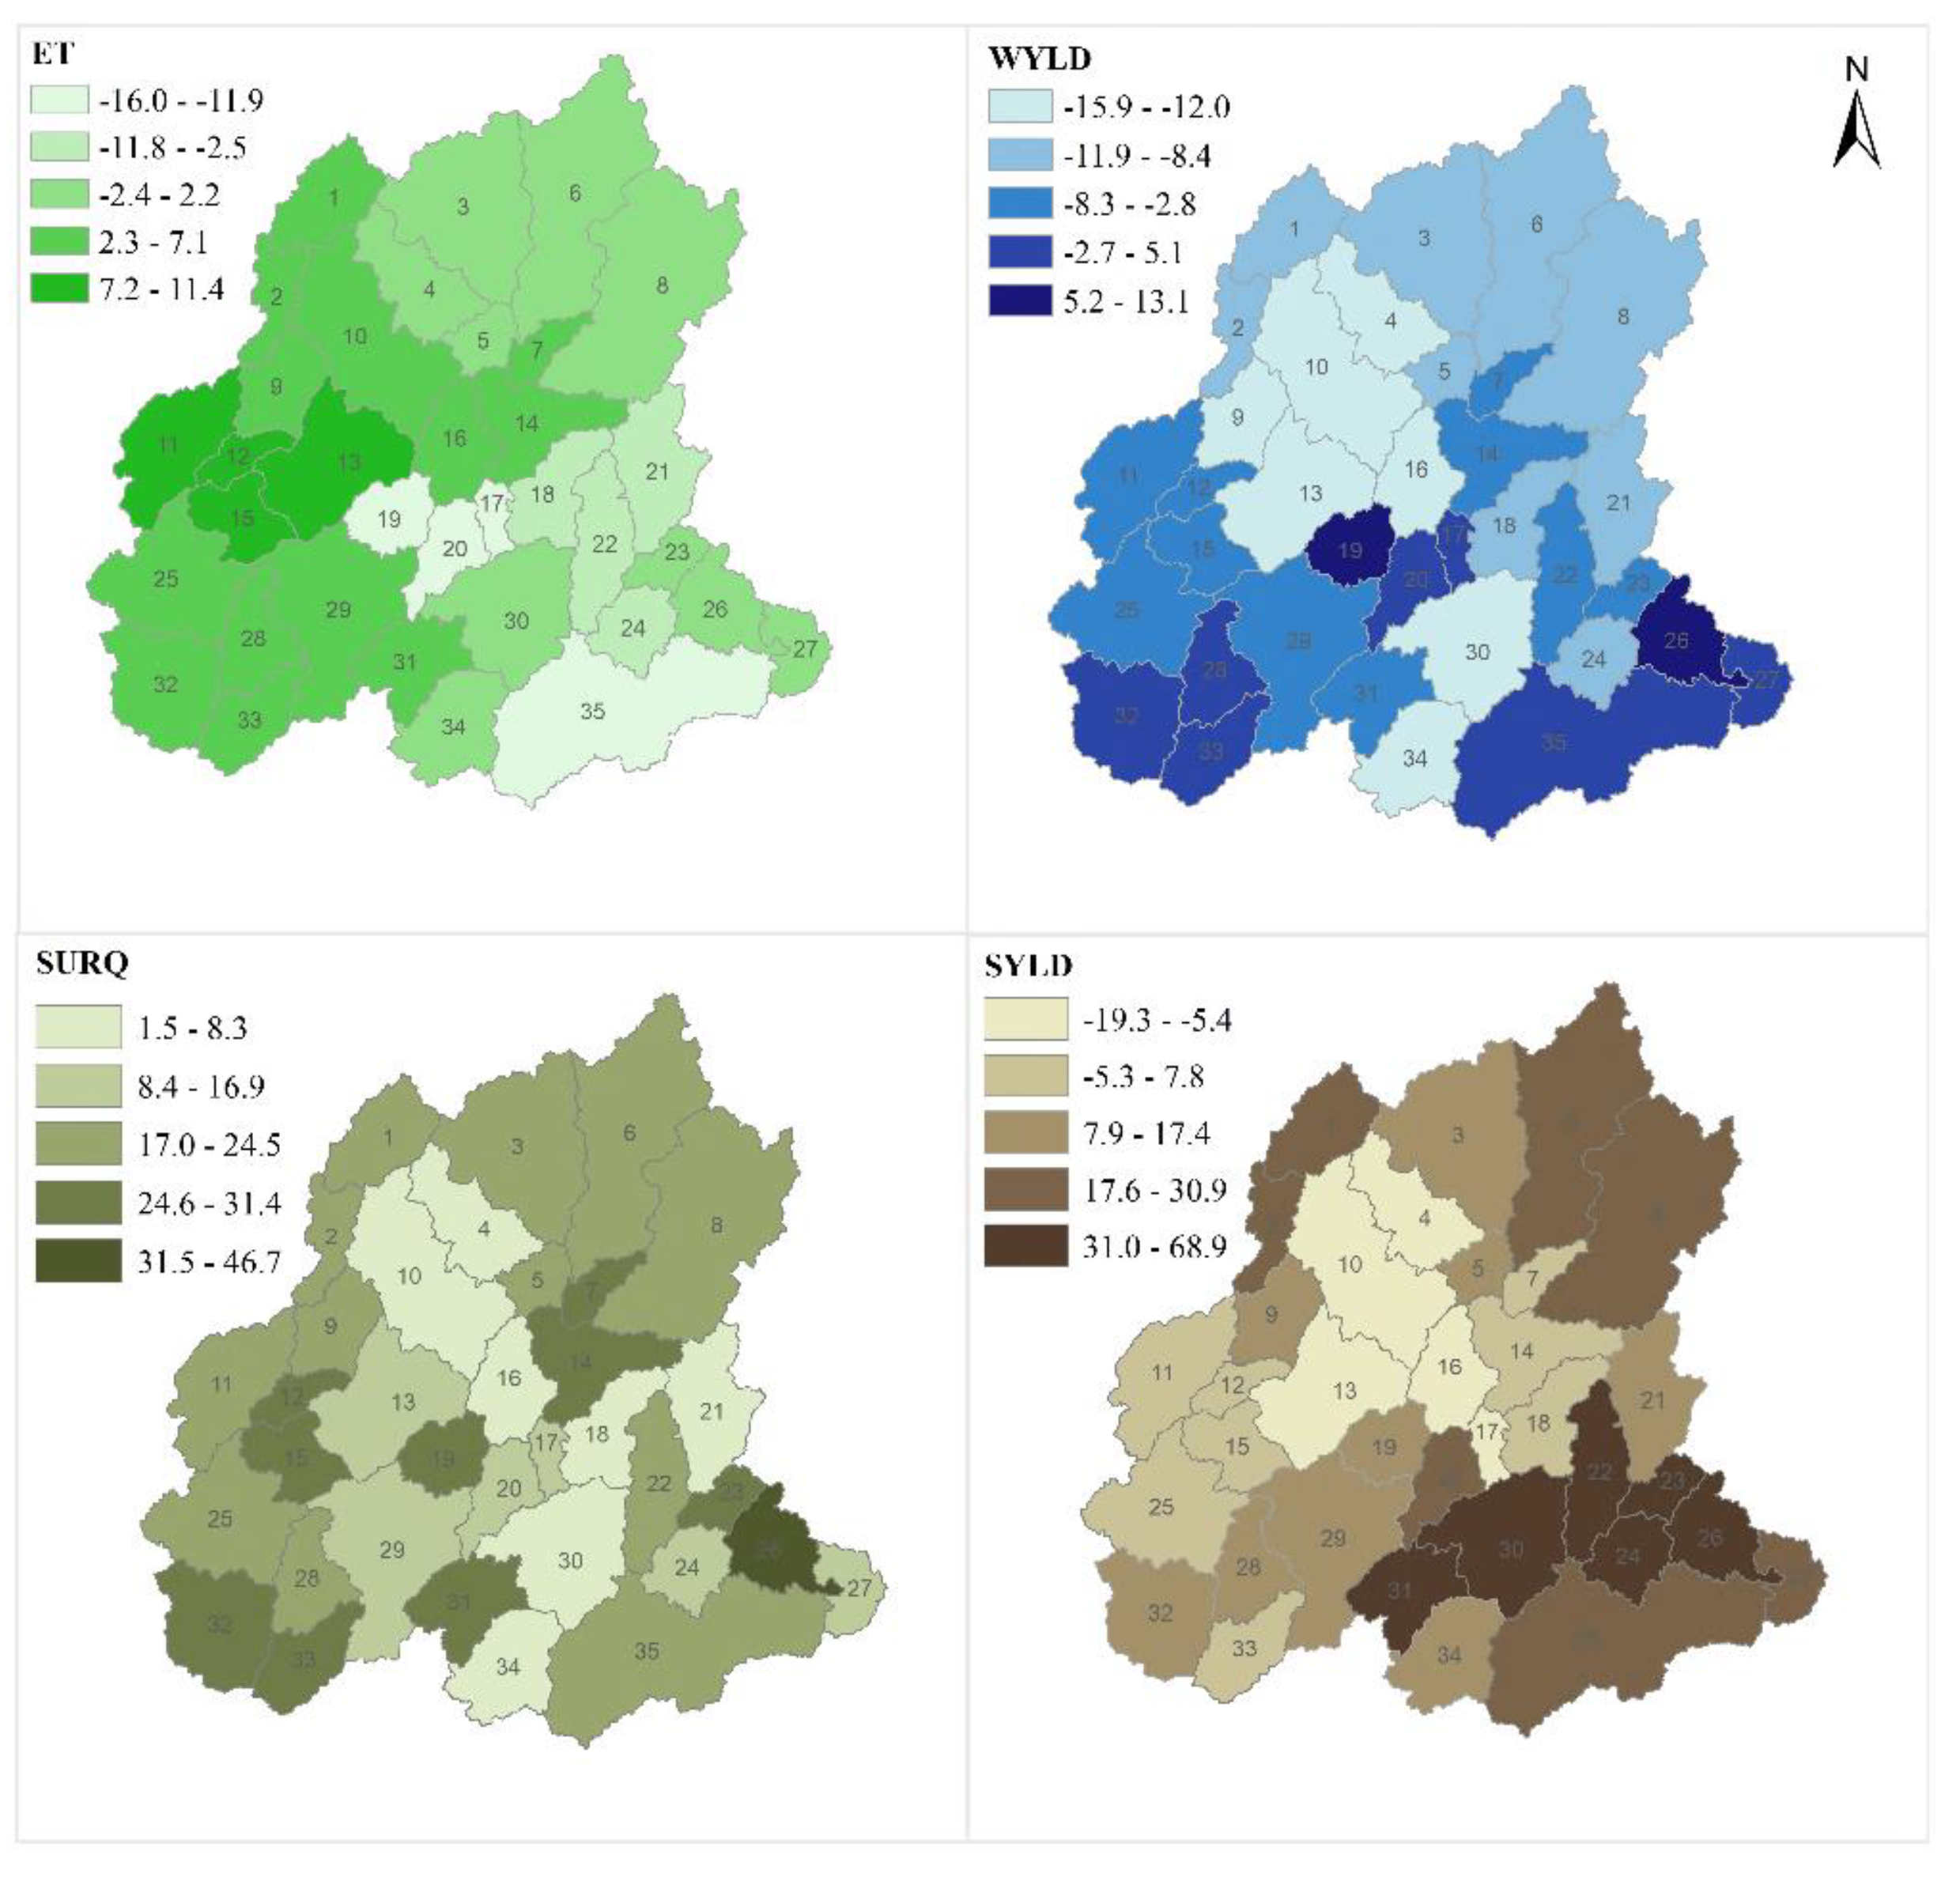
Figure 6 reveals the spatial variation in the influence of climate change on the hydrological parameters. Generally, the southern side of the watershed experienced greater impact than the northern side. ET and water yield showed opposite trends to each other, i.e., water yield largely increased in those subbasins where ET decreased. Similarly, surface runoff largely increased in those subbasins where water yield increased, however surface runoff increased in all of the subbasins, unlike water yield. Sediment yield showed a different pattern to the other hydrological parameters (Figure 6). The variation in the spatial patterns of different hydrological parameters indicates that they were influenced differently by changes in the climate parameters, or that the influencing climate parameters for different hydrological parameters were different.
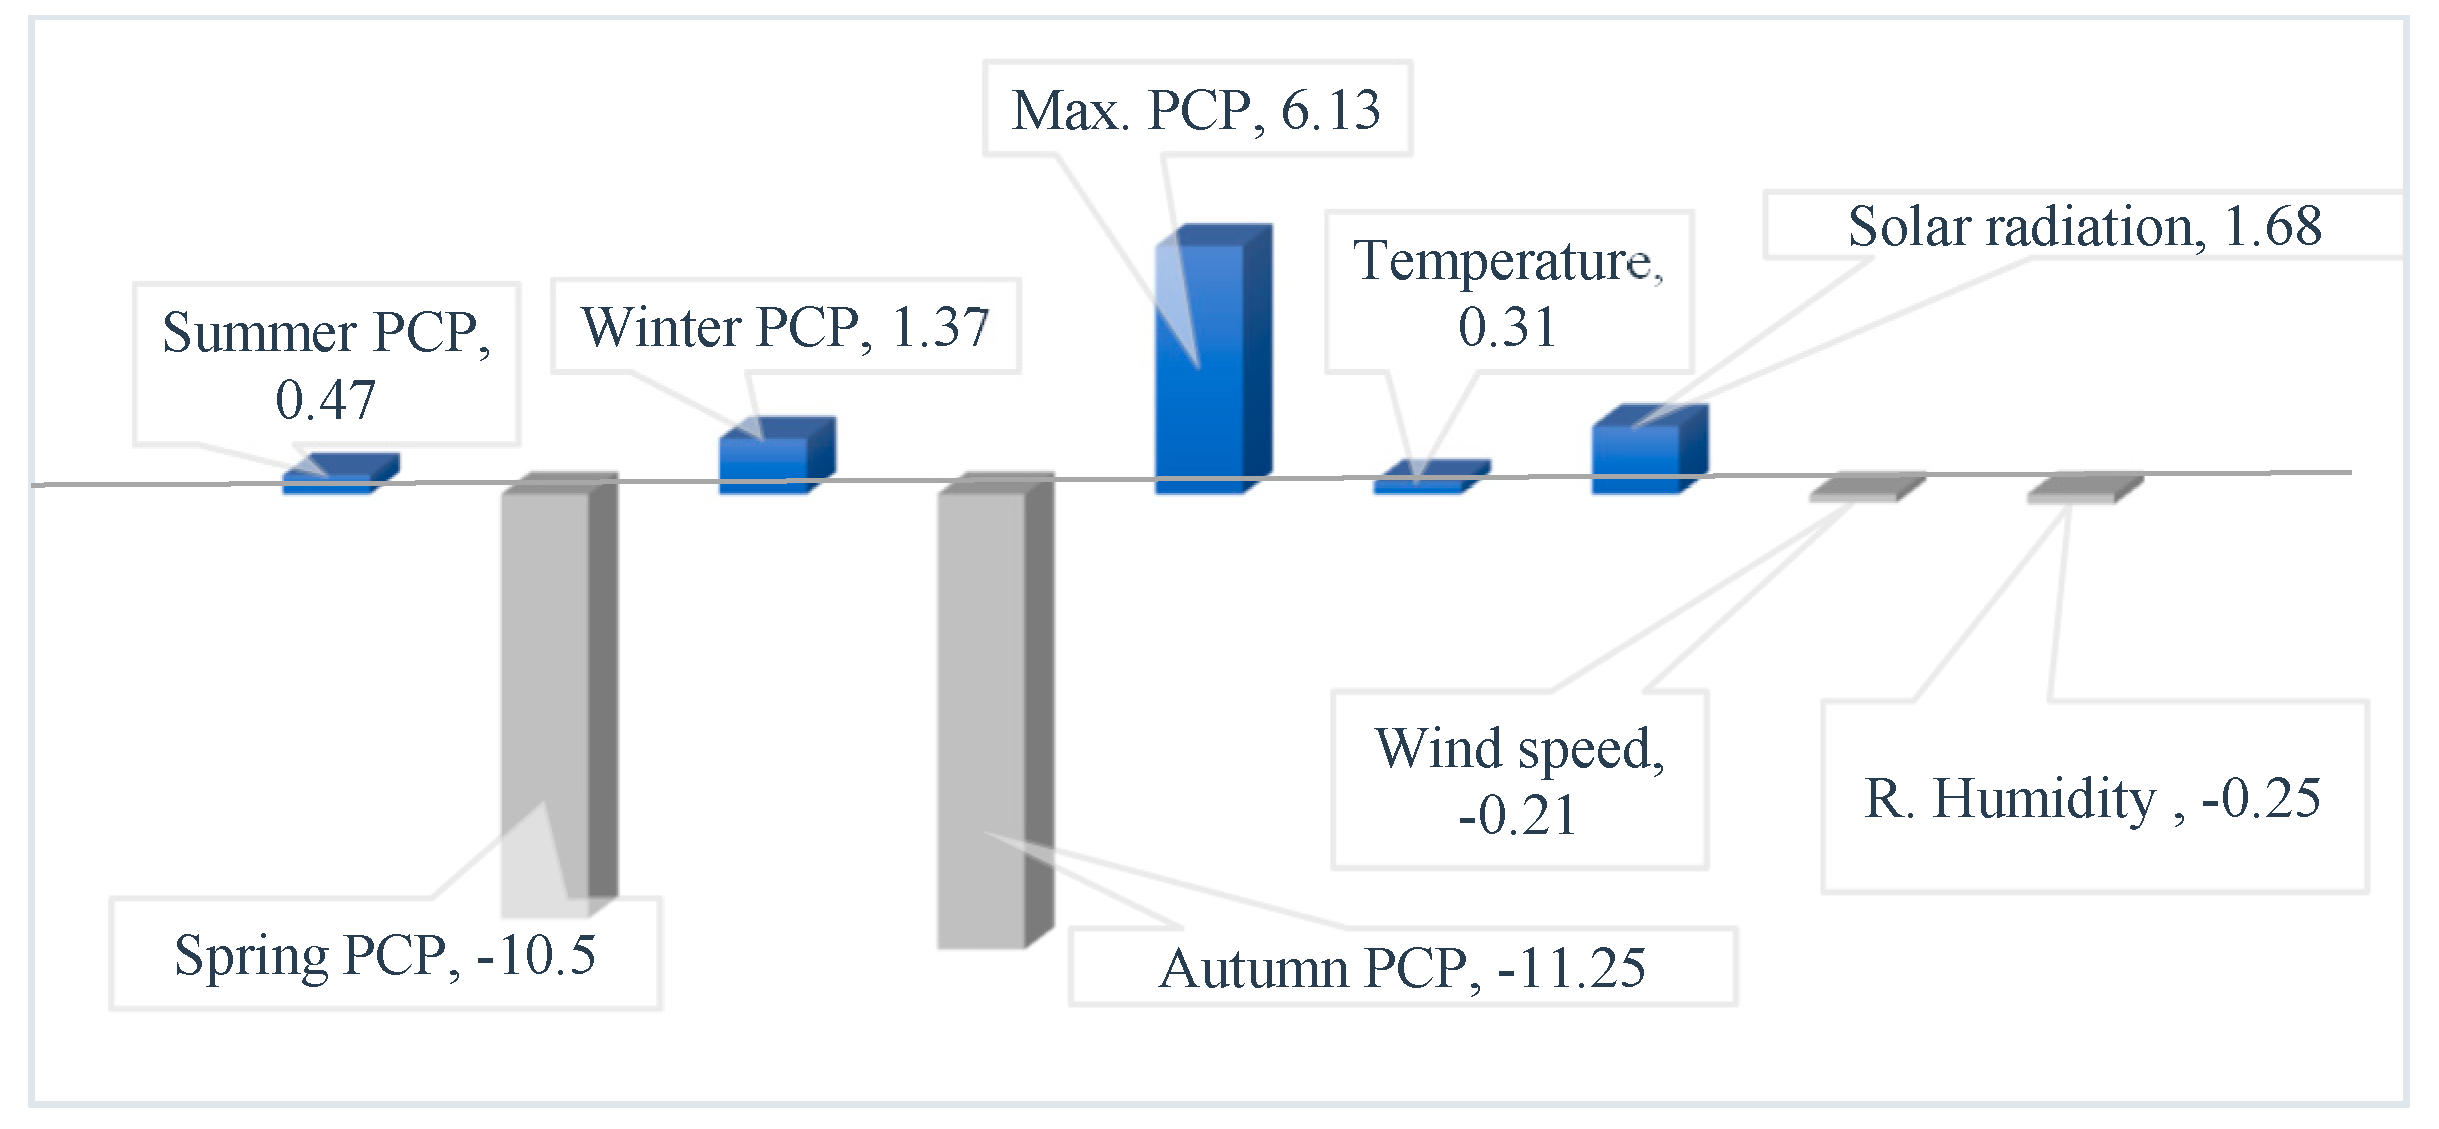
Average precipitation in summer and winter increased by 0.47% and 137%, while in spring and autumn it decreased by 10.5% and 11.25% respectively. One-day maximum precipitation increased by 6.31%. Temperature and solar radiation increased by 0.31°C and 1.68 MJ/m2, respectively. Wind speed and relative humidity decreased by 0.21 m/s and 0.25 fr, respectively (Figure 7).
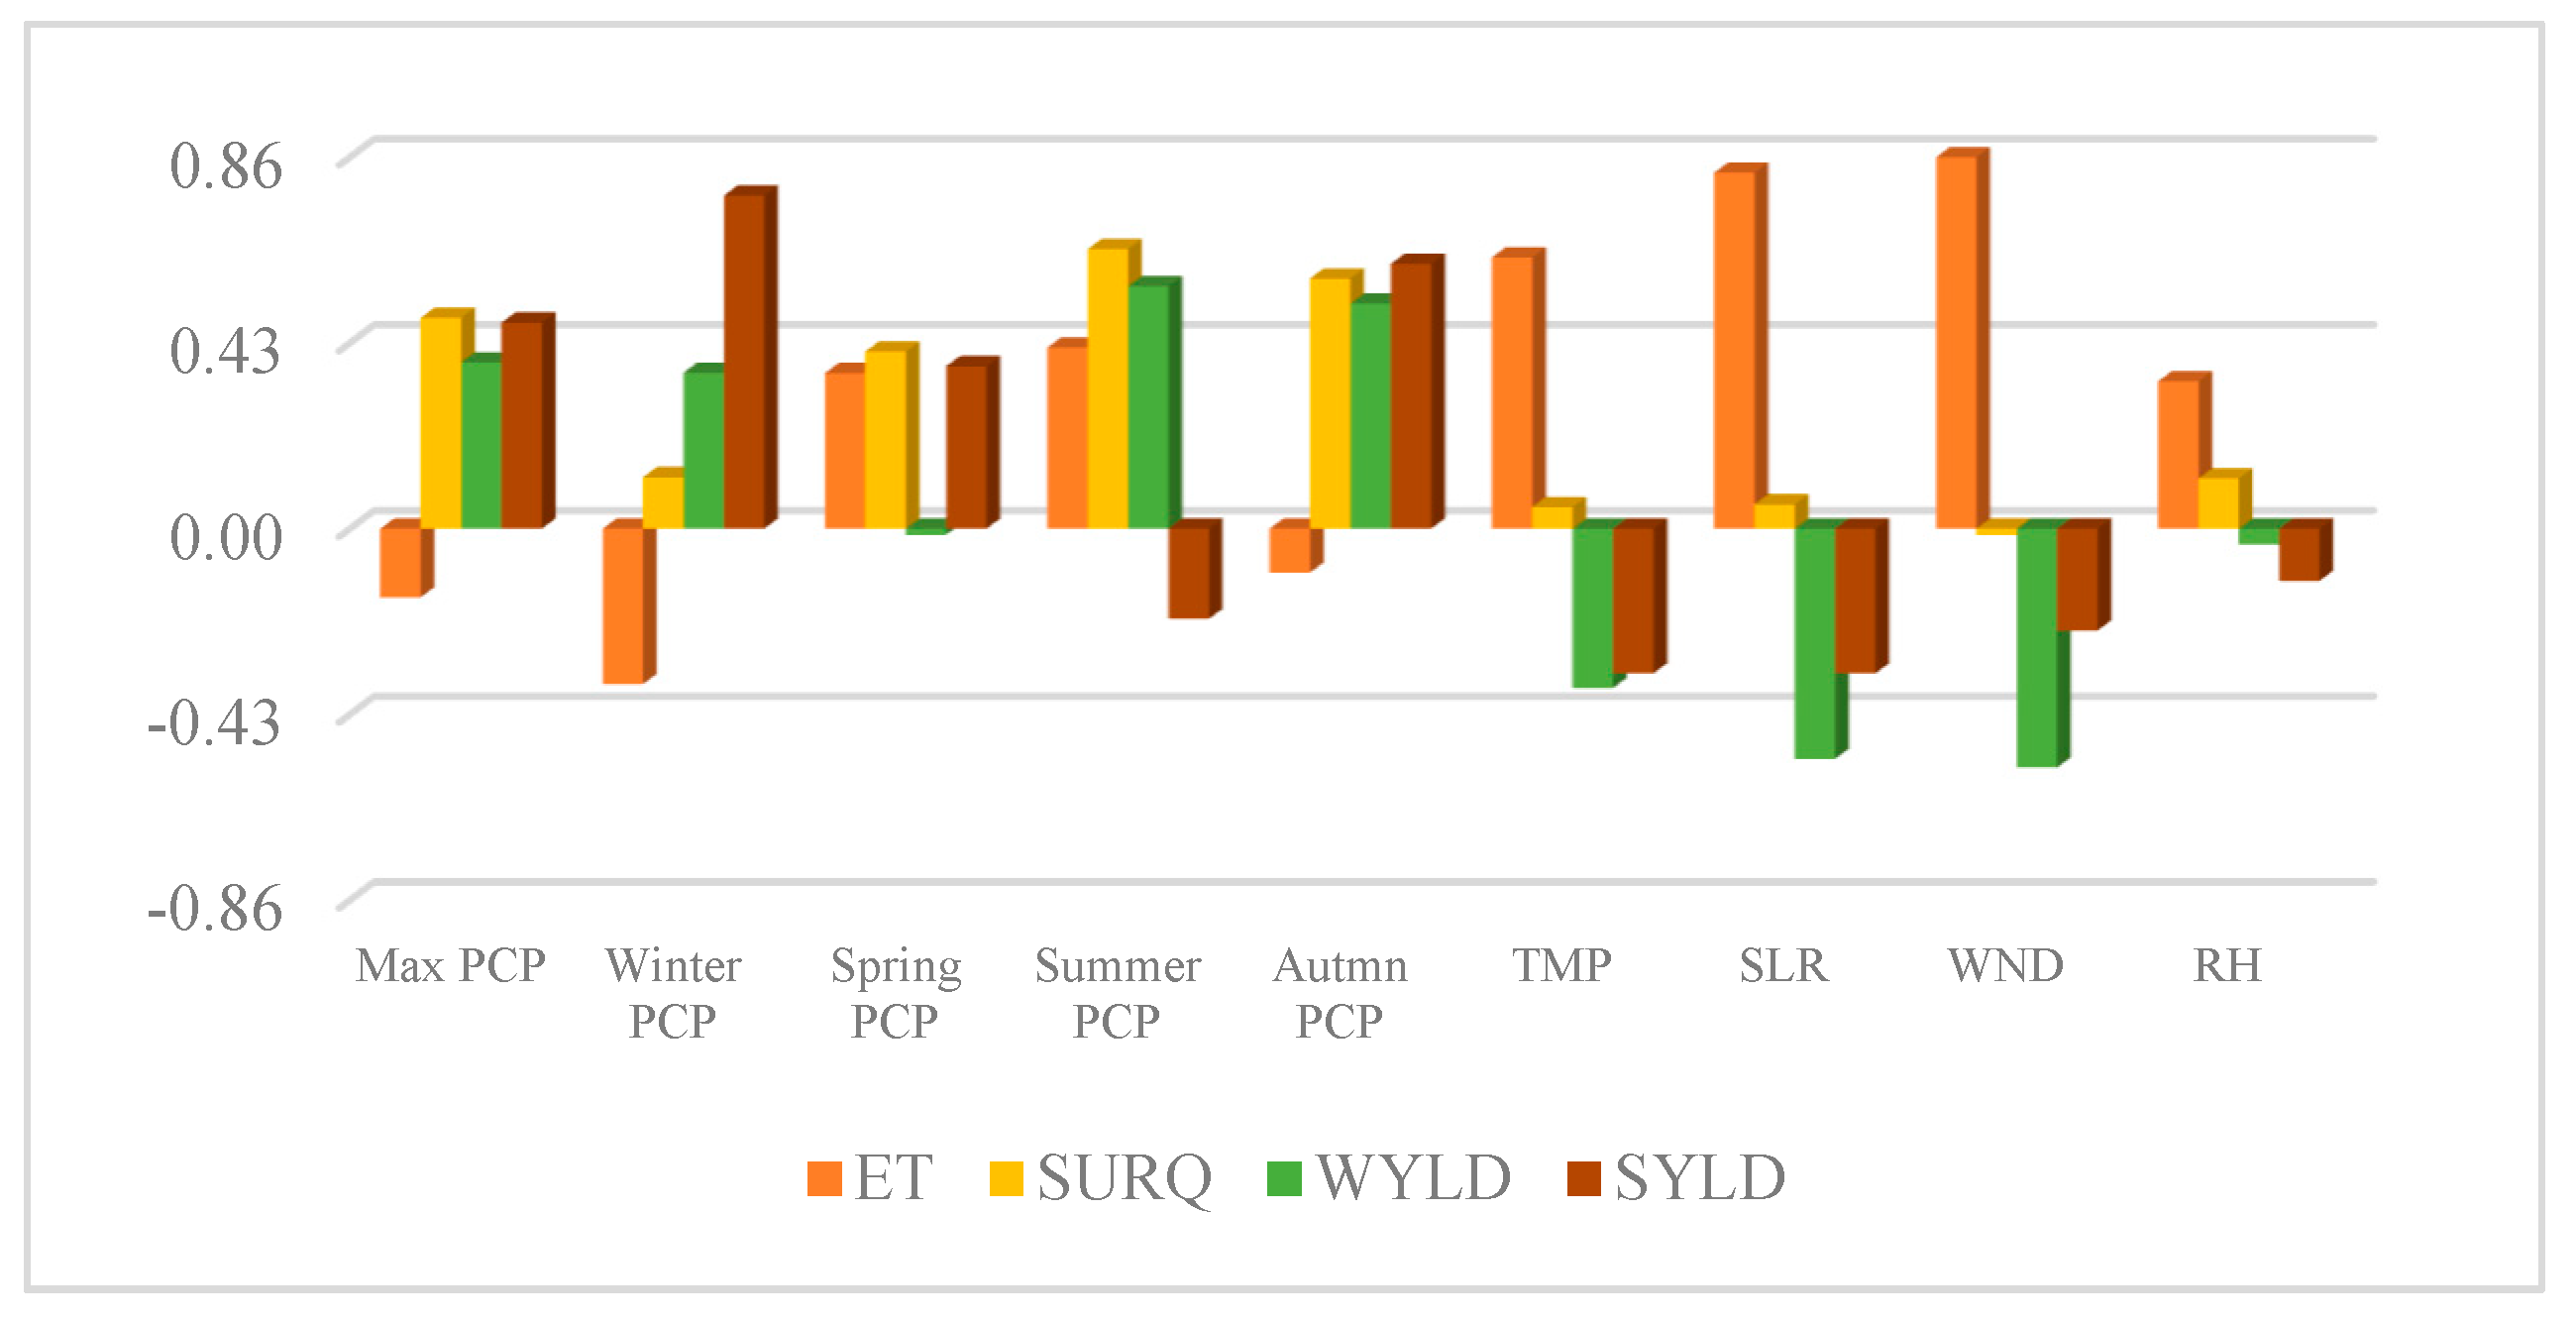
A correlation analysis of the climate and hydrological parameters revealed that ET was positively correlated to all of the climate parameters, with the highest correlation to wind speed, solar radiation and temperature (Figure 8). It reveals that solar radiation and temperature were the climate parameters that were most likely responsible for increasing ET in the watershed because wind speed decreased during the study period and the literature report that wind increases ET because it enhances the vapor pressure deficit by removing the humid air that accumulates around leaves through ventilation and bending [42,43]. Similarly, with an increase in solar radiation and temperature, the rate of transpiration increases, because vegetation reduces the amount of accepted radiation through emission, heat convection and transpiration [44]. This indicates that increases in solar radiation and temperature increased ET in those areas of the watershed where wind speed decreased comparatively less or increased, and thus wind speed acted as a reducing factor for ET, while temperature and solar radiation acted as enhancing factors in the watershed. On the other hand, a decrease in water yield was positively correlated to summer and autumn precipitation and negatively correlated to wind speed and solar radiation, which indicates that water yield decreased due to a decrease in autumn precipitation and an increase in ET.
Similarly, variation in the influence of climate change on surface runoff was positively correlated to summer, autumn and maximum precipitation, while sediment yield was significantly correlated to winter, autumn and maximum precipitation (Figure 8). It indicates that surface runoff increased due to increases in summer precipitation because the watershed receives more precipitation in summer than the other seasons, while sediment yield increased due to the increase in winter precipitation because the temperature in winter is not suitable for plant growth and bare land is prone to soil erosion. The high correlation of autumn and maximum precipitation to both of the hydrological parameters indicates that they were also influenced by increase in the intensity of heavy precipitation, which mostly occurs in the watershed during the autumn season.
3.2.2. Contribution of Different Landcover Classes
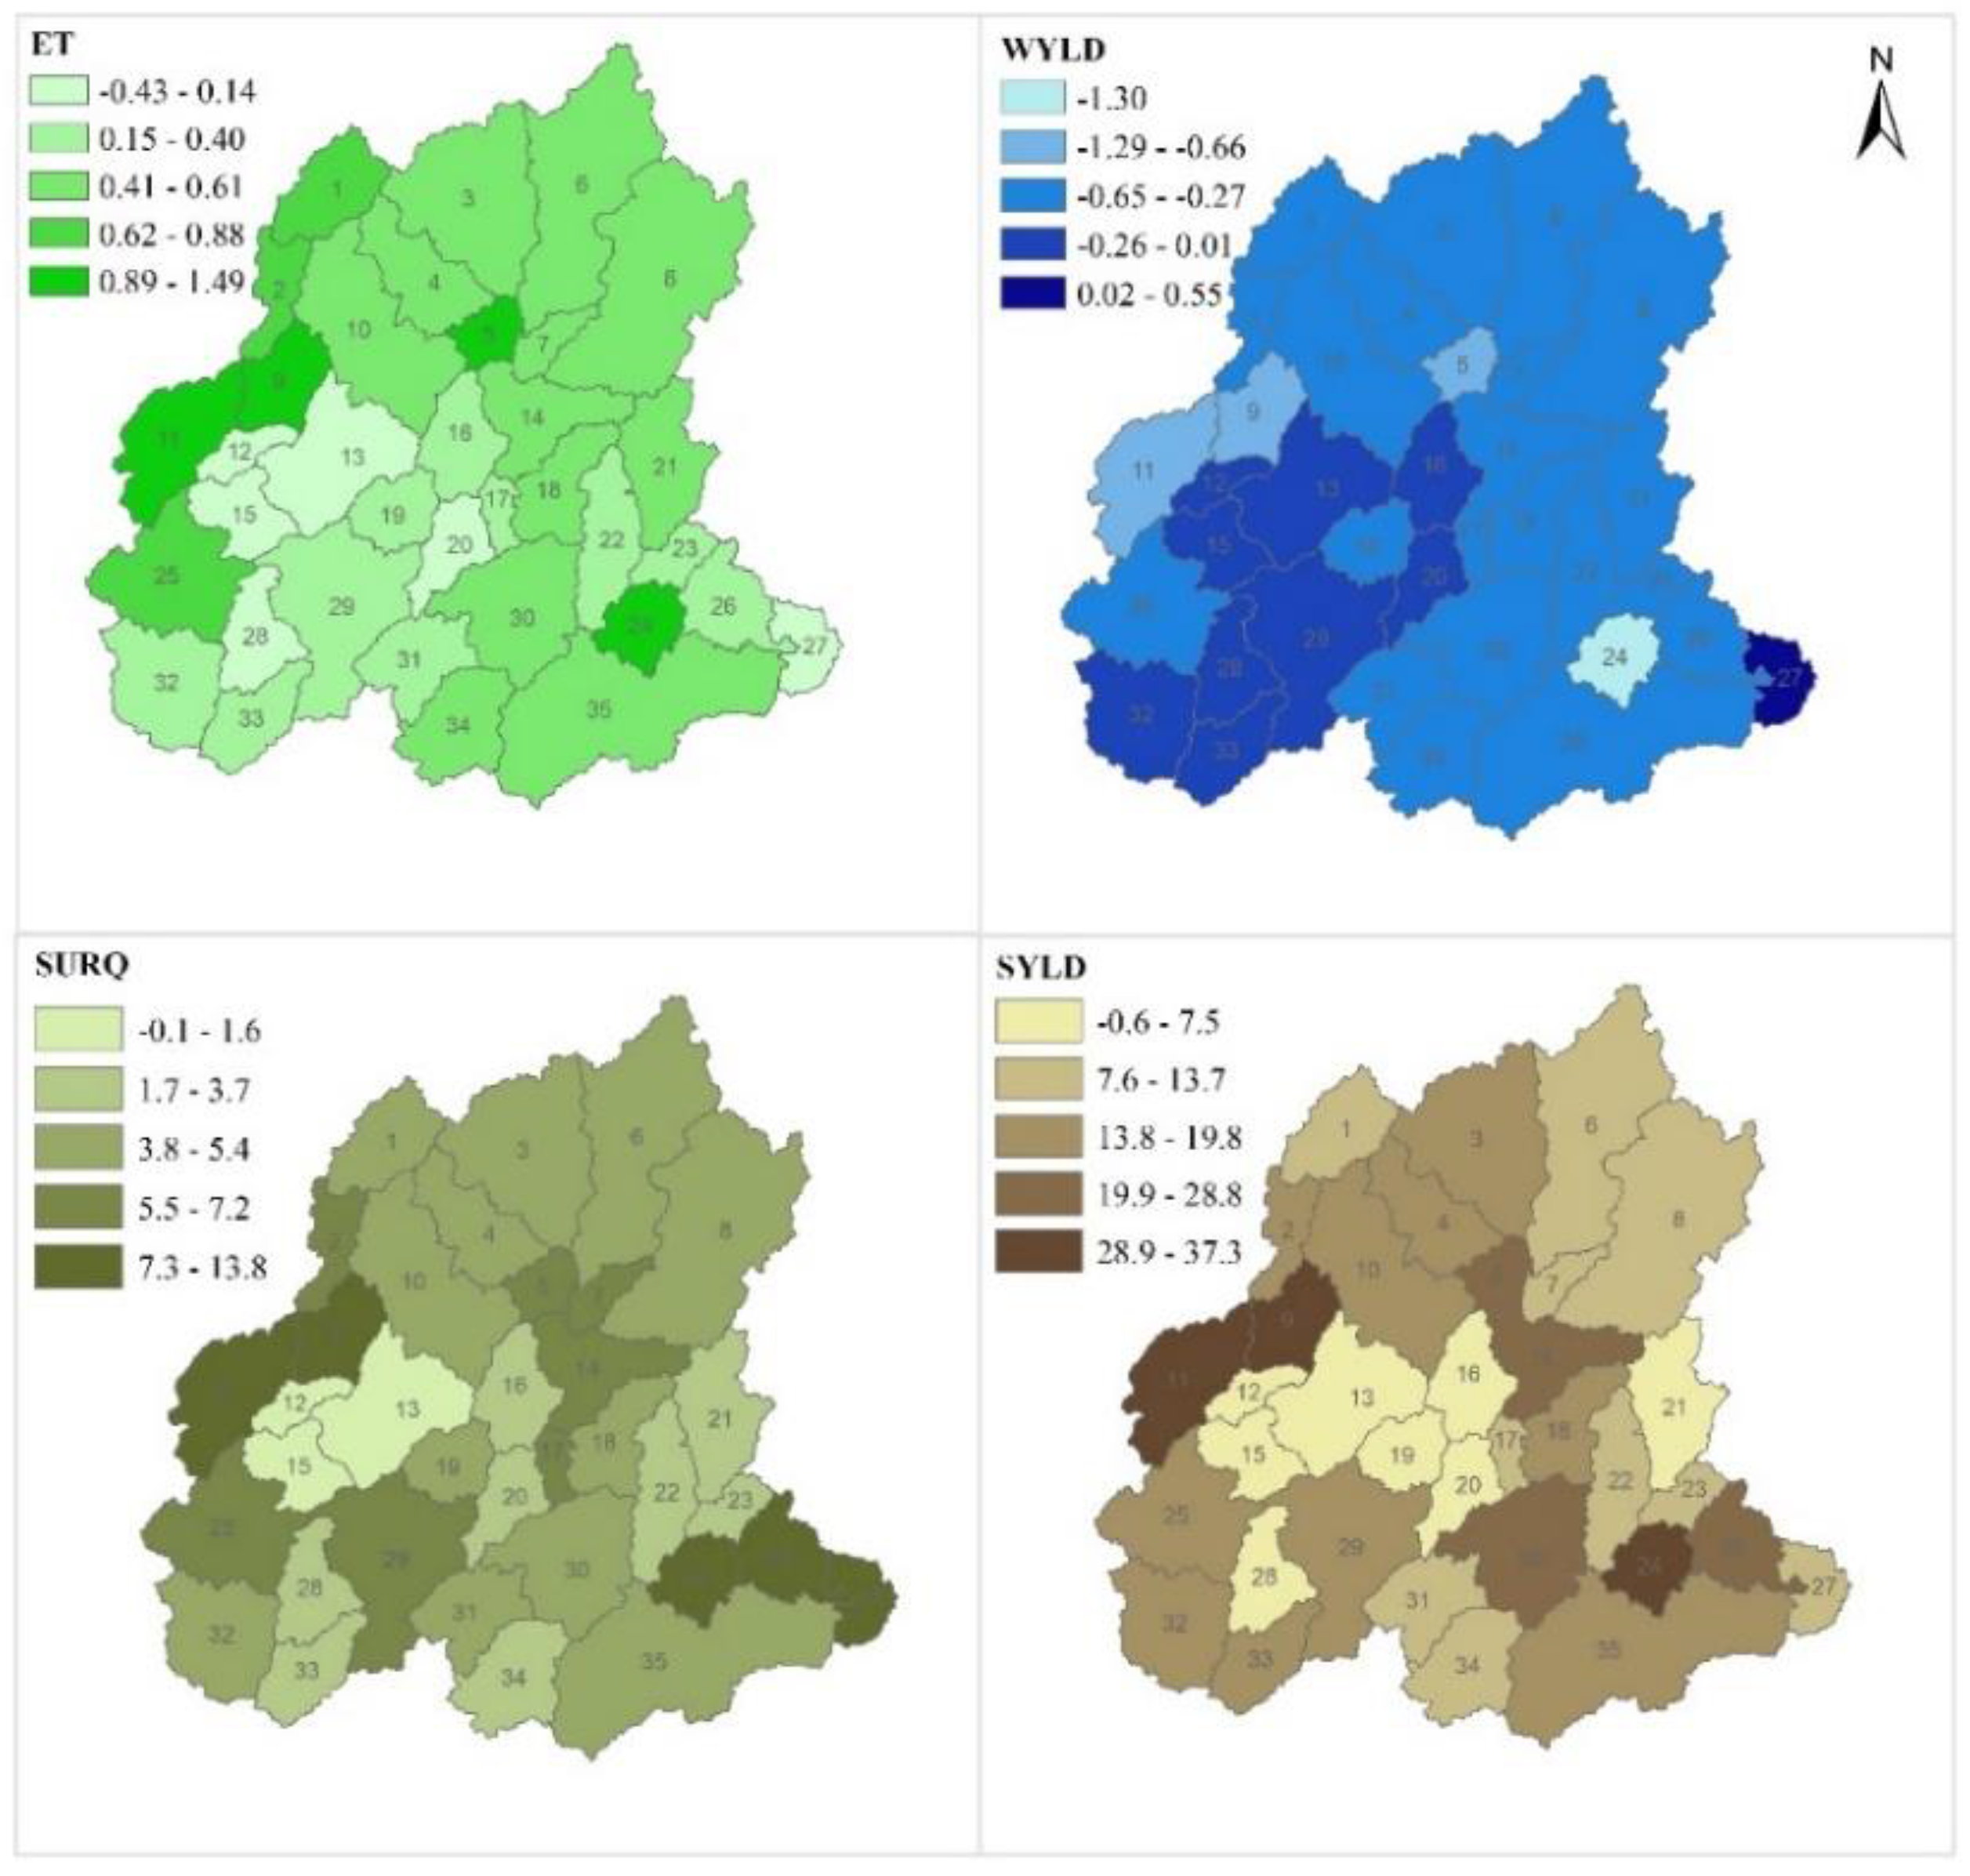
The influence of landcover changes on ET and water yield was very small in all of the subbasins and the patterns of both were the opposite of each other, i.e., water yield decreased in subbasins where ET increased. There was a clear difference in the patterns of changes for surface runoff and sediment yield, and both were different from ET and water yield (Figure 9). This indicates that these hydrological parameters were influenced by different landcover changes.
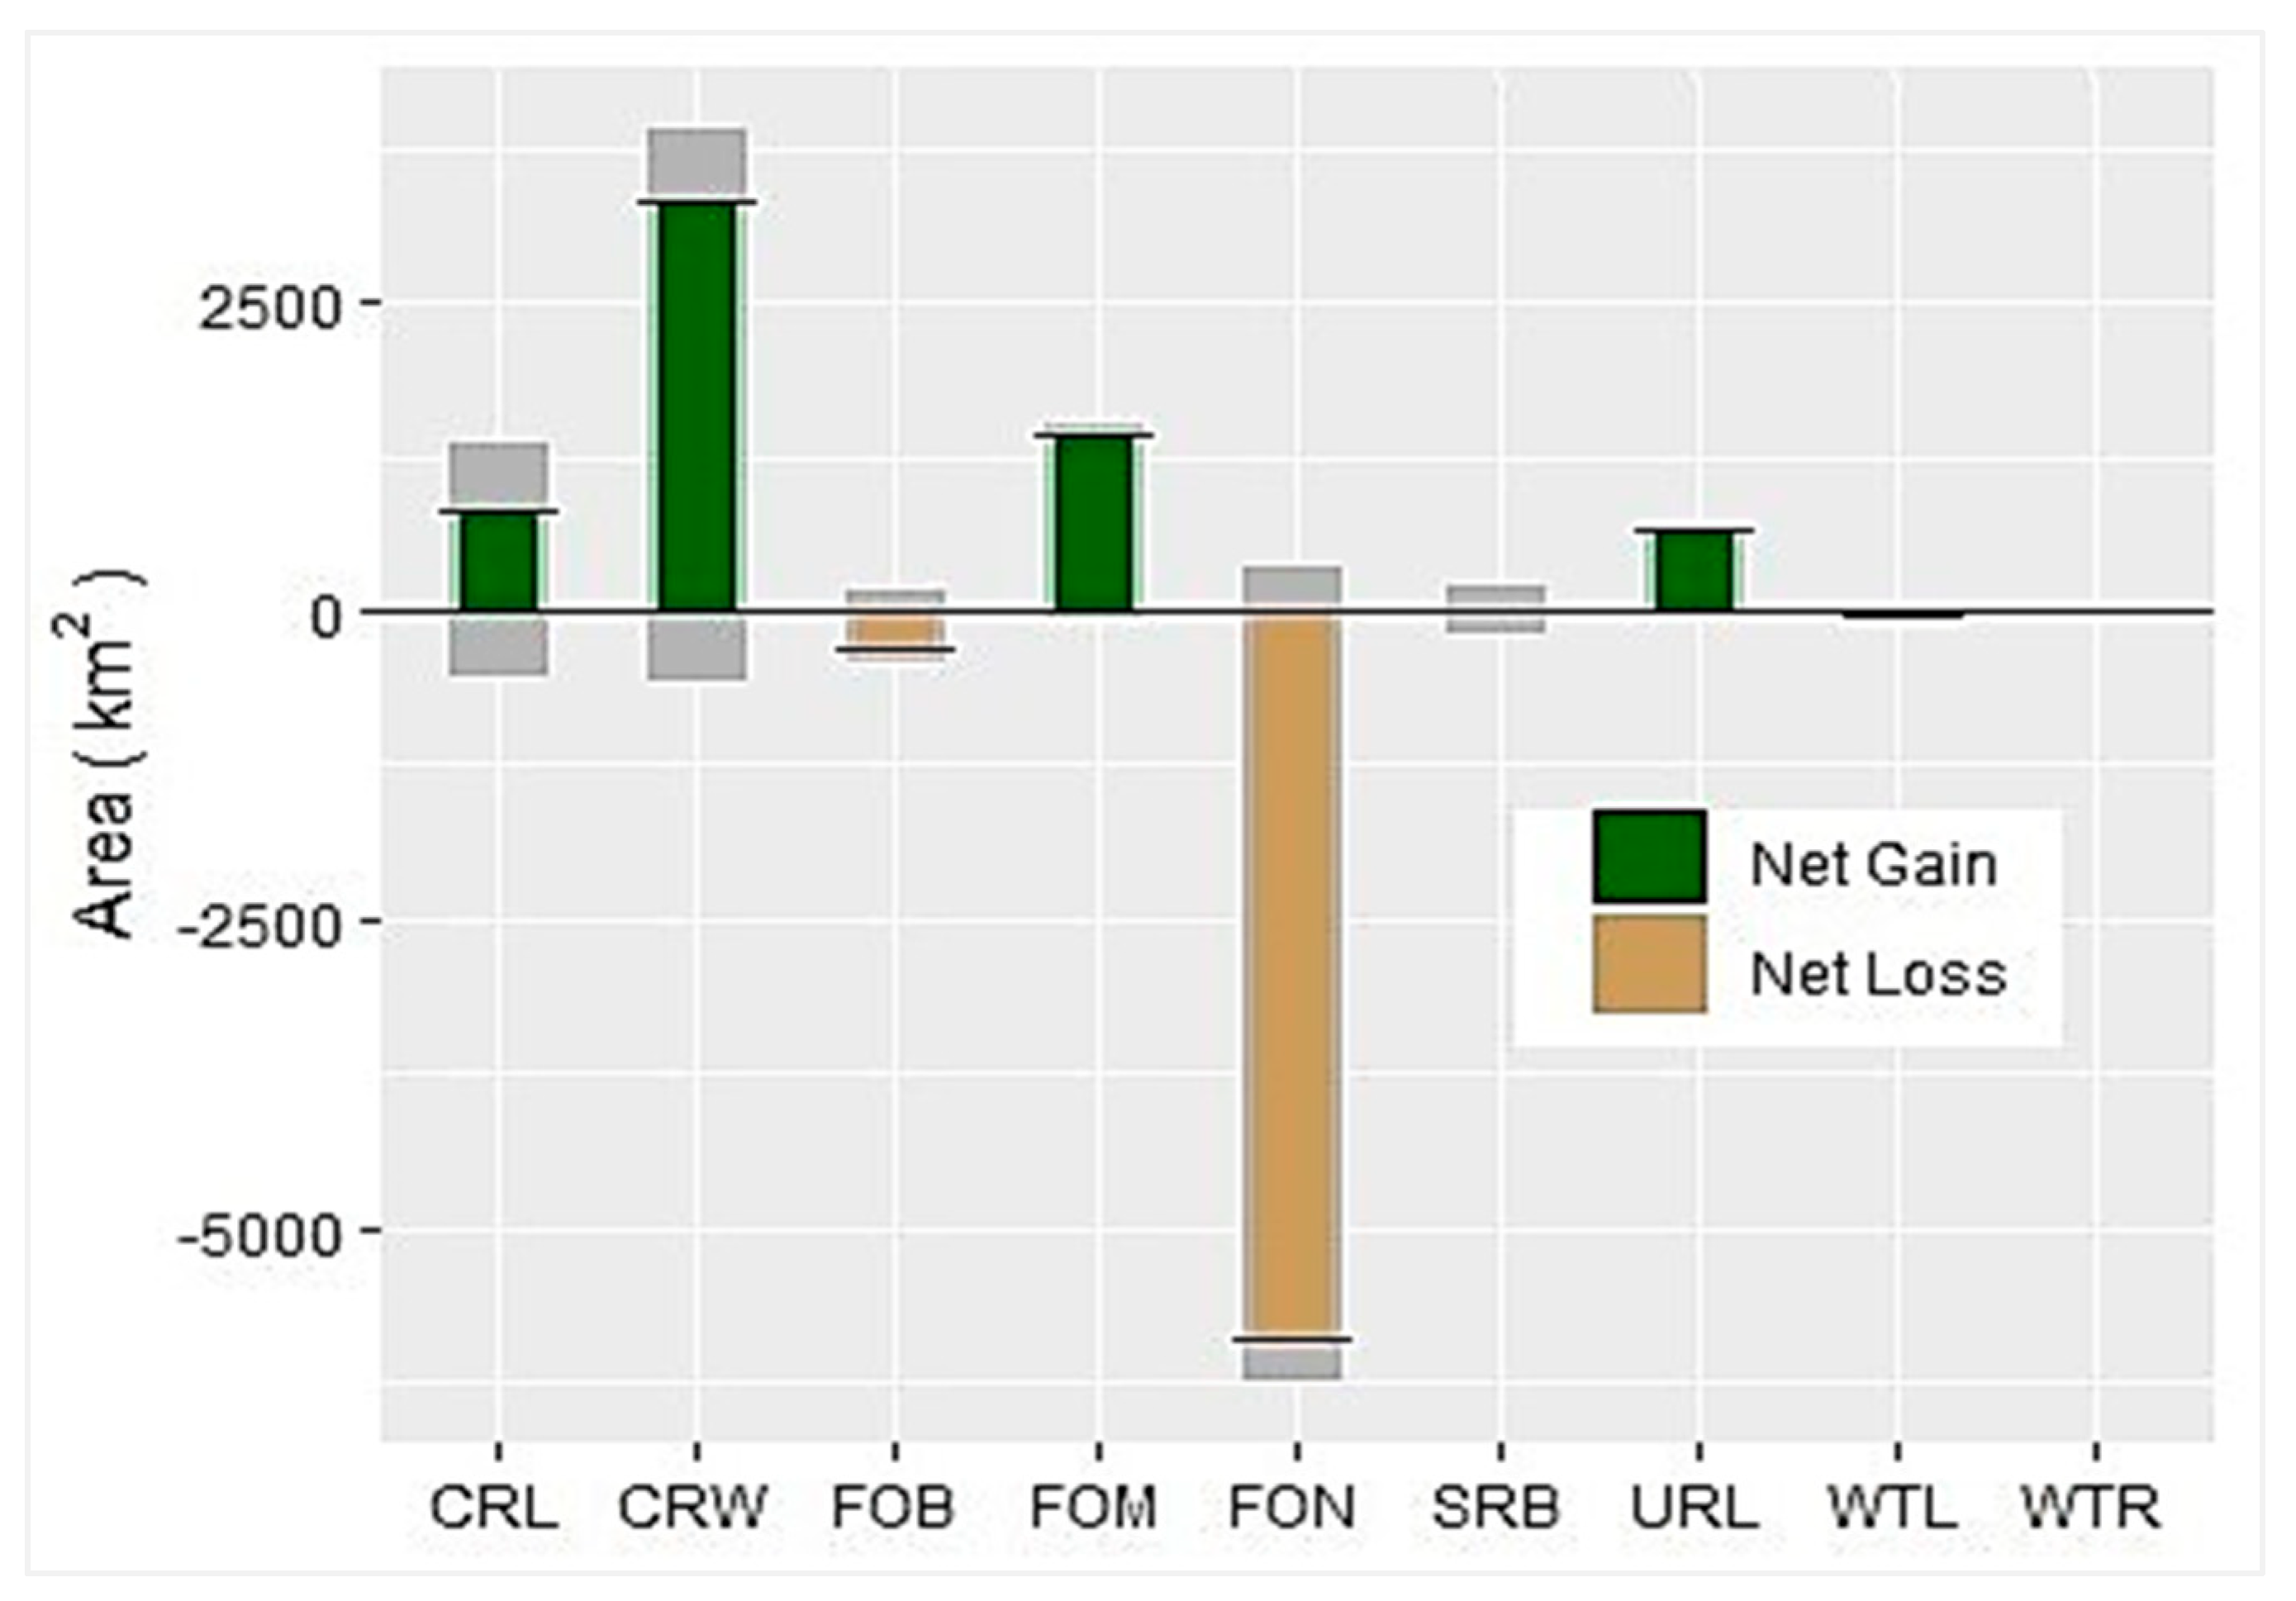
Among the landcover classes, broadleaved and needle-leaved evergreen forests and wetland decreased by 292, 5891 and 16 km2, respectively, while cropland, crop-woodland (mixed vegetation), mixed forests, and urban land increased by 800, 3338, 1434 and 658 km2, respectively (Figure 10).
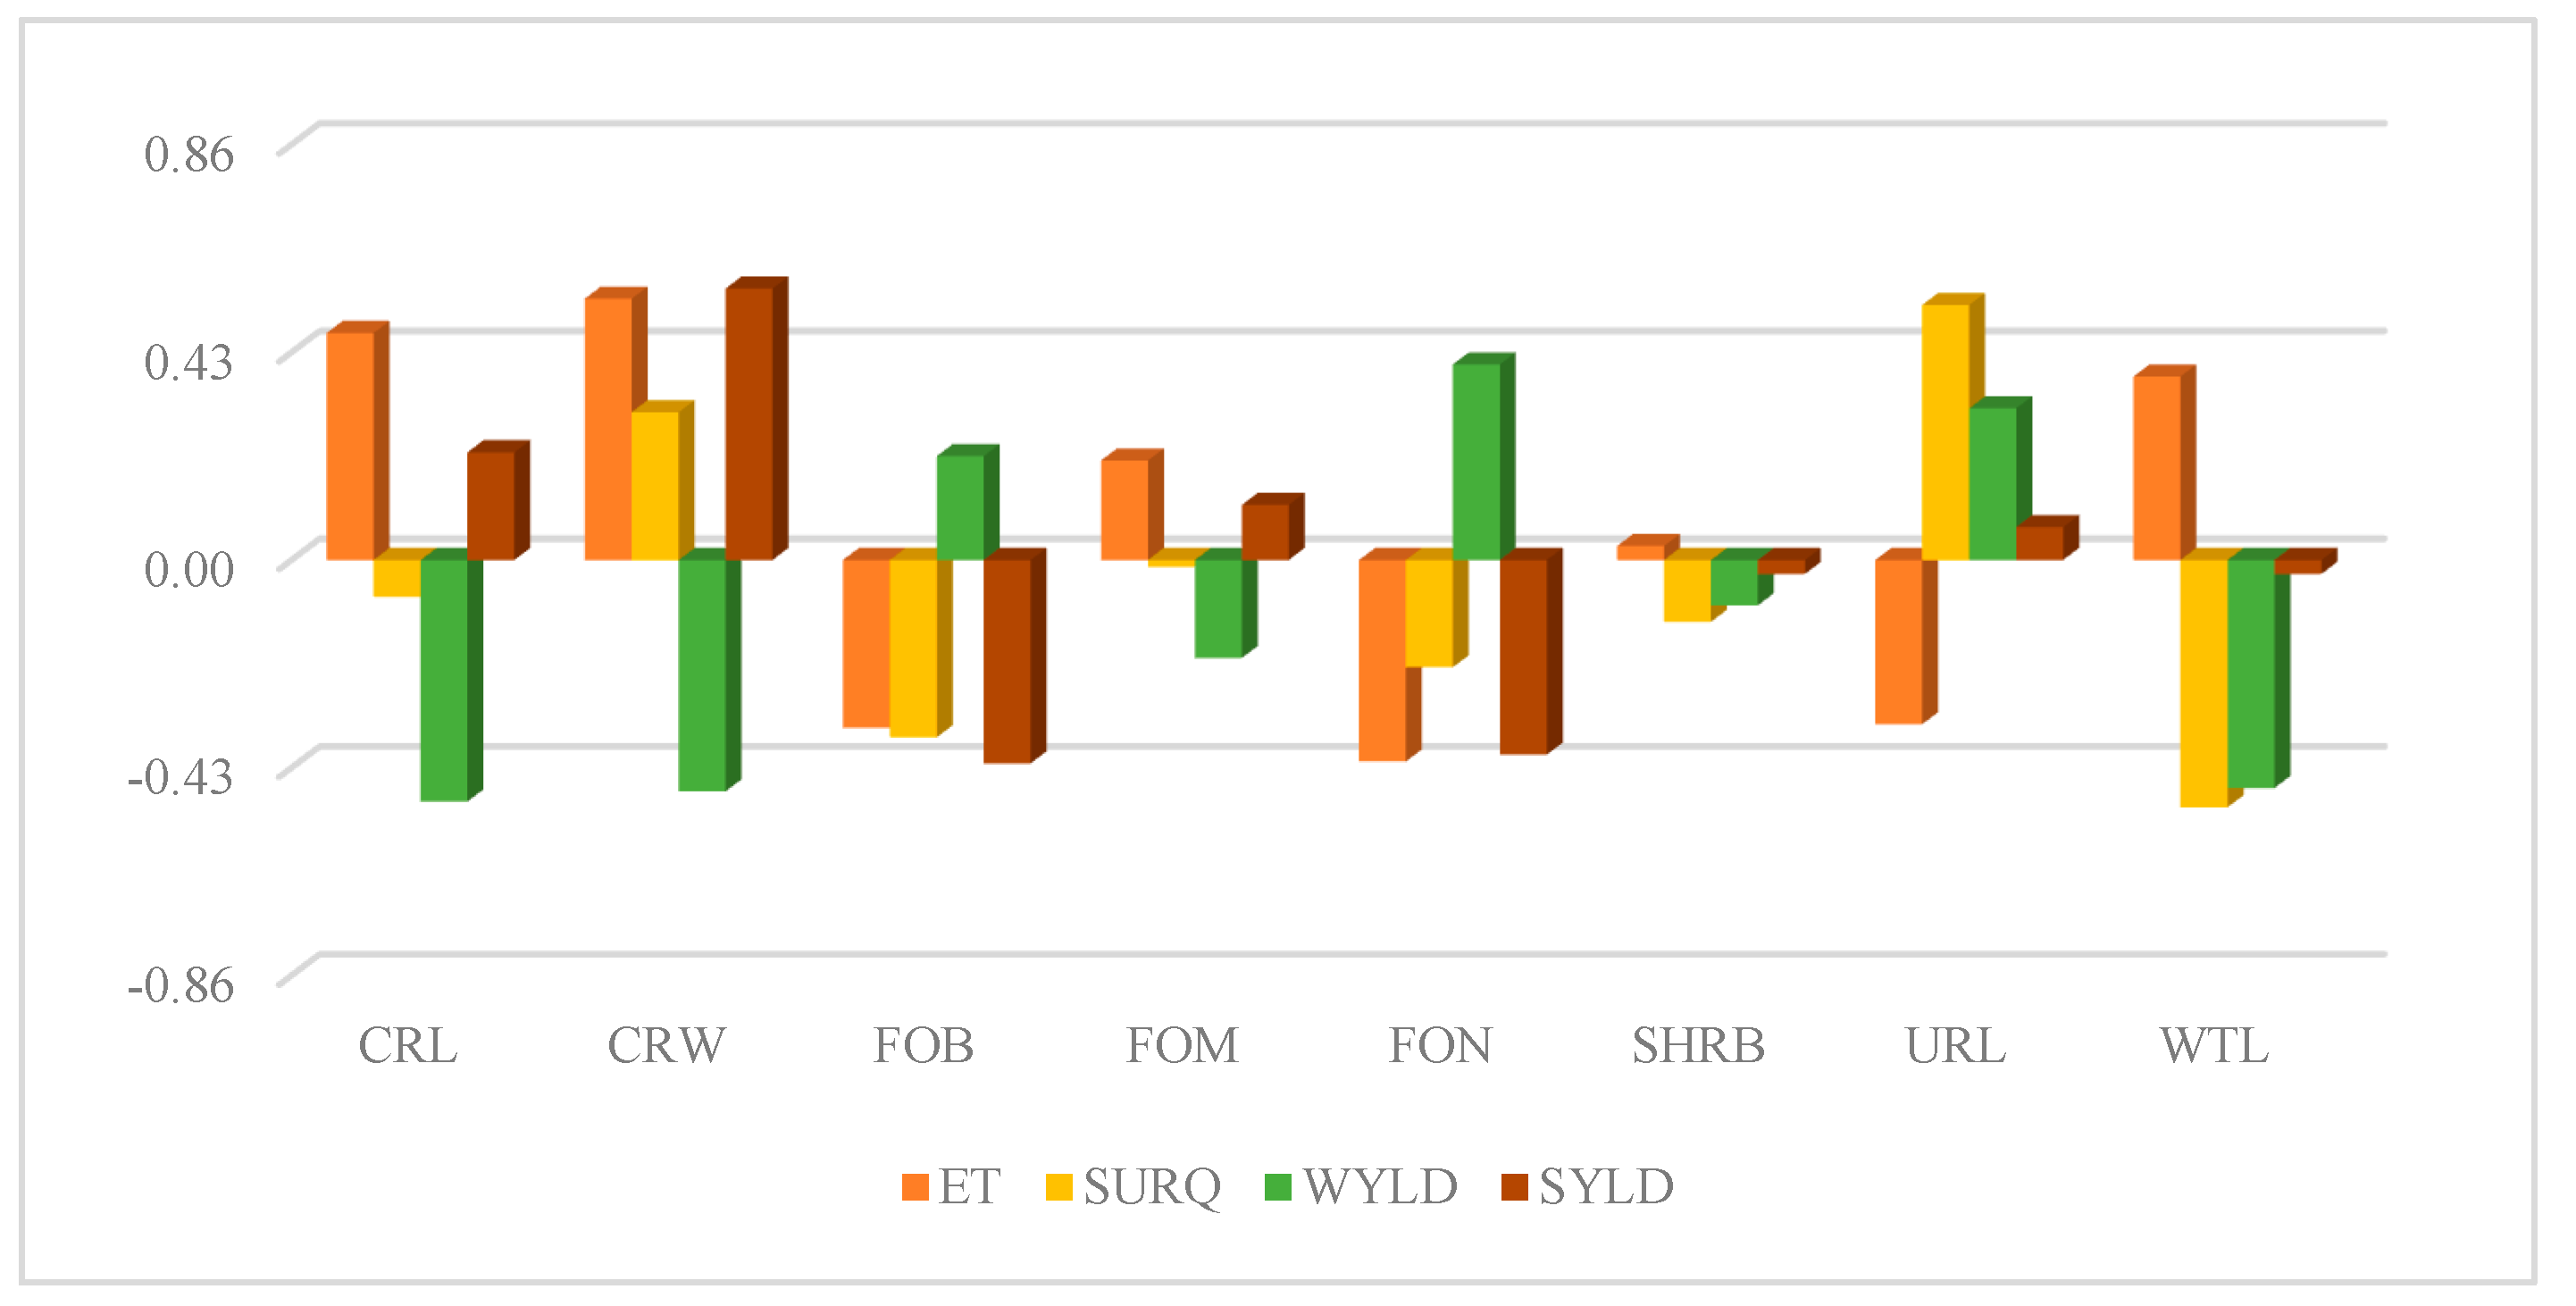
Variation in the influence of landcover changes on ET was positively correlated to cropland and crop-woodland, while negatively correlated to needle-leaved forest (Figure 11). The parameters that can largely influence ET of the different vegetation classes are leaf area index and maximum stomatal conductance. Leaf area index (LAI) was higher in the forest classes than cropland, but maximum stomatal conductance (GSI) was higher for croplands. It indicates that the difference in leaf conductance between the forests and croplands caused an increase in ET, leading to a decrease in the water yield. Maximum leaf conductance for broadleaved herbaceous crops is 500, for cereals is 450 and for coniferous forests is 234 mmol m−2 s−1 [45]. Our study is in agreement with [46], which reported an increase in ET due to a decrease in forest cover in a humid, subtropical watershed. In contrast to our results, Verstraeten et al. [47] reported more transpiration from forest than agricultural land in a temperate climate. Abundant precipitation keeps the soil water suitable for crop growth in the Minjiang river watershed. It means that a watershed with low precipitation will experience less ET from croplands than forests, because forest trees have better accessibility to the groundwater than crops.
Variation in the influence of landcover changes on surface runoff was positively correlated to urban land, while negatively correlated to wetland and broadleaved forests (Figure 11). It indicates that urban expansion in the watershed was mainly in the areas covered by wetlands and broadleaved forests. Increases in urban land at the cost of forest and wetland leads to increases in surface runoff because of the increase in impervious areas. Sediment yield was positively correlated to the presence of crop-woodland, while negatively correlated to the presence of needle-leaved and broadleaved forests. It should be noted that ‘crop-woodland’ is a mosaic vegetation category, containing forests and croplands. The cropland in this category has less than a 50% share [28], but it has a large influence on sediment yield compared to pure cropland. The reason is that the increase in the crop-woodland category was about four times larger than that for croplands. Thus, it can be concluded that the increase in the amount of cropland (crop-woodland and pure cropland) in the watershed increased sediment yield. The parameter which largely influenced sediment yield between forest and cropland is the crop factor of universal soil loss equation (the c factor). A higher c factor for cropland is due to agricultural activities, such as tillage, the removal of natural vegetation, and removing the residues of vegetation. Moreover, agricultural soil has less infiltration capacity than forests because it has less organic matter, a smaller number of microorganisms, a smaller number of roots, barren land in the non-growing season, etc. [48].
3.2.3. Implications for Watershed Management
On a global scale, about 60% of the land precipitation water is evaporated back to the atmosphere [49]. An increase in ET as a result of changes in the climate can cause chronic and periodic water shortage [3]. The authors of [50] reported an increase in the occurrence probability of extreme drought events in the Fujian province. The authors of [51] reported extreme drought conditions across south China during the late spring in 2018 with record-breaking hot days in May. Other studies also reported drying trends in late spring in south China [52,53].
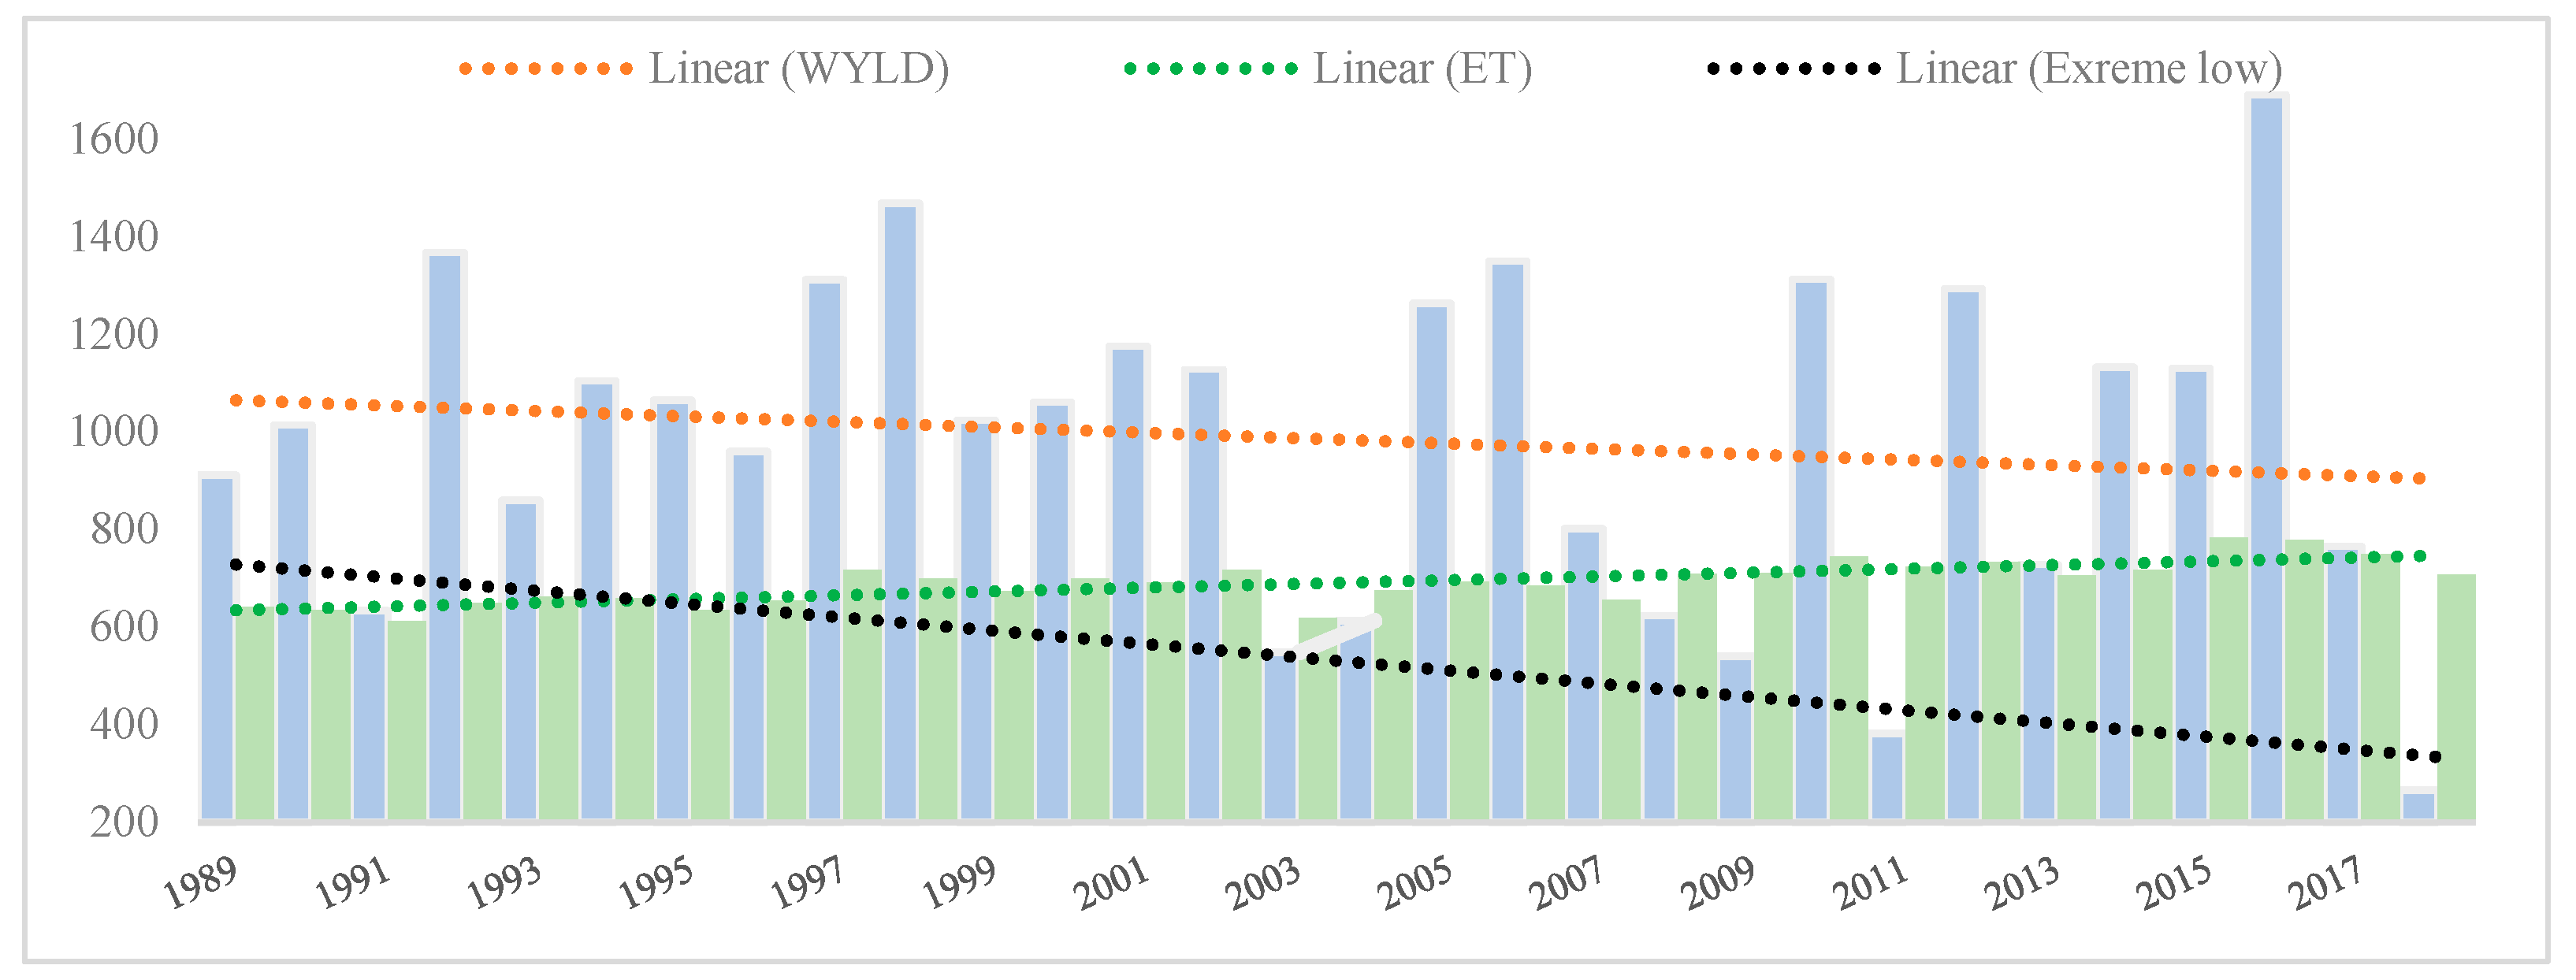
The Minjiang river watershed receives abundant precipitation, and the water balance is mainly dominated by water yield. Thus, a small decrease in average water yield may not be a good indicator from the perspective of watershed management. However, during extreme dry years, e.g., 2003, 2004, 2009, 2011 and 2018, ET dominated the water balance. During 2018, the proportion of ET was the highest, followed by 2011 and 2007 (Figure 12). This indicates that periodic water shortages (hydrological droughts) in the watershed intensified due to decreasing precipitation and increasing ET, which occurred mainly due to changes in the climate.
Extreme weather events pose a serious threat to ecosystems and human communities worldwide, with more life and economic losses from flash floods than any other climate change related problems. Flash floods that are associated with storm runoff are predicted to become more intense and frequent globally due to human activities and global warming [54]. The occurrence of flash floods in the province has risen sharply since 1988 [10]. Fujian is the province that has experienced the most severe flash flood disasters in China; about 84% of the population are directly threatened by flash floods [55]. An increase in surface runoff in the watershed indicates that the damage risk during high intensity precipitation events in the watershed has increased. Therefore, adaptation measures should be devised for storm water management, especially in urban areas and floodplains.
Soil erosion is a severe challenge for the productivity of land throughout the world [56]. About 75 billion tons of soil is eroded from terrestrial ecosystems across the world each year [57]. Heavy metals, nonpoint nutrient contaminants and chemicals are transported with soil particles due to erosion, and this causes water eutrophication and the disturbance of aquatic ecosystems [58]. In addition to degrading soil and water quality, sediments reduce the storage capacity and disturb the operations of hydroelectric power projects [59]. In the developing world, a growing population and increasing demands for food put an ever-increasing pressure on agricultural lands, which is leading to land exploitation and soil erosion [60]. Humid, subtropical zones, particularly hilly areas, are commonly overexploited for agricultural activities, which can lead to severe soil erosion during heavy precipitation events due to the steeply sloping land in these areas [61]. Soil erosion in the Minjiang river watershed increased due to increases in the amount of cropland and high-intensity precipitation, especially during the winter season. The reforestation of evergreen species, along with other mitigation measures, should be promoted especially on the steep slope areas to decrease soil and water degradation.
4. Conclusions
To investigate the impacts of recent (1989–2018) climate and landcover changes on the hydrological components of the Minjiang river watershed, this study used the SWAT model to quantitively separate the individual contribution of climate variability and landcover change. The performance of the model in simulating the streamflow was assessed using monthly observed streamflow data from one location, and yearly data from four locations. Moreover, yearly sediment loading data from five stations within the watershed were used to assess the model’s performance when simulating soil erosion and sediment transportation. Overall, the performance of the model was within the acceptable range according to the statistical criteria described in previous studies, i.e., the R2 and NSE values for streamflow ranged from 0.8–0.9 and 0.7–0.9, respectively, and for sediment loadings ranged from 0.6–0.8 and 0.6–0.7 during calibration and 0.7–0.9 and 0.7–0.9 during validation, respectively. The performance was higher when simulating streamflow than sediment loadings, which were largely influenced by the reservoirs.
To evaluate the impacts of climate and landcover changes, a scenario method was employed, i.e., one scenario for climate and landcover each. Then, the study period, i.e., 1989–2018, was divided into two equal periods. Afterwards, a comparison between the two periods revealed that water yield decreased by 6.76%, while evapotranspiration, surface runoff and sediment yield increased by 1.08%, 24.11% and 33.85%, respectively. The contribution of climate change relative to landcover change in decreasing the water yield was 95%, and in increasing evapotranspiration, surface runoff and sediment yield was 56%, 77% and 51%, respectively.
To develop a better understanding of the relationship between climate and landcover changes and the hydrology of the area, a correlation analysis was carried out to identify the most influential changes for different climate parameters and landcover classes. It revealed that the changes in climate parameters that were most likely responsible for changes in ET were increasing solar radiation and temperature and decreasing wind speed, those for changes in water yield were decreasing autumn precipitation and increasing solar radiation and temperature, those for increases in surface runoff were increasing summer and one-day maximum precipitation, while those for increasing sediment yield were increasing winter and one-day maximum precipitation. Similarly, increases in amount of cropland at the expense of needle-leaved forests was the landcover change that was most likely responsible for decreases in the water yield, and increases in ET and sediment yield, while an increase in the amount of urban land at the expense of broadleaved forests and wetlands was the landcover change that was most likely responsible for increasing surface runoff.
The Minjiang river watershed is an important water resource, and it is facing serious problems in the form of frequent floods and soil erosion. This study revealed that these problems, along with periodic extreme dry events, intensified during the past few decades, largely due to changes in the climate. Therefore, effective management strategies should be adopted in these areas, including storm water management, urban runoff, landslide protection, drought management and soil protection, especially in agricultural lands. Moreover, further studies should be conducted to predict the impacts of future climate change.
Author Contributions
S.L. conceived the idea and supervised the research; S.J. and A.Z. provided the materials, H.R. did the analysis and wrote the manuscript; A.R. helped in the study design and analysis; K.Y. and F.G. reviewed the manuscript. All authors have read and agreed to the published version of the manuscript.
Funding
The research was funded by “Funds for the Co-innovation Center for Soil and Water Conservation in Red Soil Region of the Cross-straits”, code K80ND8003.
Conflicts of Interest
The authors declare no conflict of interest.
References
- Hubbard, S.S.; Williams, K.H.; Agarwal, D.; Banfield, J.; Beller, H.; Bouskill, N.; Brodie, E.; Carroll, R.; Dafflon, B.; Dwivedi, D.; et al. The East River, Colorado, Watershed: A Mountainous Community Testbed for Improving Predictive Understanding of Multiscale Hydrological–Biogeochemical Dynamics. Vadose Zone J. 2018, 17, 180061. [Google Scholar] [CrossRef] [Green Version]
- Turral, H.; Burke, J.; Faurès, J.M. Climate Change, Water and Food Security; FAO Water Reports 36; FAO: Rome, Italy, 2011. [Google Scholar]
- IPCC. Climate Change 2014: Synthesis Report. Contribution of Working Groups I, II and III to the Fifth Assessment Report of the Intergovernmental Panel on Climate Change; Core Writing Team, Pachauri, R.K., Meyer, L.A., Eds.; IPCC: Geneva, Switzerland, 2014; p. 151. [Google Scholar]
- Erol, A.; Randhir, T.O. Climatic Change Impacts on the Ecohydrology of Mediterranean Watersheds. Clim. Chang. 2012, 114, 319–341. [Google Scholar] [CrossRef]
- Luan, X.-B.; Wu, P.-T.; Sun, S.-K.; Li, X.-L.; Wang, Y.-B.; Gao, X.-R. Impact of Land Use Change on Hydrologic Processes in a Large Plain Irrigation District. Water Resour. Manag. 2018, 32, 3203–3217. [Google Scholar] [CrossRef]
- IPCC. Climate Change 2021: The Physical Science Basis. Contribution of Working Group I to the Sixth Assessment Report of the Intergovernmental Panel on Climate Change; Masson-Delmotte, V., Zhai, P., Pirani, A., Connors, S.L., Péan, C., Berger, S., Caud, N., Chen, Y., Goldfarb, L., Gomis, M.I., et al., Eds.; Cambridge University Press: Cambridge, UK, 2021. [Google Scholar]
- FAO. Water for Sustainable Food and Agriculture; Food and Agriculture Organization of the United Nations: Rome, Italy, 2017. [Google Scholar]
- Wang, G.; Innes, J.L.; Hajjar, R.; Zhang, X.; Wang, J. Public Awareness and Perceptions of Watershed Management in the Min River Area, Fujian, China. Soc. Nat. Resour. 2013, 26, 586–604. [Google Scholar] [CrossRef]
- Hu, X.; Wu, C.; Hong, W.; Qiu, R.; Li, J.; Hong, T. Forest Cover Change and Its Drivers in the Upstream Area of the Minjiang River, China. Ecol. Indic. 2014, 46, 121–128. [Google Scholar] [CrossRef]
- Xiong, J.; Pang, Q.; Fan, C.; Cheng, W.; Ye, C.; Zhao, Y.; He, Y.; Cao, Y. Spatiotemporal Characteristics and Driving Force Analysis of Flash Floods in Fujian Province. ISPRS Int. J. Geo Inf. 2020, 9, 133. [Google Scholar] [CrossRef] [Green Version]
- Ying, C.; Xingwei, C.; Yixing, Y. Evolution Characteristics of Runoff in the Minjiang River Basin from 1960 to 2006. J. Nat. Resour. 2011, 26, 8. [Google Scholar]
- Yang, K.; Lu, C. Evaluation of Land-Use Change Effects on Runoff and Soil Erosion of a Hilly Basin—The Yanhe River in the Chinese Loess Plateau. Land Degrad. Dev. 2018, 29, 1211–1221. [Google Scholar] [CrossRef]
- Lotz, T.; Opp, C.; He, X. Factors of Runoff Generation in the Dongting Lake Basin Based on a SWAT Model and Implications of Recent Land Cover Change. Quat. Int. 2018, 475, 54–62. [Google Scholar] [CrossRef]
- Martínez-Retureta, R.; Aguayo, M.; Stehr, A.; Sauvage, S.; Echeverría, C.; Sánchez-Pérez, J.-M. Effect of Land Use/Cover Change on the Hydrological Response of a Southern Center Basin of Chile. Water 2020, 12, 302. [Google Scholar] [CrossRef] [Green Version]
- Chen, Q.; Chen, H.; Zhang, J.; Hou, Y.; Shen, M.; Chen, J.; Xu, C.-Y. Impacts of Climate Change and LULC Change on Runoff in the Jinsha River Basin. J. Geogr. Sci. 2020, 30, 85–102. [Google Scholar] [CrossRef] [Green Version]
- Saddique, N.; Mahmood, T.; Bernhofer, C. Quantifying the Impacts of Land Use/Land Cover Change on the Water Balance in the Afforested River Basin, Pakistan. Environ. Earth Sci. 2020, 79, 448. [Google Scholar] [CrossRef]
- Munoth, P.; Goyal, R. Impacts of Land Use Land Cover Change on Runoff and Sediment Yield of Upper Tapi River Sub-Basin, India. Int. J. River Basin Manag. 2019, 18, 177–189. [Google Scholar] [CrossRef]
- Guo, Y.; Fang, G.; Xu, Y.-P.; Tian, X.; Xie, J. Identifying How Future Climate and Land Use/Cover Changes Impact Streamflow in Xinanjiang Basin, East China. Sci. Total Environ. 2019, 710, 136275. [Google Scholar] [CrossRef]
- Belete, M.; Deng, J.; Abubakar, G.A.; Teshome, M.; Wang, K.; Woldetsadik, M.; Zhu, E.; Comber, A.; Gudo, A. Partitioning the Impacts of Land Use/Land Cover Change and Climate Variability on Water Supply over the Source Region of the Blue Nile Basin. Land Degrad. Dev. 2020, 31, 2168–2184. [Google Scholar] [CrossRef]
- Aneseyee, A.B.; Elias, E.; Soromessa, T.; Feyisa, G.L. Land Use/Land Cover Change Effect on Soil Erosion and Sediment Delivery in the Winike Watershed, Omo Gibe Basin, Ethiopia. Sci. Total Environ. 2020, 728, 138776. [Google Scholar] [CrossRef]
- Pessacg, N.; Flaherty, S.; Solman, S.; Pascual, M. Climate Change in Northern Patagonia: Critical Decrease in Water Resources. Theor. Appl. Climatol. 2020, 140, 807–822. [Google Scholar] [CrossRef]
- Woltemade, C.J.; Hawkins, T.W.; Jantz, C.; Drzyzga, S. Impact of Changing Climate and Land Cover on Flood Magnitudes in the Delaware River Basin, USA. JAWRA J. Am. Water Resour. Assoc. 2020, 56, 507–527. [Google Scholar] [CrossRef]
- Kabeja, C.; Li, R.; Guo, J.; Rwatangabo, D.E.R.; Manyifika, M.; Gao, Z.; Wang, Y.; Zhang, Y. The Impact of Reforestation Induced Land Cover Change (1990–2017) on Flood Peak Discharge Using HEC-HMS Hydrological Model and Satellite Observations: A Study in Two Mountain Basins, China. Water 2020, 12, 1347. [Google Scholar] [CrossRef]
- Wu, L.; Zhang, X.; Hao, F.; Wu, Y.; Li, C.; Xu, Y. Evaluating the Contributions of Climate Change and Human Activities to Runoff in Typical Semi-Arid Area, China. J. Hydrol. 2020, 590, 125555. [Google Scholar] [CrossRef]
- Meng, X.; Wang, H.; Shi, C.; Wu, Y.; Ji, X. Establishment and Evaluation of the China Meteorological Assimilation Driving Datasets for the SWAT Model (CMADS). Water 2018, 10, 1555. [Google Scholar] [CrossRef] [Green Version]
- Meng, X.; Wang, H. Significance of the China Meteorological Assimilation Driving Datasets for the SWAT Model (CMADS) of East Asia. Water 2017, 9, 765. [Google Scholar] [CrossRef]
- Meng, X.; Wang, H.; Chen, J. Profound Impacts of the China Meteorological Assimilation Driving Datasets for the SWAT Model (CMADS). Water 2019, 11, 832. [Google Scholar] [CrossRef] [Green Version]
- ESA. Land Cover CCI Product User Guide Version 2. Tech. 2017. Rep. Available online: maps.elie.ucl.ac.be/CCI/viewer/download/ESACCI-LC-Ph2-PUGv2_2.0.pdf (accessed on 7 March 2020).
- Estoque, R.C.; Ooba, M.; Avitabile, V.; Hijioka, V.; DasGupta, R.; Togawa, T.; Murayama, Y. The Future of Southeast Asia’s forests. Nat. Commun. 2019, 10, 1829. [Google Scholar] [CrossRef] [PubMed] [Green Version]
- Guo, L.; Sun, F.; Liu, W.; Zhang, Y.; Wang, H.; Cui, H.; Wang, H.; Zhang, J.; Du, B. Response of Ecosystem Water Use Efficiency to Drought over China during 1982–2015: Spatiotemporal Variability and Resilience. Forests 2019, 10, 598. [Google Scholar] [CrossRef] [Green Version]
- Osei, M.A.; Amekudzi, L.K.; Wemegah, D.D.; Preko, K.; Gyawu, E.S.; Obiri-Danso, K. The Impact of Climate and Land-Use Changes on the Hydrological Processes of Owabi Catchment from SWAT Analysis. J. Hydrol. Reg. Stud. 2019, 25, 100620. [Google Scholar] [CrossRef]
- Moriasi, D.N.; Pai, N.; Steiner, J.L.; Gowda, P.H.; Winchell, M.; Rathjens, H.; Starks, P.J.; Verser, J.A. SWAT-LUT: A Desktop Graphical User Interface for Updating Land Use in SWAT. JAWRA J. Am. Water Resour. Assoc. 2019, 55, 1102–1115. [Google Scholar] [CrossRef] [Green Version]
- Moriasi, D.N.; Arnold, J.G.; Van Liew, M.W.; Bingner, R.L.; Harmel, R.D.; Veith, T.L. Model Evaluation Guidelines for Systematic Quantification of Accuracy in Watershed Simulations. Trans. ASABE 2007, 50, 885–900. [Google Scholar] [CrossRef]
- Abbaspour, K.C.; Vedjani, M. SWAT-CUP Calibration and Uncertainty Programs for SWAT. In Proceedings of the MODSIM 2007 International Congress on Modelling and Simulation, Modelling and Simulation Society of Australia and New Zealand, Christchurch, New Zealand, 10–13 December 2007; pp. 1596–1602. [Google Scholar]
- Arnold, J.G.; Moriasi, D.N.; Gassman, P.W.; Abbaspour, K.C.; White, M.J.; Srinivasan, R.; Santhi, C.; Harmel, R.D.; van Griensven, A.; Van Liew, M.W.; et al. SWAT: Model Use, Calibration, and Validation. Trans. ASABE 2012, 55, 1491–1508. [Google Scholar] [CrossRef]
- Neitsch, S.; Arnold, J.G.; Kiniry, J.R.; Williams, J.R. Soil and Water Assessment Tool Theoretical Documentation. Version, 2009. Tex. Water Resour. Inst. 2011, 406, 618. [Google Scholar]
- Vigiak, O.; Malagó, A.; Bouraoui, F.; Vanmaercke, M.; Poesen, J. Adapting SWAT Hillslope Erosion Model to Predict Sediment Concentrations and Yields in Large Basins. Sci. Total. Environ. 2015, 538, 855–875. [Google Scholar] [CrossRef] [PubMed]
- Chang, C.; Harrison, J.F.; Huang, Y. Modeling Typhoon-Induced Alterations on River Sediment Transport and Turbidity Based on Dynamic Landslide Inventories: Gaoping River Basin, Taiwan. Water 2015, 7, 6910–6930. [Google Scholar] [CrossRef] [Green Version]
- Emam, A.R.; Kappas, M.; Fassnacht, S.; Linh, N.H.K. Uncertainty Analysis of Hydrological Modeling in a Tropical Area Using Different Algorithms. Front. Earth Sci. 2018, 12, 661–671. [Google Scholar] [CrossRef]
- Mendoza, J.A.C.; Alcazar, T.A.C.; Medina, S.A.Z. Calibration and Uncertainty Analysis for Modelling Runoff in the Tambo River Basin, Peru, Using Sequential Uncertainty Fitting Ver-2 (SUFI-2) Algorithm. Air Soil Water Res. 2021, 14. [Google Scholar] [CrossRef]
- Tang, X.; Zhang, J.; Wang, G.; Jin, J.; Liu, C.; Liu, Y.; He, R.; Bao, Z. Uncertainty Analysis of SWAT Modeling in the Lancang River Basin Using Four Different Algorithms. Water 2021, 13, 341. [Google Scholar] [CrossRef]
- Woolley, J.T. Mechanisms by Which Wind Influences Transpiration. Plant Physiol. 1961, 36, 112–114. [Google Scholar] [CrossRef] [Green Version]
- Schymanski, S.J.; Or, D. Wind Increases Leaf Water Use Efficiency. Plant Cell Environ. 2016, 39, 1448–1459. [Google Scholar] [CrossRef]
- Lin, H.; Chen, Y.; Zhang, H.; Fu, P.; Fan, Z. Stronger Cooling Effects of Transpiration and Leaf Physical Traits of Plants from a Hot Dry Habitat Than from a Hot Wet Habitat. Funct. Ecol. 2017, 31, 2202–2211. [Google Scholar] [CrossRef] [Green Version]
- Korner, C. Leaf Diffusive Conductances in the Major Vegetation Types of the Globe, in Ecophysiology of Photosynthesis; Schulze, E.-D., Caldwell, M.M., Eds.; Springer: Berlin/Heidelberg, Germany, 1995; pp. 463–490. [Google Scholar]
- Sun, G.; Zuo, C.; Liu, S.; Liu, M.; McNulty, S.G.; Vose, J.M. Watershed Evapotranspiration Increased Due to Changes in Vegetation Composition and Structure under a Subtropical Climate 1. JAWRA J. Am. Water Resour. Assoc. 2008, 44, 1164–1175. [Google Scholar] [CrossRef] [Green Version]
- Verstraeten, W.W.; Muys, B.; Feyen, J.; Veroustraete, F.; Minnaert, M.; Meiresonne, L.; De Schrijver, A. Comparative Analysis of the Actual Evapotranspiration of Flemish Forest and Cropland, Using the Soil Water Balance Model WAVE. Hydrol. Earth Syst. Sci. 2005, 9, 225–241. [Google Scholar] [CrossRef] [Green Version]
- Holz, D.; Williard, K.W.J.; Edwards, P.J.; Schoonover, P.E. Soil Erosion in Humid Regions: A Review. J. Contemp. Water Res. Educ. 2015, 154, 48–59. [Google Scholar] [CrossRef]
- Zhan, S.; Song, C.; Wang, J.; Sheng, Y.; Quan, J. A Global Assessment of Terrestrial Evapotranspiration Increase Due to Surface Water Area Change. Earth’s Future 2019, 7, 266–282. [Google Scholar] [CrossRef] [Green Version]
- Guojiang, D.; Guangsheng, L.; Lianrong, C. Application of SPEI Index in Drought Evolution in Fujian Province. IOP Conf. Ser. Earth Environ. Sci. 2020, 435, 012016. [Google Scholar] [CrossRef]
- Zhang, L.; Zhou, T.; Chen, X.; Wu, P.; Christidis, N.; Lott, C.F. The Late Spring Drought of 2018 in South China. Bull. Am. Meteorol. Soc. 2020, 101, S59–S64. [Google Scholar] [CrossRef] [Green Version]
- Qiu, Y.; Cai, W.; Guo, X.; Pan, A. Dynamics of Late Spring Rainfall Reduction in Recent Decades over Southeastern China. J. Clim. 2009, 22, 2240–2247. [Google Scholar] [CrossRef]
- Xin, X.; Yu, R.; Zhou, T.; Wang, B. Drought in Late Spring of South China in Recent Decades. J. Clim. 2006, 19, 3197–3206. [Google Scholar] [CrossRef] [Green Version]
- Yin, J.; Gentine, P.; Zhou, S.; Sullivan, S.C.; Wang, R.; Zhang, Y.; Guo, S. Large Increase in Global Storm Runoff Extremes Driven by Climate and Anthropogenic Changes. Nat. Commun. 2018, 9, 4389. [Google Scholar] [CrossRef] [Green Version]
- Cao, Y.; Jia, H.; Xiong, J.; Cheng, W.; Li, K.; Pang, Q.; Yong, Z. Flash Flood Susceptibility Assessment Based on Geodetector, Certainty Factor, and Logistic Regression Analyses in Fujian Province, China. ISPRS Int. J. Geo Inf. 2020, 9, 748. [Google Scholar] [CrossRef]
- Pennock, D. Soil Erosion: The Greatest Challenge to Sustainable Soil Management; FAO: Rome, Italy, 2019; 100p. [Google Scholar]
- Zuazo, V.H.D.; Pleguezuelo, C.R.R. Soil-Erosion and Runoff Prevention by Plant Covers. A Review. Agron. Sustain. Dev. 2008, 28, 65–86. [Google Scholar] [CrossRef] [Green Version]
- Issaka, S.; Ashraf, M.A. Impact of Soil Erosion and Degradation on Water Quality: A Review. Geol. Ecol. Landsc. 2017, 1, 1–11. [Google Scholar] [CrossRef] [Green Version]
- Kondolf, G.M.; Gao, Y.; Annandale, G.W.; Morris, G.L.; Jiang, E.; Zhang, J.; Cao, Y.; Carling, P.; Fu, K.; Guo, Q.; et al. Sustainable Sediment Management in Reservoirs and Regulated Rivers: Experiences from Five Continents. Earth’s Future 2014, 2, 256–280. [Google Scholar] [CrossRef]
- Mandal, D.; Sharda, V.N. Appraisal of Soil Erosion Risk in the Eastern Himalayan Region of India for Soil Conservation Planning. Land Degrad. Dev. 2011, 24, 430–437. [Google Scholar] [CrossRef]
- Fang, H.; Sun, L.; Qi, D.; Cai, Q. Using 137Cs Technique to Quantify Soil Erosion and Deposition Rates in an Agricultural Catchment in the Black Soil Region, Northeast China. Geomorphology 2012, 169–170, 142–150. [Google Scholar] [CrossRef]
Figure 1.
Location map of Minjiang river watershed.

Figure 2.
Separating the influence of climate and landcover changes.

Figure 3.
Attribution of the hydrological changes to different climate parameters and landcover classes.
Figure 3.
Attribution of the hydrological changes to different climate parameters and landcover classes.

Figure 4.
The combined and individual impacts of climate and landcover changes on evapotranspiration (ET) and water yield (WYLD) in the watershed.
Figure 4.
The combined and individual impacts of climate and landcover changes on evapotranspiration (ET) and water yield (WYLD) in the watershed.

Figure 5.
The combined and individual impacts of climate and landcover changes on surface runoff (SURQ) and sediment yield (SYLD) in the watershed.
Figure 5.
The combined and individual impacts of climate and landcover changes on surface runoff (SURQ) and sediment yield (SYLD) in the watershed.

Figure 6.
Variation in the influence of climate change among the subbasins.

Figure 7.
Changes in different climate parameters in the watershed during the study period.

Figure 8.
Correlation of different climate parameters to hydrological parameters (correlation > 0.43/<−0.43 denotes significant correlation).
Figure 8.
Correlation of different climate parameters to hydrological parameters (correlation > 0.43/<−0.43 denotes significant correlation).

Figure 9.
Variation in the influence of landcover change among the subbasins.

Figure 10.
Changes in landcover classes in the watershed during the study period.

Figure 11.
Correlation of different landcover classes to hydrological parameters.

Figure 12.
Annual water balance components with linear trend in ET, water yield and extreme low water yield in the watershed.
Figure 12.
Annual water balance components with linear trend in ET, water yield and extreme low water yield in the watershed.

Table 3.
Weight of the landcover maps when updating the HRUs using SWAT-LUT.
| Year | 1979 | 1993 | 1994 | 1995 | 1996 | 1997 | 1998 | 1999 | 2004 | 2005 |
|---|---|---|---|---|---|---|---|---|---|---|
| Landcover | 1992 | 2004 | 2004 | 2004 | 2004 | 2004 | 2004 | 2004 | 2004 | 2010 |
| weight | 1 | 0.08 | 0.17 | 0.25 | 0.33 | 0.42 | 0.5 | 0.58 | 1 | 0.08 |
Table 4.
Calibrated (sensitive) parameter descriptions and fitted values.
| Parameter Description | Fitted Value | ||||
|---|---|---|---|---|---|
| YT | FZ | SM | SC | JN | |
| Peak rate adjustment factor (tributary channels) | 0.56 | 0.56 | 0.56 | 0.56 | 0.56 |
| Maximum reentrainable quantity of sediments | 0.0002 | 0.0001 | 0.0002 | 0.0001 | 0.0001 |
| Exponent for sediment routing calculation | 1.07 | 1.5 | 1.5 | 1.47 | 1.28 |
| Peak rate adjustment factor (main channel) | 0.78 | 0.55 | 1.09 | 1.16 | 0.67 |
| Manning’s “n” value (main channel) | 0.015 | 0.018 | 0.022 | 0.036 | 0.021 |
| Erodibility factor (main channel) | 0.68 | 0 | 0.29 | 0.38 | 0.44 |
| Cover factor (main channel) | 0.39 | 0 | 0.25 | 0.29 | 0.31 |
| Manning’s “n” value (tributary channels) | 0.07 | 0.1 | 0.08 | 0.11 | 0.09 |
| Normal sediments concentration (reservoirs) | 142 | 50 | 92 | 195 | 70 |
| Hydraulic conductivity (reservoirs) | 0.33 | 0.33 | 0.2 | 0.28 | 0.37 |
Table 5.
Calibration results.
| Station | River Flow | Sediment Loading | ||||
|---|---|---|---|---|---|---|
| R2 | NSE | R2 | NSE | |||
| Cal. | Val. | Cal. | Val. | |||
| YT | 0.8 | 0.7 | 0.6 | 0.8 | 0.6 | 0.7 |
| SM | 0.9 | 0.9 | 0.8 | 0.9 | 0.6 | 0.8 |
| SC | 0.9 | 0.9 | 0.7 | 0.9 | 0.6 | 0.8 |
| JN | 0.8 | 0.8 | 0.7 | 0.8 | 0.6 | 0.7 |
| FZ | 0.9 | 0.9 | 0.8 | 0.9 | 0.7 | 0.8 |
Publisher’s Note: MDPI stays neutral with regard to jurisdictional claims in published maps and institutional affiliations. |
© 2021 by the authors. Licensee MDPI, Basel, Switzerland. This article is an open access article distributed under the terms and conditions of the Creative Commons Attribution (CC BY) license (https://creativecommons.org/licenses/by/4.0/).
Share and Cite
MDPI and ACS Style
Rashid, H.; Yang, K.; Zeng, A.; Ju, S.; Rashid, A.; Guo, F.; Lan, S. The Influence of Landcover and Climate Change on the Hydrology of the Minjiang River Watershed. Water 2021, 13, 3554. https://doi.org/10.3390/w13243554
AMA Style
Rashid H, Yang K, Zeng A, Ju S, Rashid A, Guo F, Lan S. The Influence of Landcover and Climate Change on the Hydrology of the Minjiang River Watershed. Water. 2021; 13(24):3554. https://doi.org/10.3390/w13243554
Chicago/Turabian StyleRashid, Haroon, Kaijie Yang, Aicong Zeng, Song Ju, Abdur Rashid, Futao Guo, and Siren Lan. 2021. "The Influence of Landcover and Climate Change on the Hydrology of the Minjiang River Watershed" Water 13, no. 24: 3554. https://doi.org/10.3390/w13243554
Note that from the first issue of 2016, this journal uses article numbers instead of page numbers. See further details here.