
Spatial Assessment of Hydrochemical Characteristics and Evolution of Inferior Quality Water in Kashi Delta
by
 ,
,
Pengfei Qu
1,* ,
,
Shengwei Su
1,
Jian Jiao
1,
Xiangyang Hu
1,
Cheng Zhao
1,
Xiao Fang
2 and
Gengsheng Yan
1 1
Powerchina Northwest Engineering Corporation Limited, Xi’an 710100, China
2
No. 801 Hydrogeology and Engineering Geology Brigade of Shandong Exploration Bureau of Geology and Mineral Resources, Ji’nan 250014, China
*
Author to whom correspondence should be addressed.
Water 2021, 13(24), 3557; https://doi.org/10.3390/w13243557
Submission received: 25 October 2021
/
Revised: 2 December 2021
/
Accepted: 8 December 2021
/
Published: 12 December 2021
(This article belongs to the Special Issue Research Progress on Watershed Ecohydrological Processes)
Abstract
:Hydrochemistry is a critical indicator of water quality. We analysed 146 hydrochemical parameters of groundwater and the hydrogeological background of the Kashi region in China, examined their spatial distributions, and elucidated the mechanisms of their occurrence. We used graphical and multivariate statistical methods to distinguish between high- and poor-quality water. In the Kizil-Cakmak River Basin of the northern Kashi region, the primary cations were Ca2+ and Mg2+, and the primary anion was SO42−; their concentrations were four times higher than the Class III water quality standard. Additionally, the salinity was high. In contrast, in the upstream and midstream parts of the Gez-Kushan River Basin in the southern Kashi region, the primary ions were HCO3− and SO42−, and the salinity was low. Downstream of the Gez-Kushan River Basin, the primary ion was Cl−, and the salinity was low. There was a wide-ranging spatial variability in the SO42−, Cl−, and Ca2+ contents throughout the study area. The present findings can be applied to locate suitable domestic, agricultural, and industrial water sources in the Kashi region and can provide theoretical guidance for the scientific development and management of groundwater in this region.
1. Introduction
Groundwater is a vital resource in arid and semi-arid regions. It is widely used for domestic, agricultural, and industrial purposes [1,2,3,4,5,6,7,8]. Groundwater quality directly affects human health and regional economic development. Studying the chemical evolution of groundwater can help elucidate its spatio-temporal distribution and facilitate its management as a resource [9,10]. Over the last decade, several scholars have analysed variations in groundwater ion distributions, salinity, and microelement contents using hydrogeochemistry, environmental isotopes, multivariate statistical analysis, hydrochemical simulations, and fuzzy comprehensive evaluations. These studies have clarified the mechanisms through which groundwater composition has formed and evolved under the influences of hydrogeochemical processes, water–rock interactions, lithofacies palaeogeography, and human activity [1,11,12,13,14,15].
The ion distribution in groundwater is primarily affected by hydrogeological conditions, lithology structure, water–rock interactions, the runoff rate, and human activity. Yang et al. [16] analysed the hydrogeochemical characteristics of sulphate in the Ordos basin and demonstrated that it is predominately controlled by lithology and lithofacies. Wu [17] measured the sulphate and chloride concentrations in the groundwater of Bengbu City and found that it exhibited high levels of these ions, primarily owing to excessive sewage, industrial wastewater, leaching, dissolution, microbial decomposition, and various physicochemical and biochemical reactions. Ma and Fan [18] found that the sulphate in the karst groundwater of East Weibei, Shanxi Province, China, was primarily derived from dissolved marine sulphate combined with ancient sedimentary saline water from the south and that leaching increased the salinity. These examples demonstrate that geological, geomorphological, hydrochemical factors, and human activities influence the distribution of groundwater sulphate, chloride, salinity, etc. and accelerate groundwater quality improvement and evolution in arid and semi-arid regions.
The Kashi Delta is in the western Tarim Basin of north-western China. It is characterised by long diurnal illumination, wide temperature variations, scant precipitation, and high evaporation rates. Hence, groundwater is one of the primary water sources in this region. The region primarily contributes to cotton-based agriculture and industry, primarily in the power and manufacturing industries. This area uses peripheral deep groundwater for irrigation and industrial purposes [19,20]. However, the uneven distribution of groundwater renders this water resource less exploitable and restricts the development of this area. Additionally, the high salinity and sulphate content of the groundwater in this region directly affects its development, utilisation, and resident health [20]. The analyses of the hydrochemical characteristics of the groundwater in the Kashi plains revealed that the northern basin exhibits particularly high sulphate concentrations (maximum 708.9 mg/L). In the southern basin, the groundwater ion concentrations widely range from low to high. Nevertheless, some of the water meets the safety standards for domestic and irrigation use. However, the mechanisms responsible for the differences in sulphate concentration and salinity between the northern and southern Kashi Delta basins are currently unknown. Based on prior investigations regarding the Kashi Delta groundwater chemistry [21,22], we conducted a comparative study of the differences in groundwater sulphate ions and mineralisation in the north and south basins of the Kashi Delta, which have not yet been comprehensively studied. We analysed the hydrochemistry and spatial variability of the major ions and identified the primary factors influencing them using graphical and multivariate statistical methods. This study provides a scientific basis for the rational development and utilisation of groundwater resources in Kashi Prefecture and guidance for the management and protection of water resources in arid and semi-arid regions.
2. Study Area
2.1. Location
The study area was in the western Tarim Basin. It was semi-enclosed in a horn-shaped basin by the West Tianshan Mountain to the north, the West Kunlun Mountain to the south, the Pamirs to the west, and the Taklamakan Desert to the east [19]. The longitude was between 75°09′42″ E and 76°15′25″ E, and the latitude was between 38°58′12″ N and 9°35′21″ N. The distances between the eastern and western and between the northern and southern boundaries of the study area were 94.0 km and 68.0 km, respectively. The total area was 6392.0 km2 (Figure 1a). The study area exhibited a typical warm temperate continental arid climate characterised by scant precipitation (63.6 mm annual average) and a high evaporation rate (2628 mm annual average) [23,24].
The study area is located at the southern boundary of the conjunction between the southwestern Snow Mountain geosyncline and the Tarim platform, and it is tectonically active. The centre of the Kumutag Mountain and the northern part of the Aketage Mountain formed the large Kumutag anticline due to the Cabarga Te-Artush extrusion uplift belt and Snow Mountain geosynclines, respectively. At the western boundary of the study area, there is a compound syncline fold belt. The Kumutag anticline can be defined as the dividing line between the Kizil-Cakmak River Basin to the north and the Gez-Kushan River Basin.
2.2. Hydrogeology
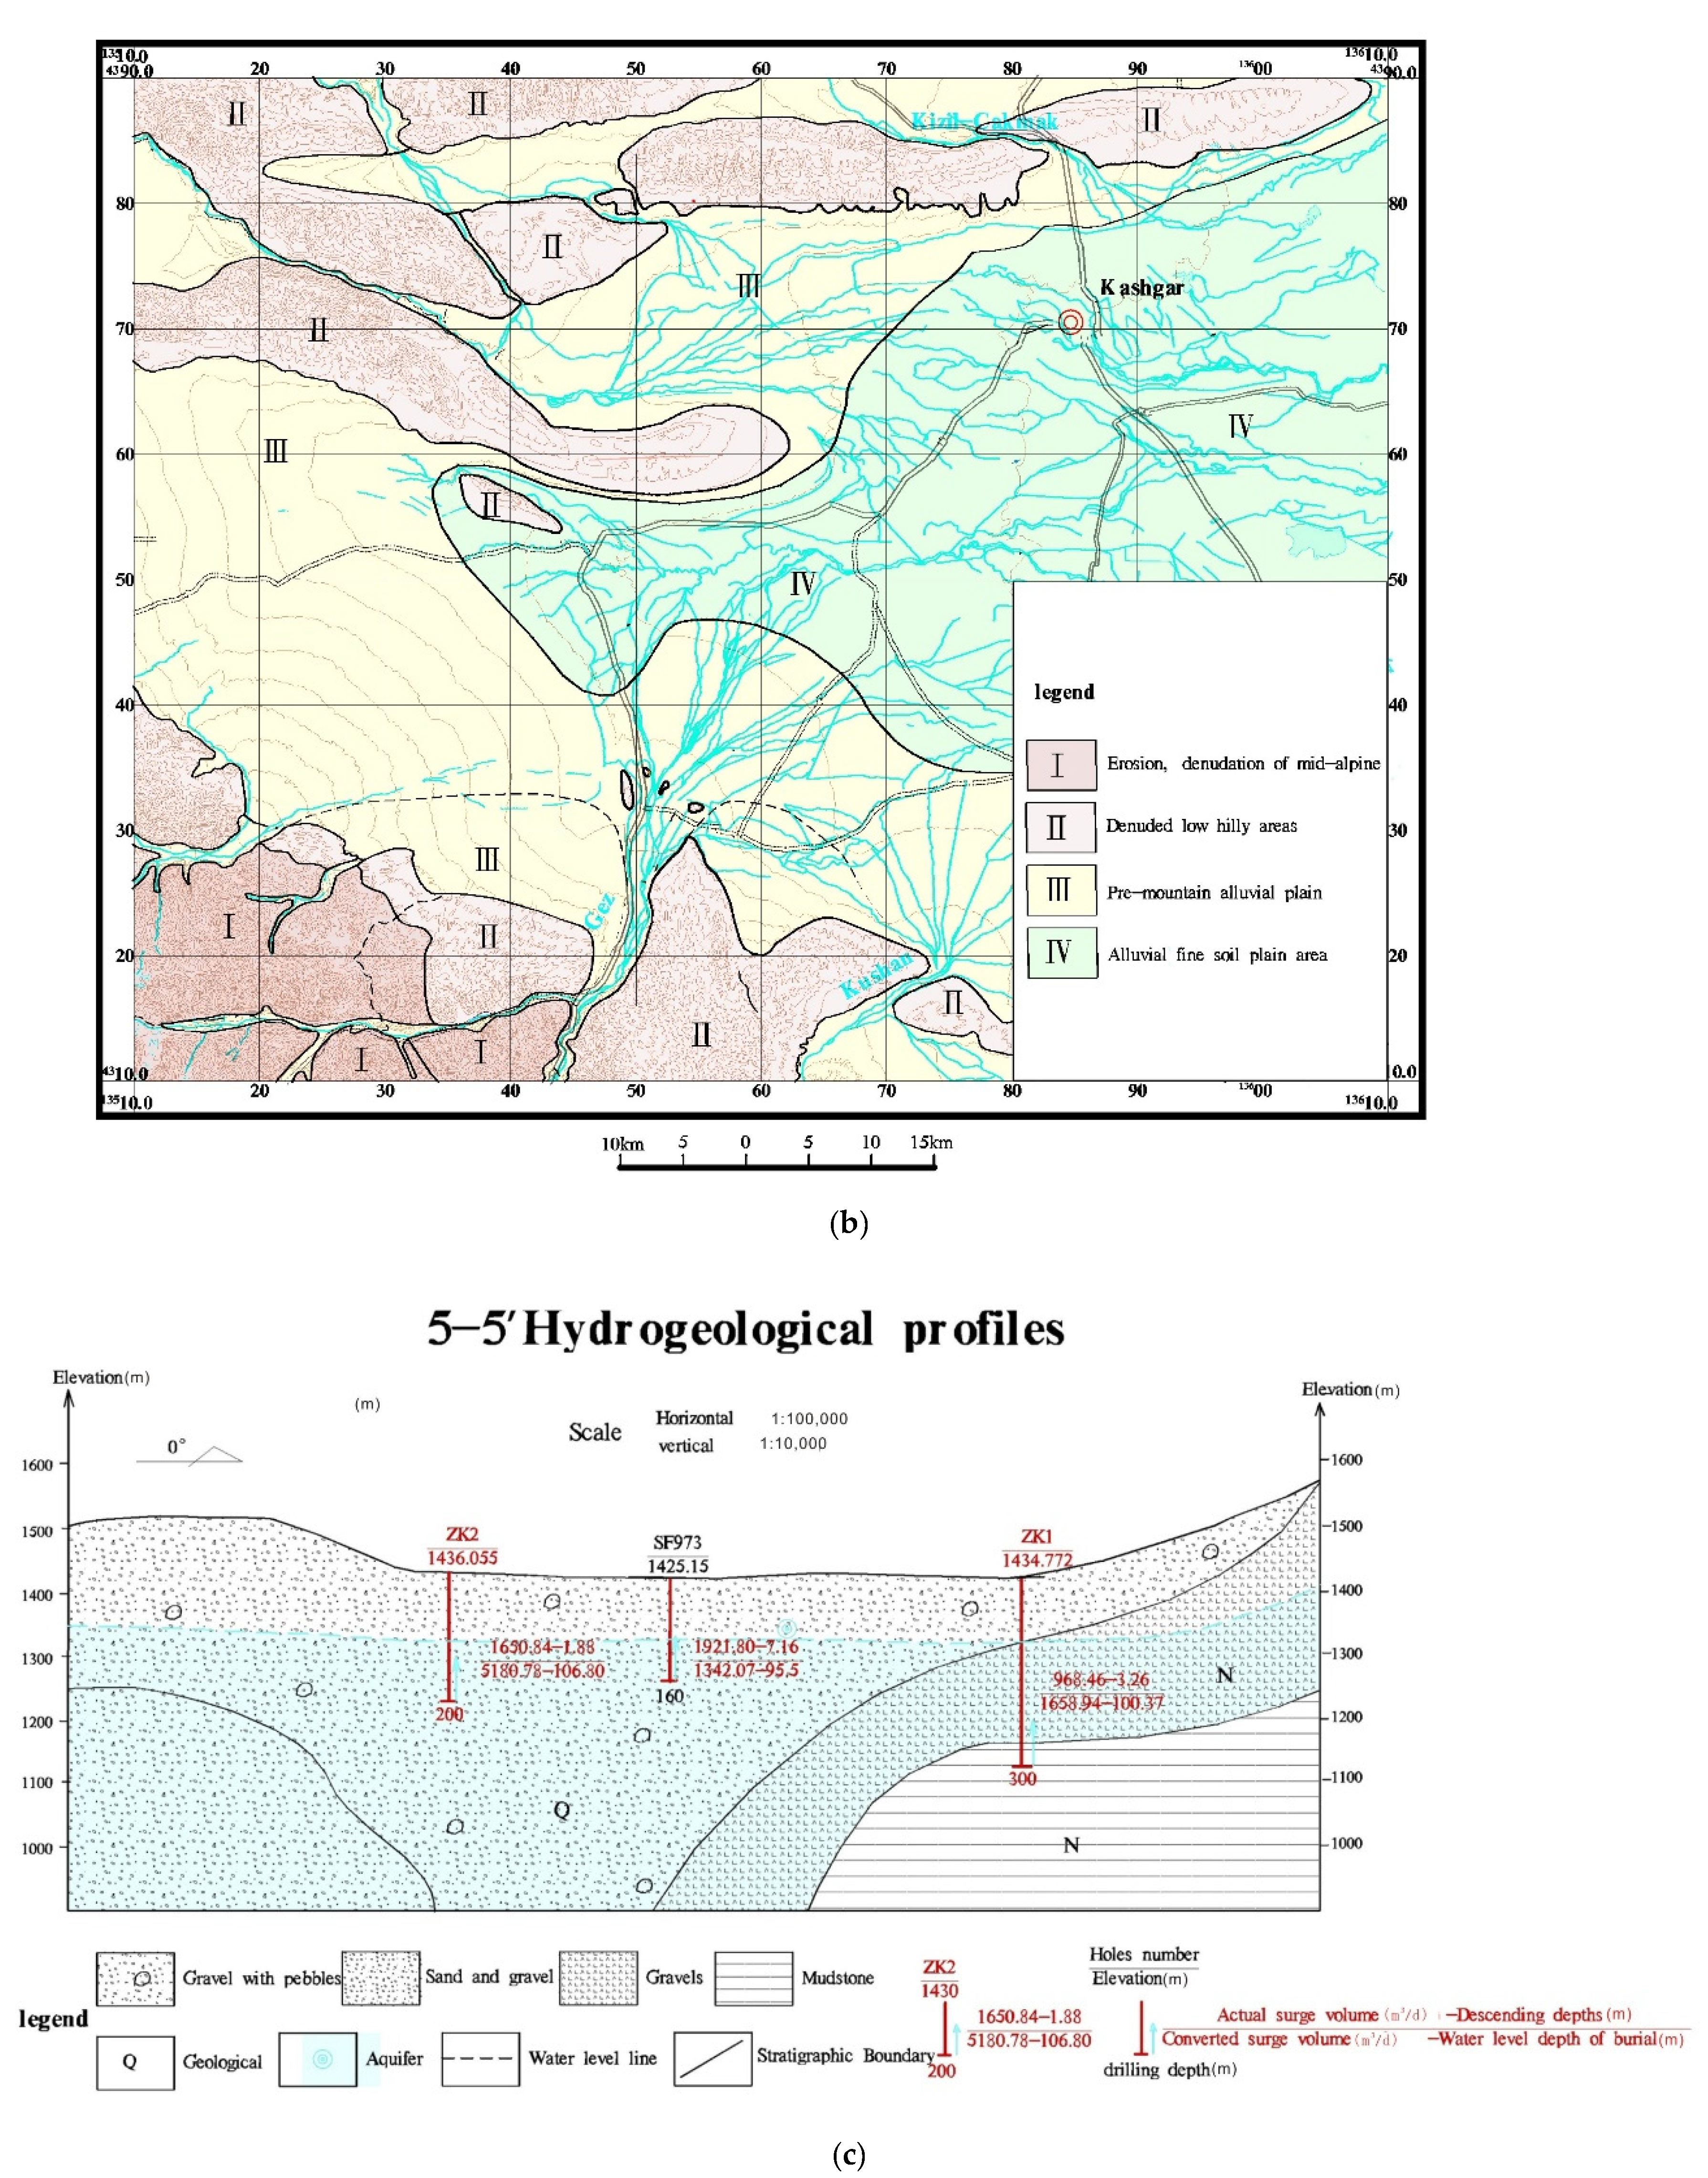
The geosphere southwest of the mountainous area primarily belonged to the Palaeozoic Erathem. To the west and north of the mountainous area, the Cenozoic strata contained small amounts of mineral salts from the Palaeogene and Neogene systems. The strata were located at the inclined piedmont plain (alluvial fan), the midstream gravel plain, and the downstream fine soil plain. They comprised Quaternary loose sediments. The Quaternary sediments in the south and west were thicker than those in the north and east of the study area. Along the piedmont fault zone, the deposition reached 2000 m in thickness and gradually decreased northward to 600 m in depth. From the piedmont alluvial plain to the downstream fine soil plain, the aquifer particles gradually changed from gravel and sand-gravel to coarse sand, fine sand, sandy loam, mild clay, and so on, and the permeability decreased accordingly (Figure 1b). The aquifer structure changed from a single-layer to a multi-layer structure. The numbers of aquifer layers and impermeable layers within them increased, whereas the thickness of each layer decreased.
The Kizil-Cakmak River Basin groundwater in the north belonged to clastic rock fissure-pore water, and there was Quaternary pore water in the loose rock. The groundwater was infiltrated and recharged by the Cakmak River in the north, the Tuman River mid-north, and the Kizil River in the west, which supplied lateral runoff infiltration, river infiltration, and subsurface recharge. The Gez-Kushan River Basin groundwater in the south belonged to the Alpine zone of bedrock fissure water and Neogene and Palaeogene clastic rock fissure-pore, and there was Quaternary pore water in the loose rock. It was primarily recharged by the lateral runoff from the upstream groundwater, piedmont rainstorm flood infiltration, river (ditch) valley undercurrent, river infiltration, and precipitation infiltration recharge (Figure 1c). The groundwater runoff condition was controlled by multiple factors, including lithology, layers, and geological structure.
The runoff condition deteriorated in the west-to-east direction. The groundwater runoff moved from both sides of the mountain to the centre of the basin in the northwest-to-southeast direction. Throughout the water circulation process, the surface water and groundwater were frequently transformed. The surface water was the primary groundwater recharge source in the study area. Under natural conditions, the predominant groundwater discharge sources were evaporation and spring discharges.
Overall, the groundwater discharge condition was influenced by hydrometeorology, topography, landforms, vegetation, lithology, and human activity. The groundwater discharge included artificial exploitation, spring discharge, evapotranspiration, and downstream discharge. Therefore, the hydrogeologic transformation trends in the Kashi region were consistent with the geological characteristics of the north-western arid region of China [25].
3. Materials and Methods
3.1. Sampling and Testing
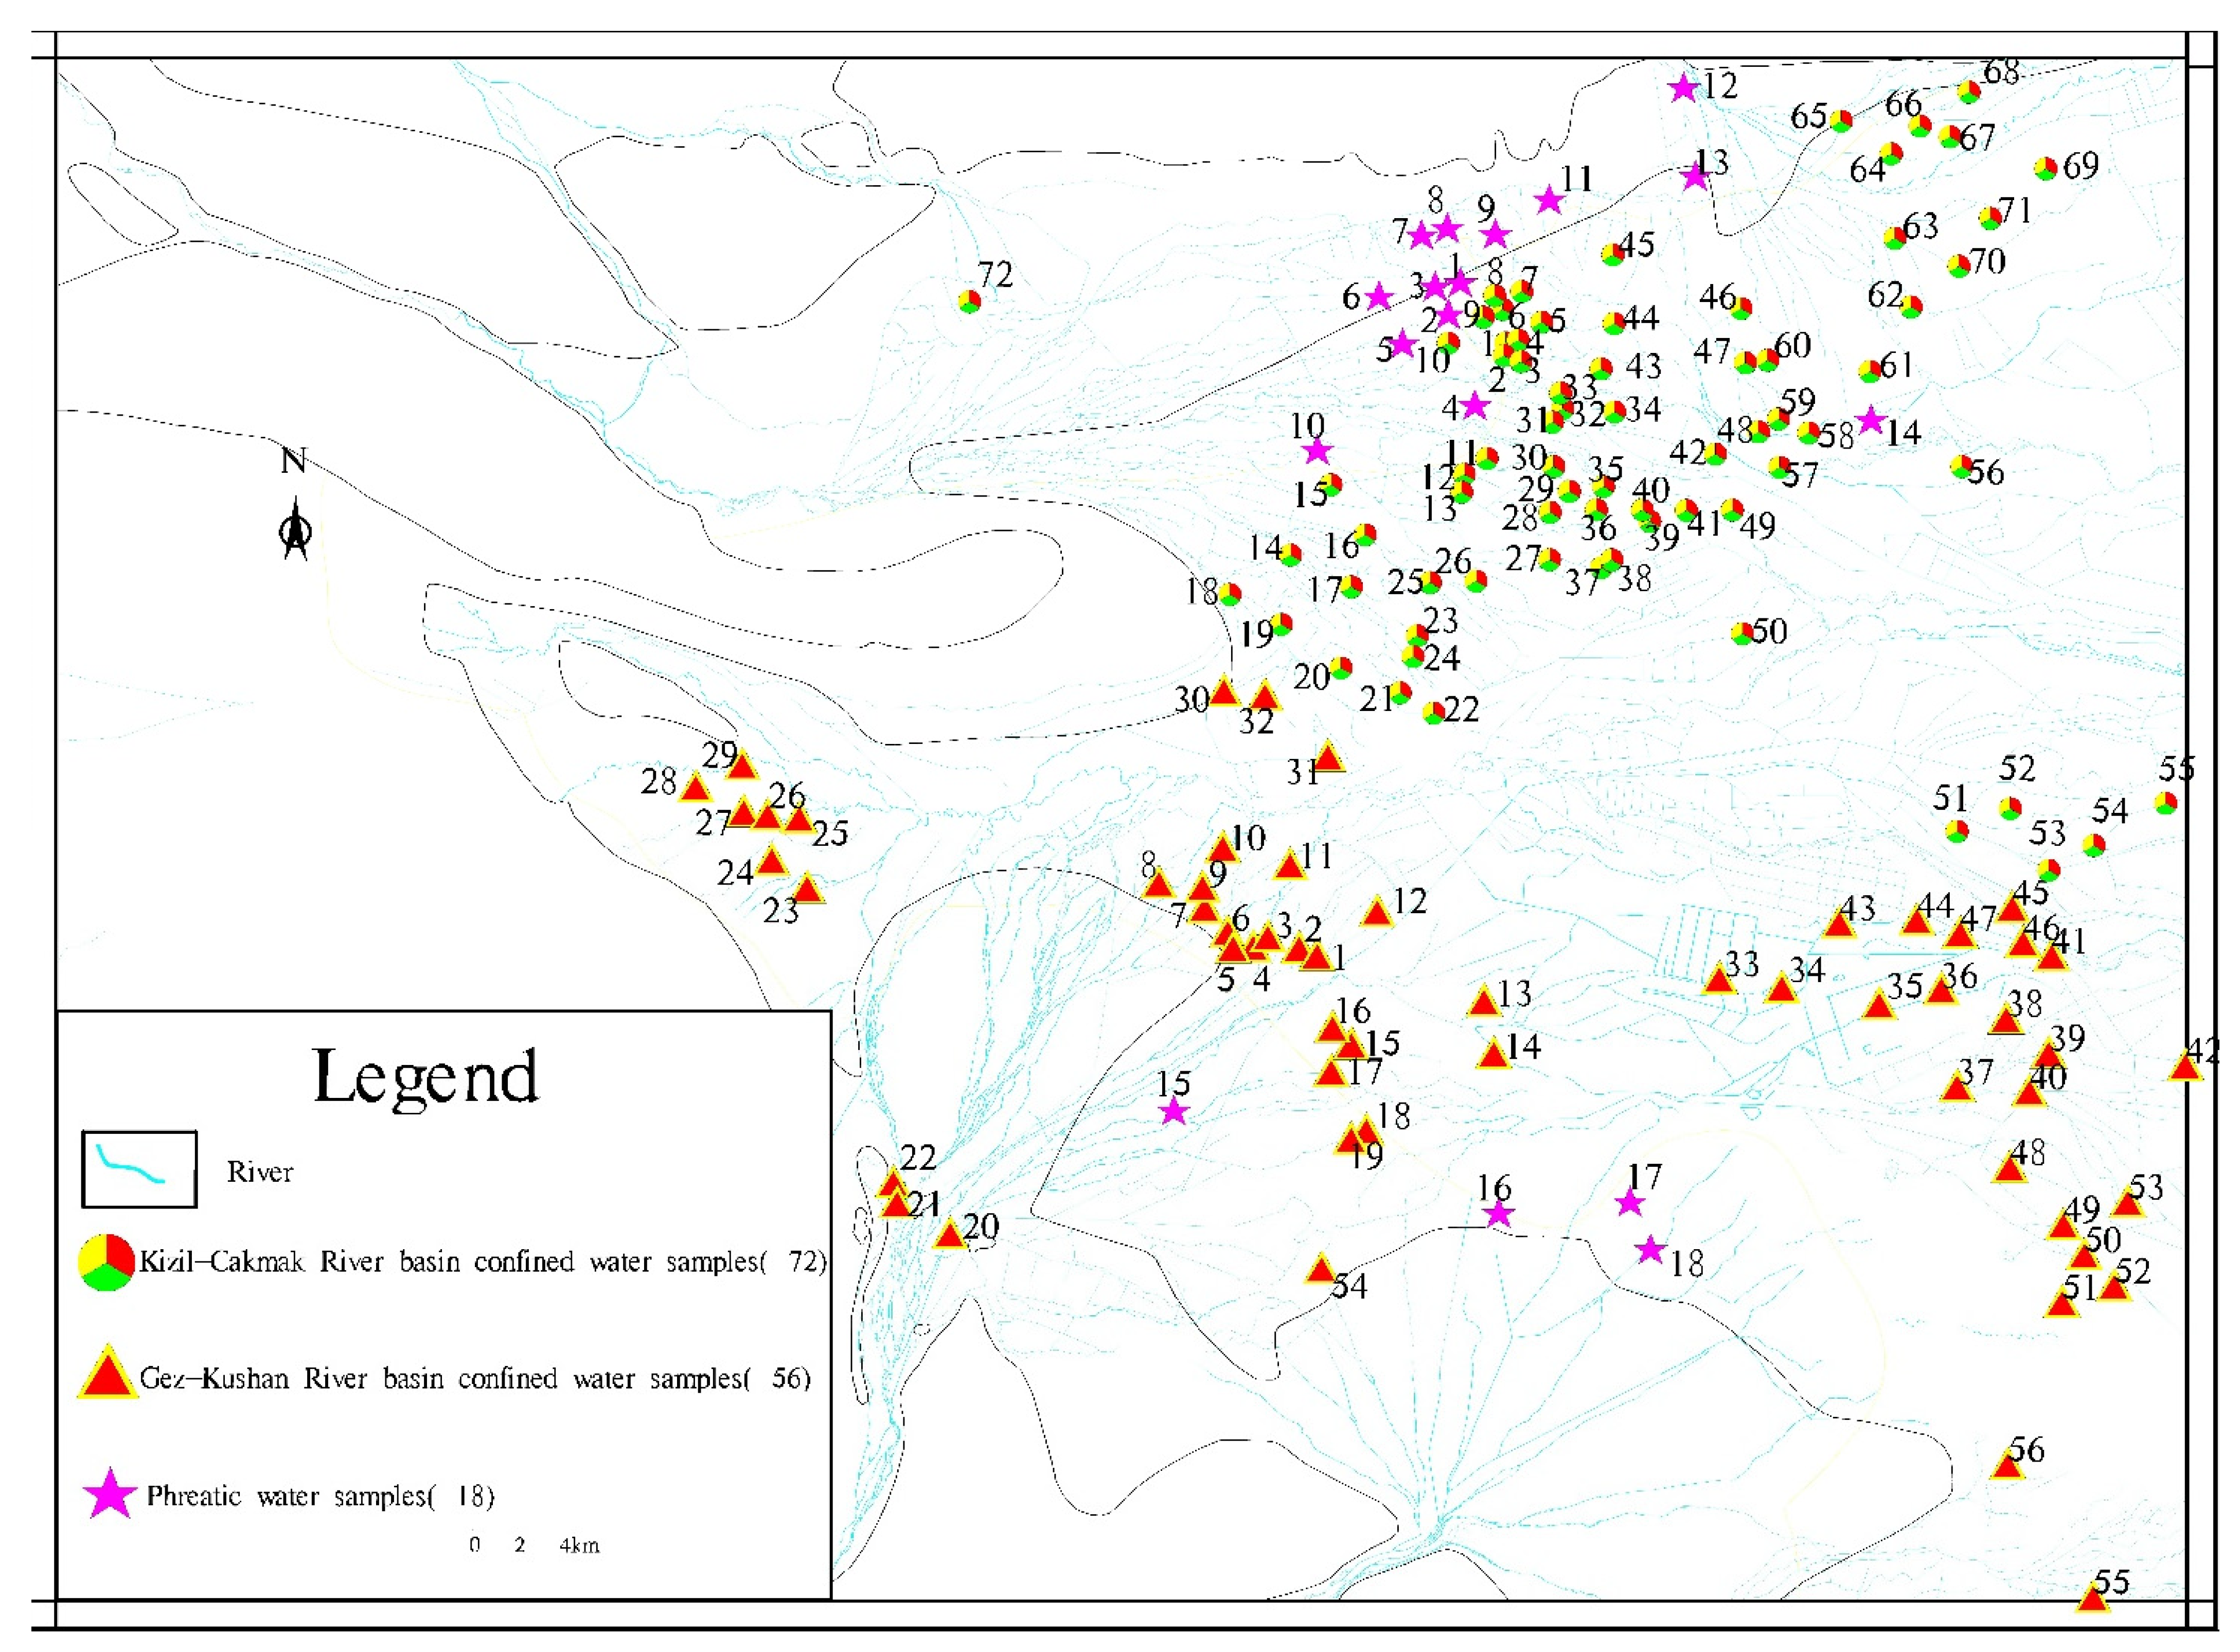
Field sampling was conducted from July 2012 to October 2012. The sampling sites were located at the basins of the Kizil, Cakmak, and Tuman Rivers in the north and the basins of the Gez and Kushan Rivers in the south. Most water samples were collected from wells intended for domestic use. There were 128 confined and 18 phreatic water samples. The locations of the sampling sites are shown in Figure 2.
Before sampling, polyethylene collection bottles 550 mL (Kangshifu Drink Co., Ltd., Tianjin, China) were rinsed 3–5 times with the groundwater to be sampled. After sampling, the bottle mouths were sealed with paraffin, and the bottles were tagged. The sampling site locations and altitudes were defined by a global positioning system (GPSMAP 621sc, Garmin Ltd., KANSAS, Olathe, KS, USA). The local topographic data were recorded in preparation for the analysis of the local ecological environment. The parameters pH (pH 610, Eutech Instruments Pte. Ltd., SanFrancisco, CA, USA) and electrical conductivity were measured onsite (TDS 6+, Eutech Instruments Pte. Ltd., SanFrancisco, CA, USA). All of the other parameters were measured by the second hydrogeological team at the laboratory of the Bureau of Geology and Mineral Resource in Xinjiang, China. The test methods included K+ and Na+ determination via flame atomic absorption spectrophotometry, Ca2+ and Mg2+ determination via Na2−EDTA titration, F− determination through ion-selective electrode method, Cl- determination via silver nitrate volumetric method, HCO3− and CO32− determination through acid–base titration, NO3− determination through ultraviolet spectrophotometry, SO42− determination via barium sulphate turbidimetry, NH4+ determination via the Kjeldahl nitrogen method, and total dissolved solids (TDS) determination via desiccation-gravimetry at <105 °C [26,27,28]. For the analyses, the quality control threshold range was ±5% for the replicates, and the replicate sample error was <5%.
3.2. Research Methods
3.2.1. Hydrochemical Type
Based on the collected data, Aquachem version 4.0 hydrochemistry software (Aquachem version 4.0 hydrochemistry software. Available online: https://aquachem.software.informer.com/4.0/, 2 April 2020) was used to plot tri-linear diagrams, and the Shug Kalev method [15] was used to classify the groundwater hydrochemistry. The quantities of HCO3−, SO42−, Cl−, Ca2+, Mg2+, and Na++K+ were measured and recorded. Na+ and K+ were combined as the latter was detected only in trace amounts. When the mg equivalent weight of an ion was in the range of 45–70% of the total isotropic ion mg equivalent weight or a mg equivalent weight > 70%, the ion was considered major. A mg equivalent weight in the range of 25–45% indicated a secondary ion, and a mg equivalent weight < 25% indicated a non-participating ion [22,29,30].
3.2.2. Kriging Interpolation Method
The spatial distributions of hydrochemical components were categorised and elucidated using the level zoning method. This approach reveals the variability trend of each hydrochemical type and the mechanisms through which the hydrochemical components are formed. Kriging is a useful geostatistical gridding method that is widely applied in groundwater simulations, soil mapping, and so on. It considers the variability distribution of the spatial attributes at a location to determine the influence range of the value to be interpolated. It then estimates the properties of the value using a sampling point within the range. Afterward, it considers the geometric characteristics, such as shape and size, the mutual spatial position of the samples, and the spatial structure. Finally, it assigns a coefficient to each sample and uses a weighted average to estimate the block grade. The purpose of this method is to obtain a linear, unbiased, and minimum variance of estimation. Kriging was utilised in this study when sampling sites were inaccessible because of poor road conditions.
3.2.3. Multivariate Statistical Analysis
Multivariate analysis is a statistical method. It extracts critical information from a large amount of data and discloses the predominant features of the system. It can simplify the original variables and reveal the most critical original information. Descriptive, correlation, and principal component analyses are typically used in the hydrochemical field [31,32]. A descriptive statistical analysis was used to clarify the hydrochemical characteristics of the study area, including the maximum and minimum values and the coefficient of variation. A correlation analysis was used to quantify the correlations among the hydrochemical variables. The correlation level was determined by calculating the correlation coefficient r [16]. When r ≥ 0.8, the parameters were highly correlated. When 0.5 ≤ r < 0.8, the parameters were considered moderately correlated. When 0.3 ≤ r < 0.5, the parameters were considered weakly correlated and were considered not correlated when r < 0.3. Distributions of the primary hydrochemical variables, such as the eight conventional ions, pH, and TDS were strongly influenced by their interactions. A principal component analysis was also utilised to identify the most influential hydrochemical parameters (SPSS 20.0, IBM, Armonk, NY, USA).
4. Results
4.1. Hydrochemical Characteristics
We subjected 146 groundwater samples from the Kashi region to hydrochemical parameter analysis. Table 1 and Table 2 illustrate the approximate enrichment and variation trends for each chemical component [33]. The unit for all of the hydrochemical parameters except pH is mg/L.
The pH range of the groundwater upstream and midstream of the southern basin was 7.37–8.45. Hence, the water was alkaline. However, the pH of the groundwater downstream of the southern and northern basins was acidic due to high SO42− and Cl− concentrations.
Ca2+ was the primary cation upstream and midstream of the southern and northern basins. At these locations, the ranking of the mean cation concentrations from high to low was Ca2+ > Na++K+ > Mg2+. Na++K+ were the primary cations downstream of the southern basin, and the ranking of the mean cation concentrations from high to low was Na++K+ > Mg2+ > Ca2+.
The mean TDS in the northern basin of the Kashi region was 2159.57 mg/L. This value was four times higher than that of midstream and upstream of the southern basin and twice that of downstream of the southern basin.
The HCO3−, NH4+, NO3−, and F− concentrations in the groundwater upstream and midstream of the southern basin exhibited small coefficients of variation. In contrast, the concentrations of the foregoing ions in the groundwater downstream of the southern basin (fine soil plain) showed larger coefficients of variation.
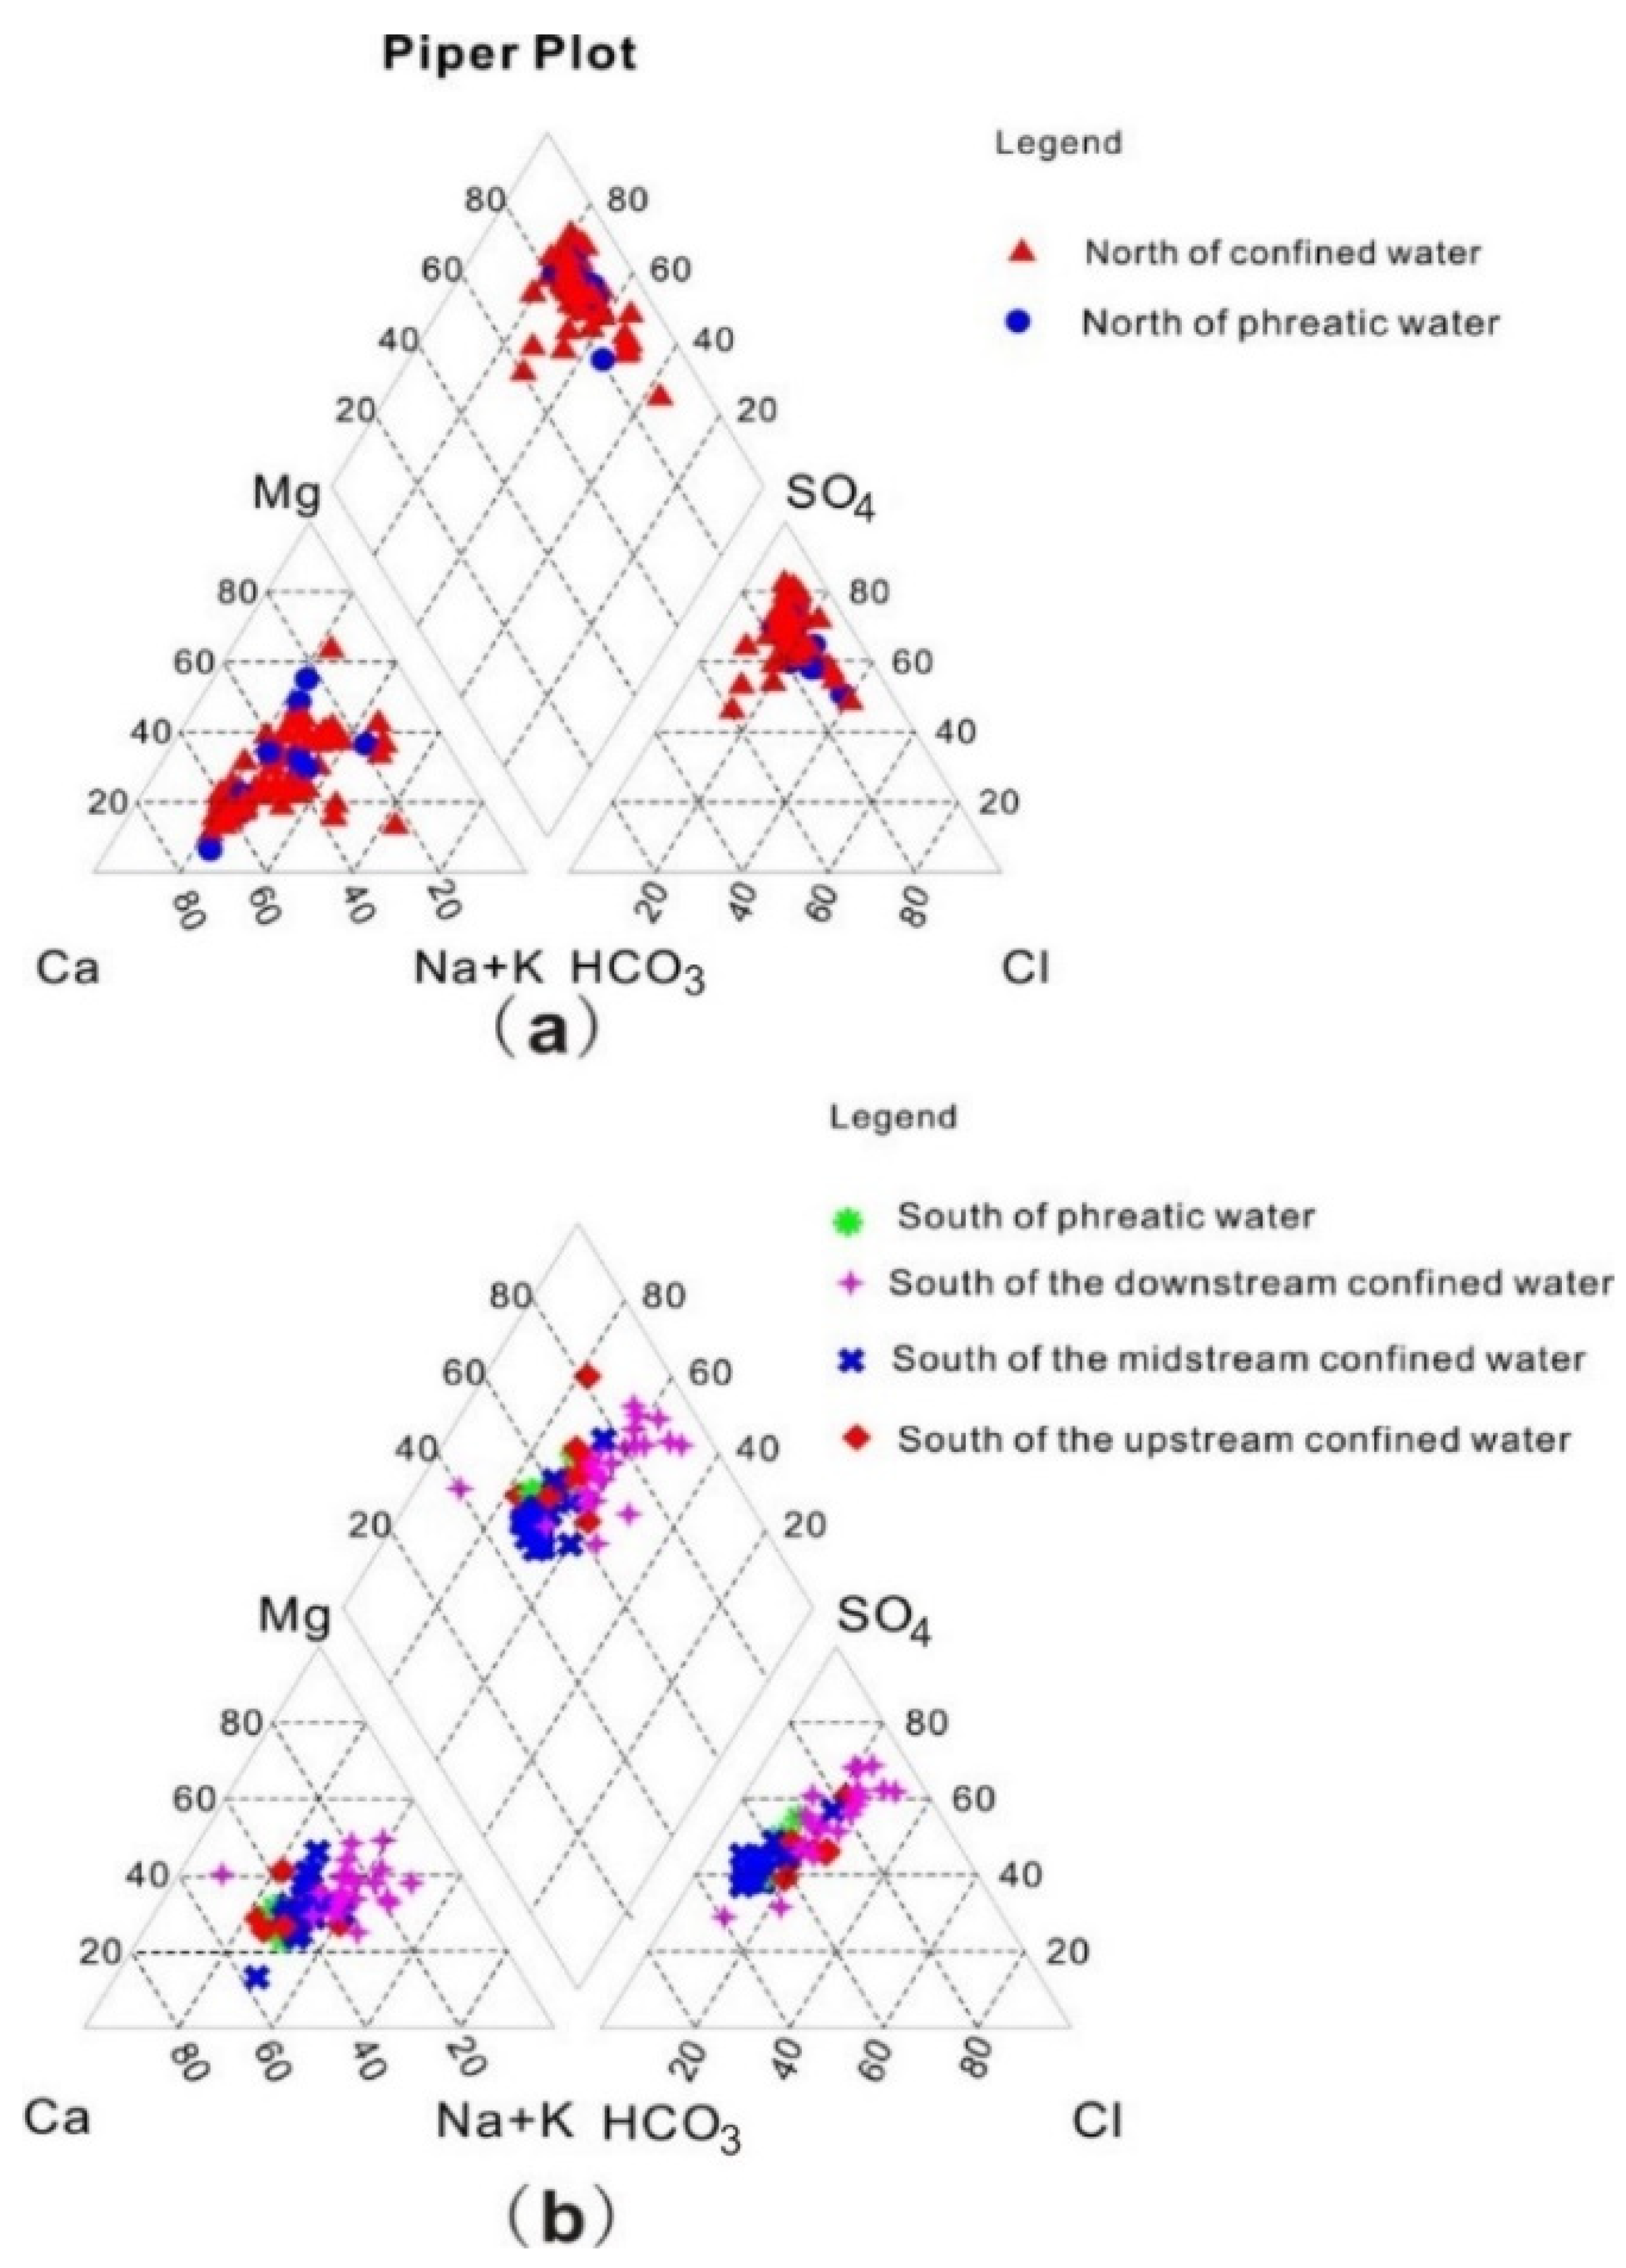
Analyses of the hydrochemical characteristics and their evolutionary trends [33,34,35] in the northern and southern basins of the Kashi region (Figure 3) were based on the Piper tri-linear diagram method. The results revealed that Ca2+ was the primary cation in the confined and phreatic waters of the Kizil-Cakmak River Basin. Ca2+ accounted for ~80% of the total cations, followed by Mg2+ and Na+ (Figure 3a). The primary anion was SO42−, which accounted for ~80% of the total anions, followed by HCO3−.The cation and anion distributions were centralised, and the hydrochemical types of the sampling site (SO4-Ca and SO4-Mg·Na·Ca) were simple. The ion distributions were centralised in the upper right corner of the rhombus. Thus, the non-carbonate hardness (secondary salinity) was >50%. Compared to the ion distribution in the northern basin, the southern Gez-Kushan River Basin exhibited a dispersive ion distribution (Figure 3b).
The groundwater runoff environment upstream of the southern basin (recharge area) was good. It had a high velocity and short detention time. The soluble components such as Cl−, K+, and Na+ in the aquifer were leached and removed by runoff. The primary groundwater cations were Ca2+ and Mg2+, whereas the predominant groundwater anions were HCO3− and SO42−. Overall, they formed the HCO3·SO4-Ca·Mg hydrochemical type with low salinity. In the midstream (runoff) area, the primary cations were Ca2+, Mg2+, and Na+, and the predominant anions were HCO3− and SO42−.
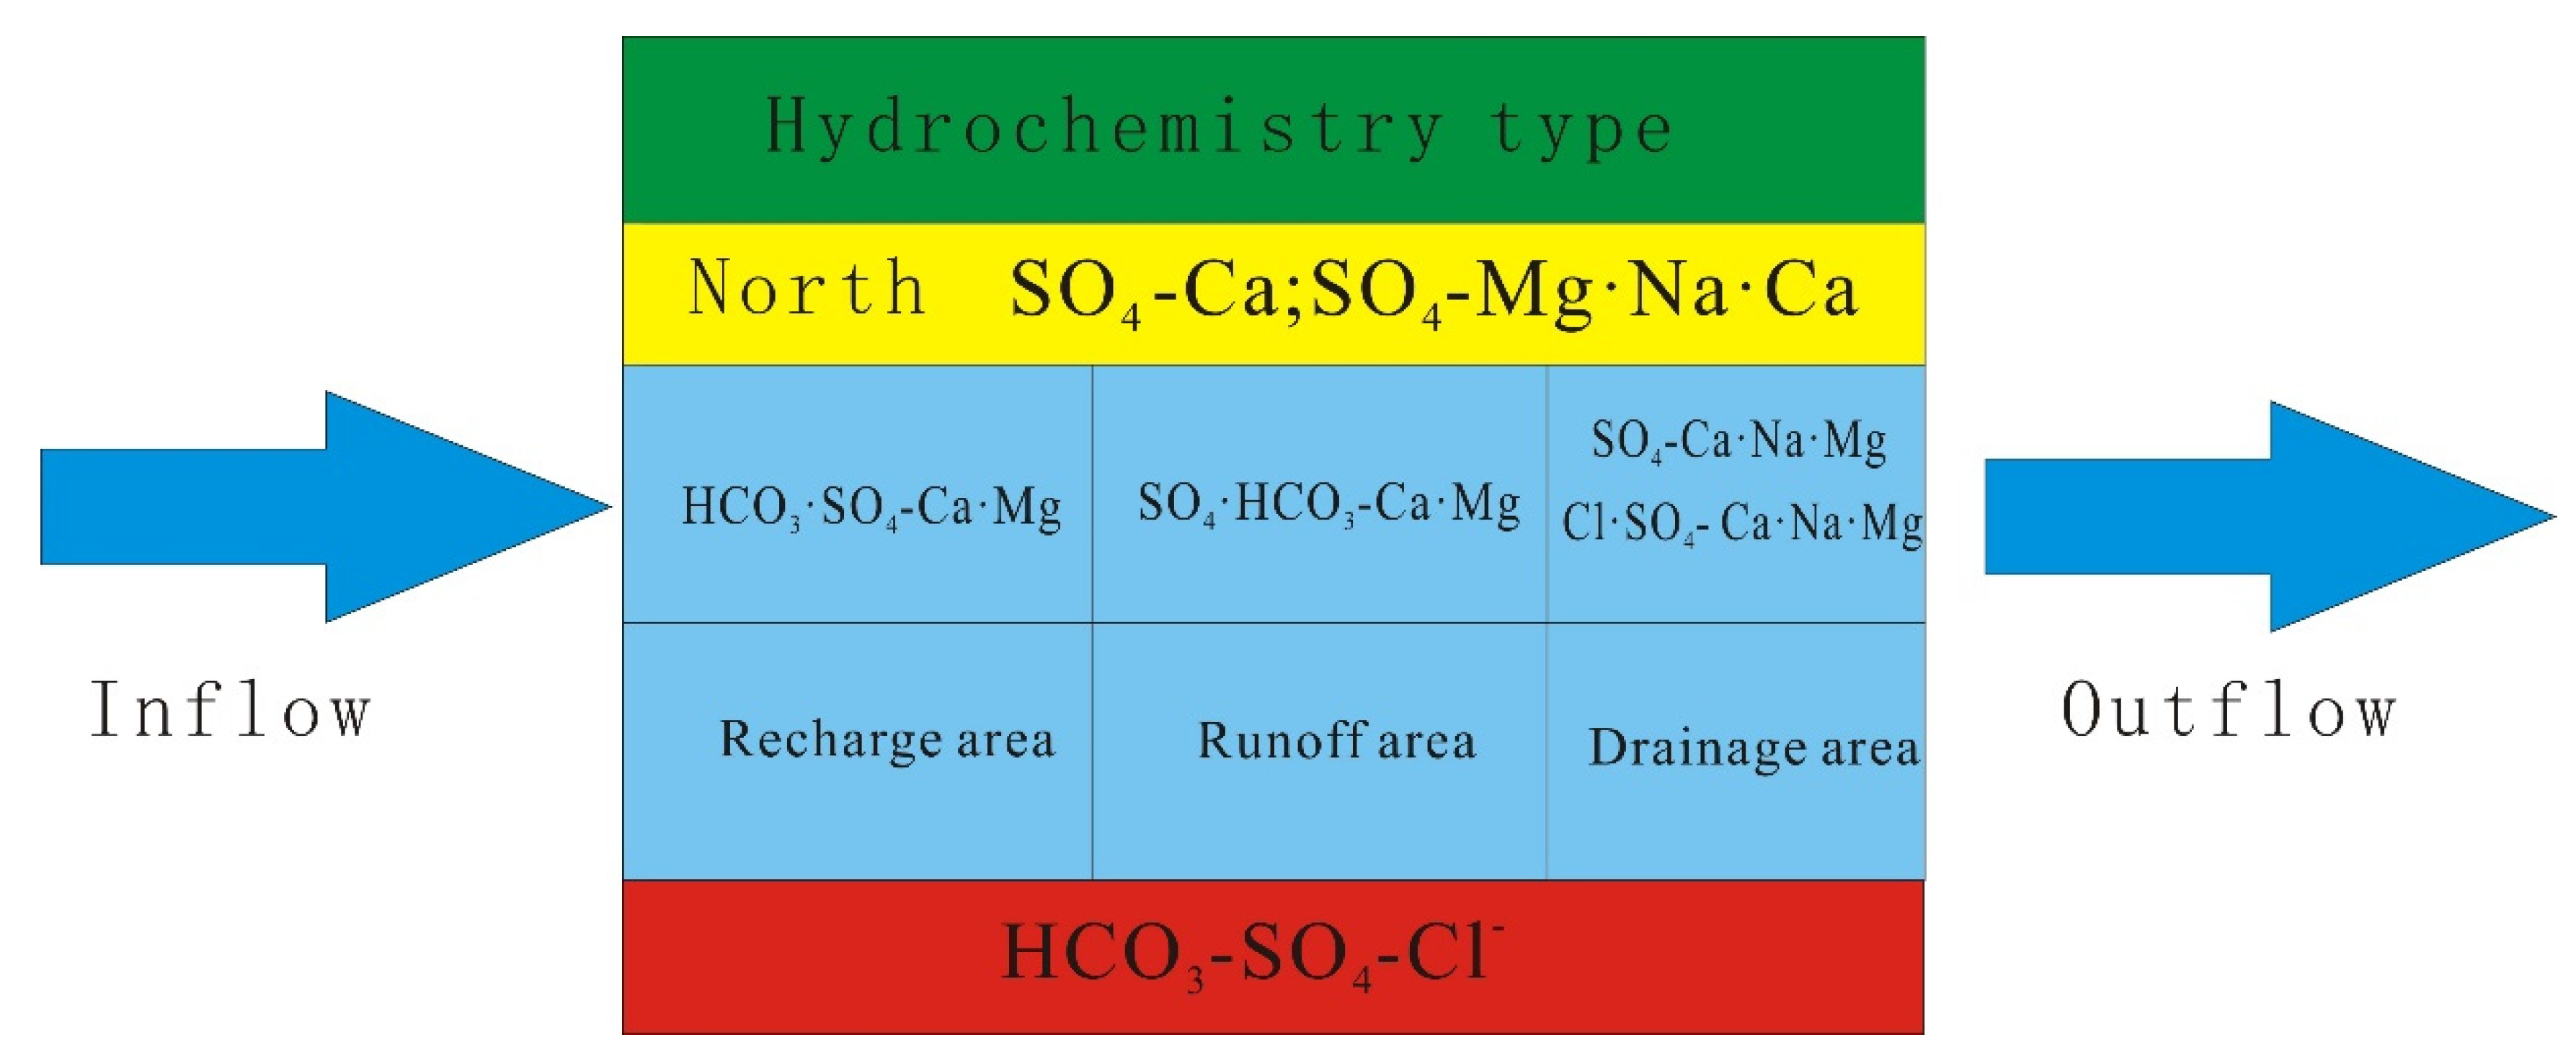
The hydrochemical type in the midstream was SO4·HCO3-Ca·Mg. From the runoff to the discharge area, the primary reactions between the groundwater and the exterior were evaporation and leaching, which increased the pH and salinity. Therefore, the ion distribution downstream (discharge area) comprised the cations Na+, Mg2+, and Ca2+ and the anions SO42− and Cl−. They formed the SO4-Ca·Na·Mg hydrochemical type with moderate salinity and the Cl·SO4-Ca·Na·Mg hydrochemical type with high salinity. Most of the ions were distributed in the centre of the rhombus. Therefore, the carbonate hardness (secondary alkalinity) was >50%. The hydrochemical profile included alkaline earth metal cations and weak acids. The analyses revealed that the hydrochemical type of the entire study zone, from the recharge to the drainage area, demonstrated the following trend: HCO3−→SO42−→Cl− (Figure 4) [22].
4.2. Spatial Distribution of Hydrochemical Parameters
Kriging is an optimal, linear, and unbiased geostatistical spatial interpolation method. It assigns a weight coefficient to each observation datum and calculates the estimated value from the weighted average while accounting for the interrelations among the observation data points. Here, we analysed the study area using SURFER version 11.0 software (SURFER version 11.0 software. Available.online: https://surfer.software.informer.com/11.0/, 5 May 2020) according to the Kriging interpolation theory. The spatial distribution maps of the confined water in the northern and southern basins of the Kashi region were plotted using SURFER version 11.0 [36,37].
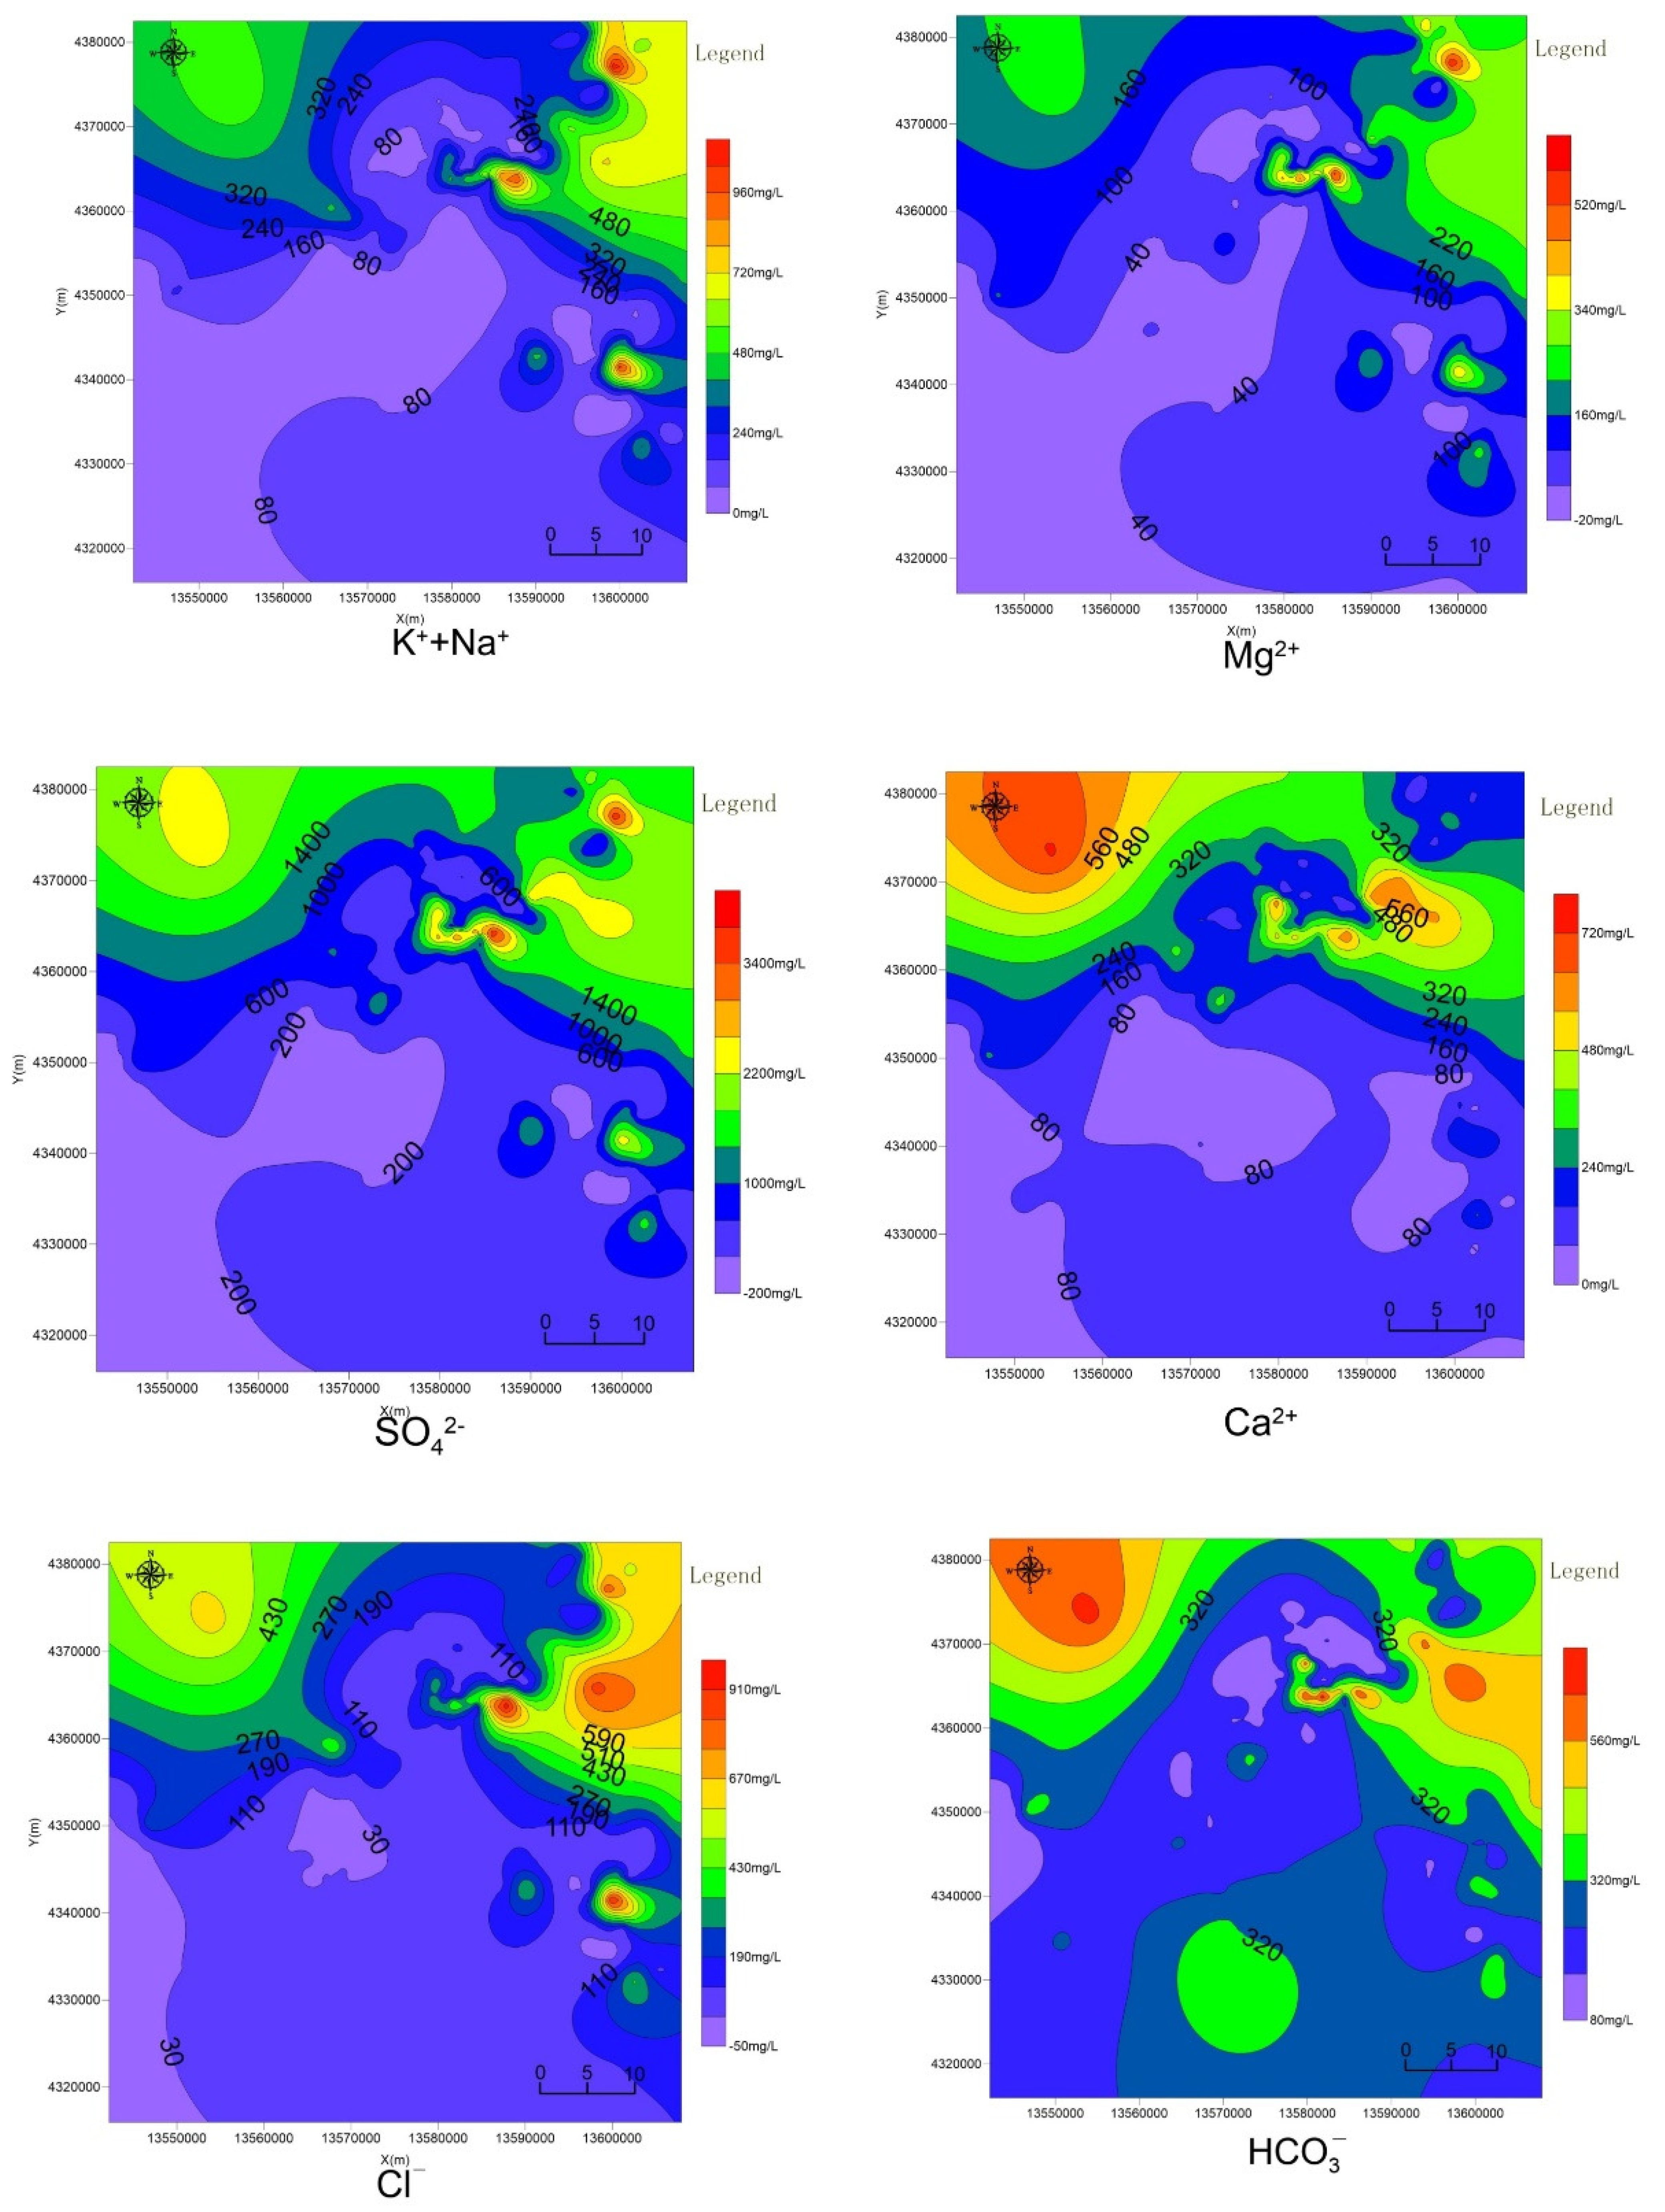
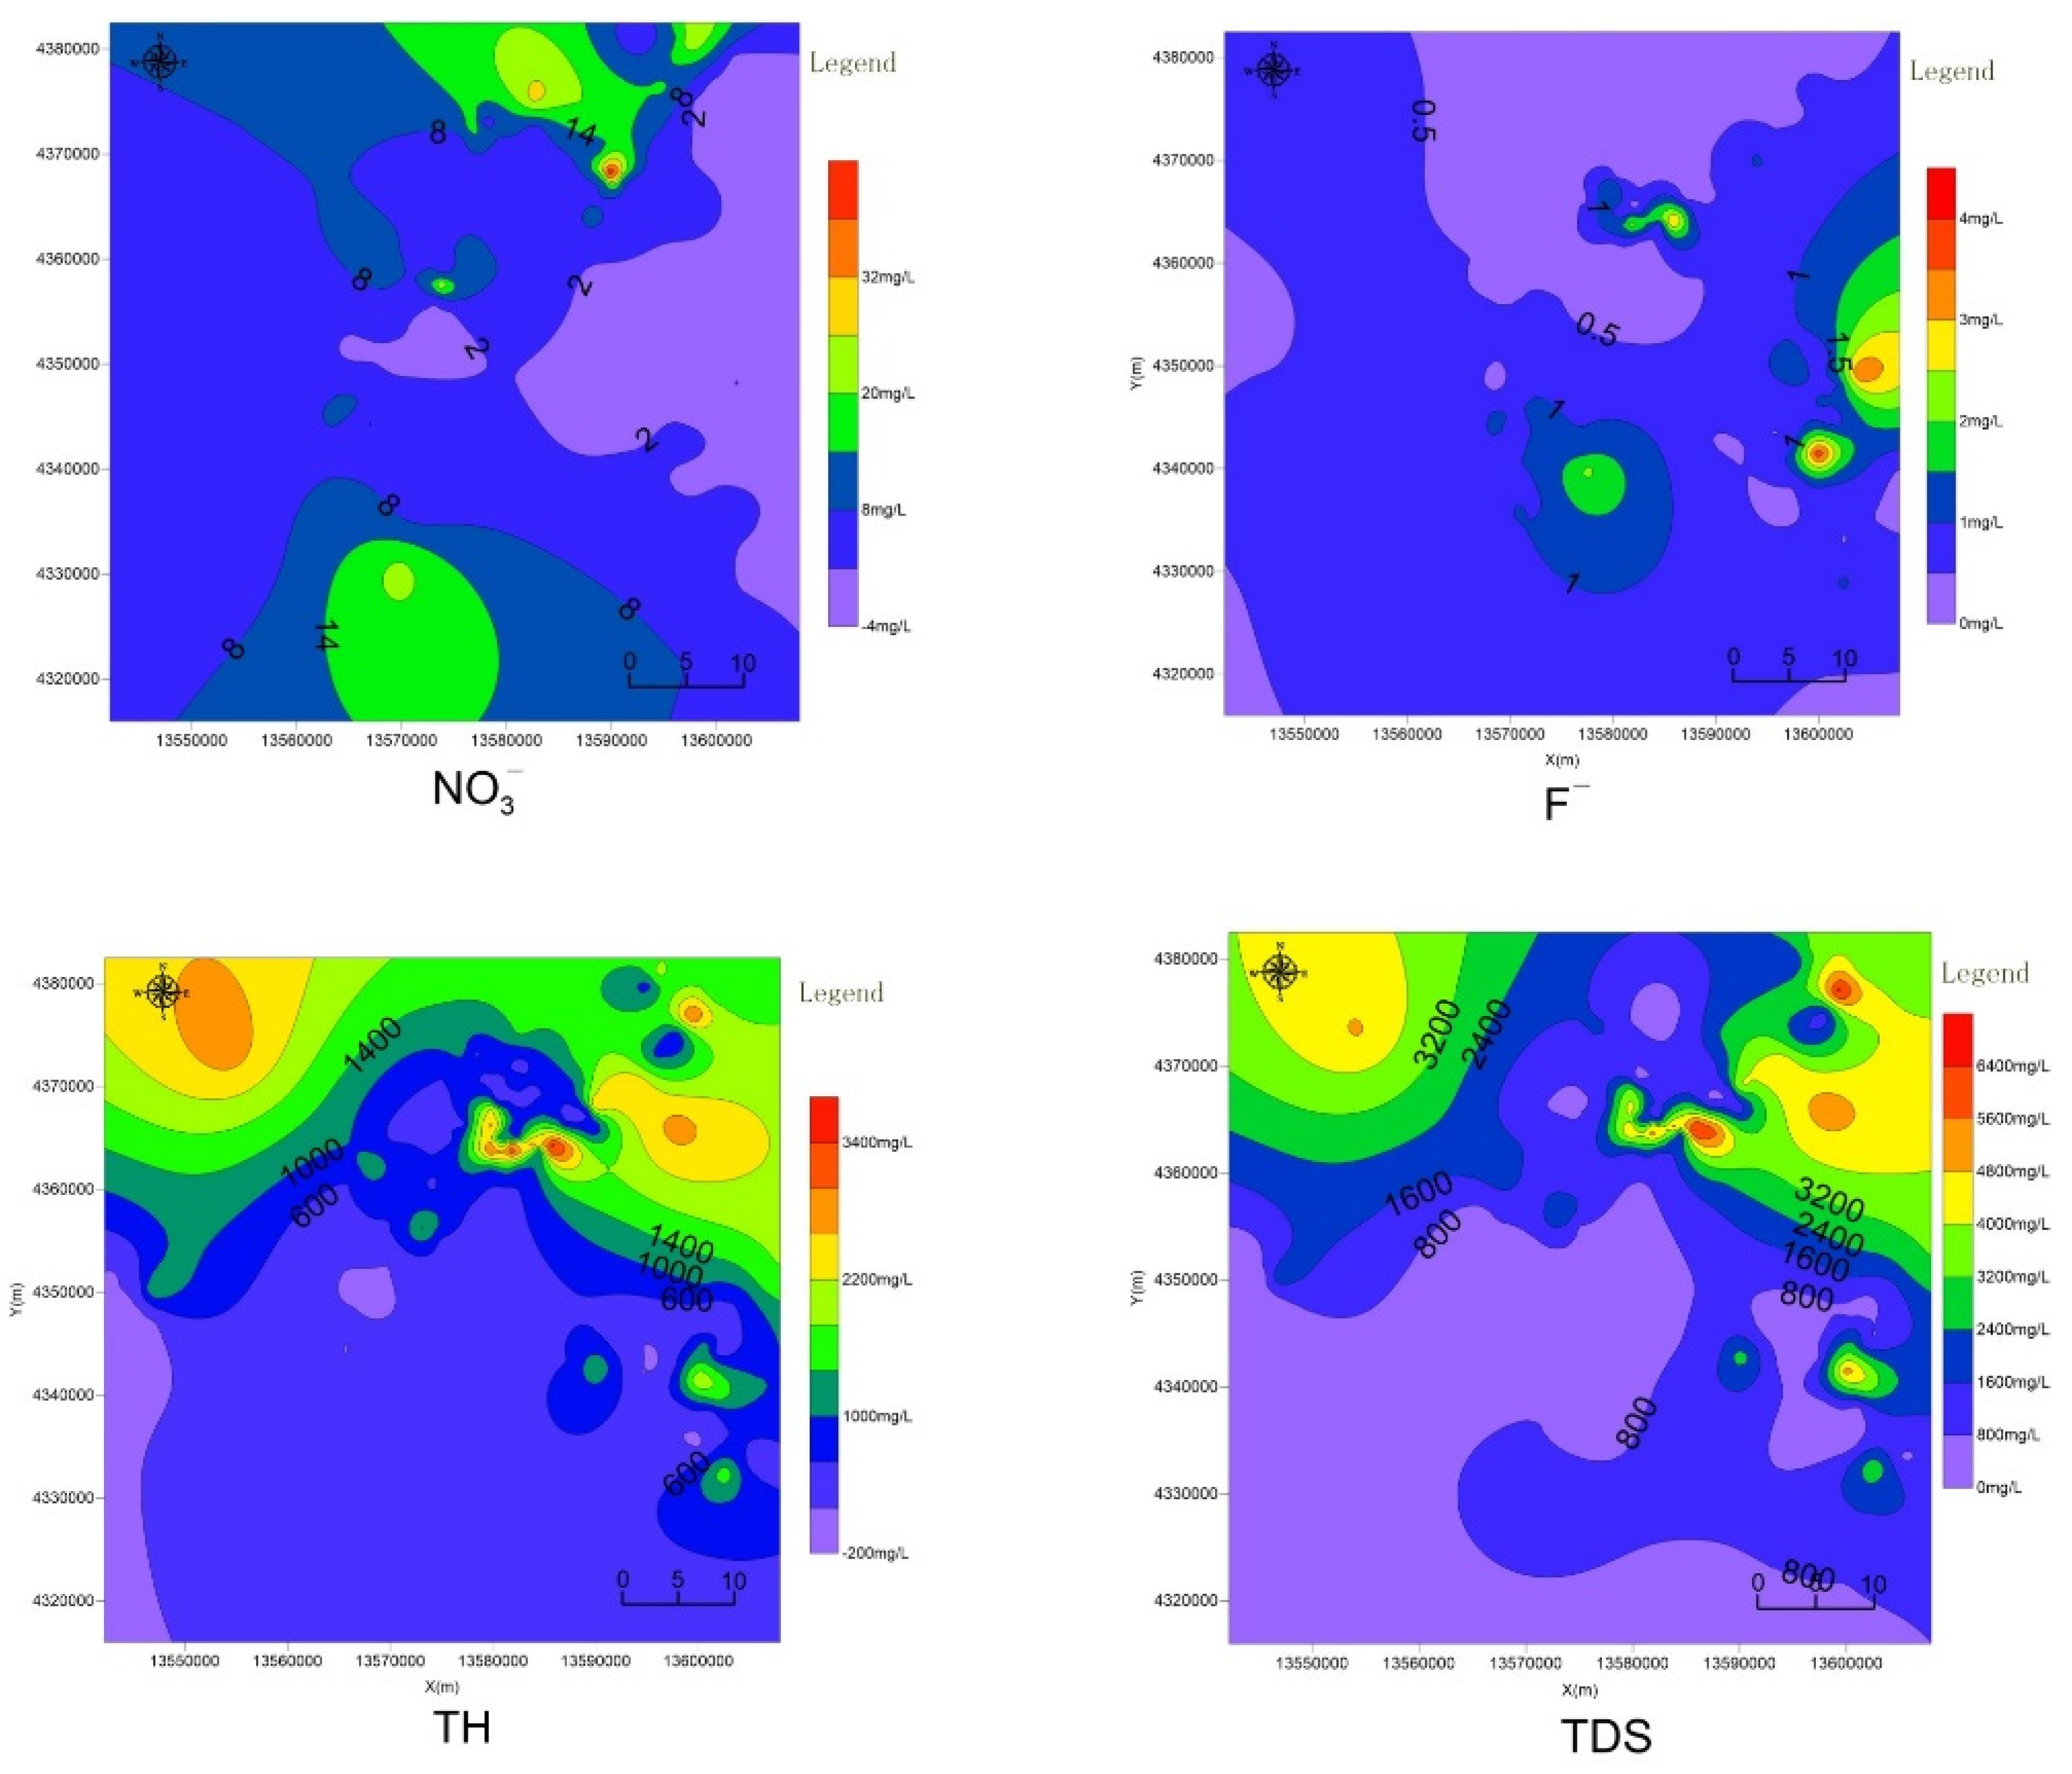
Figure 5 demonstrates that Ca2+, SO42−, and Mg2+ varied in a pattern similar to that of TDS. The hydrochemical type determined by the Piper chart analysis also indicated that the variation in TDS was due to the changes in the Ca2+, SO42−, and Mg2+ ion concentrations. The HCO3− concentration was elevated in the southern recharge area of the Gez-Kushan River Basin because the maroon stratum in the northern part of the region was rich in soluble salts. However, studies on TDS distribution patterns revealed that the recharge area exhibited HCO3−-type water with low salinity. This discovery matched the result of our hydrochemical analysis. The K+ and Na+, Cl− concentrations exhibited similar variability patterns downstream of the southern basin where the evaporation rate was high. Figure 5 illustrates that the total hardness (TH) distribution patterns (counted as CaCO3) resembled those of the TDS. Based on the TH, groundwater was classified as soft water (<150 mg/L), moderately hard water (150–300 mg/L), hard water (300–450 mg/L), and very hard water (>450 mg/L). Therefore, the groundwater in the Kashi region was classified as very hard [4].
Overall, the variability in the hydrochemical parameters was larger for the northern basin than the southern basin. The southern basin exhibited clear landform zoning, rapid runoff, and sufficient water circulation. Thus, its hydrochemical parameters were stable. While the topography of the northern basin was flat, the runoff speed was low, and the water circulation was poor. Furthermore, the groundwater was affected by human activity. These factors combined made the hydrochemical components complex. The spatial distributions of parameters such as the ion concentrations, TH, and TDS in the southern basin of the Gez-Kushan River were narrower than those of the northern basin of the Gez-Kushan River. The hydrochemical parameters tended to decrease from north to south and from the mountain front to the basin [38].
5. Discussion
5.1. Natural and Geographical Factors Affecting Spatial Distributions of Hydrochemical Parameters
5.1.1. Topographic Factors
The study area was in the western Kashi region (Figure 2). This area comprised the piedmont alluvial plain, gravel plain midstream, and fine soil plain downstream. The topography was flat, and the runoff velocity and groundwater exchange intensity were low. The study area was conducive to dissolving and accumulating ions and increasing groundwater salinity and hardness. This phenomenon primarily occurred in the northern basin and downstream of the southern basin [21].
5.1.2. Hydrological Factors
In the study area (Figure 1), the northern basin groundwater was primarily recharged by runoff from the Kizil, Cakmak, and Tuman Rivers, whereas the southern basin groundwater was predominately recharged by lateral infiltration from the upstream and piedmont flood infiltration, with a frequent exchange between the surface water and groundwater [21]. The river hydrochemistry determines the groundwater type. The Kizil River contains sulphuric acid-type water. According to the Piper tri-linear diagrams, the groundwater in this area exhibited high Ca2+ and SO42− concentrations. Thus, these ions had comparatively stable concentrations in the groundwater.
5.1.3. Climatic Factors
The Kashi region has scant precipitation and intense evaporation. Thus, the evaporation and concentration effects were strong. The groundwater in the southern basin was shallow. The salinity increased with an increase in the solution concentration. Additionally, the potential energy of the phreatic water decreased, which caused recharge from the confined water to the phreatic water. As the water evaporated, abundant salt moved to the surface soil and caused secondary soil salinisation. After human interventions such as flood irrigation, the soil salinity returned to the unconfined aquifer, and the phreatic water salinity increased. As the salt ions continued to infiltrate, the confined water salinity increased.
5.2. Hydrochemical Type Formation Mechanisms
5.2.1. Correlation Analysis
A correlation analysis is a statistical method that evaluates the associations among random dependent variables [39]. Here, SPSS version 20.0 (IBM Corp., Armonk, NY, USA) was used for the correlation analysis of confined water sampling. The results are shown in Table 3 and Table 4.
There were strong correlations between Mg2+ and SO42−, between Ca2+ and SO42−, and between Na++K+ and Cl− downstream of the southern and northern basins. Hence, the influence of the primary environment dominated in the northern basin. When chlorate and sulphate are in the water, all present cations are positively correlated. The groundwater flows through the recharge area downstream of the southern basin and enters the discharge area. Thus, these salt rock ions are enriched and highly correlated. Upstream and midstream of the southern basin (Table 3), there were strong correlations among HCO3−, Mg2+, and Ca2+. In the northern basin, there were strong positive correlations among TDS, Mg2+, Ca2+, Na++K+, SO42−, and Cl−. Therefore, the ions greatly contribute to the TDS downstream of the northern and southern basins. Additionally, as both basins exhibited poor runoff, there were high TDS. Upstream and midstream of the southern basin, there were strong correlations among TDS, Ca2+, HCO3−, and SO42−. Hence, the ions primarily contributed to the TDS. However, the salinity was low, as there was sufficient runoff upstream and midstream of the southern basin.
Downstream of the southern basin, there was a strong correlation between Ca2+ and Na++K+, which was possibly because of the intensive human activity there. Therefore, these ions are indices sensitive to human activity and major variables that influence groundwater salinity. In order to increase the yield of crops in the region, irrigation is carried out with large amounts of nitrogen, potash, and compound fertilizers. Irrigation water recharge has raised the groundwater table, and the resulting strong evaporation effect has enhanced the salinity of the shallow groundwater. Heavy irrigation brought strong cation exchange and adsorption in the downstream fine soil plain, hardened the soil, and influenced its permeability. In cation exchange and adsorption, groundwater particles adsorb and transform certain cations that were previously adsorbed to other groundwater components. Ca2+ is the primary cation in the gravel plain midstream of the northern and southern basins (Table 3), while Na+ is the primary cation downstream of the northern and southern basins. The aquifer particles are sandy loam and mild clay and are conducive to the exchange and adsorption effects between Ca2+ and Na+ in the clay. This effect enriches groundwater Na+. During adsorption, Na+ increases and Ca2+ decreases. With an increasing groundwater depth, the reaction proceeds and ultimately forms Na-type water. The primary reactions are as follows [40]:
Downstream of the southern basin, there was a strong correlation between NH4+ and NO3− because of the irrigation and fertilisation activities in this area.
5.2.2. Principal Component Analysis (PCA)
The main purpose of PCA is dimensionality reduction; it decreases the number of variables. In PCA, the variables are designated principal components. Each primary component is neither correlated nor overlapping with any other. Thus, the main components reflect most of the information. When hydrochemical characteristics are analysed, the hydrogeological significance must be assigned to the primary components according to basic hydrology theory. In this manner, the practical importance of the hydrochemical parameters may be determined [41]. The results of the analyses are shown in Table 5 and Table 6.
The eigenvalues of the primary and secondary main components upstream and midstream of the southern basin were (λ1 = 8.59 and λ2 = 1.35) and (λ1 = 7.73 and λ2 = 1.27), respectively. Thus, all of the eigenvalues were >1. The variance contribution rates were (78.11% and 12.28%) and (70.31% and 11.54%), respectively. The cumulative primary and secondary component variance contribution rates were 90.39% and 81.85%, respectively. Of the main factors identified, TDS, TH, SO42−, Na++K+, Ca2+, Mg2+, Cl−, and HCO3− in Factor F1 accounted for the largest factor loading. The primary processes in Factor F1 were carbonate and sulphate mineral leaching and precipitation, and calcite and dolomite sedimentation. Thus, Factor F1 may be defined as the leaching and precipitation factor. The upstream southern basin of the Kashi region is part of the piedmont alluvial fan, consisting of sediments with large grain sizes, steep hydraulic slopes, good runoff conditions, and high circulation rates. Thus, the groundwater type in the southern basin was relatively complex. During infiltration and runoff, dissolution occurs between the surface and precipitation water, and the carbonate, sulphate, and silicate rocks. The primary correlated reactions are as follows:
These reactions generate large quantities of Na+ and HCO3− and trace amounts of K+. As the runoff condition is suitable, HCO3·SO4-Ca·Mg-type water with low salinity forms upstream.
The variance contribution rates of the primary components in Factor F1 and the secondary components in Factor F2 reached 86.5% downstream of the southern basin (Table 6). Hence, both factors determine the groundwater hydrochemical type and quality. Factor F1 includes TDS, SO42−, TH, Mg2+, Na++K+, Cl-, Ca2+, HCO3−, and F−. Therefore, the evaporation concentration effect of the carbonate and sulphate minerals and exchange and adsorption effects account for most of the water quality variation. The dissolution of fluorine-containing minerals such as fluorite also accounts for part of the observed variation in water quality. Factor F2 includes NH4+ and NO3−, and by extension, may include the influence of human activity. The specific causes include:
In dry regions, the evaporation effect causes ions in the water to concentrate and accumulate. Therefore, the evaporation effect controls the groundwater salinity. The southern basin downstream is part of the fine soil plain where the runoff condition is poor, and the water circulation is primarily vertical. The quantity of salt in the water increases the Cl− concentration. A strong evaporation effect transformed the hydrochemical type from SO4·HCO3-Ca·Mg water to Cl·SO4-Ca·Na·Mg water. Additionally, fluorite leaching increased the F- concentration in the water [32]. Overall, the evaporation concentration effect augmented the groundwater salinity downstream of the northern and southern basins [42,43,44,45]. The primary correlated reactions are as follows (Table 7):
Human activity, such as the use of agricultural fertilisers and pesticides, has increased the NH4+ and NO3− concentrations downstream of the southern basin. NH4+ and NO3− enter the aquifer through the unsaturated zone and aggravate water quality deterioration. Human activity has also altered the recharge condition and ion concentrations in the groundwater. Irrigation water recharge has raised the groundwater table, and the resulting strong evaporation effect has enhanced the salinity of the shallow groundwater. Because the local water infrastructure is poor, farmers have overexploited the groundwater there and altered its hydrochemical and hydrodynamic properties. A previous study demonstrated that from 2003 to 2011, the TDS increased from east to west in the Kashi region. The nitrate and ammonium nitrogen concentrations exceeded the thresholds set by the drinking water standard of China by 27.3%. The maximum value of the nitrate was 0.51 mg/L, which is 2.55 times higher than the standard. These practices have severely compromised the safety of the local water supply [46,47,48,49].
The eigenvalues of the primary and secondary components in the northern basin were λ1 = 7.66 and λ2 = 1.25, respectively. The variance contribution rates were 69.60% and 11.35%, respectively, and the cumulative variance contribution rate was 80.95%. The primary component Factor F1 included TDS, TH, SO42−, Mg2+, HCO3−, Na++K+, Cl−, Ca2+, and NH4+. Hence, carbonate and sulphate mineral dissolution and precipitation affected the hydrochemical type of the groundwater in the northern basin. Therefore, F1 may be defined as a leaching or evaporation factor. NO3− is included in Factor F2 because of agricultural fertiliser and pesticide use (Table 7).
In the north-western part of the study area, maroon stratum from the Palaeogene-Neogene period was observed in the low and hilly mountain areas upstream of the Kizil River Basin. It was abundant in soluble mineral salts, including gypsum (CaSO4·2H2O), Glauber salt (Na2SO4·10H2O), magnesite (MgCO3), and halite (NaCl). When the water–rock reaction occurs, the primary correlated reactions are as follows [50,51,52,53]:
Therefore, the concentrations of these ions were high in the groundwater. The runoff condition was sufficient in the piedmont hilly area. The minerals are dissolved in the surface water, recharged, and infiltrated into the groundwater. After prolonged leaching, large quantities of soluble salts are removed. They pass through the runoff area and reach the discharge area downstream where the hydraulic slope is small, the runoff condition is poor, and the evaporation is intense. Large quantities of salts accumulate, the salinity increases, and SO4-Ca-type and SO4-Mg·Na·Ca-type waters with high salinity form in the northern Kashi region. Hence, there were greater spatial variabilities in the hydrochemical parameters of the northern basin. Additionally, the calcite from the carbonate rocks only dissolves when there is sufficient CO2 in the water, and the TH is high in the northern basin.
The groundwater hydrochemical type is determined by multiple factors, such as runoff lithology and velocity, recharge from the surface water, and human activity [54]. Based on the above analyses, we identified the ion distribution characteristics in the Kashi Delta. However, the issue of poor groundwater in the northern region remains unsolved. In the future, we can set up appropriate purification equipment in each river channel and assess the purified water quality. The Kashi Delta is a fragile ecological region, according to its characteristic of uneven distribution of water resources, and a reasonable calculation and analysis of water resources in the region is required to achieve rational utilisation of water resources.
6. Conclusions
By studying the hydrochemical characteristics of the Kashi region, the following conclusions were reached:
- From south to north and from west to east, the hydrodynamics tended to decrease, while the hydrochemical types and their parameters, such as TH and TDS, exhibited lateral zoning. The cation and anion concentrations and the TH in the groundwater of the northern basin of the Kashi region surpassed the safety thresholds set by the National Hygiene Standard for Drinking Water. Spatial variability was greater in the northern basin than in the southern basin. Thus, the groundwater in the northern basin is only suitable for industrial applications. The groundwater upstream of the southern basin had good runoff conditions and low salinity. Hence, it can be used both for domestic and agricultural purposes.
- Because of the leaching effect from the gypsum and salt rock of the Tertiary system, SO4-Ca-type water with high salinity formed upstream of the northern basin. In contrast, HCO3−-type water with low salinity formed upstream of the southern basin, as the groundwater runoff was rapid there.
- Hydrochemistry, topography, landforms, and human activity are key factors in the formation and development of the groundwater hydrochemistry of the Kashi region. Groundwater quality problems in the Kashi region should be studied from the hydrochemistry perspective and be solved in conjunction with water quantity and other factors.
- Water resource exploitation can reduce the quality and safety of vulnerable groundwater, particularly in arid and semi-arid regions. A primary objective going forward is to design a sustainable development plan and an effective monitoring system for the groundwater in the Kashi region of China.
Author Contributions
Conceptualisation, P.Q., S.S., J.J., X.H., C.Z., X.F. and G.Y.; methodology, P.Q.; software, P.Q.; validation, P.Q.; formal analysis, P.Q.; investigation, P.Q.; resources, P.Q.; data curation, P.Q.; writing—original draft preparation, P.Q. and S.S.; writing—review and editing, P.Q.; visualisation, P.Q.; supervision, P.Q. All authors have read and agreed to the published version of the manuscript.
Funding
This research was supported by the Doctoral Fund of the Ministry of Education (grant no. 20100205110007), the National Natural Science Foundation of China (grant no. 41230314), and Land and Resources for Public Sector Research and Special Projects (grant no. 12120113104200).
Institutional Review Board Statement
Not applicable.
Informed Consent Statement
Not applicable.
Data Availability Statement
The authors declare no conflict of interest.
Acknowledgments
Thanks to the reviewers for their suggestions on the article.
Conflicts of Interest
The authors declare no conflict of interest.
References
- Reghunath, R.; Sreedhara Murthy, T.R.; Raghavan, B.R. The utility of multivariate statistical techniques in hydrogeochemical studies:an example from Karnataka, India. Water Res. 2002, 36, 2437–2442. [Google Scholar] [CrossRef]
- Masoud, A.A. Groundwater quality assessment of the shallow aquifers west of the Nile Delta (Egypt) using multivariate statistical and geostatistical techniques. J. Afr. Earth Sci. 2014, 95, 123–137. [Google Scholar] [CrossRef]
- Ping, W.; Jingjie, Y.; Yichi, Z.; Changming, L. Groundwater recharge and hydrogeochemical evolution in the Ejina Basin, northwest China. J. Hydrol. 2013, 476, 72–86. [Google Scholar]
- Xing, L.N.; Guo, H.M.; Zhan, Y.H. Groundwater hydrochemical characteristics and processes along flow paths in the North China Plain. J. Asian Earth Sci. 2013, 70–71, 250–264. [Google Scholar] [CrossRef]
- Al-Bassam, A.M.; Al-Rumikhani, Y.A. Integrated hydrochemical method of water quality assessment for irrigation in arid areas: Application to the Jilh aquifer, Saudi Arabia. J. Afr. Earth Sci. 2003, 36, 345–356. [Google Scholar] [CrossRef]
- Wei, X.; Wang, N.; Luo, P.; Yang, J.; Zhang, J.; Lin, K. Spatiotemporal Assessment of Land Marketization and Its Driving Forces for Sustainable Urban–Rural Development in Shaanxi Province in China. Sustainability 2021, 13, 7755. [Google Scholar] [CrossRef]
- Zha, X.; Luo, P.; Zhu, W.; Wang, S.; Lyu, J.; Zhou, M.; Huo, A.; Wang, Y. A Bibliometric Analysis of the Research on Sponge City: Current Situation and Future Development Direction. Ecohydrology 2021, 14, e2328. [Google Scholar] [CrossRef]
- Mu, D.; Pingping Luo Lyu, J.; Zhou, M.; Huo, A.; Duan, W.; Nover, D.; He, B.; Zhao, X. Impact of temporal rainfall patterns on flash floods in Hue City, Vietnam. J. Flood Risk Manag. 2020, 14, e12668. [Google Scholar] [CrossRef]
- Jianhua, H.; Jinzhu, M.; Peng, Z.; Liming, T.; Gaofeng, Z.; Edmunds, M.W.; Qinghuan, Z. Groundwater recharge environments and hydrogeochemical evolution in the Jiuquan Basin, Northwest China. Appl. Geochem. 2012, 27, 866–878. [Google Scholar]
- Yilei, Y.; Xianfang, S.; Yinghua, Z.; Fandong, Z.; Ji, L.; Dongmei, H.; Ying, M.; Hongmei, B. Identification of key factors governing chemistry in groundwater near the water course recharged by reclaimed water at Miyun County, Northern China. J. Environ. Sci. 2013, 25, 1754–1763. [Google Scholar]
- Njitchoua, R.; Dever, L.; Fontes, J.C.H.; Naah, E. Geochemistry, origin and recharge mechanisms of groundwaters from the Garoua Sandstone aquifer, northern Cameroon. J. Hydrol. 1997, 190, 123–140. [Google Scholar] [CrossRef]
- Beatriz, H.; Padro, R.; Vega, M.; Barrado, E.; Fernandez, J.M.; Fernandez, L. Temporal Evolution of Groundwater Composition in an alluvial aquifer (pisuerga river, spain) by principal component analysis. Water Res. 2000, 34, 807–816. [Google Scholar]
- Rosenthal, E.; Zilberbrand, M.; Livshitz, Y. The hydrochemical evolution of brackish groundwater in central and northern Sinai (Egypt) and in the western Negev (Israel). J. Hydrol. 2007, 337, 294–314. [Google Scholar] [CrossRef]
- Jun, X.; Zhangdong, J.; Jin, W. Geochemistry of trace elements and water quality assessment of natural water within the Tarim River in the extreme arid region, NW China. J. Geochem. Explor. 2014, 136, 118–126. [Google Scholar]
- Zhang, B.; Song, X.F.; Zhang, Y.H.; Han, D.M.; Tang, C.Y.; Yu, Y.L.; Ma, Y. Hydrochemical characteristics and water quality assessment of surface water and groundwater in Songnen plain, Northeast China. Water Res. 2012, 46, 2737–2748. [Google Scholar] [CrossRef]
- Yang, Z.L.; Li, P.Y.; Wu, J.H.; Cui, X.W. Evaluation of the hydrochemical characteristics of groundwater and drinking water quality in Jingyuan County. South North Water Divers. Water Sci. Technol. 2010, 8, 99–104. (In Chinese) [Google Scholar]
- Xudong, W. Bengbu urban shallow, middle ground water hardness, chloride, sulfate, total dissolved solids increased Mechanism. Hydrogeol. Eng. Geol. 1998, 5, 30–32. [Google Scholar]
- Zhiyuan, M.; Jijiao, F. Formation of karst groundwater in eastern Weibei Sulfate. Coal Geol. Explor. 2005, 33, 344–346. (In Chinese) [Google Scholar]
- Jie, T.; Lin, N.F.; Hua, C. Kashi plain hydrogeochemical characteristics and quality evaluation, Xinjiang. Geogr. Sci. 1995, 15, 234–242. (In Chinese) [Google Scholar]
- Xie, D.; Duan, L.; Si, G.; Liu, W.; Zhang, T.; Mulder, J. Long-term 15N balance after single-dose input of 15Nlabeled NH4+ and NO3− in a subtropical forest under reducing N deposition. Glob. Biogeochem. Cycles 2021, 7, 356–366. [Google Scholar] [CrossRef]
- Chen, X.B.; Zhou, H.F.; Zhang, X.R. Alluvial plain water chemical characteristics of groundwater in Kasha, Xinjiang. Arid. Land Geogr. 2004, 27, 75–79. (In Chinese) [Google Scholar]
- Zhu, H.Y.; Chen, Y.J.; Liu, J.Z.; Gao, S. Talimu River groundwater chemical characteristics of its evolution. Arid. Land Geogr. 2013, 36, 8–18. (In Chinese) [Google Scholar]
- Liu, B. Tarim Basin Groundwater Exploration; China Geological Survey Bureau: Beijing, China, 2008. [Google Scholar]
- Nai, W.H. Kashi City Gez River Water Source Supply Hydrogeological Detailed Investigation Report, 2011.
- Duan, L.; Wang, W.K.; Cao, Y.Q.; Wang, L.J.; Liu, B. Tianshan Mountains in the middle of groudwater chemical characteristics and its formation. Arid. Land Resour. Environ. 2007, 21, 29–34. (In Chinese) [Google Scholar]
- Xu, F.; Ma, T.; Shi, L. Hydrogeochemical characteristics of groundwater in Hetao Plain periodate. Hydrogeol. Eng. Geol. 2012, 39, 8–15. (In Chinese) [Google Scholar]
- Zhang, Y.; Luo, P.; Zhao, S.; Kang, S.; Wang, P.; Zhou, M.; Lyu, J. Control and Remediation Methods for Eutrophic Lakes in Recent 30 years. Water Sci. Technol. 2020, 81, 1099–1113. [Google Scholar] [CrossRef] [PubMed]
- Zhu, Y.; Luo, P.; Su, F.; Zhang, S.; Sun, B. Spatiotemporal Analysis of Hydrological Variations and Their Impacts on Vegetation in Semi-arid Areas from Multiple Satellite Data. Remote Sens. 2020, 12, 4177. [Google Scholar] [CrossRef]
- Zhang, Y.; Huang, C.C.; Tan, Z.; Chen, Y.; Qiu, H.; Huang, C.; Li, Y.; Zhang, Y.; Li, X.G.; Shulmeister, J.; et al. Prehistoric and historic overbank floods in the Luoyang Basin along the Luohe River, middle Yellow River basin 2019, China. Quat. Int. 2019, 521, 118–128. [Google Scholar] [CrossRef]
- Guo, B.; Wang, X.; Pei, L.; Su, Y.; Zhang, D.; Wang, Y. Identifying the spatiotemporal dynamicofPM 2.5 concentrations at multiple scales using geographically and temporally weightedregression model across China during 2015–2018. Sci. Total Environ. 2020, 751, 1–15. [Google Scholar]
- Salifu, A.; Petrusevski, B.; Uhebremichael, K.; Buamah, R.; Amy, G. Multivariate Statistical Analysis for Fluoride Occurrence in Uroundwater in the Northern Region of Ghana. J. Contam. Hydrol. 2012, 140–141, 34–44. [Google Scholar] [CrossRef] [PubMed]
- Zhang, G.X.; Deng, W.; He, Y.; Ramsis, S. The hydrochemical characteristics of groundwater Chinese northeast Songnen Plain and the evolution rule. Adv. Water Sci. 2006, 17, 20–28. (In Chinese) [Google Scholar]
- Wang, R.J. The three line and the hydrological geology interpretation of exploration engineering. Eng. Explor. 1983, 6, 6–11. (In Chinese) [Google Scholar]
- Fuoco, I.; Figoli, A.; Criscuoli, A.; Brozzo, G.; De Rosa, R.; Gabriele, B.; Apollaro, C. Geochemical modeling of chromium release in natural waters and treatment by RO/NF membrane processes. Chemosphere 2020, 254, 126696. [Google Scholar] [CrossRef]
- Apollaro, C.; Di Curzio, D.; Fuoco, I.; Buccianti, A.; Dinelli, E.; Vespasiano, G.; Castrignanò, A.; Rusi, S.; Barca, D.; Figoli, A.; et al. A multivariate non-parametric approach for estimating probability of exceeding the local natural background level of arsenic in the aquifers of Calabria region (Southern Italy). Sci. Total. Environ. 2022, 806, 150345. [Google Scholar] [CrossRef]
- Zhang, X.D.; Qian, H.; Chen, J.; Qiao, L. Assessment of Groundwater Chemistry and Status in a Heavily Used Semi-Arid Region with Multivariate Statistical Analysis. Water 2014, 6, 2212–2232. [Google Scholar] [CrossRef] [Green Version]
- Wen, X.H.; Wu, Y.Q.; Chang, J. Heihe River Basin water chemistry characteristics of spatial variation. Arid. Zone Res. 2004, 21, 1–6. (In Chinese) [Google Scholar]
- Wang, X.X.; Wang, W.K.; Wang, Z.Z.; Zhao, J.L.; Xie, H.L.; Wang, X.D. Downstream river and coastal groundwater chemical characteristics Luan River and its formation. Hydrogeol. Eng. Geol. 2014, 41, 25–33. (In Chinese) [Google Scholar]
- Sun, Y.B.; Wang, W.K.; Duan, L.; Zhang, C.C.; Li, H.; Zhang, Q. Guanzhong Basin shallow groundwater hydrogeochemical Distribution Research. South North Water Divers. Water Sci. Technol. 2013, 11, 142–146. (In Chinese) [Google Scholar]
- Sun, Y.B.; Wang, W.K.; Zhang, C.C.; Duan, L.; Wang, Y.H.; Li, H. The formation and evolution mechanism of shallow high fluorine water in Guanzhong Basin. Hydrogeol. Eng. Geol. 2013, 40, 117–122. (In Chinese) [Google Scholar]
- Hui, Q.; Wei, W.; Qing, C.R.; Bing, C.X. Kashi City Groundwater Resource Mining program expanding comparative analysis. Arid. Zone Res. 2004, 21, 327–332. (In Chinese) [Google Scholar]
- Zhang, C.C.; Wei, Z.; Sun, Y.B.; Li, H.; Wang, W.K.; Duan, L. Phreatic water in Guanzhong basin hydrological and geochemical evolution mechanism. South North Water Divers. Water Sci. Technol. 2013, 11, 48–52. (In Chinese) [Google Scholar]
- Li, P.Y.; Qian, H.; Wu, J.H.; Zhang, Y.Q.; Zhang, H.B. Major Ion Chemistry of Shallow Groundwater in the Dongsheng Coalfield, Ordos Basin, China. Mine Water Environ. 2013, 32, 195–206. (In Chinese) [Google Scholar] [CrossRef]
- Bai, C.Y.; Jia, R.L.; Li, Q.; Zhou, J.L. Analysis of the Tarim basin plain area groundwater quailty variation characteristics of 2003–2011. J. Xinjiang Agric. Univ. 2012, 35, 504–509. (In Chinese) [Google Scholar]
- Luo, P.; Mu, D.; Xue, H.; Ngo-Duc, T.; Dang-Dinh, K.; Takara, K.; Nover, D.; Schladow, G. Flood inundation assessment for the Hanoi Central Area, Vietnam under historical and extreme rainfall conditions. Sci. Rep. 2018, 8, 12623. [Google Scholar] [CrossRef]
- Yidana, S.M.; Banoeng-Yakubo, B.; Akabzaa, T.M. Analysis of groundwater Quality Using Multivariate and Spatial Analyses in the Basin, Ghana. J. Afr. Earth Sci. 2010, 58, 220–234. [Google Scholar] [CrossRef]
- Pan, F.; Zhang, Q.H.; He, J.H. Evolution of Gansu Dongzhiyuan area of Quaternary Groundwater Recharge and chemical characteristics of water environment. Arid. Land Geogr. 2014, 37, 9–18. (In Chinese) [Google Scholar]
- Dong, W.H.; Su, X.S.; Hou, G.C.; Lin, X.Y.; Liu, F.T. Distribution of Erdos Cretaceous groundwater basin groundwater chemical type. J. Jilin Univ. Earth Sci. Ed. 2007, 37, 288–292. (In Chinese) [Google Scholar]
- Al-ahmadi, M.E.; EI-Fiky, A.A. Hydrogeochemical Evaluation of Shallow Alluvial Aquifer of Wadi Marwani, Western Saudi Arabia. J. King Saud Univ. Sci. 2009, 21, 179–190. [Google Scholar] [CrossRef] [Green Version]
- Yang, Y.C.; Shen, Z.L.; Wen, D.G.; Hou, G.C.; Zhao, Z.H.; Wang, D. Ordos Cretaceous Groundwater Basin hydrologic sulfate Earth Chemical characteristics and sources. Earth J. 2008, 29, 553–562. [Google Scholar]
- Luo, P.; Xu, C.; Kang, S.; Huo, A.; Lyu, J.; Zhou, M.; Nover, D. Heavy metals in water and surface sediments of the Fenghe River Basin, China: Assessment and source analysis. Water Sci. Technol. 2021, 84, 3072–3090. [Google Scholar] [CrossRef] [PubMed]
- Weili, D.; Zou, S.; Chen, Y.; Nover, D.; Fang, G.; Wang, Y. Sustainable water management for cross-border resources: The Balkhash Lake Basin of Central Asia, 1931–2015. J. Clean. Prod. 2020, 263, 121614. [Google Scholar]
- Wenjing, H.; Duan, W.; Chen, Y. Rapidly declining surface and terrestrial water resources in Central Asia driven by socio-economic and climatic changes. Sci. Total. Environ. 2021, 784, 147193. [Google Scholar]
- Weili, D.; Maskey, S.; Chaffe, P.L.B.; Luo, P.; He, B.; Wu, Y.; Hou, J. Recent Advancement in Remote Sensing Technology for Hydrology Analysis and Water Resources Management. Remote Sens. 2021, 6, 1097. [Google Scholar]
Figure 1.
(a) Location map of study area. (b) Geomorphological map of the study area. (c) Typical hydrogeological profiles of the study area (5–5’).
Figure 1.
(a) Location map of study area. (b) Geomorphological map of the study area. (c) Typical hydrogeological profiles of the study area (5–5’).


Figure 2.
Distribution map of sampling points.

Figure 3.
(a) Hydrochemical type of the groundwater in the northern basin. (b) Hydrochemical type of the groundwater in the southern basin.
Figure 3.
(a) Hydrochemical type of the groundwater in the northern basin. (b) Hydrochemical type of the groundwater in the southern basin.

Figure 4.
Hydrochemistry types in the study area.

Figure 5.
Contour maps of the sampling parameter concentrations.


Table 1.
Descriptive statistics of hydrochemistry in the southern basin.
| Confined Water Upstream Basin | Coefficient of Variation (%) | Confined Water Midstream Basin | Coefficient of Variation (%) | |||||||
|---|---|---|---|---|---|---|---|---|---|---|
| Parameters | Eigenvalue (mg L−1) | Eigenvalue (mg L−1) | ||||||||
| Min | Max | Mean | Standard Deviation | Min | Max | Mean | Standard Deviation | |||
| Na++K+ | 34.39 | 173.79 | 62.51 | 40.47 | 0.65 | 32.14 | 143.32 | 62.38 | 26.47 | 0.42 |
| Ca2+ | 40.68 | 266.46 | 80.81 | 67.58 | 0.84 | 39.46 | 137.57 | 67.26 | 25.98 | 0.39 |
| Mg2+ | 17.52 | 175.93 | 41.01 | 47.71 | 1.16 | 7.4 | 62.67 | 33.78 | 14.37 | 0.43 |
| NH4+ | 0 | 0.17 | 0.12 | 0.05 | 0.4 | 0 | 0.21 | 0.08 | 0.06 | 0.75 |
| Cl− | 32.25 | 263.73 | 67.01 | 70.86 | 1.06 | 17.92 | 102.48 | 39.45 | 21.47 | 0.54 |
| SO42− | 98.02 | 1007.54 | 236.17 | 272.85 | 1.16 | 79 | 391.51 | 174.01 | 88.21 | 0.51 |
| HCO3− | 119.6 | 378.32 | 183.79 | 82.52 | 0.45 | 140.35 | 394.19 | 229.38 | 67.49 | 0.29 |
| NO3− | 2.02 | 6.99 | 3.5 | 1.6 | 0.46 | 2.2 | 22.14 | 5.76 | 4.65 | 0.81 |
| F− | 0.35 | 0.71 | 0.49 | 0.13 | 0.26 | 0.33 | 2.14 | 0.9 | 0.35 | 0.39 |
| TH | 183.9 | 1389.6 | 370.64 | 362.8 | 0.98 | 162.5 | 594.4 | 307 | 116.21 | 0.38 |
| TDS | 292.29 | 2082.1 | 583.88 | 532.69 | 0.91 | 263.57 | 1041.5 | 498.32 | 200.72 | 0.40 |
| PH | 7.37 | 8.45 | 7.9 | 0.31 | 0.04 | 7.43 | 8.29 | 8.02 | 0.24 | 0.03 |
K+—Potassium, Na+—Sodium, Ca2+—Calcium, Mg2+—Magnesium, HCO3−—Bicarbonate, SO42−—Sulphate, Cl−—Chloride, F−—Fluoride, NH4+—Ammonium, NO3−—Nitrate, TDS—total dissolved solution, TH—total hardness.
Table 2.
Descriptive statistics of hydrochemistry in the southern and northern basins.
| Confined Water Downstream Basin | Coefficient of Variation (%) | Confined Water Northern Basin | Coefficient of Variation (%) | |||||||
|---|---|---|---|---|---|---|---|---|---|---|
| Parameters | Eigenvalue (mg L−1) | Eigenvalue (mg L−1) | ||||||||
| Min | Max | Mean | Standard Deviation | Min | Max | Mean | Standard Deviation | |||
| Na++K+ | 7.37 | 1045.16 | 235.29 | 242.28 | 1.03 | 58.08 | 1150 | 251.99 | 241.2 | 0.96 |
| Ca2+ | 34.58 | 264.32 | 106.03 | 69.14 | 0.65 | 73.23 | 731.97 | 269.51 | 157.69 | 0.59 |
| Mg2+ | 17.27 | 413.14 | 113.13 | 102.45 | 0.91 | 22.21 | 605.64 | 139.93 | 143.15 | 1.02 |
| NH4+ | 0 | 2.51 | 0.34 | 0.51 | 1.5 | 0 | 5.07 | 0.6 | 0.93 | 1.56 |
| Cl− | 14.33 | 960.32 | 200.42 | 222.86 | 1.11 | 50.17 | 1003.3 | 219.15 | 215 | 0.98 |
| SO42− | 48.52 | 2555.64 | 687.65 | 666.3 | 0.97 | 257.39 | 4011.9 | 1163.74 | 897.39 | 0.77 |
| HCO3− | 128.14 | 378.32 | 243.02 | 71.54 | 0.29 | 101.29 | 762.75 | 274.29 | 168.57 | 0.61 |
| NO3− | 0.25 | 7.56 | 1.86 | 1.96 | 1.06 | 0.31 | 48.89 | 8.27 | 7.89 | 0.95 |
| F− | 0.38 | 4.04 | 0.86 | 0.74 | 0.87 | 0.17 | 3.54 | 0.63 | 0.7 | 1.12 |
| TH | 161.5 | 2233.9 | 730.49 | 577.81 | 0.79 | 423.6 | 3878.5 | 1249.04 | 885.89 | 0.71 |
| TDS | 198.11 | 5375.69 | 1467.1 | 1314.61 | 0.9 | 251.03 | 7138.8 | 2159.57 | 1644.46 | 0.76 |
| PH | 4.66 | 8.36 | 7.83 | 0.73 | 0.09 | 6.63 | 8.22 | 7.76 | 0.37 | 0.05 |
K+—Potassium, Na+—Sodium, Ca2+—Calcium, Mg2+—Magnesium, HCO3−—Bicarbonate, SO42−—Sulphate, Cl−—Chloride, F−—Fluoride, NH4+—Ammonium, NO3−—Nitrate, TDS—total dissolved solution, TH—total hardness.
Table 3.
Matrix of coefficient of correlation in the southern basin.
| Parameters | Upstream (South) | Midstream (South) | ||||||||||||||||||||
|---|---|---|---|---|---|---|---|---|---|---|---|---|---|---|---|---|---|---|---|---|---|---|
| Na++K+ | Ca2+ | Mg2+ | NH4+ | Cl− | SO42− | HCO3− | NO3− | F− | TH | TDS | Na++K+ | Ca2+ | Mg2+ | NH4+ | Cl− | SO42− | HCO3− | NO3− | F− | TH | TDS | |
| Na++K+ | 1.00 | 1.00 | ||||||||||||||||||||
| Ca2+ | 0.95 | 1.00 | 0.91 | 1.00 | ||||||||||||||||||
| Mg2+ | 0.98 | 0.97 | 1.00 | 0.84 | 0.76 | 1.00 | ||||||||||||||||
| NH4+ | −0.75 | −0.82 | −0.86 | 1.00 | 0.44 | 0.40 | 0.26 | 1.00 | ||||||||||||||
| Cl− | 0.98 | 0.95 | 0.98 | −0.82 | 1.00 | 0.91 | 0.84 | 0.82 | 0.29 | 1.00 | ||||||||||||
| SO42− | 0.98 | 0.98 | 1.00 | −0.85 | 0.98 | 1.00 | 0.97 | 0.92 | 0.87 | 0.41 | 0.94 | 1.00 | ||||||||||
| HCO3− | 0.81 | 0.93 | 0.85 | −0.70 | 0.77 | 0.86 | 1.00 | 0.77 | 0.82 | 0.82 | 0.32 | 0.59 | 0.73 | 1.00 | ||||||||
| NO3− | 0.28 | 0.51 | 0.37 | −0.34 | 0.25 | 0.37 | 0.75 | 1.00 | 0.58 | 0.49 | 0.59 | 0.12 | 0.45 | 0.49 | 0.63 | 1.00 | ||||||
| F− | −0.10 | −0.05 | −0.15 | 0.36 | −0.17 | −0.12 | 0.07 | 0.16 | 1.00 | 0.10 | 0.21 | 0.31 | 0.34 | 0.03 | 0.12 | 0.44 | 0.00 | 1.00 | ||||
| TH | 0.97 | 0.99 | 0.99 | −0.85 | 0.97 | 1.00 | 0.89 | 0.44 | −0.10 | 1.00 | 0.93 | 0.94 | 0.93 | 0.35 | 0.89 | 0.96 | 0.88 | 0.57 | 0.27 | 1.00 | ||
| TDS | 0.98 | 0.99 | 1.00 | −0.84 | 0.98 | 1.00 | 0.88 | 0.40 | −0.11 | 1.00 | 1.00 | 0.98 | 0.95 | 0.90 | 0.40 | 0.92 | 0.98 | 0.83 | 0.57 | 0.19 | 0.99 | 1.00 |
Table 4.
Matrix of coefficient of correlation of the southern (downstream) and northern basins.
| Parameters | Downstream (South) | North | ||||||||||||||||||||
|---|---|---|---|---|---|---|---|---|---|---|---|---|---|---|---|---|---|---|---|---|---|---|
| Na++K+ | Ca2+ | Mg2+ | NH4+ | Cl− | SO42− | HCO3− | NO3− | F− | TH | TDS | Na++K+ | Ca2+ | Mg2+ | NH4+ | Cl− | SO42− | HCO3− | NO3− | F− | TH | TDS | |
| Na++K+ | 1.00 | 1.00 | ||||||||||||||||||||
| Ca2+ | 0.83 | 1.00 | 0.57 | 1.00 | ||||||||||||||||||
| Mg2+ | 0.97 | 0.87 | 1.00 | 0.84 | 0.61 | 1.00 | ||||||||||||||||
| NH4+ | 0.09 | 0.05 | 0.07 | 1.00 | 0.54 | 0.70 | 0.59 | 1.00 | ||||||||||||||
| Cl− | 1.00 | 0.82 | 0.96 | 0.11 | 1.00 | 0.96 | 0.61 | 0.76 | 0.58 | 1.00 | ||||||||||||
| SO42− | 0.97 | 0.91 | 0.99 | 0.07 | 0.96 | 1.00 | 0.86 | 0.79 | 0.95 | 0.65 | 0.80 | 1.00 | ||||||||||
| HCO3− | 0.77 | 0.84 | 0.85 | −0.11 | 0.77 | 0.83 | 1.00 | 0.74 | 0.77 | 0.78 | 0.69 | 0.75 | 0.81 | 1.00 | ||||||||
| NO3− | −0.27 | −0.25 | −0.28 | 0.48 | −0.25 | −0.29 | −0.33 | 1.00 | 0.08 | 0.18 | 0.07 | −0.07 | 0.03 | 0.14 | −0.02 | 1.00 | ||||||
| F− | 0.78 | 0.40 | 0.68 | 0.19 | 0.80 | 0.65 | 0.46 | −0.16 | 1.00 | 0.42 | 0.43 | 0.56 | 0.43 | 0.37 | 0.54 | 0.63 | −0.28 | 1.00 | ||||
| TH | 0.95 | 0.93 | 0.99 | 0.07 | 0.95 | 0.99 | 0.87 | −0.28 | 0.61 | 1.00 | 0.81 | 0.85 | 0.94 | 0.70 | 0.78 | 0.99 | 0.86 | 0.12 | 0.56 | 1.00 | ||
| TDS | 0.99 | 0.90 | 0.99 | 0.08 | 0.98 | 1.00 | 0.83 | −0.28 | 0.70 | 0.99 | 1.00 | 0.91 | 0.77 | 0.93 | 0.67 | 0.88 | 0.97 | 0.85 | 0.07 | 0.54 | 0.96 | 1.00 |
Table 5.
Load matrix of the main components.
| Upstream Matrix (South) | Midstream Matrix (South) | ||||
|---|---|---|---|---|---|
| Parameters | Components | Parameters | Components | ||
| 1 | 2 | 1 | 2 | ||
| TH | 1.00 | 0.00 | TDS | 0.99 | −0.06 |
| TDS | 1.00 | −0.03 | TH | 0.99 | 0.00 |
| SO42− | 0.99 | −0.06 | Na++K+ | 0.97 | −0.11 |
| Ca2+ | 0.99 | 0.09 | SO42− | 0.96 | −0.11 |
| Mg2+ | 0.99 | −0.08 | Ca2+ | 0.94 | 0.00 |
| Cl− | 0.96 | −0.17 | Mg2+ | 0.92 | 0.01 |
| Na++K+ | 0.96 | −0.09 | Cl− | 0.90 | −0.24 |
| HCO3− | 0.90 | 0.36 | HCO3− | 0.87 | 0.21 |
| NH4+ | −0.86 | 0.25 | NO3− | 0.62 | −0.24 |
| F− | −0.13 | 0.80 | F− | 0.25 | 0.88 |
| NO3− | 0.46 | 0.68 | NH4+ | 0.43 | 0.55 |
| Eigenvalue | 8.59 | 1.35 | Eigenvalue | 7.73 | 1.27 |
| % of Variance explained | 78.11 | 12.28 | % of Variance explained | 70.31 | 11.54 |
| % Cumulative variance | 78.11 | 90.39 | % Cumulative variance | 70.31 | 81.85 |
Table 6.
Load matrix of the main components.
| Downstream Matrix (South) | Matrix (North) | ||||
|---|---|---|---|---|---|
| Parameters | Components | Parameters | Components | ||
| 1 | 2 | 1 | 2 | ||
| TDS | 1.00 | 0.03 | TDS | 0.98 | 0.05 |
| SO42− | 0.99 | 0.02 | TH | 0.98 | 0.07 |
| TH | 0.99 | 0.00 | SO42− | 0.97 | 0.11 |
| Mg2+ | 0.99 | 0.02 | Mg2+ | 0.92 | 0.02 |
| Na++K+ | 0.98 | 0.06 | HCO3− | 0.90 | −0.13 |
| Cl− | 0.98 | 0.09 | Na++K+ | 0.89 | 0.10 |
| Ca2+ | 0.90 | −0.04 | Cl− | 0.87 | 0.08 |
| HCO3− | 0.86 | −0.19 | Ca2+ | 0.82 | 0.12 |
| F− | 0.71 | 0.23 | NH4+ | 0.74 | −0.15 |
| NH4+ | 0.06 | 0.89 | F− | 0.61 | −0.55 |
| NO3− | −0.32 | 0.78 | NO3− | 0.06 | 0.92 |
| Eigenvalue | 8.00 | 1.52 | Eigenvalue | 7.66 | 1.25 |
| % of Variance explained | 72.73 | 13.78 | % of Variance explained | 69.60 | 11.35 |
| % Cumulative variance | 72.73 | 86.50 | % Cumulative variance | 69.60 | 80.95 |
Table 7.
Main reaction of the groundwater in the Kashi Region.
| Valley | Hydrochemistry | Main Reaction |
|---|---|---|
| Upstream Midstream (South) | Dissolve Precipitation | Reaction (3) |
| Reaction (4) | ||
| Reaction (5) | ||
| Reaction (6) | ||
| Reaction (7) | ||
| Downstream (South) | Evaporation Concentrate Cation Exchange | Reaction (8) |
| Reaction (9) | ||
| North | Dissolve Evaporation | Reaction (10) |
| Reaction (11) | ||
| Reaction (12) | ||
| Reaction (13) |
Publisher’s Note: MDPI stays neutral with regard to jurisdictional claims in published maps and institutional affiliations. |
© 2021 by the authors. Licensee MDPI, Basel, Switzerland. This article is an open access article distributed under the terms and conditions of the Creative Commons Attribution (CC BY) license (https://creativecommons.org/licenses/by/4.0/).
Share and Cite
MDPI and ACS Style
Qu, P.; Su, S.; Jiao, J.; Hu, X.; Zhao, C.; Fang, X.; Yan, G. Spatial Assessment of Hydrochemical Characteristics and Evolution of Inferior Quality Water in Kashi Delta. Water 2021, 13, 3557. https://doi.org/10.3390/w13243557
AMA Style
Qu P, Su S, Jiao J, Hu X, Zhao C, Fang X, Yan G. Spatial Assessment of Hydrochemical Characteristics and Evolution of Inferior Quality Water in Kashi Delta. Water. 2021; 13(24):3557. https://doi.org/10.3390/w13243557
Chicago/Turabian StyleQu, Pengfei, Shengwei Su, Jian Jiao, Xiangyang Hu, Cheng Zhao, Xiao Fang, and Gengsheng Yan. 2021. "Spatial Assessment of Hydrochemical Characteristics and Evolution of Inferior Quality Water in Kashi Delta" Water 13, no. 24: 3557. https://doi.org/10.3390/w13243557
Note that from the first issue of 2016, this journal uses article numbers instead of page numbers. See further details here.