Article

Alternative Use of Artificial Quarry Lakes as a Source of Thermal Energy for Greenhouses

by
Jessica Maria Chicco
1,*,
Felix-Antoine Comeau
2,
Alessandro Casasso
3,
Cesare Comina
4,
Nicolò Giordano
5,
Giuseppe Mandrone
1 and
Jasmin Raymond
2
1
Interuniversity Department of Regional and Urban Studies and Planning, Politecnico di Torino, Viale Pier Andrea Mattioli 39, 10125 Torino, Italy
2
Centre Eau Terre Environnement, Institut National de la Recherche Scientifique, 490 Rue de la Couronne, Québec, QC G1K 9A9, Canada
3
Department of Environment, Land and Infrastructure Engineering, Politecnico di Torino, Corso Duca degli Abruzzi 24, 10129 Torino, Italy
4
Department of Earth Sciences, University of Torino, Via Valperga Caluso 35, 10125 Torino, Italy
5
Géotherma Solutions Inc., 13-2528 Avenue de Monceaux, Québec, QC G1T 2N7, Canada
*
Author to whom correspondence should be addressed.
Water 2021, 13(24), 3560; https://doi.org/10.3390/w13243560
Submission received: 26 October 2021 / Revised: 7 December 2021 / Accepted: 9 December 2021 / Published: 13 December 2021
(This article belongs to the Section Water-Energy Nexus)

Abstract

:
In northern Italy, most greenhouses rely on gas or oil heaters which are sometimes subject to high operating costs. Several greenhouses are nearby quarry lakes, which are the legacy of the expansion of cities in the last decades, including Turin (NW Italy). About 20 quarry lakes were excavated close to the Po riverbed in the southern part of this urban area, along a belt of more than 30 km in length, with an overall volume exceeding 10 million m3 water. The study addresses these artificial lakes as a low enthalpy thermal energy source, potentially providing heat to surrounding agri-business buildings. Detailed temperature monitoring of a large lake quarry was conducted over two years at different depths, measuring the surrounding groundwater level as well. Two different behaviors of the lake during the winter and summer seasons enabled the definition of a quite low water mixing process between the surrounding aquifers and the lake (in the range of 2–4 °C). An evaluation of the heat extraction potential using the lake as a heat source, depending on water temperature and its volume, and a qualitative comparison with groundwater systems are proposed. This study contributes to increasing knowledge on an overlooked resource for sustainable heating.

1. Introduction

In Italy, most of the aggregate production originates from alluvial deposits providing high-quality material. In the Turin area (NW Italy), there is a massive presence of quarries exploiting such deposits. These mining activities represent a relevant environmental concern, especially when the excavation reaches the water table of the shallow aquifer(s). As this happens, the so-called quarry lakes are formed, which are associated with several possible impacts [1,2,3,4]. Previous studies have dealt with quarry lakes because of progressive flooding of the excavated area with groundwater, rainfall, or surface runoff [2]. They can become a potential threat because of harmful chemical and physical groundwater pollution [3]. Dewatering pumping systems are kept in operation even after the mine closure to avoid groundwater contamination. A similar application was recently proposed also for pump-and-treat systems in groundwater remediation projects [5].
Quarry lakes can also modify the morphology of the water table, leading to a possible mixing between shallow and deep aquifers and to a hydrogeological imbalance between the evaporation from lakes and the amount of precipitation [1].
South of Torino (Figure 1), a number of these water basins (totalizing > 10 million m3 of water) are found close to the Po riverbed, along a belt more than 30 km in length. These flooded quarries are typically returned to the local community after the end of the mining activity and most of them are going to end their operation, in the next decades.
According to national and local regulations, environmental restoration is mandatory when a quarry ends its operation. These lakes are usually restored through renaturation, converted to recreational and sports centers, or as lagoon basins for aqueducts. Options demanding low-cost maintenance are often sought as public funds available for restoration are often scarce and the choice of a sustainable solution is up to the local administrations.
Mining areas now have more and more attention hoping to improve their sustainability. Land recovery planning and regulations are of great importance to guarantee sustainable exploitation. There are several potential positive uses for shallower mines and for quarries that are currently inactive [6,7,8,9,10,11,12,13], including the thermal exploitation of lake water as a low enthalpy thermal energy source, as initially suggested by [14].
This paper aims to investigate if areas nearby the lakes can be potential sites for greenhouses or agri-business factories, particularly for Space Heating and Cooling (SHC), domestic hot water, and food processes (e.g., vegetable and fruit dehydration).

2. Materials and Methods

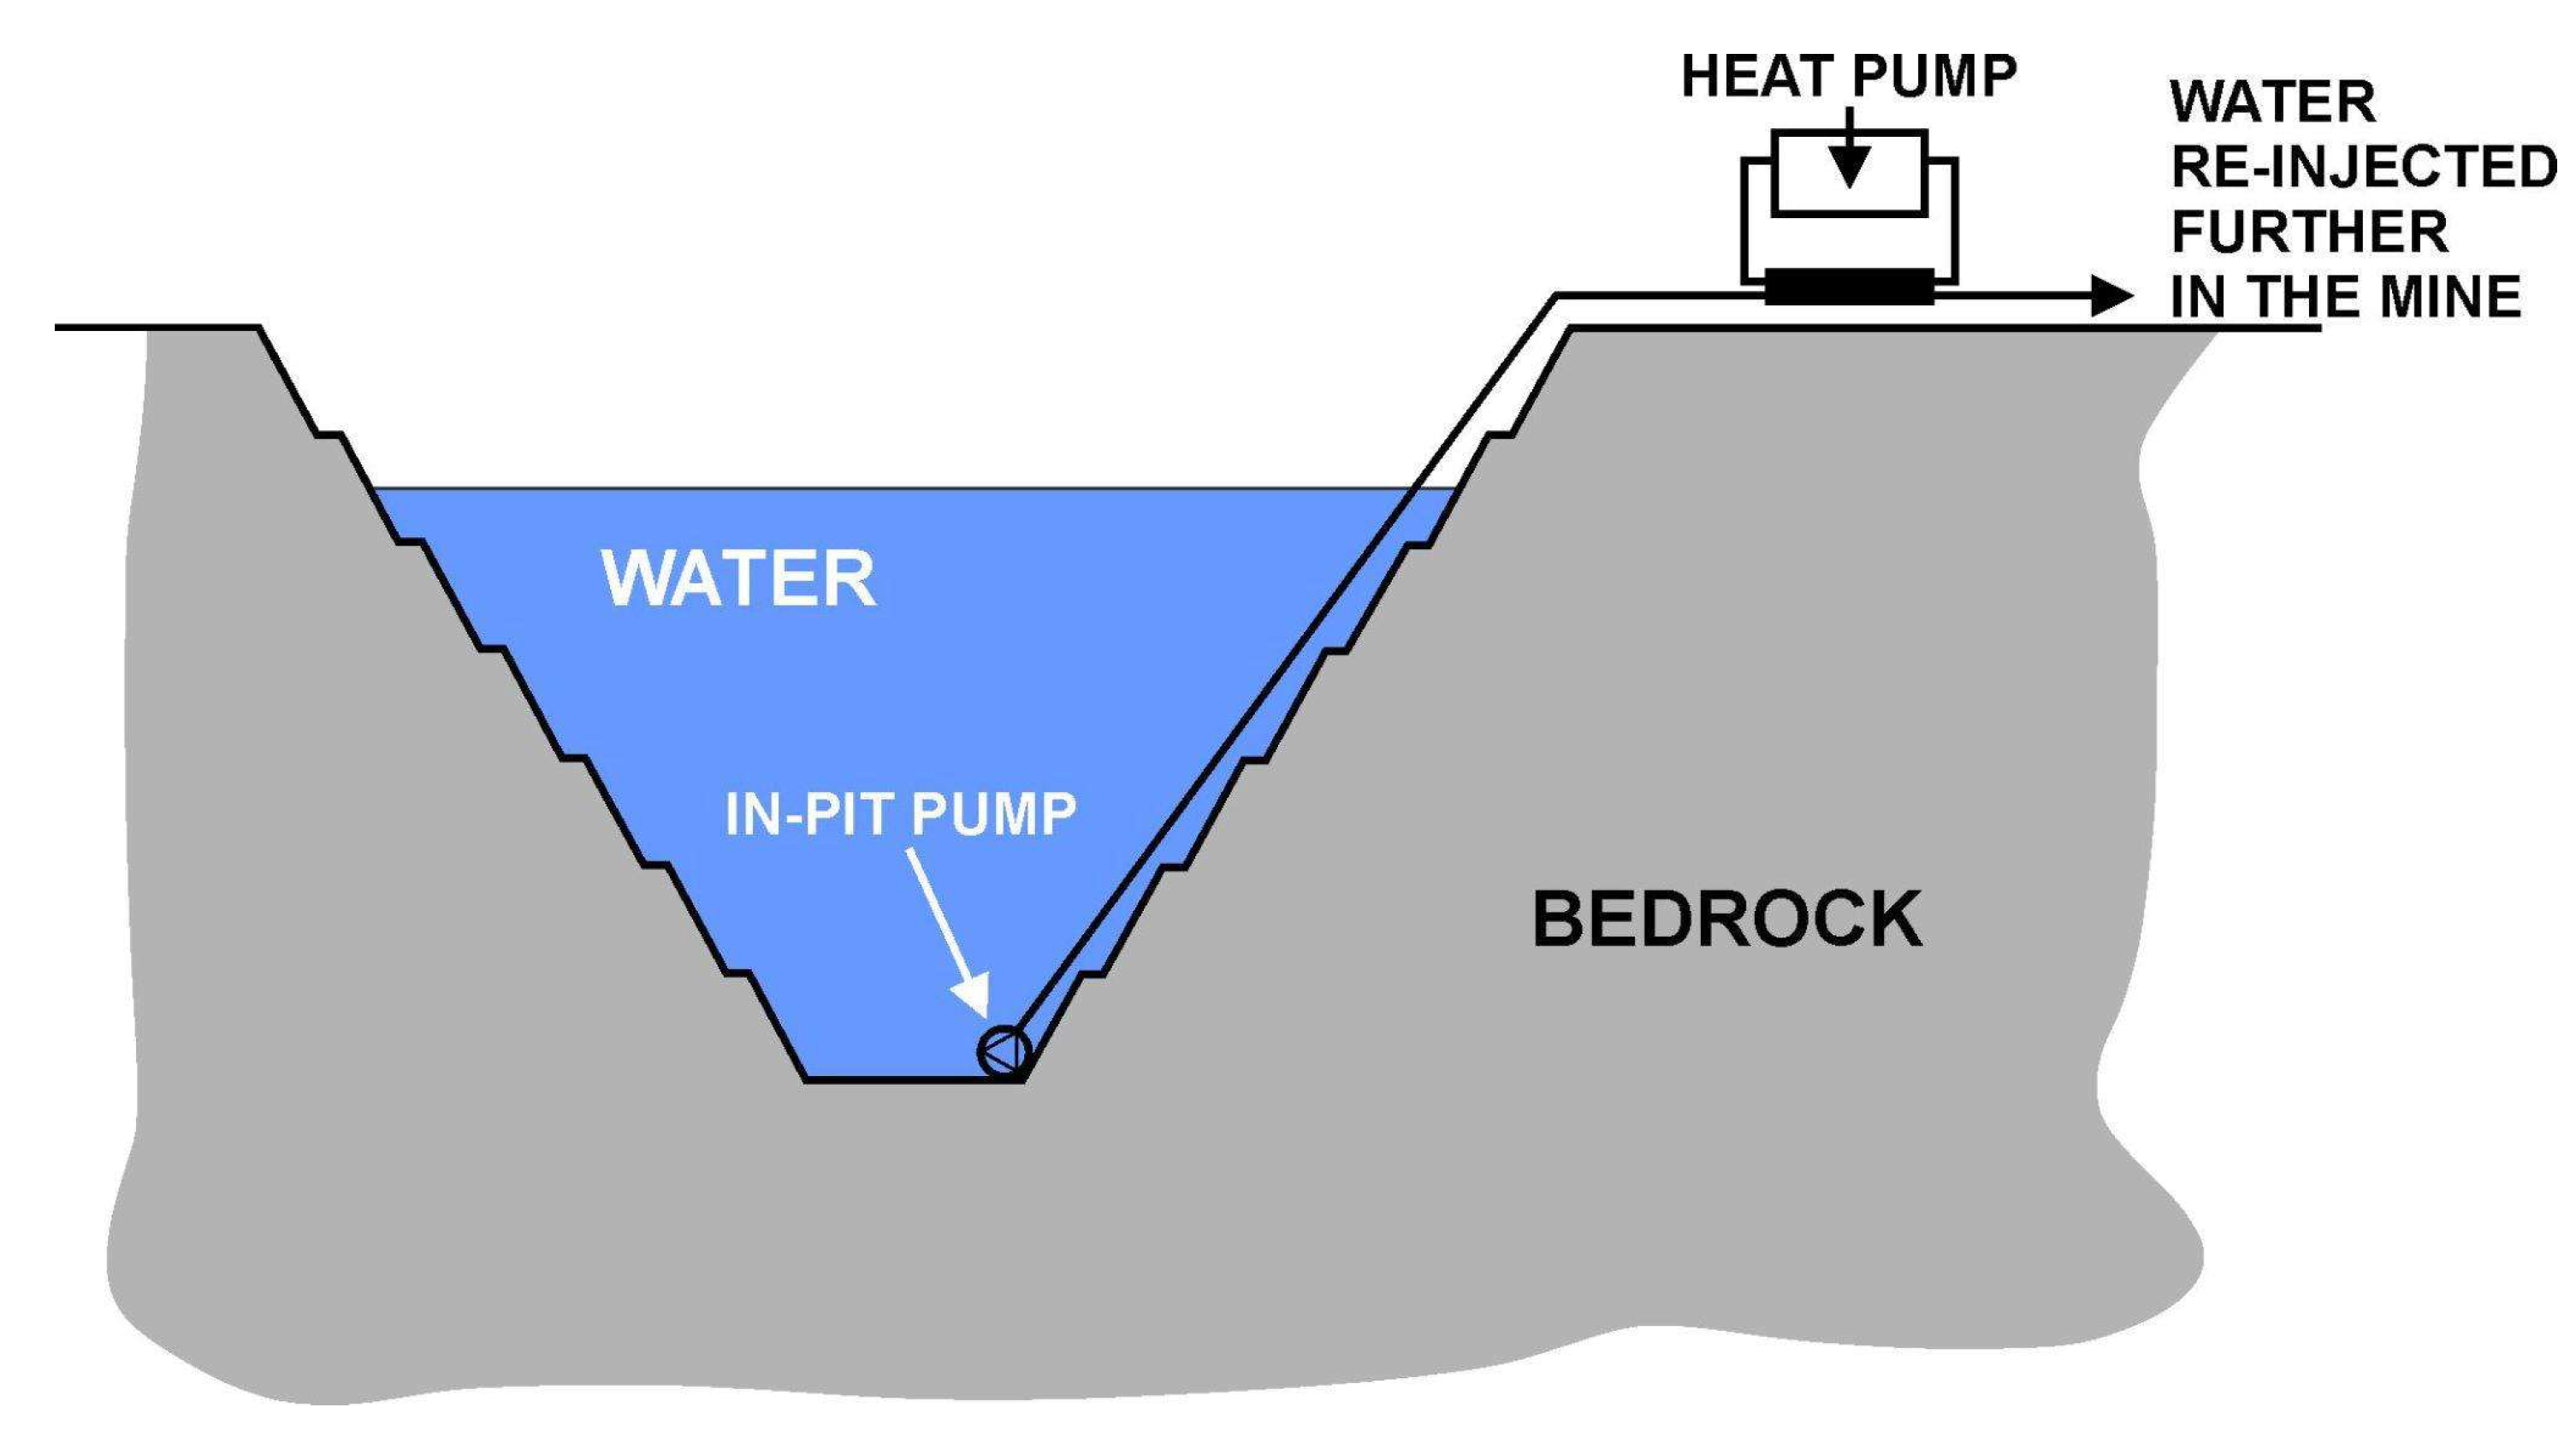
2.1. The Concept: Exploiting the Quarry Lake as a Heat Source

Mining sites and quarries require significant capital investment to operate, but they are considered to have little value after closure. During production or after the closure, open-pit mines and quarries can become flooded by groundwater and surface runoff. The thermal inertia of this water body can be exploited as a heat source, using heat pump systems. This technology can be deployed in any type of geological environment for the benefit of users that can obtain important energy savings. This is a feature that makes quarry lakes an interesting alternative to well drilling. Indeed, well drilling represents a major cost item for open-loop geothermal heat pump systems whereas, in the case of a flooded quarry, water at an almost constant temperature is directly accessible through the existing open pit (Figure 2).
There are at least two alternative methods to produce thermal energy: the abstracted water can be disposed of in the same lake, maximizing the distance in order to avoid or limit the occurrence of thermal recycling [15]; as an alternative, a heat exchanger can be submerged into the lake, working like a pond loop [16,17].
Energy extracted can be used to heat and cool commercial, industrial, and institutional buildings near these mines or to supply energy-intensive businesses, such as greenhouses or data centers, where heating and cooling costs represent an important part of building’s economic and energy budget [18,19,20]. Therefore, the use of surface water geothermal energy available in the mine water would make it possible to reduce building operating costs significantly.

2.2. The “Provana” Quarry Site: Geographical and Geological Setting

The alluvial Po Plain in Northern Italy hosts a high number of quarries located along the Po River and its tributaries. Piedmont (NW Italy) hosts several of them, historically located along the main rivers, with an average depth of 20–30 m and up to 60 m, with a surface area ranging from 3 to 30 ha, and volumes ranging from 1 to 20 million m3.
The study area is the “Provana” quarry, located about 30 km south of Torino, near the Po River and a few km away from residential and industrial areas between Carignano and Carmagnola localities, hosting a population of around 40,000 (Figure 1).
The area is part of the Western Po Plain and is one of the most important water resources of Europe and of Italy. It is bordered by the Alps to the North and by the Apennines to the South. The configuration of the Western Po Plain is formed by the W-vergent arc of the Western Alps and the NE-vergent arc of the Northern Apennines [21]. The westernmost part of the Po Plain can be further divided into the northern and southern sectors with respect to the Torino urban area (Figure 3). This physical division consists of alluvial fans to the West and by an E-W belt formed by the Torino and Monferrato hills to the East [22].
The hydrogeological model of the Piedmont Po Plain is mainly characterized by:
  • an Alluvial Complex, consisting of unconsolidated deposits, which can be assigned to quaternary fluvial deposits with gravelly–sandy texture and silt–clay intercalation hosting shallow groundwater;
  • a “Villafranchiano” complex, with fluvio-lacustrine deposits of the late Pliocene to early Pleistocene;
  • a deeper Marine complex, deposits of the early Pliocene marked by sand deposits.
The study area was excavated in the Alluvial Complex, namely in the recent fluvial deposits of the Upper Pleistocene–Holocene. They are characterized by a general decrease in grain size towards the Po River, with high to medium porosity and hosting a shallow confined aquifer connected to the main River. The Alluvial Complex has a variable thickness ranging between 20 and 50 m and a high hydraulic conductivity ranging from 10−3 and 10−4 m/s. The water table ranges from almost outcropping to more than −40 m close to the Alps, ranging between 15 and 20 m nearby of the “Provana” quarry site. The recharge of the shallow aquifer is dominated by rainfall infiltration and this, combined with a relatively shallow water table and the intense agricultural and farming activities, makes this area prone to nitrate contamination [23,24]. The continental climate of the study area (Figure 4) consists of springs and autumns with maximum amounts of rainfall, while winter and summer seasons are characterized by fewer rainfalls [25]. At the Provana lake, the average annual temperature is 12.8 °C and the yearly rainfalls are 790 mm (the driest month is January, with only 37 mm, while the rainiest is May with 97 mm). July is the hottest month (23.4 °C) while January is the coldest (2.2 °C).

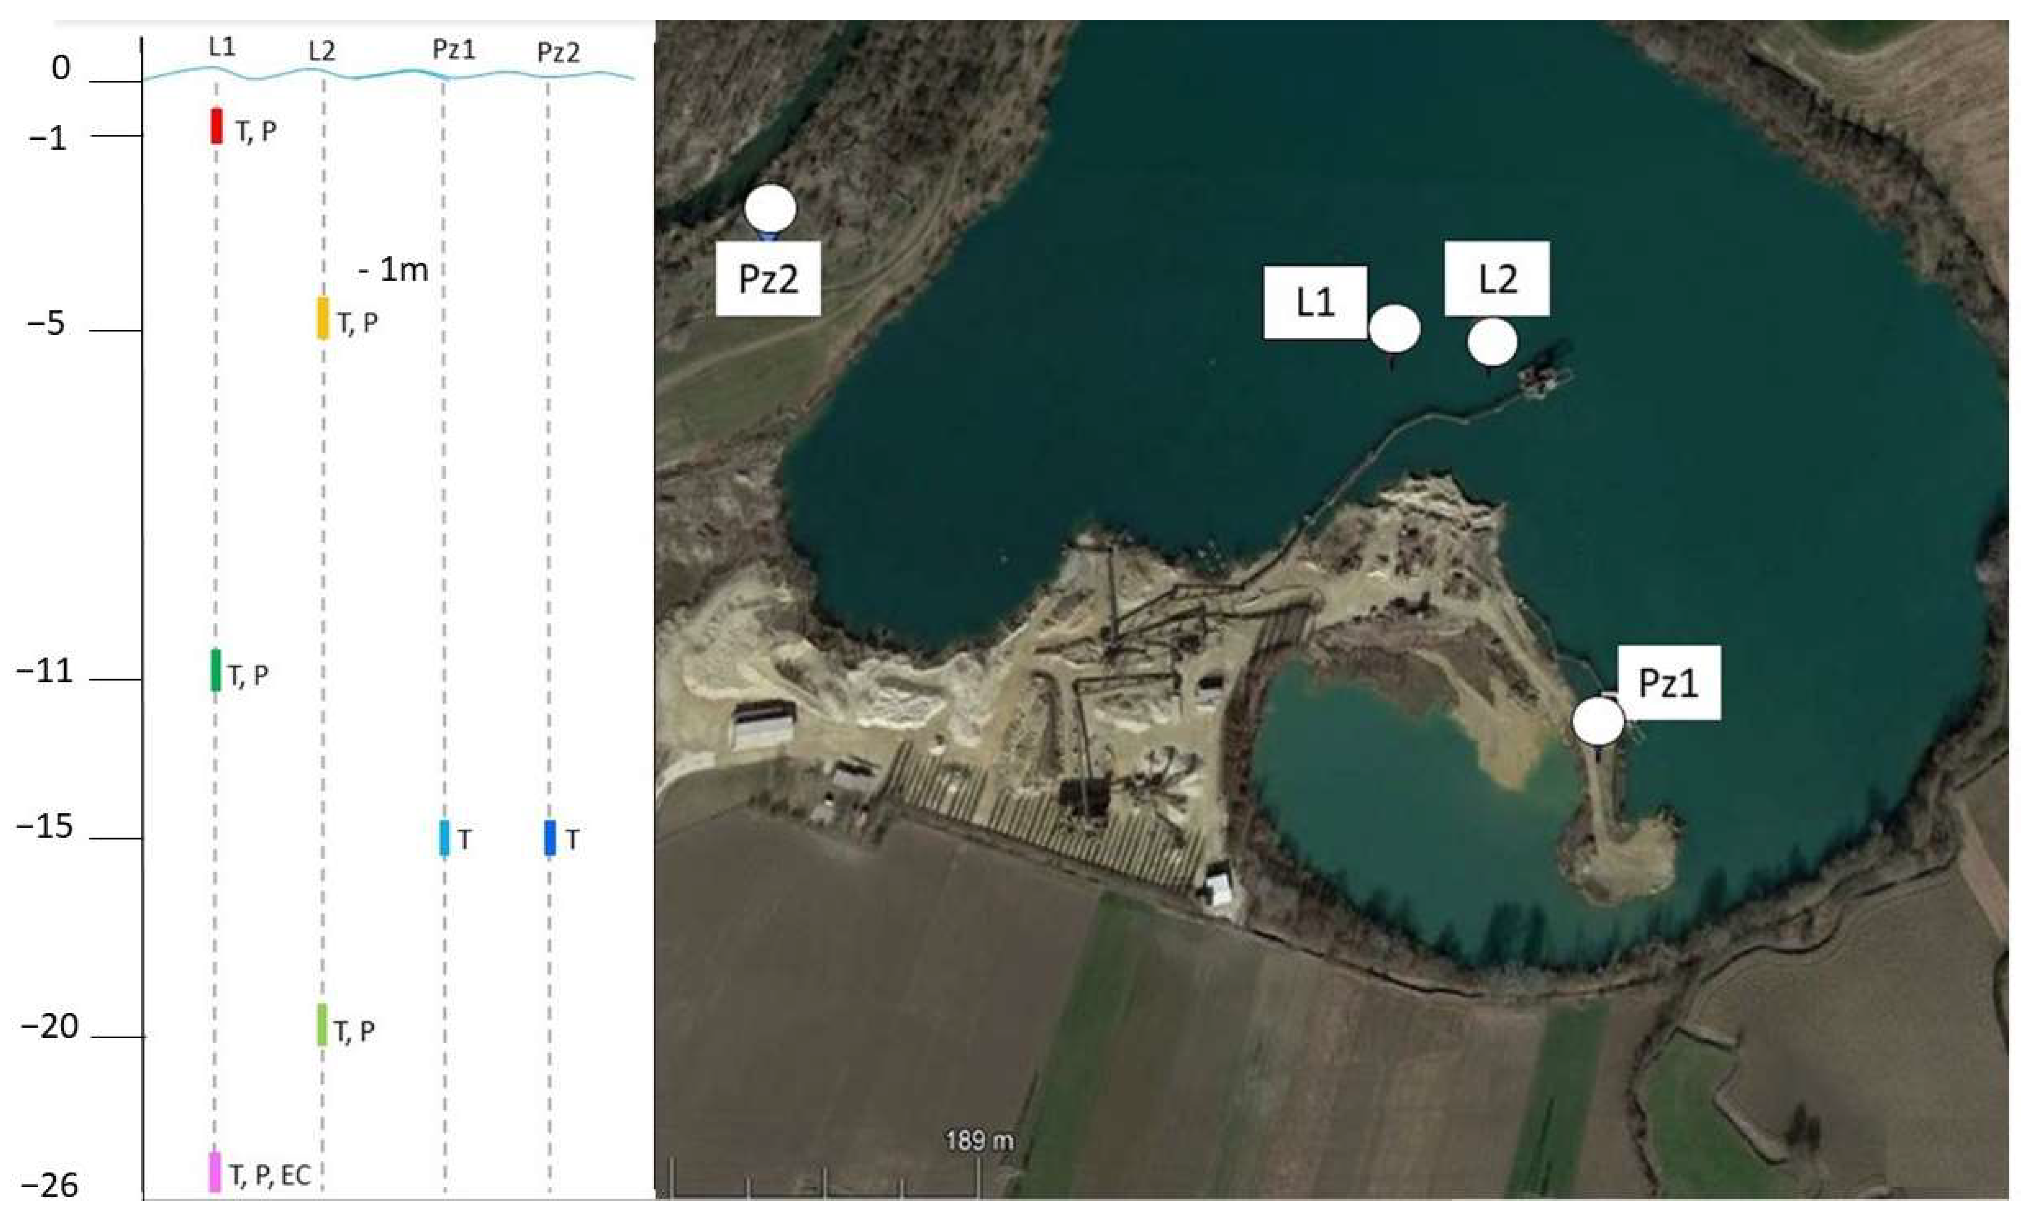
2.3. Temperature Monitoring System

Knowing the spatial distribution and the time trend of the lake water temperature at different depths and linked to the different weather conditions is of paramount importance to characterize the resource and the potential of lake water for heating and cooling purposes. Usually, two temperature profiles a year are requested as control from local public authorities, but in this specific case, sensors were installed at different depths (Figure 5) to monitor water properties over 2 years. In addition, two temperature sensors were placed in piezometers around the lake. Data were compared to the “Arpa Piemonte” weather stations measures [25], providing air temperature and rainfalls. Three additional field surveys in different periods were carried out in August 2018, May 2019, and October 2020 when manual control of the equipment was performed. In August 2018, two temperature logs were made. When completing the first log (L1; Figure 5), sensors measuring both temperature and pressure were installed at different depths (at −1 m, −11 m, and −26 m). The third sensor detecting temperature and electrical conductivity was installed at the bottom of the lake (−26 m). In this last case, data were recorded with a time interval of 6 h. A second temperature profile was made a few meters away from L1 (L2; Figure 5). Sensors were installed at −5 m and −15 m, with a recording time interval of 1 h over a day.
The devices used were submersible sensors and data loggers, designed for continuous water monitoring with different characteristics and at different depths, as detailed in Table 1.

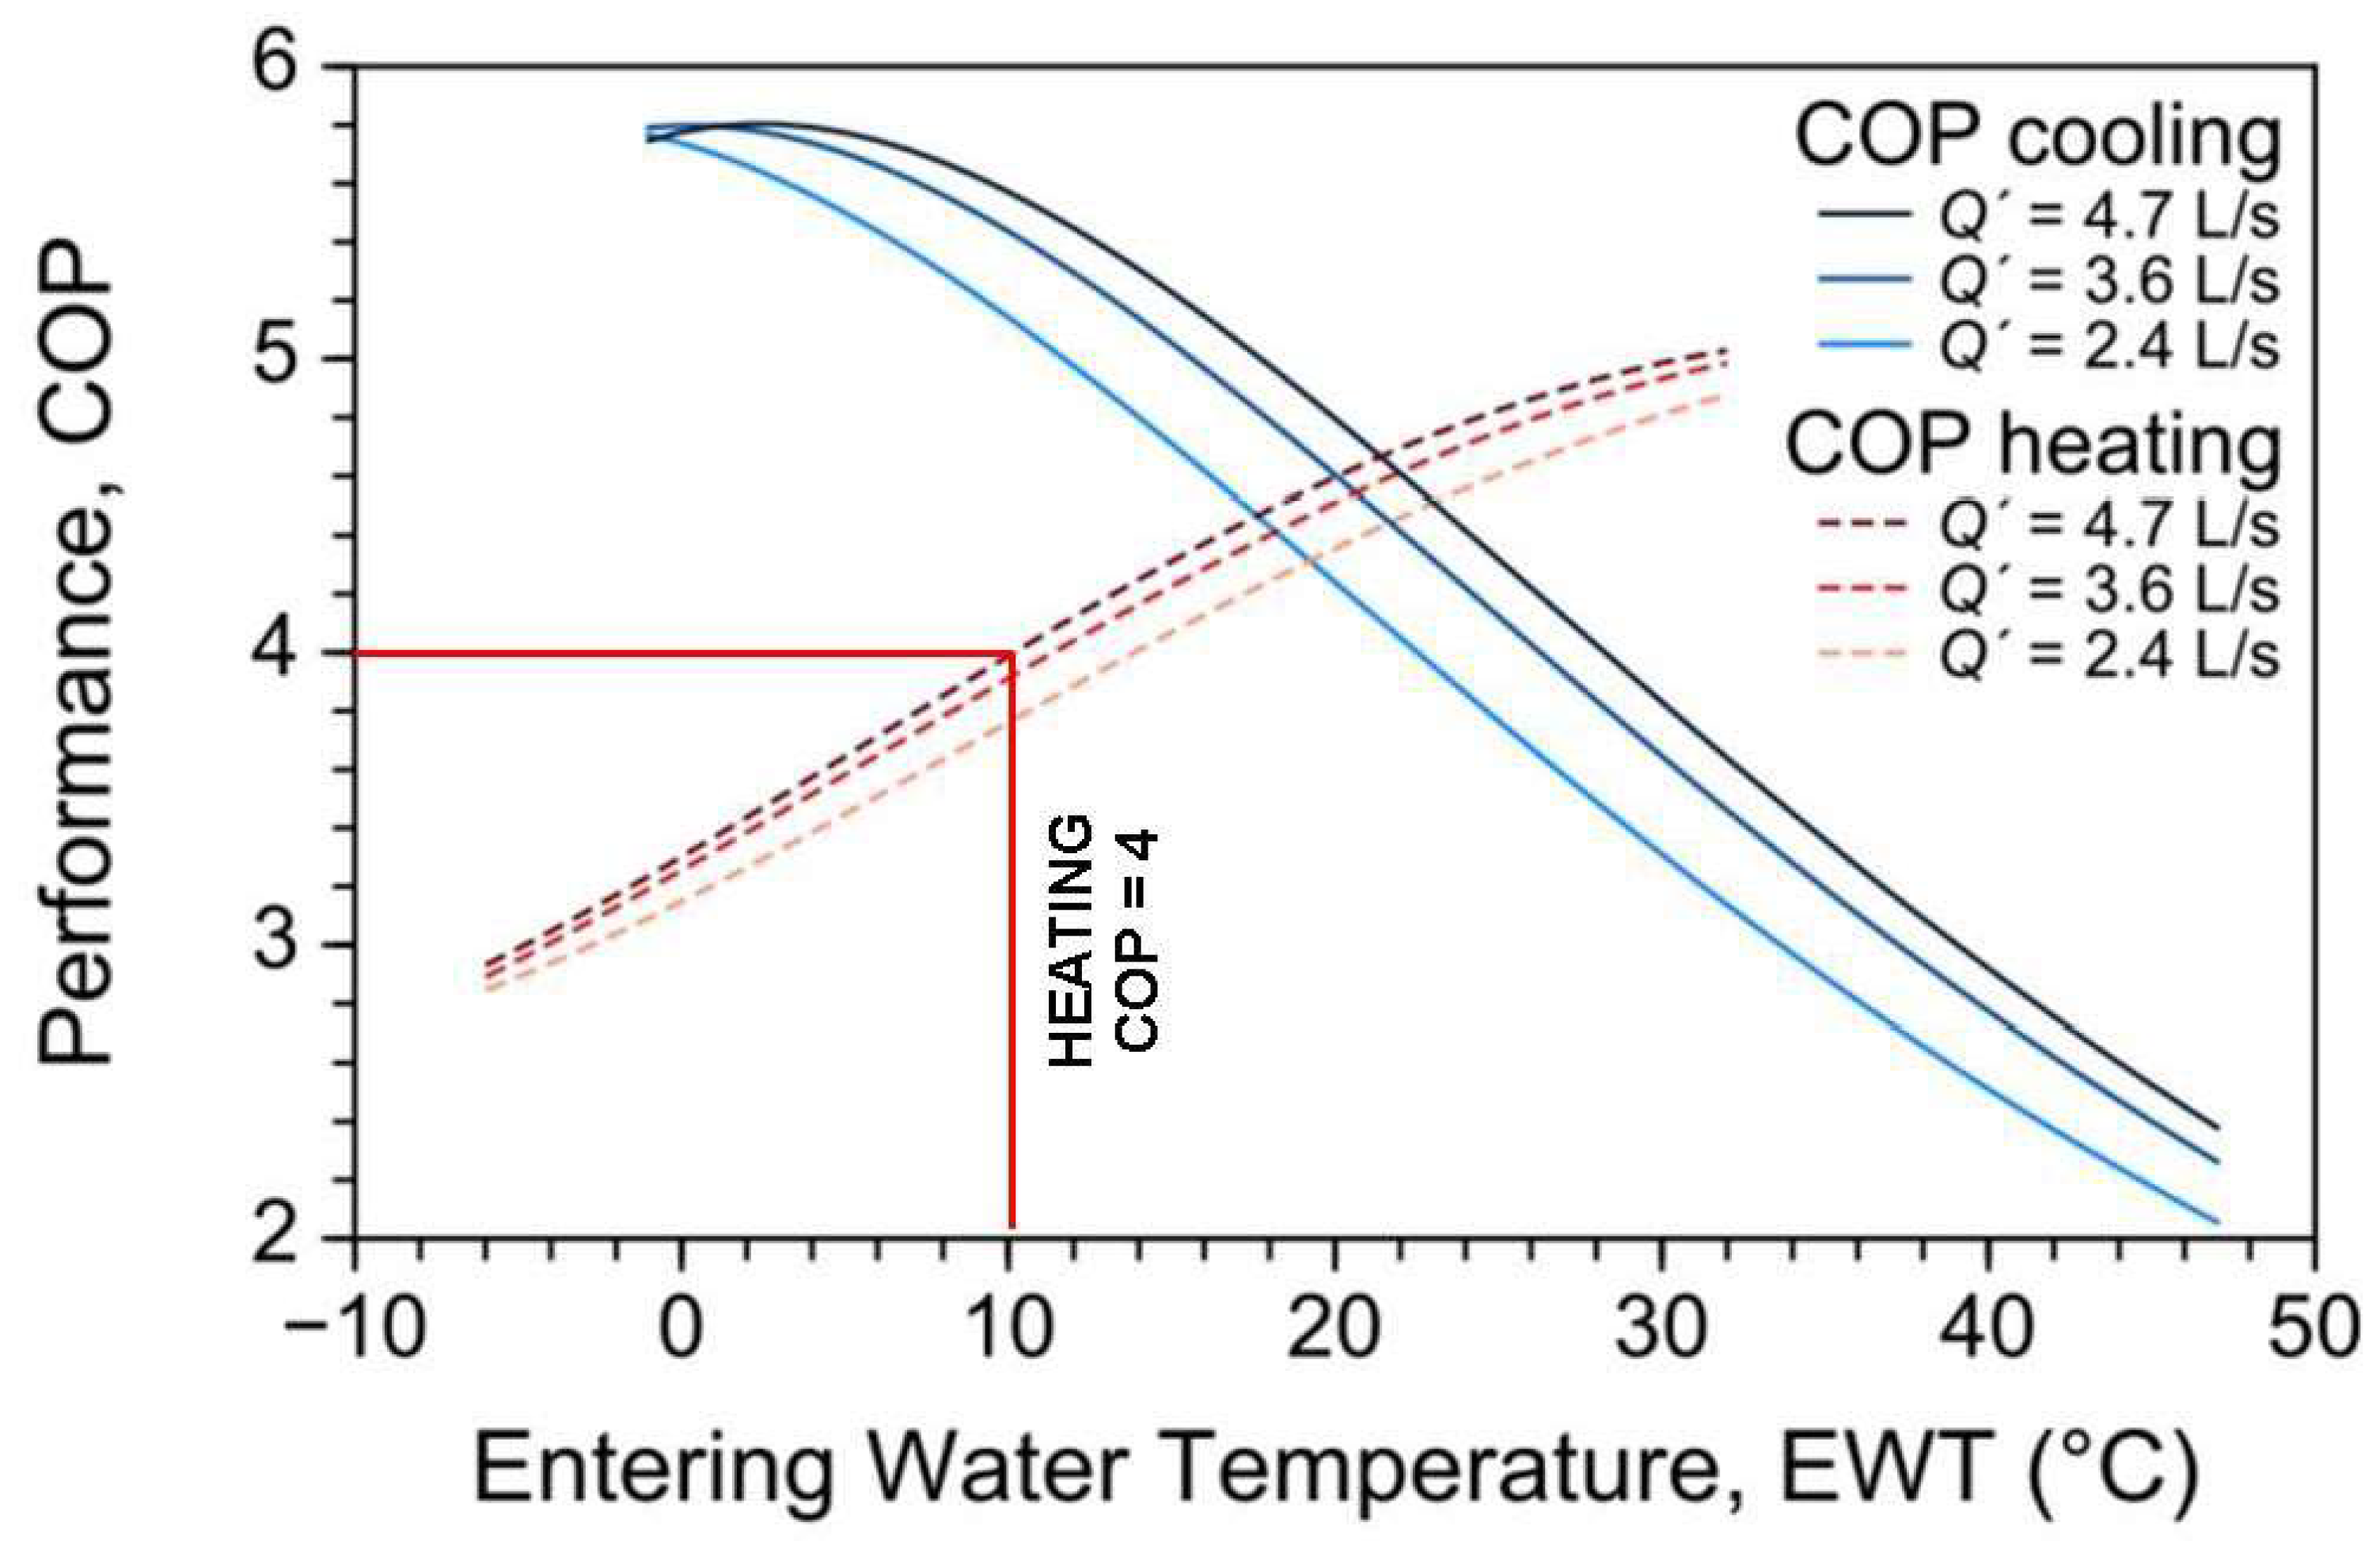
2.4. Evaluation of Heat Extraction Potential

The extraction of heat from the quarry lake water depends on the water temperature and its volume, which are calculated as follows (Equation (1)):
E = v × T × c
where, E (MJ) is the energy available over the heating period, v (m3) is the volume of water in the quarry, ∆T (°C) is the change in water temperature, and c (MJ m−3 K−1) is the volumetric heat capacity (water = 4.18 MJ m−3 K−1).
Note that the energy value is more conveniently expressed in MWh and was converted by dividing the energy value in MJ by 3600 sh−1. The amount of energy was calculated assuming maximum exploitation of the lake by lowering the overall quarry water temperature by 1 degree (∆T = 1) during the heating need period. To estimate the volume of the quarry water, a simplified quarry shape with a maximum depth of 30 m without considering the submerged slopes, was assumed to evaluate temperature that is supposed equal in each water layer. Then, the lake was divided into 5-m layers (Table 2), and the total volume of water in the quarry was estimated to be 6,813,020 m3.
This energy extracted from the volume of water can also be converted into power (MW) according to Equation (2):
P = E t
where P (MW) is the thermal power, E (MJ) is the energy available over the heating period, and t (s) is the time period during which this thermal energy (heat) is extracted.
In addition, the water flow rate (Q) required to extract the energy over a heating period can be calculated. Note that this flow rate means continuous operation 24 h a day for all this period. For this calculation, Equation (3) related to power (P) can be rearranged to find Q (m3 s1) the water extraction rate:
P = Q × T × c
Using a ground-source heat pump system, heat can be produced efficiently depending on the water temperature at the inlet of the heat pump, according to a system-specific coefficient of performance (COP). Because of the entering water temperature for the exploitation of the quarry lake, a conservative COP of four was set for heating (Figure 6).
An energy source, usually electricity, is required to operate the compressor of the ground-source heat pump system. The amount of energy required to operate the system compressor is a function of the COP. This is calculated for the heating of a building (Equation (4)):
COP = Heat provided ( W ) Energy consumed ( W ) = EnergyHeat water + EnergyHeat compressor Energy compressor O r ,   E n e r g y   c o m p r e s s o r = E n e r g y   w a t e r C O P 1
In addition, electric energy consumed by pumping was subtracted from the thermal energy that can be produced considering pumping head loss, i.e., the difference in height between the quarry water level and the pump. For these calculations, the position of the pump was determined at an elevation h of −10 m from the water level (Equation (5)).
E   p u m p = Q × ρ × g × h
where ρ (kg m3) is the density of water (1000 kg m3), g (m s2) is the gravitational acceleration (9.81 m s2), and h (m) is the head loss.
Finally, the total power provided by the heat pump consists of the sums of the thermal power extracted from the quarry lake water (Equation (3)) and the compressor power (Equation (4)).
Energy demand was then determined, to compare with the heat extraction potential of the quarry water. To complete this, the greenhouse energy consumption and associated CO2 emissions in southern Quebec were used [27] and adapted to Italy considering that energy consumption is proportional to Heating Degree Days (HDD), which is a measurement designed to quantify the heating energy demand of a building. HDD are defined relative to the outside temperature below which a building needs heating. The heating requirements for a given building at a specific location are directly proportional to the number of HDD at that location.
Table 3 presents the energy consumption over the year of the best performing greenhouse studied in southern Québec, which is a twin greenhouse made of double polyethylene with north wall and perimeter insulation and the use of a thermal shield.

3. Results

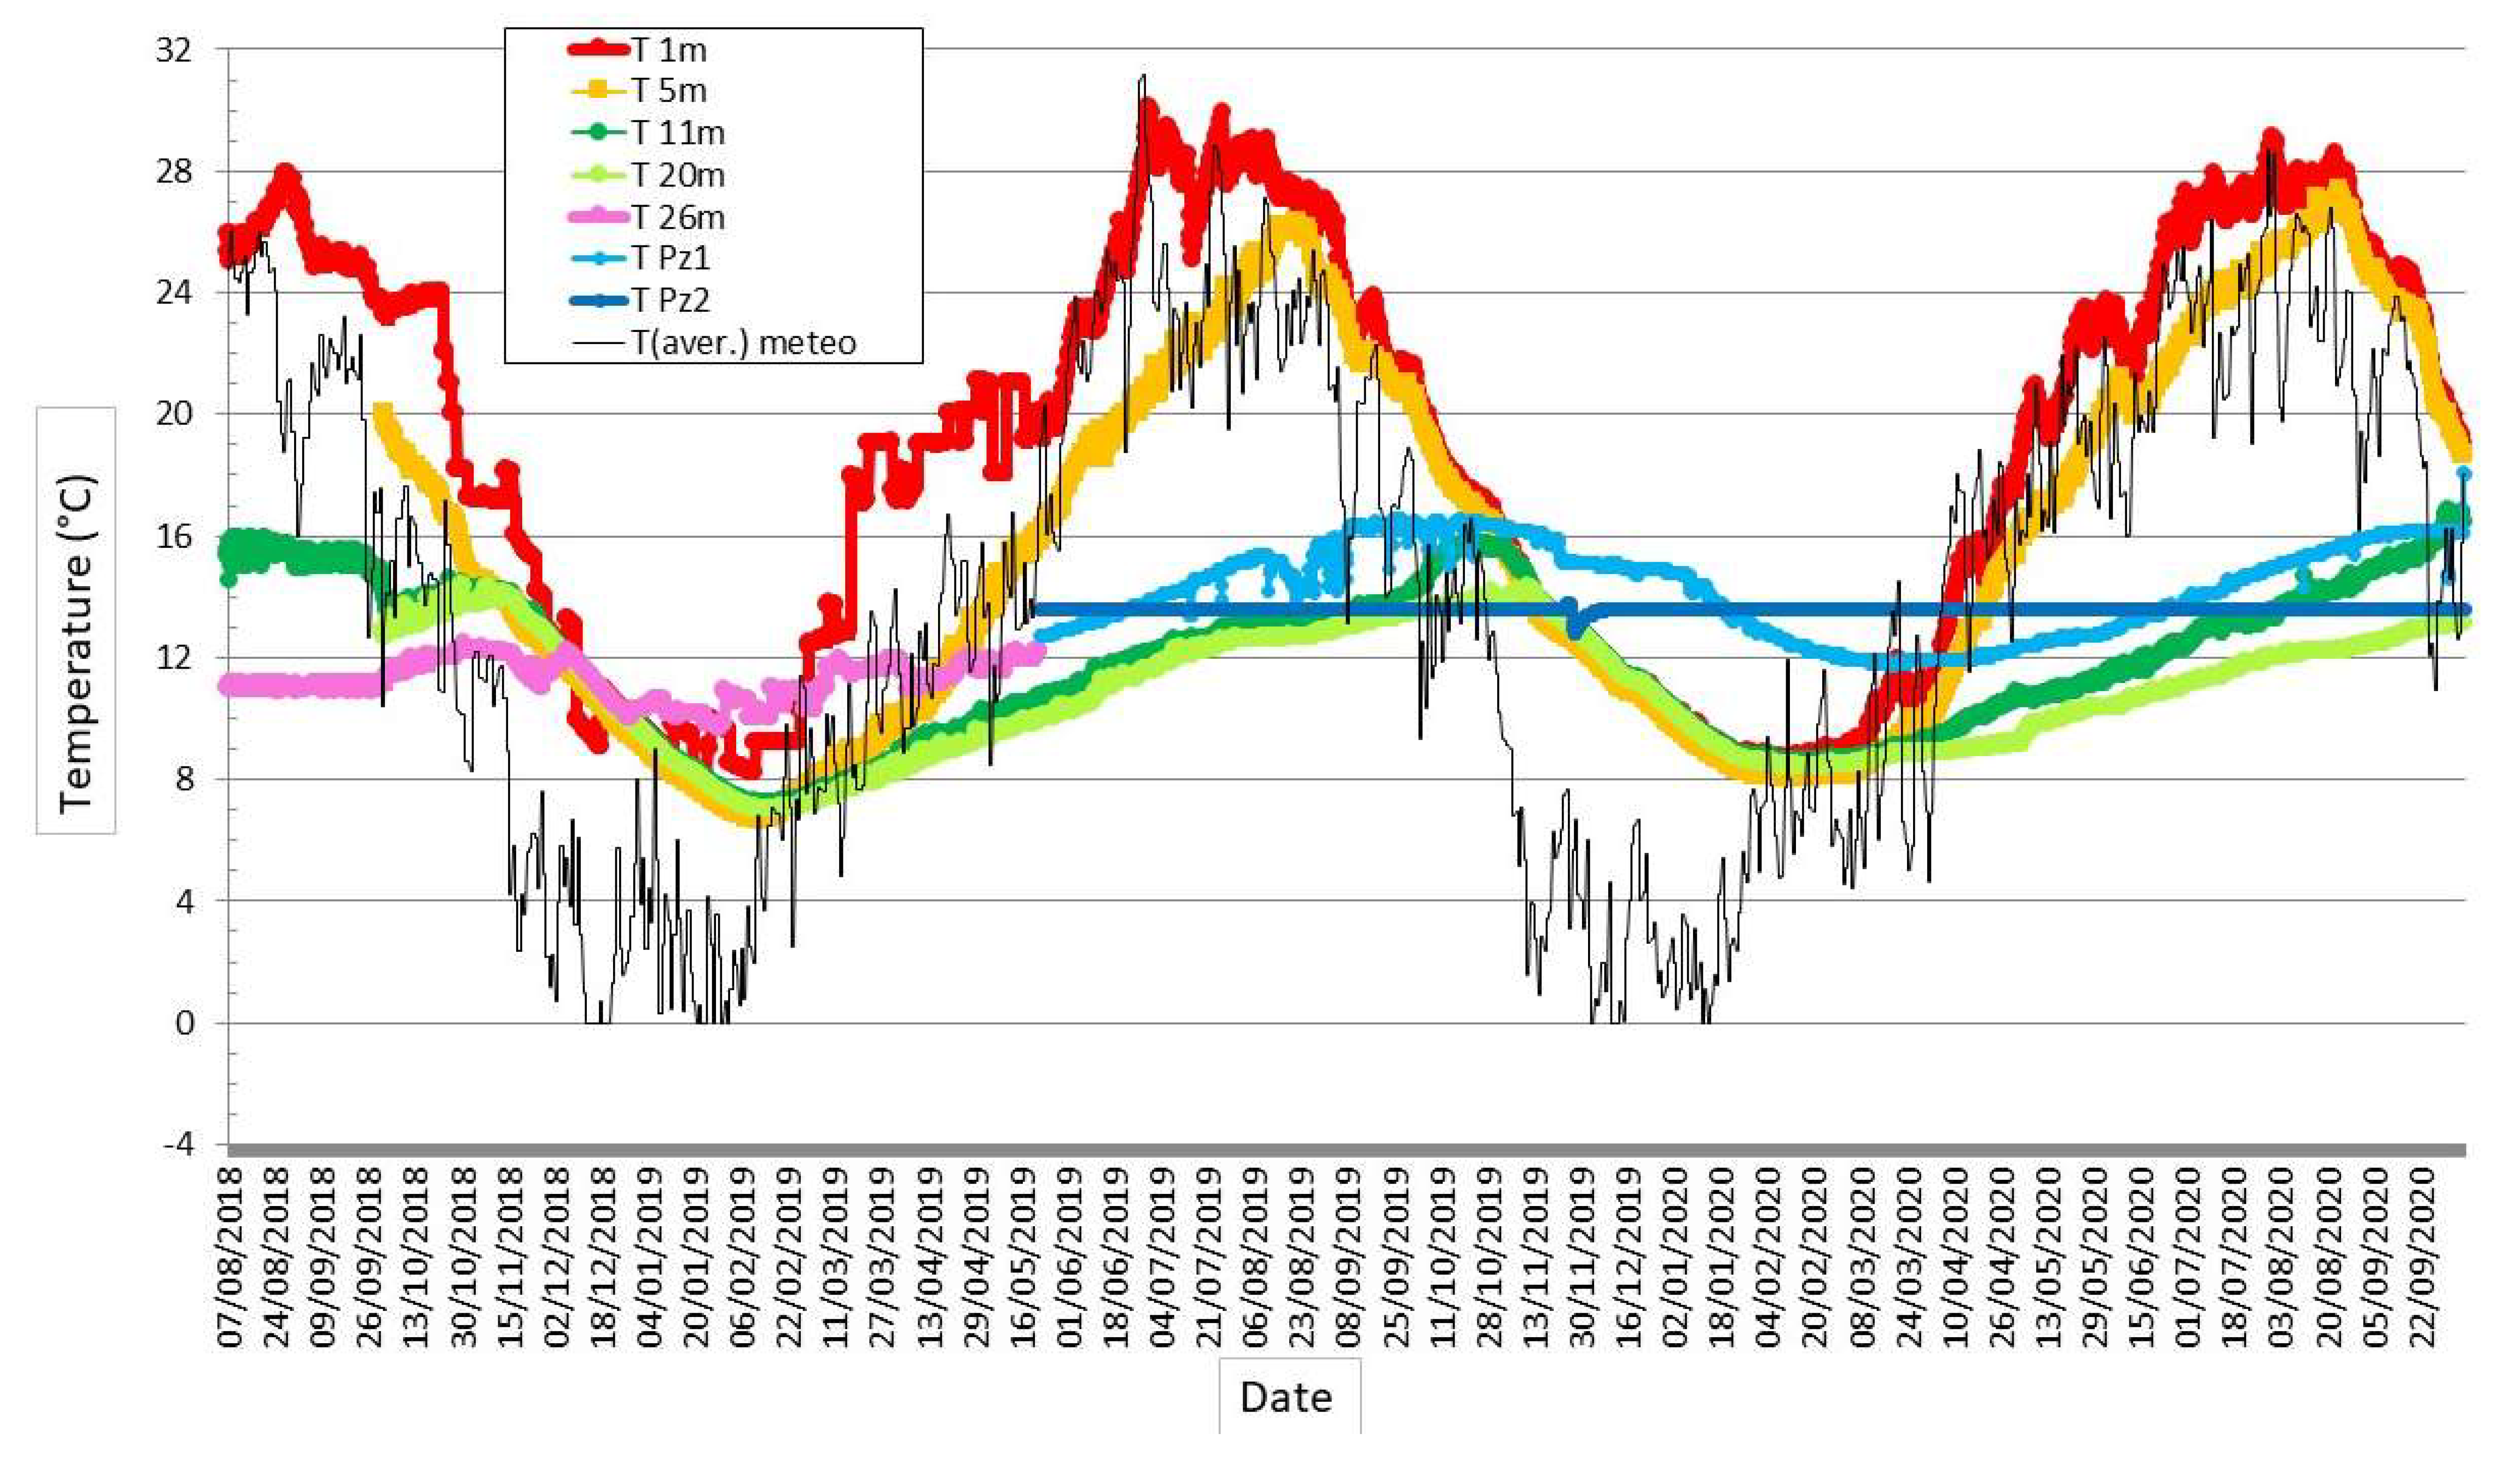
3.1. Temperature Monitoring

More than two years of monitoring, from August 2018 to October 2020, are presented in Figure 7. Two behaviors can be distinguished:
  • from November to March, the lake below five meters’ depth had a rather homogeneous temperature, gradually decreasing from 14 to 7 °C (reached at the end of wintertime), usually higher than the air;
  • from March to November, stratification occurred and the temperatures in the upper five meters of the lake exceeded 25 °C, whereas they remained 14–16 °C below 10 m depth.
This process was progressive: peaks in temperature were reached with some weeks of delay at different depths, highlighting that the water mixing process was quite low. The bottom of the quarry lake behaves similarly to the groundwater, even if its temperature is usually lower (in the range of 2–4 °C). Groundwater temperatures in the aquifer are almost (well Pz1) or completely (well Pz2) unaffected by seasonal variations while in the lake, changes are progressively more evident with increasing distance from the lake’s coastline due to a slow and continuous water exchange between the aquifer and the lake. From about 10 m depth, the temperature is more stable and rarely exceeds 15 °C, while the first meters of water are in equilibrium with the air temperature. The delay between temperature peaks in the atmosphere (and in the higher part of the lake) compared to the bottom of the lake (and the surrounding groundwater) is around three months.
The deepest sensor (−26 m) showed a constant temperature when compared to the others, displaying a slight influence of weather conditions. It seems to be in continuity with Pz1 because it is very close to the lake; this sensor, however, was lost due to mining operations after the first data download, so only the first 10 months of monitoring are available. The data logger installed at −26 m of depth also measured the specific Electrical Conductivity (EC) of water, with values slightly oscillating between 0.86 and 1.1 mS/cm (Figure 8), apparently not correlated with weather conditions (rainfall events).
Of course, due to the short measurement period, any assumption based on these data (i.e., possible correlations between water temperature and the electrical conductivity over different seasons and weather conditions) can be questionable.

3.2. Thermal Energy Potential of the Quarry Lake

Table 4 shows the average water temperature of the quarry lake obtained through interpolation from the collected data to define an average value for each five-meter-thick layer of the quarry. Thus, based on the average monthly temperatures, the heating need period was determined to be from November to April (six months). The average water temperature in the deeper layers of the lake was 10–11 °C and, hence, the choice of a COP = 4 based on a water temperature of 10 °C (see Figure 6) proves a reasonable one.
The monthly energy gains and losses of sensible heat over the year using Equation (1) were calculated (Table 5), considering that ΔT is the difference between the monthly and the yearly average temperature of the water depth of the quarry water lake (Table 4).
By using Equations (1)–(5), the heat extraction potential of the quarry lake water over a period of six months (from November to April) was calculated: assuming a volume of 6,813,020 m3 and a ΔT of 1 °C, the energy produced is 7918 MWh. An output of 1.81 MW can be obtained for every 1 °C extracted from the mine water (expressed as Volume, in m3) assuming that all this energy is recovered during the summer months, from May to October.
Based on the ambient air temperature data at the quarry lake, the HDD (<18 °C) for each month was calculated. This allowed us to estimate the amount of energy needed to heat a greenhouse in the Turin urban area (Table 6), based on greenhouse data from southern Quebec (Table 3) and considering a proportional correlation with the HDDs.
Thus, it was established that 326 kWh are required to heat 1 m2 of greenhouse for the Turin area, which corresponds to the total heating needs from November to April. Table 7 shows the result of the thermal energy generated by the ground-source heat pump.
For each degree of temperature extracted from the quarry water over a period of six months, from November to April, 10,558 MWh can be made available for heating. Using the energy consumption and CO2 emissions values from Table 6, this amount of energy can supply 32,385 m2 of the greenhouse, which corresponds to a saving of 2.9 tons of CO2 e per year if the heat pumps use green electricity.

4. Discussions and Conclusions

Heat pumps systems are among the most energy-efficient solutions for heating/cooling purposes. Heat pumps can exchange heat with air, water, or the ground with different performances and initial costs. According to [28], Ground Source Heat Pumps (GSHP) are more performant than Air Source Heat Pumps (ASHP), so that the Coefficient of Performance (COP) associated with heat pump systems is expected to be variable and low if fed with air, even if cheaper units can be installed [29]. On the other hand, among GSHP systems, it is possible to distinguish closed-loop systems (i.e., Borehole Heat Exchangers) and open-loop ones (i.e., groundwater, lake, river, and sea), of which the latter has the highest efficiency [30,31], also reaching a COP higher than 5.
Focusing on the reuse of quarry lakes for geothermal purposes, we proposed the thermal exploitation of quarry lakes for heated greenhouses as a solution for using them during and after the quarry extraction phase, and we applied this concept to an active quarry close to Turin, NW Italy. We assessed that using a GroundWater Heat Pump (GWHP) system in this context over a period of six months (November to April) would allow for saving 2.9 tons of CO2 per year as well as supplying heat for 32,385 m2 of greenhouse if the heat pumps use green electricity. This is a very important topic to be addressed when deciding on a geothermal solution as well as when facing the environmental recovery of abandoned quarry lakes in defined hydrogeological contexts. In addition, this confirms the better performance of using a GWHP than a GSHP system, especially when a great heat exchange occurs, and the COP stands at around 4.00 at the end of the heating season [30,31,32,33], providing a total power of 2.410 MW. This also fits with the temperature profile inside quarry lakes, testifying to a well-defined stratification during summertime according to [33], where a higher temperature at the top (about 30 °C) and a lower temperature at the bottom (around 14 °C) occur.
Aimed at understanding the thermal behavior of the artificial lakes, the obtained results show how the quarry lake water is affected by atmospheric temperatures changes, although a delay for water to warm or cool was verified. Even if more pronounced within the first −5 m depth, a strong influence of the weather conditions on the lake’s waters was observed until −20 m in depth. This confirms a homogenous temperature reservoir in wintertime, while water stratification occurs in the summertime and could be compared with the thermal behavior of natural lakes [34,35]. Relationships between quarry lake water and groundwater have been qualitatively highlighted. A stable quarry lake water at its base confirms an exchange between these two kinds of water even if this process can affect only the surrounding groundwater volume. In fact, it is noted that about 90 m away from the border of the lake, the groundwater follows a linear trend with a constant temperature over the whole year. The study thus demonstrated a more stable condition in groundwater outside the quarry lake.
The recovery of dismissed quarries or mines lakes can lead to the following important questions:
(1)
what are the environmental procedures to be followed?
(2)
can quarry lakes be used to obtain low-cost thermal energy, especially for agricultural needs (i.e., greenhouses or agribusiness factories)?
(3)
is this process sustainable and are there additional benefits?
At first, the investigated quarry lake and the surrounding ones face environmental risks that need to be addressed before being abandoned; this can entail high costs. Therefore, a sustainable and active restoration is recommended. The obtained results show how the use of GWHP in these contexts, as a low-cost and sustainable energy alternative, can play an important role in restoration activities and could be addressed to agricultural, industrial, or civil uses.
An environmental recovery of abandoned or ending mining activities falls within the main objectives of local authorities to contribute to a virtuous territorial circular economy. For example, there could be an incentive to choose these local foods over those coming from far away. In this way, the restored area remains under societal and civil controls, and marginal activities (often recorded in abandoned mining sites) could be avoided.
In conclusion, when dealing with low enthalpy geothermal open-loop systems, the absence of seasonal fluctuations ensures better performances. Water pumping for a heat pump operation should take place at different depths mainly depending on the different hydrogeological conditions, but, usually, temperature stability can be reached between −15 and −30 m below the ground. In an alluvial context, such as this one, seasonal fluctuations do not occur from −15 to −20 m in depth. This is very interesting for geothermal purposes and hence for the recovery of dismissed quarry lakes.
Our study provided a first assessment of the potential of quarry lakes to provide sustainable heating. The methodology proposed could be extended to several other quarry lakes, some of them located close to settlements: in these cases, district heating could also be considered as an option. Quarry lakes could be also considered as an ideal place for cooling; however, due to the large quantity of water available, a good performance for heating is also ensured.

Author Contributions

Conceptualization, G.M.; J.M.C., N.G. and A.C.; methodology, J.M.C., F.-A.C. and G.M.; validation, J.M.C., G.M. and F.-A.C.; investigation, J.M.C. and F.-A.C.; data curation, J.M.C., F.-A.C., G.M., N.G., J.R., A.C. and C.C.; writing—original draft preparation, J.M.C., G.M. and F.-A.C.; writing—review and editing, J.M.C., G.M., F.-A.C., N.G., J.R., A.C. and C.C.; supervision, G.M. and J.R. All authors have read and agreed to the published version of the manuscript.

Funding

Program ‘Coopération bilatérale Québec-Italie’ from the ‘Ministère des Relations internationales et de la Francophonie’ of the Québec provincial gouvernement.

Institutional Review Board Statement

Not applicable.

Informed Consent Statement

Not applicable.

Data Availability Statement

Weather data as reported in Figure 4 and Figure 7 (reference [25]): http://www.geoportale.piemonte.it/geocatalogorp/?sezione=mappa, accessed on 13 November 2021.

Acknowledgments

Many thanks to Cave Provana SpA and in particular, to Dott. Geol. Massimo Tridente and Dott. Geol. Andrea Giuliani for assisting us with obtaining all needed authorizations, as well as for helping with the installation of thermal sensors inside the quarry lake.

Conflicts of Interest

The authors declare no conflict of interest.

References

  1. Castagna, S.; Dino, G.A.; Lasagna, M.; de Luca, D.A. Environmental Issues Connected to the Quarry Lakes and Chance to Reuse Fine Materials Deriving from Aggregate Treatments. In Engineering Geology for Society and Territory—Volume 5; Lollino, G., Manconi, A., Guzzetti, F., Culshaw, M., Bobrowsky, P., Luino, F., Eds.; Springer International Publishing: Cham, Switzerland, 2015; pp. 71–74. [Google Scholar]
  2. Jawecki, B.; Dąbek, P.B.; Pawęska, K.; Wei, X. Estimating Water Retention in Post-Mining Excavations Using LiDAR ALS Data for the Strzelin Quarry, in Lower Silesia. Mine Water Environ. 2018, 37, 744–753. [Google Scholar] [CrossRef] [Green Version]
  3. Molenda, T.; Ciupa, T.; Suligowski, R. The Properties of Reservoir Water in Post-Mining Excavations of Cambrian and Devonian Quartzite Sandstones (Holy Cross Mountains). Env. Earth Sci. 2020, 79, 310. [Google Scholar] [CrossRef]
  4. Kivinen, S. Sustainable Post-Mining Land Use: Are Closed Metal Mines Abandoned or Re-Used Space? Sustainability 2017, 9, 1705. [Google Scholar] [CrossRef] [Green Version]
  5. Peralta Ramos, E.; Breede, K.; Falcone, G. Geothermal Heat Recovery from Abandoned Mines: A Systematic Review of Projects Implemented Worldwide and a Methodology for Screening New Projects. Environ. Earth Sci. 2015, 73, 6783–6795. [Google Scholar] [CrossRef]
  6. Jessop, A. Geothermal Energy from Old Mines at Springhill, Nova Scotia, Canada; World geothermal Congress: Florence, Italy, 1995. [Google Scholar]
  7. Raymond, J.; Therrien, R. Low-Temperature Geothermal Potential of the Flooded Gaspé Mines, Québec, Canada. Geothermics 2008, 37, 189–210. [Google Scholar] [CrossRef]
  8. Hall, A.; Scott, J.A.; Shang, H. Geothermal Energy Recovery from Underground Mines. Renew. Sustain. Energy Rev. 2011, 15, 916–924. [Google Scholar] [CrossRef]
  9. Raymond, J.; Therrien, R. Optimizing the Design of a Geothermal District Heating and Cooling System Located at a Flooded Mine in Canada. Hydrogeol. J. 2014, 22, 217–231. [Google Scholar] [CrossRef]
  10. Casasso, A.; Tosco, T.; Bianco, C.; Bucci, A.; Sethi, R. How Can We Make Pump and Treat Systems More Energetically Sustainable? Water 2019, 12, 67. [Google Scholar] [CrossRef] [Green Version]
  11. Loredo, C.; Roqueñí, N.; Ordóñez, A. Modelling Flow and Heat Transfer in Flooded Mines for Geothermal Energy Use: A Review. Int. J. Coal Geol. 2016, 164, 115–122. [Google Scholar] [CrossRef]
  12. Al-Habaibeh, A.; Athresh, A.P.; Parker, K. Performance Analysis of Using Mine Water from an Abandoned Coal Mine for Heating of Buildings Using an Open Loop Based Single Shaft GSHP System. Appl. Energy 2018, 211, 393–402. [Google Scholar] [CrossRef] [Green Version]
  13. Comeau, F.-A.; Raymond, J.; Ngoyo Mandemyo, D. Évaluation Du Potentiel Géothermique Des Mines Désaffectées de Société Asbestos Limitée à Thetford Mines (Evaluation of Geothermal Potential of Former Asbestos Mines in Thetford Mines); INRS: Quebec City, QC, Canada, 2019. [Google Scholar]
  14. Giordano, N.; Canalis, L.; Ceppa, L.; Comina, C.; Degiorgis, L.; Giuliani, A.; Mandrone, G.; Marcon, G. How open-loop heat pumps on lakes can help environmental control: An example of geothermal circular economy. In Proceedings of the European Geothermal Congress, Strasbourg, France, 19–24 September 2016; pp. 1–9. [Google Scholar]
  15. Banks, D. Thermogeological Assessment of Open-Loop Well-Doublet Schemes: A Review and Synthesis of Analytical Approaches. Hydrogeol. J. 2009, 17, 1149–1155. [Google Scholar] [CrossRef]
  16. Preene, M.; Younger, P.L. Can You Take the Heat?—Geothermal Energy in Mining. Min. Technol. 2014, 123, 107–118. [Google Scholar] [CrossRef] [Green Version]
  17. Self, S.J.; Reddy, B.V.; Rosen, M.A. Geothermal Heat Pump Systems: Status Review and Comparison with Other Heating Options. Appl. Energy 2013, 101, 341–348. [Google Scholar] [CrossRef]
  18. Bertoldi, P.; Avgerinou, M.; Castellazzi, L. Trends in Data Centre Energy Consumption under the European Code of Conduct for Data Centre Energy Efficiency; EUR 28874 EN; Publications Office of the European Union: Luxembourg, Luxembourg, 2017; JRC108354. [Google Scholar] [CrossRef]
  19. IRENA, IEA, REN21. Renewable Energy Policies in a Time of Transition: Heating and Cooling. IRENA, OECD/IEA and REN21, 2020. Available online: https://www.irena.org/publications/2020/Nov/Renewable-energy-policies-in-a-time-of-transition-Heating-and-cooling (accessed on 13 November 2021).
  20. Koronen, C.; Åhman, M.; Nilsson, L.J. Data centres in future European energy systems—Energy efficiency, integration and policy. Energy Effic. 2020, 13, 129–144. [Google Scholar] [CrossRef] [Green Version]
  21. Biella, G.; Polino, R.; de Franco, R.; Rossi, P.M.; Clari, P.; Corsi, A.; Gelati, R. The crustal structure of the western Po plain: Reconstruction from integrated geological and seismic data. Terra Nova 1997, 9, 28–31. [Google Scholar] [CrossRef]
  22. Piana, F.; Fioraso, G.; Irace, A.; Mosca, P.; D’Atri, A.; Barale, L.; Falletti, P.; Monegato, G.; Morelli, M.; Tallone, S.; et al. Geology of Piemonte region (NW Italy, Alps–Apennines interference zone). J. Maps 2017, 13, 395–405. [Google Scholar] [CrossRef]
  23. Mas-Pla, J.; Menció, A. Groundwater nitrate pollution and climate change: Learnings from a water balance-based analysis of several aquifers in a western Mediterranean region (Catalonia). Environ. Sci. Pollut. Res. 2019, 26, 2184–2202. [Google Scholar] [CrossRef] [PubMed] [Green Version]
  24. Visser, A.-N.; Lehmann, M.F.; Rügner, H.; D’Affonseca, F.M.; Grathwohl, P.; Blackwell, N.; Kappler, A.; Osenbrück, K. Fate of nitrate during groundwater recharge in a fractured karst aquifer in Southwest Germany. Hydrogeol. J. 2021, 29, 1153–1171. [Google Scholar] [CrossRef]
  25. CSI Piemonte. Geopiemonte. Ambiente Energia, Territorio, Regione Piemonte. Available online: http://www.geoportale.piemonte.it/geocatalogorp/?sezione=mappa (accessed on 22 April 2021).
  26. Raymond, J. Colloquium 2016: Assessment of subsurface thermal conductivity for geothermal applications. Can. Geothech. J. 2018, 55, 1209–1229. [Google Scholar] [CrossRef] [Green Version]
  27. Pelletier, F.; Godbout, S. Consommation d’énergie et émissions de gaz à effet de serre en production serricole au Québec. Institut de Recherche et de Développement en Agroenvironnement. Québec, Projet IRDA 400023. 2017, p. 36. Available online: https://www.serres.quebec/consommation-energetique-et-emissions-de-ges/ (accessed on 13 November 2021).
  28. Maddah, S.; Goodarzi, M.; Safaei, M.R. Comparative study of the performance of air and geothermal sources of heat pumps cycle operating with various refrigerants and vapor injection. Alex. Engin. J. 2020, 59, 4037–4047. [Google Scholar] [CrossRef]
  29. Johnson, R.K. Measured Performance of a Low Temperature Air Source Heat Pump; US Department of Energy, Building Technologies Offices: Washington, DC, USA, 2013. [Google Scholar]
  30. Lei, F.; Hu, P. A comparative study on long-term energy efficiency of two kinds of ground-source heat pump systems. Adv. Mat. Res. 2014, 1070–1072, 349–352. [Google Scholar] [CrossRef]
  31. Giordano, N.; Riggi, L.; Della Valentina, S.; Casasso, A.; Mandrone, G.; Raymond, J. Efficiency evaluation of borehole heat exchangers in Nunavik, Québec, Canada. In Proceedings of the 25th IIR International Congress of Refrigeration, Montreal, QC, Canada, 24–30 September 2019; pp. 4381–4388. [Google Scholar] [CrossRef]
  32. Sarbu, I.; Sebachievici, C. Using Ground-Source Heat Pump Systems for Heating/Cooling of Buildings. In Advances in Geothermal Energy; Ismail, B., Ed.; IntechOpen: London, UK, 2015. [Google Scholar] [CrossRef] [Green Version]
  33. Seelen, L.M.S.; Teurlincx, S.; Bruinsma, J.; Huijsmans, T.M.F.; van Donk, E.; Lurling, M.; de Senerpont Domis, L.N. The value of novel cosystems: Disclosing the ecological quality of quarry lakes. Sci. Total. Environ. 2020, 769, 1–11. [Google Scholar]
  34. Sahoo, G.B.; Schladow, S.G.; Reuter, J.E.; Coats, R. Effects of climate change on thermal properties of lakes and reservoirs, and possible implications. Stoch. Environ. Res. Risk Assess. 2011, 25, 445–456. [Google Scholar] [CrossRef] [Green Version]
  35. Prats, J.; Roubeix, V.; Reynaud, N.; Tormos, T.; Danis, P.A. The thermal behaviour of French water bodies: From ponds to Lake Geneva. J. Great Lakes Res. 2020, 46, 718–731. [Google Scholar] [CrossRef]
Figure 1. Location of the study area (the red square): artificial quarry lakes along the Po River south of Turin (NW Italy) can be well identified.
Water 13 03560 g001
Figure 2. Ground-source heat pump systems using surface water from closed and flooded open-pit mines. Adapted from Ref. [14].
Water 13 03560 g002
Figure 3. Geological map of Piedmont (NW-Italy), modified from [22]: the red star highlights the study area.
Water 13 03560 g003
Figure 4. Temperature distribution (monthly averages) at the “Provana” quarry lake (modified from [25]).
Water 13 03560 g004
Figure 5. Aerial view of the “Provana” quarry. Keys: L1 and L2 are the locations of sensors for continuous monitoring of lake temperature, Pz1 and Pz2 are the two piezometers where temperature sensors were installed. For each log and piezometer, a schematic representation with sensors at different depths is shown on the left (T = water temperature, P = water column pressure, and EC = electrical conductivity).
Water 13 03560 g005
Figure 6. Coefficient of performance (COP) of a water-to-air heat pump system in heating and cooling mode according to the temperature and flow rate of the water entering the system [26].
Water 13 03560 g006
Figure 7. Water temperatures (T; °C) from over more than 2 years of monitoring at different depths inside the “Provana” quarry lake (red, yellow, light green, dark green, and pink lines), groundwater temperatures measured at Pz1 (light blue) and Pz2 (dark blue); the average daily atmospheric temperature (black line).
Water 13 03560 g007
Figure 8. Water temperature vs. electrical conductivity at the bottom of the lake (−26 m) and rainfalls.
Water 13 03560 g008
Table 1. Main specifications of the used devices: Depth (m), kind of device, location (referred to Figure 5), recording time (h), temperature accuracy (°C), and pressure accuracy (mm H2O).
Depth (m)DeviceIDRecording Time (h)Temperature Accuracy (°C)Pressure
Accuracy (mmH2O)
−1Mini Diver (Van Essen Instruments, Tucker, GA, USA)L160.12.5
−5Levelogger Edge (Solinst Canada LTD, Ontario, Canada)L210.051.5
−11Mini Diver (Van Essen Instruments, Tucker, GA, USA)L160.12.5
−15Microtemp
(Madgetech Inc., Warner NH USA)
Pz110.5/
−15Microtemp Madgetech
(Madgetech Inc., Warner NH USA)
Pz210.5/
−20Levelogger Edge Solinst (Canada LTD, Georgetown, Ontario, Canada)L210.051.5
−26CTD Diver (Van Essen Instruments, Tucker GA USA)L160.12.5
Table 2. Estimated area and volume for each 5-m-thick layer of quarry water.
Depth SlicesArea (m2)Volume (m3)
0–5 m325,0001,625,000
5–10 m281,7181,408,591
10–15 m241,5281,207,640
15–20 m204,4291,022,146
20–25 m170,422852,111
25–30 m139,507697,533
6,813,020
Table 3. Heating Degree Days (HDD), energy consumption, and CO2 emissions for a greenhouse in Southern Quebec [27].
JANFEBMARAPRMAYJUNJULAUGSEPOCTNOVDEC
HHD (<18 °C)88476664136315638923117305501768
Energy needs (kWh m−2)135117985624614184777118
kg CO2e from oil [m−2]3732271572015132132
kg CO2e from natural gas [m−2]242118104101381421
kg CO2e from propane [m−2]3026211251014101726
Table 4. Average monthly temperature values of the quarry according to the ambient air and water depth, from high (red color) to low (in green) temperature.
mJANFEBMARAPRMAYJUNJULAUGSEPOCTNOVDECAVERAGE
YEARNOV to APR
air2.66.38.913.816.622.623.823.619.313.96.72.313.46.8
Pz113.912.411.912.012.713.314.415.216.116.315.915.014.113.5
Pz213.613.613.613.613.613.613.613.613.613.613.513.613.613.6
0–58.98.210.814.318.322.025.426.423.421.515.711.017.211.5
5–108.77.78.610.913.916.518.820.919.419.215.311.014.310.4
10–158.97.98.49.610.912.213.414.814.915.014.111.311.810.0
15–208.97.88.29.110.111.012.112.913.413.913.811.211.09.8
20–259.48.99.59.910.711.111.611.812.112.912.911.111.010.3
25–3010.210.511.411.411.911.611.311.011.011.811.911.111.311.1
Table 5. Energy gains (in red) and losses (in yellow) of the quarry lake over the year.
E (MWh)
mJANFEBMARAPRMAYJUNJULAUGSEPOCTNOVDEC
0–5−15,624−16,930−12,080−54712139921815,47117,54011,8778284−2704−11,721
5–10−9108−10,699−9207−5511−5233711744610,882840681521721−5270
10–15−4019−5472−4756−3042−120552322904166444045323258−714
15–20−2532−3796−3309−2317−1167−1112422219281233943260205
20–25−1580−2050−1475−1055−328104584806111018431916123
25–30−877−57910613149326128−204−188434506−111
TOTAL−33,740−39,526−30,721−17,266−59013,80727,06235,40928,45726,6387957−17,488
Table 6. Heating degree days (HDD), energy consumption, and CO2 emissions in greenhouse production for the quarry lake under study, based on data from southern Quebec. Moreover, the use of heat pumps saves 89 kg CO2e per m2 of greenhouse, compared to the use of fuel oil for heating. The heating period in the Turin area corresponds from November to April.
JANFEBMARAPRMAYJUNJULAUGSEPOCTNOVDEC
HHD (<18 °C)48236327015910400023,9130372481
Energy needs (kWh m−2)74554125160004205774
kg CO2e for oil [m−2]20151175000161620
kg CO2e natural gas [m−2]1310843000131013
kg CO2e propane [m−2]1612953000141316
Table 7. Capacity to generate thermal energy from the quarry water according to the overall temperature extracted.
ParametersΔT = 1
Thermal power extracted from the lake (MW)1.808
Pumping rate (m3 s−1)0.432
Coefficient of performance (COP)4.00
Compressor power (MW)0.603
Pumping power (MW)−0.042
Total power provided by the heat pump (MW)2.410
Efficiency ratio (%)73
Total energy (MW h)10,558
Energy for 1 m2 of greenhouse (MWh)0.326
Heatable greenhouse area (m2)32,385
CO2e emissions with oil (kg)2,879,770
Publisher’s Note: MDPI stays neutral with regard to jurisdictional claims in published maps and institutional affiliations.

