
Synergistic Degradation of Chloramphenicol by an Ultrasound-Enhanced Fenton-like Sponge Iron System


State Key Laboratory of Bio-Based Material and Green Papermaking/Key Laboratory of Pulp & Paper Science and Technology of Education Ministry of China, Qilu University of Technology, Jinan 250353, China
*
Authors to whom correspondence should be addressed.
Water 2021, 13(24), 3561; https://doi.org/10.3390/w13243561
Submission received: 6 November 2021
/
Revised: 4 December 2021
/
Accepted: 10 December 2021
/
Published: 13 December 2021
(This article belongs to the Section Wastewater Treatment and Reuse)
Abstract
:In this study, an ultrasound Fenton-like sponge iron system was used to enhance the degradation efficiency for chloramphenicol (CAP). Three single-factor experiments of reaction pH, hydrogen peroxide (H2O2) concentration, and sponge iron (Fe) concentration were used to explore the impact on CAP degradation efficiency. The response surface method revealed the interactions between various factors. The degradation efficiency for CAP was as high as 99.97% at pH = 3, 3.19 mmol/L H2O2, and a sponge iron concentration of 2.26 g/L. The degradation rate for CAP was significantly reduced upon the addition of some inorganic salts, mainly due to the quenching of OH radicals. Gram-negative (G(−)) Escherichia coli and Gram-positive (G(+)) Staphylococcus aureus were used to evaluate the changes in the antibacterial activity of CAP. Finally, gas chromatography/mass spectrometry (GC-MS) was used to identify the degradation products and the degradation path for the products was proposed based on the detected products.
1. Introduction
Antibiotic drugs and personal care products are common in natural water environments, and their potential adverse reactions have received widespread attention [1,2]. Antibiotics are not easily biodegradable and gradually accumulate in water, leading to antibiotic-resistant microorganisms. China is the world’s largest producer and consumer of antibiotics and developing tools to minimize antibiotics in wastewater is an urgent problem [3]. Chloramphenicol (CAP) is a typical representative of broad-spectrum antibiotics, which has a good inhibitory effect on Gram-positive brucella and Gram-negative chlamydia [4]. The accumulation of CAP in the human body can cause serious adverse reactions such as liver and kidney damage, optic nerve atrophy, and hematopoietic dysfunction [4].
The traditional methods of removing CAP include chemical precipitation, activated carbon adsorption, and activated sludge [5]. However, these technologies have disadvantages such as high costs or difficulties in sludge disposal, which is not conducive to CAP treatment [6]. CAP pollutants are difficult to completely degrade with biological treatment technology, but advanced oxidation processes can efficiently degrade and effectively mineralize pollutants [7]. The working principle of advanced oxidation processes is to generate hydroxyl radicals (·OH) that are non-selective and can rapidly oxidize and mineralize stubborn pollutants [8]. Fenton, Fenton-like, photocatalytic, and ultrasonic technologies, among others, are used to treat stubborn pollutants [9,10]. Fenton and Fenton-like reactions are the most promising processes that can effectively treat multiple pollutants [11,12].
Sponge iron has attracted much attention because of its rich content, low price, and good degradation efficiency in organic waste [13]. Xie and colleagues used a biological sponge iron Fenton system to degrade aniline. It has the obvious advantages of removing refractory pollutants [14]. The zero-valent iron (ZVI, Fe0) in sponge iron accounts for more than 90% of the total iron, which has high surface activity, looser micropores, and good removal effects on trace pollutants in water [15]. The presence of ultrasound (US) can further enhance the Fenton-like reaction effects mainly because this treatment will produce unique physical and chemical effects to accelerate the conversion of hydroxyl radicals [16]. Concurrently, the cavitation produced by US can effectively remove oxides or other impurities on the surface of sponge iron to further accelerate the corrosion of sponge iron and improve its catalytic performance [17]. In addition, US produces a powerful mechanical effect that can enhance mass transfer at the solid–liquid interface [18]. Therefore, combining US with sponge iron can activate the Fenton reaction and may increase the synergistic effect of pollutant degradation. The response surface method (RSM) can simultaneously optimize multiple process variables under complex interaction conditions. In this way, comprehensive data analysis results can be obtained through a small number of experiments, which can reduce experimental time and cost [19]. It is very important to use optimization methods in the CAP degradation process.
Thus, the degradation characteristics of CAP in the US/Fenton-like process requires further study. The effects of various reaction parameters (pH, hydrogen peroxide concentration, and sponge iron concentration) were evaluated in single-factor experiments and response surface analysis to maximize the degradation efficiency of CAP. Gram-negative (G(−)) Escherichia coli and Gram-positive (G(+)) Staphylococcus aureus were used to evaluate the changes in the antibacterial activity of CAP. Finally, GC-MS was used to identify the product, and the degradation path of the product was proposed based on the detected product.
2. Materials and Methods
2.1. Materials
Chloramphenicol was obtained from Sigma-Aldrich (Shanghai, China) without further purification. The sponge iron was purchased from Guangzhou Weijia Technology Co., Ltd. (Guangzhou, China). with a particle size of 1–3 mm. Before use, the sponge iron needs to be decontaminated and activated with 5% (v/v) hydrochloric acid for about 20 min and then rinsed with deionized water until it reaches a neutral pH. The chemical analysis of sponge iron after treatment showed zero-valent iron (above 93.8%), iron oxide (3.5%), and carbon (2.7%). H2O2 at 30% concentration was purchased from Jinan Qiguang Technology and Trade Co., Ltd. (Jinan, China), diluted to 0.2 mol/L, and stored in the dark. Gram-negative (G(−)) Escherichia coli and Gram-positive (G(+)) Staphylococcus aureus were obtained from the School of Food and Bioengineering, Qilu University of Technology. Luria-Bertani (LB) culture media, N,O-bistrimethylsilyl trifluoroacetamide (BSTFA) and trimethylchlorosilane (TMCS), hydrochloric acid, sodium hydroxide, and other drugs were purchased from Macleans. All other chemicals were of analytical grade and used without further purification. The experimental equipment was as follows: ultrasonic reaction vessel (XO-1000D, Nanjing, China, frequency: 20 KHZ, Power: 200 W), high-performance liquid chromatography (HPLC, LC-20AT, Shimadzu, Japan), gas chromatography-mass spectrometry (GC-MS) analysis (Agilent, 7890B, Palo Alto, CA, USA), scanning electron microscopy (SEM, Quanta 200, New York, NY, USA), micromeritics ASAP 2020 sorptometer (Maike, Atlanta, GA, USA), and total organic carbon (TOC) analyzer (TOC-L, Shimadzu, Shimadzu, Japan).
2.2. Procedure
In this experiment, 50 mL of 120 mg/L CAP solution was added to the ultrasonic reaction vessel (XO-1000D, China, frequency: 20 KHZ, Power: 200 W), and then H2O2 was added, and the pH was adjusted with diluted sulfuric acid and sodium hydroxide. Sponge iron was added to the ultrasonic reactor, and the reaction time and power were controlled. The CAP solution was sonicated with an ultrasound probe for 1 h at a power of 200 W, and samples were taken every 10 min to detect the remaining concentration of CAP. CAP samples were taken at specified time intervals and filtered through a 0.45-μm microporous membrane. The remaining concentration of CAP was determined by high performance liquid chromatography, and each group of experiments was repeated three times.
2.3. Analytical Methods
2.3.1. Sponge Iron Characterization
The surface structures of Sponge iron were observed via scanning electron microscopy. Before observation, the aerogel surface was sputter-coated with gold. Specific surface area of sponge iron was measured with a Micromeritics ASAP 2020 sorptometer using nitrogen as the adsorbate at 77 K. Sponge iron was degassed at 300 °C for more than 10 h before analysis. The surface area was calculated using the BET method based on adsorption data in the relative pressure range of 0.02−0.2, and total pore volume was determined at the highest relative pressure.
2.3.2. Sponge Iron Recyclability Experiment
The sponge iron degraded by CAP needs to be filtered out, then decontaminated and activated with 5% (v/v) hydrochloric acid for about 20 min and rinsed with deionized water to bring it to a neutral pH value. The cleaned sponge iron is dried and recycled.
2.3.3. CAP Concentration
The CAP concentration was qualitatively and quantitatively studied by HPLC. This experiment used a Shimadzu LC-10AT-TVP liquid chromatograph with a Phenomennex Luna C18 250 × 4.6 mm reversed-phase chromatographic column for separation. The mobile phase of this experiment was methanol and water (60:40, v/v), and the flow rate was 0.50 mL/min. The degradation ratio of CAP was calculated as follows:
where the degradation ratio (%) is the degradation ratio of CAP and C0 and Ct (mg/L) are the initial concentration and remaining concentration of CAP, respectively.
Degradation ratio (%) = Ct/C0 × 100%
2.3.4. Total Organic Carbon Investigation
A total organic carbon (TOC) analyzer was used to determine the TOC content before and after the CPA degradation reaction. The combustion oxidation-non-dispersive infrared absorption method was used to determine the TOC reduction efficiency of CAP, and the trend of TOC change in a certain period of time was analyzed.
2.3.5. Antibacterial Activity Test
The in vitro antibacterial activities of CAP and its degraded products were tested using the paper disc diffusion method [20]. Gram-negative (G(−)) Escherichia coli and Gram-positive (G(+)) Staphylococcus aureus were obtained from the School of Food and Bioengineering, Qilu University of Technology. The liquid medium containing the bacterial subcultures was autoclaved for 20 min at 121 °C before inoculation. The bacteria were then cultured for 16 to 24 h at 37 °C in an incubator. Luria–Bertani (LB) culture media was used for preparing basal media for the bioassay of the organisms. LB agar was poured onto a plate and allowed to solidify. The CAP solution was autoclaved at 121 °C for 20 min before being dripped into the filter paper disc, which removed the residual hydrogen peroxide. CAP solutions were filtered through a 0.45-μm microporous membrane and slowly dripped into a 6 mm diameter filter paper disc placed on an agar plate. The plates were then kept at 5 °C for 1 h and transferred to an incubator maintained at 37 °C. The width of the growth inhibition zone around the disc was measured after incubation for 24 h.
2.3.6. Product Identification
To study and infer the degradation products of CAP and its possible degradation pathways, gas chromatography-mass spectrometry (GC-MS) analysis was used to identify possible degradation products. Before analysis, BSTFA+1%TMCS reagents were used as a derivatization reagent to make the products easier to separate and identify. The injection volume was 1 μL, and the injection port temperature was 250 °C. The initial temperature of the oven was 80 °C, and the temperature was increased to 280 °C at 10 °C/min under a helium atmosphere.
3. Results and Discussion
3.1. Degradation of CAP by Different Processes
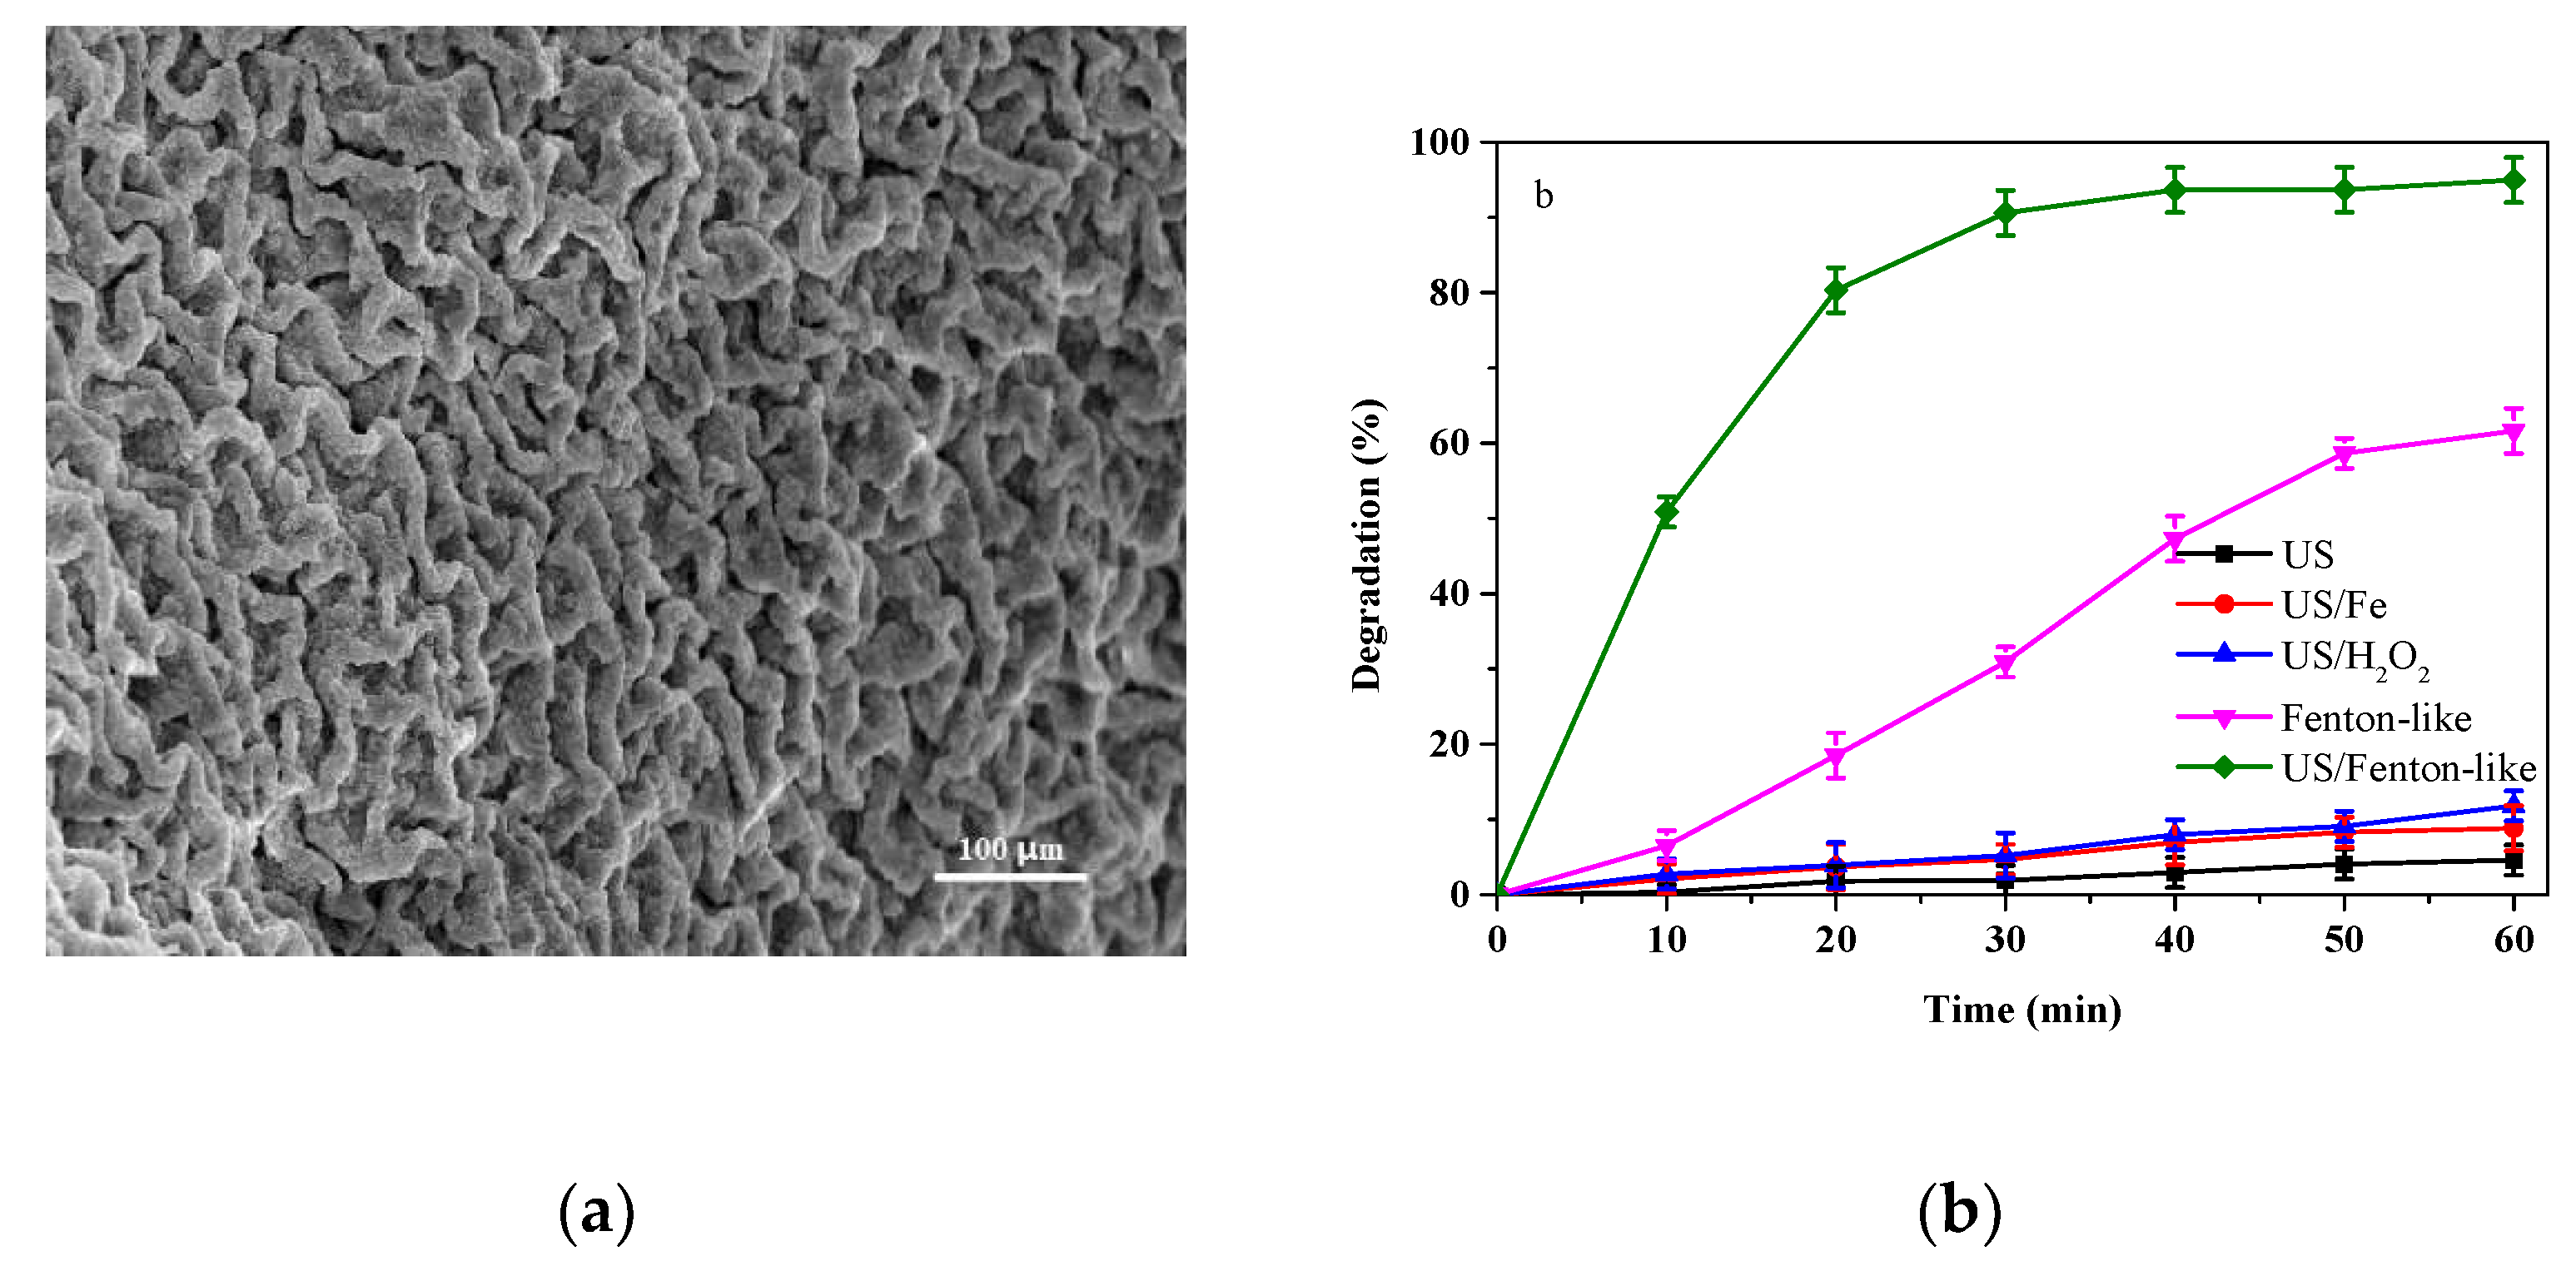
SEM was conducted to analyze the surface morphology of sponge iron. Figure 1a shows the surface features of sponge iron, which looks like a sponge. The size of a sponge iron particle was 3–5 mm. The specific surface areas of sponge iron were found to be 85 cm2/g, which is similar to [21].
Figure 1b shows that the CAP solution was treated with US, US/Fe, and US/H2O2 for 60 min. The results show that the order of degradation of CAP was US/H2O2 > US/Fe > US with degradation rates of 11.80%, 8.82%, and 4.60%, respectively. Compared with the above three processes, Fenton-like oxidation significantly increased its degradation rate, and the degradation rate of 60 min reached 62%. This occurred because H2O2 is an oxidizing agent in the presence of sponge iron and can catalyze the generation of OH radicals, which degrade refractory compounds through the high oxidation potential of OH radicals [22,23]. Figure 1b shows that US effectively enhanced the Fenton-like treatment effect (H2O2/sponge iron). The degradation rate reached over 50% after 10 min, and the degradation rate reached over 93% after 30 min. However, the degradation rate increased slowly by prolonging the reaction time, and the degradation rate was nearly 95% after 1 h. This was mainly due to the cavitation caused by US, which enhances the generation of OH radicals. At the same time, ultrasonic cavitation bubbles concentrate OH radicals on the oxidation site and homogenize the process to further improve the effectiveness of oxidation [15,24].
3.2. Effect of Initial pH Variation
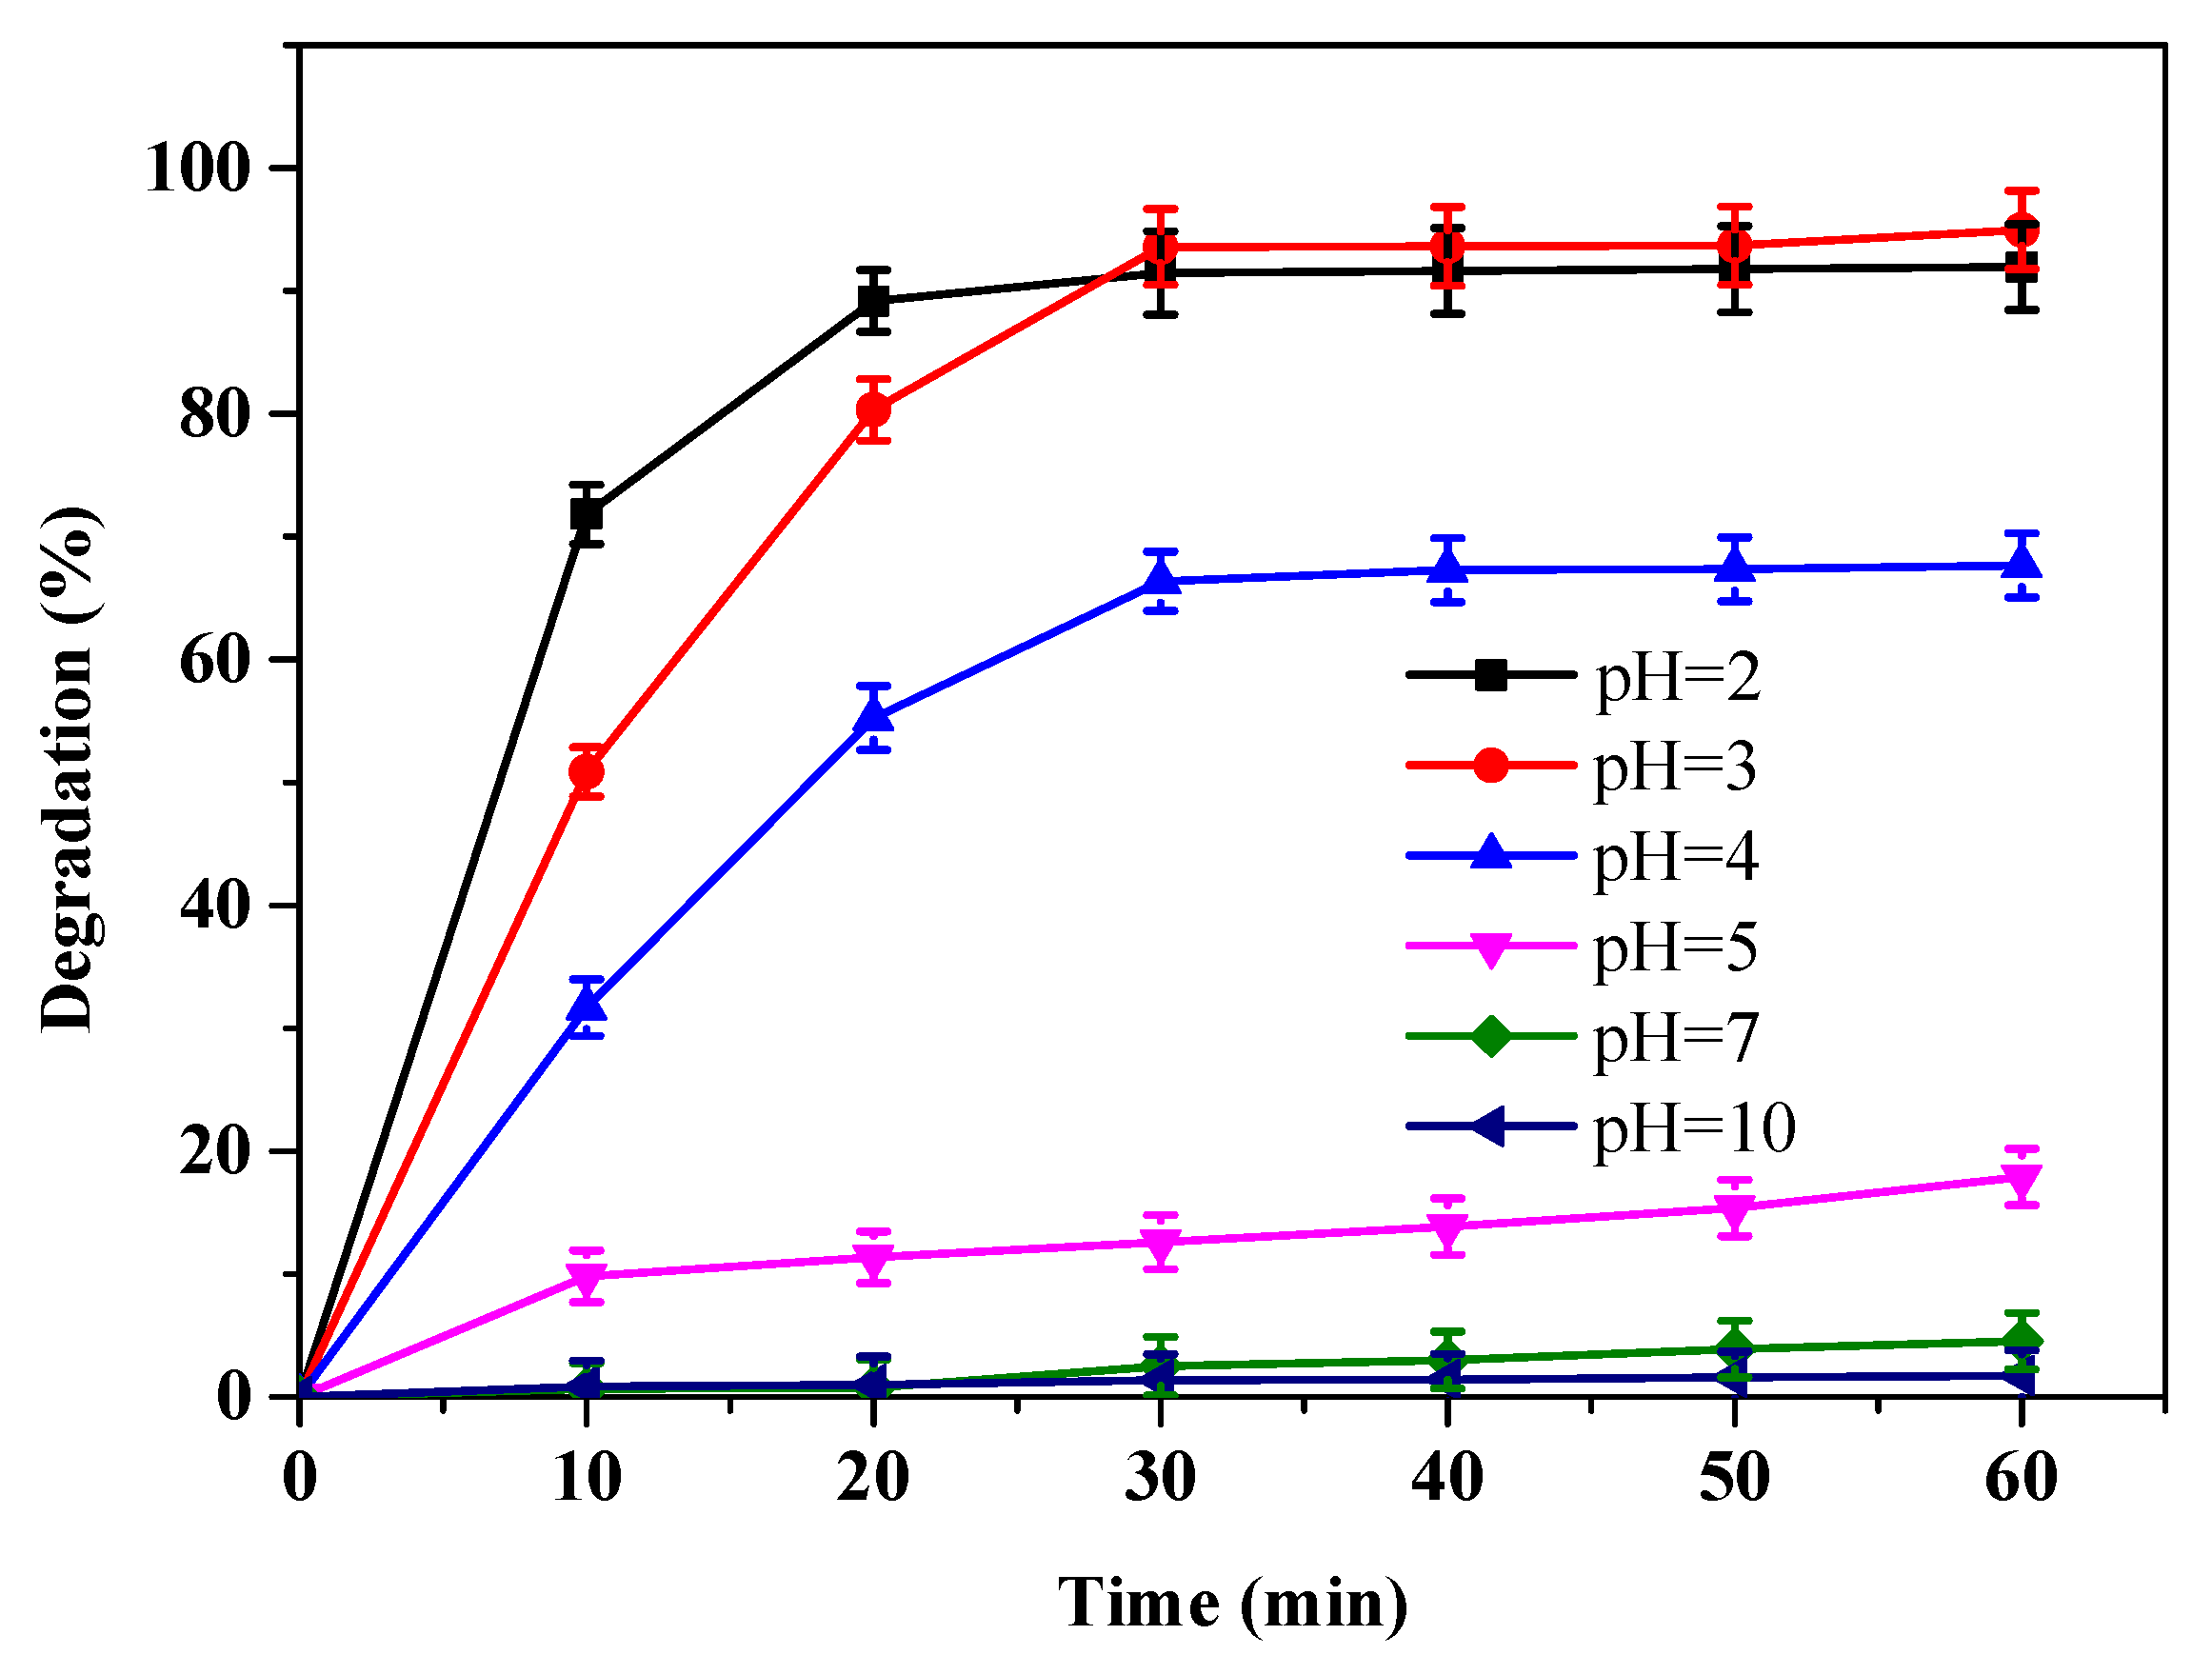
Figure 2 shows the degradation of CAP by US/Fenton-like treatment with an initial pH of 3 to 10. The results show that the efficiency of removing CAP under acidic conditions was higher than that under alkaline conditions. Other reports have shown that acidic pH helps remove CAP [25]. The above phenomenon is mainly due to the decrease in the redox potential of OH and the decrease in OH activity when the pH value increases, which inhibits the degradation of CAP [26]. Moreover, the alkaline conditions lead to the precipitation of dissolved iron ions and passivation of the sponge iron surface, which hinders the degradation of CAP [27]. The pH value controls the solubility of sponge iron and the availability of Fe2+ that is required to activate the Fenton reaction. The slight difference between pH 2 and pH 3 is mainly due to the higher content of Fe2+ available at pH < 4. The higher pH is conducive to the formation of FeOH2+ and Fe2(OH)24+ complexes and hinders the activation of H2O2 [15,28].
3.3. Effect of Hydrogen Peroxide Concentration
Figure 3 shows the effect of different hydrogen peroxide concentrations from 0 to 4.0 mmol/L on the CAP degradation performance at a sponge iron concentration of 2.0 g/L, and pH 3.0. An increase in the concentration of H2O2 from 0 mmol/L to 3.0 mmol/L resulted in an enhanced rate of degradation for CAP. When the concentration of H2O2 was lower than 3.00 mmol/L, the degradation rate for CAP increased to more than 99% after 30 min; the CAP degradation rate decreased slightly when the concentration of H2O2 exceeded 3.00 mmol/L. This may be due to the competitive effect of excessive H2O2, which can be converted into an OH radical scavenger, thus reducing the degradation efficiency of CAP [29,30]. Studies have shown that a higher concentration of peroxide is needed to achieve higher degradation efficiency when the concentration of organic matter is higher [31].
3.4. Effect of Sponge Iron Concentration
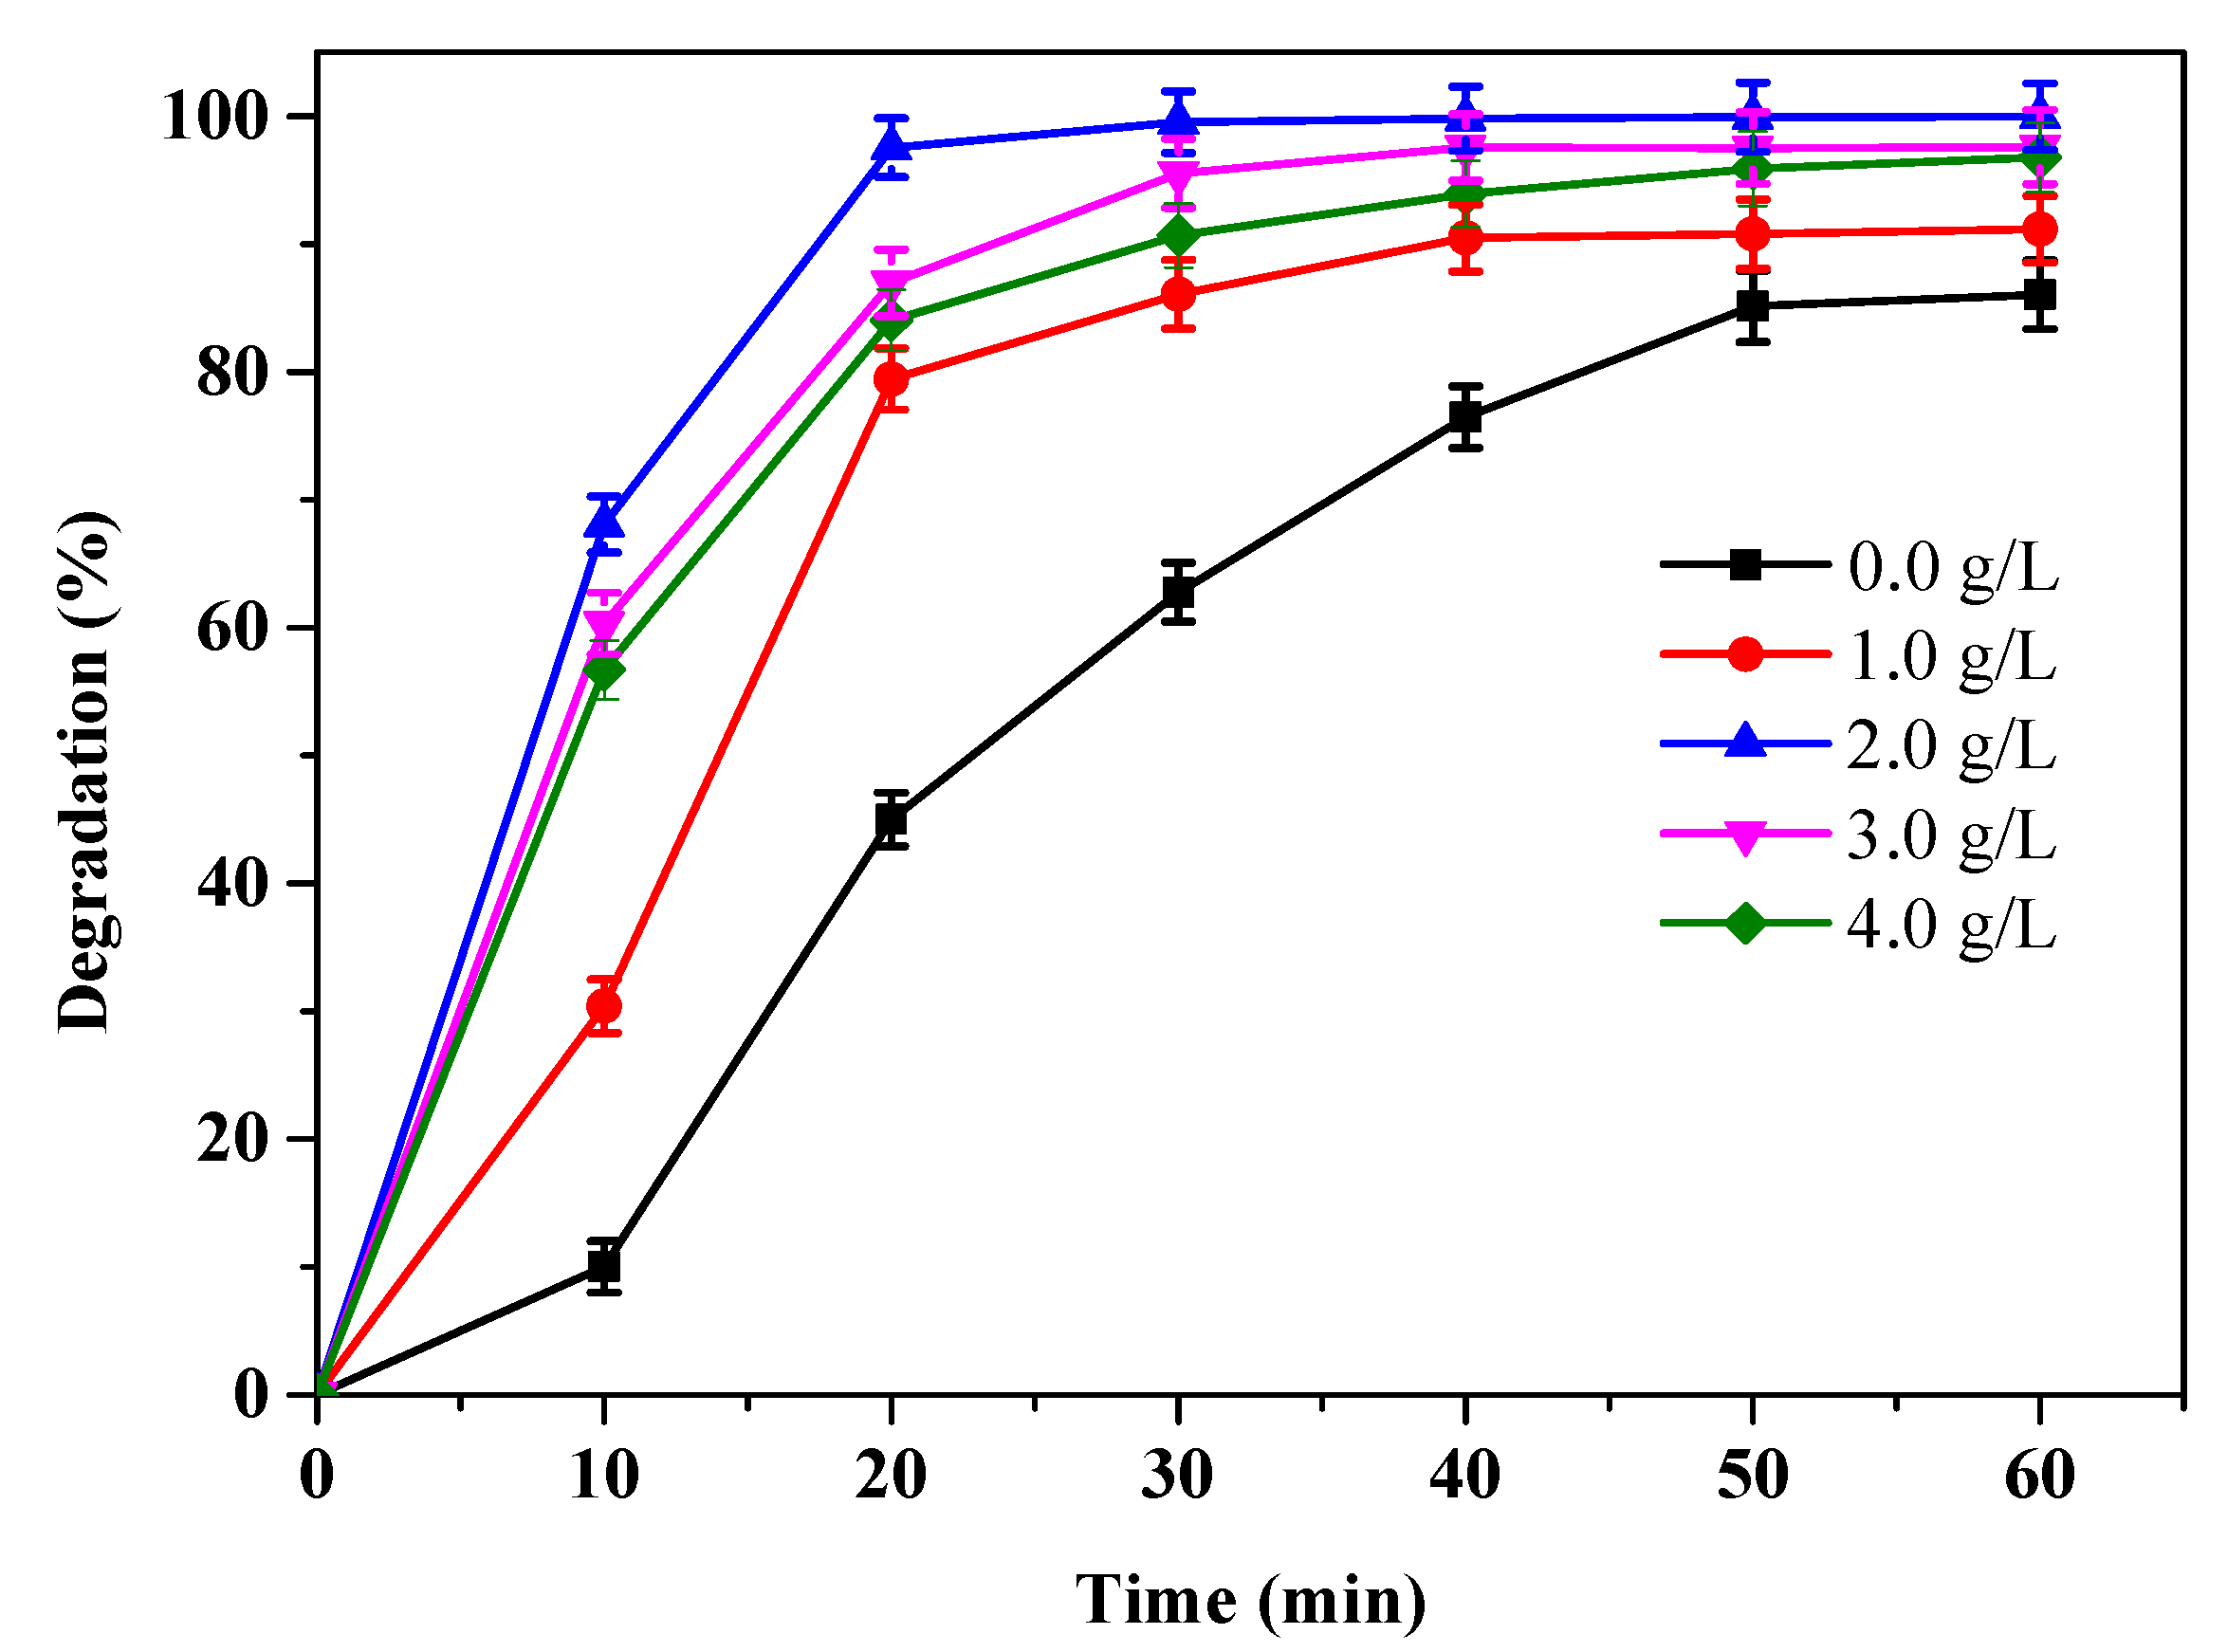
Figure 4 shows the effect of different sponge iron concentrations from 0 to 4.0 g/L on the degradation performance of CAP at a H2O2 concentration of 3.0 mmol/L and pH of 3.0. Below a sponge iron concentration of 2.0 g/L, the content of OH radicals produced by the Fenton-like system formed by Fe and H2O2 increased as the sponge iron concentration increased. This in turn increased the degradation efficiency of CAP. The increase in degradation efficiency is mainly because sponge iron provides more surface-active sites to accelerate the degradation reaction and increases the number of ultrasonic cavitation bubbles to accelerate the generation of OH radicals [21]. However, the degradation rate of CAP decreased when the sponge iron concentration exceeded 2.00 g/L. This may be due to the increase in the sponge iron concentration, which causes the viscosity of the ultrasonic cavitation bubble liquid to increase and the turbulence intensity to weaken. This is not conducive to the generation of OH radicals. At the same time, the large amount of Fe2+ produced by excessive sponge iron will consume a large amount of OH radicals and reduce the degradation reaction [32].
3.5. Process Optimization
The analysis results in Figure 2, Figure 3 and Figure 4 failed to show the magnitude of the impact of the reaction parameters on the degradation of CAP. The correlation between the reaction parameters and the degradation results for CAP can be determined by analysis of variance of the response surface method [33,34]. Design-Expert Version 8.0.6 software was used to explore the interaction between reaction pH, hydrogen peroxide concentration, and sponge iron concentration in the process of CAP degradation. In this set of experiments using the Box–Behnken method, three factors and three levels were considered in 17 runs in Table 1. The degradation efficiency of CAP was used as the response of each factor to the reaction. At the same time, five repeated experiments were used to evaluate and reduce measurement errors.
The outcomes of the response surface models for the optimization of CAP degradation were estimated, and the results are shown in Table 2. The F value represents the significance of the entire fitting equation, and the p value is an index for measuring the difference in the experimental group. The F-value was 32,985.13, and a p-value less than 0.05 implied that the fit model was significant and functional in this experiment [35]. “Lack of fit” is an important characteristic used to evaluate the reliability of the equation. If it is obvious that the equation is not well simulated, it needs to be adjusted. If the equation is not significantly simulated, it can fit the data well. The “lack of fit” of 6.38 for F-value and 0.0527 for p-value implied that it is insignificant relative to the pure error, which shows that the equation can fit the data well [36]. In the case of p-values, X1, X2, X3, X1×2, X1X3, X2X3, X12, X22, and X32 are the influence of each factor, the quadratic of each factor and the interaction factor when they were less than 0.05, implying that the correlation factors were significant [33]. The F-value of X2 was the smallest of the three factors, indicating the negligible effect of H2O2 concentration versus other factors (pH and sponge iron concentration) in increasing the degradation of CAP. In addition, the sponge iron concentration has the greatest impact on the degradation of CAP. The predicted R2 of 0.9997 agrees well with an adjusted R2 of 0.9999. The results show that the experimental results are consistent with the theoretical results, indicating that the equation can predict the degradation reaction of CAP well [37]. Furthermore, “adequate precision” determines the signal-to-noise ratio in the modeling analysis when the ratio >4 is desirable. The fitting result shows that an adequate precision of 564.485 was achieved, thus indicating the effectiveness and accuracy of the fitted model [38]. The relationship between these responses and the independent variables was fitted by a quadratic polynomial equation, and the resulting reduced equations were obtained using Equation (2):
where X1 is pH, X2 is H2O2 concentration (mmol/L), and X3 is sponge iron concentration (g/L). According to the prediction of response surface analysis, the maximum degradation efficiency of CAP of 99.97% is obtained when at pH = 3, 3.19 mmol/L of H2O2, and 2.26 g/L of sponge iron.
Degradation = 24.94775 + 0.80500X1 + 24.14475X2 + 27.36525X3 −
1.0200X1X2 − 0.60000X1X3 − 0.092500X2X3 + 1.47100X12 − 2.95475X22 − 5.58975X32
1.0200X1X2 − 0.60000X1X3 − 0.092500X2X3 + 1.47100X12 − 2.95475X22 − 5.58975X32
3.6. Effect of Presence of Inorganic Salts and RECYCLABILITY Experiments
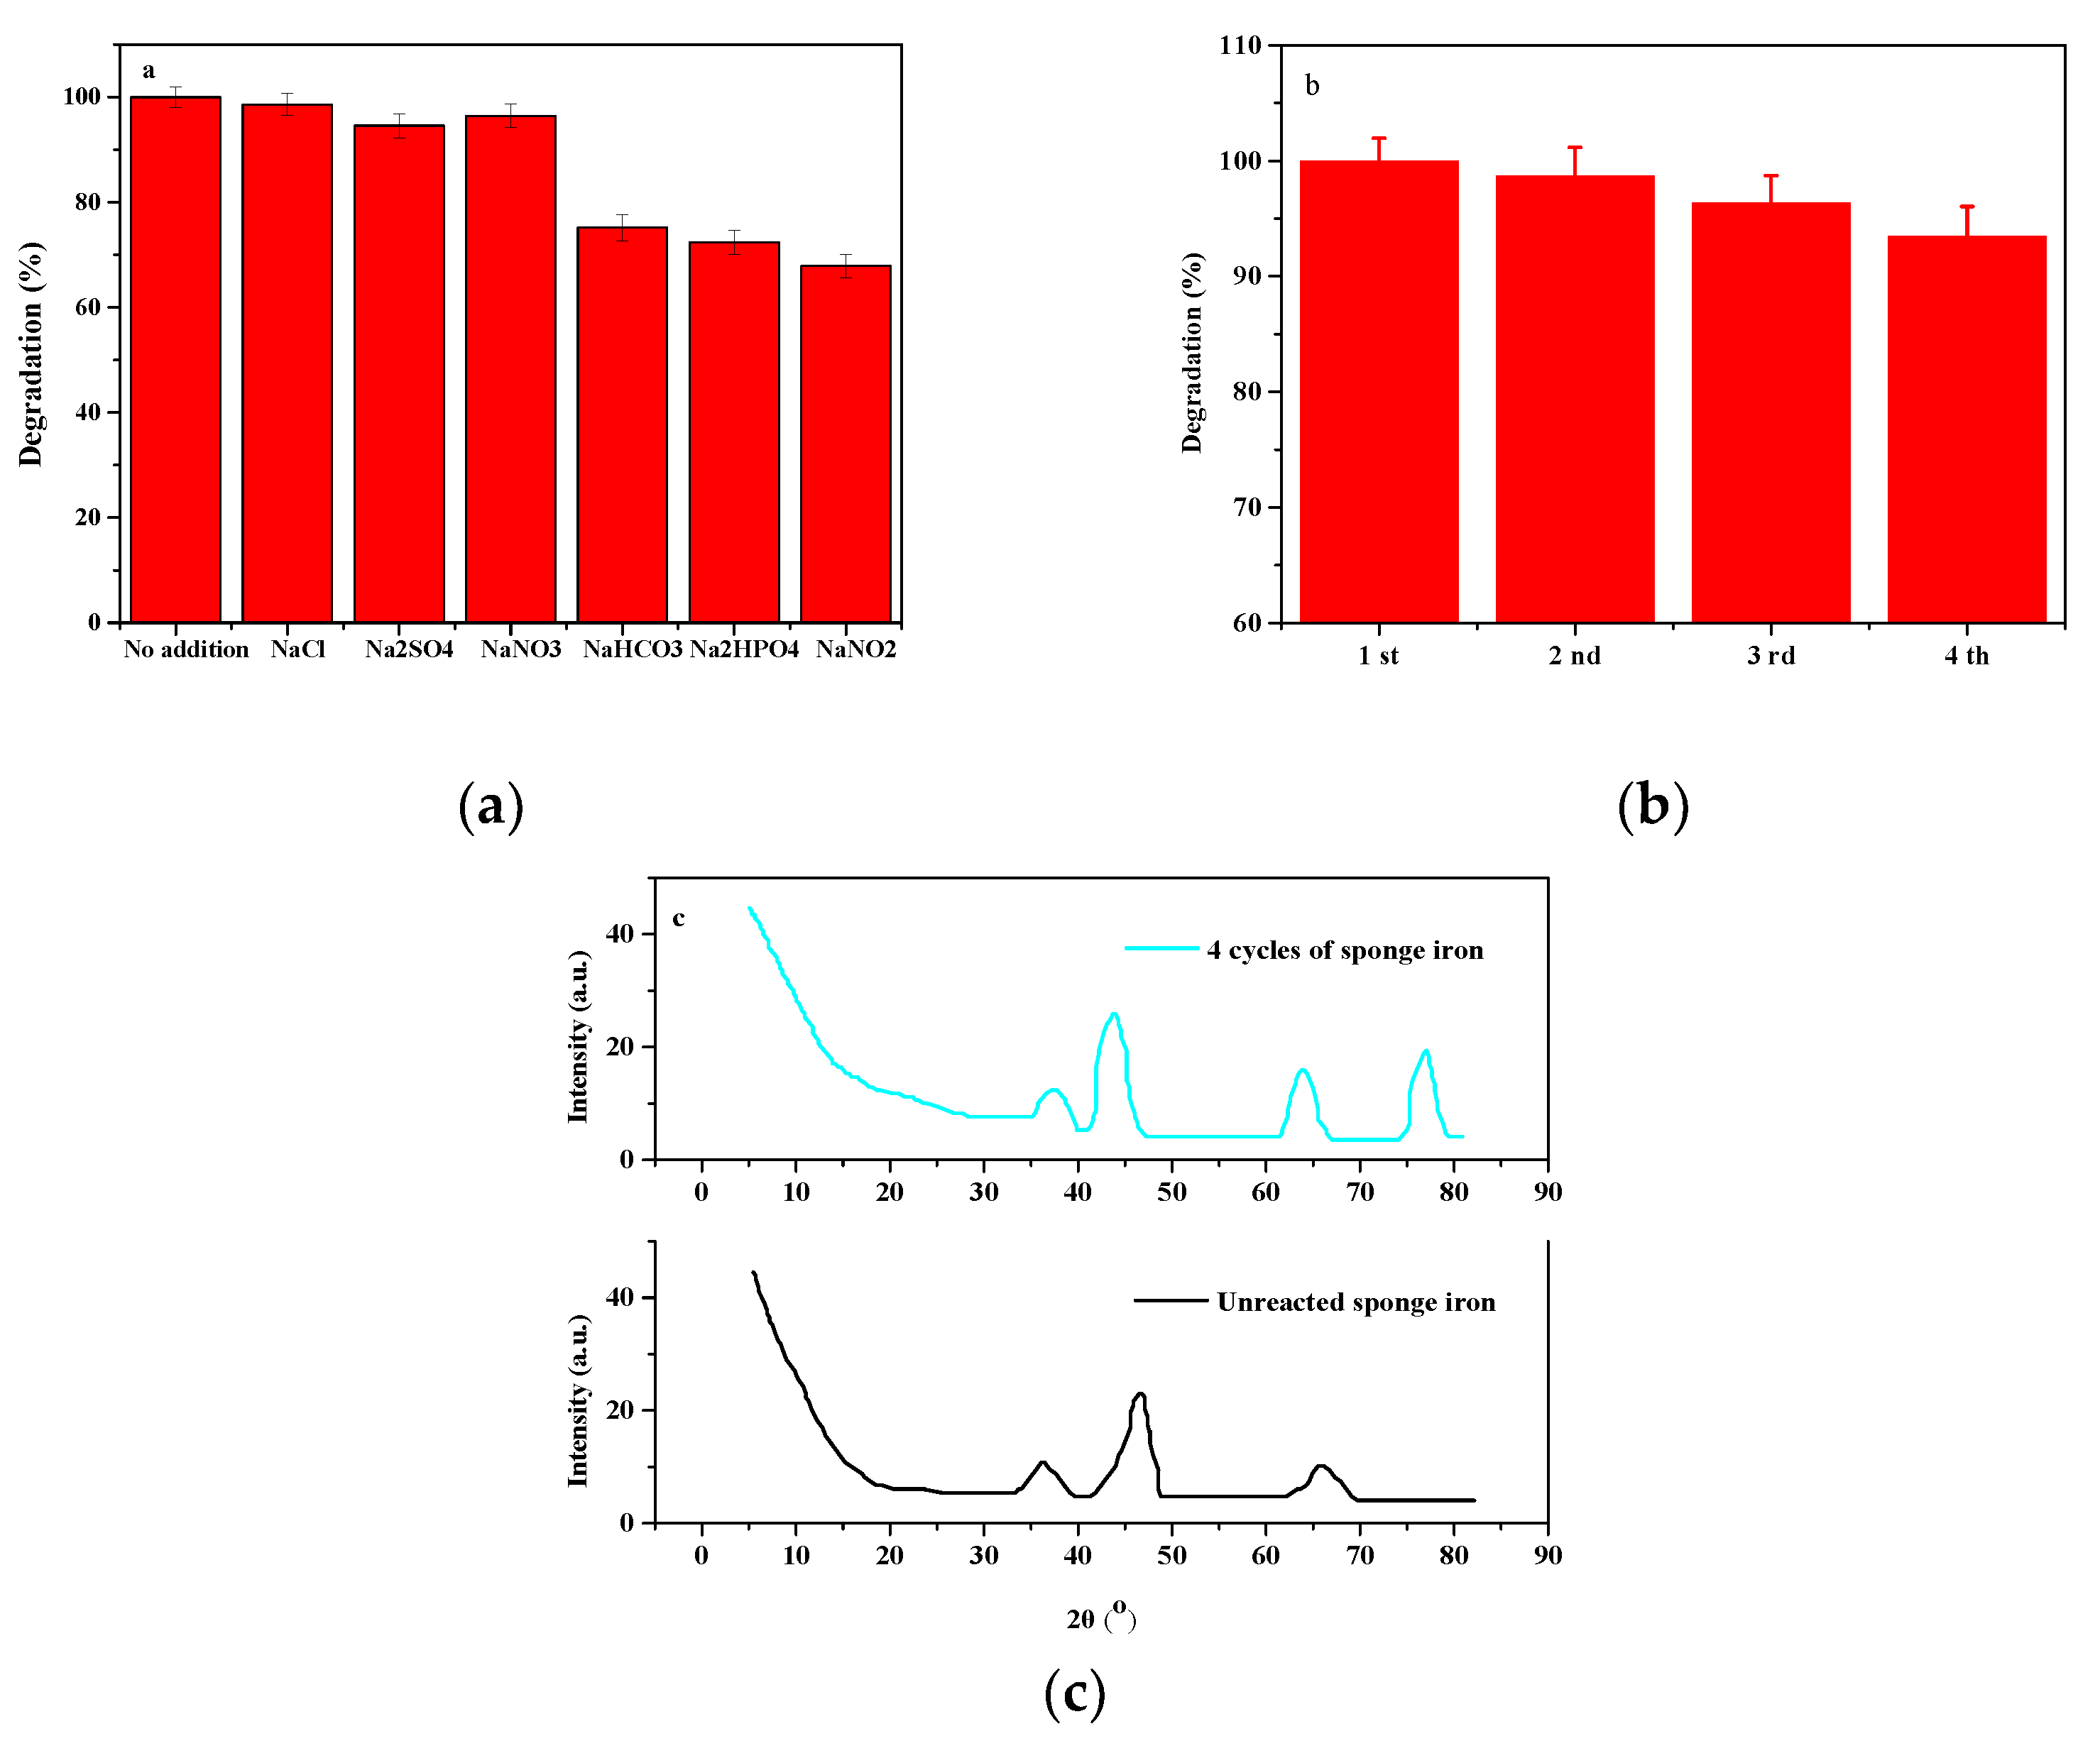
Inorganic salts are generally available in CAP wastewater and may affect the efficiency of Fenton-like systems for CAP wastewater treatment. Figure 5a illustrates the impact of various inorganic salts (0.01 mol/L concentration) on CAP degradation using US/Fenton-like treatment. All of these inorganic salts had a negative effect on CAP degradation, although the effect was stronger for NaHCO3, Na2HPO4 and NaNO2 than for NaCl, Na2SO4, and NaNO3. The three inorganic salts of NaCl, Na2SO4, and NaNO3 had a slight effect on CAP degradation using US/Fenton-like treatment. The presence of NaHCO3 and Na2HPO4 increases the pH to alkaline conditions, which has a negative impact on the degradation of CAP. In addition, the presence of HCO3− and HPO42− in the inorganic salt can quench the OH radicals and react with Fe2+ or Fe3+, further reducing the reaction effect [15]. The results show that the degradation rate of CAP decreases significantly after adding NaNO2, mainly because NO2− acts as a quencher to remove OH radicals and terminate the oxidation reaction of OH radicals [39].
Figure 5b shows that the degradation rate of CAP can still reach 93% after repeated use of sponge iron four times. This is because the surface of the sponge iron is oxidized to form oxides attached to the surface of the sponge iron particles after use, which affects the CAP removal effect to a certain extent. The X-ray diffraction (XRD) scan results of unreacted and four-cycle sponge iron are shown in Figure 5c. Compared with unreacted sponge iron, sponge iron has regular characteristic diffraction peaks with similar sharpness at 36°, 45° and 64° after being recycled four times, and a new characteristic peak appeared near 75°, which indicates that Fe2+ and Fe3+ oxides are produced on the surface of sponge iron after four cycles [32].
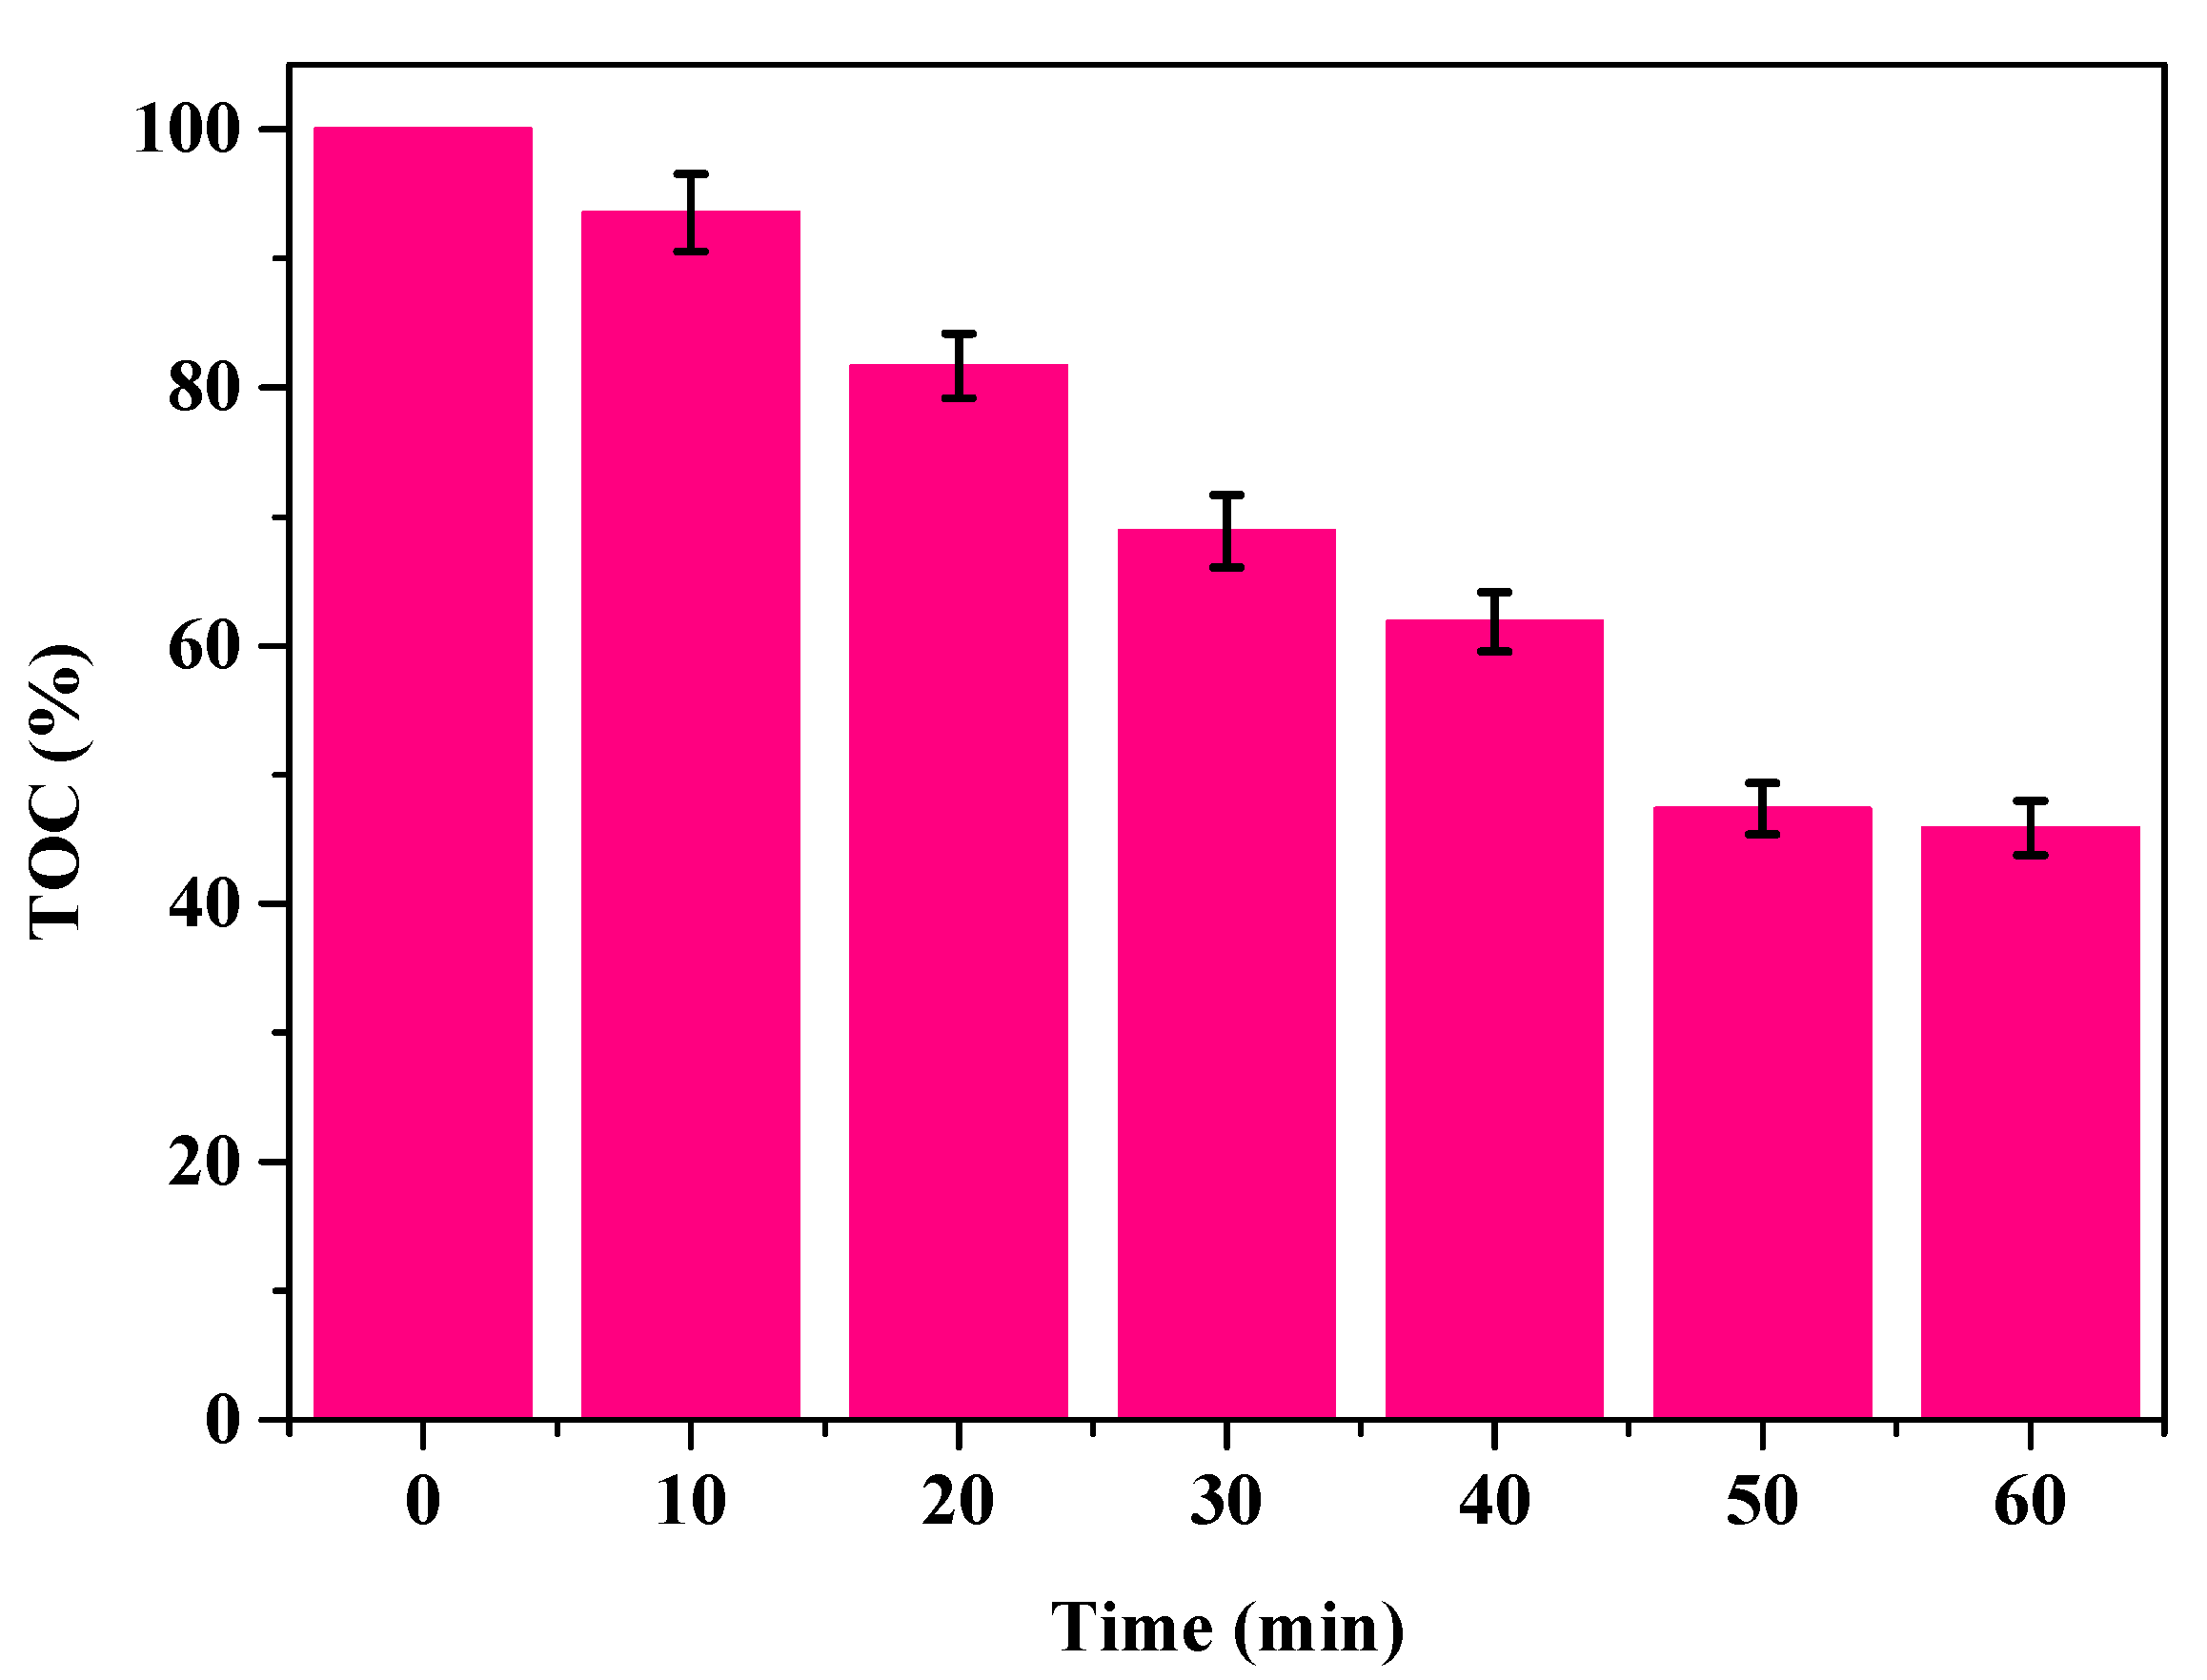
3.7. Mineralization of CAP
The fate of degraded CAP was determined by measuring the amount of TOC during the reaction. Figure 6 shows that the TOC content during the degradation of CAP decreased from 32.68 mg/L to 14.99 mg/L during the optimal reaction process of US/Fenton-like treatment. The TOC percentage decreased by 54.14%, and the final remaining was 45.86%. This shows that CAP is oxidized into smaller organic molecules and is not fully mineralized. The detection results of US/Fenton-like degradation of CAP are consistent with the degradation mechanism of CAP in the literature [15]. CAP is not completely mineralized but is partially degraded into other small molecular organics. The following section will analyze and study the degradation products with an in-depth study of the possible mechanism of CAP degradation.
3.8. Antibacterial Activity Test
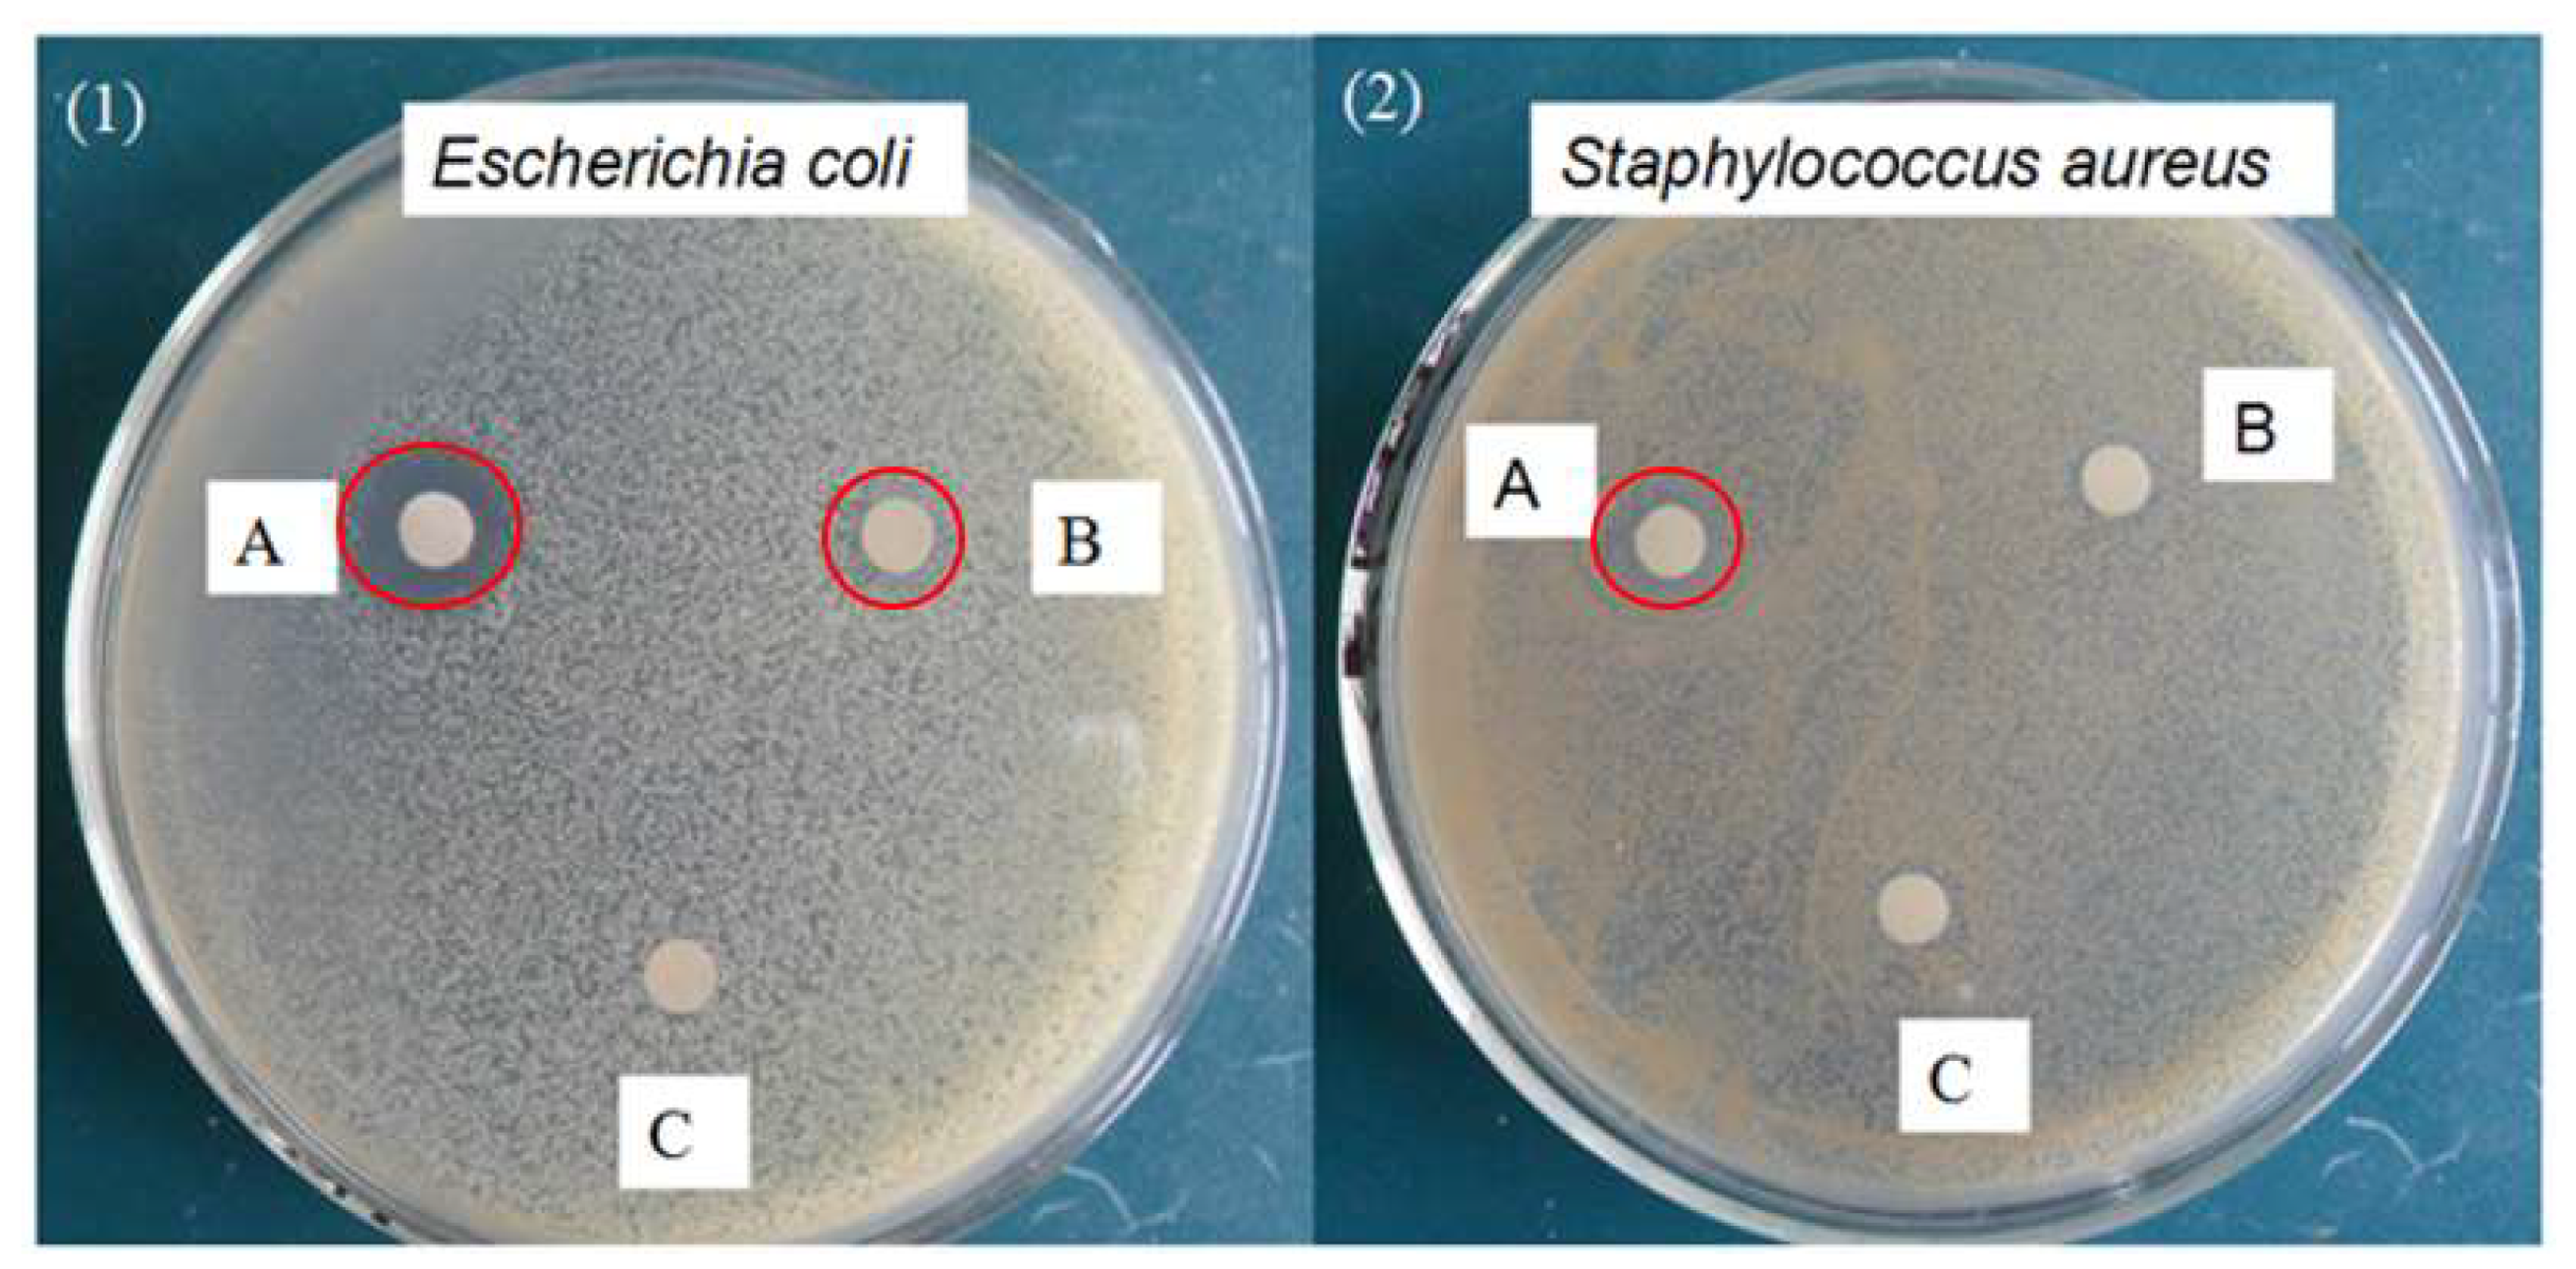
The Gram-negative bacterium Escherichia coli and the Gram-positive bacterium Staphylococcus aureus were used as bacterial strains. Table 3 shows the antibacterial effect of degraded compounds using the paper disc diffusion method. The plate test results of the antibacterial activity of CAP with different degradation efficiencies are shown in Figure 7. The initial CAP showed an antibacterial effect toward Escherichia coli as well as Staphylococcus aureus. The results showed that the antibacterial effect of CAP with a degradation rate of 50% on Escherichia coli was lower than that of the initial CAP. With a degradation rate of 50%, the zone of inhibition was significantly reduced to 9 mm, and CAP with a degradation rate of 99% had no zone of inhibition. In contrast, CAP degraded to 50% and 99% had no activity against Staphylococcus aureus. These results indicate that the antibacterial activity of CAP decreases significantly as the degradation efficiency increases. There were no significant active strains in the final product. The structure of the CAP inhibitory bacteria is oxidized by the US/Fenton-like treatment, and the degradation products have strong biodegradability.
3.9. CAP Degradation Pathway during US/Fenton-like Treatment
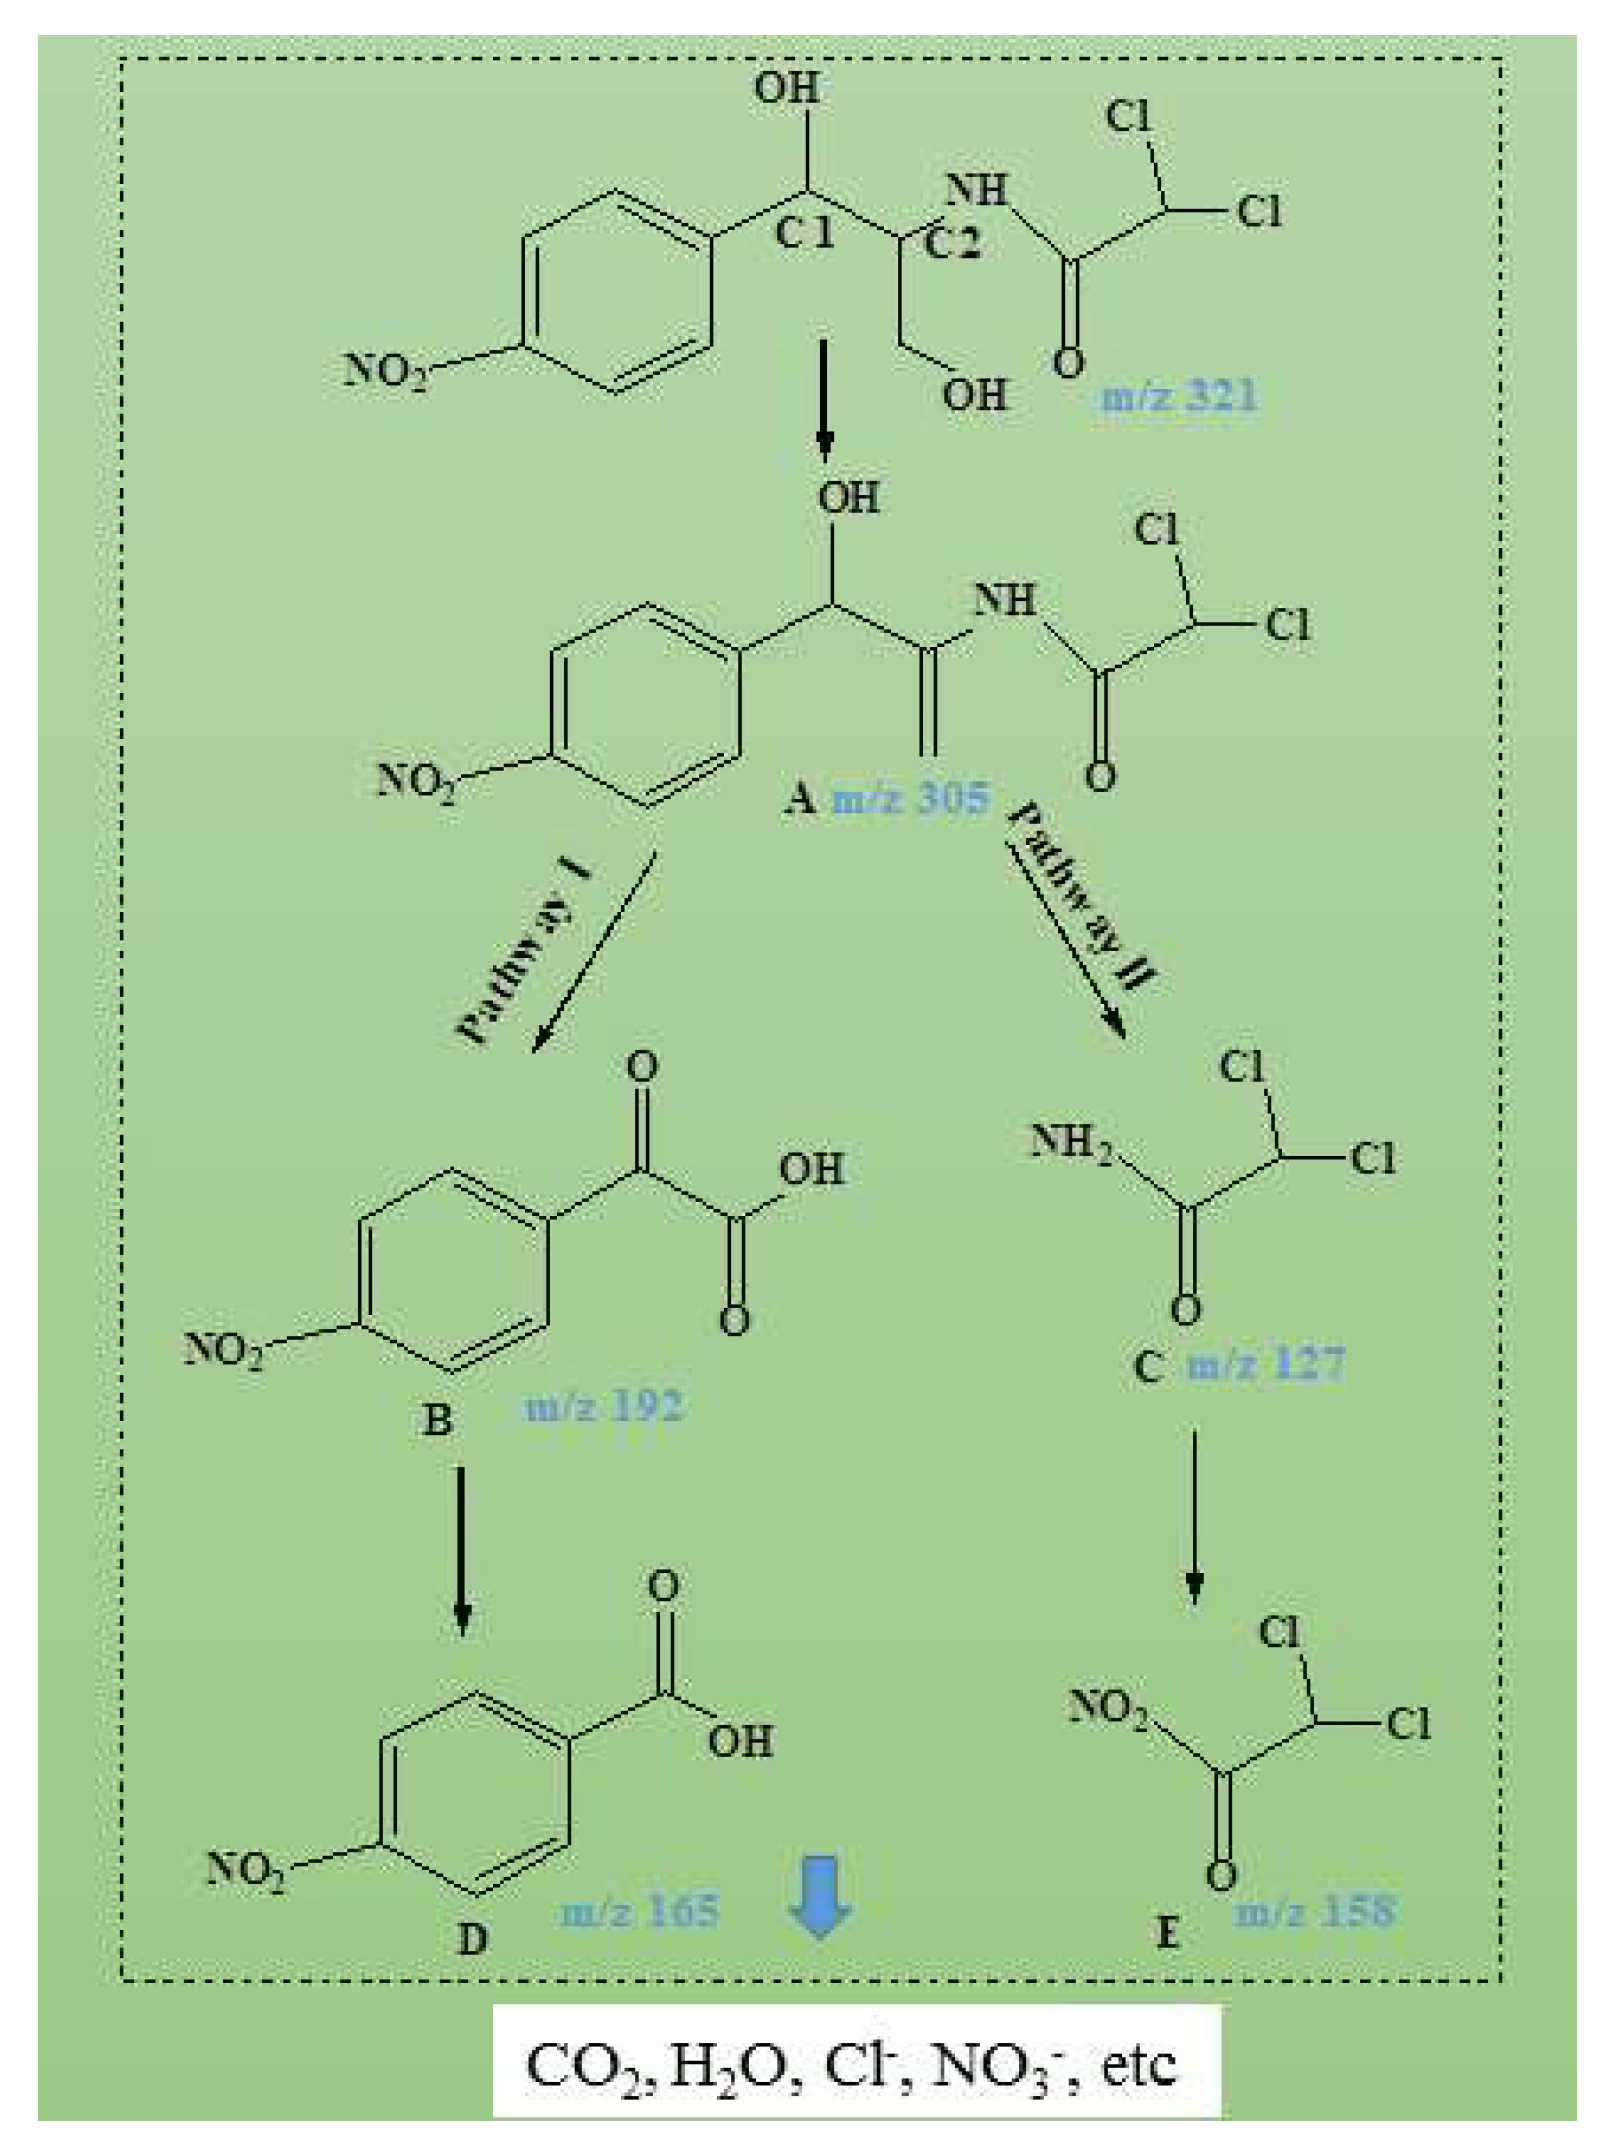
CAP has two asymmetrical centers (C1 and C2) with weakly bonded hydrogen atoms, which can be easily abstracted by free radicals. GC-MS separated and identified the products formed by the reaction of CAP and OH radicals. Five major intermediate products were formed and named A to G. These represent the intermediates shown in Figure 8. According to references and product analysis, dehydroxylation reaction occurred on CAP to form 2, 2-dichloro-n-(1-(4-nitrobenzoyl)vinyl)acetamide (product A) [40]. Hydroxyl radicals will preferentially attack the -C-N bond at the C2 position in product A, which forms 4-nitrophenylglyoxylic acid (product B) and dichloroacetamide (product C) [41]. Products B and C are further oxidized by hydroxyl radicals to form 4-nitroacetophenone (product D) and nitroalkane (product E), respectively [15]. In addition, these products further oxidate to produce inorganic ions (such as NO3- and Cl-) and small molecular compounds (such as H2O and CO2).
4. Conclusions
In this study, US effectively enhanced the degradation efficiency of a Fenton-like sponge iron system for CAP. The response surface method was used to explore the optimal reaction conditions and the interaction between various factors. The results showed that the degradation efficiency of CAP was as high as 99.97% at pH = 3, 3.19 mmol/L H2O2, and 2.26 g/L sponge iron. The degradation rate of CAP was significantly reduced upon addition of inorganic salts, mainly due to the quenching of OH radicals. Gram-negative (G(−)) Escherichia coli and Gram-positive (G(+)) Staphylococcus aureus were used to evaluate the changes in the antibacterial activity of CAP, and the results showed that the degraded CAP had no antibacterial activity. GC-MS was used to analyze and identify the main products of CAP degradation, and the possible degradation paths of the products were proposed based on the detected products. This may lead to high-value products for further use.
Author Contributions
X.M., Z.L., S.W. and F.K. conceived and designed the experiments; Z.L. and X.M. performed the experiments; Z.L., F.K. and S.W. analyzed the data; S.W. and F.K. contributed reagents/materials/analysis tools; X.M., F.K. and Z.L. wrote the paper. All authors have read and agreed to the published version of the manuscript.
Funding
This research was funded by the Natural Science Foundation of Shandong (No. ZR2020MC156); National Natural Science Foundation of China (Grant Nos. 31971605); Shandong Key R&D Program (Nos. 2019JZZY010407, 2019JZZY010304); Special Foundation for National Science and Technology Basic Research Program of China (2019FY100902) and National Key R&D Program (No. 2020YFC1910302).
Institutional Review Board Statement
Not applicable.
Informed Consent Statement
Not applicable.
Data Availability Statement
Not applicable.
Acknowledgments
The authors are grateful for support from the Natural Science Foundation of Shandong (No. ZR2020MC156), National Natural Science Foundation of China (Grant (Grant Nos. 31971605), Shandong Key R&D Program (Nos. 2019JZZY010407, 2019JZZY010304), National Key R&D Program (No. 2020YFC1910302), and the Special Foundation for National Science and Technology Basic Research Program of China (2019FY100902).
Conflicts of Interest
The authors declare that they have no known competing financial interests or personal relationships that could have appeared to influence the work reported in this paper.
References
- Yin, F.; Dong, H.; Zhang, W.; Zhu, Z.; Shang, B.; Wang, Y. Removal of combined antibiotic (florfenicol, tylosin and tilmicosin) during anaerobic digestion and their relative effect. Renew. Energy 2019, 139, 895–903. [Google Scholar] [CrossRef]
- Klauson, D.; Krichevskaya, M.; Borissova, M.; Preis, S. Aqueous photocatalytic oxidation of sulfamethizole. Environ. Technol. 2010, 31, 1547–1555. [Google Scholar] [CrossRef]
- Shukla, P.; Bansode, F.; Singh, R. Chloramphenicol toxicity: A review. J. Med. Med. Sci. 2013, 2, 1313–1316. [Google Scholar]
- Wu, G.; Kong, W.; Gao, Y.; Kong, Y.; Dai, Z.; Dan, H.; Shang, Y.; Wang, S.; Yin, F.; Yue, Q.; et al. Removal of chloramphenicol by sulfide-modified nanoscale zero-valent iron activated persulfate: Performance, salt resistance, and reaction mechanisms. Chemosphere 2021, 286, 131876. [Google Scholar] [CrossRef]
- Wu, Y.; Mao, S.; Liu, C.; Pei, F.; Wang, F.; Hao, Q.; Xia, M.; Lei, W. Enhanced degradation of chloramphenicol through peroxymonosulfate and visible light over z-scheme photocatalysts: Synergetic performance and mechanism insights. J. Colloid Interface Sci. 2022, 608, 322–333. [Google Scholar] [CrossRef] [PubMed]
- Shokri, M.; Jodat, A.; Modirshahla, N.; Behnajady, M.A. Photocatalytic degradation of chloramphenicol in an aqueous suspension of silver-doped tio2 nanoparticles. Environ. Technol. 2013, 34, 1161–1166. [Google Scholar] [CrossRef]
- Ioannou-Ttofa, L.; Raj, S.; Prakash, H.; Fatta-Kassinos, D. Solar photo-fenton oxidation for the removal of ampicillin, total cultivable and resistant e-coli and ecotoxicity from secondary-treated wastewater effluents. Chem. Eng. J. 2019, 355, 91–102. [Google Scholar] [CrossRef]
- Kaur, A.; Umar, A.; Kansal, S.K. Heterogeneous photocatalytic studies of analgesic and non-steroidal anti-inflammatory drugs. Appl. Catal. A-Gen. 2016, 510, 134–155. [Google Scholar] [CrossRef]
- Xia, Q.; Zhang, D.; Yao, Z.; Jiang, Z. Investigation of cu heteroatoms and cu clusters in fe-cu alloy and their special effect mechanisms on the fenton-like catalytic activity and reusability (vol 299, 120662, 2021). Appl. Catal. B-Environ. 2022, 299, 120662. [Google Scholar] [CrossRef]
- Gao, L.; Cao, Y.; Wang, L.; Li, S. A review on sustainable reuse applications of fenton sludge during wastewater treatment. Front. Environ. Sci. Eng. 2022, 16, 77. [Google Scholar] [CrossRef]
- Sharma, A.; Verma, M.; Haritash, A.K. Degradation of toxic azo dye (ao7) using fenton’s process. Adv. Environ. Res. 2016, 5, 189–200. [Google Scholar] [CrossRef]
- Sun, S.; Hu, Y.; Xu, M.; Cheng, F.; Zhang, H.; Li, Z. Photo-fenton degradation of carbamazepine and ibuprofen by iron-based metal-organic framework under alkaline condition. J. Hazard. Mater. 2022, 424, 127698. [Google Scholar] [CrossRef]
- Munoz, M.; de Pedro, Z.M.; Casas, J.A.; Rodriguez, J.J. Preparation of magnetite-based catalysts and their application in heterogeneous fenton oxidation-A review. Appl. Catal. B-Environ. 2015, 176, 249–265. [Google Scholar] [CrossRef] [Green Version]
- Xie, H.-N.; Li, J.; Wang, Y.-E.; Zhao, W.; Zhang, L.-H.; Li, J. Influencing factors for the fenton-like of biological sponge iron system and its degradation mechanism of aniline. Process Biochem. 2021, 101, 230–236. [Google Scholar] [CrossRef]
- Zhang, T.T.; Yang, Y.L.; Gao, J.F.; Li, X.; Yu, H.K.; Wang, N.; Du, P.; Yu, R.; Li, H.; Fan, X.Y.; et al. Synergistic degradation of chloramphenicol by ultrasound-enhanced nanoscale zero-valent iron/persulfate treatment. Sep. Purif. Technol. 2020, 240, 116575. [Google Scholar] [CrossRef]
- Ninomiya, K.; Takamatsu, H.; Onishi, A.; Takahashi, K.; Shimizu, N. Sonocatalytic–fenton reaction for enhanced oh radical generation and its application to lignin degradation. Ultrason. Sonochem. 2013, 20, 1092–1097. [Google Scholar] [CrossRef]
- Zou, X.; Zhou, T.; Mao, J.; Wu, X. Synergistic degradation of antibiotic sulfadiazine in a heterogeneous ultrasound-enhanced fe0/persulfate fenton-like system. Chem. Eng. J. 2014, 257, 36–44. [Google Scholar] [CrossRef]
- Guo, J.; Zhu, L.; Sun, N.; Lan, Y. Degradation of nitrobenzene by sodium persulfate activated with zero-valent zinc in the presence of low frequency ultrasound. J. Taiwan Inst. Chem. Eng. 2017, 78, 137–143. [Google Scholar] [CrossRef]
- Shen, S.; Zhou, C.; Zeng, Y.; Zhang, H.; Hossen, M.A.; Dai, J.; Li, S.; Qin, W.; Liu, Y. Structures, physicochemical and bioactive properties of polysaccharides extracted from panax notoginseng using ultrasonic/microwave-assisted extraction. LWT 2022, 154, 112446. [Google Scholar] [CrossRef]
- Anacona, J.R.; Estacio, J. Synthesis and antibacterial activity of cefotaxime metal complexes. J. Transit. Met. Chem. 2005, 31, 227–231. [Google Scholar] [CrossRef]
- Liu, Y.; Wang, X.K.; Chen, B.; Wang, C.; Shen, T.T. Degradation of azo dye c.I. Reactive blue 194 in water by sponge iron in the presence of ultrasound. Environ. Eng. Sci. 2014, 31, 541–547. [Google Scholar] [CrossRef]
- de Luna, M.D.G.; Colades, J.I.; Su, C.C.; Lu, M.C. Comparison of dimethyl sulfoxide degradation by different fenton processes. Chem. Eng. J. 2013, 232, 418–424. [Google Scholar] [CrossRef]
- Gode, J.N.; Souza, D.H.; Trevisan, V.; Skoronski, E. Application of the fenton and fenton-like processes in the landfill leachate tertiary treatment. J. Environ. Chem. Eng. 2019, 7, 103352. [Google Scholar] [CrossRef]
- Ferkous, H.; Merouani, S.; Hamdaoui, O.; Petrier, C. Persulfate-enhanced sonochemical degradation of naphthol blue black in water: Evidence of sulfate radical formation. Ultrason. Sonochem. 2017, 34, 580–587. [Google Scholar] [CrossRef] [PubMed]
- Nie, M.H.; Yang, Y.; Zhang, Z.J.; Yan, C.X.; Wang, X.N.; Li, H.J.; Dong, W.B. Degradation of chloramphenicol by thermally activated persulfate in aqueous solution. Chem. Eng. J. 2014, 246, 373–382. [Google Scholar] [CrossRef]
- Lucas, M.S.; Peres, J.A. Decolorization of the azo dye reactive black 5 by fenton and photo-fenton oxidation. Dye. Pigment. 2006, 71, 236–244. [Google Scholar] [CrossRef]
- Xu, X.-R.; Li, X.-Z. Degradation of azo dye orange g in aqueous solutions by persulfate with ferrous ion. Sep. Purif. Technol. 2010, 72, 105–111. [Google Scholar] [CrossRef] [Green Version]
- Stefánsson, A. Iron(iii) hydrolysis and solubility at 25 °C. Environ. Sci. Technol. 2007, 41, 6117–6123. [Google Scholar] [CrossRef]
- Nidheesh, P.V.; Rajan, R. Removal of rhodamine b from a water medium using hydroxyl and sulphate radicals generated by iron loaded activated carbon. RSC Adv. 2016, 6, 5330–5340. [Google Scholar] [CrossRef]
- Verma, M.; Haritash, A.K. Degradation of amoxicillin by fenton and fenton-integrated hybrid oxidation processes. J. Environ. Chem. Eng. 2019, 7, 102886. [Google Scholar] [CrossRef]
- Ay, F.; Kargi, F. Advanced oxidation of amoxicillin by fenton’s reagent treatment. J. Hazard. Mater. 2010, 179, 622–627. [Google Scholar] [CrossRef]
- Tian, J.N.; Sharshar, M.M.; Yang, M.H.; Mu, T.Z.; Xing, J.M. Degradation of rhodamine b at neutral ph using modified sponge iron as a heterogeneous electro-fenton catalyst. Environ. Prog. Sustain. Energy 2018, 37, 989–995. [Google Scholar] [CrossRef]
- Liu, Z.; Xu, D.; Xia, N.; Zhao, X.; Kong, F.; Wang, S.; Fatehi, P. Preparation and application of phosphorylated xylan as a flocculant for cationic ethyl violet dye. Polymers 2018, 10, 317. [Google Scholar] [CrossRef] [Green Version]
- Sujatha, S.; Sivarethinamohan, R. Application of response surface methodology to optimize lead(ii) ion adsorption by activated carbon fabricated from de oiled soya. Desalin. Water Treat. 2021, 226, 242–250. [Google Scholar] [CrossRef]
- Jeong, S.Y.; Lee, J.W. Optimization of pretreatment condition for ethanol production from oxalic acid pretreated biomass by response surface methodology. Ind. Crop. Prod. 2016, 79, 1–6. [Google Scholar] [CrossRef]
- Solhi, L.; Sun, H.S.; Daswani, S.H.; Shojania, S.; Springate, C.M.K.; Brumer, H. Controlled sulfation of mixed-linkage glucan by response surface methodology for the development of biologically applicable polysaccharides. Carbohydr. Polym. 2021, 269, 118275. [Google Scholar] [CrossRef] [PubMed]
- Dong, X.; Gao, X.; Song, J.; Zhao, L. A novel dispersive magnetic solid phase microextraction using ionic liquid-coated amino silanized magnetic graphene oxide nanocomposite for high efficient separation/preconcentration of toxic ions from shellfish samples. Food Chem. 2021, 360, 130023. [Google Scholar] [CrossRef]
- Liu, Z.M.; Xu, D.D.; Kong, F.G.; Wang, S.J.; Yang, G.H.; Fatehi, P. Preparation and application of sulfated xylan as a flocculant for dye solution. Biotechnol. Prog. 2018, 34, 529–536. [Google Scholar] [CrossRef]
- Wang, S.; Wang, J. Trimethoprim degradation by fenton and fe(ii)-activated persulfate processes. Chemosphere 2018, 191, 97–105. [Google Scholar] [CrossRef] [PubMed]
- Nie, M.; Yan, C.; Xiong, X.; Wen, X.; Yang, X.; Lv, Z.; Dong, W. Degradation of chloramphenicol using a combination system of simulated solar light, fe2+ and persulfate. Chem. Eng. J. 2018, 348, 455–463. [Google Scholar] [CrossRef]
- Csay, T.; Rácz, G.; Takács, E.; Wojnárovits, L. Radiation induced degradation of pharmaceutical residues in water: Chloramphenicol. Radiat. Phys. Chem. 2012, 81, 1489–1494. [Google Scholar] [CrossRef]
Figure 1.
(a) Surface feature of sponge iron. (b) Degradation of CAP under different combinations of treatments. (Conditions: CAP = 120 mg/L, pH = 3.0, H2O2 = 2.00 mmol/L, Sponge iron = 2.00 g/L).
Figure 1.
(a) Surface feature of sponge iron. (b) Degradation of CAP under different combinations of treatments. (Conditions: CAP = 120 mg/L, pH = 3.0, H2O2 = 2.00 mmol/L, Sponge iron = 2.00 g/L).

Figure 2.
Degradation of CAP by US/Fenton-like treatment with initial pH from 3 to 10. (Conditions: CAP = 120 mg/L, H2O2 = 2.00 mmol/L, Sponge iron = 2.00 g/L).
Figure 2.
Degradation of CAP by US/Fenton-like treatment with initial pH from 3 to 10. (Conditions: CAP = 120 mg/L, H2O2 = 2.00 mmol/L, Sponge iron = 2.00 g/L).

Figure 3.
Effect of H2O2 concentration on the degradation of CAP. (Conditions: CAP = 120 mg/L, pH = 3.0, Sponge iron = 2.0 g/L).
Figure 3.
Effect of H2O2 concentration on the degradation of CAP. (Conditions: CAP = 120 mg/L, pH = 3.0, Sponge iron = 2.0 g/L).

Figure 4.
Effect of sponge iron concentration on the degradation of CAP. (Conditions: CAP = 120 mg/L, pH = 3.0, H2O2 = 3.00 mmol/L).
Figure 4.
Effect of sponge iron concentration on the degradation of CAP. (Conditions: CAP = 120 mg/L, pH = 3.0, H2O2 = 3.00 mmol/L).

Figure 5.
(a) Effect of inorganic salts on the degradation of CAP. (b) Cycling runs for the degradation of CAP. (c) XRD changes in sponge iron after four cycles. (Conditions: CAP = 120 mg/L, pH = 3.0, H2O2 = 3.19 mmol/L, Sponge iron = 2.26 g/L).
Figure 5.
(a) Effect of inorganic salts on the degradation of CAP. (b) Cycling runs for the degradation of CAP. (c) XRD changes in sponge iron after four cycles. (Conditions: CAP = 120 mg/L, pH = 3.0, H2O2 = 3.19 mmol/L, Sponge iron = 2.26 g/L).

Figure 6.
TOC investigations into the degradation process under optimum conditions.

Figure 7.
Plate assay showing bacteriostatic activity for CAP of various degradation efficiencies. Note: (1) for Escherichia coli and (2) for Staphylococcus aureus. A: Initial CAP, B: CAP after degraded by 50%, C: CAP after degraded by 99%. (Antibacterial zone: red circle).
Figure 7.
Plate assay showing bacteriostatic activity for CAP of various degradation efficiencies. Note: (1) for Escherichia coli and (2) for Staphylococcus aureus. A: Initial CAP, B: CAP after degraded by 50%, C: CAP after degraded by 99%. (Antibacterial zone: red circle).

Figure 8.
Proposed CAP degradation pathway as a result of US/Fenton-like treatment.


Table 1.
Conditions of degradation of CAP: pH (X1), H2O2 (X2), and Fe (X3).
| Run | X1 | X2 | X3 | pH | H2O2, mmol/L | Fe, g/L | Degradation |
|---|---|---|---|---|---|---|---|
| (X1) | (X2) | (X3) | (%) | ||||
| 1 | −1 | −1 | 0 | 2 | 2 | 2 | 90.45 |
| 2 | 1 | −1 | 0 | 3 | 2 | 2 | 95.33 |
| 3 | −1 | 1 | 0 | 2 | 4 | 2 | 94.84 |
| 4 | 1 | 1 | 0 | 3 | 4 | 2 | 97.68 |
| 5 | −1 | 0 | −1 | 2 | 3 | 1 | 86.46 |
| 6 | 1 | 0 | −1 | 3 | 3 | 1 | 91 |
| 7 | −1 | 0 | 1 | 2 | 3 | 3 | 93.48 |
| 8 | 1 | 0 | 1 | 3 | 3 | 3 | 96.82 |
| 9 | 0 | −1 | −1 | 2.5 | 2 | 1 | 83.6 |
| 10 | 0 | 1 | −1 | 2.5 | 4 | 1 | 87.14 |
| 11 | 0 | −1 | 1 | 2.5 | 2 | 3 | 90.28 |
| 12 | 0 | 1 | 1 | 2.5 | 4 | 3 | 93.45 |
| 13 | 0 | 0 | 0 | 2.5 | 3 | 2 | 97.16 |
| 14 | 0 | 0 | 0 | 2.5 | 3 | 2 | 97.14 |
| 15 | 0 | 0 | 0 | 2.5 | 3 | 2 | 97.15 |
| 16 | 0 | 0 | 0 | 2.5 | 3 | 2 | 97.18 |
| 17 | 0 | 0 | 0 | 2.5 | 3 | 2 | 97.18 |
Table 2.
Outcomes of the response surface models for optimization of CAP degradation.
| Source | Sum of Squares | Degrees of Freedom | Mean Square | F-Value | p-Value |
|---|---|---|---|---|---|
| Model | 314.04 | 9 | 34.89 | 32,985.13 | <0.0001 |
| X1-pH | 30.42 | 1 | 30.42 | 28,756.25 | <0.0001 |
| X2-H2O2 | 22.61 | 1 | 22.61 | 21,376.06 | <0.0001 |
| X3-Fe | 83.4 | 1 | 83.4 | 78,837.31 | <0.0001 |
| X1X2 | 1.04 | 1 | 1.04 | 983.5 | <0.0001 |
| X1X3 | 0.36 | 1 | 0.36 | 340.31 | <0.0001 |
| X2X3 | 0.034 | 1 | 0.034 | 32.35 | 0.0007 |
| X12 | 0.57 | 1 | 0.57 | 538.29 | <0.0001 |
| X22 | 36.76 | 1 | 36.76 | 34,749.68 | <0.0001 |
| X32 | 131.56 | 1 | 131.56 | 124,400 | <0.0001 |
| Lack of Fit | 0.00061 | 3 | 0.0002 | 6.38 | 0.0527 |
| Pure error | 0.00013 | 4 | 0.0032 |
Table 3.
Antibacterial activity of initial and degraded CAP.
| Bacterial Strains | Zone of Inhibition (mm) * | ||
|---|---|---|---|
| A: Initial CAP | B: CAP after Degraded by 50% | C: CAP after Degraded by 99% | |
| Gram negative: | 15 | 9 | N |
| Escherichia coli | |||
| Gram positive: | 10 | N | N |
| Staphylococcus aureus | |||
* Used paper disk with CAP (120 mg/L) degradation efficiency of 0%, 50%, and 99%. Number of assays = 3, estimated error ± 1 mm; N stands for no zone of inhibition.
Publisher’s Note: MDPI stays neutral with regard to jurisdictional claims in published maps and institutional affiliations. |
© 2021 by the authors. Licensee MDPI, Basel, Switzerland. This article is an open access article distributed under the terms and conditions of the Creative Commons Attribution (CC BY) license (https://creativecommons.org/licenses/by/4.0/).
Share and Cite
MDPI and ACS Style
Meng, X.; Liu, Z.; Wang, S.; Kong, F. Synergistic Degradation of Chloramphenicol by an Ultrasound-Enhanced Fenton-like Sponge Iron System. Water 2021, 13, 3561. https://doi.org/10.3390/w13243561
AMA Style
Meng X, Liu Z, Wang S, Kong F. Synergistic Degradation of Chloramphenicol by an Ultrasound-Enhanced Fenton-like Sponge Iron System. Water. 2021; 13(24):3561. https://doi.org/10.3390/w13243561
Chicago/Turabian StyleMeng, Xia, Zhongming Liu, Shoujuan Wang, and Fangong Kong. 2021. "Synergistic Degradation of Chloramphenicol by an Ultrasound-Enhanced Fenton-like Sponge Iron System" Water 13, no. 24: 3561. https://doi.org/10.3390/w13243561
Note that from the first issue of 2016, this journal uses article numbers instead of page numbers. See further details here.