Article

Analysis of the Three-Dimensional Fluorescence Spectroscopy Characteristics of Dissolved Organic Matter in Groundwater from a Subtropical Cave in Dry Season—Daxiao Cave in South China Karst

1
School of Karst Science, Guizhou Normal University, Guiyang 550001, China
2
State Engineering Technology Institute for Karst Desertification Control, Guiyang 550001, China
*
Author to whom correspondence should be addressed.
Water 2021, 13(24), 3574; https://doi.org/10.3390/w13243574
Submission received: 24 October 2021 / Revised: 9 December 2021 / Accepted: 10 December 2021 / Published: 13 December 2021

Abstract

:
Groups in dissolved organic matter (DOM) emit fluorescence information at characteristic wavelengths when irradiated by excitation waves, which can reveal the geochemical behavior of dissolved organic matter in the environment and its sources, but there are few relevant studies in cave groundwater systems. In order to investigate the relationship between drip hydrochemistry characteristics and DOM in cave systems after subsurface leakage, in this study, from the perspective of dissolved organic matter in the karst cave water system, the groundwater in the dry season of Daxiao Cave was selected as the research object. Five drip points and one water pool (DX-1, DX-2, DX-3, DX-4, DX-5, and DX-C) in Daxiao Cave were monitored and consecutively sampled for four months. The parallel factor analysis method (PARAFAC), three-dimensional (3D) fluorescence parameters, and excitation-emission matrix fluorescence spectroscopy (EEM), combined with the hydrochemistry characteristics of the drip water and correlation analysis, were used to analyze the 3D fluorescence spectral characteristics of the DOM of the drip water of Daxiao Cave and their influencing factors. The results show that (1) the hydrochemistry type of the drip water in Daxiao Cave was within the Ca–Mg–HCO3 type, and Ca2+, Mg2+, and HCO3 were the dominant ions in Daxiao Cave; (2) the fluorescence fractions of drip water in dry season caves were dominated by C1 (humus-like), C2 (tryptophan-like), and C3 (tyrosine-like), and the fluorescence fractions of drip water DOM were controlled by protein fluorophores; (3) the DOM in the drip water of Daxiao Cave in the dry season was controlled in part by subsurface leakage and was largely the result of microbial degradation; and (4) the DOM of the drip water may be influenced by the chemical composition of the water, but the exact process is not clear.

1. Introduction

DOM mainly refers to organic mixtures present in soil or water bodies that can pass through a 0.45 μm filter membrane and are soluble in water, acidic, or alkaline solutions, consisting of amino acid, aromatic, aliphatic, and other functional groups containing oxygen, nitrogen, and sulfur; they are a unified body of organic molecules of different sizes and structures, also known as water-soluble organic matter [1]. They are widely present in all kinds of natural water bodies and play an important role in the study of the global carbon cycle and ecosystem nutrient balance, as well as the transport and transformation of organic matter and heavy metal pollution, while DOM is also an important chemical component in water bodies and an important reservoir of organic matter in ecosystems, which has a direct impact on the transport and transformation of matter and energy in ecosystems [2]. At the same time, DOM is one of the most active chemical components in the environment, participating in various biogeochemical cycling processes, and the environmental behavior and biological effectiveness of pollutants (heavy metals, organic pollutants, etc.) are also influenced by it. Currently, more knowledge has been obtained about the composition of DOM, but for compounds whose composition can be determined to be less than 25% of the total organic matter, there is still a large portion of organic matter whose composition is completely unknown [3], and in these unknown DOM, individual molecular chemical isomeric structures have not been identified. The presence of multiple molecular compositions in DOM has been detected using mass spectrometry, and He (2018) and Lechleitner et al. (2017) used high-resolution mass spectrometry to analyze the molecular formula or molecular composition of DOM, but the structure of DOM molecular composition is extremely complex [3,4]. In a study of related literature by He (2018), it was found that for the natural organic matter specimens Suwannee River Fulvic Acids (SRNOM) and Suwannee River Natural Organic Matter (SRFA), different laboratories provided different FT-ICR MS analysis results and the differences were very different, and even the same instrument at different times gives different molecular compositions [3], which confirms the complexity of DOM.
Karst groundwater is an important underground freshwater resource and is the main source of domestic water for residents in karst areas. It is extremely abundant in storage, but what can be used directly by humans is limited. As a result, residents in the karst region of southern China usually experience water shortages in their daily water use, which proves the urgency of protecting karst groundwater quality and is a key challenge in the region [5]. Due to the specific surface chemistry and high stability of DOM, it directly facilitates the dissolution and transport of contaminants (e.g., toxic heavy metals) between the surface environment and aquifers to the extent that the groundwater quality deteriorates [6,7]. DOM can account for up to 90% of the natural organic matter (NOM) in groundwater [8]. NOM in groundwater mainly originates from the soil zone, which is not only capable of transporting contaminants [9] but also converts to carcinogenic disinfection byproducts during oxidation and chlorination in the drinking water treatment process [10], which affects groundwater quality and at the same time affects drinking water safety. Therefore, it is also considered a potential contaminant in groundwater [9].
In karst areas, soil water in karst cave systems and water bodies in karst aquifers are mainly based on karst fractures, pore spaces, and pipe leakage due to the fact that slope runoff is not easily formed in the dry season, but subsurface leakage still exists, thus forming cave drips in the cave roof [11,12]. Cave drip is an important transport driver of DOM in cave systems, carrying a large amount of DOM fluorescence properties, but the relationship between cave water and fluorescence properties after subsurface leakage is unclear. In a study on the response of three-dimensional fluorescence spectral characteristics of cave drip dissolved organic carbon (DOC) to the environment, Xie et al. (2007) found that cave drip DOC originated from the overlying soil layer and that changes in the overlying vegetation of the cave system affected the fluorescence spectral characteristics of the drip [13]. There is a unique hydrogeological structure in karst areas, which makes karst cave systems more sensitive and vulnerable to the external environment [14]. Studies by Li et al. (2006) and Yang et al. (2009, 2012) have shown that groundwater flow and geochemical indicators in karst areas during rainfall responded rapidly to external rainfall [15,16,17], and cave dripping is a type of karst groundwater. Shopov et al. (1994) hypothesized that the long oscillation period of fluorescence intensity of cave sediments is controlled by climatic factors [18], and Baker et al. (1998) also found a link between excitation and emission wavelengths of cave sediments and average annual rainfall [19]. This confirms the correlation between the cave drip DOM and the external environment. There have been numerous studies on the hydrochemistry and fluorescence properties of karst water systems [20,21,22,23], and in a study of the transport characteristics of dissolved organic matter in karst systems, Yao et al. (2014) concluded that traditional physicochemical indicators reflect regional characteristics of water bodies, while DOM fluorescence components reflect more type differences [24]. Studies on the relationship between hydrochemistry and DOM in karst areas are mostly focused on rivers and karst springs, while there are fewer studies related to the DOM of cave water in groundwater systems. Strengthening studies related to DOM in cave water systems is undoubtedly of great significance to enrich and improve DOM studies in karst groundwater systems.
Since there is a lag in the response of cave drip to the external environment, the dry season is less affected by rainfall drenching, subsurface leakage exists, the main source of nutrient leakage such as DOM is not clear, and whether it has an impact on the nutrient use of the overlying vegetation and vegetation recovery is not yet known. Therefore, this study selected October to January as the research period and took the drip water of Daxiao Cave in Guizhou as the research object, using parallel factor analysis and 3D fluorescence spectroscopy to combine the fluorescence component characteristics of DOM with the conventional hydrochemistry indexes of drip water to systematically explore the transport characteristics of DOM and the correlation between the chemical indexes of drip water and the fluorescence component of DOM in Daxiao Cave during the dry season, explore the sources and influencing factors of DOM, and provide a scientific basis for the study of DOM in cave drip water in karst areas. This study provides a scientific basis for the study of drip DOM in karst caves.

2. Materials and Methods
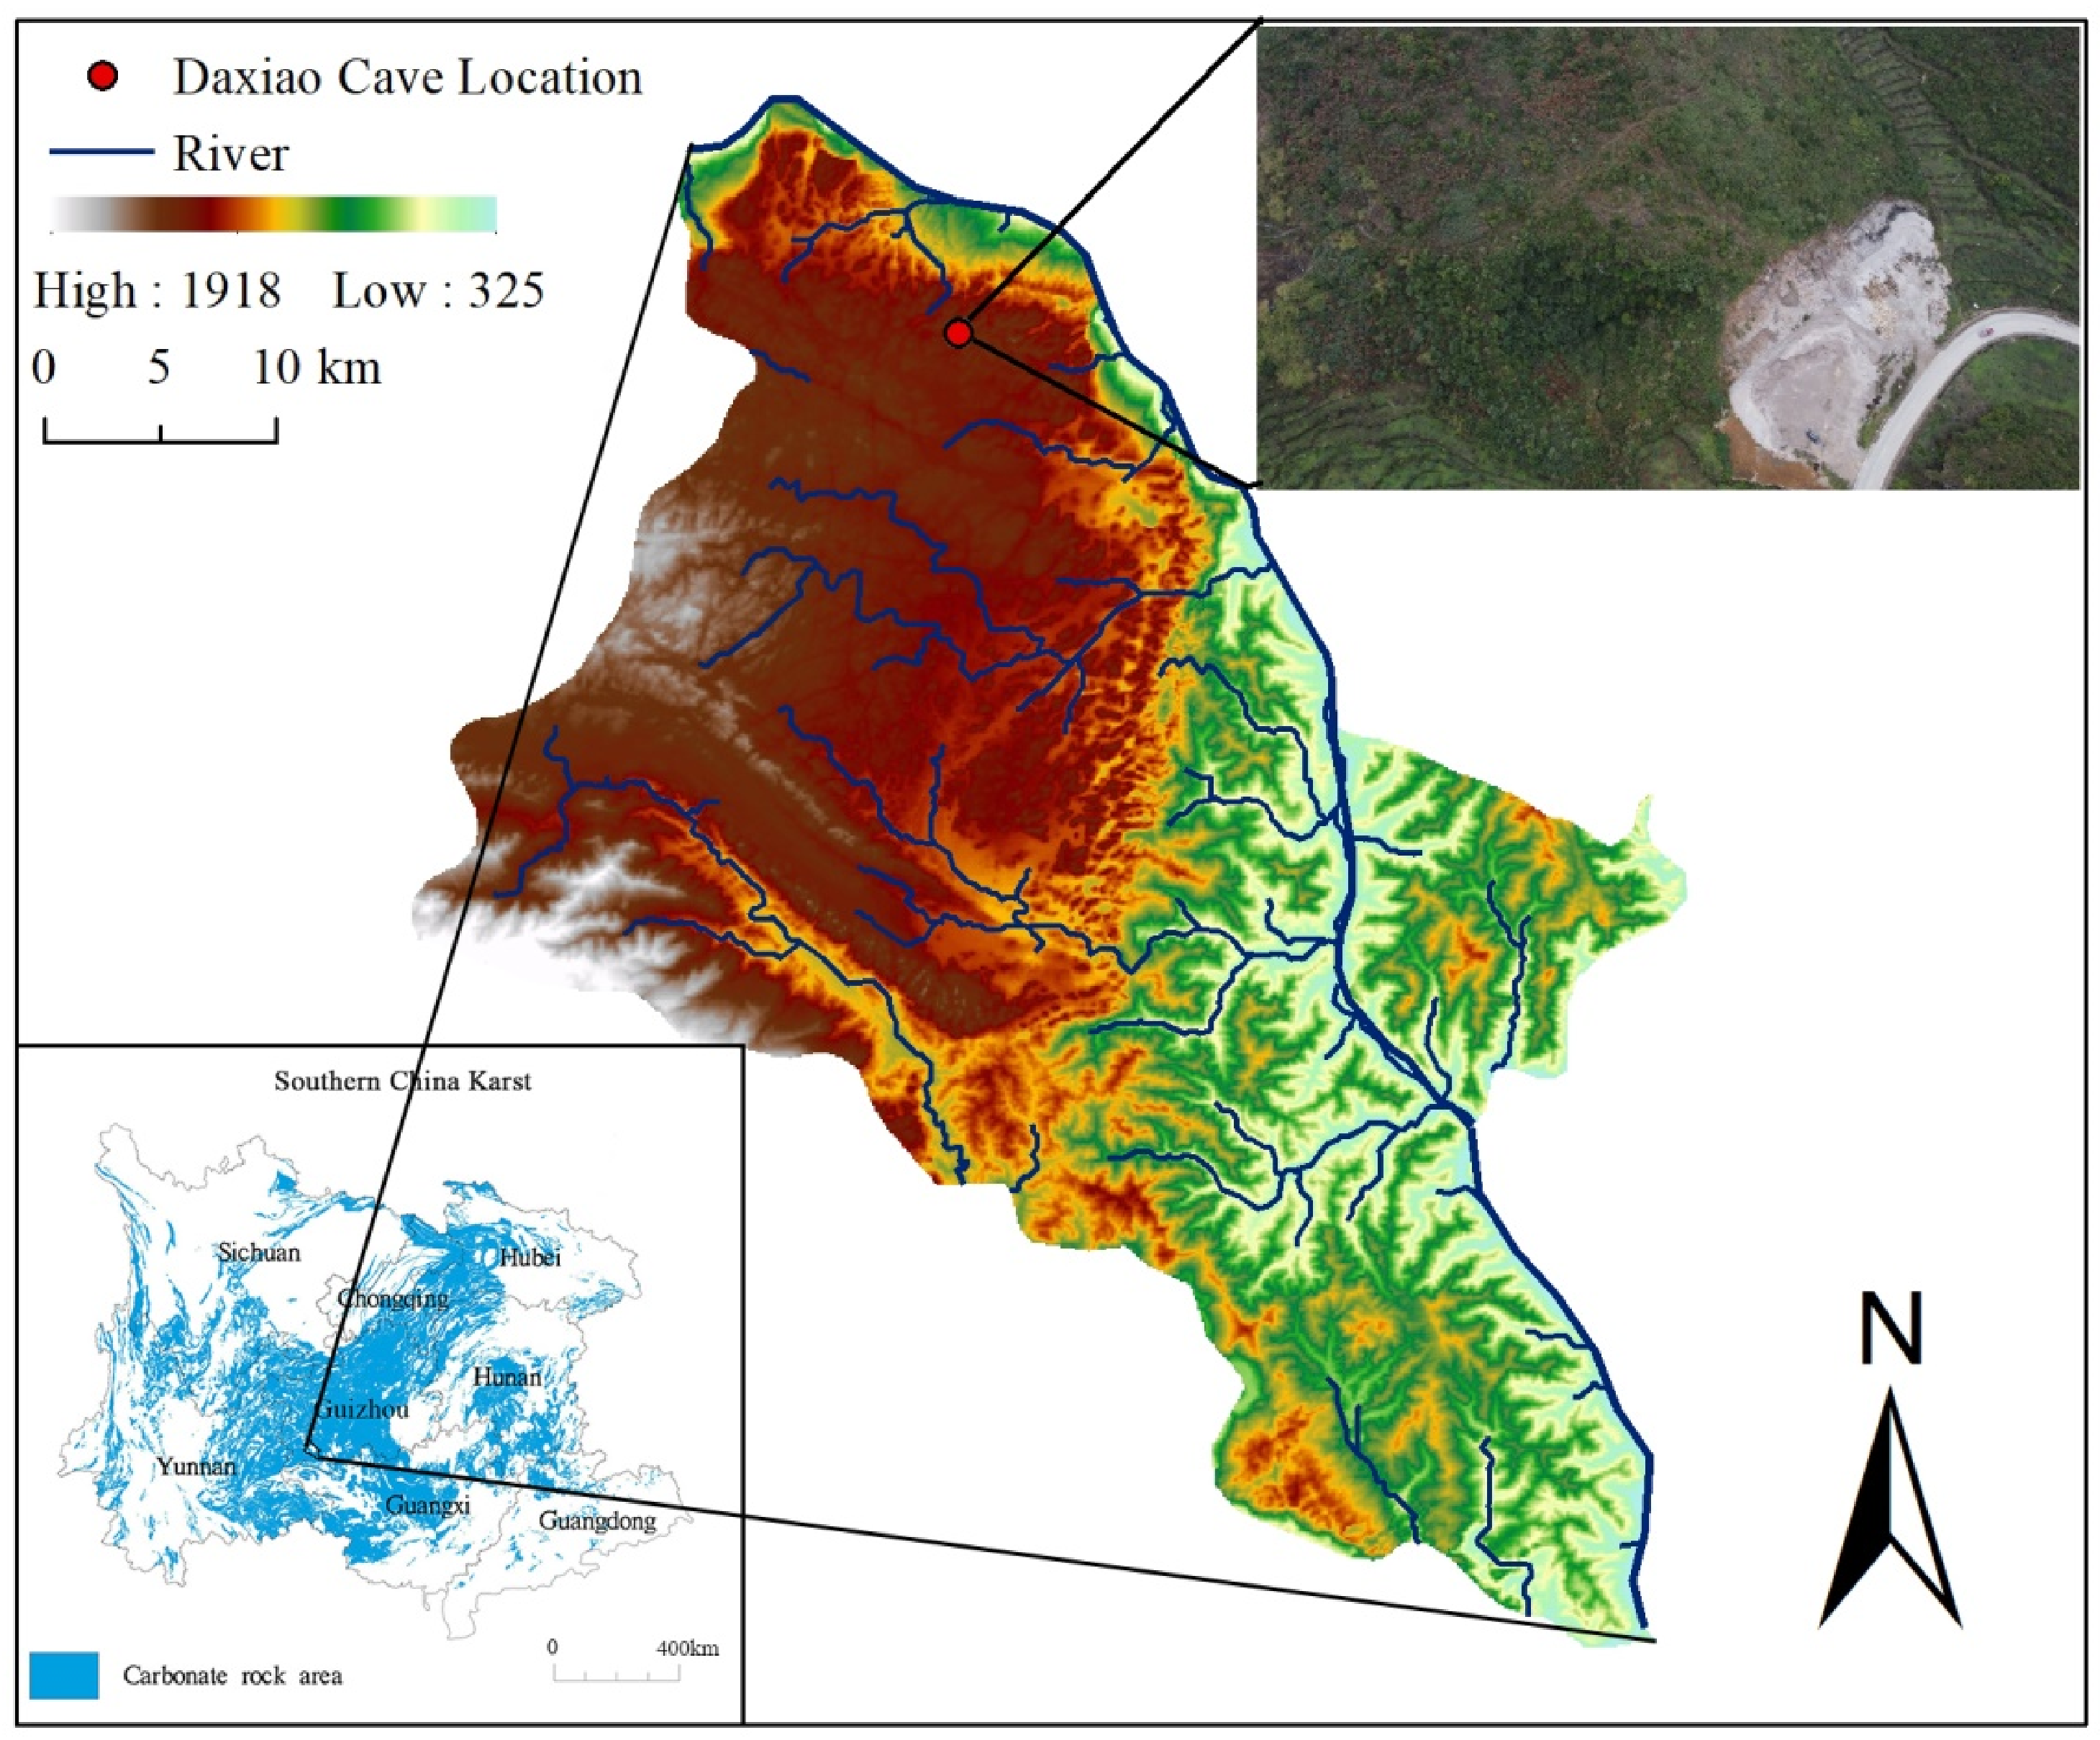
2.1. Study Area

Southern China karst, centered on the Guizhou plateau, is the largest and most concentrated continuous karst ecologically fragile area in the world, with an area of more than 55 × 104 km2, and is also one of the most typical and complex karst development and the richest landscape type, and stone desertification is the most serious ecological environment problem faced by this area. The representative Guanling-Zhenfeng Huajiang karst ecological environment type was selected as the study area in the Guizhou plateau mountains, which represents the general structure of the southern karst environment type [25]. There is a rock exposure rate of up to 90% in the Huajiang study area, a typical plateau–gorge landscape, and the ground is rugged. The climate type is a northern subtropical plateau monsoon humid and mild climate, the highest temperature in summer can reach 40 °C, the average annual temperature is 18.4 °C. The average annual rainfall is 1100 mm, but the northwestern annual rainfall is greater, between 1300 and 1400 mm. Beipanjiang town is an important demonstration area for stone desertification management in China, with pepper and honeysuckle and other cash crops mainly planted, and the stone desertification management is more effective. This area is in the same period of rain and heat and generally starts to enter the dry season in October. The dry season rainfall is only about 17% of the annual rainfall; it is in the subtropical evergreen broad-leaved forest zone, and some vegetation has dry branches and withered leaves in the dry season.
Daxiao Cave (25°37′40.5″ N, 105°38′22.8″ E) is located at the edge of the crest of the slope of Beipanjiang Canyon in the northern part of Beipanjiang Town (Figure 1), with relatively higher terrain than the canyon side, and the elevation of the cave entrance reaches 1209 m. The lithology of the entire cave belongs to the medium-thick bedded ash dolomite (T2y) of the Middle Triassic Guanling Formation, and the lithology is tilted from the high-elevation peaks to the low-elevation canyons. The top of the cave is covered with a thin layer of soil, the vegetation is mainly low bushes and herbs, and the surrounding depressions are mainly planted with pepper. In recent years, under the promotion of a stone desertification management project, the degree of stone desertification has been reduced, and the vegetation coverage has been greatly increased. The entrance of the cave is located in the collapsed part of the southwest side of the peak body; the entrance of the cave is spacious. The height of the cave is 3 m. From the cave entrance to the bottom of the cave is a steep slope descent, the surface of the steep slope is covered by debris, the slope is between 38° and 70°. The highest height from the bottom to the top of the cave is 36 m (Figure 2a), there are drip deposits developed on the bottom and the slope, there is seasonal water accumulation on the bottom of the cave, and there is brown and yellow mud siltation in the dry season when the water recedes. The top plate of the cave has a thickness of (22 ± 7) m. The top rock layer has obvious traces of slumping, and more deposits such as goose tubes and stalactites are developed. The ventilation effect in the cave is poor, with an average CO2 concentration of 440 mg/L, an average temperature of 14.94 °C, and relative humidity of 84.33%. There are relatively more perennial drip points in the cave, and most of them also drip at a faster rate, as shown in the specific drip sampling points (Figure 2b).

2.2. Field Monitoring and Sampling

A total of five perennial-type drip points and one small pool collected by the drip water were selected horizontally and vertically as monitoring points (DX-1, DX-2, DX-3, DX-4, DX-5, and DX-C) according to the hydrological process of the drip water in Daxiao Cave and the development of secondary sediments below, and the physicochemical properties of the six monitoring points were monitored for a period of four months from October 2020 to January 2021. The monitoring time was monthly, and DX-4 and DX-5 were missing data in October and November. The air temperature, water temperature, drip rate, drip volume, pH, electrical conductivity (EC), HCO3, etc., were measured on site at the 5 drip points, and the air temperature, water temperature, pH, and electrical conductivity (EC) were measured using an HQ40d portable water quality analyzer (HACH, Loveland, CO, USA). A plastic bucket rinsed 3 times with pure water was placed under the drip point, and a stopwatch was used to measure the drip rate at 1 min intervals. The average value of the 3 measurements was used as the final drip rate, the drip volume was measured with a small plastic measuring cylinder of 10 mL 3 times, and the average value was taken as the final drip volume. The HCO3 concentration at the drip point was titrated using an alkalinity meter (Merck KGaA, Darmstadt, Germany), and the above index data were recorded.
Before sample collection, clean plastic buckets with pure water were placed at the monitoring points to collect drip water; the collected drip water (pool water) was put into 100 mL brown glass bottles that had been rinsed in advance and the bottles were sealed with sealing film. Meanwhile, three rinsed 100 mL white polyethylene bottles were used for each monitoring site to collect DOC, anion, and cation samples, and to the cation sample, about 0.2 mL 1:1 pure nitric acid was added to prevent cations from adhering to the bottle wall. The above water samples were brought back to the laboratory as soon as possible after filtration, stored in a 4 °C refrigerator, and tested within 24 h, as far as possible.

2.3. Sample Testing and Experimental Methods

The DOM samples brought back to the laboratory were filtered through a 0.22 μm filter membrane into brown glass bottles washed with pure water and dried, then sealed with a sealing film, and scanned using an RF-5301PC fluorescence spectrophotometer (Shimadzu, Kyoto Japan) with a 700 V xenon lamp and a 1 cm quartz cuvette. The excitation wavelength (Ex) ranged from 220 to 500 nm with an interval of 5 nm; the emission wavelength (Em) ranged from 220 to 600 nm with an interval of 1 nm, and the bandwidths of both excitation and emission wavelengths were 5 nm. Mill-Q ultrapure water was used as a blank for scanning to remove Rayleigh scattering and Raman scattering. The cationic samples in polyethylene bottles were filtered and then tested for K+, Na+, Ca2+, and Mg2+ in the soil and water analysis laboratory of the State Engineering Technology Institute for Karst Desertification Control using an inductively coupled plasma mass spectrometer (iCAP RQ ICP-MS) from Thermo Fisher Scientific (Shanghai). Cl, SO42−, and NO3 were determined for anionic samples by ion chromatography (Dionex Aquion IC), and DOC was tested by a multi N/C UV HS TOC analyzer from Analytik Jena (Jena, Germany). The anions and cations were determined by iCAP RQ ICP-MS and Dionex Aquion IC, respectively.
In this study, the 3D fluorescence spectra were analyzed by the parallel factorial method using the DOMFluor toolkit in Matlab2016a software, and the models were uploaded using the OpenFlour interface and compared for analysis to determine the fluorescence components. Parallel factor analysis (PARAFAC) is a mathematical model based on trilinear decomposition theory using alternating least squares to decompose the complex fluorescence data matrix of DOM into its different components [22,26]. The PARAFAC model equation is as follows [22,27]:
x i j k = f = 1 F a i f b j f c k f + e i j k
where xijk denotes the fluorescence intensity of the ith sample at emission wavelength j and excitation wavelength k; F denotes the number of component factors selected; aif is the factor score reflecting the concentration of the fth analysis of the ith sample; bjf and ckf are the loadings, which are the relative values of the kth excitation spectrum and the jth emission spectrum with the fth component, respectively; and eijk denotes the systematic residuals.

3. Results

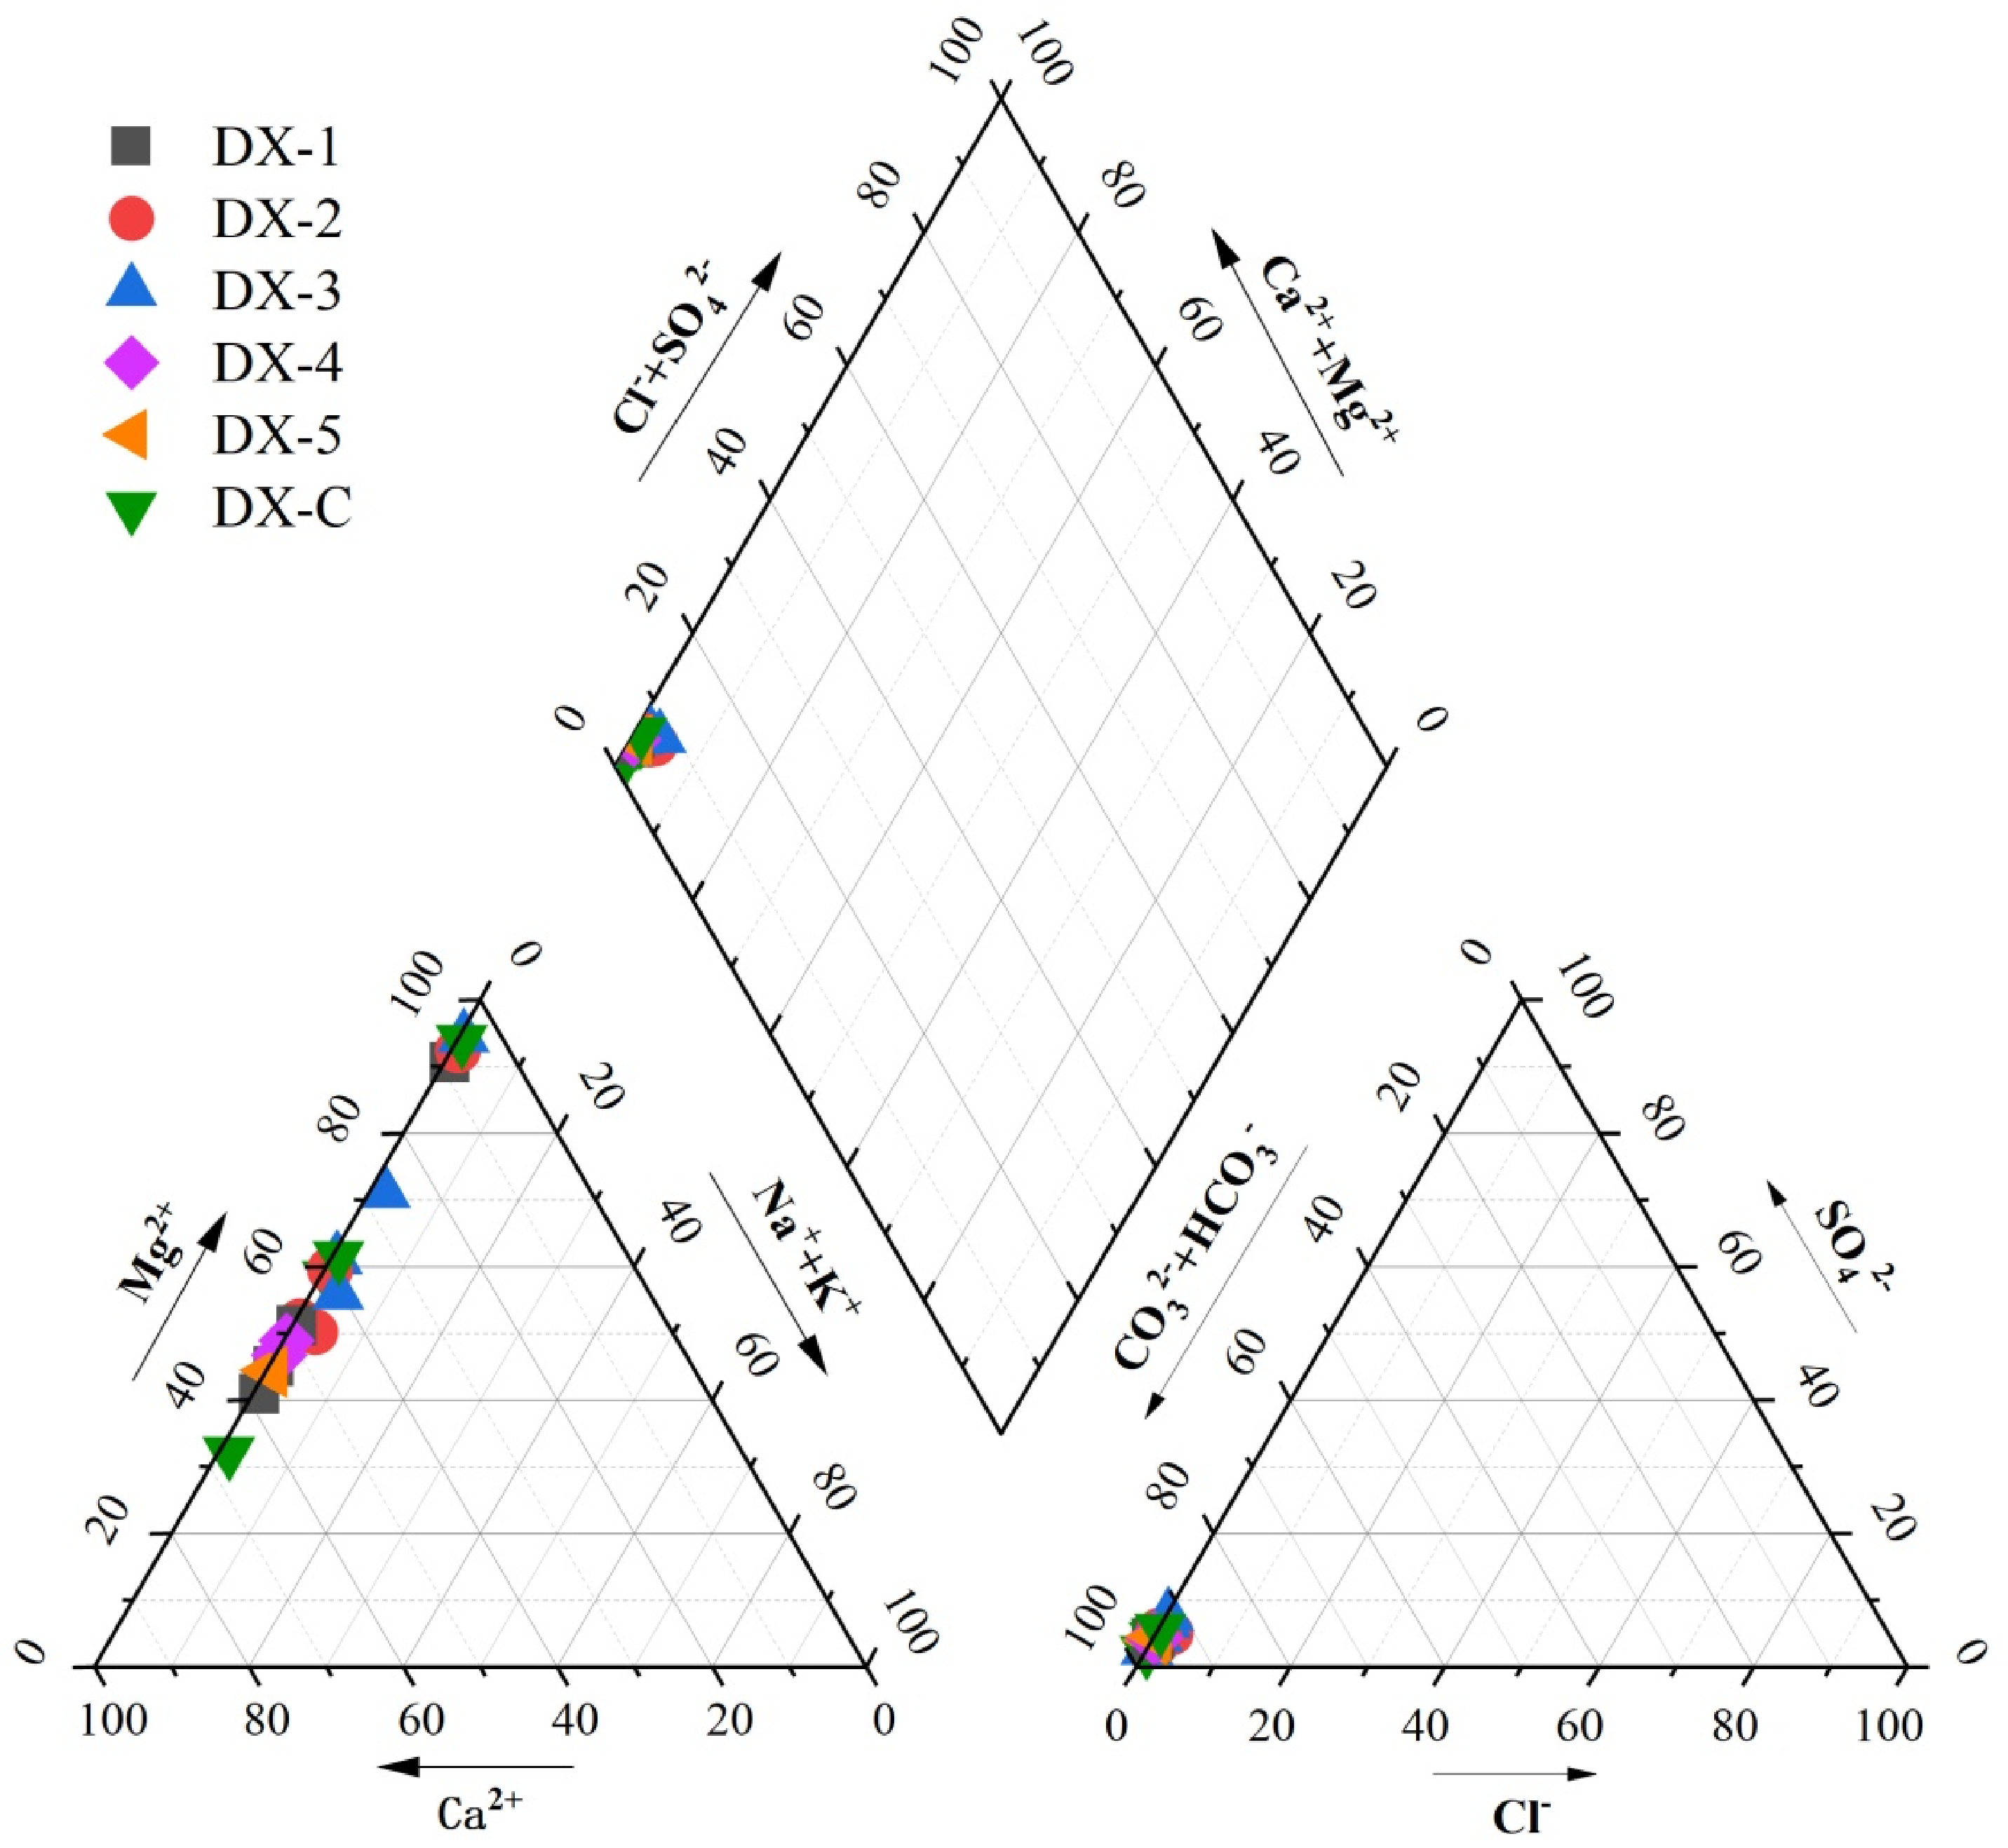
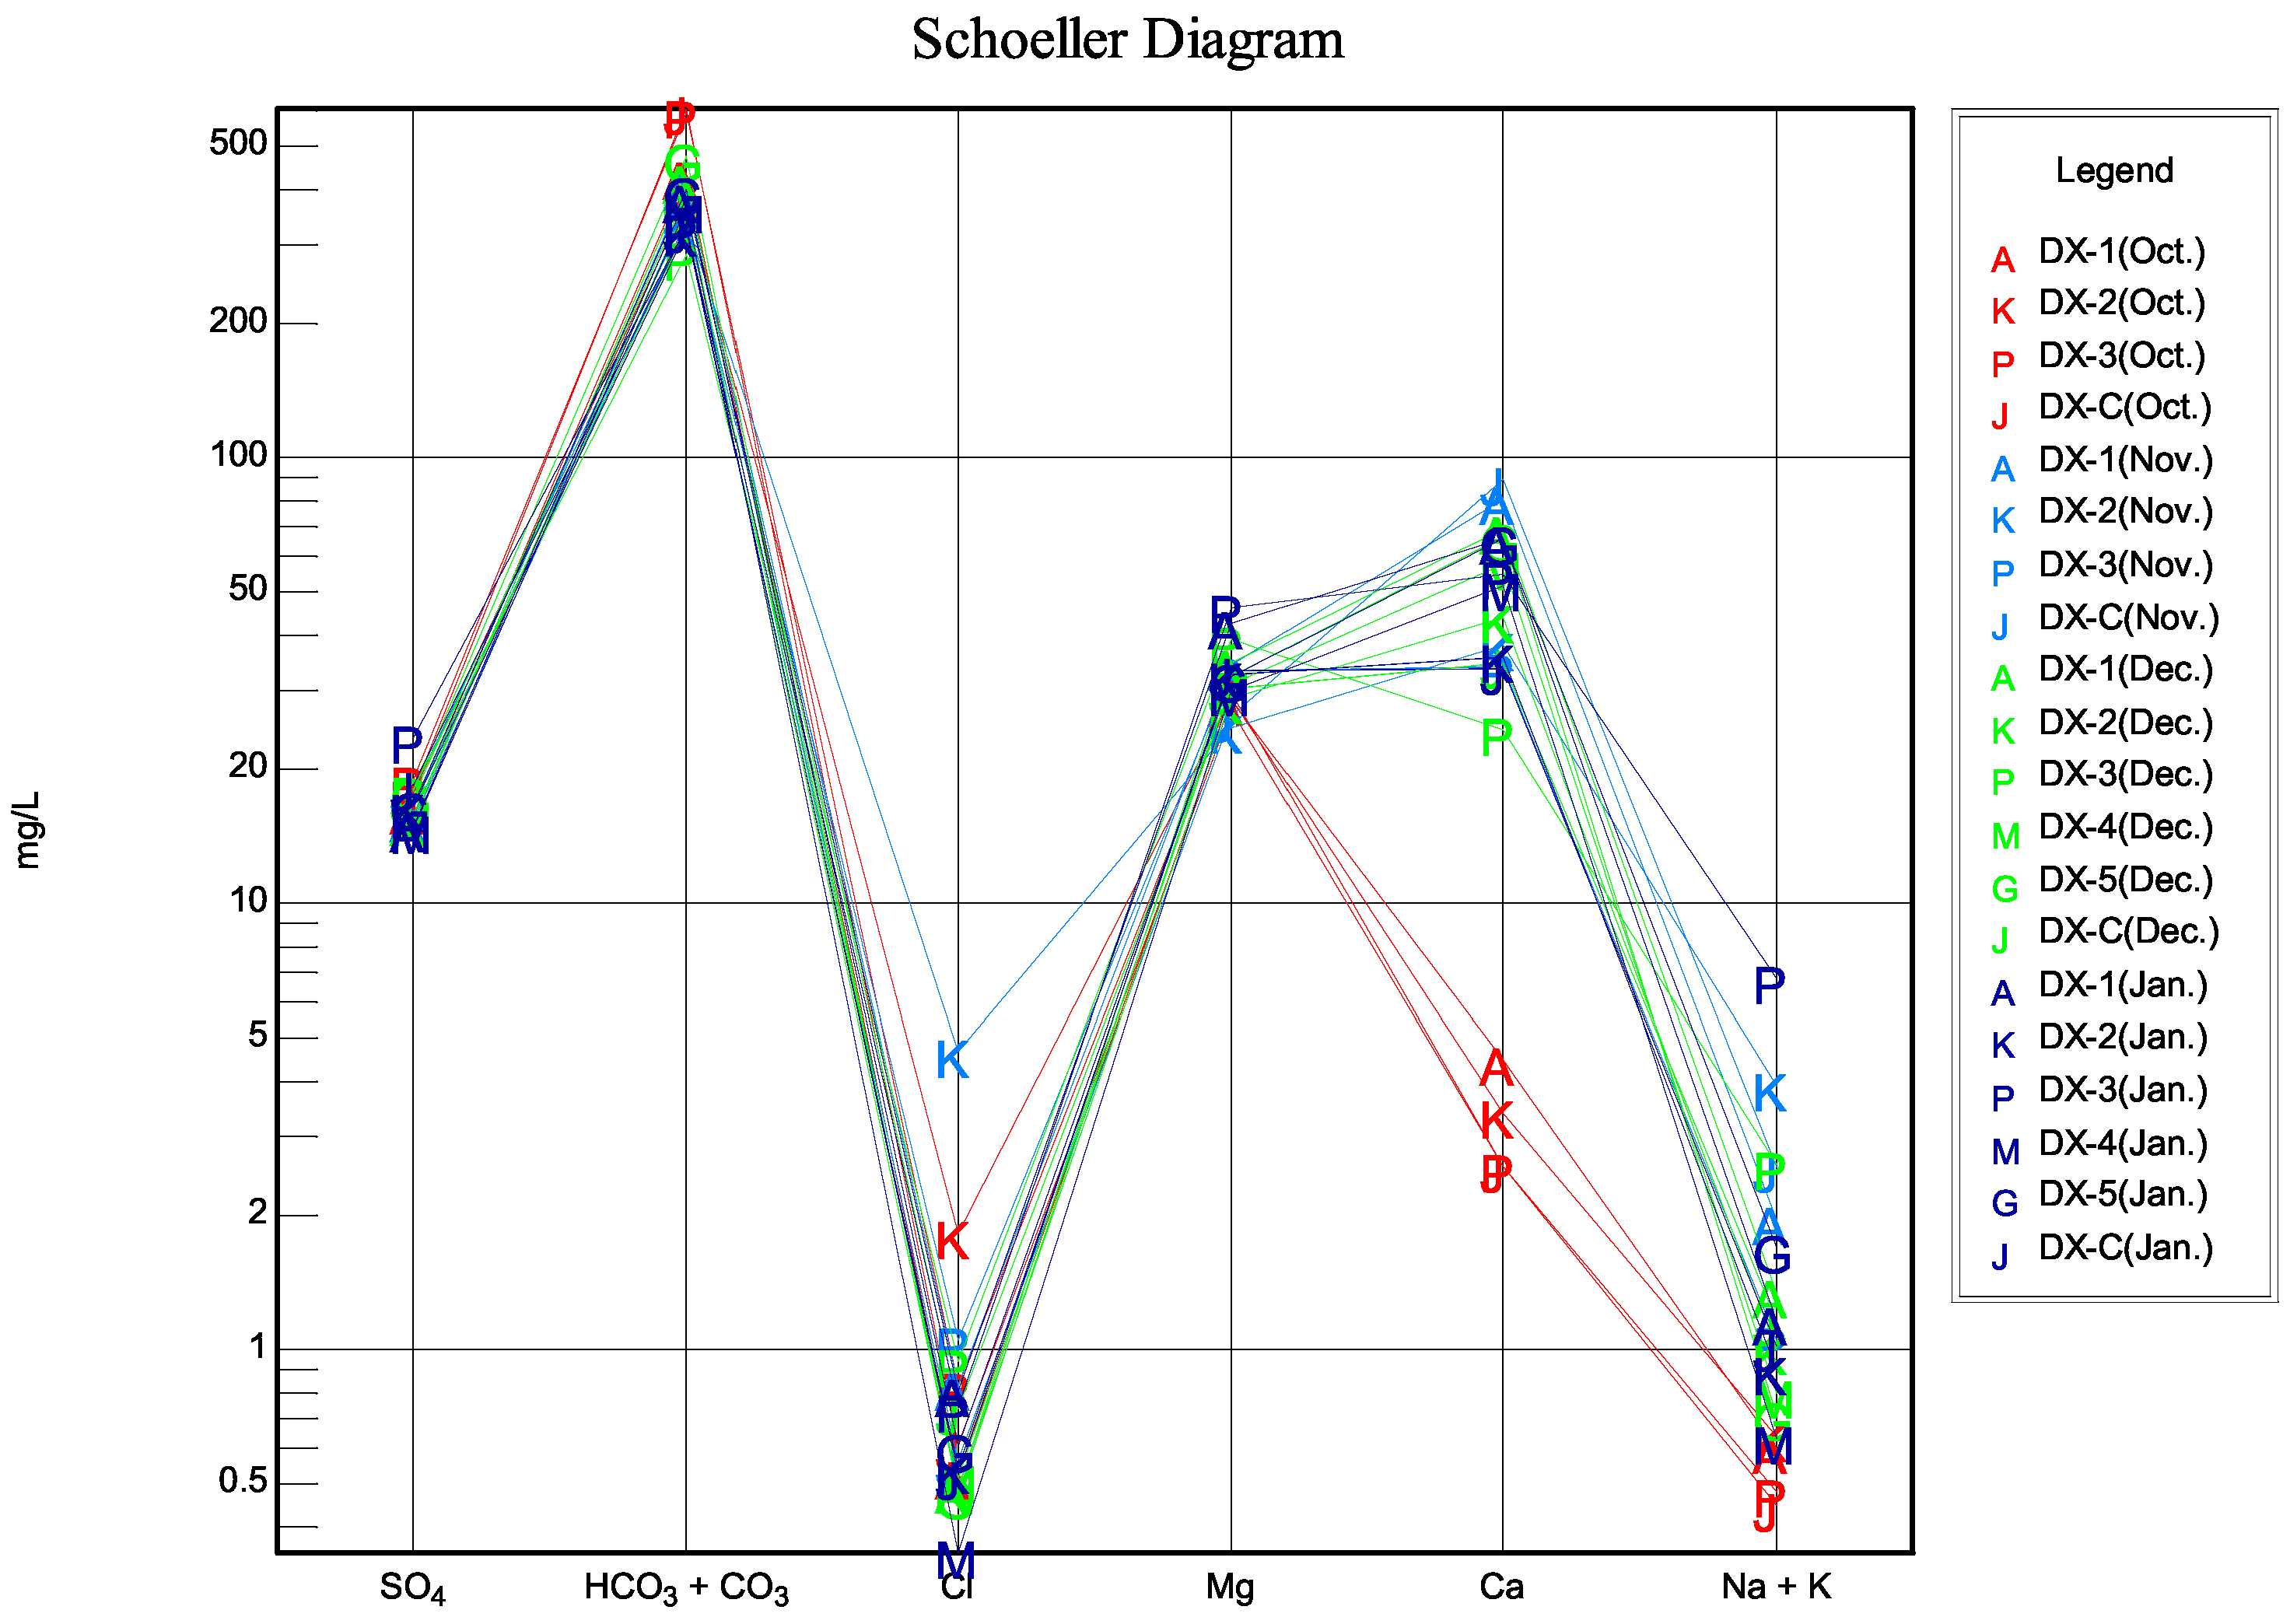
3.1. Hydrochemistry Characteristics of Cave Drips

Cave drip is an important part of the cave environment. It is the medium between the stalagmite and the external environment and also the carrier of environmental climate information. Its physicochemical properties are not only influenced by the external environment, such as temperature and rainfall, etc., but also by soil structure, overlying rock thickness, bedrock fissures, and other factors [28]. The reaction of water bodies such as rainfall and soil water with overlying rock layers during subsurface leakage carries information on ions in the rock layers or nutrients in the overlying soil and bedrock fissure soils. The physicochemical properties of drip water can not only detail the type of drip water chemistry, and external climate and environmental changes but also be an important reference indicator for the study of groundwater nutrient sources and nutrient leakage forms, so it is extremely important to monitor the physicochemical properties of drip water.
The Piper diagram (Figure 3) was drawn based on the anion and cation data of Daxiao Cave, and it is obvious from the Piper diagram that the distribution of the data points in Daxiao Cave is concentrated except for the cation region, which shows that the hydrochemistry of Daxiao Cave drip water is of Ca–Mg–HCO3 type, with carbonate hardness over 50% and hydrochemistry dominated by alkaline earth metals and weak acids [29], which is consistent with the results of Lü (2020) on hydrochemistry and dissolved organic matter characteristics of karst water systems and their influencing factors [30].
In Table 1, the counts of the main cation and anion concentrations at the drip point of Daxiao Cave are presented. The pH value of the drip water in Daxiao Cave during the dry season fluctuated between 8.12 and 9.82, with an average value of 8.69, and the drip water was alkaline. The DOC values in the drip water of Daxiao Cave ranged from 1.88 to 3.9 mg/L and showed an overall trend of increasing before decreasing over time. The NO3 of DX-2 was abnormally high, with a maximum value of 67.28 mg/L, indicating possible contamination. According to the ion content concentration of the Schoeller diagram (Figure 4), the cations of Daxiao Cave drip water were Ca2+ and Mg2+, and the anions were dominated by HCO3, a feature that coincided with the study of Ca2+ and HCO3 as the main anions and cations in karst water [31,32]. Ca2+, Mg2+, and HCO3 accounted for a large proportion of the ion content in Daxiao Cave during the dry season, with Ca2+ concentrations ranging from 2.56 to 89.66 mg/L, with a mean value of 42.95 mg/L, Mg2+ concentrations ranging from 24.83 to 46.12 mg/L, with a mean value of 32.33 mg/L. Ca2+ and Mg2+ accounted for 55.9% and 42.1%, respectively, of the total cation concentration, and HCO3 accounted for 75.1% of the total anion concentration. The abundance of major cations was Ca2+ > Mg2+ > Na+ > K+. From the Schoeller plot, the concentration of Ca2+ in October showed a large deviation from other months, while the concentrations of the remaining ions were relatively close to each other, and the concentrations of some ions deviated, but the differences were not large. The abundance of major anions was HCO3 > CO32− > SO42− > NO3 > Cl. Excluding HCO3 and SO42−, the remaining three anion indicators showed anomalous values in October or November, mainly in DX-3 and DX-C in October and DX-2 drip points in November.

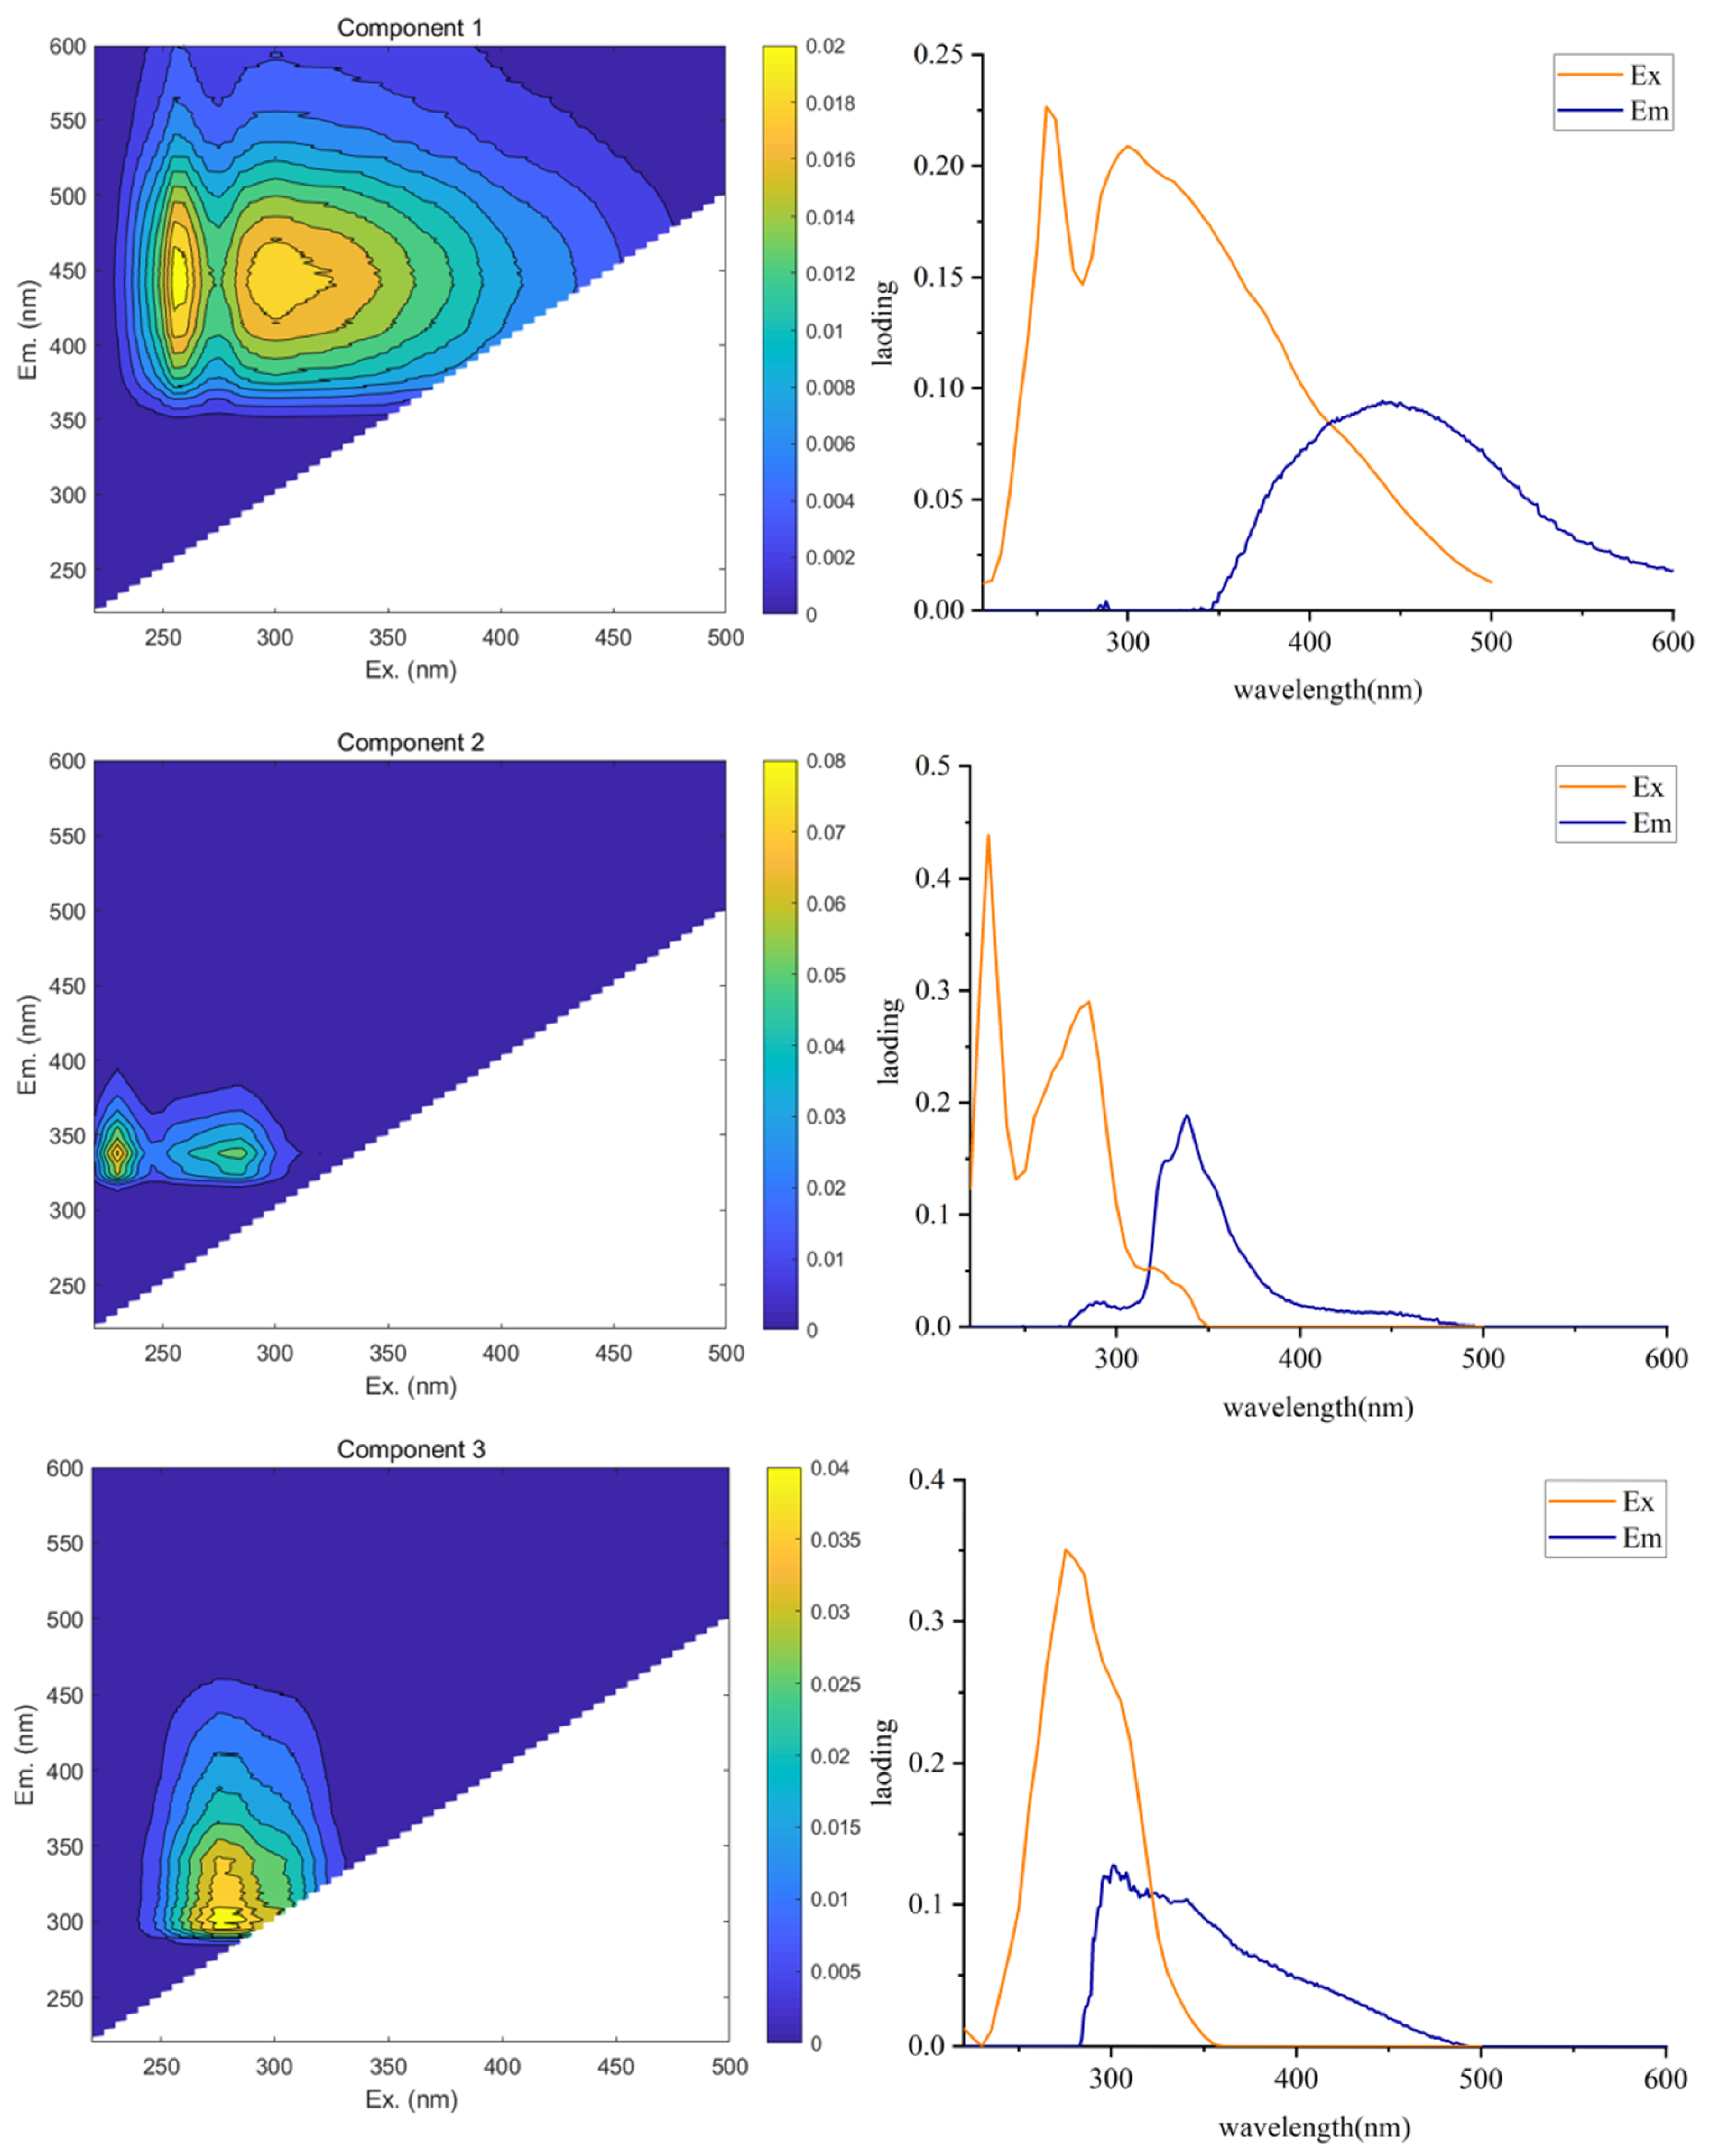
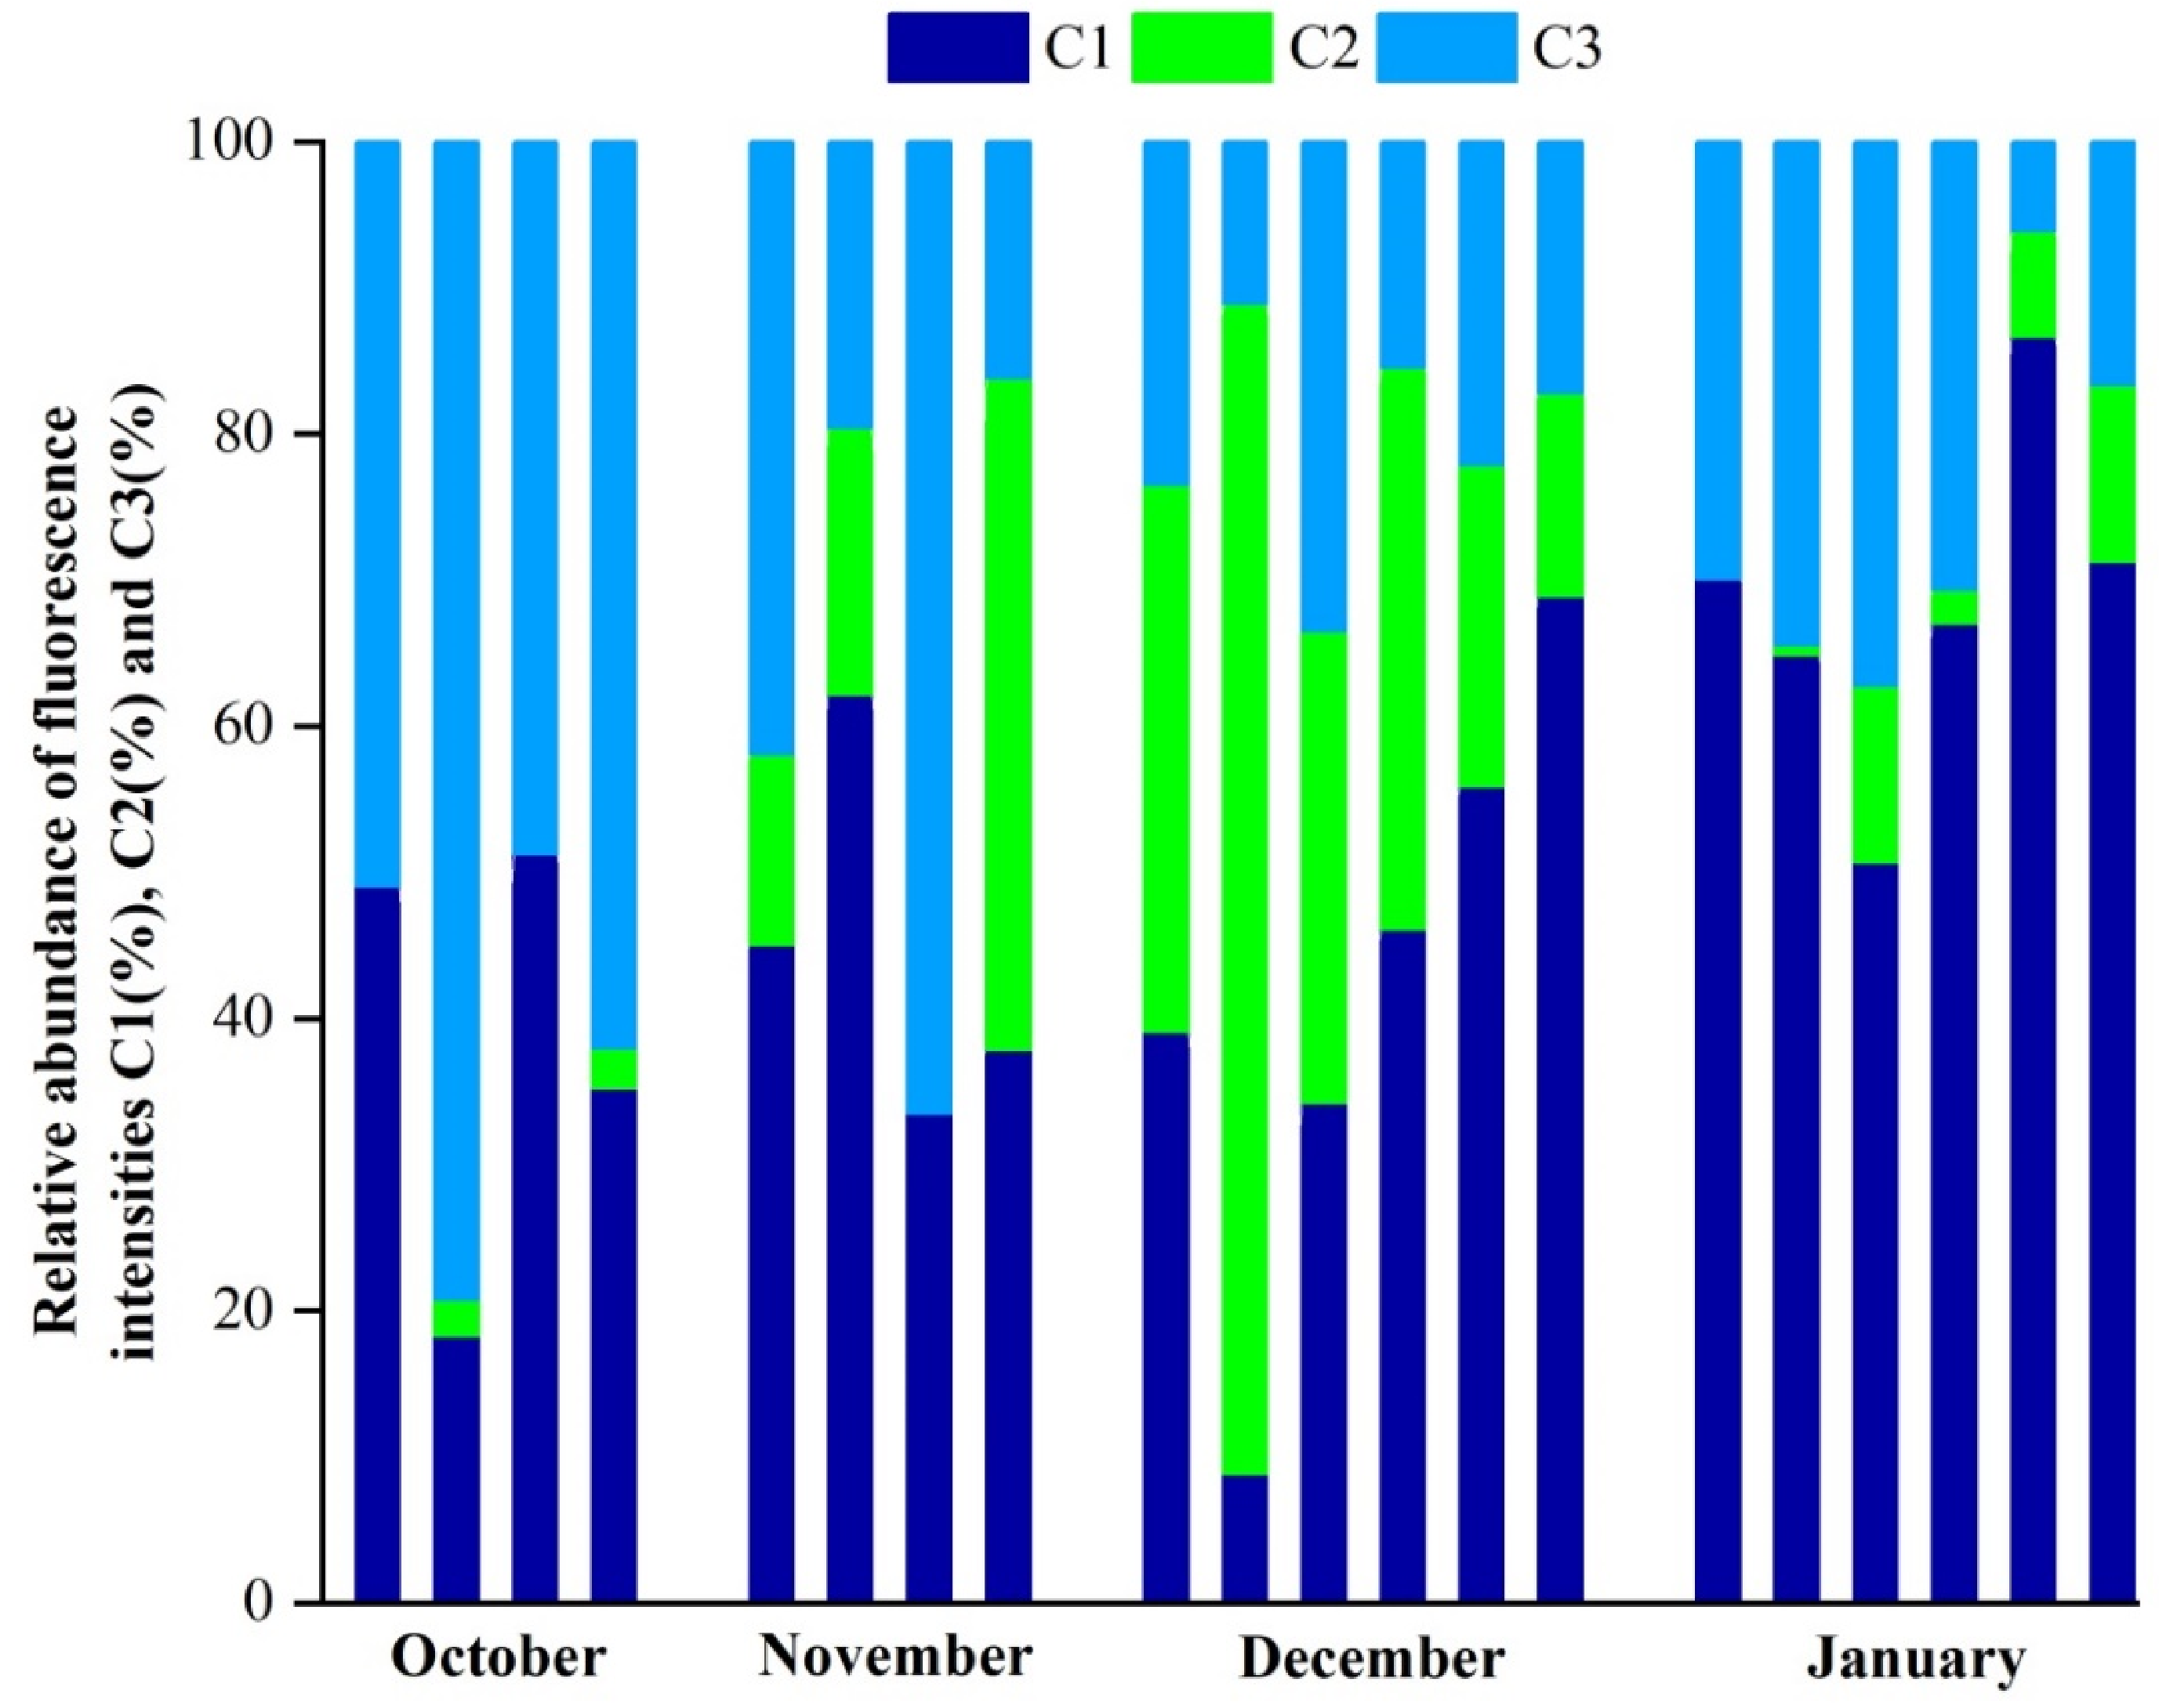
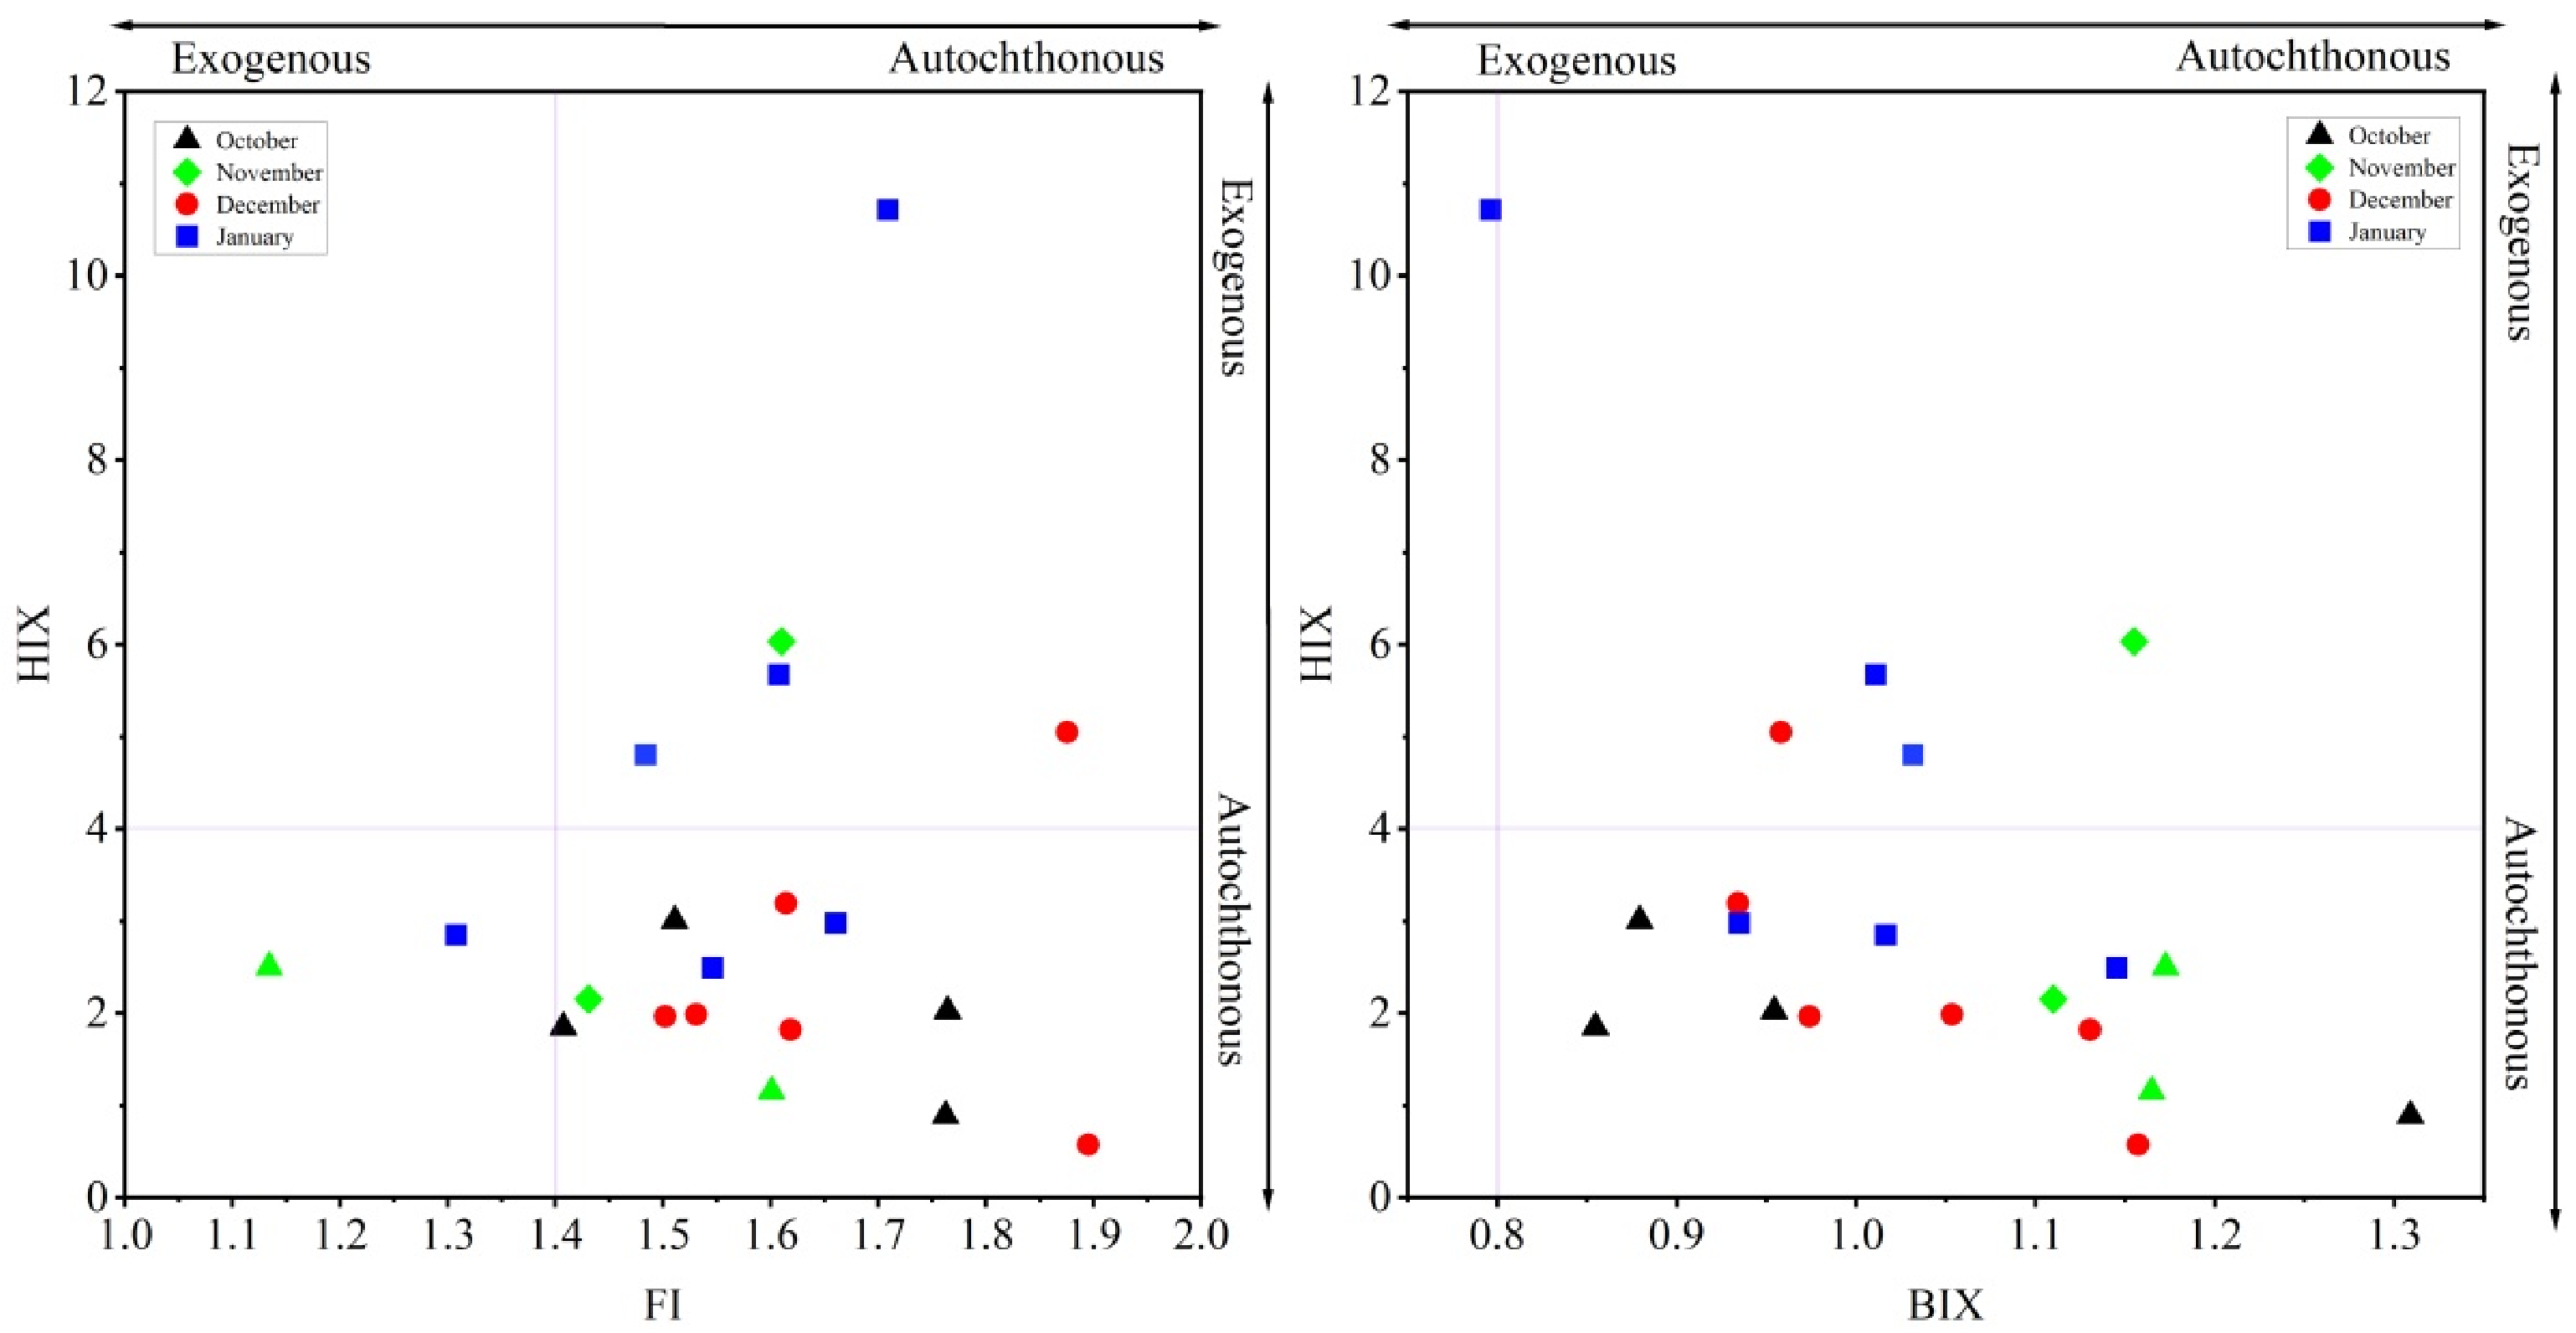
3.2. Three-Dimensional Fluorescence Spectral Characteristics of Cave Drip Water

Three-dimensional fluorescence spectroscopy (EEM) can not only obtain excitation wavelength and emission wavelength but also can be combined with relevant fluorescence information parameters to obtain information on the fluorescence intensity of DOM and its change trend when both wavelengths are changed at the same time. However, the component information of DOM is complex, and the conventional is ambiguous for identifying the specific type of DOM components. Using PARAFAC can decompose the specific fluorescence components and help to better understand the component information and, subsequently, accurately determine the source and nature of the components [33]. In this study, the three cave drip DOM fluorescence components and the excitation and emission wavelengths of each component were obtained by PARAFAC, and the excitation and emission peaks of different components were also obtained to provide conditions for determining the component types. The specific component characteristics information is shown in Figure 5 and Table 2.
The fluorescence component information of the first component determined that the component C1 excitation wavelength (Ex) had a maximum peak at 255 and 300 nm, and the emission wavelength (Em) had a maximum peak at 440 nm. After comparative model analysis with other literature, it was determined that component C1 was a terrestrial source humic substance, which is consistent with the traditional C peak in the literature (λexem: 300~350/400~460) [40]. Component C2 had two maximum excitation peaks at 230 nm and 285 nm, respectively, and a maximum emission peak at 338 nm, with peaks located in the region of the conventional T-peak (λexem: 270~295/330~380) [40], which mainly reflected tryptophan-like proteins produced by microbial degradation. Component C3 was a tyrosine-like protein produced endogenously by terrestrial plants or soil organic matter or by solubilizing microorganisms. Component C3 had only one excitation peak and one emission peak at an excitation wavelength of 275 nm and an emission wavelength of 301 nm, respectively, located near the conventional B peak.
The C1 component at the 255/440 nm peak and the C2 component at the 230 nm/338 nm peak were lower than the conventional peak; therefore, the blue shift of peak position occurred at the above peak position for component C1 and component C2. Senesi et al. (1990) suggested that the reduction in conjugated bonds, decrease in aromaticity, and elimination of functional groups (carbonyl, carboxyl, hydroxyl, etc.) are the main factors affecting the blueshift of DOM 3D fluorescence spectral peaks [41]. Therefore, the blue shift occurring between component C1 and component C2 may be the reason for the reduction in aromatic functional groups.
Based on the Fmax values, the proportion of the 3D fluorescence components of Daxiao Cave differed significantly in different months (Figure 6), and the DOM of Daxiao Cave drip in October was dominated by the tyrosine-like component C3, accounting for 68.5%, while the tryptophan-like component C2 accounted for only 2.1%. The proportion of humic-like C1 and tryptophan-like C2 fractions gradually increased in November and December, with fractions C1 and C2 accounting for 28.1% and 51.3%, respectively, in the two months, and in January, the C2 fraction decreased to only 6.1%, with the humic-like C1 fraction occupying the largest proportion with a 66.5% advantage. As a whole, the percentage of DOM components in the drip water of large elimination holes in the dry season was not very different, with components C1, C2, and C3 accounting for 32.3%, 33.7%, and 34%, respectively.
Fluorescence parameters are mostly used to study the relative contributions of autogenous (endogenous) and terrestrial (exogenous) sources of DOM in natural water bodies (Table 3). In order to clarify the characteristics and sources of dripping DOM in Daxiao Cave during the dry season, the HIX, BIX, and FI of DOM in Daxiao Cave were visualized and analyzed (Figure 7).
Fluorescence Index (FI) is an important indicator for inferring the input of DOM from internal and external sources in natural water bodies. It can also be used as an indicator of the degree of DOM degradation, which is the ratio of the fluorescence intensity at 470 nm and 520 nm when the excitation wavelength is 370 nm, and the emission wavelength is 520 nm. The FI values of Daxiao Cave ranged from 1.13 to 1.89, with a mean value of 1.58. Mcknight et al. showed [45] that when FI = 1.4, the main source of the fluorescence components of DOM is terrestrial, and when FI = 1.9, the source of the fluorescence components of DOM is mainly microbial, i.e., authigenic. In total, 90% of the sample sites of Daxiao Cave had FI indices between 1.4 and 1.9, and most of the data were biased toward microbial sources, which indicated that the DOM of the Daxiao Cave drip water was affected mainly by microbial degradation.
The humification index (HIX) indicates the degree of humification or humic content of the water body, and some studies correlating EEMF with FTICR-MS results have found it to be associated with oxygen-rich and highly unsaturated components (polyphenol-likes) [46,47]. It is the ratio of the integrated value of fluorescence intensity at the excitation wavelength (Ex) at 254 nm, the integrated value of fluorescence intensity at the emission wavelength (Em) from 435 to 480 nm, and the integrated value of fluorescence at 300 to 345 nm. The higher the HIX value, the higher the degree of water humification. The HIX values of cave drips in Daxiao Cave ranged from 0.57 to 10.72, with a mean value of 3.19. A total of 45% of the sample sites had HIX indices between 1.5 and 2.9, reflecting weak humification and important recent endogenous components, and 35% of the sample sites had HIX indices between 3.0 and 6.0, reflecting strong humification and weak recent endogenous components. The HIX indices of the dry season in Daxiao Cave showed an overall trend from weak humification to strong humification.
The biological index (BIX) indicates the origin of microorganisms in DOM aquatic systems [44] and is the ratio of fluorescence intensity at 380 to 430 nm when the excitation wavelength is 310 nm for the emission wavelength. According to Chen et al. (2019), BIX can reflect the contribution of protein-like fractions of DOM in water bodies, and the high contribution is positively correlated with the magnitude of BIX value [48]. The BIX values at the drip point of Daxiao Cave ranged from 0.8 to 1.17, with a mean value of 1.04, indicating that Daxiao Cave drip had more DOM de novo autogenous source material.

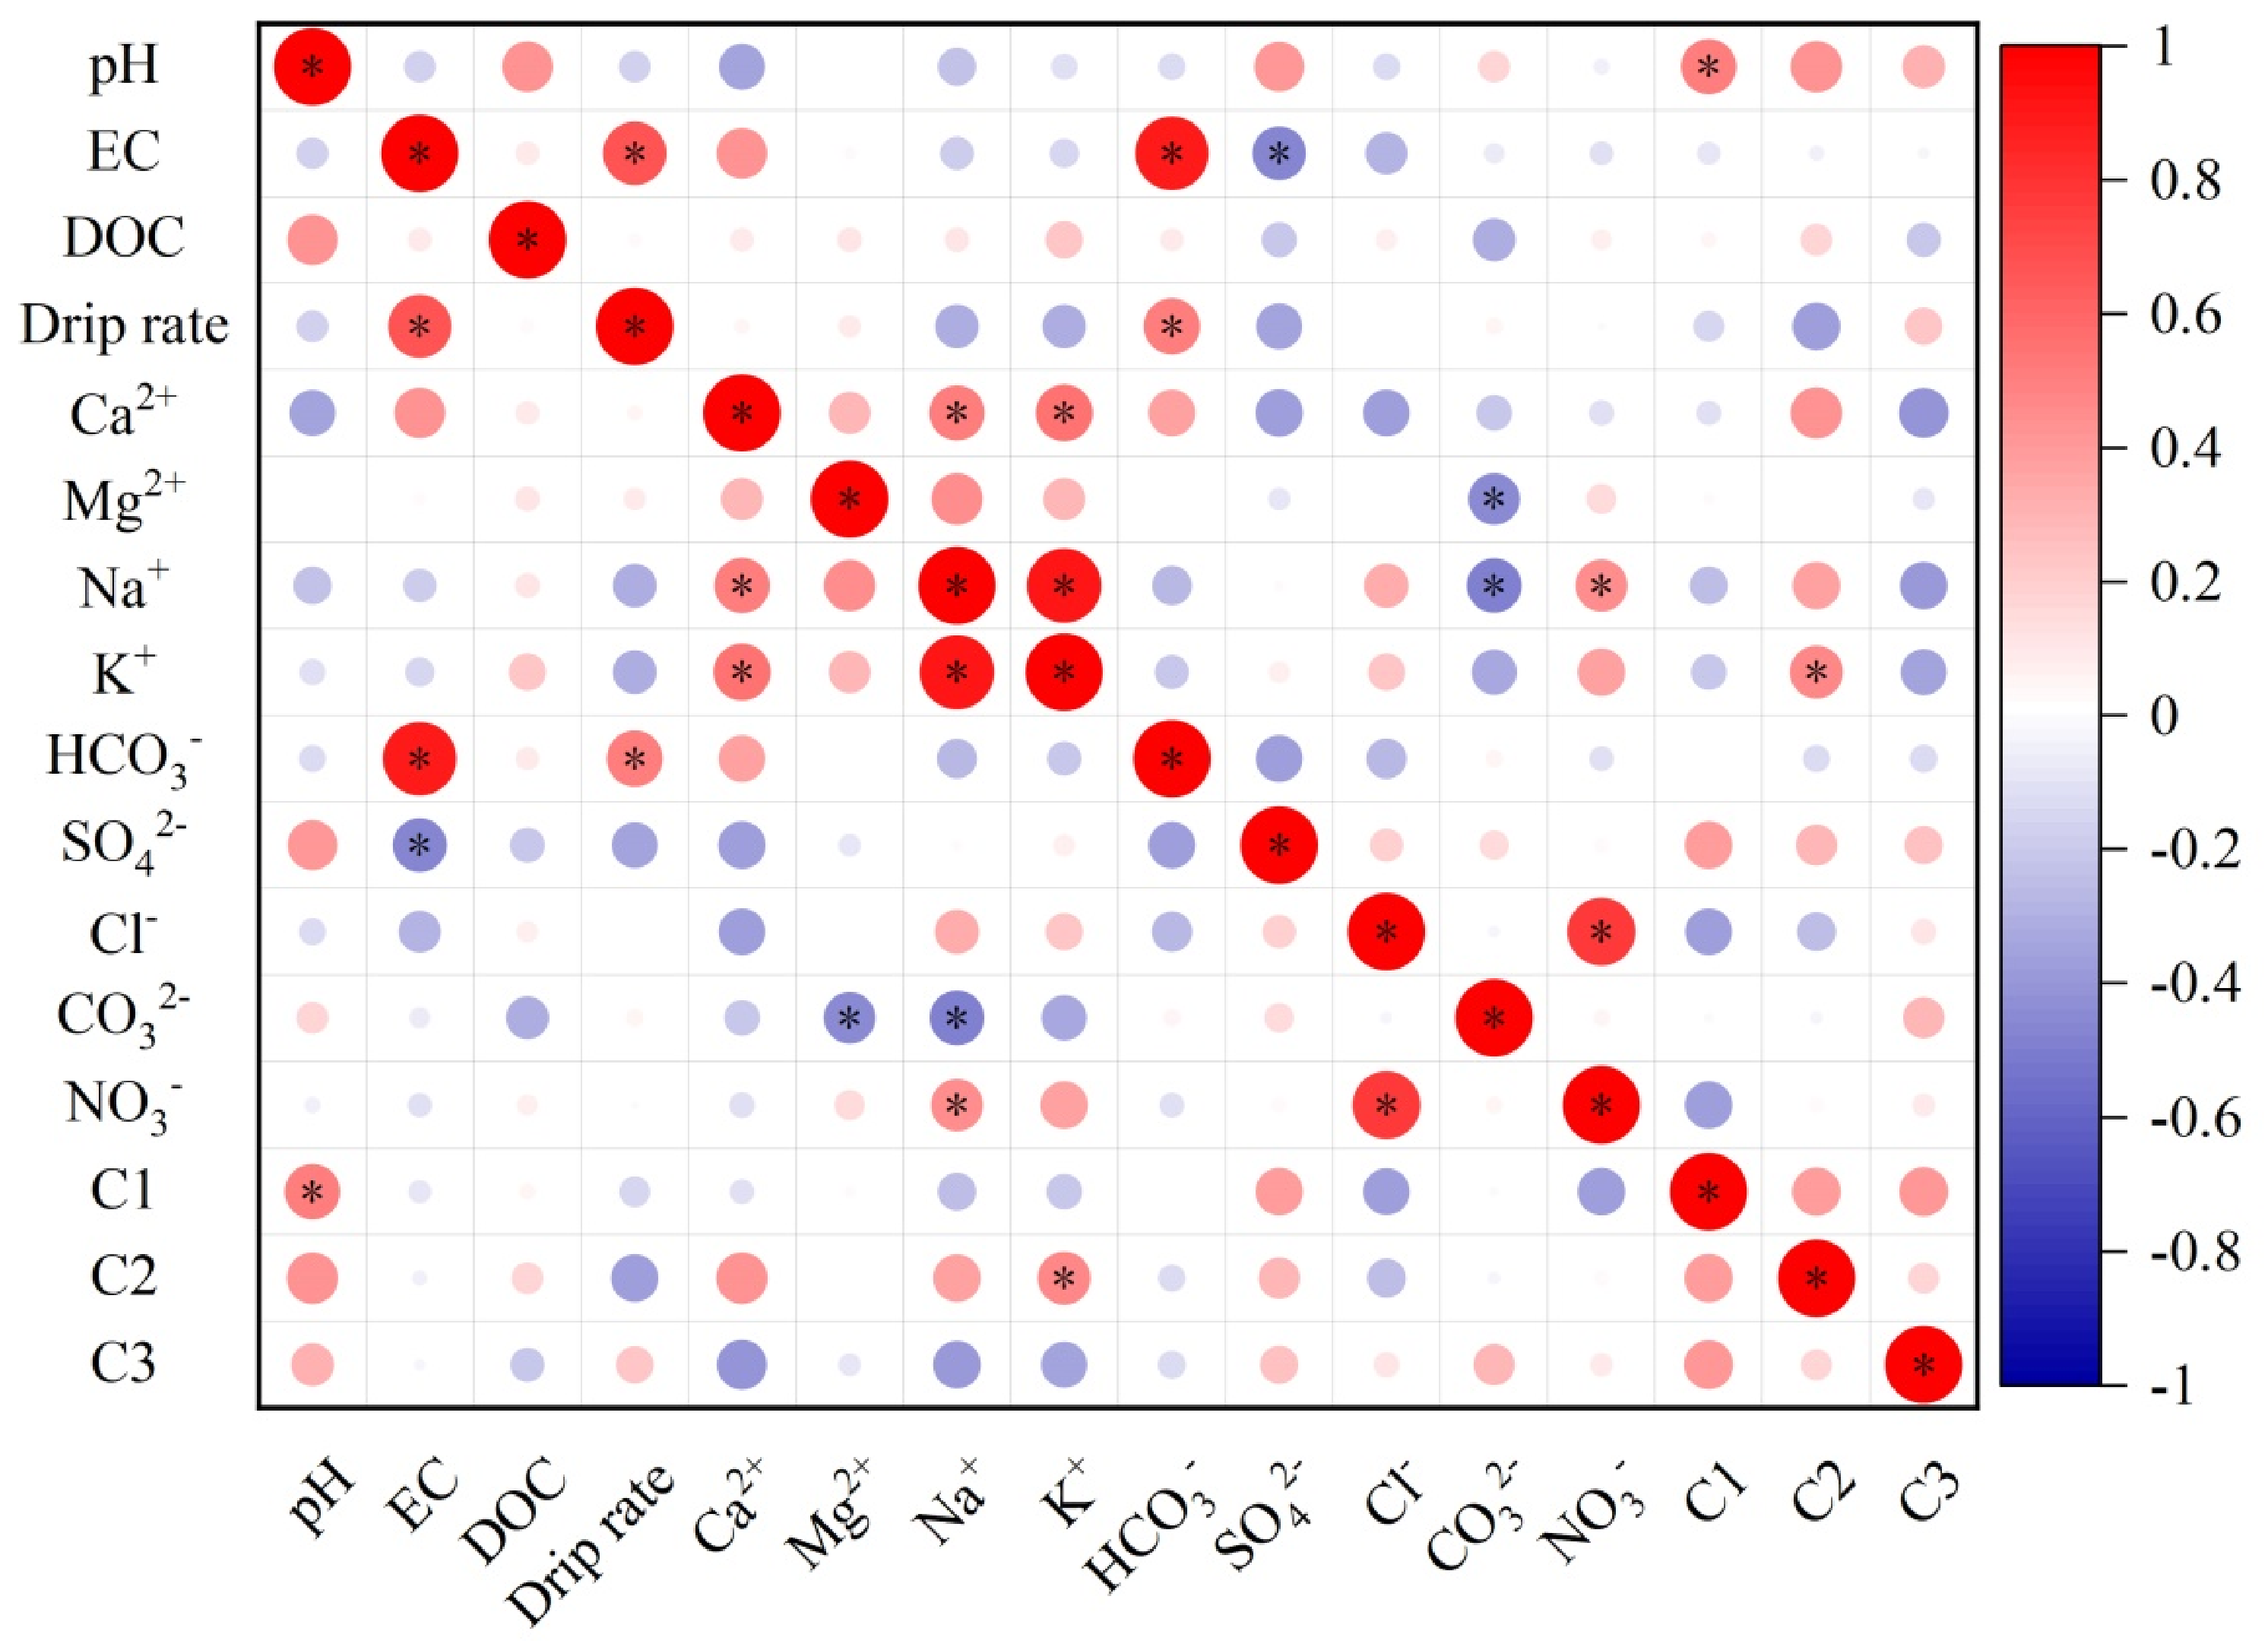
3.3. Correlation Analysis between Hydrochemistry Characteristics and DOM

The unique “aboveground-subsurface” dual structure of the karst region determines that the transport and transformation of DOM in karst caves are influenced not only by biochemical but also by hydrogeological effects. In this study, we monitored and measured the physicochemical properties of water dripping from Daxiao Cave during the dry season. Based on the environmental characteristics and hydrochemistry of the karst caves, we selected 13 physicochemical indexes, including pH, EC, DOC, drip rate, Ca2+, Mg2+, Na+, K+, HCO3, SO42−, Cl, CO32−, NO3, etc., and used multivariate mathematical and statistical analysis methods to investigate the fluorescence of DOM. The correlation analysis was carried out for the fluorescence components C1, C2, and C3 to explore the correlation between the drip water chemistry and its DOM components and to find the main influencing factors in the process of DOM migration and transformation in the cave.
After correlation analysis, the correlation heat map in Figure 8 shows that pH has a more significant positive correlation relationship with component C1 with a correlation coefficient of 0.51. C2, C3, DOC, and SO42− also have a positive correlation relationship with pH, with correlation coefficients of 0.44, 0.31, 0.43, and 0.42, respectively, and the correlation between components shows that C1 > C2 > C3. Patel-Sorrentino et al. (2002) and Spencer et al. (2007) found that humus-like fluorescence peaks in groundwater are affected by the acidity and alkalinity of pH, and fluorescence intensity increases with increasing pH [49,50]. The pH values of the drip water from Daxiao Cave in the dry season ranged from 8.12 to 8.82, which was weakly alkaline, and fluorescence intensity overall showed an increasing trend with pH. SO42− was positively correlated with C1, C2, and C3, with correlation coefficients of 0.38, 0.28, and 0.24, respectively (correlation: C1 > C2 > C3); tryptophan-like component C2 was positively correlated with Ca2+, Na+, and K+, in addition to pH significantly, and was more significantly correlated with K+ with correlation coefficients of 0.44, 0.38, and 0.47, respectively. Component C3 showed negative correlations with Ca2+, Na+, and K+ with correlation coefficients of −0.41, −0.38, and −0.35, respectively. Both negative and positive correlations existed between the drop rate and components C1 and C2 and between the drop rate and component C3, respectively, but none of them were significant, with correlation coefficients of −0.16, −0.37, and 0.23, respectively. The correlation between drip rate and DOC was not obvious, indicating a direct or indirect link between drip rate and DOM components in Daxiao Cave, but the intrinsic link between drip rate and components was not clear in view of the complexity of the cave environment.
The ionic origin of the water dripping from Daxiao Cave is independent of the surrounding agricultural activities, as demonstrated by the correlation between SO42−, Cl, and Mg2+. Singh et al. (2008) suggested that Ca2+ and HCO3 indicate the chemical weathering origin of calcite in carbonate rocks [51]. It is evident in Figure 8 that C2 is positively correlated with Ca2+ and insignificantly correlated with HCO3 (near-zero correlation), indicating that its source may be related to geology and rock weathering, while EC is significantly correlated with drip rate, Ca2+, and HCO3, suggesting that the rapidity of seepage has a large effect on the rate of rock weathering.

4. Discussion

The role of water in the process of subsurface leakage is unquestionable, and in karst cave systems, drip water is the main medium to link the internal environment of the cave with the external environment. The ions in cave drips are mainly from bedrock as well as the overlying soil, and the ion concentrations of macronutrients and trace elements in the drips are influenced by the duration of water–rock interaction; PCP action, uncoordinated calcite dissolution, mixing of old and new water, and dilution of bedrock fracture water are also important factors affecting the ion concentrations in cave drips [52]. Wu et al. (2015) concluded that extraction of mineral precipitates is considered an important predictor of minerals and that studying the Mg/Ca ratio in drip water is important for understanding cave minerals [53]. Borsto et al. (2016) concluded that the Mg/Ca ratio can indicate wet and dry changes in climate [54] and that rainfall is directly or indirectly related to changes in ion concentration. The Ca2+ concentration in Daxiao Cave showed lower values in October, the Ca2+ concentration in other months of Daxiao Cave water was 9~18 times higher than that in October, and the Mg/Ca ratio in October ranged from 6.4 to 11.6. Johnson (2006) found that karst water is prone to PCP during the infiltration process when water–rock action is longer, resulting in a lower Ca2+ concentration and, thus, a higher Mg/Ca ratio [55]. This is most likely the main reason for the low Ca2+ concentration in October in Daxiao Cave; of course, the “ piston effect” plays an important role in this. Our field survey in September showed that there was continuous rainfall in mid-September in the area where Daxiao Cave is located. Combined with the drip rate of drip water, the drip water responded to the external rainfall, and the infiltration rate was faster, so the reason for the low Ca2+ concentration due to the “dilution effect” cannot be ignored, which may also be the reason for the negative correlation between the drip rate and components C1 and C2.
The fluorescence characteristics of the drip water DOM in Daxiao Cave showed that the fluorescence components of Daxiao Cave were C1, C2, and C3, which are mainly humus-like and protein-like (tryptophan-like and tyrosine-like), and the fluorescence parameters showed that the source of DOM in Daxiao Cave in the dry season was mainly authigenic (microbial source). Yao et al. (2014) showed that the fluorescence fraction of DOM in karst groundwater systems is dominated by terrestrial sources of humic substances, reflecting the exogenous contribution of DOM in groundwater systems during the summer abundance period [24], and this study suggests that the source of DOM is more related to subsurface leakage, which is directly or indirectly related to the drip ion concentration in response to the external environment. The fluorescence parameters of the drip water showed that the DOM of the drip water in October was dominated by terrestrial sources or lower authigenic sources, and the drop rate of the drops gradually decreased, and the concentration of Ca2+ and Mg2+ increased after October, DOM showing obvious characteristics of authigenic sources. In recent years, the degree of surface desertification in Daxiao Cave has been reduced, and the overlying vegetation has been better restored, but soil and water leakage still exists, and the DOM generated by the degradation of plant and animal residues in the dry season increases with the increase in plant and animal residues. This is the main source of humic acid in the drip water of the cave, and also because the water stays in the bedrock fissures for a long time, the drip water carries DOM generated by microbial degradation during the leakage process. As rainfall decreases, water retention time becomes longer, resulting in longer microbial degradation time, and the microbial degradation sources become the main source of drip DOM, which may be the main reason for the significantly higher HIX of cave drip in January. The DOM in Daxiao Cave in the dry season is not entirely caused by subsurface leakage, but to a large extent, it is caused by the long retention time of the water body in the overlying rock layer, and, thus, it is formed by microbial degradation and modification over a long period of time.
There have been many relevant studies on the effect of pH on the presence of fluorescent components [49,50,56,57]. Laane et al. (1982) suggested that the variation of fluorescence intensity with pH may be caused by changes in the molecular orbitals of excitable electrons [56], Ghosh et al.(1980) also observed that the structure of humic substances changes with the environment and that they have a linear structure at high pH [57], and Patel-Sorrentino(2002) also suggested that the UV excitation peak (A-peak) is more sensitive to pH, and the fluorescence intensity is affected by pH [49]. We found that the dry season cave drip water in Daxiao Cave was also consistent with the above study. The fluorescence intensity of the dry season cave drip increased with increasing pH, which was additionally confirmed by the correlation between pH and fluorescence components.
The DOC of dripping water tended to increase and then decrease with time, and Xie et al. (2007) concluded that cave drip DOC inherits DOC from the overlying soil water and that DOC produces different fluorescence intensities due to the presence of different functional groups of organic molecules that produce fluorescence [13]. In this study, it was concluded that due to the delayed response of cave drip to rainfall, the change in DOC concentration indicated that the drip DOC in Daxiao Cave may originate from the transport of rainwater to DOC in the overlying soil with a lag as the rainwater is retained in bedrock fractures. However, the correlation between DOC and the three fluorescence components indicated that the fluorescence of terrestrial-derived humus and microbial-derived protein fluorescence retained some of the fluorescence properties generated from the degradation of the overlying soil plants and animals, but the fluorescence change process during DOC transport could not be determined because of the many factors affecting DOM.
There are numerous related studies revealing the relationship between hydrochemistry and DOM; Zhang (2018) found that tyrosine substances are strongly adapted to Ca2+ and HCO3, and Cl and SO42 have a significant positive correlation with fulvic acid-like fractions, while indicators such as K+, Na+, Cl, and SO42 reflect the hydrogeological characteristics and functional information of aquifers in karst areas and indicate the mineralization of water bodies [22]. In karst aquifers, one of the main factors affecting DOM concentration is the mineralization and degradation of the water column during DOM transport [5]. During subsurface leakage in karst areas, the transport time and transport path of water bodies in bedrock fractures or overlying soils affect the degradation of microorganisms and the mineralization of water bodies, which in turn affects the concentration and 3D fluorescence spectral characteristics of dripping DOM. So the process of subsurface leakage is particularly important in the study of DOM. Studies on the relationship between hydrochemistry and DOM in karst cave drips are still scarce. DOM in karst cave systems has a unique path of production, decomposition, and preservation; therefore, exploring the link between hydrochemistry and DOM in cave drips based on subsurface leakage can help us better understand the sources, leakage forms, and influencing factors of DOM in karst water systems to complement the research on DOM in karst water. The current study of DOM in karst water systems is inadequate.

5. Conclusions

The hydrochemistry type of the drip water from Daxiao Cave is Ca–Mg–HCO3, with carbonate hardness over 50% and hydrochemistry dominated by alkaline earth metals and weak acids, Ca2+, Mg2+, and HCO3 are the dominant ions in Daxiao Cave, and the hydrochemistry type is affected by lithology and rock weathering. Moreover, the DOM of cave dripping water in Daxiao Cave in the dry season is controlled by protein fluorophores, mainly from autogenous sources generated by microbial degradation, and the part generated by subsurface leakage is less, which can be used as a potential tracer to study nutrient leakage in karst areas. There is a correlation between the fluorescence fraction of DOM and each hydrochemistry index in the cave drip water of Daxiao Cave. The DOM of the Daxiao Cave drip water in the dry season may be influenced by the hydrochemistry and may be related to the weathering of carbonate rocks, but the specific process is not clear, and more in-depth investigation is needed.

Author Contributions

R.Z. writing—original draft preparation and software; Z.L. conceptualization, methodology, and formal analysis; K.X. methodology, writing—review and editing, funding acquisition; X.L. methodology, resources, and supervision; C.H. investigation and visualization; X.W. software and data curation; K.C. investigation and validation. All authors have read and agreed to the published version of the manuscript.

Funding

This study was supported by the China Overseas Expertise Introduction Program for Discipline Innovation (No. D17016), the Technology Program of Guizhou Province: (No. 5726-28 2017 Qiankehe Pingtai Rencai), the Science and Technology Program of Guizhou Province (No. Yiban 185 2021 Qiankehe Jichu-ZK), and the Ph.D. Research Startup Foundation of Guizhou Normal University in 2019 (No. GZNUD 2 2019).

Institutional Review Board Statement

Not applicable.

Informed Consent Statement

Not applicable.

Data Availability Statement

The data presented in this study are available on request from the corresponding author.

Acknowledgments

We appreciate the anonymous reviewers for their invaluable comments and suggestions on this manuscript.

Conflicts of Interest

The authors declare no conflict of interest.

References

  1. Kalbitz, K.; Solinger, S.; Park, J.-H.; Michalzik, B.; Matzner, E. Controls on the dynamics of dissolved organic matter in soils: A review. Soil Sci. 2000, 165, 277–304. [Google Scholar] [CrossRef]
  2. Wu, F.C.; Wang, L.Y.; Li, W.; Zhang, R.Y.; Fu, P.Q.; Liao, H.Q.; Bai, Y.C.; Guo, J.Y.; Wang, J. Natural organic matter and its significance in terrestrial surface environment. Lake Sci. 2008, 20, 1–12. [Google Scholar] [CrossRef]
  3. He, C. Molecular Characterizaiton of Dissolved Organic Matter by Fourier Transform Ion Cyclotron Resonance Mass Spectrometry: Methodology and Application; China University of Petroleum: Beijing, China, 2018. [Google Scholar]
  4. Lechleitner, F.A.; Dittmar, T.; Baldini, J.U.L.; Prufer, K.M.; Eglinton, T.I. Molecular signatures of dissolved organic matter in a tropical karst system. Org. Geochem. 2017, 113, 141–149. [Google Scholar] [CrossRef] [Green Version]
  5. Liao, J.; Hu, C.; Wang, M.; Li, X.; Ruan, J.; Zhu, Y.; Fairchild, I.J.; Hartland, A. Assessing acid rain and climate effects on the temporal variation of dissolved organic matter in the unsaturated zone of a karstic system from southern China. J. Hydrol. 2018, 556, 475–487. [Google Scholar] [CrossRef]
  6. Rutlidge, H.; Baker, A.; Marjo, C.E.; Andersen, M.S.; Graham, P.W.; Cuthbert, M.O.; Rau, G.C.; Roshan, H.; Markowska, M.; Mariethoz, G.; et al. Dripwater organic matter and trace element geochemistry in a semi-arid karst environment: Implications for speleothem paleoclimatology. Geochim. Cosmochim. Acta 2014, 135, 217–230. [Google Scholar] [CrossRef] [Green Version]
  7. Klucáková, M.; Kalina, M. Diffusivity of Cu(II) ions in humic gels—Influence of reactive functional groups of humic acids. Colloids Surf. A Physicochem. Eng. Asp. 2015, 483, 162–170. [Google Scholar] [CrossRef]
  8. Thurman, E.M. Organic Geochemistry of Natural Waters; Springer: Berlin/Heidelberg, Germany, 1985. [Google Scholar]
  9. Hartmann, A.; Kobler, J.; Kralik, M.; Dirnböck, T.; Humer, F.; Weiler, M. Model-aided quantification of dissolved carbon and nitrogen release after windthrow disturbance in an Austrian karst system. Biogeosciences 2016, 13, 159–174. [Google Scholar] [CrossRef] [Green Version]
  10. Papageorgiou, A.; Papadakis, N.; Voutsa, D. Fate of natural organic matter at a full-scale Drinking Water Treatment Plant in Greece. Environ. Sci. Pollut. Res. 2016, 23, 1841–1851. [Google Scholar] [CrossRef] [PubMed]
  11. Dai, Q.H.; Yan, Y.J. Research Progress of Karst Rocky Desertification and Soil Erosion in Southwest China. J. Soil Water Conserv. 2018, 32, 1–10. [Google Scholar] [CrossRef]
  12. Xiong, K.N.; Li, J.; Long, M.Z. Features of Soil and Water Loss and Key Issues in Demonstration Areas for Combating Karst Rocky Desertification. Acta Geogr. Sin. 2012, 67, 878–888. [Google Scholar] [CrossRef]
  13. Xie, X.; Wang, S.; Zhou, Y.; Luo, W. Three-dimensional fluorescence spectroscopy of dissolved organic carbon in cave drips and its response to the environment: Four cave systems in Guizhou as an example. Chin. Sci. Bull. 2007, 52, 2781–2784. [Google Scholar] [CrossRef]
  14. Yuan, D.X. Sensitivity of karst action to environmental changes and its documentation. Bull. Sci. Technol. 1995, 40, 1210–1213. [Google Scholar] [CrossRef]
  15. Li, Q.; Sun, H.; He, Q.; Ja, L. Soil Loss of Phosphorus and Nitrogen Under Different Precipitation at Karst Area in Southwest China and Its Influence on Spring Hydrochemistry—A Case Study at Nongla, Mashan, China. J. Agric. Environ. Sci. 2006, 25, 467–470. [Google Scholar]
  16. Yang, P.H.; Kuang, Y.L.; Yuan, W.H.; Ja, P.; He, Q.F.; Lin, Y.S. Substances Transport in an Underground River of Typical Karst Watershed During Storm Events. Environ. Sci. 2009, 30, 3249–3255. [Google Scholar] [CrossRef]
  17. Yang, P.H.; Liu, Z.Q.; He, Q.F. Transportation and Sources of the Suspended Particle in a Karst Spring During a Storm Event. Environ. Sci. 2012, 33, 3376–3381. [Google Scholar] [CrossRef]
  18. Shopov, Y.Y.; Ford, D.C.; Schwarcz, H.P. Luminescent microbanding in speleothems: High-resolution chronology and paleoclimate. Geology 1994, 22, 407–410. [Google Scholar] [CrossRef]
  19. Baker, A.; Genty, D.; Smart, P.L. High-resolution records of soil humification and paleoclimate change from variations in speleothem luminescence excitation and emission wavelengths. Geology 1998, 26, 903. [Google Scholar] [CrossRef]
  20. Ayadi, Y.; Mokadem, N.; Besser, H.; Khelifi, F.; Harabi, S.; Hamad, A.; Boyce, A.; Laouar, R.; Hamed, Y. Hydrochemistry and stable isotopes (δ18O and δ2H) tools applied to the study of karst aquifers in southern mediterranean basin (Teboursouk area, NW Tunisia). J. Afr. Earth Sci. 2018, 137, 208–217. [Google Scholar] [CrossRef] [Green Version]
  21. Ayadi, Y.; Mokadem, N.; Besser, H.; Redhaounia, B.; Khelifi, F.; Harabi, S.; Nasri, T.; Hamed, Y. Statistical and geochemical assessment of groundwater quality in Teboursouk area (Northwestern Tunisian Atlas). Environ. Earth Sci. 2018, 77, 349. [Google Scholar] [CrossRef]
  22. Zhang, L.K.; Liu, P.Y.; Qin, X.Q.; Shan, X.J.; Liu, W.; Zhao, Z.H.; Yao, X.; Shao, M.Y. Migration and Transformation of Dissolved Organic Matter in Karst Water Systems and an Analysis of Their Influencing Factors. Environ. Sci. 2018, 39, 2104–2116. [Google Scholar] [CrossRef]
  23. Ehya, F.; Mosleh, A. Hydrochemistry and quality assessment of groundwater in Basht Plain, Kohgiluyeh-va-Boyer Ahmad Province, SW Iran. Environ. Earth Sci. 2018, 77, 164. [Google Scholar] [CrossRef]
  24. Yao, X.; Zou, S.Z.; Xia, R.Y.; Xu, D.D.; Yao, M. Dissolved Organic Matter (DOM) Dynamics in Karst Aquifer Systems. Environ. Sci. 2014, 35, 1766–1772. [Google Scholar] [CrossRef]
  25. Xiong, K.N.; Chen, Q.W. Discussion on karst rocky desert evolution trend based on ecologically comprehensive treatment. Caisologica Sin. 2010, 29, 50–56. [Google Scholar] [CrossRef]
  26. Liu, X.H.; Zhang, Y.L.; Yin, Y.; Shi, Z.Q. Application of three-dimensional fluorescence spectroscopy and parallel factor analysis in CDOM study. Trans. Oceanol. Limnol. 2012, 03, 133–145. [Google Scholar] [CrossRef]
  27. Liu, L.Z.; Huang, Q.; Wu, Y.M.; Wu, D.S.; You, H.L. Fluorescent characteristics of CDOM in Poyang Lake analyzed by three-dimensional excitation-emission matrix spectroscopy and parallel factor analysis. China Environ. Sci. 2018, 38, 293–302. [Google Scholar] [CrossRef]
  28. Fairchild, I.J.; Tuckwell, G.W.; Baker, A.; Tooth, A.F. Modelling of dripwater hydrology and hydrogeochemistry in a weakly karstified aquifer (Bath, UK): Implications for climate change studies. J. Hydrol. 2006, 321, 213–231. [Google Scholar] [CrossRef]
  29. Wang, R.J. Trilinear illustration and its hydrogeological interpretation. Geotech. Investig. Surv. 1983, 6–11. [Google Scholar]
  30. Lü, W.W.; Yao, X.; Su, C.T.; Ren, H.Y.; Yao, M.; Zhang, B.H. Characteristics and influencing factors of hydrochemistry and dissolved organic matter in typical karst water system. Environ. Sci. Pollut. Res. 2020, 27, 11174–11183. [Google Scholar] [CrossRef]
  31. Yuan, D.X. Karst Dynamic System of China; Geological Publish House: Beijing, China, 2002. [Google Scholar]
  32. Ford, D.; Williams, P. Karst Hydrogeology and Geomorphology; John Wiley & Sons Inc.: Hoboken, NJ, USA, 2007. [Google Scholar]
  33. Stedmon, C.A.; Markager, S. Resolving the Variability in Dissolved Organic Matter Fluorescence in a Temperate Estuary and Its Catchment Using PARAFAC Analysis. Limnol. Oceanogr. 2005, 50, 686–697. [Google Scholar] [CrossRef]
  34. Coble, P.G. Characterization of marine and terrestrial DOM in seawater using excitation-emission matrix spectroscopy. Mar. Chem. 1996, 51, 325–346. [Google Scholar] [CrossRef]
  35. Stedmon, C.A.; Markager, S. Tracing the Production and Degradation of Autochthonous Fractions of Dissolved Organic Matter by Fluorescence Analysis. Limnol. Oceanogr. 2005, 50, 1415–1426. [Google Scholar] [CrossRef]
  36. Wang, S.H.; Wang, W.W.; Jang, X.; Zhao, L.; Zhang, B. Distribution of chromophoric dissolved organic matter in Lihu Lake using excitation-emission matrix fluorescence and parallel factor analysis. China Environ. Sci. 2016, 36, 517–524. [Google Scholar] [CrossRef]
  37. Coble, P.G.; Castillo, C.E.D.; Avril, B. Distribution and optical properties of CDOM in the Arabian Sea during the 1995 Southwest Monsoon. Deep-Sea Res. Part II 1998, 45, 2195–2223. [Google Scholar] [CrossRef]
  38. Stedmon, C.A.; Markager, S.; Bro, R. Tracing dissolved organic matter in aquatic environments using a new approach to fluorescence spectroscopy. Mar. Chem. 2003, 82, 239–254. [Google Scholar] [CrossRef]
  39. Cai, H.L.; Ning, X.A.; Chen, X.H.; Lai, X.J.; Wang, Y. Fluorescence characteristics of dissolved organic matter in textile-dyeing effluents. Environ. Chem. 2021, 40, 1592–1601. [Google Scholar] [CrossRef]
  40. Fan, J.X. Sources and Influencing Factors of Chromophoric Dissolved Organic Matter (CDOM) in the Main Stream of Lijiang River in Guilin; Southwest University: Chongqing, China, 2020. [Google Scholar]
  41. Senesi, N. Molecular and quantitative aspects of the chemistry of fulvic acid and its interactions with metal ions and organic chemicals: Part II. The fluorescence spectroscopy approach. Anal. Chim. Acta 1990, 232, 77–106. [Google Scholar] [CrossRef]
  42. Cory, R.M.; McKnight, D.M. Fluorescence spectroscopy reveals ubiquitous presence of oxidized and reduced quinones in dissolved organic matter. Environ. Sci. Technol. 2005, 39, 8142–8149. [Google Scholar] [CrossRef] [PubMed]
  43. Ohno, T. Fluorescence inner-filtering correction for determining the humification index of dissolved organic matter. Environ. Sci. Technol. 2002, 36, 742–746. [Google Scholar] [CrossRef] [PubMed]
  44. Huguet, A.; Vacher, L.; Relexans, S.; Saubusse, S.; Froidefond, J.M.; Parlanti, E. Properties of fluorescent dissolved organic matter in the Gironde Estuary. Org. Geochem. 2009, 40, 706–719. [Google Scholar] [CrossRef]
  45. McKnight, D.M.; Boyer, E.W.; Westerhoff, P.K.; Doran, P.T.; Kulbe, T.; Andersen, D.T. Spectrofluorometric Characterization of Dissolved Organic Matter for Indication of Precursor Organic Material and Aromaticity. Limnol. Oceanogr. 2001, 46, 38–48. [Google Scholar] [CrossRef]
  46. Wilske, C.; Herzsprung, P.; Lechtenfeld, O.J.; Kamjunke, N.; Einax, J.W.; von Tümpling, W. New Insights into the Seasonal Variation of DOM Quality of a Humic-Rich Drinking-Water Reservoir—Coupling 2D-Fluorescence and FTICR MS Measurements. Water 2021, 13, 1703. [Google Scholar] [CrossRef]
  47. Wilske, C.; Herzsprung, P.; Lechtenfeld, O.J.; Kamjunke, N.; von Tümpling, W. Photochemically Induced Changes of Dissolved Organic Matter in a Humic-Rich and Forested Stream. Water 2020, 12, 331. [Google Scholar] [CrossRef] [Green Version]
  48. Chen, Z.Y.; Li, S.Y. Absorption and Fluorescence Spectra of Dissolved Organic Matter in Rivers of the Three Gorges Reservoir Area Under the Background of Urbanization. Environ. Sci. 2019, 40, 5309–5317. [Google Scholar] [CrossRef]
  49. Patel-Sorrentino, N.; Mounier, S.; Benaim, J.Y. Excitation–emission fluorescence matrix to study pH influence on organic matter fluorescence in the Amazon basin rivers. Water Res. 2002, 36, 2571–2581. [Google Scholar] [CrossRef]
  50. Spencer, R.G.M.; Bolton, L.; Baker, A. Freeze/thaw and pH effects on freshwater dissolved organic matter fluorescence and absorbance properties from a number of UK locations. Water Res. 2007, 41, 2941–2950. [Google Scholar] [CrossRef] [PubMed]
  51. Singh, A.K.; Mondal, G.C.; Kumar, S.; Singh, T.B.; Tewary, B.K.; Sinha, A. Major ion chemistry, weathering processes and water quality assessment in upper catchment of Damodar River basin, India. Environ. Geol. 2008, 54, 745–758. [Google Scholar] [CrossRef]
  52. Baker, A.; Genty, D.; Fairchild, I.J. Hydrological characterisation of stalagmite dripwaters at Grotte de Villars, Dordogne, by the analysis of inorganic species and luminescent organic matter. Hydrol. Earth Syst. Sci. 2000, 4, 439–449. [Google Scholar] [CrossRef] [Green Version]
  53. Wu, K.Y.; Shen, L.C.; Zhang, T.S.; Xiao, Q.; Wang, A.Y. Links between host rock, water, and speleothems of Xueyu Cave in Southwestern China: Lithology, hydrochemistry, and carbonate geochemistry. Arab. J. Geosci. 2015, 8, 8999–9013. [Google Scholar] [CrossRef]
  54. Borsato, A.; Johnston, V.E.; Frisia, S.; Miorandi, R.; Corradini, F. Temperature and altitudinal influence on karst dripwater chemistry: Implications for regional-scale palaeoclimate reconstructions from speleothems. Geochim. Cosmochim. Acta 2016, 177, 275–297. [Google Scholar] [CrossRef]
  55. Johnson, K.R.; Hu, C.; Belshaw, N.S.; Henderson, G.M. Seasonal trace-element and stable-isotope variations in a Chinese speleothem: The potential for high-resolution paleomonsoon reconstruction. Earth Planet. Sci. Lett. 2006, 244, 394–407. [Google Scholar] [CrossRef] [Green Version]
  56. Laane, R. Influence of pH on the fluorescence of dissolved organic matter. Mar. Chem. 1982, 11, 395–401. [Google Scholar] [CrossRef]
  57. Ghosh, K.; Schnitzer, M. Fluorescence Excitation Spectra of Humic Substances. Can. J. Soil Sci. 1980, 60, 373–379. [Google Scholar] [CrossRef] [Green Version]
Figure 1. The map of Zhenfeng County showing locations of Daxiao Cave, including an overview of the cave entrance.
Water 13 03574 g001
Figure 2. Schematic diagram of the profile and plane sampling points of Daxiao Cave ((a) profile; (b) plane and sampling point schematic).
Water 13 03574 g002
Figure 3. Dry season drip water Piper diagram of Daxiao Cave.
Water 13 03574 g003
Figure 4. Schoeller diagram of Daxiao Cave. The red, light blue, green, and dark blue labels indicate the sampling points of Daxiao Cave in October, November, and December 2020 and January 2021, respectively.
Water 13 03574 g004
Figure 5. Spectral shapes of the three components of drip water from Daxiao Cave.
Water 13 03574 g005
Figure 6. The percentage of the three fluorescent components of the DOM in the drip water of Daxiao Cave. Each bar represents a sample point, sorted from left to right by DX-1, DX-2, DX-3, DX-4, DX-5, and DX-C for each month, where the DX-4 and DX-5 data for October and November are missing.
Water 13 03574 g006
Figure 7. Distribution of drip point FI, HIX, and BIX for October 2020–January 2021 in Daxiao Cave.
Water 13 03574 g007
Figure 8. Heat map of the correlation between hydrochemistry and fluorescence components in the drip water of Daxiao Cave (* p ≤ 0.05).
Water 13 03574 g008
Table 1. Statistics of chemical parameters of drip water in Daxiao Cave from October 2020 to January 2021, where all units are in mg/L except for pH and Drip rate.
OctoberNovemberDecemberJanuary
RangeMeanRangeMeanRangeMeanRangeMean
pH8.33~8.568.498.12~8.428.279.34~9.829.488.17~8.478.34
DOC2.25~2.822.411.88~3.182.612.8~3.93.272.18~3.322.68
Drip rate42~12687.719~8658.311~86443~7536.6
Ca2+2.56~4.473.2534.01~89.6660.5924.5~69.1249.3433.44~65.9451.27
Mg2+27.2~29.7228.5524.83~34.3729.6928.92~39.3232.8230.14~46.1236.12
Na+0.21~0.390.280.54~2.271.260.34~1.590.70.32~4.131.17
K+0.23~0.330.260.51~1.661.120.33~1.010.570.31~2.650.86
Cl0.53~1.820.950.57~4.641.770.47~0.930.610.35~0.810.59
SO42−16.22~18.9917.7215.35~17.8716.4015.3~18.1116.8714.74~23.5117.44
NO33.99~19.228.425.2~67.2821.992.49~9.574.92.39~7.234.3
HCO3298.9~366323.3274.5~341.6297.38250.1~408.7320.25274.5~372.1316.18
Table 2. Characteristics of the fluorescence components of DOM in the drip water of Daxiao Cave.
ComponentsTypeThe Present Study Ex/Em (nm)Other Studies Ex/Em (nm)Nature and Possible Sources
C1Humus-like255 (300)/440255 (340)/453 [27]Terrestrial source humus.
250~260/380~460 [34]
320~360/420~460 [34]
C2Tryptophan-like230 (285)/338280/388 [35]Tryptophan-like production from microbial degradation. [35]
225~230/320~350 [36]
225~230 (275)/340~350 [37,38]
C3Tyrosine-like275/301275/304 [27]Terrestrial plants or soil organic matter, endogenously produced or dissolved microbial metabolites. [39]
<255 (275)/304 [33]
275/315 [39]
Table 3. Equations and significance of fluorescence parameters [40].
DefinitionSignificance
FIRatio of fluorescence intensity at excitation wavelength 370 nm to emission wavelength at 470 nm and 520 nm.Infers the relative contribution of the internal and external source inputs to CDOM in natural water bodies. [42]
HIXThe ratio of the integrated value of fluorescence intensity in the range of 435~480 nm and the integrated value of fluorescence from 300 to 345 nm at the excitation wavelength of 254 nm for the emission wavelength.Indicates humus content or degree of humisification. [43]
BIXExcitation wavelength 310 nm, emission wavelength at 380 nm, and 430 nm fluorescence intensity ratio.Reflects the relative contribution of authigenic CDOM in water samples. [44]
Publisher’s Note: MDPI stays neutral with regard to jurisdictional claims in published maps and institutional affiliations.

