Article

Influence of Carbon Agglomerate Formation on Micropollutants Removal in Combined PAC-Membrane Filtration Processes for Advanced Wastewater Treatment

by
Grit Hoffmann
1,
Karthik Rathinam
1,
Matthias Martschin
1,
Ivana Ivančev-Tumbas
2 and
Stefan Panglisch
1,3,4,5,*
1
Chair for Mechanical Process Engineering/Water Technology, University of Duisburg-Essen, 47057 Duisburg, Germany
2
Department for Chemistry, Biochemistry and Environmental Protection, Faculty of Sciences, University of Novi Sad, 21000 Novi Sad, Serbia
3
IWW Water Centre, 45476 Mülheim an der Ruhr, Germany
4
DGMT German Society for Membrane Technology e.V., 45141 Essen, Germany
5
Centre for Water and Environmental Research (ZWU), 45141 Essen, Germany
*
Author to whom correspondence should be addressed.
Water 2021, 13(24), 3578; https://doi.org/10.3390/w13243578
Submission received: 23 October 2021 / Revised: 6 December 2021 / Accepted: 10 December 2021 / Published: 14 December 2021
(This article belongs to the Special Issue Advanced Technologies for Water Reclamation and Reuse)

Abstract

:
Micropollutants (MPs) are ubiquitous in wastewater and are not effectively removed by the existing conventional treatment processes, resulting in increased environmental pollution. Nowadays, dosing of powdered activated carbon (PAC) prior to membrane filtration has emerged as an advanced wastewater treatment method for MPs removal. This study investigated the carbon agglomerate formation in the PAC stock suspension and its influence on MPs removal in PAC-capillary membrane filtration processes at both lab- and pilot-scale levels. Both lab- and pilot-scale membrane filtration results revealed that MPs removal efficiency is affected with the increase of PAC concentration in the stock suspension. For example, one of the investigated pilot tests showed a significantly reduced removal of good adsorbable MPs (from 57 to 17%) when stock suspension concentration was increased from 0.2 to 20 g/L. It is assumed that PAC agglomerates led to a slower adsorption kinetic and an inhomogeneous distribution of PAC in the membrane system. Maintaining PAC concentration in the stock suspension as low as possible (below 0.2 g/L for investigated PAC) certainly would help to avoid agglomeration problems and enhance the overall performance of the processes.

1. Introduction

The term “micropollutants” (MPs) is increasingly appearing in the scientific literature in the field of advanced wastewater treatment. This is due to their ecotoxicity and the increased stress that MPs such as pharmaceuticals, flame retardants, biocides and other industrial chemicals exerted on the aquatic environment [1], but also because they cannot be adequately eliminated by conventional treatment processes [2]. According to a report by German scientists, more than 600 different pharmaceuticals were present in measurable environmental concentrations in various water bodies worldwide by 2015 and it is anticipated that this number might have increased in the meantime [3]. Urban wastewater treatment plants (WWTPs) have turned out to be one of the primary point sources for MPs followed by hospitals and animal husbandry, and moreover, it has been found out that the concentration levels of several MPs in the aquatic ecosystems were in the range known to cause acute and chronic toxicity [3]. Existing conventional secondary treatment processes are incapable of removing some of MPs that are found already in wastewater [4], hence, downstream measures at WWTPs must be considered to control MPs further dissemination into different water bodies.
To significantly reduce or even prevent the discharge of MPs into the aquatic environment, the implementation of additional steps is required. Although advanced treatment techniques such as oxidation or reverse osmosis have proven to be viable technologies for MPs removal [5,6], there are many issues associated with these techniques such as high operating costs, the formation of undesirable by-products, and harmful concentrates that need to be discharged. Besides, adsorption on powdered or granular activated carbon (PAC or GAC) has emerged as a promising and economic process, that is basically suitable for all municipal wastewaters. Although an additional removal process is needed in case of PAC dosage, the usage of PAC has some important advantages compared to GAC filtration. A first advantage is the variability of the carbon dose. It can be adapted to seasonal changings of MPs concentration levels, reduced to low or even zero carbon dose if no adsorption step is needed or increased to very high carbon doses e.g., in case of sudden appearance of high concentrations of known or unknown MPs [7]. A second important advantage is the small space requirement of the PAC dosing unit, which can easily be implemented in existing membrane plants [8].
Pressure-driven membrane processes are an internationally recognized essential element of sustainable water management due to intrinsic advantages compared to conventional processes and due to their versatility e.g., for water treatment, purification and reuse. Ultrafiltration (UF) and microfiltration (MF) are increasingly used in the treatment of municipal and industrial wastewater because of its ability to produce water of constant quality, virtually independent of the feed water quality [9]. In general, UF and MF can be used to remove algae, bacteria and viruses (only UF), among other particulate matters, very efficiently [10]. In order to remove MPs in addition to the aforementioned water compounds, the MF/UF can be combined with PAC dosage to form the so-called hybrid PAC/UF (or PAC/MF) process. In this process, organic compounds are normally not retained by the membrane itself but are adsorbed by PAC, which in turn is retained by the membrane. In full-scale PAC/UF (or PAC/MF) applications, PAC is usually dosed continuously at a certain concentration and the spent PAC is removed at the end of a filtration cycle. The residence time of PAC in the system is dictated by the frequency of membrane backwashing that can range from 15 to 90 min [11]. The first PAC/UF applications were installed on a large scale in France as early as in 1990s. This process is referred as CRISTAL® process (Combination of Reactors, including membrane Separation Treatment and Adsorption in Liquid) in the literature, in which the system is operated with hollow fiber membranes in cross-flow-mode [12]. Today, however, most large-scale membrane systems are operated in dead-end-mode due to the lower energy demand [13]. When using PAC/UF (or PAC/MF) in advanced wastewater treatment, inline coagulation is also often used to reduce organic fouling of the membranes [14]. According to the flow direction of the feed water in the capillaries, one can distinguish between OUT/IN processes and IN/OUT processes with a separation layer on the outer or inner surface of the hollow fibers, respectively. OUT/IN mode means the feed water flows from outside to inside of the fibers. IN/OUT mode means that the separation layer is the inner surface of the fibers, and the feed water flows from inside to outside.
A major advantage of the hybrid PAC/UF (or PAC/MF) process is that very small carbon particles even in the sub micrometer range with very fast adsorption kinetics can be applied [15]. However, the usage of such small PAC particles intensifies the interparticle interactions, which can lead to agglomeration of the particles already in the concentrated PAC basic suspension used for dosage (hereinafter referred to as stock suspension) [16,17]. Such agglomeration in turn may have negative effects on the removal of the MPs [18]. In the present study, the effect of PAC concentration in the stock suspension on the formation of agglomerates was investigated. Furthermore, the influence of these agglomerates on the adsorption performance of the activated carbon in PAC/UF and PAC/MF processes was examined for the first time in both lab and pilot scales and for both IN/OUT and OUT/IN modes.

2. Materials and Methods

2.1. Chemicals

For laboratory investigations, calcium chloride dihydrate (CaCl2·2H2O), sodium chloride (NaCl), sodium bicarbonate (NaHCO3), magnesium sulphate heptahydrate (MgSO4·7H2O), sodium pyrophosphate and Tween® 80 were purchased from VWR International (Darmstadt, Germany). Diclofenac sodium salt (purity ≥ 98%) and acesulfame potassium salt (purity ≥ 99%) were purchased from Sigma Aldrich (Taufkirchen, Germany). Pure water was produced using a Pentair Reverse osmosis unit (RO Merlin GE Water & Process Technologies, Brookfield, WI, USA). For pilot scale investigations, the aluminum-based coagulant Gilufloc®40H was provided by Kurita Europe GmbH (Ludwigshafen, Germany).

2.2. Activated Carbons

Aquasorb PAC-MG (Carbon A) was provided by Jacobi Carbons GmbH and Pulsorb WP260 UF (Carbon B) was provided by Chemviron Carbon GmbH. The properties of Carbon A and Carbon B are listed in Table 1.

2.3. PAC Agglomeration Studies

To perform the PAC agglomeration studies and to investigate the influence of different factors on agglomerate formation, suspensions with Carbon A were prepared in reverse osmosis (RO) quality water in different concentrations (0.01 g/L up to 4 g/L). In addition to the simple dilution studies, further experiments were performed in duplicates at room temperature (25 °C) by changing the physicochemical characteristics (pH, ionic strength, dispersants addition, etc.) of a PAC stock suspension (5 g/L) to test the strength of the PAC agglomerates and to find out favorable conditions to avoid the agglomerate formation. To investigate the effect of solution pH on agglomeration, the pH of the PAC stock suspension was pre-adjusted to pH 3, 6.5, 9 and 12 using 0.05 M NaOH and 0.05 M HCl solutions. Various amounts of NaCl were added to the PAC stock suspension (conductivity range from 300 to 10,000 μS/cm) to investigate the influence of ionic strength on the agglomeration. In addition, experiments with inorganic dispersant, sodium pyrophosphate, were carried out under two different dosage conditions (0.5 g/L and 2 g/L). Furthermore, experiments with 5 mL/L of organic dispersant (Tween 80) were also performed. After each of the above-mentioned conditions were set, 100 µL sample was withdrawn from the respective PAC suspension using an external pipette, added between a glass slide and cover slip, and imaged using a DNT DigiMicro Mobile device.

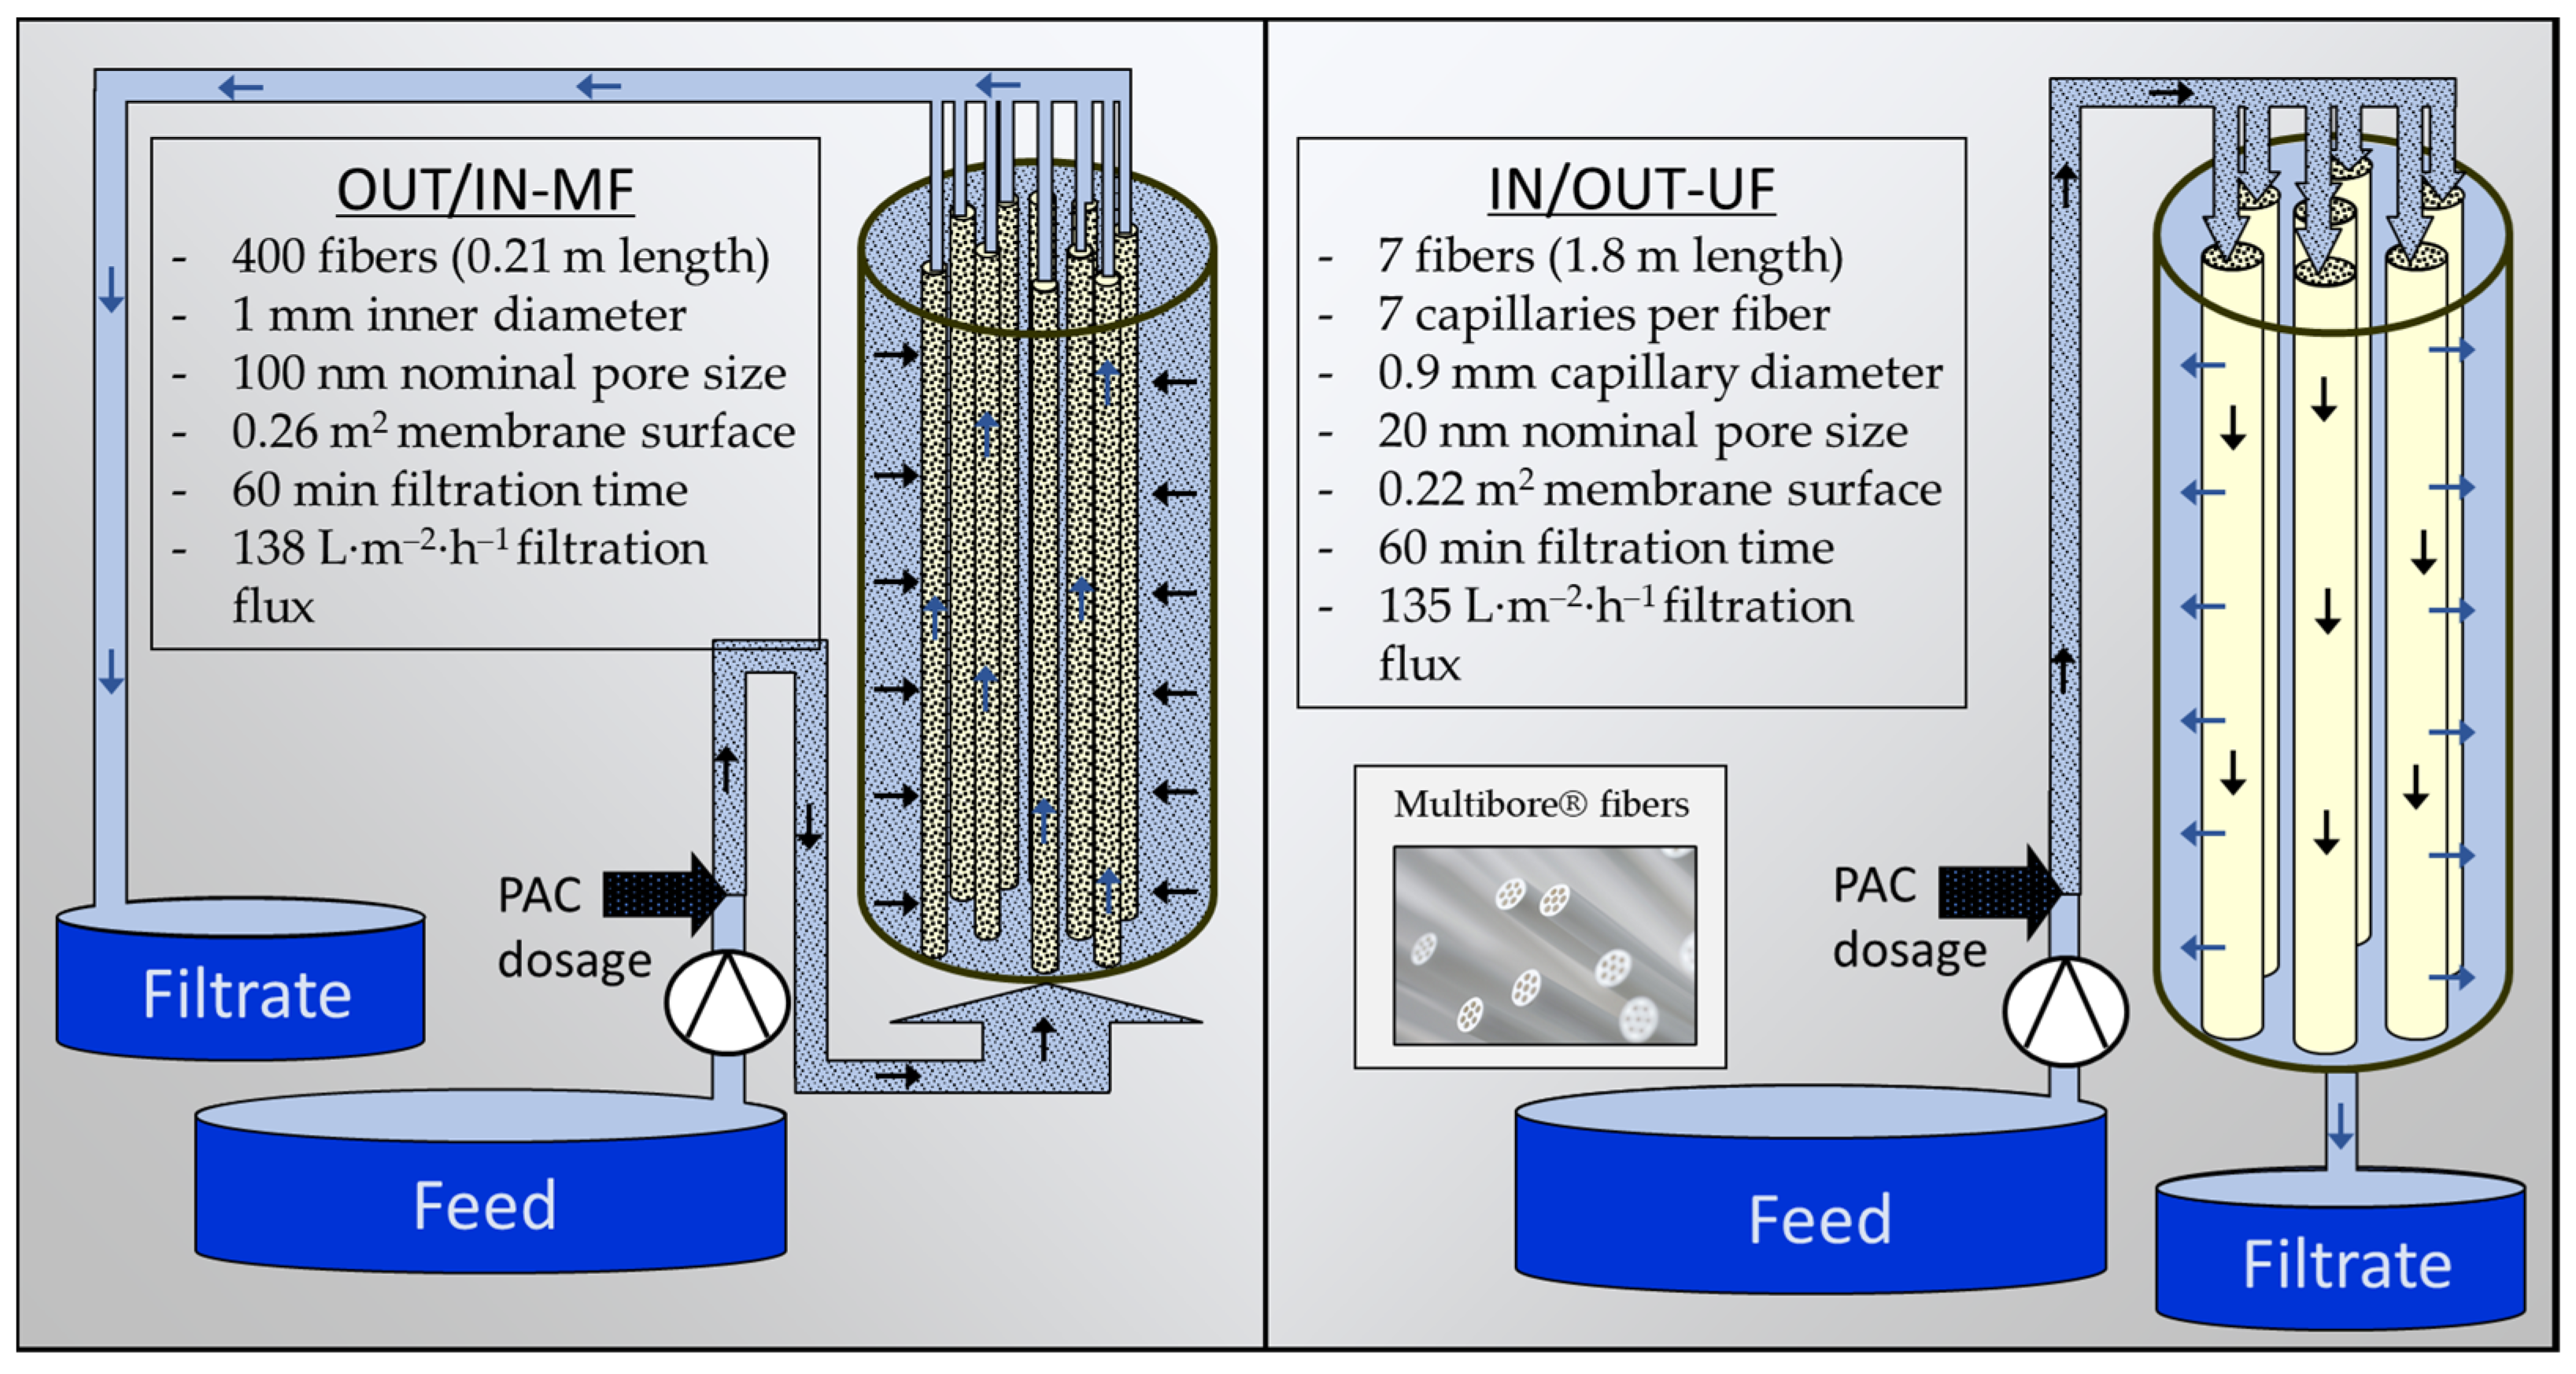
2.4. Lab-Scale Investigations for IN/OUT and OUT/IN Membrane Filtration

To investigate the influence of PAC agglomeration on the adsorption process, two different membrane units were operated at laboratory scale. A lab-scale plant provided by PALL® (New York, NY, USA) with a PVDF (polyvinylidenefluoride) Microza® (Tokyo, Japan) MF-module was used for OUT/IN investigations. It was located at the University of Duisburg (Duisburg, Germany). Another unit, located at the University of Novi Sad (Novi Sad, Serbia), with a PESU (polyethersulfone) Multibore® UF module (provided by inge GmbH, Greifenberg, Germany) was used for IN/OUT lab-scale investigations. Important module characteristics and some experimental conditions are summarized in Figure 1. The two process designs are also shown schematically. The PAC (Carbon A) was dosed directly into the feed pipe prior to the modules (hydraulic retention time <30 s). A backwash was performed intensively for some minutes between each experiment to sufficiently clean the membrane systems before the subsequent run.
For the lab-scale experiments at University of Duisburg, synthetic model water (SMW) containing 0.5 mmoL/L NaHCO3, 0.3 mmoL/L CaCl2, 0.2 mmoL/L MgSO4 and 5 mg/L diclofenac sodium salt dissolved in RO water was used as feed. For the second set of experiments, instead of diclofenac, 5 mg/L acesulfame potassium salt was used as the model substance. These two organic model substances were selected since they are quickly and easily detected spectrophotometrically and are highly relevant for wastewater treatment. Diclofenac (anti-inflammatory) represents a well adsorbable substance, whereas acesulfame (sweetener) can be used for investigations with a rather poorly adsorbable substance. Since no RO plant was available during the experiments at the University of Novi Sad (Novi Sad, Serbia), a commercial bottled water with a comparably low content of salts and organic background was used. It was also spiked with 5 mg/L diclofenac sodium salt and used as a feed. Filtrate was in all tests collected in time intervals of 1 min and concentrations of diclofenac and acesulfame were measured by UV spectroscopy (at a wavelength of 276 nm and 241 nm, respectively). Relative filtrate concentration was calculated as follows:
C C 0 = C F C S M W
where C F and C S M W are the diclofenac/acesulfame concentrations in the filtrate and the SMW (feed), respectively. In the first set of experiments using diclofenac as the model substance, four PAC stock suspensions (Carbon A) containing 0.2, 0.5, 0.9 and 1.8 g PAC/L were used for both systems to investigate the influence of PAC agglomeration on the process. The complete amount of PAC was added in only a single pulse during the first minute of each filtration cycle, resulting in a PAC layer of 0.7 g/m² (PAC amount per membrane surface). Based on the full filtration cycle this corresponds to a carbon dose of 5 mg/L. In an additional set of experiments using acesulfame as the model substance (tested only for OUT/IN), the carbon dose has been increased (5, 20, 40 and 80 mg/L) to investigate the influence of PAC agglomeration in more detail for two selected PAC stock suspension concentrations (0.2 and 1.8 g/L). Due to the significantly higher PAC doses, the poorly adsorbable model substance acesulfame was used here to be able to complete the tests again in a test period of 60 min filtration time. Due to the large quantities of PAC stock suspension that had to be dosed here (especially for the low concentrated suspension), the carbon was added before the filtration of the SMW.

2.5. Pilot-Scale Test Site

The pilot tests on a technical scale were carried out at a technical wastewater treatment plant (tWWTP), which treats real municipal wastewater (capacity of 1000 population equivalents). The tWWTP can be used for research purposes, as its effluent is discharged to the neighboring large scale WWTP “Emschermündung”, Dinslaken, Germany (approx. 1,000,000 population equivalents, operated by the Emschergenossenschaft). The pre-treatment of the tWWTP is realized by a screen and a pre-sedimentation basin (14 m³). The wastewater is then fed to two identical aerated biological lines, each divided into 56 m³ denitrification volume and 85 m³ nitrification volume, followed by a 55 m³ circular sedimentation tank. For the pilot experiments, the effluents from both lines were temporarily stored in a collection tank that supplied the feed water to the pilot plants. During the test period, the tWWTP had an influent volume flow of 2.3 L/s, a total suspended solid content of 3 g/L in the biological stage and a sludge age of 10–13 days. In the two years prior to this study (August 2015 until September 2017) the performance of the tWWTP was monitored in terms of dissolved organics and some selected MPs (results provided by Emschergenossenschaft). Figure 2 shows wastewater characteristics in terms of DOC (dissolved organic carbon), UV (254) (ultraviolet light absorbance at 254 nm) and COD (chemical oxygen demand). The COD in the inlet to the plant varied greatly and ranged between 114 and 618 mg/L (median= 396 mg/L). Removal of COD was, in most of the time, high and reached values up to 91%. Median of influent DOC and UV (254) was 40 mg/L and 36 m−1, respectively. Since the removal of total dissolved organic matter was significantly higher than that of UV active matter, the SUVA (specific ultraviolet absorbance) increased from 0.9 to 1.9 L·mg−1·m−1 over the entire system.
Concentrations of the selected MPs are shown in Figure 3. The data shows that the measured three X-ray contrast media (amidotrizoate, iopamidol and iopromide), the complexing agent benzotriazole and the sweetener acesulfame are subject to strong fluctuations in the influent and, accordingly, also in the effluent of the wastewater treatment plant. The measured pharmaceuticals (diclofenac, sulfamethoxazole, bezafibrate, carbamazepine and metoprolol), on the other hand, show smaller deviations, since these are presumably always administered to patients in the catchment area of the wastewater treatment plant in the same quantity and thus enter the wastewater with only minor fluctuations. With the exception of iopromide all substances are removed by less than 50% (median values), which shows their rather poor biodegradability in conventional WWTPs and highlights the need for advanced wastewater treatment.

2.6. Pilot-Scale Investigations for IN/OUT and OUT/IN Membrane Filtration

The IN/OUT pilot plant, provided by the company inge GmbH (Greifenberg, Germany), was equipped with a full-size dizzer® XL module with a membrane surface area of 80 m2. The module contained Multibore® hollow (Greifenberg, Germany) fiber membranes (material: polyethersulfone, PES) with a nominal pore size of 0.02 µm and an inner diameter of the capillaries of 0.9 mm. The system was operated at a flux of 40 L∙m−2∙h−1 and a filtration time of 30 min. A mechanical cleaning using filtrate was carried out at the end of a filtration cycle at a flux of 230 L∙m−2∙h−1. The water was first flushed out of the module downwards (35 s) and then upwards (20 s). The OUT/IN pilot plant, provided by Koch Membrane Systems GmbH (Wilmington, MA, USA), was equipped with a PURON® MP module with a membrane surface area of 51 m2. The module is based on UF hollow fiber membranes made of PVDF (polyvinylidene difluoride) with an inner diameter of 1 mm and a nominal pore size of 0.03 μm. The individual fibers are sealed on one side and fixed in the module head and hang down freely inside a pressure pipe. Cleaning of the membranes using an air purge from below is possible with this arrangement as there is a uniform flow of air across all the fibers. Due to the use of a customized transparent module, the distribution of PAC onto the membrane surface could be monitored for the OUT/IN process at any time. The coagulant Gilufloc® (Ludwigshafen, Germany) 40 H was dosed at a concentration of 4 mg Al/L by a peristaltic pump. PAC and coagulant were added inline (with a few seconds distance) directly in front of the feed pumps to ensure a high energy input and thus a high shear rate for mixing. The residence time between feed pump and membrane module was approx. 30 s for both plants.
The PAC used in both pilot plants was Carbon B. The PAC stock suspensions were freshly prepared before each experiment using feed water (secondary effluent) and dosed by means of a peristaltic pump. Single pulse PAC dosing was used in all experiments, i.e., the required amount of PAC was completely added in the first 3 to 4 min of a cycle. In a later large-scale implementation, the backwash water of the membrane process and thus, also, the dosed PAC will be returned to the activated sludge process of the WWTP. Therefore, the carbon is removed from the system along with the excess sludge and finally incinerated.
To evaluate the efficiency of the adsorption process, the removal of selected MPs was determined in both pilot-tests. Samples were taken by collecting the filtrate for the total filtration cycle of 30 min. The average removal of each MPs was calculated as follows:
Removal   in % = ( 1     C F C P P F ) · 100
where C F and C P P F are the concentration of the respective MPs in the collected filtrate and the pilot plant feed, respectively. Influent water samples were taken prior to testing, and when necessary, up to three samples were taken in one day, as some of the MPs tested showed large diurnal variations. For clarity, the MPs were divided into three groups. This classification was based on results of previous performed batch tests. The batch tests were used to select the best activated carbon for the pilot-scale tests. Fifteen activated carbons were tested and afterwards the MPs could be classified as low adsorbable substances with less than 45% elimination (amidotrizoate, iopamidol and iopromide), good adsorbable substances with elimination between 45 and 85% (diclofenac, sulfamethoxazole, clarithromycin and naproxen) and very good adsorbable substances showing more than 85% elimination (bezafibrate, benzotriazole, carbamazepine and metoprolol). Acesulfame was not part of the substances investigated in the pilot studies, since the previous batch tests showed that this poorly adsorbable substance is almost not removed from real wastewater.
The pilot study was part of the project “Optimized use of powdered activated carbon and ultrafiltration as 4th purification stage (UF/PAC 4.0)” [19]. The aim of this project was to optimize the treatment performance of WWTPs with regard to the removal of MPs and other relevant parameters using the hybrid process combination PAC/UF (funded by the Ministry of the Environment, Agriculture, Nature Conservation and Consumer Protection of the State of North Rhine-Westphalia, Düsseldorf, Germany).

2.7. Micropollutant Analysis

MPs concentrations were analyzed by liquid chromatography with tandem mass spectrophotometry (LC-MS/MS) by an external laboratory (IUTA-Institute of Energy and Environmental Technology, Duisburg, Germany). According to the method developed for wastewater analysis, an internal standard was added to the samples, the samples were filtered through a syringe filter, and measured as direct measurement. Chromatographic separation was performed on a 50 mm × 2.1 mm Restek Raptor ARC-18, 2.7 µm HPLC column with a 5 mm × 2.1 mm Restek Raptor ARC-18, 2.7 µm Guard column (Restek GmbH, Bad Homburg vor der Höhe, Germany) using an Agilent 1200 HPLC system (Agilent Technologies Deutschland GmbH, Waldbronn, Germany). H2O (+0.1% HCOOH) and acetonitrile (+0.1% HCOOH) were used as mobile phases for gradient elution. The measurement was carried out on a QTRAP 6500+ (Sciex Germany, Darmstadt, Germany). Ionization was carried out by means of electrospray in positive measuring mode. An overview of all investigated MPs and the corresponding analysis applied is summarized in Table 2.

3. Results and Discussion

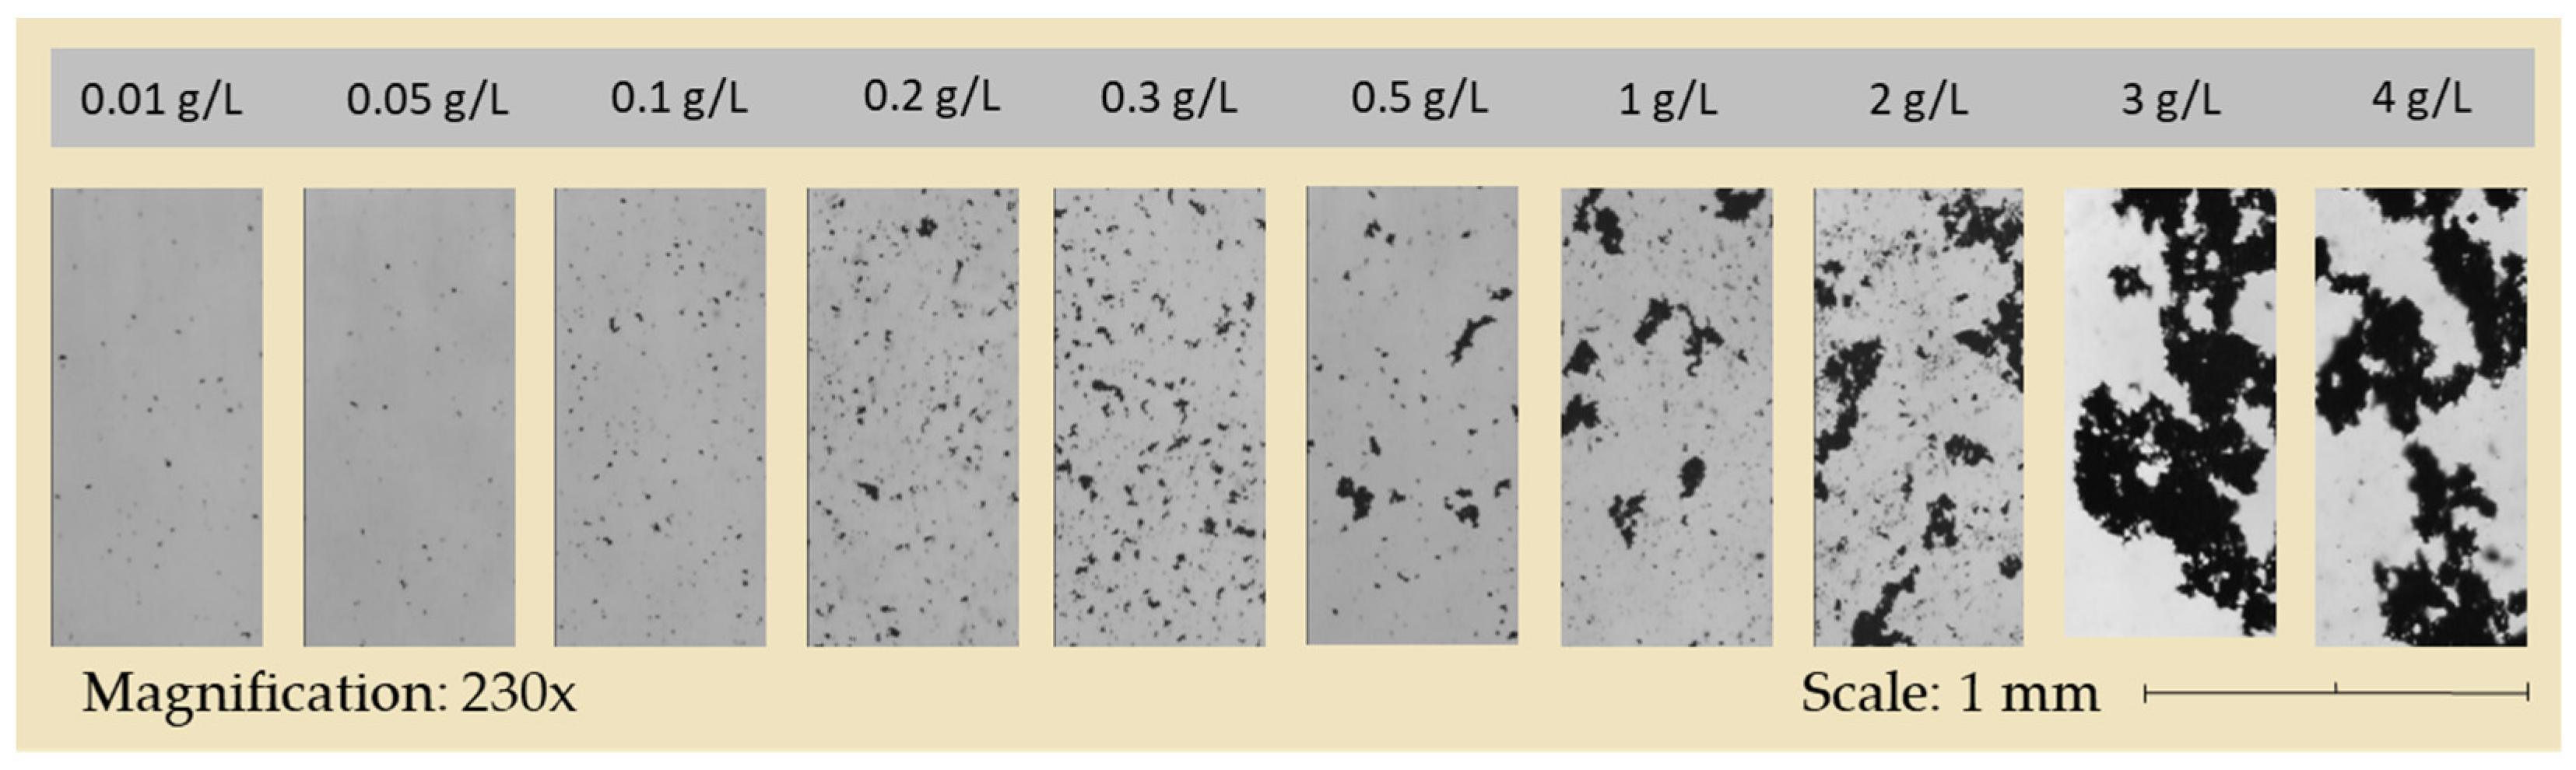
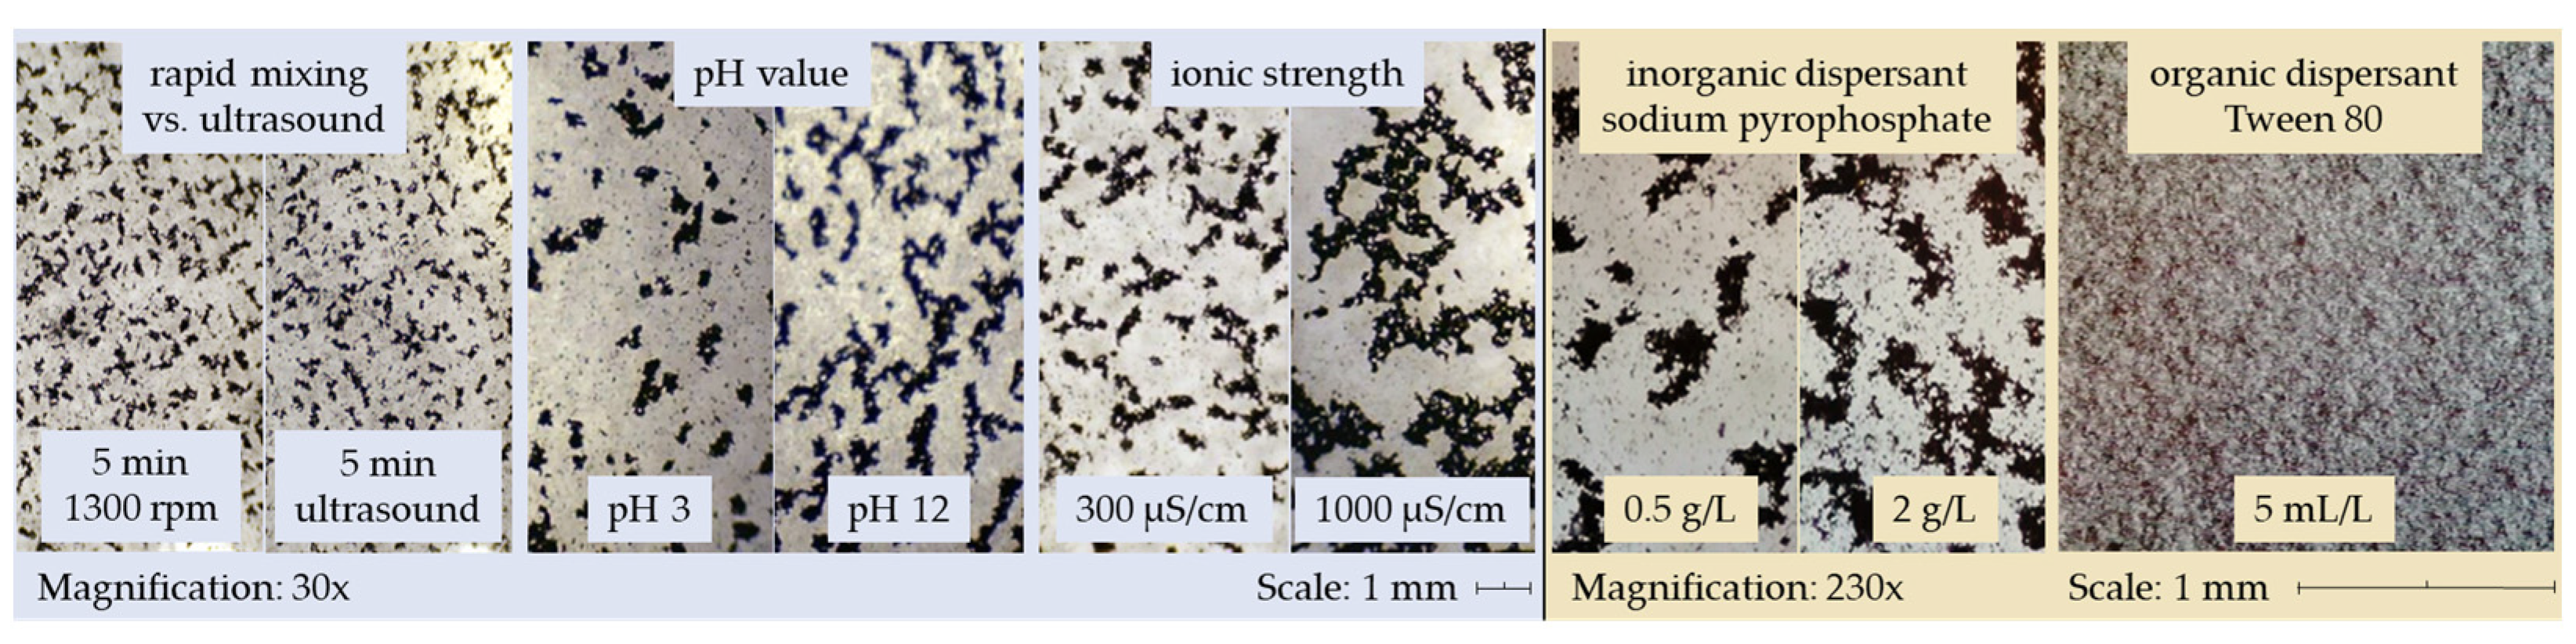
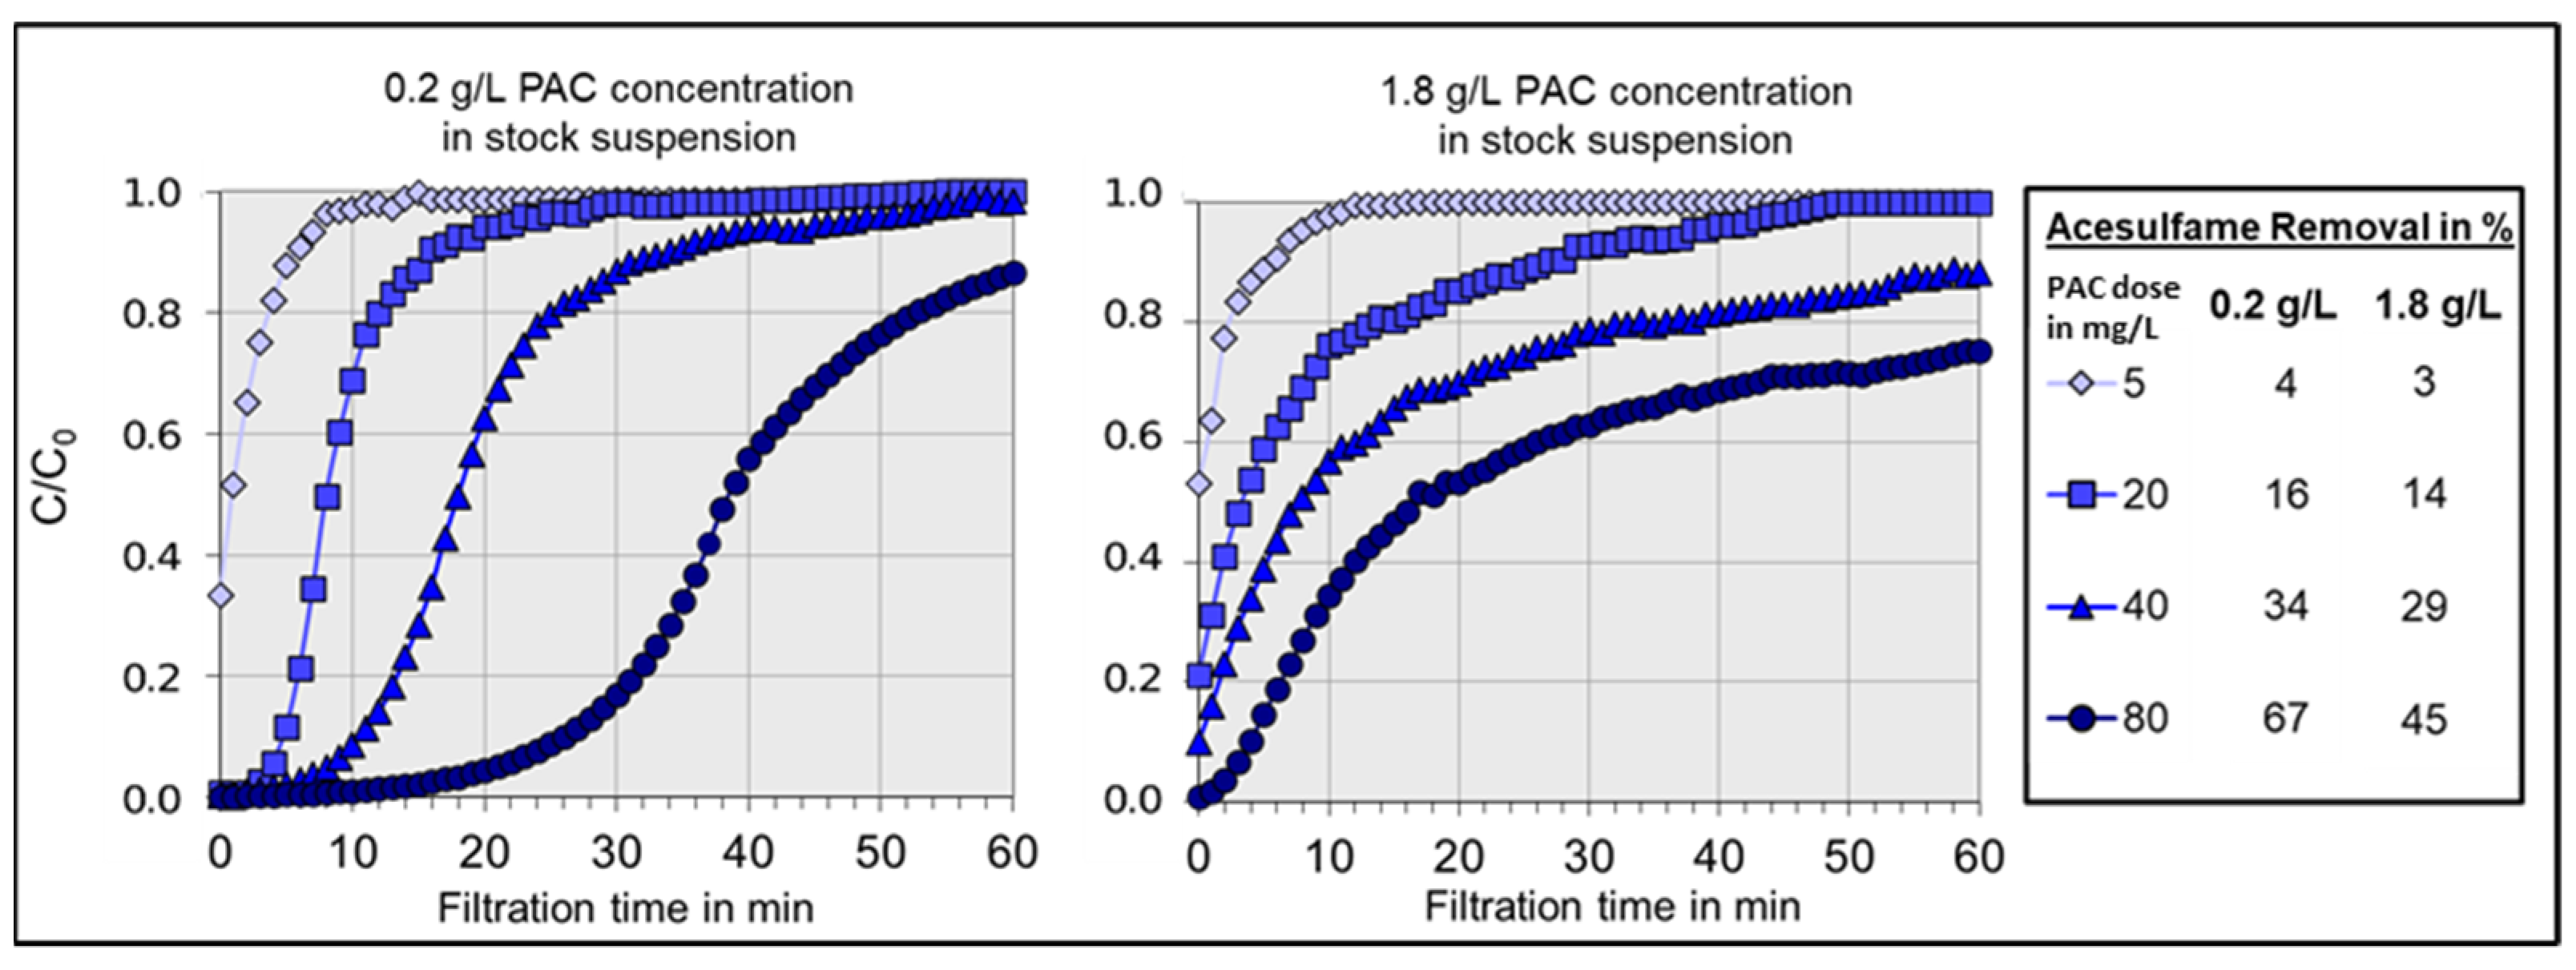
3.1. PAC Agglomerates Formation

In practice, PAC stock suspensions are usually prepared in concentrations of several g/L, depending on the size of the preparation tank or other local conditions. Information on carbon suspension preparation, the concentrations used, and the dosing procedures are very limited in the available literature. It can be seen from Figure 4 that increasing PAC concentration in the suspension results in the formation of stable PAC agglomerates. The resulting size of the largest formed agglomerates in a stock solution of 4 g/L can be estimated to be about 1000 µm, which means that the size of the PAC particles increases by a factor of more than 100. In practice, even significantly higher concentrations are generally used, so even greater agglomerates are to be expected there. However, it is also obvious that smaller agglomerates were already formed at concentrations >0.05 g/L.
The influence of several factors on the formation of PAC agglomerates in a 5 g/L stock suspension was investigated and the results are shown in Figure 5. First, the input of energy in the form of mixing and ultrasonic application for de-agglomeration was studied. In both cases, a positive effect could be observed during the energy input (dark-black coloration of the suspension), but the agglomerates were immediately regressed afterwards. A pH study revealed that the agglomeration tendency increases with increasing pH from 3 to 12. A slight difference in the size of the agglomerates was observed at pH 3, compared to pH 12 as well as a slight reduction in the size of the agglomerates due to lowering the ionic strength. While the inorganic dispersant (sodium pyrophosphate) revealed no effect on the PAC agglomeration, a noteworthy influence on the agglomeration was observed when the non-ionic organic dispersant (Tween 80, 5 mL/L) was added to the suspension. This de-agglomeration property is also used in industry in the stabilization of nanoparticles, when allowing the coexistence of the particles and the surfactant so that the surface of the nanoparticles is covered with the surfactant, and the nanoparticles are stabilized in the system [20]. At the same time, diclofenac (5 mg/L) adsorption onto PAC (30 mg/L) was carried out in the presence of Tween 80 (5 mL/L) to see whether the added organic dispersant has any influence on PAC’s adsorption capacity. Consequently, it has been found out that no removal of diclofenac was seen due to the added dispersant. This confirms either the change in PAC surface properties due to the added Tween 80 or the loading of the adsorption sites with this organic compound, which is thus not a practically applicable solution for the agglomerate formation problem.

3.2. Lab-Scale Investigations of the Hybrid Processes

The influence of PAC agglomeration on the adsorption process of diclofenac in a laboratory scale membrane process has been investigated for both, IN/OUT and OUT/IN process, under similar operating conditions and with different PAC stock suspension concentrations (0.2–1.8 g/L). The relative (diclofenac) concentration in filtrate was determined for a filtration cycle of 60 min according to Formula (1). Results are shown in Figure 6.
It can be seen from the results that the diclofenac removal is significantly affected with the increase in PAC concentration in the stock suspension. For instance, in an OUT/IN process, the average diclofenac removal for the most highly concentrated PAC stock suspension (1.8 g/L) was around 22% lower than for the least concentrated stock suspension (0.2 g/L). In case of IN/OUT there was a difference of 16% for the named case. This confirms that agglomerates negatively affect removal of diclofenac in both processes. One possible reason could be an inhomogeneous coverage of the membrane surface with PAC due to the different hydrodynamic behavior of the larger PAC agglomerates compared to smaller individual particles. For the OUT/IN system this is illustrated by example photos for PAC stock suspensions applied in different concentrations (see Figure 7). Another reason may be a decreasing adsorption kinetics with increasing agglomerate size. This was already noted by [18] with the finding that a strong agglomeration phenomenon of PAC lowered the adsorptive removal of 2-methylisoborneol by PAC.
To verify the latter hypothesis, removal experiments were performed in the OUT/IN system with an increasing amount of carbon by adding 0.7, 2.8, 5.6 and 11.2 g PAC/m2 (corresponding to a carbon dose of 5, 20, 40 and 80 mg/L) to induce a more and more complete coverage of the membrane surface. A complete blackening of the membrane surface already occurred at a dosage of 5.6 g PAC/m2. Due to the high carbon dose, the model substance has been changed for this experiment to the poorly adsorbable acesulfame. Thus, almost complete breakthrough curves could be recorded in one filtration cycle here as well. Results (see Figure 8) indicate that a significant difference in the average removal was also found in these experiments when comparing the low and the high concentrated stock suspensions (0.2 g/L and 1.8 g/L). In difference to Figure 6, the breakthrough curves start at C/C0 = 0 as the carbon coverage took place before filtrating the SMW. With a filtration cycle of 60 min and complete PAC coverage of the membrane (dose of 80 mg/L), the average acesulfame removal was still reduced from 67 to 45% by increasing the concentration in the PAC suspension from 0.2 to 1.8 g/L. The breakthrough behavior, also, indicates adsorption kinetics as a limiting factor since in the case of the 1.8 g/L stock suspension a significantly faster breakthrough of acesulfame could be observed. These results clearly support one of the hypotheses presented and indicate that the adsorption kinetics is at least one reason why the removal is lowered in the case of highly concentrated stock suspensions.
When comparing OUT/IN and IN/OUT modes (Figure 6), it becomes apparent that OUT/IN generally showed a better utilization of the adsorption capacity. This filtration mode achieved the best result of all tests with 50% average removal of diclofenac for the lowest PAC stock suspension concentration of 0.2 g/L. The diclofenac loading of the PAC used in this experiment (calculated after the full breakthrough of the substance) agrees well with the isothermal equilibrium loading determined for this carbon and the same model water (results not shown here). In contrast, in the IN/OUT mode, the PAC capacity cannot be fully utilized, even with very low PAC stock suspension concentrations. The maximum average diclofenac removal achieved for this process was only 38%. Further dilutions may be necessary for the IN/OUT mode to de-agglomerate the carbon even more and to use it more effectively. A possible explanation for this lower performance could be the higher flow velocity in the capillaries in the IN/OUT mode. Investigations by Panglisch [21] have shown that, depending on the size of the particles transported in a capillary, a more or less inhomogeneous coverage can result. Particles larger than a limiting diameter are even transported to the dead end of the module. In the present case, this could have led to larger sections of the membrane surface being completely without a PAC layer and thus to significant amounts of water passing through the membrane without contact with the PAC resulting in less average removal of diclofenac. If we further consider the hydrodynamic conditions in the OUT/IN and IN/OUT another reason for the differences may be in the different module configurations. With a length of only 21 cm, the OUT/IN module was significantly shorter than the IN/OUT module, which was installed in the original length of 1.8 m. The transport mechanisms for the PAC agglomerates are therefore unlikely to have been comparable in the two systems.

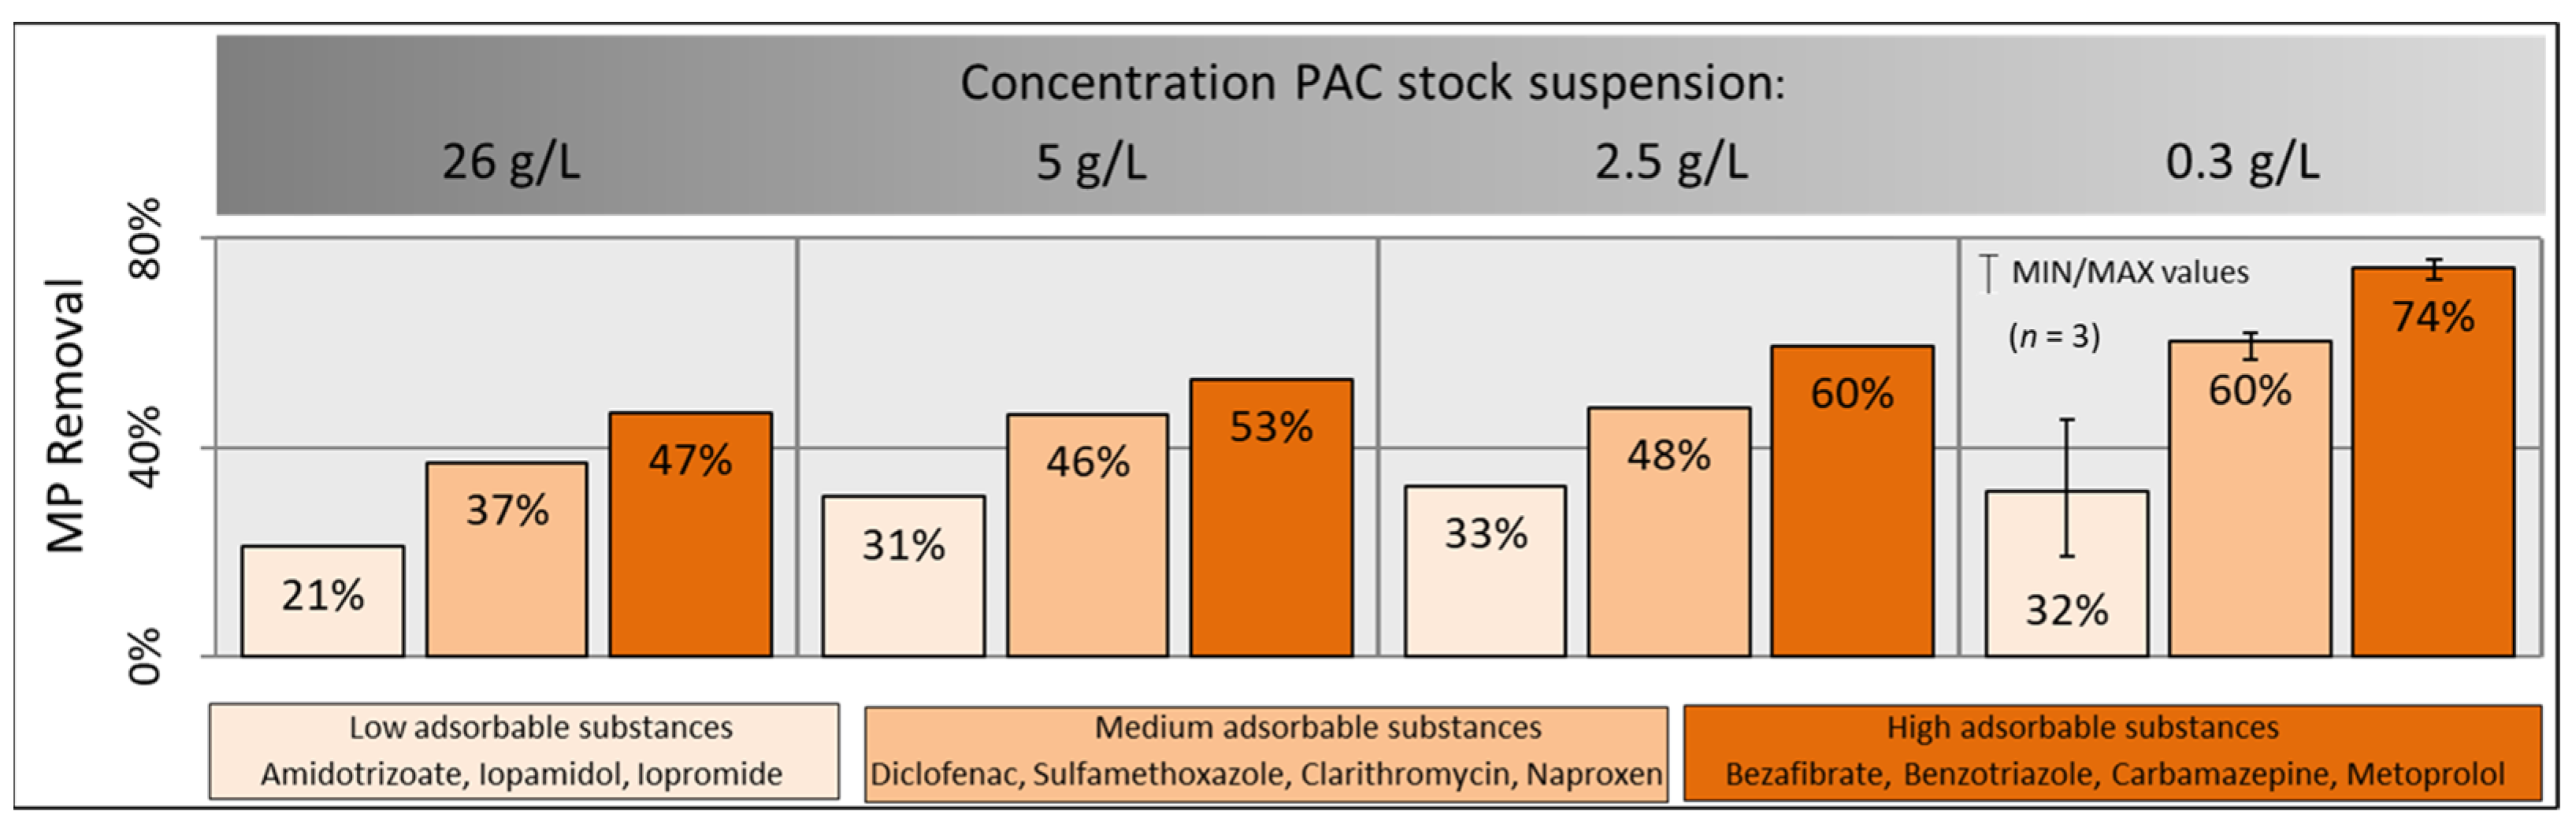
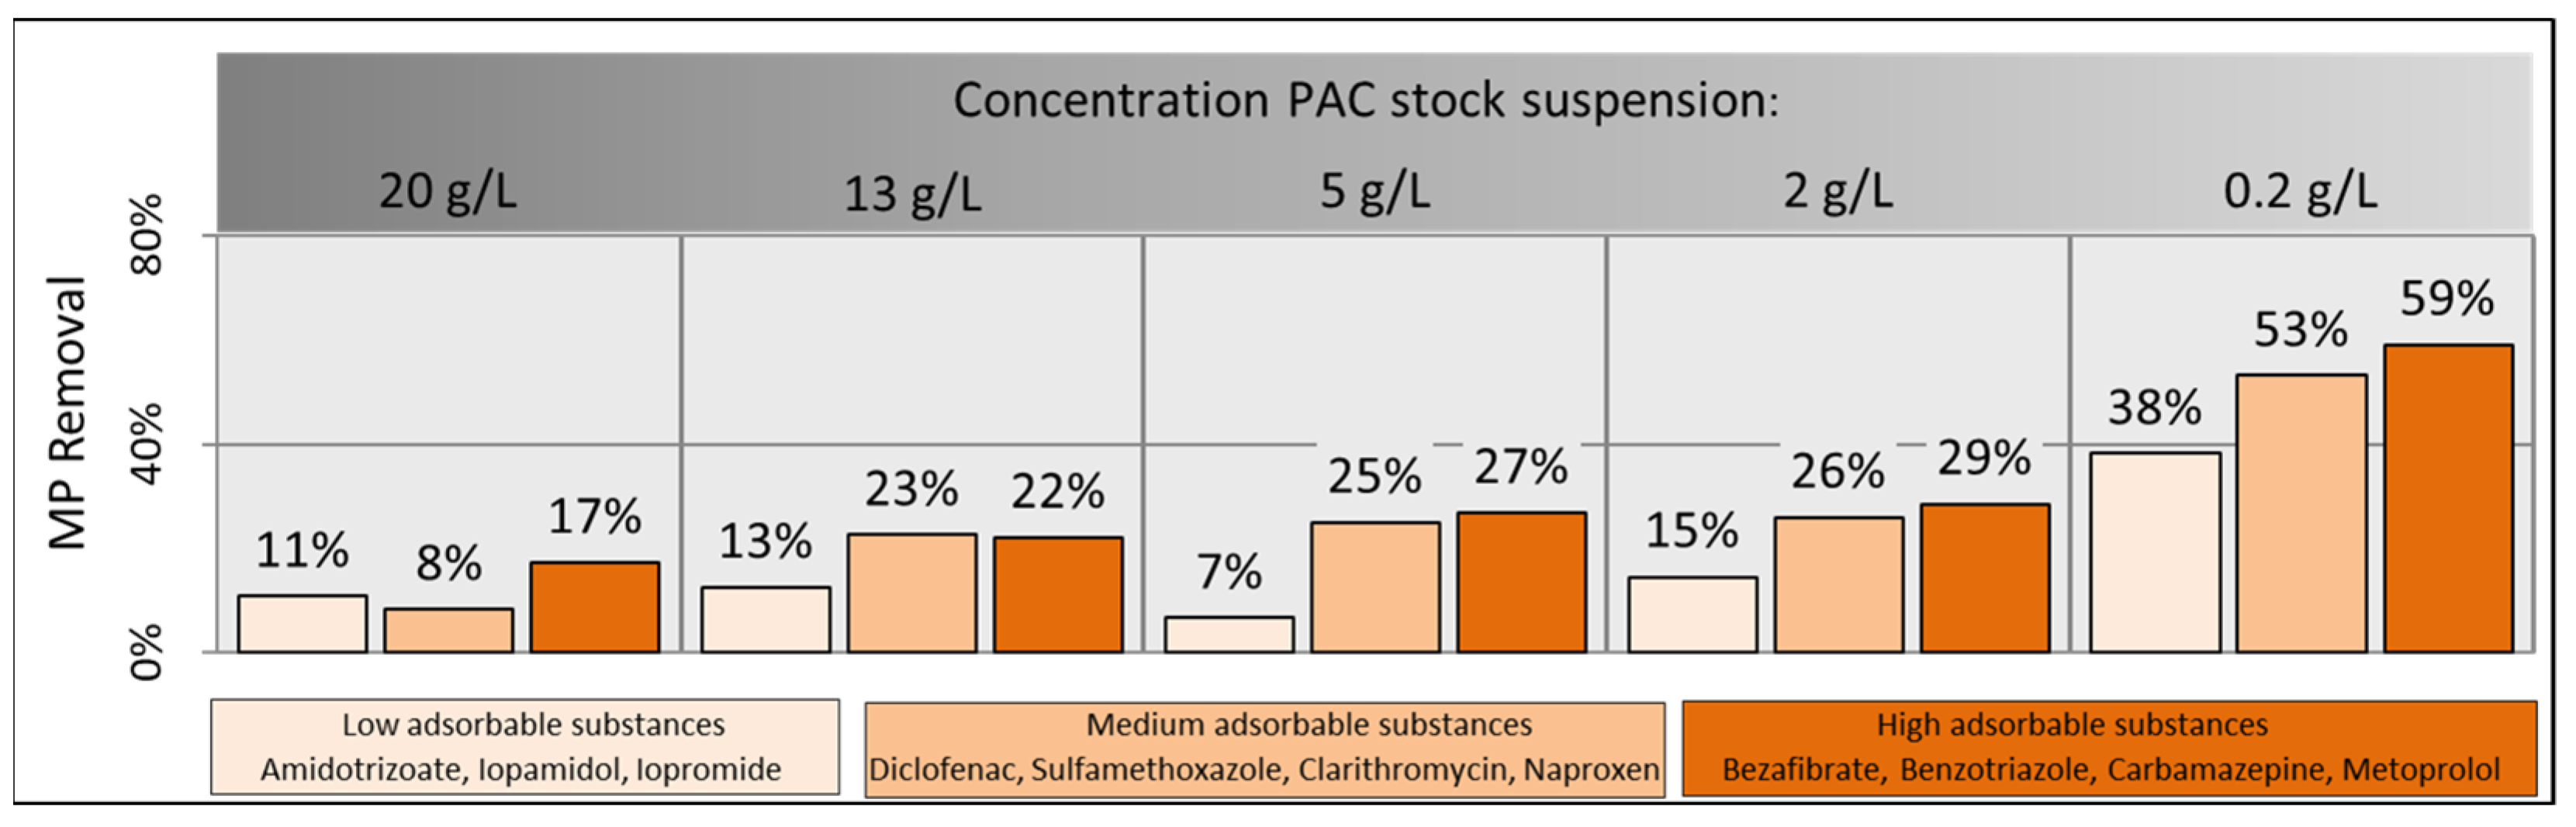
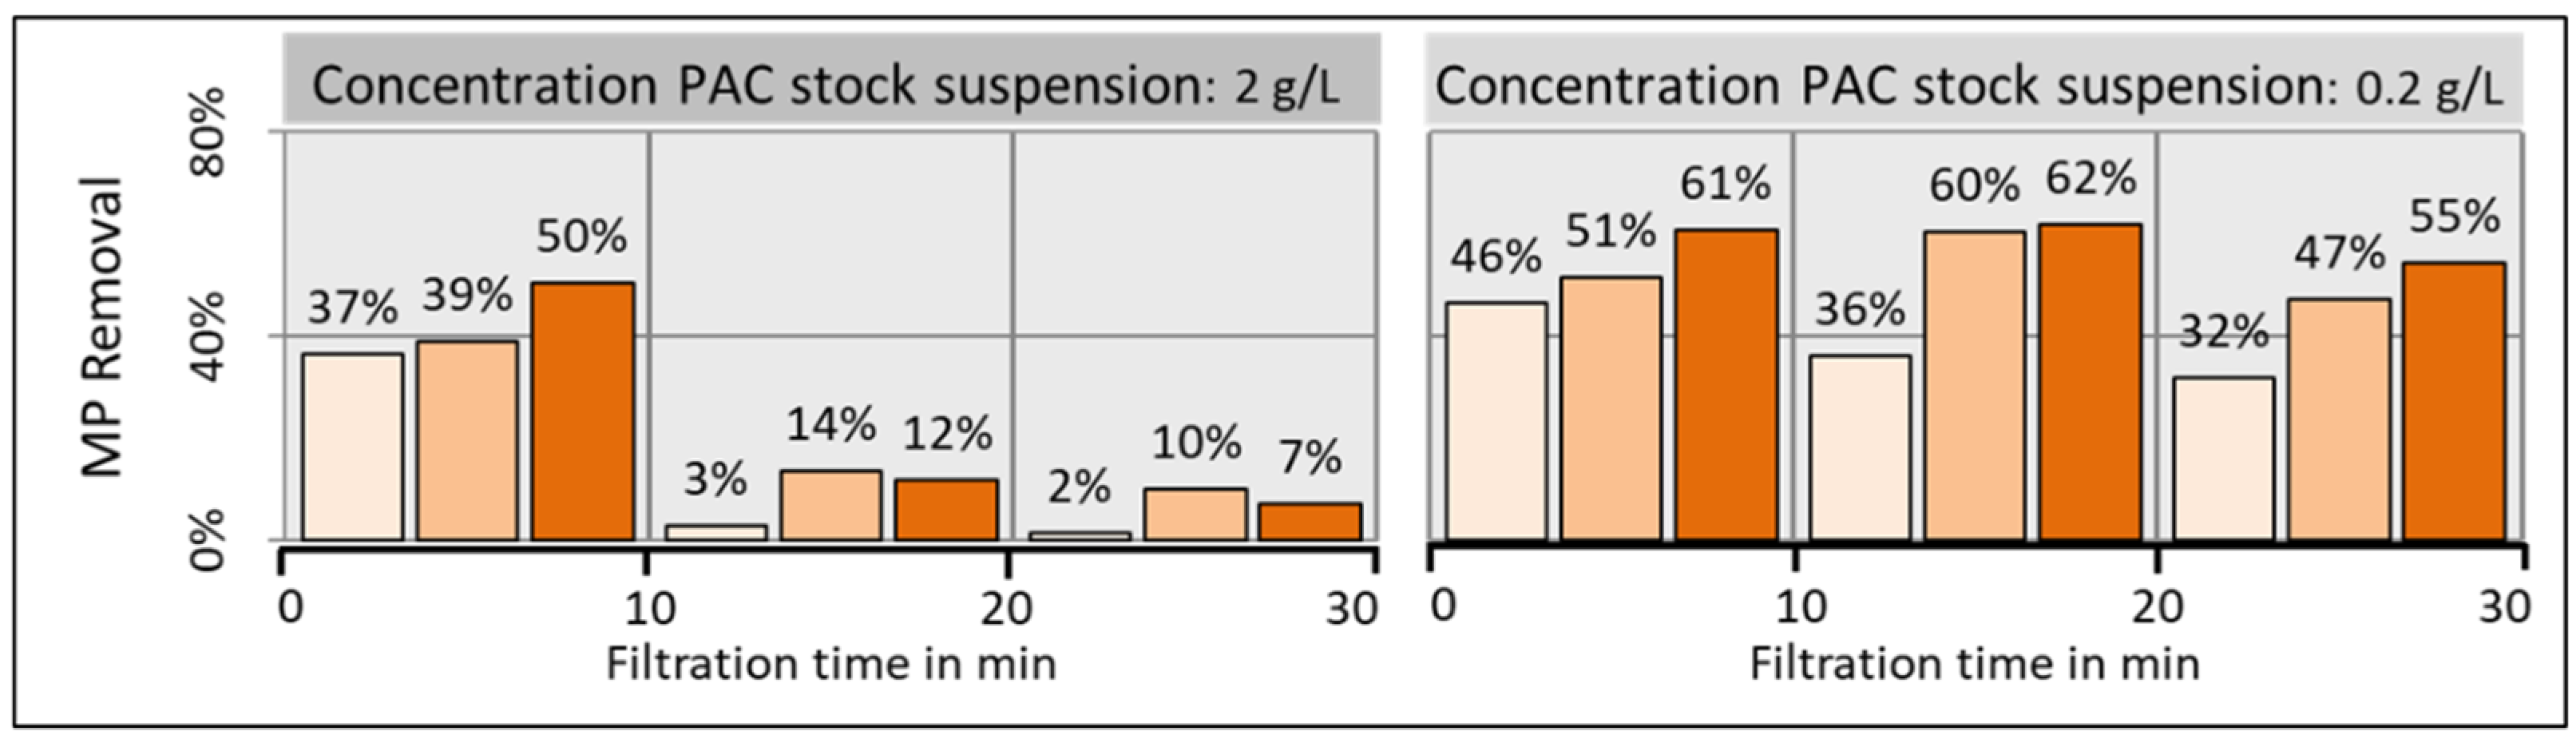
3.3. Pilot-Scale Study of the Hybrid Processes

The laboratory tests have proven that a PAC dosing with high stock suspension concentrations can have negative effects on organic substance removal. However, when investigating this process on an industrial scale with real water, other factors can additionally influence the adsorption process which may mitigate or even boost the agglomeration influence. A real wastewater contains not only MPs, but also particulate matter and a mixture of various natural organic matter that is competing with MPs for adsorption sites on the carbon. If inline coagulation is performed, this can further enhance the inhomogeneous distribution of PAC on the membrane surface due to the formation of the comparatively large flocs.
During the 2-year term of the present study (2016–2018), the effluent of the tWWTP was analyzed several times (n = 47). The median as well as the minimum and maximum values of these analyses are shown in Table 3. For example, the median for iopromide was only 1300 ng/L, but peak values of up to 19,000 ng/L were also detected. For all substances, the median concentration in the effluent, i.e., the feed of the membrane processes, was well above the limit of determination (LOD in Table 2). Furthermore, the data (arithmetic mean and standard deviation) of a five-fold measurement of a single sample are shown.
Results of pilot scale in OUT/IN mode investigations are shown in Figure 9 and confirm that the concentration of the PAC stock suspension significantly affect the MPs removal. The usage of a high concentration PAC stock suspension, such as 26 g/L, achieves a significantly lower MPs removal compared to the use of a more diluted one. Further, it has been proven by a three-fold repetition of the experiments for a PAC stock suspension concentration of 0.3 g/L that these evaluated differences are significant. For the medium and high adsorbable substances, the mean values of the three replicates were 60% and 74%, respectively, with only small deviations, i.e., good reproducibility. Only the group of low adsorbable substances (including X-ray contrast media) showed larger deviations, maybe due to large fluctuations of the influent concentration of these substances. For example, iopromide was analyzed in the pilot plant feed on only one day at concentrations of 800, 1800 and 7500 ng/L, due to diurnal variations of the substance based on strongly fluctuating use of this compound, which is then resulting in strong concentration variation of the substance in the feed.
Due to the use of a transparent module also in pilot scale, it was again possible to take a closer look at the distribution of the PAC on the membrane surface (see Figure 10). When dosing a PAC stock suspension with a high concentration (26 g/L), the carbon forms agglomerates resulting in an inhomogeneous coverage. Furthermore, it could be seen that a large portion of the carbon was transported to the upper side of the module representing the dead-end. Only small parts of the membrane hollow fibers were covered with carbon and larger agglomerates were partly not transported to the membrane surface at all but moved freely in the module space. In contrast, the distribution was completely different in the case of the low concentrated PAC stock suspension (0.3 g/L). The PAC was completely and almost uniformly distributed on the membrane surface.
The IN/OUT process showed an even clearer influence of formed PAC agglomerates on the adsorption process (see Figure 11). In this case, the tested concentrations of the PAC stock suspension ranged from 20 to 0.2 g/L. It becomes clear that an effective adsorption process only becomes apparent in the range of highly diluted PAC suspensions of only 0.2 g/L. A slight increase to 2 g/L directly halved the MPs removal. For example, the average removal of high adsorbable substances was reduced from 59% to 29%. Using a PAC stock solution of practically relevant concentration such as 20 g/L, decreased the MPs removal to a value below 20% for all tested substances.
In two further experiments with PAC stock suspension concentrations of 2 and 0.2 g/L, the sampling of the MPs was divided into three time periods: the first ten minutes, the subsequent ten minutes, and the last ten minutes of one filtration cycle. The results for this more detailed temporal investigation of the process are given in Figure 12. It is evident that in the experiment with the dosage of 2 g/L (left figure), MPs removal takes place almost exclusively in the first ten minutes, i.e., in the time when the carbon is added to the system. During the second and third filtration time slot almost no MPs removal took place, which can be explained by the fact that the carbon is not finely distributed on the membrane surface, but probably transported to the dead end of the module. A completely different result is shown in the case of the high diluted PAC suspension of 0.2 g/L (right figure). Again, the PAC was added in the first few minutes of the filtration cycle, but it can be clearly seen that a removal of MPs takes place even after the dosing phase, since the PAC was presumably evenly distributed on the membrane surface. When using the diluted stock suspension, a breakthrough behavior of the individual substances can even be seen depending on their adsorbability. As known from fixed-bed adsorption applications, the low adsorbable substances break through most rapidly, while the high adsorbable substances still show an average removal of 55% even in the last third of the cycle.
A general comparative evaluation of the MP removal is difficult for the two studied processes. On the one hand, the OUT/IN investigations were carried out in August 2017 and the IN/OUT investigations in November 2018. Even though the background matrix measured as UV (254) was comparable at the two times (16 m−1),the organic composition of the water is unknown and can influence the adsorption process. Furthermore, higher concentrations of MPs were measured in the influent water of the OUT/IN process. For example, the concentrations of the good adsorbable substances with benzotriazole = 7.5 µg/L, metoprolol = 4.2 µg/L, bezafibrate = 0.9 µg/L and carbamazepine = 0.6 µg/L were significantly higher than in the influent of the IN/OUT process with 1.9, 0.8, 0.3 and 0.4 µg/L, respectively. This may have had an effect on the adsorption process as well. Despite the slightly different feed qualities, the results obtained so far nevertheless show that the agglomerates formed in the stock suspension have a significantly stronger negative influence on the MPs removal in the IN/OUT mode. Already the increase of the concentration of the PAC stock suspension from 0.2 to 2 g/L produced a decrease of about 50% of the removal performance. Although the OUT/IN process is also influenced by the formation of agglomerates, the performance loss in removal is much less. As discussed earlier, this is most likely due to the different hydrodynamic conditions in the two different modes, which result in more or less pronounced particle transport along the membrane surface, resulting in more or less homogeneous coverage of the membrane surface. The additional coagulation which was only applied during the pilot studies may even amplify this negative effect, as the axial transport forces acting on particles close to the membrane surface becomes larger with increasing particle size [21]. Thus, the formed flocs in which, also, the PAC particles are embedded are suspected to produce the inhomogeneous coverage more quickly compared to individual PAC particles or even agglomerates. Moreover, a decrease in the adsorption kinetics is conceivable, due to the longer diffusion paths in the large flocs, as it has already been suspected in other studies [22,23].

4. Conclusions

This study confirmed that the formation of agglomerates in PAC stock suspension affects the removal of MPs in PAC-membrane filtration advanced wastewater treatment. Based on the obtained results, the following conclusions can be drawn:
  • Already comparatively low carbon concentrations in a PAC stock suspension resulted in the formation of stable agglomerates.
  • The tendency for PAC to agglomerate in the stock suspension decreased slightly with decreasing pH while ionic strength and inorganic dispersant did not affect it. The presence of Tween 80 dispersant significantly contributed to de-agglomeration. However, at the same time PAC adsorption capacity for diclofenac was lost.
  • A decrease in diclofenac removal with increasing concentration of the PAC stock suspension was observed in both the laboratory-scale IN/OUT and OUT/IN processes, which was attributed to increased agglomerate formation. This was also confirmed in pilot-scale investigations, where the removal of MPs increased significantly with the reduction of the stock suspension PAC concentration.
  • It is assumed that the different hydrodynamic conditions of the two processes are leading to a more (OUT/IN) or less (IN/OUT) homogeneous carbon coverage of the membrane surface. Appropriate hydrodynamic conditions should be set to ensure a uniform distribution of the PAC in the system, such as a single pulse carbon dosage at a reduced flux.
  • To avoid the formation and influence of agglomerates, future efforts should be made to keep the concentration of the PAC stock suspension as low as possible prior to dosing. The authors are currently in discussion with plant manufacturers in order to think about measures that can be implemented on a technical scale.

Author Contributions

Investigation, G.H. and I.I.-T.; supervision, S.P.; writing—original draft preparation, G.H., K.R. and M.M.; writing—review and editing, I.I.-T. and S.P.; visualization, G.H. and M.M.; project administration, G.H. and S.P.; funding acquisition, G.H. and S.P. All authors have read and agreed to the published version of the manuscript.

Funding

This research was funded by the Ministry of the Environment, Agriculture, Nature Conservation and Consumer Protection of the State of North Rhine-Westphalia, grant number 17-04.02.01-9a/2016.

Institutional Review Board Statement

Not applicable.

Informed Consent Statement

Not applicable.

Data Availability Statement

Not applicable.

Conflicts of Interest

The authors declare no conflict of interest. The funders had no role in the design of the study; in the collection, analyses, or interpretation of data; in the writing of the manuscript, or in the decision to publish the results.

References

  1. Hughes, S.R.; Kay, P.; Brown, L.E. Global Synthesis and Critical Evaluation of Pharmaceutical Data Sets Collected from River Systems. Environ. Sci. Technol. 2013, 47, 661–677. [Google Scholar] [CrossRef] [PubMed]
  2. Eggen, R.I.L.; Hollender, J.; Joss, A.; Schärer, M.; Stamm, C. Reducing the Discharge of Micropollutants in the Aquatic Environment: The Benefits of Upgrading Wastewater Treatment Plants. Environ. Sci. Technol. 2014, 48, 7683–7689. [Google Scholar] [CrossRef] [PubMed]
  3. Der Beek, T.A.; Weber, F.-A.; Bergmann, A.; Hickmann, S.; Ebert, I.; Hein, A.; Küster, A. Pharmaceuticals in the environment—Global occurrences and perspectives. Environ. Toxicol. Chem. 2016, 35, 823–835. [Google Scholar] [CrossRef] [PubMed]
  4. Grandclément, C.; Seyssiecq, I.; Piram, A.; Wong-Wah-Chung, P.; Vanot, G.; Tiliacos, N.; Roche, N.; Doumenq, P. From the conventional biological wastewater treatment to hybrid processes, the evaluation of organic micropollutant removal: A review. Water Res. 2017, 111, 297–317. [Google Scholar] [CrossRef] [PubMed] [Green Version]
  5. Khanzada, N.K.; Farid, M.U.; Kharraz, J.A.; Choi, J.; Tang, C.Y.; Nghiem, L.D.; Jang, A.; An, A.K. Removal of organic micropollutants using advanced membrane-based water and wastewater treatment: A review. J. Membr. Sci. 2020, 598, 117672. [Google Scholar] [CrossRef]
  6. Yin, R.; Shang, C. Removal of micropollutants in drinking water using UV-LED/chlorine advanced oxidation process followed by activated carbon adsorption. Water Res. 2020, 185, 116297. [Google Scholar] [CrossRef] [PubMed]
  7. Worch, E. Adsorption Technology in Water Treatment, 2nd ed.; De Gruyter: Berlin, Germany; Boston, MA, USA, 2021; p. 363. [Google Scholar]
  8. Abegglen, C.; Siegrist, H. Mikroverunreinigungen Aus Kommunalem Abwasser. Verfahren Zur Weitergehenden Elimination Auf Kläranlagen; Bundesamt für Umwelt BAFU: Ittigen, Switzerland, 2012. [Google Scholar]
  9. Calabrò, V.; Basile, A. 1-Fundamental membrane processes, science and engineering. In Advanced Membrane Science and Technology for Sustainable Energy and Environmental Applications; Basile, A., Nunes, S.P., Eds.; Woodhead Publishing: Sawston, UK, 2011. [Google Scholar]
  10. Doyen, W. Latest developments in ultrafiltration for large-scale drinking water applications. Desalination 1997, 113, 165–177. [Google Scholar] [CrossRef]
  11. Farahbakhsh, K.; Smith, D.W. Performance comparison and pretreatment evaluation of three water treatment membrane pilot plants treating low turbidity water. J. Environ. Eng. Sci. 2002, 1, 113–122. [Google Scholar] [CrossRef]
  12. Campos, C.; Mariñas, B.J.; Snoeyink, V.L.; Baudin, I.; Michel Laîné, J. Adsorption of trace organic compounds in CRISTAL® processes. Desalination 1998, 117, 265–271. [Google Scholar] [CrossRef]
  13. Chang, S.; Waite, T.D.; Fane, A.G. A simplified model for trace organics removal by continuous flow PAC adsorption/submerged membrane processes. J. Membr. Sci. 2005, 253, 81–87. [Google Scholar] [CrossRef]
  14. Zevenhuizen, E.; Reed, V.A.; Rahman, M.S.; Gagnon, G.A. In-line coagulation to reduce high-pressure membrane fouling in an integrated membrane system: A case study. Desalin. Water Treat. 2015, 56, 1987–1998. [Google Scholar] [CrossRef]
  15. Matsui, Y.; Murase, R.; Sanogawa, T.; Aoki, N.; Mima, S.; Inoue, T.; Matsushita, T. Rapid adsorption pretreatment with submicrometre powdered activated carbon particles before microfiltration. Water Sci. Technol. 2005, 51, 249–256. [Google Scholar] [CrossRef] [PubMed]
  16. Bonvin, F.; Jost, L.; Randin, L.; Bonvin, E.; Kohn, T. Super-fine powdered activated carbon (SPAC) for efficient removal of micropollutants from wastewater treatment plant effluent. Water Res. 2016, 90, 90–99. [Google Scholar] [CrossRef] [PubMed]
  17. Bakkaloglu, S.; Ersan, M.; Karanfil, T.; Apul, O.G. Effect of superfine pulverization of powdered activated carbon on adsorption of carbamazepine in natural source waters. Sci. Total Environ. 2021, 793, 148473. [Google Scholar] [CrossRef] [PubMed]
  18. Pan, L.; Matsui, Y.; Matsushita, T.; Shirasaki, N. Superiority of wet-milled over dry-milled superfine powdered activated carbon for adsorptive 2-methylisoborneol removal. Water Res. 2016, 102, 516–523. [Google Scholar] [CrossRef] [PubMed]
  19. Panglisch, S.; Hoffmann, G.; Antakyali, D.; Jagemann, P. Optimierter Einsatz von Pulveraktivkohle und Ultrafiltration als 4. Reinigungsstufe (UF/PAK 4.0)-Abschlussbericht-only Available in German Language; Ministry for Environment, Agriculture, Conservation and Consumer Protection of the State of North Rine-Westphalia: Düsseldorf, Germany, 2018. [Google Scholar]
  20. Miyazawa, T.; Itaya, M.; Burdeos, G.C.; Nakagawa, K.; Miyazawa, T. A Critical Review of the Use of Surfactant-Coated Nanoparticles in Nanomedicine and Food Nanotechnology. Int. J. Nanomed. 2021, 2021, 3937–3999. [Google Scholar] [CrossRef] [PubMed]
  21. Panglisch, S. Formation and prevention of hardly removable particle layers in inside-out capillary membranes operating in dead-end mode. Water Supply 2003, 3, 117–124. [Google Scholar] [CrossRef]
  22. Altmann, J.; Zietzschmann, F.; Geiling, E.-L.; Ruhl, A.S.; Sperlich, A.; Jekel, M. Impacts of coagulation on the adsorption of organic micropollutants onto powdered activated carbon in treated domestic wastewater. Chemosphere 2015, 125, 198–204. [Google Scholar] [CrossRef] [PubMed]
  23. Schwaller, C.; Hoffmann, G.; Hiller, C.X.; Helmreich, B.; Drewes, J.E. Inline dosing of powdered activated carbon and coagulant prior to ultrafiltration at pilot-scale—Effects on trace organic chemical removal and operational stability. Chem. Eng. J. 2021, 414, 128801. [Google Scholar] [CrossRef]
Figure 1. Lab-scale module characteristics, experimental conditions and process designs for OUT/IN process (left) and IN/OUT process (right).
Water 13 03578 g001
Figure 2. Results of tWWTP monitoring for DOC, UV (254) and COD, evaluation of 68 samples in the period between August 2015 and September 2017 (data provided by Emschergenossenschaft).
Water 13 03578 g002
Figure 3. Results of tWWTP monitoring for selected micropollutants, evaluation of 68 samples in the period between August 2015 and September 2017 (data provided by Emschergenossenschaft).
Water 13 03578 g003
Figure 4. Optical images of the PAC suspensions prepared from 0.01 g/L to 4 g/L.
Water 13 03578 g004
Figure 5. Optical micrographs of the PAC suspensions (5 g/L) prepared under different conditions.
Water 13 03578 g005
Figure 6. Removal of diclofenac (C0 = 5 mg/L) in lab-scale investigations for OUT/IN (left) and IN/OUT (right) using different PAC stock suspension concentrations (PAC dose: 5 mg/L as single pulse dosage).
Water 13 03578 g006
Figure 7. Photos of 0.7 mg PAC/m2, distributed on the OUT/IN module for PAC stock suspensions (0.2, 0.9 and 1.8 g/L) applied in different concentrations as well as a photo of a clean membrane after chemical cleaning.
Water 13 03578 g007
Figure 8. Removal of acesulfame (C0 = 5 mg/L) in lab-scale investigations for OUT/IN using 0.2 g/L (left) and 1.8 g/L (right) PAC stock suspension concentrations (PAC dose: 5, 20, 40 and 80 mg/L added before starting the filtration of the model water).
Water 13 03578 g008
Figure 9. MPs removal in OUT/IN pilot scale investigations using different PAC suspension concentrations (UV(254) in the pilot plant feed: 16 m−1; PAC dose: 15 mg/L as single pulse dosage).
Water 13 03578 g009
Figure 10. Photos of PAC distributed on the OUT/IN module using different PAC stock suspension concentrations as well as a photo of a clean membrane after chemical cleaning.
Water 13 03578 g010
Figure 11. MPs removal in IN/OUT pilot scale investigations using different PAC stock suspension concentrations (UV (254) in the pilot plant feed: 16 m−1; PAC dose: 15 mg/L as single pulse dosage).
Water 13 03578 g011
Figure 12. Time partitioned micropollutant removal for IN/OUT pilot scale investigations using two different PAC stock suspension concentrations (UV (254) in the pilot plant feed: 16 m−1; PAC dose: 15 mg/L as single pulse dosage).
Water 13 03578 g012
Table 1. Properties of the selected PACs.
CategoryCarbon ACarbon B
NameAquasorb PAC-MGPulsorb WP260 UF
Raw materialLigniteBituminous coal
BET surface area in m²/g14251145
Iodine number in mg/g12901200
Particle size distribution (volume distribution, laser particle size analyzer)D10 = 1.2 µm
D50 = 4.31 µm
D90 = 9.47 µm
D10 = 0.9 µm
D50 = 5.0 µm
D90 = 13.4 µm
Mean diameter5 µm6.8 µm
Table 2. Investigated micropollutants, their origin, limit of detection (LOD) and applied analysis (A = LC-MS/MS according to DIN 38407-47 and B = LC-MS/MS according to ISO 21676).
MicropollutantsOriginLOD in ng/LApplied Analysis
BenzotriazoleCorrosion inhibitor20A, B
AmidotrizoateIodinated contrast medium10A
BezafibrateLipid regulator10A, B
CarbamazepineAnticonvulsant10A, B
ClarithromycinAntibiotic10A, B
DiclofenacAnti-inflammatory10A, B
IopamidolIodinated contrast medium10A
IopromideIodinated contrast medium10A
MetoprololBeta blocker10A, B
NaproxenAnti-inflammatory10A
SulfamethoxazoleAntibiotic10A, B
Table 3. Median, minimum and maximum concentration of micropollutants in tWWTP effluent (n = 47) during pilot study and results for a five-fold analysis of one sample (A.M. = arithmetic mean and RSD = relative standard deviation).
MicropollutantsWWTP Effluent (n = 47)Quintuplicate of One Sample
Min. in ng/LMax. in ng/LMedian in ng/LA.M. in ng/LRSD in%
1H-Benzotriazol130011,000370037003.8
Amidotrizoic acid843600160026803.1
Bezafibrate7415004804924.4
Carbamazepine11011004706840.8
Clarithromycin53500235565.1
Diclofenac12007500330045002.2
Iopamidol5510,0006108382.4
Iopromide16019,000130013203.4
Metoprolol3805500230027402.0
Naproxen20540150818.4
Sulfamethoxazole5485018071611.8
Publisher’s Note: MDPI stays neutral with regard to jurisdictional claims in published maps and institutional affiliations.

