
The Effects of Different Carbon Sources on the Production Environment and Breeding Parameters of Litopenaeus vannamei

1
Key Laboratory of Mariculture, Ministry of Education, Ocean University of China, Qingdao 266003, China
2
Function Laboratory for Marine Fisheries Science and Food Production Processes, Qingdao National Laboratory for Marine Science and Technology, Qingdao 266235, China
*
Author to whom correspondence should be addressed.
Water 2021, 13(24), 3584; https://doi.org/10.3390/w13243584
Submission received: 4 November 2021
/
Revised: 9 December 2021
/
Accepted: 10 December 2021
/
Published: 14 December 2021
(This article belongs to the Special Issue Advances in Aquaculture Ecology Research)
Abstract
:This study investigated the effect of different carbon sources on water quality, ammonia removal pathways, the bacterial community, and the production of Litopenaeus vannamei in outdoor culture tanks. Three systems were established: a clear water system (CW) and biofloc technology (BFT) systems with added molasses (M-BF) or poly (3-hydroxybutyric acid-co-3-hydrovaleric acid) (PHBV) (P-BF). The average pH, total alkalinity, total organic carbon, biofloc volume, chlorophyll a, nitrite, nitrate, total nitrogen, and nitrification rate were significantly different among the treatments. Microbial composition varied and different dominant taxa were identified in the treatments by linear discriminant analysis effect size. Redundancy analysis indicated that the water quality parameters affected the distribution of the microbial community. Moreover, the genus Leucothrix was closely related to the M-BF treatment. Chemoheterotrophy and aerobic chemoheterotrophy were the most abundant functions in all treatments. A comparison of functions using BugBase indicated that the relative abundance of several functions such as biofilm formation, stress tolerance and functions related to anaerobic processes increased in the M-BF treatment. The specific growth rate, growth rate, and survival rate of shrimp were significantly higher in the P-BF system than in the CW system and the feed conversion ratio in the BFT treatments was significantly lower than that in the CW system. Overall, adding carbon sources affected water quality, microbial community, and shrimp performance. The results show that PHBV is a good alternative to carbon sources.
1. Introduction
The Pacific white shrimp (Litopenaeus vannamei) is the most important commercially- traded species in shrimp aquaculture [1]. The culture systems for L. vannamei are becoming more intensive, resulting in ammonia and nitrite accumulation within grow-out systems [2,3]. Attention should be given to high ammonia concentrations because the stress can kill shrimp, fish, and other cultured animals [4,5,6]. Three processes involving ammonia removal from aquaculture systems are photoautotrophic uptake by algae, chemoautotrophic oxidation of ammonia to nitrate, and heterotrophic assimilation of ammonia directly to bacterial protein [7,8]. These three processes occur simultaneously in many aquaculture systems but seldom in equal importance, and changes in carbon sources may cause shifts in the dominant pathway [7].
The chemoautotrophic process is dominant in systems with a low total organic carbon/total nitrogen (C/N) ratio, such as a recirculating aquaculture system, [9]. Increasing the C/N ratio in biofloc technology (BFT) systems by adding organic carbon sources induce a shift in nitrogen use by the bacterial community from chemoautotrophy to heterotrophy [10]. The rate of nitrogen use by heterotrophic bacteria is 10 times faster than that of autotrophic nitrification [11]. Previous studies have demonstrated the efficiency of heterotrophic bacteria in controlling total ammonia nitrogen (TAN) in shrimp and tilapia BFT systems [5,8]. Although the growth of heterotrophic bacteria is stimulated in BFT systems, nitrification occurs in these systems, and the process is important for the long-term removal of TAN originating from the feed in intensive BFT systems [8,12,13]. However, it is unclear whether the nitrification rates differ in different carbon added systems, and whether the nitrification rate changes with the development of the bacterial community in a BFT system.
Molasses is a by-product of sugar production, that was suggested to be an appropriate carbon source to increase the C/N ratio in BFT systems. This water-soluble carbon source needs to be applied frequently with constant supervision to prevent overdosing and starvation of the bacterial floc, which increases the management effort. In recent years, insoluble biodegradable polymers (BDPs), such as poly (3-hydroxybutyric acid-co-3-hydrovaleric acid) (PHBV) have been used as carbon sources and biofilm carriers in aquaculture [14]. The relatively low cost of BDPs and the simple management requirements make them an attractive alternative carbon source for aquaculture [15]. However, the use of different carbon sources may lead to differences in water quality and changes in the bacterial community of a BFT system [6,16].
The conversion of nitrogen and waste recycling in BFT systems strongly depends on the capacity of microbes to assimilate and convert the nutrient waste [17]. The functions of biofloc, as a waste nutrient converting agent and a food source, are related to the microbial community. The changes in the bacterial community after adding carbons can affect the nutrient composition, which is essential for bacteria and cultured animals. Moreover, the relevance of host–microbiota–nutrient interactions is important in aquaculture [18]. Therefore, it is essential to explore the relationships between environmental factors and the microbiota [18].
The present study was designed to evaluate the effects of different carbon sources (molasses and PHBV) on water quality, nitrification rate and growth performance of L. vannamei in low water exchange grow-out systems. Moreover, the microbial community, the relationship between microbial structure and water environmental factors, as well as microbial function was investigated to develop a further understanding of the impact of different carbon sources on the microbial community in BFT systems.
2. Materials and Methods
2.1. Experimental Shrimp and Acclimation
The L. vannamei juveniles used in this experiment were supplied by Baorong Aquaculture Corp., Qingdao, China, and the experiment was conducted at the Ruizi Marine Food Product Co., Ltd., Qingdao City, China. The shrimp were acclimated for 10 days in 11 polyethylene fiber tanks (400 L) from which 50% of the water was renewed daily. The shrimp were fed a commercial feed (crude protein, 40%; moisture, 12%; ash, 16%; crude fat, 4% and NaCl, 3%) produced by the Yuehai Feed Co., Ltd., Guangzhou, China. Feed was offered twice daily (7:00 a.m. and 6:00 p.m.) based on a feeding amount equivalent to 5% of shrimp body weight.
2.2. Experimental Design
A 34-day trial was conducted. Three kinds of culture systems, each replicated three times (400-L of water in each circular tank), were established and 60 healthy shrimp (2.70 ± 0.02 g) were stocked into each tank. The treatments were: a clear water system (CW) and two BFT systems with added molasses (M-BF) or PHBV (P-BF). No molasses or PHBV was added to the CW tanks. Molasses was applied to the M-BF treatment at the ideal theoretical application amounts suggested by Avnimelech [10]. The molasses had a total organic carbon concentration of 26.5%, and it was diluted with water from the tanks and splashed uniformly over the tank surfaces twice daily. As suggested by Zhang, et al. [19], after 7 days of activation in the acclimation tanks, 633 g of PHBV was placed in a PVC tube with an inner diameter of 15 cm and an operating depth of 30 cm, and an air stone was placed inside the tube to sufficiently stir the PHBV. The PVC tube was wrapped with a filter screen, which was cleaned every five days.
The tanks were located within a greenhouse covered with clear plastic sheeting. One-fifth of the water in the CW treatment was replaced daily to ensure good water quality [13]. One-fifth of the water in the BFT tanks was replaced every 5 days [20]. The seawater used was pre-filtered using a sand filter. Each tank was continuously aerated with four air stones. The tanks were covered with shade netting to control sunlight. The feeding regime was the same as during the acclimation period.
2.3. Water Quality
Temperature, dissolved oxygen (DO), and pH were measured at 8:00 am daily using a portable DO meter (RDB20, Yuanmu, Shanghai, China) and a pH meter (pH-100, LICHEN, Shanghai, China). The salinity of the culture water was 31 g L−1 which was monitored using an optical salinity meter (LYT-610, Yulin, Shanghai, China). Water samples were collected from the tanks every 5 days. Total ammonia nitrogen (TAN), nitrite (NO2−-N), nitrate (NO3−-N), total nitrogen (TN), total alkalinity (TA) and chlorophyll (Chl) a were analyzed following the standard methods of the Chinese State Environmental Protection Agency [21]. Particulate organic carbon (POC) and dissolved organic carbon (DOC) were analyzed according to the method of Gilcreas [22]. Total organic carbon (TOC) was calculated as the sum of DOC and POC. Water samples (1000 mL) were transferred to Imhoff cones (1000-0010, Nalgene) at 3:00 pm every five days to determine biofloc volume. The volume of the biofloc plug accumulating on the bottom of the cone was determined 30 min after sedimentation.
2.4. Nitrification Rate
Water samples (500 mL) were collected on days 14, 19, 24, 29 and 34 to measure the nitrification rate following the methodology of Bratvold and Browdy [23]. Briefly, duplicate samples were enriched with ammonium chloride (2.5 mg L−1 of ammonia-N) and incubated in the absence or presence of 2.2 mg L−1 of the nitrification inhibitor N-allylthiourea (Sigma-Aldrich, St. Louis, MO, USA). The nitrification process is expressed as NH4+ + 2O2 → NO3− + 2H+ + H2O. The difference in the DO concentration of dissolved oxygen between the bottles with and without the inhibitor was the nitrification result. The nitrification rate (NR) (mg L−1 h−1) was calculated using Equation (1):
where (DO1) = dissolved oxygen in the bottle with the inhibitor (mg L−1); DO2 = dissolved oxygen in the bottle without the inhibitor (mg L−1); h = incubation period (h).
NR = (DO1 − DO2)/h,
2.5. 16S rRNA Gene High Throughput Sequencing Analysis
At the end of the study, 1-L water sample was filtered with a 50-mm membrane (pore size 0.20 μm) and used for bacterial DNA extraction and analysis. Three replicates were conducted for each treatment. Total DNAs from these samples were extracted by the CTAB/SDS method [24] and were diluted to 1 ng/µL with sterile water and used for PCR template. 16S rRNA genes of distinct regions (16S V4/V5) were amplified using specific primers (515F: 5′-GTGCCAGCMGCCGCGG-3′ and 907R: 5′-CCGTCAATTCMTTTRAGTTT-3′). These PCR products were purified with a GeneJET Gel Extraction Kit (Thermo Scientific, Waltham, MA, USA) and prepared to construct libraries. Sequencing libraries were generated using NEB Next®Ultra™DNA Library Prep Kit for Illumina (NEB, Ipswich, MA, USA) following the manufacturer’s instructions. The library quality was assessed on the Qubit@ 2.0 Fluorometer (Thermo Scientific, Waltham, MA, USA) and Agilent Bioanalyzer 2100 system (Agilent Technologies, Santa Clara, CA, USA). Then the library was sequenced on an Illumina MiSeq platform and 250 bp paired-end reads were generated. The raw amplicon sequencing data were deposited to NCBI Sequence Read Archive (accession number: PRJNA738270).
Paired-end reads were merged using FLASH (v. 1.2.11, http://ccb.jhu.edu/software/FLASH/, accessed on 29 April 2021), which was designed to merge paired-end reads when at least some of the reads overlap those generated from the opposite end of the same DNA fragments. The splicing sequences were called raw tags. Quality filtering on the raw tags were performed under specific filtering conditions to obtain the high-quality clean tags using Trimmomatic v. 0.33 [25]. The primer sequences were identified and removed using Cutadapt v. 1.9.1 [26]. The raw tags were compared with the reference database (Silva database, Release132, http://www.arb-silva.de/, 29 April 2021) using UCHIME algorithm v. 10 [27] to detect and remove chimera sequences [28]. The sequencing results were clustered into operation taxonomy units (OTUs) at a similarity threshold of 97% using USEARCH v. 10.0 [27]. The representative sequences for each OTU were made taxonomic annotations against the SILVA taxonomy database (Release132, http://www.arb-silva.de/, 29 April 2021) using Qiime 2 [29].
2.6. Shrimp Growth Performance and Survival
At the end of the experiment, all shrimp in the tanks were collected, counted, and weighed to calculate growth rate, feed conversion ratio (FCR), specific growth rate (SGR) and survival rate, which were determined as follows:
Growth rate (g/wk) = (average final weight of shrimp − average initial weight of shrimp)/culture weeks;
Feed conversion ratio (FCR) = total weight of feed intake (g)/total shrimp weight gain (g);
Specific growth rate (SGR) = (ln (initial wet weight) − ln (final wet weight))/culture days × 100;
Survival rate (%) = (final shrimp number/initial stocking shrimp number) × 100.
2.7. Statistical Analysis
The statistical analysis was performed using SAS v9.4 for windows (Cary, NC, USA). The normality of distribution of data was checked using the Kolmogorov–Smirnov test (p > 0.05). The Levene test (p > 0.05) was applied for assessing the homogeneity of variance. One-way analysis of variance (ANOVA) was used to compare the average concentration of all the water quality parameters, concentrations of NR, TAN, NO2−-N, NO3−-N and TN on each sampling day, microbial alpha diversity indexes, shrimp growth indexes, the composition of microbial phylum and genus among treatments. Differences were considered significant at p < 0.05. When significant differences were found, Tukey’s test was used to identify differences between treatments. The indices of Chao1, Abundance-based Coverage Estimator (ACE), Shannon and Simpson were calculated using Qiime 2.
The linear discriminant analysis (LDA) effect size (LEfSe) method (http://huttenhower.sph.harvard.edu/lefse/, 29 April 2021) was used for determining the features of bacterial communities between different treatments [30]. The LDA score was set as 3.5 to identify the significant features. The redundancy analysis (RDA) was carried on using the vegan package (v. 2.3) in R (v. 4.0). The functional prediction of bacterial community was performed by FAPROTAX [31] and BugBase [32].
3. Results
3.1. Water Quality
The descriptive statistics for the water quality data are given in Table 1. No significant differences in average temperature or DO were observed among the treatments (Table 1, p > 0.05). The pH in the CW system was significantly higher than that in the other treatments and pH in the P-BF system was significantly higher than that in the M-BF system (Table 1, p < 0.05). The average TA concentration in the CW system was significantly higher than that in the other systems (p < 0.05) and the biofloc volume in the M-BF systems was significantly higher than that in the CW and P-BF systems. The Chlorophyll a in the P-BF system was significantly lower than that in the other two systems.
The average TAN concentration was not significantly different among the three systems (Table 1, p > 0.05). The concentration of TAN in the BFT systems (M-BF and P-BF) reached peak levels on day 7 of the experiment and then decreased sharply from day 7 to 14 (Figure 1a). Then, the concentration of TAN in the BFT systems remained relatively stable. The concentration of TAN in the CW system declined from days 1 to 14 and then increased slowly over that in the other systems (Figure 1a). No significant difference in TAN was observed among the treatments at the end of the study (Figure 1a, p > 0.05).
The average concentration of NO2−-N in the CW system was significantly lower than that in the BFT systems (p < 0.05) and it was relatively stable. The NO2−-N concentration in the M-BF system increased sharply from days 0 to 19, then, the concentration of NO2−-N decreased from days 19 to 24 and was stable after day 24 (Figure 1b).
The concentration of NO3−-N in all systems was stable from days 1 to 19 but increased sharply in the BFT systems from days 19 to 29 (Figure 1c). After day 29, the NO3−-N concentration in the BFT systems decreased slightly. The NO3−-N concentration in the CW system remained relatively constant during the study. The concentration of NO3−-N in the CW system was not significantly different from the other two systems during the first 19 days (p > 0.05). After day 19, the concentration of NO3−-N in the CW system was significantly lower than that in the carbon added systems (p < 0.05).
The average concentration of TN in the M-BF was 13.65 mg L−1, which was significantly higher than that in the CW and P-BF systems (5.69 and 9.75 mg L−1, respectively) (Table 1, p < 0.05). The TN concentration increased during the first 7 days in all systems but began to fluctuate after day 7 (Figure 1d). The concentration of TN in the M-BF system was significantly higher than that in the CW system after day 7.
The average nitrification rate in the CW system was significantly higher than that in the BFT systems (Table 1, p < 0.05). No significant differences were observed in nitrification rate among the three treatments on the first sampling date (d 14) (Figure 2). Then, the nitrification rate was consistently higher in the CW system than in the other systems (Figure 2). The nitrification rate in the BFT systems decreased dramatically after the first sampling and approached zero after day 19 (Figure 2).
3.2. Characterization of the Bacterial Community
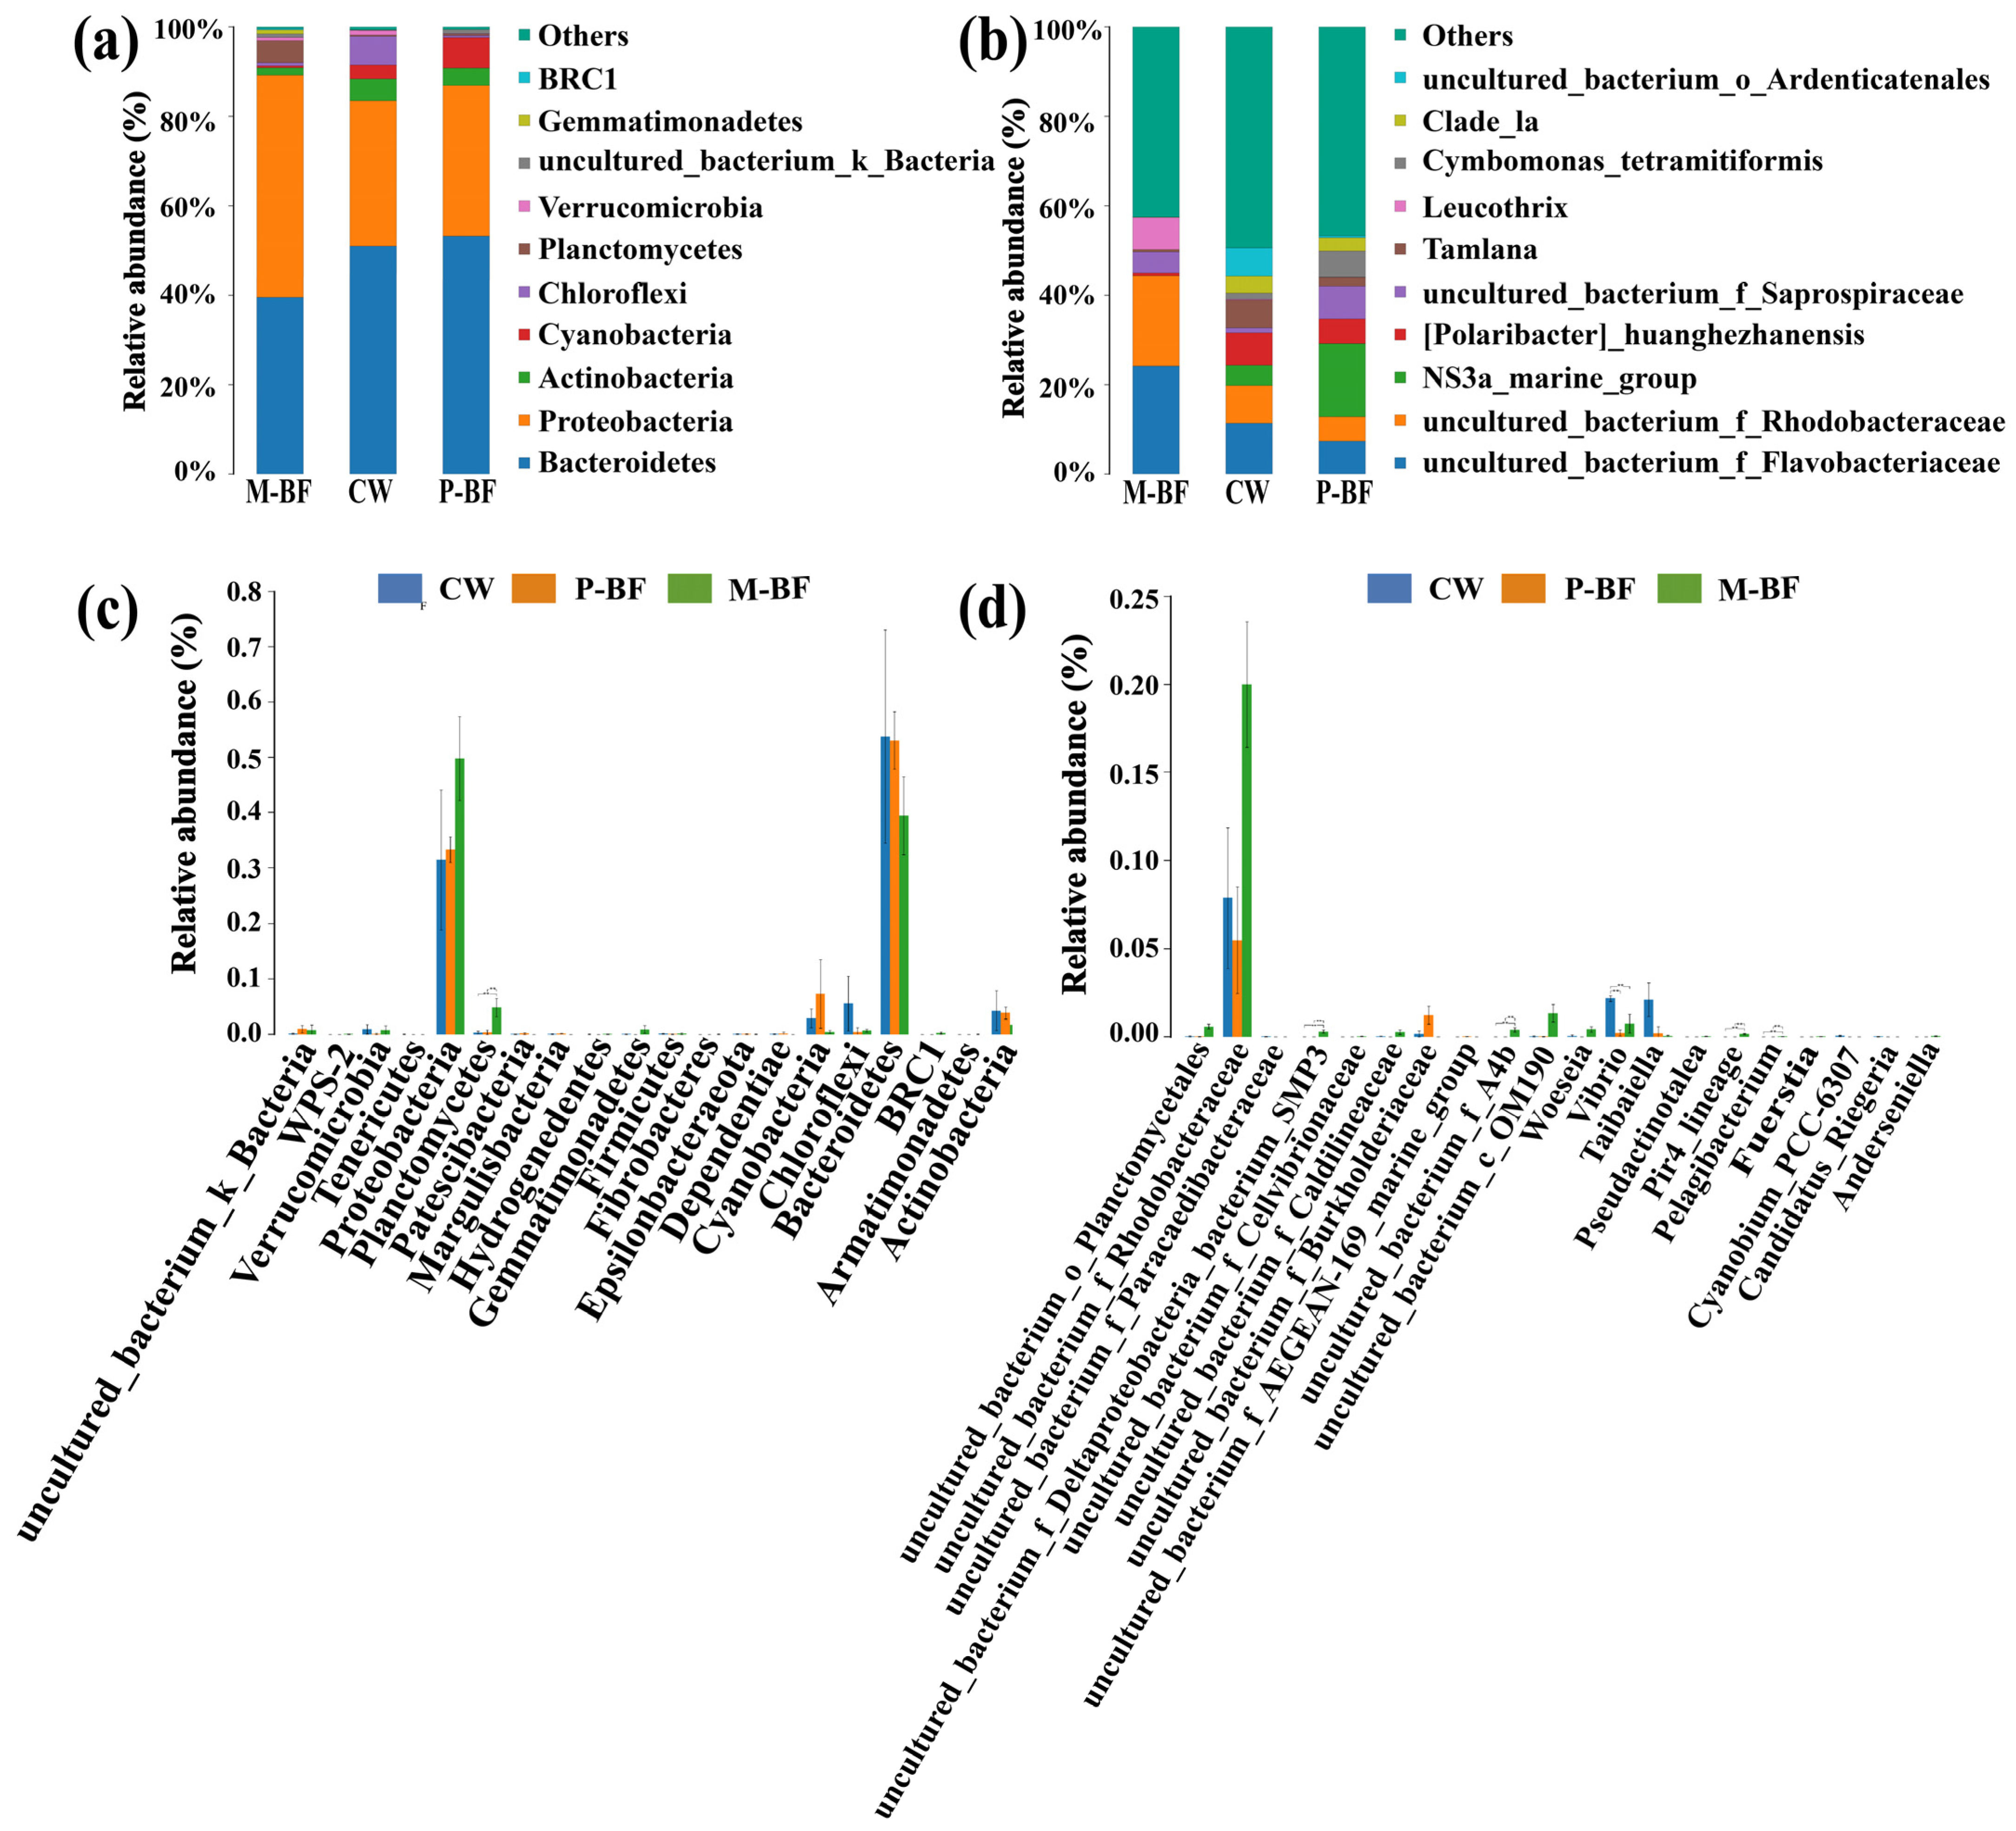
A total of 446,015 high-quality reads were obtained and 3,219 operational taxonomic units (OTUs) were obtained in the water samples by clustering the OTUs at a 97% similarity level. The Chao1, ACE, Shannon, and Simpson indices, which were used to represent the richness and diversity of the bacterial community, were not significantly different among the treatments. The phyla Bacteroidetes, Proteobacteria and Actinobacteria were the dominant bacteria (48.76%, 38.20%, and 3.27%, respectively) in the three treatments (Figure 3a). The abundance of Cyanobacteria decreased in the M-BF system and increased in the P-BF system compared to the CW system, which was 0.44%, 7.32% and 2.83% in the M-BF, P-BF, and CW systems, respectively. Differences in the phyla among treatments were compared and the top 20 phyla with the smallest p-values were listed in Figure 3c. Cyanobacteria were included in the top 20 phyla. Planctomycetes was one of the dominant bacteria in the M-BF system and the abundance of this phylum was significantly higher than that in the other treatments (p < 0.01, Figure 3c). The abundance of Chloroflexi was higher in the CW systems (5.58%) than in the BFT systems (0.69% in M-BF and 0.46% in P-BF) and was included in the top 20 phyla with the smallest p-value (Figure 3c).
As for genera of the bacterial communities, an uncultured_bacterium_f_ Flavobacteriaceae, uncultured_bacterium_f_Rhodobacteraceae, and Leucothrix were the more abundant genera in the M-BF treatment compared to the other two treatments (Figure 3b). Tamlana and an uncultured _bacterium_o_Ardenticatenales were more abundant in the CW than the other two systems. Five genera were significantly different among the treatments in the top 20 genera with the smallest p-values (Figure 3d). Vibrio was significantly more abundant in the CW than the BFT systems (Figure 3d).
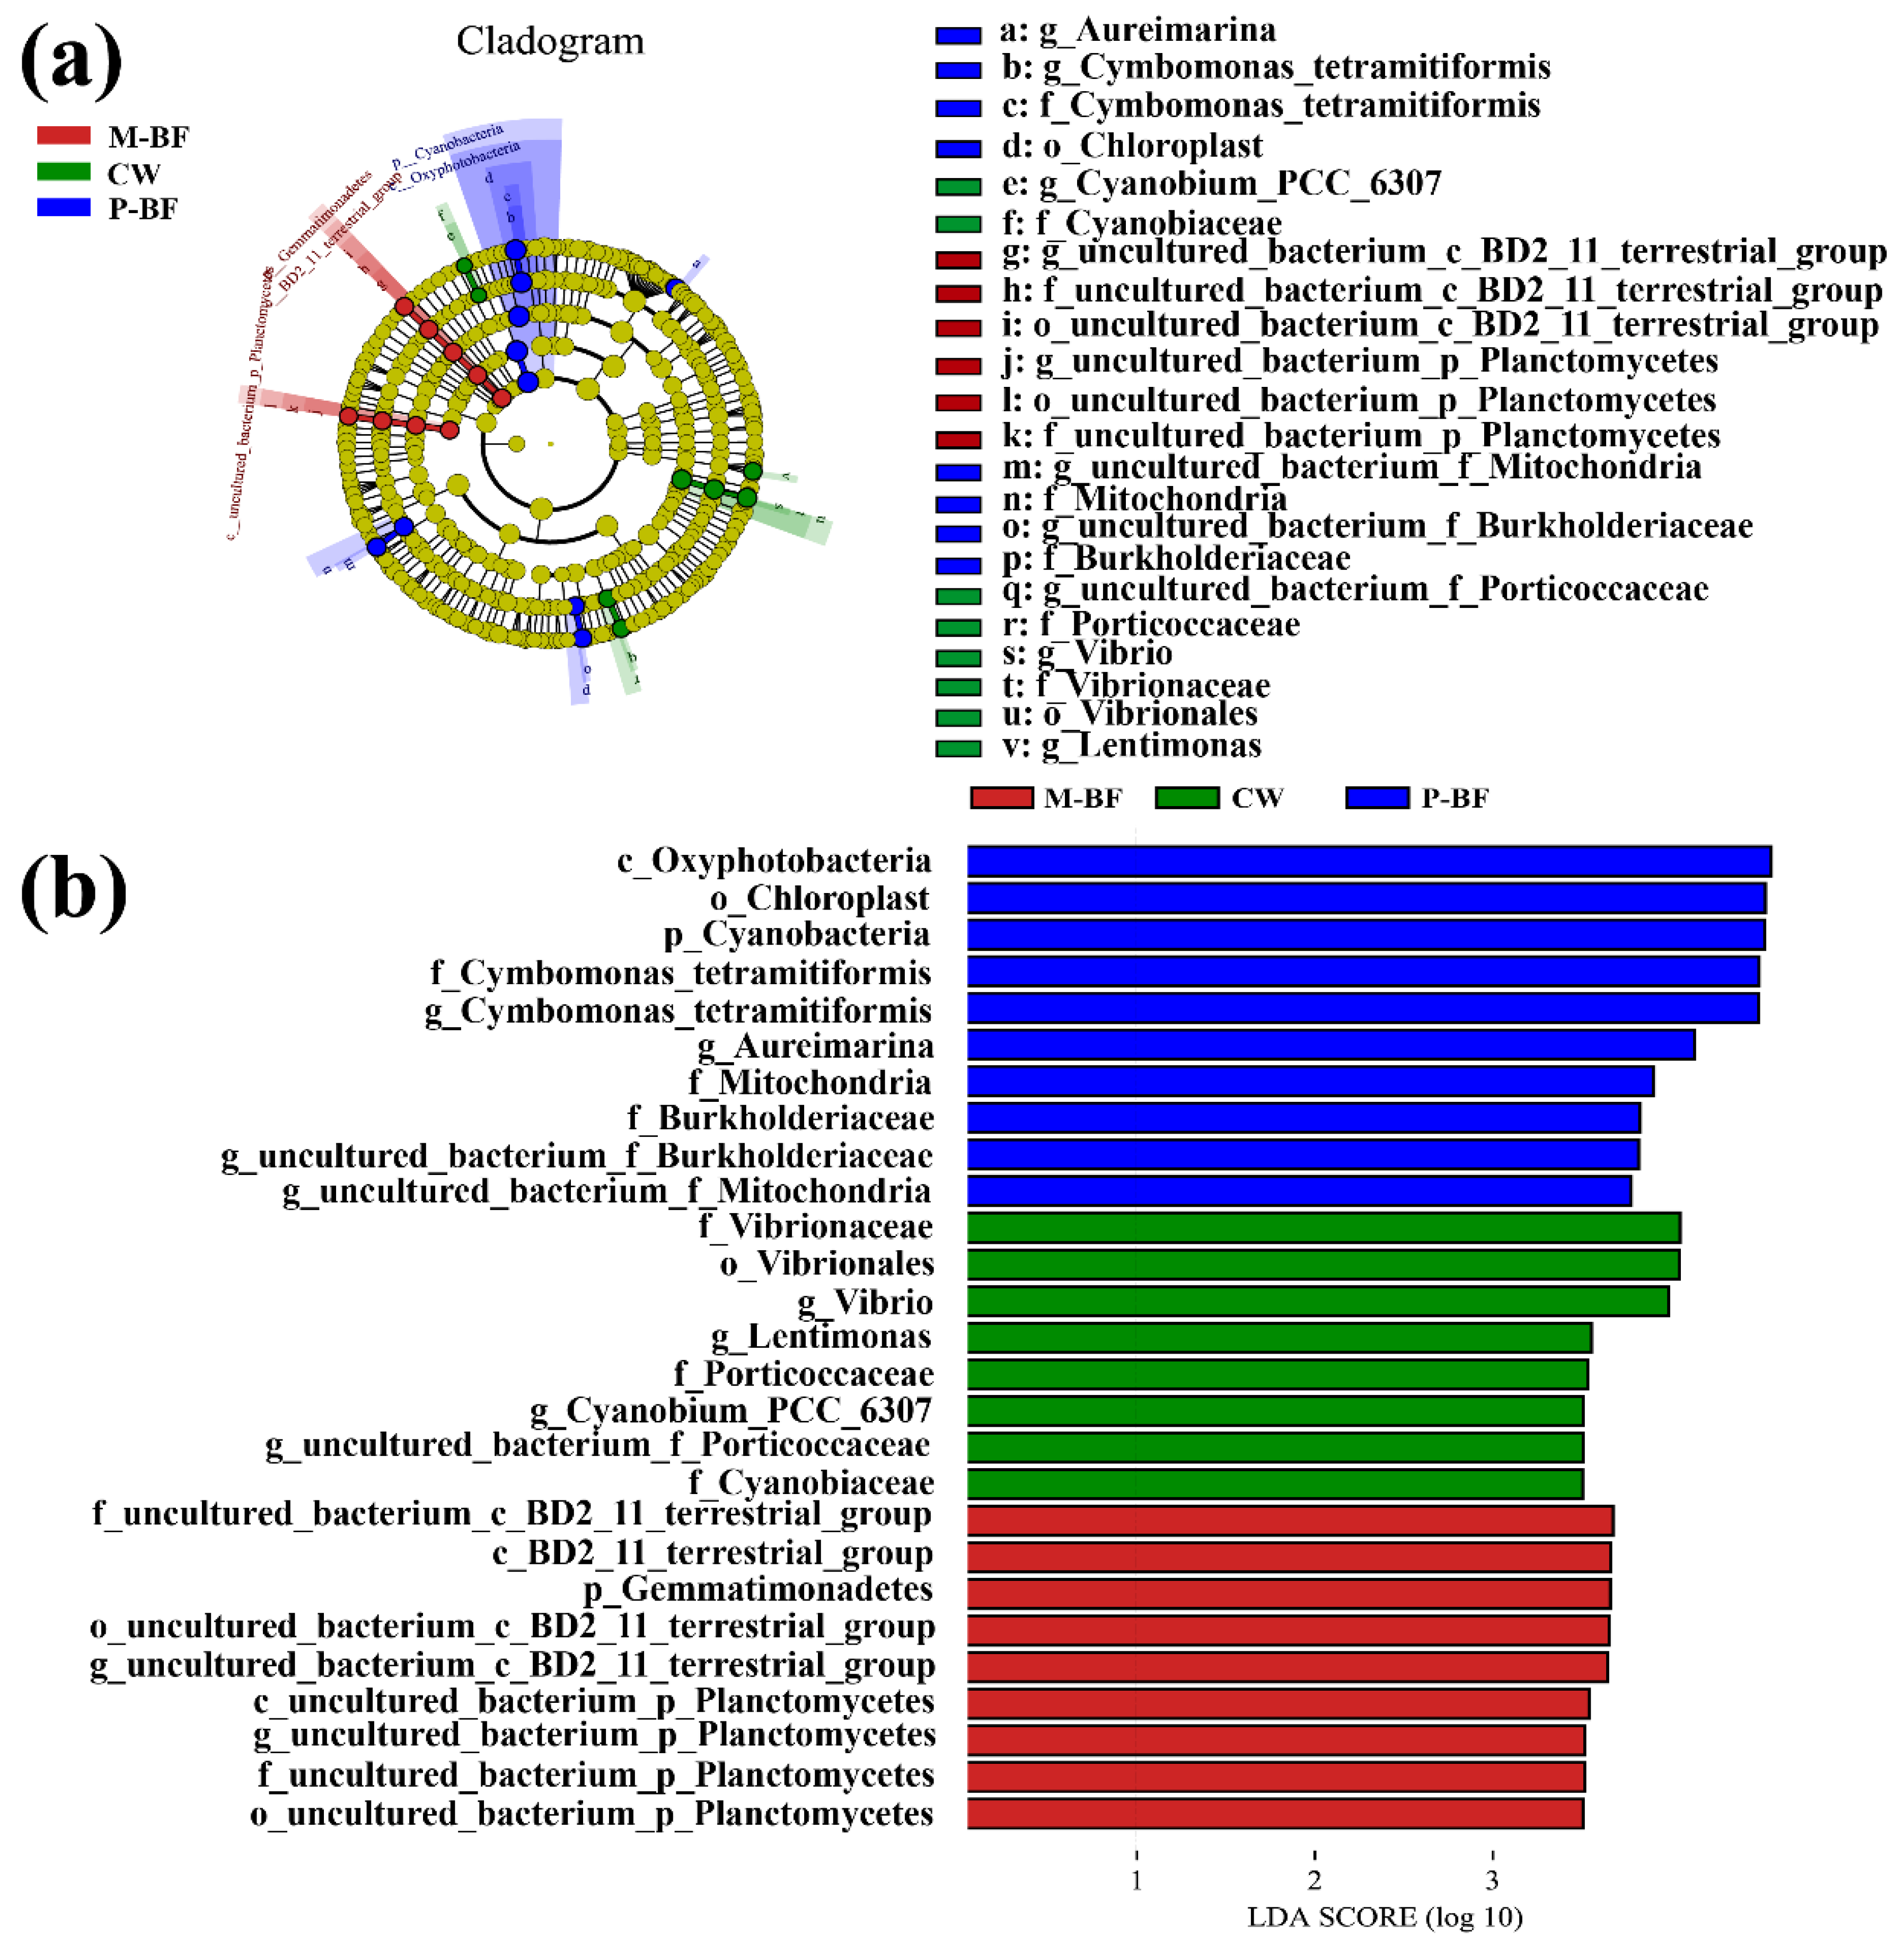
Linear discriminant analysis effect size (LEfSe) was used to identify the most differentially abundant microbial taxa in the three systems (Figure 4a). The taxa higher than the LDA significance threshold of 3.5 were scored in each system (Figure 4b). Various taxa were enriched in the BFT systems (Figure 4). For example, Oxyphotobacteria (Class), Cyanobacteria (Phylum), and Chloroplast (Order) were enriched in the p-BF treatment, whereas Gemmatimonadetes (Phylum) and planctomycetes (Class, Order, Family and Genus) were enriched in the M-BF treatment (Figure 4). Furthermore, Vibrionaceae (Family), Vibrionales (Order) and Vibrio (Genus) were enriched in the CW system, which was consistent with the analysis of variance in genus level (Figure 3d).
3.3. Correlation Analysis between Environmental Factors and Microbial Community
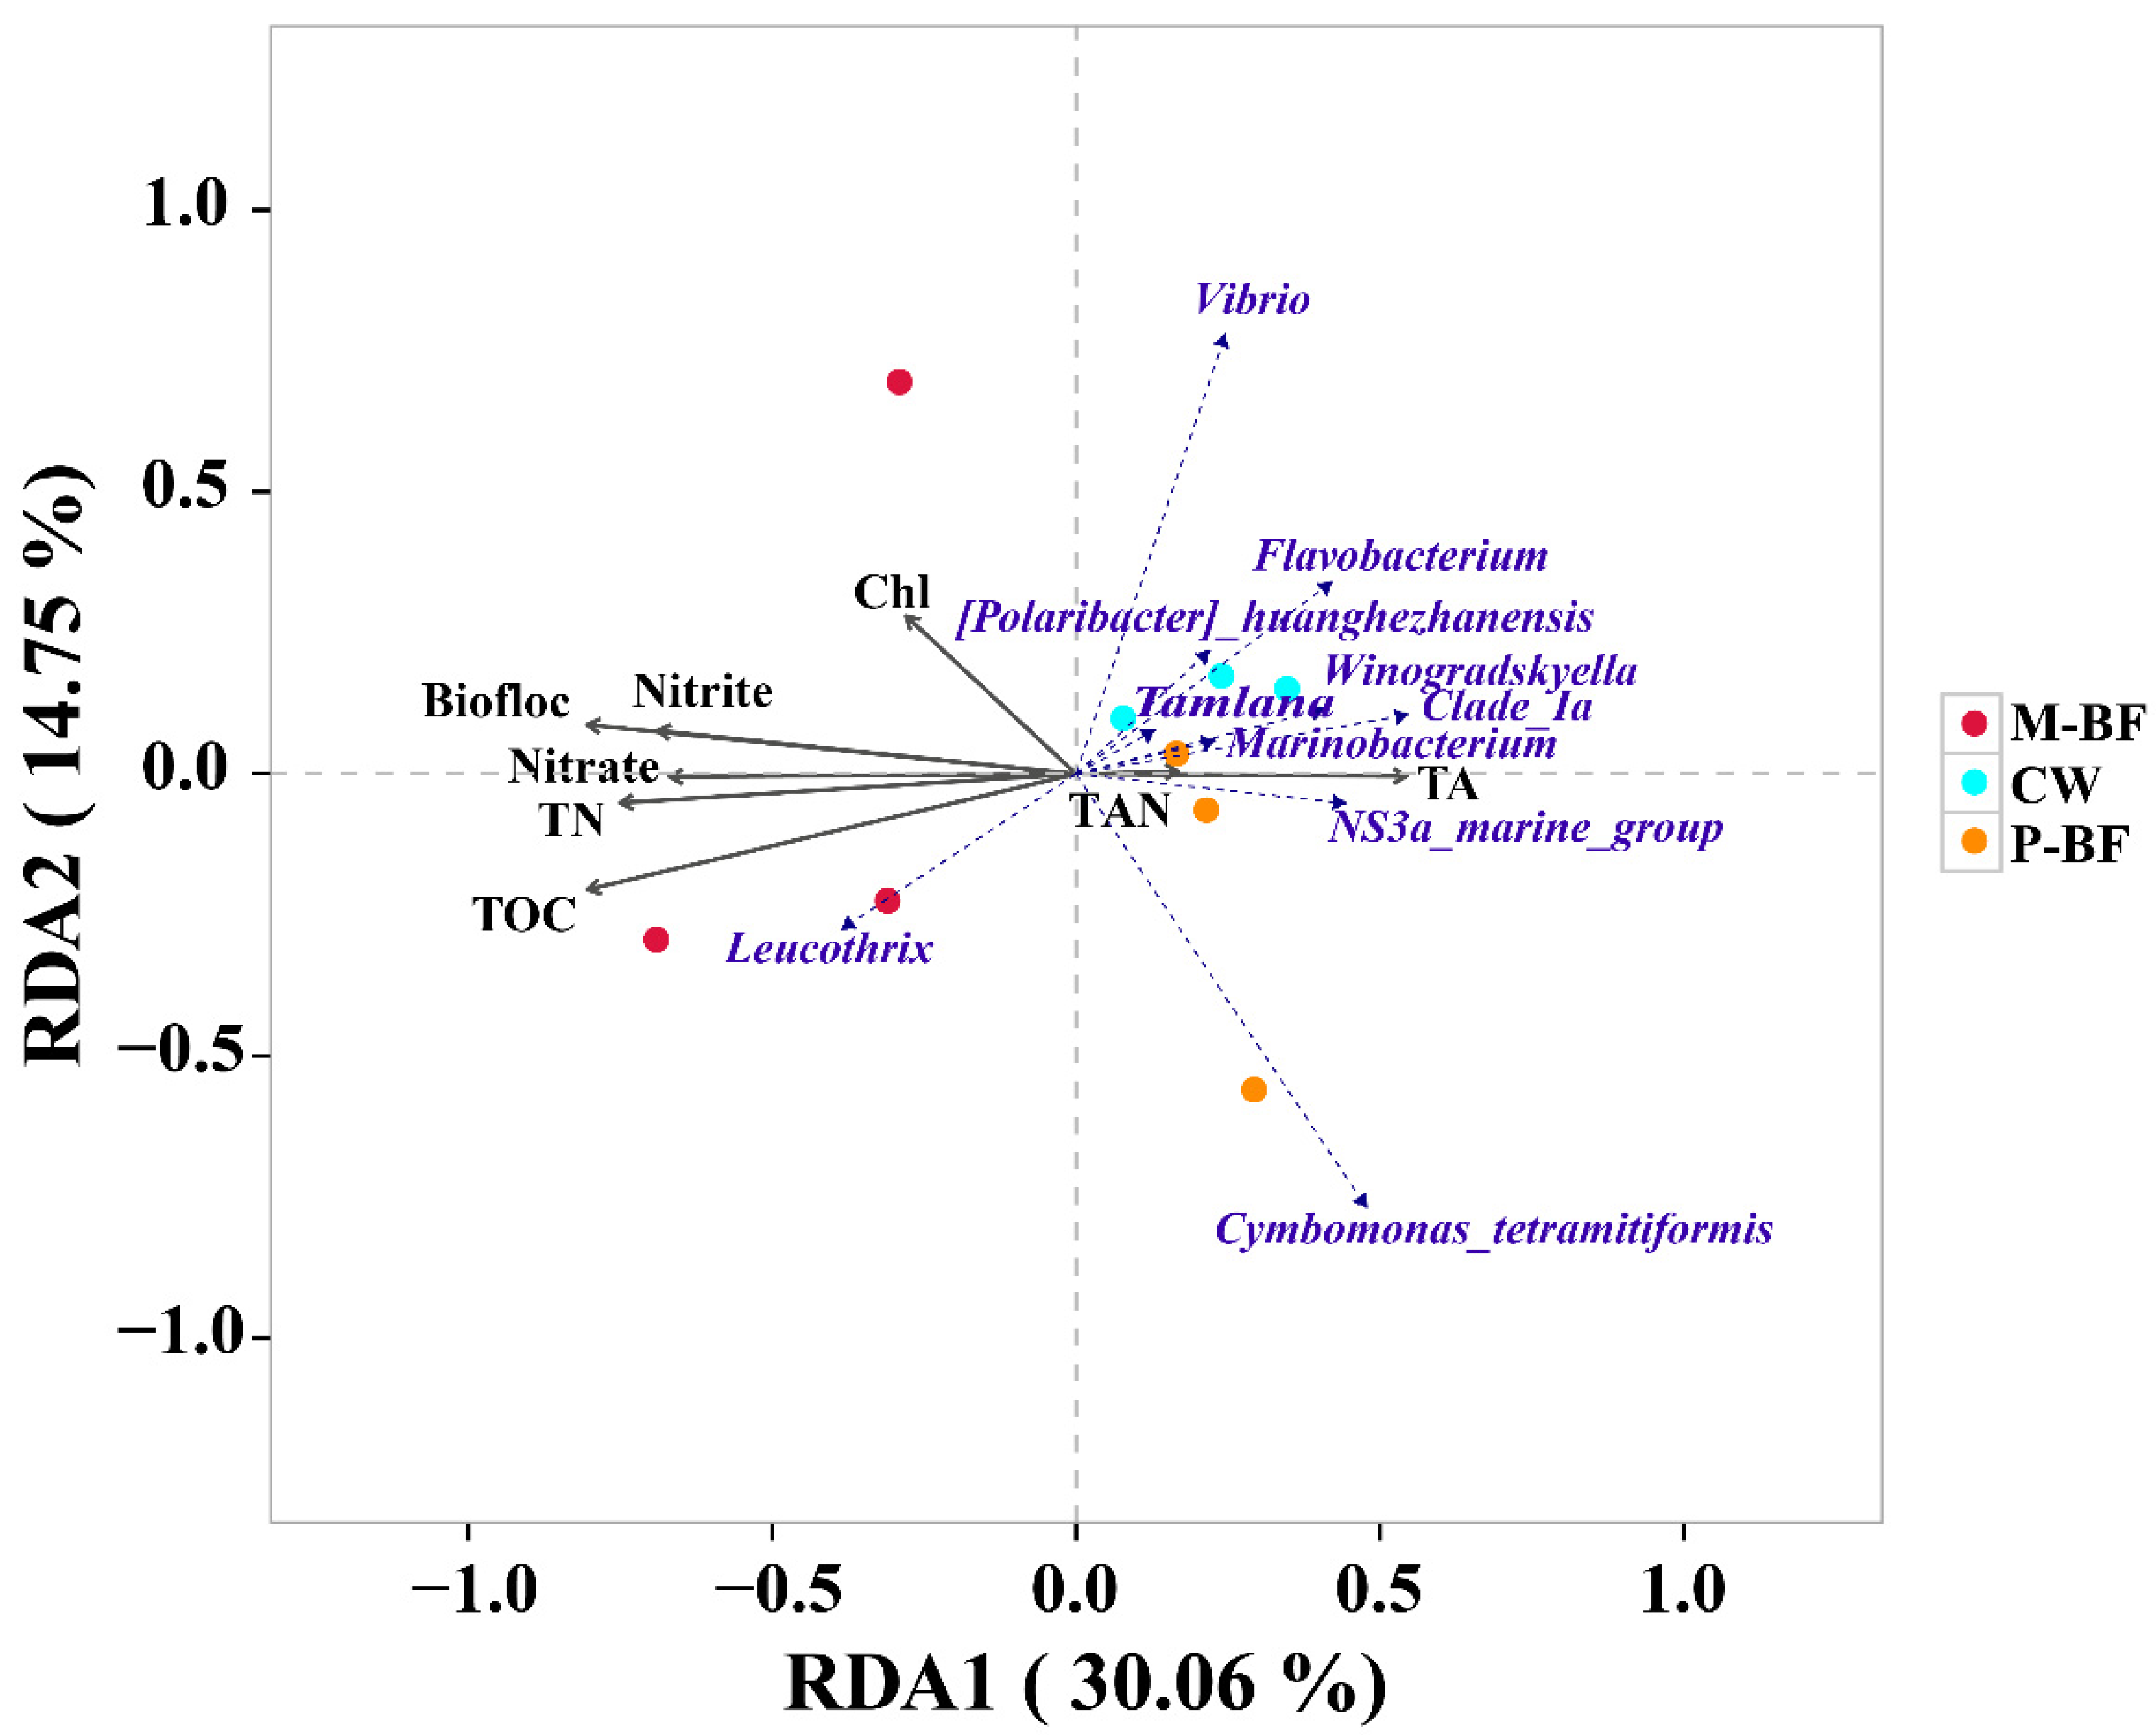
Redundancy analysis (RDA) was used to discern the possible correlations between the bacterial genera, the carbon varieties, and the environmental variables (Figure 5). Samples from the M-BF system were distributed on the left of the first canonical axis, whereas samples from the P-BF and CW systems were distributed on the right. Most environmental factors had a strong negative effect on the distribution of the samples on the first axis, whereas TAN and TA had a positive effect. Moreover, Leucothrix was strongly positively correlated with the M-BF treatment.
3.4. Functional Prediction in Carbon Adding Environments
FAPROTAX was adopted to annotate and screen the key ecological functions of the bacterial communities in the three treatments. The top 10 functions are shown in Figure 6a. The functions of chemoheterotrophy and aerobic chemoheterotrophy were abundant in all treatments. Increased relative abundances of chloroplasts and intracellular parasites were observed in the P-BF treatment, while fermentation increased in the M-BF treatments. Based on the 16s rRNA gene sequences, the pairwise functional comparison was investigated using BugBase (Figure 6b–d). The relative abundance of several functions, such as biofilm formation (i.e., forms biofilms), anaerobic functions (i.e., anaerobic), stress tolerance (i.e., stress-tolerant), and mobile elements (i.e., contains mobile elements), increased in the M-BF than the CW system (Figure 6b). The relative abundance of the function of Gram-negative increased in both carbon adding systems compared to the CW system (Figure 6b,c). The relative abundance of the functions related to Gram-negative, aerobic, anaerobic, forms biofilms and stress-tolerant were all higher in M-BF than P-BF (Figure 6d).
3.5. Growth Performance
The final weight, specific growth rate (SGR), growth rate, and survival rate of L. vannamei were highest in the P-BF system and lowest in the CW system. The three parameters in the P-BF system were significantly higher than those in the CW system (Table 2). The feed conversion ratios (FCR) were significantly lower in M-BF and P-BF treatments than in the CW treatment (p < 0.05).
4. Discussion
4.1. TAN Removal Pathways in Different Systems
4.1.1. Nitrification in Different Systems
In previous studies, apparent nitrification was observed in heterotrophic systems, where heterotrophic assimilation was promoted [7,33]. This agrees well with the findings of the present study, in which the nitrification rate was relatively high in the BFT treatments during early culture but was not significantly different from that in the CW treatment. Several water quality variables demonstrated nitrification in the BFT systems. NO2−-N is the product of the first step in the nitrification process. The accumulation of NO2−-N and a decrease in TAN were observed during the early days of culture, suggesting that the first nitrification step (NH4+ + 1.5 O2 → NO2− + 2H+ + H2O) progressed at a greater rate than the second step (NO2− + 0.5 O2 → NO3−). Schveitzer, et al. [33] made a similar observation in BFT systems and arrived at the same conclusion. A dramatic increase in NO3−-N was observed from days 19 to 29, indicating complete oxidation of nitrite to nitrate during the period. Nitrite increased to a high level in the middle of the experiment and Emilie, et al. [34] also observed this trend after 20 d. However, nitrification in the BFT systems became inhibited as the experiment progressed. The nitrification rates in the BFT systems decreased and almost reached zero at the end of the study. Previous studies have demonstrated that heterotrophic bacteria efficiently compete with nitrifying bacteria for nutrients and space resulting in inhibited nitrification in L. vannamei and Oreochromis mossambicus culture systems [7,8,12].
4.1.2. Heterotrophic Bacteria Assimilation
The heightened ammonia concentrations in BFT systems during week 1 of this study may indicate that heterotrophic bacterial communities require considerable time to develop. The water had not received added carbohydrates to stimulate the growth of heterotrophic bacteria before it was added to the culture tanks. The addition of carbohydrates began after the shrimp were placed into the tanks, and the bacterial community required time to become functional in the systems [6]. Gerardi [35] reported that the heterotrophic bacterial community takes 14 days to reach a stable stage. In this study, although the average TAN concentration was not significantly different among the treatments, the dominant TAN removal pathway may have been different. The low TAN concentration in the CW system was maintained by water exchange and nitrification. This was supported by the significantly higher nitrification rate in the CW system during the experiment period. TAN in the BFT systems was mainly removed through heterotrophic bacterial assimilation, and nitrification was greatly inhibited after 14 d.
4.2. Microbial Composition
Previous studies have shown that different carbon sources can affect the structure and function of bacterial communities in aquaculture systems [8,10,36,37]. In this study, Proteobacteria and Bacteroidetes were the dominant phyla of bacteria in all three systems. This finding agrees with Cardona, et al. [34] who reported that these two phyla represent more than 90% of the total bacteria present in BFT systems. Proteobacteria are widely dispersed in the aquatic environment and play an important role in nutrient cycling and the mineralization of organic compounds [34,38]. Bacteroidetes are an important part of the heterotrophic bacterial community of many water bodies [39]. Other phyla with different abundance among treatments, including Cyanobacteria, Planctomycetes, Chloroflexi, and Verrucomicrobia were found in L. vannamei culture systems [40]. Significant growth and proliferation of Cyanobacteria were observed in the P-BF system in this study, and this was reported by Miranda-Baeza, et al. [41] in BFT systems with added molasses. This phylum has developed a variety of ecological and physiological adaptation strategies to grow under poor conditions with high organic matter loads [41]. The phylum Planctomycetes, which was abundant in the M-BF system, performs anaerobic ammonium oxidation (i.e., oxidizing ammonium with nitrite as the electron acceptor to yield dinitrogen gas) to maintain good water quality [36,42].
Leucothrix was the most abundant genus in the M-BF system, and this was consistent with our previous studies [43]. One study reported that Leucothrix forms filaments and is usually found as an epiphyte on algae and invertebrates [43]. Species of this genus promote high mortality rates in shrimp [44,45], and this may be the reason for the decreased survival rate in the M-BF system. In addition, Vibrio, which are also bacterial pathogens to aquatic organisms, increased significantly in the CW system compared to the BFT systems [46,47]. Inhibition of a population of pathogenic Vibrio was reported in BFT systems [46].
4.3. The Correlation between Carbon Sources, Microbial Communities and Environmental Factors
According to the RDA, a close correlation was observed between bacterial composition and the water quality parameters. This result agrees with the findings of previous studies, which reported that bacterial community structure in the aquatic environment is affected by the abiotic environment [48]. Zhang, et al. [49] revealed that abiotic environmental factors, such as TAN and TN, have large impacts on bacterial populations in L. vannamei culture ponds, and Li, et al. [50] reported that TAN and Chl strongly affect the bacterial composition in the sediment of intertidal regions used for mariculture. Many of the environmental factors changed in the culture systems after adding the carbon sources. (Table 1). Different bacteria perform different ecological functions and the changing ecology and microbiota co-affected shrimp culture [51].
The changes in the functional profiles involved in the bacterial community provide valuable information from a functional perspective [31]. FAPROTAX is a gene functional annotation tool based on 16S rRNA sequencing that is appropriate for environmental samples. The results of the functional predictions indicated that biofilms formation and stress tolerance increased in the M-BF system. Biofilm contributes to the metabolism of the nitrogenous compounds generated within biofloc culture systems [52]. This finding indicates that adding molasses changed the environment to a more stressful condition but improved nitrogen metabolism in another aspect. The functional comparison using BugBase showed that adding PHBV produced a less stressful environment for bacteria compared to that of molasses. Our previous study also showed that shrimp are subject to be stressed in BFT systems where molasses serves as the carbon source other than PHBV [53].
4.4. Practical Value
Carbon sources are often applied in aquaculture systems to maintain a high C/N ratio and control the concentrations of nitrogenous metabolites in the system [54]. The carbon sources used are often by-products of the food processing and animal feed industries that are inexpensive and locally available [54]. Water exchange is greatly reduced in those systems to favor heterotrophic nitrogen assimilation pathways [33,55,56,57]. In the present study, the water exchange rate in the BFT systems was only one-fifth of that applied to the CW system, but the average TAN concentrations were not significantly different among the three systems. This agrees with the findings of Hargreaves [12] and Avnimelech [58], who demonstrated the usefulness of BFT in reducing water use while maintaining adequate water quality.
The growth rate of shrimp was better in the BFT systems than in the CW system, suggesting the benefits of BFT systems for improving the growth rate, decreasing the FCR of shrimp, and reducing feed costs. Avnimelech [59] also observed that the growth rate of overwintering tilapia fingerlings in BFT systems was significantly higher than in the control. Shrimp may utilize bioflocs as a source of protein and additional feed for growth [4,60]. The mechanism for the promoting effect of biofloc on the growth of aquatic animals is unclear. Some researchers have proposed that biofloc contains fungal proteins, and their amino acids facilitate absorption by aquatic animals. In addition, biofloc is a rich source of proteins and lipids continuously available in situ for consumption by shrimp [54].
Water-soluble carbon sources, such as molasses, must be added many times to a culture system, which increases the difficulty of system management. Such carbon sources are also limited by excessive DOC and color problems [61]. In the present study, water from the M-BF system was more turbid than that from the CW and P-BF systems. The biofloc in the P-BF system was almost in the PVC tube, which caused low biofloc volume in this system. Moreover, PHBV was added as a carbon source only once, so this was not a major management effort. Boley, et al. [61] demonstrated that solid carbon sources are better alternatives to water-soluble carbon sources because they reduce supervision and management efforts. Adding PHBV had a similar function for improving water quality and producing less stress compared with the molasses-added treatments. Taken together, our results suggest that insoluble biodegradable polymers could be good alternatives for improving water quality and promoting production in intensive aquaculture systems.
5. Conclusions
The carbon sources-added group maintained water quality with reduced water exchange compared to the control. The dominant ammonia removal pathways changed after adding a carbon source, where the TAN concentration was mainly removed through heterotrophic bacterial assimilation, and nitrification was greatly inhibited after day 14. Moreover, this study confirmed the effects of adding carbon sources on bacterial community composition in culture tanks, and Leucothrix was closely related to molasses treated systems. Results from the present study also indicated that the environment of the molasses-added systems tended to be more stressful to shrimp as the relative abundance of several functions, such as biofilms formation and stress tolerance increased in the treatment. The relatively better shrimp performance and less stressful culture environment in the PHBV-added systems suggest that PHBV may be a better alternative as a carbon source in BFT systems.
Author Contributions
Conceptualization, methodology, and writing—original draft preparation, L.L. and Y.X.; writing—review and editing, L.L.; visualization, Y.X.; data curation, project administration, L.L., S.D. and X.T.; supervision, L.L., S.D., Q.G. and X.T.; data curation, project administration, Y.X.; funding acquisition, L.L., X.T. and S.D.; investigation, Y.X.; validation and resources, L.L. and X.T.; formal analysis: Y.X. All authors have read and agreed to the published version of the manuscript.
Funding
This research was funded by the National Key R&D Program of China (No. 2020YFD0900200 and No. 2017YFE0122100) and the Natural Science Foundation of Shandong Province, China (ZR2020MC194).
Institutional Review Board Statement
Not applicable.
Informed Consent Statement
Not applicable.
Data Availability Statement
The data from this study are available from the corresponding author upon reasonable request.
Conflicts of Interest
The authors declare no conflict of interest.
References
- Boyd, C.E.; McNevin, A.A. Land Use in Shrimp Aquaculture. World Aquacult. 2018, 49, 28–34. [Google Scholar]
- Haslun, J. Characterization of Bioflocs in a No Water Exchange Super-intensive System for the Production of Food Size Pacific White Shrimp Litopenaeus vannamei. Int. J. Aquac. 2012, 2, 29–38. [Google Scholar] [CrossRef]
- Li, Y.; Boyd, C.E. Laboratory tests of bacterial amendments for accelerating oxidation rates of ammonia, nitrite and organic matter in aquaculture pond water. Aquaculture 2016, 460, 45–58. [Google Scholar] [CrossRef]
- Abu Bakar, N.S.; Mohd Nasir, N.; Lananan, F.; Abdul Hamid, S.H.; Lam, S.S.; Jusoh, A. Optimization of C/N ratios for nutrient removal in aquaculture system culturing African catfish, (Clarias gariepinus) utilizing Bioflocs Technology. Int. Biodeterior. Biodegrad. 2015, 102, 100–106. [Google Scholar] [CrossRef]
- Azim, M.E.; Little, D.C. The biofloc technology (BFT) in indoor tanks: Water quality, biofloc composition, and growth and welfare of Nile tilapia (Oreochromis niloticus). Aquaculture 2008, 283, 29–35. [Google Scholar] [CrossRef]
- Ray, A.J.; Lotz, J.M. Comparing a chemoautotrophic-based biofloc system and three heterotrophic-based systems receiving different carbohydrate sources. Aquac. Eng. 2014, 63, 54–61. [Google Scholar] [CrossRef]
- Ebeling, J.M.; Timmons, M.B.; Bisogni, J.J. Engineering analysis of the stoichiometry of photoautotrophic, autotrophic, and heterotrophic removal of ammonia–nitrogen in aquaculture systems. Aquaculture 2006, 257, 346–358. [Google Scholar] [CrossRef] [Green Version]
- Xu, W.-J.; Morris, T.C.; Samocha, T.M. Effects of C/N ratio on biofloc development, water quality, and performance of Litopenaeus vannamei juveniles in a biofloc-based, high-density, zero-exchange, outdoor tank system. Aquaculture 2016, 453, 169–175. [Google Scholar] [CrossRef]
- Zhu, S.; Chen, S. Effects of organic carbon on nitrification rate in fixed film biofilters. Aquac. Eng. 2001, 25, 1–11. [Google Scholar] [CrossRef]
- Avnimelech, Y. Carbon nitrogen ratio as a control element in aquaculture systems. Aquaculture 1999, 176, 227–235. [Google Scholar] [CrossRef]
- Hargreaves, J.A. Photosynthetic suspended-growth systems in aquaculture. Aquac. Eng. 2006, 34, 344–363. [Google Scholar] [CrossRef]
- Hargreaves, J.A. Biofloc Production Systems for Aquaculture; Southern Regional Aquaculture Center Stoneville: Stoneville, MS, USA, 2013; Volume 4503, pp. 1–11. [Google Scholar]
- Ren, W.; Li, L.; Dong, S.; Tian, X.; Xue, Y. Effects of C/N ratio and light on ammonia nitrogen uptake in Litopenaeus vannamei culture tanks. Aquaculture 2019, 498, 123–131. [Google Scholar] [CrossRef]
- Qiu, T.; Xu, Y.; Gao, M.; Han, M.; Wang, X. Bacterial community dynamics in a biodenitrification reactor packed with polylactic acid/poly (3-hydroxybutyrate-co-3-hydroxyvalerate) blend as the carbon source and biofilm carrier. J. Biosci. Bioeng. 2017, 123, 606–612. [Google Scholar] [CrossRef] [PubMed]
- Wu, W.; Yang, L.; Wang, J. Denitrification performance and microbial diversity in a packed-bed bioreactor using PCL as carbon source and biofilm carrier. Appl. Microbiol. Biotechnol. 2013, 97, 2725–2733. [Google Scholar] [CrossRef] [PubMed]
- Schneider, O.; Sereti, V.; Eding, E.H.; Verreth, J.A.J. Molasses as C source for heterotrophic bacteria production on solid fish waste. Aquaculture 2006, 261, 1239–1248. [Google Scholar] [CrossRef]
- Fatimah, N.; Pande, G.S.J.; Natrah, F.M.I.; Meritha, W.W.; Widanarni; Sucipto, A.; Ekasari, J. The role of microbial quorum sensing on the characteristics and functionality of bioflocs in aquaculture systems. Aquaculture 2019, 504, 420–426. [Google Scholar] [CrossRef]
- Coyte, K.Z.; Schluter, J.; Foster, K.R. The ecology of the microbiome: Networks, competition, and stability. Science 2015, 350, 663–666. [Google Scholar] [CrossRef]
- Zhang, N.; Luo, G.; Tan, H.; Liu, W.; Hou, Z. Growth, digestive enzyme activity and welfare of tilapia (Oreochromis niloticus) reared in a biofloc-based system with poly-β-hydroxybutyric as a carbon source. Aquaculture 2016, 464, 710–717. [Google Scholar] [CrossRef]
- Kim, M.S.; Min, E.; Kim, J.H.; Koo, J.K.; Kang, J.C. Growth performance and immunological and antioxidant status of Chinese shrimp, Fennerpenaeus chinensis reared in bio-floc culture system using probiotics. Fish Shellfish Immunol. 2015, 47, 141–146. [Google Scholar] [CrossRef]
- Eaton, A. Standard Methods for the Examination of Water and WasteWater; AWWA: Washington DC, USA, 2005. [Google Scholar]
- Gilcreas, F.W. Standard methods for the examination of water and waste water. Am. J. Public Health Nations Health 1966, 56, 387–388. [Google Scholar] [CrossRef]
- Bratvold, D.; Browdy, C.L. Simple electrometric methods for estimating microbial activity in aquaculture ponds. Aquac. Eng. 1998, 19, 29–39. [Google Scholar] [CrossRef]
- Murray, M.G.; Thompson, W.F. Rapid isolation of high molecular weight plant DNA. Nucleic Acids Res. 1980, 8, 4321–4325. [Google Scholar] [CrossRef] [PubMed] [Green Version]
- Bolger, A.M.; Lohse, M.; Usadel, B. Trimmomatic: A flexible trimmer for Illumina sequence data. Bioinformatics 2014, 30, 2114–2120. [Google Scholar] [CrossRef] [PubMed] [Green Version]
- Martin, M. Cutadapt removes adapter sequences from high-throughput sequencing reads. EMBnet J. 2011, 17. [Google Scholar] [CrossRef]
- Edgar, R.C. UPARSE: Highly accurate OTU sequences from microbial amplicon reads. Nat. Methods 2013, 10, 996–998. [Google Scholar] [CrossRef] [PubMed]
- Haas, B.J.; Gevers, D.; Earl, A.M.; Feldgarden, M.; Ward, D.V.; Giannoukos, G.; Ciulla, D.; Tabbaa, D.; Highlander, S.K.; Sodergren, E.; et al. Chimeric 16S rRNA sequence formation and detection in Sanger and 454-pyrosequenced PCR amplicons. Genome Res. 2011, 21, 494–504. [Google Scholar] [CrossRef] [Green Version]
- Bolyen, E.; Rideout, J.R.; Dillon, M.R.; Bokulich, N.A.; Abnet, C.C.; Al-Ghalith, G.A.; Alexander, H.; Alm, E.J.; Arumugam, M.; Asnicar, F. Reproducible, interactive, scalable and extensible microbiome data science using QIIME 2. Nat. Biotechnol. 2019, 37, 852–857. [Google Scholar] [CrossRef]
- Segata, N.; Izard, J.; Waldron, L.; Gevers, D.; Miropolsky, L.; Garrett, W.S.; Huttenhower, C. Metagenomic biomarker discovery and explanation. Genome Biol. 2011, 12, R60. [Google Scholar] [CrossRef] [Green Version]
- Louca, S.; Parfrey, L.W.; Doebeli, M. Decoupling function and taxonomy in the global ocean microbiome. Science 2016, 353, 1272–1277. [Google Scholar] [CrossRef]
- Ward, T.; Larson, J.; Meulemans, J.; Hillmann, B.; Lynch, J.; Sidiropoulos, D.; Spear, J.R.; Caporaso, G.; Blekhman, R.; Knight, R.; et al. BugBase Predicts Organism Level Microbiome Phenotypes. BioRxiv 2017, 133462. [Google Scholar] [CrossRef]
- Schveitzer, R.; Arantes, R.; Costódio, P.F.S.; do Espírito Santo, C.M.; Arana, L.V.; Seiffert, W.Q.; Andreatta, E.R. Effect of different biofloc levels on microbial activity, water quality and performance of Litopenaeus vannamei in a tank system operated with no water exchange. Aquac. Eng. 2013, 56, 59–70. [Google Scholar] [CrossRef]
- Emilie, C.; Yannick, G.; Kevin, M.; Bénédicte, L.; David, P.; Fabien, P.; Florian, N.; Denis, S. Bacterial community characterization of water and intestine of the shrimp Litopenaeus stylirostrisin a biofloc system. BMC Microbiol. 2016, 16, 157. [Google Scholar] [CrossRef]
- Gerardi, M.H. Wastewater Bacteria; Wiley-Interscience: Hoboken, NJ, USA, 2006. [Google Scholar]
- Martínez-Córdova, L.R.; Vargas-Albores, F.; Garibay-Valdez, E.; Ortíz-Estrada, Á.M.; Porchas-Cornejo, M.A.; Lago-Lestón, A.; Martínez-Porchas, M. Amaranth and wheat grains tested as nucleation sites of microbial communities to produce bioflocs used for shrimp culture. Aquaculture 2018, 497, 503–509. [Google Scholar] [CrossRef]
- Yu, E.; Xie, J.; Wang, J.; Ako, H.; Wang, G.; Chen, Z.; Liu, Y. Surface-attached and suspended bacterial community structure as affected by C/N ratios: Relationship between bacteria and fish production. World J. Microbiol. Biotechnol. 2016, 32, 116. [Google Scholar] [CrossRef]
- Kirchman, D.L. The ecology of Cytophaga-Flavobacteria in aquatic environments. FEMS Microbiol. Ecol. 2002, 39, 91–100. [Google Scholar] [CrossRef]
- Woebken, D.; Fuchs, B.M.; Kuypers, M.M.; Amann, R. Potential interactions of particle-associated anammox bacteria with bacterial and archaeal partners in the Namibian upwelling system. Appl. Environ. Microbiol. 2007, 73, 4648–4657. [Google Scholar] [CrossRef] [Green Version]
- Yang, W.; Zhu, J.; Zheng, C.; Qiu, H.; Zheng, Z.; Lu, K. Succession of bacterioplankton community in intensive shrimp (Litopenaeus vannamei) aquaculture systems. Aquaculture 2018, 497, 200–213. [Google Scholar] [CrossRef]
- Miranda-Baeza, A.; Mariscal-López, M.d.l.A.; López-Elías, J.A.; Rivas-Vega, M.E.; Emerenciano, M.; Sánchez-Romero, A.; Esquer-Méndez, J.L. Effect of inoculation of the cyanobacteria Oscillatoria sp. on tilapia biofloc culture. Aquacult. Res. 2017, 48, 4725–4734. [Google Scholar] [CrossRef]
- Kim, Y.-S.; Kim, S.-E.; Kim, S.-J.; Jung, H.-K.; Park, J.; Jeon, Y.J.; Kim, D.-H.; Kang, J.-H.; Kim, K.-H. Effects of wheat flour and culture period on bacterial community composition in digestive tracts of Litopenaeus vannamei and rearing water in biofloc aquaculture system. Aquaculture 2021, 531, 735908. [Google Scholar] [CrossRef]
- Goffredi, S.K. Indigenous ectosymbiotic bacteria associated with diverse hydrothermal vent invertebrates. Environ. Microbiol. Rep. 2010, 2, 479–488. [Google Scholar] [CrossRef]
- Hansen, G.H.; Olafsen, J.A. Bacterial Interactions in Early Life Stages of Marine Cold Water Fish. Microb. Ecol. 1999, 38, 1–26. [Google Scholar] [CrossRef] [PubMed]
- Gutiérrez-Salazar, G.J.; Molina-Garza, Z.J.; Hernández-Acosta, M.; García-Salas, J.A.; Mercado-Hernández, R.; Galaviz-Silva, L. Pathogens in Pacific white shrimp (Litopenaeus vannamei Boone, 1931) and their relationship with physicochemical parameters in three different culture systems in Tamaulipas, Mexico. Aquaculture 2011, 321, 34–40. [Google Scholar] [CrossRef]
- Barcenal, A.; Traifalgar, R.; Jr, V. Anti-Vibrio harveyi Property of Micrococcus luteus Isolated from Rearing Water under Biofloc Technology Culture System. Curr. Res. Bacteriol. 2015, 8, 26–33. [Google Scholar] [CrossRef] [Green Version]
- Dias Schleder, D.; Jatobá, A.; Silva, B.; Ferro, D.; Seiffert, W.; do Nascimento Vieira, F. Soybean protein concentrate in Pacific white shrimp reared in bioflocs: Effect on health and vibrio challenge. Acta Sci. Anim. Sci. 2018, 40, 1–6. [Google Scholar] [CrossRef]
- Jiang, W.; Ren, W.; Li, L.; Dong, S.; Tian, X. Light and carbon sources addition alter microbial community in biofloc-based Litopenaeus vannamei culture systems. Aquaculture 2020, 515, 734572. [Google Scholar] [CrossRef]
- Zhang, H.; Sun, Z.L.; Liu, B.; Xuan, Y.M.; Jiang, M.; Pan, Y.S.; Zhang, Y.M.; Gong, Y.P.; Lu, X.P.; Yu, D.S.; et al. Dynamic changes of microbial communities in Litopenaeus vannamei cultures and the effects of environmental factors. Aquaculture 2016, 455, 97–108. [Google Scholar] [CrossRef]
- Li, J.; Li, F.; Yu, S.; Qin, S.; Wang, G. Impacts of mariculture on the diversity of bacterial communities within intertidal sediments in the Northeast of China. Microb. Ecol. 2013, 66, 861–870. [Google Scholar] [CrossRef]
- Bunse, C.; Pinhassi, J. Marine Bacterioplankton Seasonal Succession Dynamics. Trends Microbiol. 2017, 25, 494–505. [Google Scholar] [CrossRef] [Green Version]
- Lara, G.; Furtado, P.; Hostins, B.; Poersch, L.; Wasielesky Jr, W. Addition of sodium nitrite and biofilm in a Litopenaeus vannamei biofloc culture system. Lat. Am. J. Aquat. Res. 2016, 44, 760–768. [Google Scholar] [CrossRef]
- Xue, Y.; Wei, F.; Jiang, Y.; Li, L.; Dong, S.; Tian, X. Transcriptome signatures of the Pacific white shrimp Litopenaeus vannamei hepatopancreas in response to stress in biofloc culture systems. Fish Shellfish Immunol. 2019, 91, 369–375. [Google Scholar] [CrossRef]
- Emerenciano, M.G.C.; Martínez-Córdova, L.R.; Martínez-Porchas, M.; Miranda-Baeza, A. Biofloc technology (BFT): A tool for water quality management in aquaculture. Water Qual. 2017, 5, 92–109. [Google Scholar] [CrossRef] [Green Version]
- Deng, M.; Chen, J.; Hou, J.; Li, D.; He, X. The effect of different carbon sources on water quality, microbial community and structure of biofloc systems. Aquaculture 2017, 482. [Google Scholar] [CrossRef]
- Wang, G.J.; Yu, E.M.; Xie, J.; Yu, D.G.; Li, Z.F.; Luo, W.; Qiu, L.J.; Zheng, Z.L. Effect of C/N ratio on water quality in zero-water exchange tanks and the biofloc supplementation in feed on the growth performance of crucian carp, Carassius auratus. Aquaculture 2015, 443, 98–104. [Google Scholar] [CrossRef]
- Wei, Y.; Liao, S.-A.; Wang, A.-l. The effect of different carbon sources on the nutritional composition, microbial community and structure of bioflocs. Aquaculture 2016, 465, 88–93. [Google Scholar] [CrossRef]
- Avnimelech, Y. Biofloc Technology: A Practical Guide Book; The World Aquaculture Society: Baton Rouge, LA, USA, 2012; pp. 73–91. [Google Scholar]
- Avnimelech, Y. Feeding with microbial flocs by tilapia in minimal discharge bio-flocs technology ponds. Aquaculture 2007, 264, 140–147. [Google Scholar] [CrossRef]
- Ahmad, I.; Rani, A.M.B.; Verma, A.K.; Maqsood, M. Biofloc technology: An emerging avenue in aquatic animal healthcare and nutrition. Aquacult. Int. 2017, 25, 1215–1226. [Google Scholar] [CrossRef] [Green Version]
- Boley, A.; Muller, W.R.; Haider, G. Biodegradable polymers as solid substrate and biofilm carrier for denitrification in recirculated aquaculture systems. Aquac. Eng. 2000, 22, 75–85. [Google Scholar] [CrossRef]
Figure 1.
Fluctuations of (a) total ammonia nitrogen (TAN), (b) NO2−-N, (c) NO3−-N and (d) total nitrogen (TN) during the period of the experiment. CW, M-BF and P-BF represented the three systems of this study. Values are mean ± standard deviation of three replications on each sampling day.
Figure 1.
Fluctuations of (a) total ammonia nitrogen (TAN), (b) NO2−-N, (c) NO3−-N and (d) total nitrogen (TN) during the period of the experiment. CW, M-BF and P-BF represented the three systems of this study. Values are mean ± standard deviation of three replications on each sampling day.

Figure 2.
Nitrification rate during the period of the experiment. CW, M-BF and P-BF represented the three systems of this study. Values are mean ± standard deviations of three replications on each sampling day.
Figure 2.
Nitrification rate during the period of the experiment. CW, M-BF and P-BF represented the three systems of this study. Values are mean ± standard deviations of three replications on each sampling day.

Figure 3.
Bacterial community compositions and abundance at phyla (a) and genus (b) levels across all samples. The Analysis of Variance (ANOVA) shows the top 20 phyla (c) and genera (d) with the smallest p-value among treatments. *, p < 0.05; **, p < 0.01. CW, M-BF and P-BF represented the three systems of this study.

Figure 4.
Linear discriminant analysis effect size (LEfSe) analysis showing the abundance of three treatments. (a) LEfSe analysis identified the most differentially abundant taxa among three systems. The six rings of the cladogram stand for domain (innermost) phylum, class, order, family, and genus. (b) Linear discriminant analysis score of the three systems with a threshold value of 3.5. CW, M-BF and P-BF represented the three systems of this study.

Figure 5.
Redundancy analysis (RDA) identified the correlation of different treatments, bacterial communities, and environmental factors. Biofloc: biofloc volume; TN: total nitrogen; TAN: total ammonia nitrogen; TA: total alkalinity; Chl: chlorophyll a; TOC: total organic carbon. Details of all environmental factors were shown in Table 1. CW, M-BF and P-BF represented the three systems of this study.

Figure 6.
Functional prediction in different environments. (a) The predicted functions using FAPROTAX among different treatments. (b–d) Pairwise comparisons of functions between the three systems according to BugBase. The left part of each figure shows the mean proportion of two systems in different functions. The right part of each figure shows the difference between proportions. CW, M-BF and P-BF represented the three systems of this study.


Table 1.
The mean and standard deviations of water quality parameters in the three systems during the experiment.
Table 1.
The mean and standard deviations of water quality parameters in the three systems during the experiment.
| Parameters | CW | M-BF | P-BF |
|---|---|---|---|
| Temperature (°C) | 25.5 ± 1.56 a | 25.5 ± 1.56 a | 25.5 ± 1.56 a |
| DO (mg L−1) | 5.27 ± 0.74 a | 4.83 ± 0.88 a | 4.95 ± 0.84 a |
| pH | 7.7 ± 0.08 a | 7.1 ± 0.07 c | 7.4 ± 0.05 b |
| TA (mg L−1 CaCO3) | 102.67 ± 0.44 a | 81.69 ± 4.98 b | 86.14 ± 1.81 b |
| TOC (mg L−1) | 10.65 ± 3.29 c | 27.01 ± 2.93 a | 18.95 ± 3.15 b |
| Biofloc volume (mL L−1) | 0.00 ± 0.00 b | 3.35 ± 1.10 a | 0.00 ± 0.00 b |
| Chl (mg L−1) | 13.55 ± 1.19 a | 10.48 ± 2.11 a | 3.95 ± 0.57 b |
| TAN ((mg L−1) | 0.13 ± 0.16 a | 0.17 ± 0.04 a | 0.23 ± 0.05 a |
| NO2−-N (mg L−1) | 0.82 ± 0.26 c | 6.44 ± 1.70 a | 3.38 ± 0.49 b |
| NO3−-N (mg L−1) | 0.94 ± 0.09 c | 4.51 ± 0.90 a | 2.79 ± 0.20 b |
| TN (mg L−1) | 5.69 ± 0.30 c | 13.65 ± 0.58 a | 9.75 ± 0.39 b |
| Nitrification rate (mg L−1 h−1) | 0.39 ± 0.06 a | 0.10±0.02 b | 0.12±0.01 b |
CW, M-BF and P-BF represented the three systems of this study. TA: total alkalinity; TOC: total organic carbon; Chl: chlorophyll a; TAN: total ammonia nitrogen; TN: total nitrogen. In each row, different superscript letters indicate significant differences at the p < 0.05 level (one-way ANOVA and Tukey’s test).
Table 2.
Growth parameters and survival of Litopenaeus vannamei of different experimental systems at the end of the 34-d trial.
Table 2.
Growth parameters and survival of Litopenaeus vannamei of different experimental systems at the end of the 34-d trial.
| Parameters | CW | M-BF | P-BF |
|---|---|---|---|
| final weight | 5.17 ± 0.81 b | 6.94 ± 1.17 ab | 8.04 ± 0.94 a |
| Specific growth rate (%/day) | 1.84 ± 0.00 b | 2.67 ± 0.00 ab | 3.11 ± 0.00 a |
| Growth rate (g/wk) | 0.49 ± 0.16 b | 0.85 ± 0.23 ab | 1.07 ± 0.19 a |
| Feed conversion ratio (kg/kg) | 1.95 ± 0.54 a | 1.12 ± 0.30 b | 0.86 ± 0.17 b |
| Survival rate (%) | 28.33 ± 0.04 b | 45.56 ± 0.11 ab | 61.11 ± 0.29 a |
Data are presented as mean ± standard deviation (n = 3). CW, M-BF and P-BF represented the three systems of this study. In each row, different superscript letters indicate significant differences at the p < 0.05 level (one-way ANOVA and Tukey’s test).
Publisher’s Note: MDPI stays neutral with regard to jurisdictional claims in published maps and institutional affiliations. |
© 2021 by the authors. Licensee MDPI, Basel, Switzerland. This article is an open access article distributed under the terms and conditions of the Creative Commons Attribution (CC BY) license (https://creativecommons.org/licenses/by/4.0/).
Share and Cite
MDPI and ACS Style
Xue, Y.; Li, L.; Dong, S.; Gao, Q.; Tian, X. The Effects of Different Carbon Sources on the Production Environment and Breeding Parameters of Litopenaeus vannamei. Water 2021, 13, 3584. https://doi.org/10.3390/w13243584
AMA Style
Xue Y, Li L, Dong S, Gao Q, Tian X. The Effects of Different Carbon Sources on the Production Environment and Breeding Parameters of Litopenaeus vannamei. Water. 2021; 13(24):3584. https://doi.org/10.3390/w13243584
Chicago/Turabian StyleXue, Yiming, Li Li, Shuanglin Dong, Qinfeng Gao, and Xiangli Tian. 2021. "The Effects of Different Carbon Sources on the Production Environment and Breeding Parameters of Litopenaeus vannamei" Water 13, no. 24: 3584. https://doi.org/10.3390/w13243584
Note that from the first issue of 2016, this journal uses article numbers instead of page numbers. See further details here.