
Water-Energy-Food Accessibility and Tracking Progress towards Achieving Sustainable Development Goals in the Savannah Region of Katsina State, Nigeria


1
Division of Water Resources Engineering, Department of Building and Environmental Technology, Faculty of Engineering, Lund University, P.O. Box 118, 221 00 Lund, Sweden
2
Department of Civil Engineering Science, School of Civil Engineering and the Built Environment, University of Johannesburg, Kingsway Campus, P.O. Box 524, Aukland Park, Johannesburg 2006, South Africa
3
Department of Town Planning, Engineering Networks and Systems, South Ural State University, 76, Lenin Prospekt, 454080 Chelyabinsk, Russia
4
Institute of Environmental Engineering, Wroclaw University of Environmental and Life Sciences, ul. Norwida 25, 50-375 Wrocław, Poland
*
Author to whom correspondence should be addressed.
Water 2021, 13(24), 3595; https://doi.org/10.3390/w13243595
Submission received: 27 October 2021
/
Revised: 30 November 2021
/
Accepted: 9 December 2021
/
Published: 14 December 2021
(This article belongs to the Section Water-Energy Nexus)
Abstract
:Although remarkable progress has been achieved in reducing hunger and poverty and improving people’s health in the past couple of decades, humanity still faces considerable socio-economic and sustainability challenges. Ensuring sustainable access to safe and sufficient water, improved sanitation facilities, clean energy sources and healthy food is a necessary requirement for ending hunger and poverty, advancing health and achieving all the goals of the sustainable development agenda. Socio-economic variables are determinant factors of water, energy and food accessibility. Ecological region, income and education are measures used in this study, which aims to examine a pairwise comparison of water and energy sources, sanitation facilities and food accessibilities in six sampling communities and tracking progress towards achieving the sustainable development goals (SDG) at a local scale using nine specific SDG indicators. A study involving questionnaire administration covering 1785 households across the three ecological regions of Katsina state was performed. Two communities representing urban and rural households from each of the ecological regions were selected. An analysis of variance was used to test the equality of resource accessibility across the investigated communities followed up by a post hoc analysis to identify significant mean groups. The results showed that the overall access level to safely manage water and sanitation facilities were 16.5% and 28.1%, respectively. Access indices of 1.83 and 1.24 for electricity and cooking fuel, respectively, were calculated in the study area. The study revealed that location, education and income are the key drivers of water, energy and food access and choice.
1. Introduction
The SDG are comprehensive international guidelines that are adopted by the United Nations member states aiming to move the world towards a more sustainable future, balancing economic growth, social development and environmental protection [1,2]. The SDG can be viewed as a successor to the millennium development goals and are set to be achieved by 2030. Each of the 17 goals has well-defined targets; for instance, goal 2 is about ending hunger, achieving food security, improving nutrition and promoting sustainable agriculture. Goals 6 and 7 are concerned with security in terms of water and energy, respectively. All goals are interlinked, and progress to one goal is best achieved in conjunction with progress towards others [3]. The achievement of the SDG is particularly relevant to low- and middle-income countries (LMIC) such as Nigeria, where more progress towards meeting these goals is necessary.
The water-energy-food nexus is being promoted as a conceptual tool for achieving sustainable development. The nexus addresses the connections between these three resource sectors and deals with their potential conflicts, synergies, trade-offs and resource-use efficiencies that arise from how they are managed. These three resources have long been recognised as essential to human life and socio-economic progress. The nexus approach perspectives emphasise the multiple inter-reliance among water, energy and food security and the underlying natural resources. It also stresses the need to adopt a socio-ecological perspective and the need for a conceptual framework connecting water, energy and food to sustainable development [4,5,6,7]. Everyone has the right to good quality water, clean energy and healthy food to support active and healthy lives. However, these crucial resources are under pressure. With the current world population at over 7 billion inhabitants, it has been reported that 900 million people live without access to clean drinking water, 2.7 billion live without access to proper sanitation, 1.3 billion live without electricity and 1.02 billion are undernourished [8,9]. Population growth, urbanisation, economic prosperity and climate change are considered as major driving factors for the global increase in demand for water, energy and food [8,9,10]. Increased urbanisation and a high population growth rate put additional pressure on the resources in sub-Saharan Africa to meet the basic demand of the population in the region [8,9,10]. The water-energy-food nexus is being endorsed as central to achieving sustainable development [8].
Due to their interdependencies, potential conflicts, synergies and trades-off among the various systems of water, energy and food have raised the corresponding nexus to prominence in development. New policy frameworks for addressing the scarcities and sustainability of water, energy and food are required [11,12,13,14]. Even though general awareness concerning the water-energy-food nexus approach has increased over the past decades, there is minimal attention on the nexus at household scale [15,16,17]. Even when there were attempts to investigate the nexus at the household level, the focus was often only on one or two elements of the nexus [17]. For example, the water and energy nexus has been studied in the Beijing-Tiajin-Hebei region of China [18,19].
In addition, Zouh et al. and Viera et al. [19,20] investigated single elements of the nexus. For instance, Vieira et al. [19] appraised the effectiveness of household water consumption. Furthermore, they related household water efficiency to socio-demographic variables. Vieira et al. [19] studied water related to energy use in low-income households of Brazil. They focused on the water sector’s sustainability, which is principally connected to the decrease of waste matters generated in centralised systems. They further suggested that to lessen the impacts associated with a rise in energy consumption in the water sector, a reduction in the production of household effluents should be implemented.
The nature of climatic regions play an important role in access to water, energy and food. For instance, rainfall determines the most significant meteorological trend on earth for natural and human life [21]. The variability in the amount of rainfall has resulted in prevalent droughts in the central Maghreb nations [22], causing a substantial challenge to the availability and accessibility of water and food resources [23,24,25]. Rainfall is linked to global climate change. Thus, the analysis of rainfall at various spatial-temporal scales is crucial [26]. It is evident that climate has a wide range of impacts on natural resources including freshwater ecosystems, household energy and food resources [27,28]. It has been reported that the less-privileged developing regions of the world, especially rural communities, are the most exposed ones to severe impacts of climate change [26].
The impact of variability in household socio-economic and demographic characteristics on water, energy and food accessibility are widely addressed in various studies [29,30,31]. In addition, Phoebe and Lydia [32] identified the impact of climate as the main driver for physical access to water, energy and food. Furthermore, previous studies highlighted the relationship between rainfall variability as well as water demand and quality. Calow et al. [33] and Friel et al. [34] revealed that during drought seasons access to good quality water and healthy food can be crucial due to availability and accessibility challenges. Several studies [35,36,37,38] on the impact of rainfall variability on water and food resources have been carried out. A solid connection between socio-economic and ecological characteristics with regards to water, energy and food accessibilities is still lacking.
The availability of water, energy (biomass) and food is strongly dependent on the amount of rain. Furthermore, water, energy and food supplies at household level depend on the sources and quantity, which directly depend on rainfall variability and its spatial-temporal processes that comprise rainfall time, duration and location. There is insufficient evidence signifying the extent of the impact of socio-ecological water, energy and food accessibilities. The water-energy-food nexus perspective draws awareness to the need to implement socio-ecological perspectives, and the need for a broad conceptual framework linking the water-energy-food nexus to larger sustainable development issues.
The aim of this study is to analyse water, energy and food accessibility across the three ecological case study regions (isohyets) connected to socio-economic variables and progress towards the achievement of the relevant SDG in an example case study (Katsina state, northern Nigeria). Findings were compared with global indicators, where possible. This comparison will help to identify data gaps and areas for potential research and development, as well as stimulate discussions about the types of data required for SDG targets and index computation for other sub-Saharan regions with similar socio-ecological characteristics.
This research paper is structured as follows: after a brief introduction and a review of the scientific literature concerning the nexus and its relation to sustainable development in Section 1, Section 2 is dedicated to the research methodology, and it covers a full description of the materials and methods used to conduct the research, which involves the study area description, conceptual model, selection of the studied communities data and statistical analysis. Section 3 is dedicated to the research findings, and it highlights results on the socio-economic characteristics of the household heads, access to household water sources, sanitation facilities as well as energy and food items. Moreover, findings were used to assess specific indicators towards achieving the SDG at a local scale. Finally, Section 4 concludes the main research findings and highlights the relevance of this paper.
2. Materials and Methods
2.1. Study Area
The study was conducted in Katsina state, which is located in the north-western part of Nigeria between latitude 11°08′ N and 13°22′, and longitude 6°52′ E and 9°20′ E. It covers an area of approximately 24,000 km2. The state shares political boundaries with Kaduna state to the south, Jigawa and Kano states to the east, Zamfara state to the west and the Republic of Niger to the north [39].
On the basis of seasonality, the state is classified into two different climatic zones, tropical continental and semi-arid continental. The state experiences a hot dry season from March to May and a warm wet season from June to September. A less distinct season is identified by decreasing rainfall and a gradual decline in temperature during the months of October and November. The months of December to February are characterised by a cold dry season, which is popularly referred to as the harmattan.
Furthermore, based on the longitudinal pattern of rainfall influence, the state is categorised into three extensive rainfall regions. These isohyets match up with the three existing ecological regions of the Guinea, Sudan and Sahel savannah regions in the south, central and north, respectively [40]. Figure 1a shows Africa comprising Nigeria including Katsina state; Figure 1b shows six investigated communities across the three different ecological (rainfall) regions in the state. The southern region of the state receives rainfall in the region of above 900 mm, while the central and northern regions receive between 700 and 900 mm, and below 700 mm, respectively.
The state population projected data issued by the National Population Commission indicated that the total population for the year 2019 was about 8,613,100, out of which 4,565,000 (53%) and 4,048,100 (47%) are located in rural and urban communities, respectively.
The study was carried out in six sampling communities located in Katsina state (Figure 1), which were selected based on urban and rural criteria. The urban communities surveyed across the respective isohyets of the northern, central and southern regions were Katsina, Dutsinma and Funtua, and the corresponding rural communities surveyed were Dan-Yashe, Kaikai and Kuringafa. These communities are characterised below.
Katsina: The community of Katsina is based in one of the ancient cities of Hausaland, emerging in the 15th century. The ancient city is the administrative and commercial capital and the largest settlement of the state. It has a heterogeneous setting of mixed formal and informal (traditional African) settlement settings. In contrast to the traditional settlements, the formal settlement is well-planned and accessible. The residents are connected to electricity and a piped water supply, and they have access to basic sanitation facilities.
Dutsinma and Funtua: Both settlements are local government and zonal administrative headquarters of the Katsina state. Furthermore, Funtua is the second largest urban community and commercial centre after urban Katsina. Politically, it is also a southern senatorial zone of the state. These two urban communities are similar to urban Katsina in terms of settlement patterns. They are also characterised by a mixture of traditional African and formal (modern) settings. Both Dutsinma and Funtua urban communities are connected to the national electricity grid. Zobe and Mairuwa are multi-purpose dams constructed in the respective central and southern isohyets to supply water for various uses. Therefore, both settlements are connected to the water supply systems and have access to various sanitation facilities.
Dan-Yashe, Kaikai and Kuringafa: These three communities are typical rural African communities. They are characterised by lower population densities compared to urban communities. In addition, the communities are unplanned and without adequate energy, water and sanitation facilities.
The map of the study area showing the sampling communities was obtained through a cartographical analysis and geographical information system investigations. Global positioning system coordinates of the sampling communities were recorded during the field survey and incorporated into the existing digital map database available at the Geographical Information System and Remote Sensing Unit of the Department of Geography at Umaru Musa Yarádua University.
2.2. Conceptual Model
The study attempted to uncover several layers of influence which determine accessibility to various water and energy sources, sanitation facilities and food resources. The socio-ecological model (Figure 2) illustrates these various layers.
The model is constructed of four inter-related characteristics: individual household as well as socio-economic, physical and political environments. Socio-ecological parameters are not the only dominant ones, but they intersect with all of the other layers of influence; for example, the effects of location on urban–rural dichotomy influence access to household resources across the communities. Hence, it is constructed in accordance with the nexus perspective, which also draws attention to the need to adopt an integrated landscape or socio-ecological perspective, and the need for a broad conceptual framework linking the water-energy-food nexus to the larger sustainable development agenda.
The model helps to assess the role of various parameters related to different water and energy sources, sanitation facilities and food access at various households in the sampling communities. It also demonstrates the vital role of physical environment, political environment and the socio-economic (income and education level) characteristics of the household’s heads as determinant factors of water, sanitation, energy and food accessibility at household scale.
In the natural environment, there is a strong linkage among water, energy and food. Water is fundamental for agriculture, and consequently food production, and certainly for the functioning of all terrestrial ecosystems including biomass production and other agricultural ecosystems. Insufficient amounts or variability in the availability of water has severe impacts on agricultural yields and vegetation cover (biomass). Thus, climatic (isohyets) regions of the world with an inadequate amount of water and with a large number of poor people also face the most serious challenges in terms of the availability of water for food production, biomass burning and other household usages.
The political environment plays a leading role in the control and regulation of water, energy and food production in the region. It also provides an institutional and legal framework, which contains the rules, regulations, laws and the role of the public and private sectors in terms of water, energy and food supplies. Moreover, in order to maintain a sustainable access to good quality water, clean energy and healthy food, a sound socio-economic infrastructure is crucial. Thus, governments have to invest huge amounts of resources for the development of overhead capital including power, energy, agricultural inputs and transportation facilities.
An urban household usually has access to improved water sources, improved sanitation facilities, clean cooking fuels and secure food sources, in contrast to their rural counterparts. Similarly, a highly educated household is likely to earn more income than a household characterised by members with a low education level. Thus, an educated household is more likely to consume safe and sufficient water from the improved sources, has access to enhanced sanitation facilities and benefits from clean cooking energy and healthy food.
2.3. Selection of the Studied Communities
A qualitative research design was conducted across six communities in Katsina state, Nigeria. A stratified random sampling method was used to get a full and clear representation of the state, which was stratified into regions based on three existing rainfall zones (i.e., the southern, central and the northern zones). Furthermore, each region was further stratified into rural and urban communities in accordance with the Katsina State Urban and Regional Planning Board guidelines [41], which stratified the whole state into urban and rural areas. One settlement was selected from each sub-stratum representing urban and rural areas in the study area. The sample size of 1785 households was determined adopting a method by Israel [42] at a 95% confidence level (see Table 1).
Due to unavailable data on the number of households in the study area, an average of six persons per household was assumed according to the Katsina state Primary Health Care Development Agency [43] estimations based on their routine immunisation programmes. A purposive (non-probability) sampling method was used in selecting households for the administration of questionnaires in the sampling communities. The estimated 2019 population figures were obtained from the National Population Commission, Katsina state.
2.4. Data Collection
Primary and secondary data sources were used for this study. The primary data were produced through the administration of structured and pre-tested questionnaires. The English version of the questionnaire was adapted and translated into Hausa, which is the regional language. The questionnaires were administered in person by 16 field assistants, who are familiar with Hausa and the sampling communities, in addition to receiving training in questionnaire administration. Furthermore, all interviews and discussions were conducted in Hausa. The questionnaire design and guidance for interviews followed common standards in terms of sections on household, characteristics, composition and socio-economic status [44]. The questionnaire is available as Supplementary Material SM1.
Data were collected over a period of two months (July and August 2019). The number of houses investigated was a reflection of the estimated sample size in each investigated community. Katsina (north-urban), which had 22.4% of the sampled households, was linked to 400 copies of questionnaires. Dan-Yashe (north-rural), which had 13.6% of the sampled households, received 242 copies of questionnaires. Dutsinma (central-urban), representing 21.8% of the sampled households, obtained 390 copies of questionnaires. Kaikai (central-rural) had 7.5% of the sampled households, representing 134 copies of questionnaires. Funtua (south-urban) had 22.2% of the sampled households (397 copies of questionnaires). Finally, Kuringafa (south-rural), which represents 12.4% of the sampled households, had 222 copies of questionnaires. At the end of the exercise, 1785 copies of questionnaires were served to the household heads in Katsina state.
2.5. Statistical Analysis
The data were analysed using IBM SPSS version 24. In order to determine the proportion of the households’ accessibility level regarding food purchase frequencies as well as water and energy sources, descriptive statistics were computed. The relationship between household educational status and monthly income was assessed using the Pearson Product Moment Correlation (PPMC) coefficient r. A one-way analysis of variance was used to determine if there were any differences in the mean amount of water sources, sanitation facilities, energy sources and food purchase frequencies across the six sampling communities. After rejection of the hypothesis of equality, significant group means (pair-wise) of water, energy and food accessibility levels across the six sampling communities were compared with each other. A post hoc analysis using Duncan’s method for α = 0.05 was applied using pairwise comparisons of water, sanitation, energy and food access across the sampling communities.
In addition, the information captured by the multi-tier matrix was compiled into a single number representing the level of access to electricity and cooking fuels in a study area. A simple index was calculated by weighting the tiers and arriving at a weighted average. Equation (1) showing the index of access to electricity supply and cooking fuels was applied [45].
where PT represents the proportion of households at tier T with tier number {0,1,2,3,4,5}.
Index = ∑ (PT × T)
2.6. Study Variables
The key variables for the study area were access to household water source, sanitation facilities, energy (cooking fuel) source and access to households’ food resources. Each household in the respective urban and rural communities across the isohyets was investigated regarding access to the various water and energy sources as well as sanitation facilities. Water sources and sanitation facilities were classified into improved and unimproved sources based on Joint Monitoring Programme (JMP) categorisation [46] and energy access was classified according to WHO [47]. Food access frequency was grouped according to Frongillo and Gittelsohn [48,49]. Table 2 shows from the bottom to the top a progressive improvement in terms of resource security.
Furthermore, to determine the water service access level, water quality tests were performed using the standard JMP portable kit for Escherichia coli as described by [46]. The water testing quality was carried out in 20% of the surveyed households and was tested proportionate to their accessibility to various water sources. The testing was carried out in collaboration with the Water Laboratory, Department of Geography, Umaru Musa Yarádua University.
A multi-tier framework [45,50,51] was adopted to measure the proportion of the households’ access level to electricity and cooking energy. The Multi-Tier Framework (MTF) of the Global Traffic Framework (GTF) was developed to address the limitations of a binary energy access tool whereby a household was either categorised as having access or not [48,49]. The framework measures the level of electricity access and usage on the basis of these indicators: peak capacity, duration, reliability, quality, affordability, health and environmental safety. To measure cooking energy access, the framework was designed to analyse data in multiple dimensions of access and consists of six equal attributes: exposure and efficiency formed the two technical attributes while the other four contextual attributes capture the user’s experience in terms of convenience, affordability, safety and reliability. In order to measure progress, each attribute has six tiers ranging from 0 to 5, designated as no access, very low access, low access, limited access, high access and very high access, respectively. The method for assessing cooking energy with an overall tier rating is designed to be technology and fuel neutral, while reflecting the broad range of cooking solutions. Cooking solutions in the household are assessed based on the combination of six attributes of energy across six tiers (0–5), starting with access to basic solutions and increasing gradually to modern cooking solutions that deliver the highest results for all attributes. Each attribute is assessed independently and the overall tier for a household’s access to cooking solutions is obtained by summing-up the entire index of the six attributes using Equation (1).
In addition, to assess household food security, food purchase frequency was used to determine food poverty linked to purchasing power. The following socio-ecological factors were considered in this study: ecological (isohyets) and social (rural/urban) location of the residence as well as the income and education level of the household’s head.
Moreover, local progress towards SDG achievement was compared with the global indicator framework. Using data from the study, the global indicator framework for the SDG was applied to calculate indicators for the study area cumulatively. Responses to questionnaires, which aligned with SDG indicators were used to calculate a specific index. Where responses matched SDG indices, a direct comparison was possible. This was mostly the case for relative indices, e.g., the percentage of population living below the international poverty line, proportion of population using safely managed drinking water services and proportion of population with access to electricity among others.
3. Results
3.1. Socio-Economic Characteristics of the Households’ Heads
In total, 1785 households were surveyed across the six studied communities of Katsina state. The main socio-economic characteristics of the respondents are based on the frequency analysis shown in Table 3. In all communities, more than half of the respondents were from urban communities (66%). Only 34.5% of the respondents were from rural communities. An advanced university degree was the highest level of education found only in the urban communities. The highest percentage of advanced degrees was 17.3% in the northern urban areas and the lowest was 5.9% in the central urban areas. The majority of household heads that had no formal education were also found in the rural communities. The northern rural community was found to have the highest percentage (80.1%) of respondents with no formal education and the lowest percentage (61.9%) was found in the central rural community. The majority of the high-income earning household heads were located in urban communities across the isohyets. The highest proportion of household heads that earned above N180,000 ($500) were found in the northern urban community. The highest percentage (72.3%) of low-income earning household heads (<N18,000 ($50)) was linked to the northern rural region.
Table 4 indicates the association between household head income and educational level. The PPMC was calculated to determine the direction and strength of association between the variables. At the community level, the table revealed stronger associations between household head income and educational level in the urban communities. The highest r value was found for Katsina (northern urban region) and the lowest one for Kaikai (central rural region) with the respective values of 0.782 and 0.238. Generally, the PPMC results indicated strong associations between household head educational status and monthly income across the urban communities. The table also revealed weak associations across the rural investigated communities.
3.1.1. Access to Household Water Sources
Table 5 indicates access to various water sources, which include piped water into a dwelling, piped water to a yard, public tap (standpipe), private borehole, public borehole, protected dug well, unprotected dug well, water vendor, surface water and tanker truck (fuel truck or tanker) for different households across the six investigated communities. Overall, the use of water vendors and public boreholes are recorded across the six areas.
Access to a water vendor has dramatically decreased in six sampling communities from the northern to the southern isohyets. The highest proportion of water vendor users was found in the Dan-Yashe (northern rural area) community at 44.6% followed by Kaikai (central rural area) at 41.1%, and the lowest proportion was found at 3.2% in the Kuringafa (southern rural) community. Access to a water vendor followed a similar pattern for the rural communities. In the urban communities, Katsina (northern urban area) was associated with 40.2%, followed by Dutsinma (central urban area) at 34.1% and 18.1% for Funtua (urban south). Accessibilities to two different types of boreholes (public and private) were found in the study. The highest accessibility level to a public borehole was found in the rural south at 23.4% and the lowest one was found in northern rural areas at 7.5%. Access to a private borehole was only recorded in urban communities across the three isohyets and in the rural south. The highest proportion of private borehole access was found at 35.8% in the urban north and the lowest one at 0.4% in the southern rural region. Among the ten different water sources that were utilised in the sampling communities, utilisation of piped water into dwellings, piped water to yard and public tap were recorded at the lowest utilisation level. Piped water into a dwelling and piped water to a yard were found in two urban communities. Piped water into a dwelling was found at 6.5% and 1.7% for the urban north and urban south, respectively. Proportions of 0.2% and 6.8% of piped water to yard were found in the urban north and urban south, respectively. About 1.8% of public tap supply was only recorded in the urban community of the north. Similarly, surface water source access was only recorded in the southern rural community at 31.1%. Significant proportions of tanker truck utilisation were found in the sampling communities with the exception of southern rural communities. The highest figures were recorded at 40.5% in the northern rural area, while the lowest proportion of access to tanker trucks was recorded at 2.8% in the urban north.
Similarly, two types of dug wells were accessed at various households across the sampling communities. Unprotected dug wells were utilised in all six communities, where the highest accessibility level was recorded in the rural south at 28.8% and the lowest level was found at 0.2% in the urban north. While the protected dug well was used in all communities (except in the rural north), the highest proportion of users was found in southern rural areas at 13.1% and a rather low proportion was recorded at 5.0% for the northern urban communities.
Generally, the study revealed that 39.3% of the households have access to various improved water sources in contrast to the 60.7% that lack access to improved sources. In addition to the design nature and construction of water sources, having a potential of delivering safe drinking water in line with JMP [46], the investigated households using the water sources were subdivided into these three groups: accessible to premises, available when needed and free from contamination (Figure 3).
Table 6 revealed that 16.5% of the investigated households have access to safely managed water sources, 10.3% have basic access and 12.5% have limited-service access.
An analysis of variance was performed on the results of the overall access to household water sources, which revealed that all of the group means were not equal at p < 0.05. Hence, the hypothesis of equality was rejected. However, to compare water source accessibility across the sampling communities, a post hoc analysis was performed. The results indicated that household water source mean access in the urban communities of northern (Katsina) and southern (Funtua) isohyets were similar. In addition, rural communities in the southern (Kuringafa) isohyet and urban communities (Dutsinma) in the central isohyet were similar. However, the respective rural areas in the central (Kaikai) and northern (Dan-Yashe) isohyets were different.
3.1.2. Household Sanitation Facilities
Table 7 indicates a variety of household sanitation facilities, which include a septic tank, pit latrine with a slab, pit latrine without a slab and no facility (open defecation), across the six sampling communities. Overall, pit latrines with slabs and pit latrines without slabs were found across urban and rural areas within the isohyets.
Findings show substantial access to septic tanks in all three urban communities across the isohyets (Table 7). A high level of septic tank accessibility at 53.7% was found in the northern urban community (Katsina) and low-level accessibility in the urban communities was recorded in the central urban community (Dutsinma) at 27.9%. The analysis further reveals the high accessibility of pit latrines with slabs in the respective urban communities across the isohyets, contrasting the high use of pit latrines in the corresponding rural communities. In rural communities, access to septic tanks was recorded only in the south (Kuringafa) at 0.4%. In urban areas, access to a septic tank was highest in the northern (Katsina) isohyets at 53.7%, it dropped considerably to 27.9% in the central region and rose to 36.0% in the southern region. Moreover, access to pit latrines with slabs was highest at 43.2% in the southern rural areas, followed by 40.3% in the central areas (Dutsinma) and 7.4% in the northern rural areas. The accessibility level of pit latrines without slabs was highest in the rural north (Dan-Yashe) at 85.2% and the lowest level was found at 55.0% for the southern rural community (Kuringafa). Furthermore, a substantial proportion of households without sanitation facilities (open defecation) was recorded in rural communities at 7.4% and 0.4% in Dan-Yashe (rural north) and Kuringafa (rural south), respectively. While 0.3% of open defecation was recorded for the Funtua community (urban south).
Furthermore, household access to sanitation facilities was in line with JMP [46] for the investigated households. As defined by UNICEF and WHO [46], Table 8 illustrates the five access service levels for adequate sanitation facilities, outlining the specific characteristics for each to provide a more in-depth understanding.
Findings revealed that 28.1% of the investigated households have access to safely managed services, 26.7% have basic access, 5.3% have limited-service access, 38.7% have unimproved and 1.2% have open defecation service levels. An analysis of variance (p > 0.05) indicated access to various sanitation facilities across the sampling communities. A post hoc analysis revealed that mean access to household sanitation facilities in the three urban areas across the isohyets was different compared to each other: 3.9800, 4.4005 and 5.200 for the north, central and south, respectively. Rural communities in the southern and central isohyets had similar access figures related to household sanitation (6.5586 and 6.8358, respectively). Moreover, rural communities in the central and northern isohyets also had similar mean values of 6.8358 and 7.0000, respectively.
3.2. Access to Household Energy
3.2.1. Proportion of Household Access to Electricity
Access to electricity was equated to the proportion of households connected to both grid or off-grid electric supply for lighting and other household services. A multi-tier framework was employed to measure the level of electricity access based on the specified indicators. The results are illustrated in Figure 4.
Figure 4 revealed that 42.8% of the investigated households were classified as having no access to electricity. The SE4ALL Global Tracking Framework [45] defines these households as having access to less than 5 watts of electricity per day. In addition, 21.4% of the surveyed households were categorised as tier 1 of the multi-tier framework. These households are characterised by a low electric power supply (5–50 watts with less than four hours of supply daily) and have basic access to electricity for lighting and phone charging. This level also corresponds to the one for electricity supply linked to solar panels. The study further shows that 15.7% of the surveyed households are part of tier 2. These households are characterised by a low electric power supply (a minimum of 50 watts with at least four hours of daily supply) and have beyond basic access and applications of electricity for household appliances such as televisions, videos and fans in addition to lighting and phone charging. This level also corresponds to the one for electricity supply associated with solar panels. Furthermore, the findings revealed that 10.9% of the investigated households belong to tier 3 of the multi-tier framework. These are households characterised by a daily electrical supply of at least 200 watts and enjoyed all the services of tier 2 in addition to the use of other electrical appliances such as refrigerators. It was found that only 6.3% of the investigated households were reported to have a high electric power supply of a minimum capacity of 800 watts daily. These households were characterised by services from tier 3 in addition to the use of other appliances such as heaters and pressing irons. Only 2.1% of the surveyed households were reported having access to all of the services in tier 4. Finally, only 0.8% was recorded for tier 5 of the framework. This tier consists of households with the use of all services linked to tier 4 plus the use of other appliances such as air conditioners, submersible pumps and other gadgets that require a high electric supply. Moreover, the overall household electricity access index for the study area was low (1.83), implying that the majority of households in Katsina state are constrained in receiving reliable and efficient energy for lighting and other appliances.
3.2.2. Access to Household Cooking Energy
Table 9 indicates a variety of energy sources, which include electricity, cooking gas (usually liquefied petroleum gas (LPG)), kerosene, charcoal, sawdust, fuelwood (or wood fuel), agricultural residue and dung. The table summarises household energy sources for cooking in the study area.
Findings show overall use of fuelwood and agricultural residue across the six communities of the three isohyets (Table 9). The highest proportion of fuelwood access was found in the central rural community at 93.3%. The lowest utilisation level was found in the northern rural community. Similarly, the accessibility pattern followed the same trend among the urban communities. The highest accessibility level of fuelwood was estimated at 70.7% for the central urban region. The lowest corresponding level was recorded for the northern rural community at 45.0%. A high level of agricultural residue access was found for the rural communities, where 43.0% was recorded in the north and 5.2%, which was the lowest proportion, in the central rural community.
Table 9 reveals a trend of access to cooking gas (LPG) within all urban communities. The highest accessibility level of 45.0% was recorded in Katsina (urban north) and the least was found in Dutsinma (central urban region) at 25.6%. Access to electricity as a cooking energy source was only found in Katsina (urban north) at 3.7%. In addition, dung was only found in the poor rural households across the northern and southern isohyets at 2.9% and 2.7%, respectively. Furthermore, kerosene and sawdust were only accessed in the urban communities of the northern and central isohyets. The highest accessibility levels of kerosene and sawdust were recorded at 0.5% and 0.8%, respectively, in the north, while the lowest level of both energy sources was recorded at 0.3% each in the central region.
An analysis of variance revealed an inequality in access to various cooking energy sources. Furthermore, a post hoc analysis indicates that urban areas in the central and southern isohyets were found to be at the same range with energy mean usages of 3.3769 and 3.5088, respectively. In addition, the analysis shows an overlap between the southern and northern urban areas in the third group with household mean usages of 3.5088 and 3.6100 in the respective communities. Moreover, rural areas in the southern and northern isohyets are found within the same range at means of 3.8829 and 4.0331, respectively.
Access to sustainable energy for cooking is usually equated with the use of clean fuels as primary energy sources. The study categorised the access level into three groups: no access, which is aligned with tier 0 of the multi-tier framework; basic access, which is aligned with tiers 1–3, representing the use of self-made and manufactured non-BLEN cook stoves; and advanced access, which is aligned with tiers 4–5 corresponding to BLEND cook stoves. Figure 5 indicates that 75.1% of households had basic access to cooking fuels, these households made up tiers 1–3 and the majority of them had a low-grade technical performance. These are mostly cooking stoves (e.g., three-stone stove) whose efficiency and performance are unknown.
Figure 5 further indicates that 24.1% of the investigated households had advanced access to cooking fuels. They are households with access to electricity and stoves run on cooking gas, which are graded high in terms of efficiency and performance of primary cooking solutions. These households were aligned to tiers 4 and 5 of the multi-tier framework. Moreover, the overall household electricity access index for the study area was low (1.24), which implies that the majority of households in Katsina state are associated with deficient access to sustainable cooking energy.
3.3. Economic Access to Household Food
Table 10 indicates variable food purchase frequency in various households across the six communities. A considerable variety of patterns of household food purchases was found: daily, weekly and monthly purchases.
Moreover, households that accessed their food through their own production were also identified. Disparities exist in household food accessibility among the six sampling communities. Table 8 shows a substantial proportion of monthly purchases of food in all three urban communities across the isohyets. This is in contrast to substantial proportions of daily purchases of staple food (defined as food that is eaten routinely and in considerable quantities) in the corresponding rural communities. The highest proportion of monthly food purchases was recorded in the northern urban area at 63.5% followed by 35.4% in the central urban region, whereas the lowest proportion of monthly purchases among the urban areas is found in the south at 9.9%. In rural communities, monthly food purchases were recorded in all three rural communities. The highest proportion was found in the rural south at 9.9%, while the lowest proportion of monthly food purchases linked to rural communities was recorded in the rural north at 1.7%. The highest proportion of daily food purchases was determined at 33.9% for the urban-rural category, while the lowest proportion was found in the rural south at 22.1%. In urban communities, the highest proportion of daily food purchases was found in the central-urban region at 32.1%, and the lowest proportion was recorded in the urban north at 13.5%. Own production of food was high in the rural communities. The highest production was recorded for southern rural communities (34.7%). Proportions of 27.6% and 9.2% were found in the south-central and northern rural communities, respectively. In urban communities, the highest proportion of own food production was found in the southern urban (20.4%) category, while the lowest value of 9.2% was noted for the urban communities in the north.
An analysis of variance was performed to compare several means of household major food-type usages among the six sampling communities. The statistical test performed on the results of overall household food accessibility shows that all of the group means are not equal at p < 0.05. However, in order to identify which particular differences between pairs are significant, post hoc tests using the Duncan method were performed to explore the six group means of food access in the study area. Results revealed that inequality in food access existed in the study area. The analysis further revealed that central-rural, north-rural and central-urban areas were found within the same range with the respective access mean values of 2.0970, 2.1736 and 2.2538, while the remaining three studied communities were found within the same range of mean access at 2.5721, 2.6045 and 2.6850 for south-rural, south-urban and north-urban areas, respectively.
3.4. Comparison of the Study Findings with SDG Targets and Indices
Table 11 compares data collected from the investigated households across the six communities in Katsina state with relevant SDG indicators falling under the SDG 1, 2, 3, 6, 7 and 11 covering issues of no poverty, zero hunger, health and well-being, clean water and sanitation, clean and affordable energy and sustainable cities, respectively.
Table 11 is directly relevant to SDG 1 (no poverty), particularly indicators 1.1.1 and 1.2.1. About 31.3% of the households lived below the 2020 international poverty line at the time of the survey ($1.90/person/day), and 22.9% of respondents lived below the national poverty line of N137,430 ($381)/person/year. In addition, relevant to SDG 2 (zero hunger), particularly indicator 2.1.2, the study further indicated that 25.7% and 22.4% of the surveyed households economically accessed household food stuff on a daily (severe food insecurity) and a weekly (moderate food insecurity) basis, respectively. Moreover, related to SDG 6, 7 and 3, Table 9 indicated that 60.7% and 39.9% of the surveyed households reported to have access to various sources of unimproved water and sanitation facility respectively. Results further revealed that 72.3% of the households were using solid fuels of mainly biomass (fuel wood, saw dust, charcoal, agricultural residue and dung) and 49.8% used less efficient cooking stoves.
Table 11 also showed that 60.7% and 39.9% of the surveyed households were vulnerable to certain health issues caused by either pollutants from various water sources or due to the inaccessibility of basic sanitation facilities. It further revealed that 72.3% of the investigated households were also vulnerable to various health issues as a result of indoor air pollutants due to the burning of fuels. In relation to SDG 11, the table shows that 39.2% of the investigated urban households lived in formal dwellings.
4. Discussion
There has been growing global concern around the need to provide universal access to safe and sufficient water, clean energy and healthy food for all. In Nigeria, efforts are underway to achieve water, energy and food security for most communities by about 2030.
In the investigated communities, the hypothesis of equality to household water sources, energy sources and food accessibility varied significantly (p < 0.05). Several sources of household water, cooking energy and food accessibility were identified. Access to both improved (piped water into dwelling, piped water to yard, public tap/stand pipe, private borehole, public borehole and protected dug well) and unimproved water sources (unprotected dug well, water vendor, surface water and tanker truck) was recorded. Both improved (septic tank and pit latrine with a slab) and unimproved sanitation facilities (pit latrine without a slab and open defecation) facilities were noted. Clean energy sources (electricity, liquefied petroleum gas and kerosene) and unclean energy sources (fuelwood, agricultural residue, charcoal, saw dust and dung) were also recorded. Finally, food access (including production of own food) and purchase frequency (monthly, weekly and daily purchases) were documented.
The technologies and corresponding accessibilities regarding water, sanitation and energy are inadequate. The results of the study showed that more than half (60.7%) of all households in the investigated communities lack access to improved water sources. More than one third (40.0%) of households lack access to improved sanitation facilities. About 74.3% of households lack access to clean cooking energy sources. About half (48.0%) of the households frequently had only smaller food quantities either on a daily or weekly basis, indicating food insecurity.
Dan-Yashe (north-rural), Kaikai (central-rural) and Kuringafa (south-rural) are communities where households have lower access to improved water sources. In rural communities, accessibility to improved water sources decreased from north to south. The results revealed that only 5.0% of households in the rural north have access to improved water sources, while 18.7% of the central-rural category were found to have access to various improved water sources. For the south-rural category, 34.9% of households have access to various improved water sources.
Restricted access to improved water sources and sanitation facilities in rural communities has also been reported elsewhere [52,53,54]. Both high poverty and population growth have been identified as major factors for the inaccessibility of improved water sources. In urban communities, accessibility to improved water sources was higher in Katsina (urban north, 56.8%) compared to 36.9% in Dutsinma (urban central region) and 55.2% in Funtua (urban south). In the Dan-Yashe (north-rural) and Kaikai (central-rural) communities, 5.0% and 13.4%, respectively, of the surveyed households had access to public boreholes as the only improved source. In the Kuringafa (rural south) community, 0.5%, 23.4% and 13.1% of the households accessed private boreholes, public boreholes and protected dug wells, respectively. Rural households were associated with restricted access to improved water sources. In addition, southern rural households had higher proportions of people with access to improved water sources, which include private boreholes, public boreholes and protected dug wells. This indicated the influence of isohyets regarding water access [55]. Unlike for the rural households, the study revealed that urban households were more likely to access improved water sources. For the Katsina community in the urban north, 56.8% of households had access to various improved water sources, followed by the Funtua (urban south) community, where 55.2% of the households had access to various improved water sources, and the lowest proportion was recorded for the Dutsinma (central-urban category) community, where 34.9% of the households had access to improved water sources. This is in contrast to rural communities, where the trend of accessibility to improved water sources increased from north to south. In urban communities, the study revealed the highest accessibility level to various water sources in the urban community located in the northern isohyets.
The likely reason for Katsina (urban north) having a higher proportion of access to improved water sources and sanitation facilities is that it is the administrative capital and the informal commercial capital of Katsina state. Although Funtua (urban south) cannot be matched with Katsina in terms of political priorities, it was next in terms of the accessibility level. Concerning the surveyed communities in the southern isohyets, their higher level of physical accessibility to improved water sources can be linked to the higher levels and durations of rainwater received [56,57,58]. A post hoc analysis showed that Katsina (urban north) and Funtua (urban south) were on the same sub-set group with corresponding means of water accessibility at 7.0925 and 7.2670, respectively.
An increase in the amount of rainfall across rural areas positively impacts on agricultural production, which also results in higher incomes and household welfare [56,57]. Thus, higher accessibility to improved water and more access to food purchases can be attributed to higher earnings as a result of increased economic activities. The findings match those of other studies [58,59]. The study showed comparable trends of access to both improved water sources and sanitation facilities for rural communities. The accessibility increased from north to south in rural communities. In rural communities in general, the overwhelming majority of households do not have access to improved sanitation facilities. In Dan-Yashe (north-rural), Kaikai (central-rural) and Kuringafa (south-rural) communities, 95% 81.3% and 56.3% of the respective households did have access to improved sanitation facilities. Moreover, access to various water sources, sanitation facilities and results obtained from water quality tests supported SDG 6.1 and 6.2, and thus enable the examination of inequalities in service levels across the investigated communities.
Geographical location, income and education were found to be among the determinant factors that force the majority of households to access unimproved sanitation facilities in Nigeria [54,60,61]. A post hoc analysis revealed that Dan-Yashe (north-rural) and Kuringafa (south-rural) were grouped in different sub-sets with access means of sanitation facilities of 7.000 and 6.5586, respectively. Though there was an overlap between both the rural north and the rural south with Kaikai (rural central region) in the transition. The analysis revealed that urban communities across the three isohyets are significantly different from rural areas.
The study showed strong associations between similar categories of water sources and sanitation facilities. Thus, an increase in improved water accessibility corresponds to an associated increase in improved sanitation facilities [62]. Generally, the results are in line with another study [63,64] showing little or no access to improved water sources and improved sanitation facilities in poor households, especially in rural developing countries.
The accessibility of household energy sources for cooking in the surveyed communities varied significantly (p < 0.05) from one community to another. Several sources of energy were identified. In rural communities, access to (solid) biomass (mainly fuelwood), agricultural residue, charcoal and dung were identified. This implies the inaccessibility of non-solid (clean) energy sources and a total dependence on solid fuel sources in these communities. In contrast, in urban communities, access to various sources of cooking energy from solid and non-solid categories were identified. In the Katsina (north-urban) community, the highest proportion of households having access to clean (non-solid) energy sources was found to be 49.3%, 25.9% and 43.7% for Katsina (north-urban), Dutsinma (central-urban) and Funtua (south-urban) communities, respectively. The highest accessible level of biomass, which includes fuelwood and charcoal in urban and rural communities across the isohyets, showed a significant level of access to fuelwood in developing countries [65]. The inaccessibility of clean cooking fuels and socio-economic status were identified as the major determinants responsible for the high utilisation level of biomass in developing countries [65,66,67,68].
Access to clean cooking fuels, which include electricity and cooking gas among the urban households, is a clear indication of elevated educational level and financial capabilities [62,68]. In addition, access to electricity as a source of household energy for cooking was only recorded in the Katsina (north-urban) community. Results from the interviews indicated that an overwhelming majority of urban households was connected to electricity systems. However, the distribution of electricity in the state is unreliable. A low electricity accessibility level in this study showed an insufficient and erratic supply. This forced the majority of urban households to use other cooking fuels for easy accessibility.
Economic access to various food types through purchasing frequencies, which include monthly, weekly and daily purchases, alongside those that produced their food items through agricultural practices varied significantly (p < 0.05) from one surveyed community to another. The study revealed a high proportion of households that produced their own food in the rural communities where mostly subsistence farming is practiced. Subsistence farming plays a crucial role in ensuring food security [69]. Moreover, the study coincided with other studies [70,71] which revealed food purchase frequencies as measures of food security. In addition, the study supports other findings [72,73] revealing that socioeconomic parameters are drivers to food access.
Tracking progress towards achieving the SDG in the study area was compared with relevant indicators. The general indicator framework for sustainable development was formulated by the Inter Agency and Expert group on sustainable development goal indicators and was unanimously adopted at the 48th session of the United Nations General Assembly on 6 July 2017. The official SDG indicator framework presently consists of 231 indicators, which are divided into three tiers (1—method established and data widely available, 2—method established but limited data, 3—no internationally agreed-upon method). Furthermore, 123 indicators (53%) belong to tier 1, and the rest are assigned to tier 2 [74,75]. As a result, the official global SDG indicator framework is only partly effective, particularly in countries that have weak official data compilation systems. Identifying the difficulties of adopting a global indicator framework that works for all countries, the 2030 Agenda states that members will develop their national indicators in line with the principles of the 2030 Agenda and that targets are defined as aspirational and global, with each government setting its own national targets guided by the global level of ambition, but taking into account national circumstances [76].
The income of about one third (31.3%) of the surveyed population ranks below the international and the national poverty lines (Table 9). The results further revealed that the Katsina state population (33.1%) has an income below the international poverty line, exceeding the national proportion (22.9%). Food purchase was being employed as a measure of food security through assessing purchase frequencies. Table 9 revealed that 25.7% and 22.4% of the surveyed households bought food stuff on a daily (severe food insecurity) and a weekly (moderate food insecurity) basis, respectively. The definition of access to clean and affordable drinking water and sanitation is outlined by UNICEF and WHO [46]. Concerning Katsina state, many households had access to piped water. However, household water supply was erratic. Households often had extended periods of time without running water, thus relying on water storage, leading to other health-related risks (e.g., bacteriological contamination causing diarrheal disease). The study revealed that 39.3% and 60.0% of the surveyed households reported to have some form of water access and sanitation, respectively. Generally, it seems that more people living in Katsina state have formal dwellings compared to the rest of the country. Fewer people (24.2%) were reported having access to the Internet in the study areacompared to the rest of the country (51.4%). Given the definition of access to electricity, clean cooking fuels and cooking energy access [47,48], the study revealed that the electricity and cooking energy access indexes were low at 1.83 and 1.24, respectively.
Table 9 showed that 72.3% of households were using solid fuels (fuel wood, saw dust, charcoal, agricultural residue and dung). Furthermore, 1078 households accessed fuel wood for cooking; 40.2% and 49.8% of them used modern molded (higher burning efficiency stove) and traditional three-stone stoves respectively. Relevant to indicators 3.9.1 and 3.9.2, the lack of access to improved water sources and sanitation facilities led to water-borne illnesses such as cholera and stunted child growth. [77,78]. In addition, indoor air pollution caused by burning solid fuels using inefficient cooking stoves is another cause of deadly acute respiratory infections as well as pulmonary- and cardiovascular-related diseases [79]. Findings revealed that 49.2% of the investigated households lived in formal dwellings (Table 9). This means that more people in Katsina state, especially in the rural communities, lived in informal dwellings.
5. Conclusions
Access to improved sources of water, basic sanitation facilities, clean energy and food remains a challenge for poor households in sub-Saharan African countries, particularly in rural communities. There is a need for inventive planning approaches based within a socio-ecological context to provide equitable access to improved water sources, basic sanitation facilities, clean energy sources and healthy food within this decade. The study revealed the existence of a strong relationship between socio-ecological characteristics and access to the household resources and the amount of seasonal rainfall in the respective isohyets, especially across the rural communities. The findings indicated a progressive trend of access to improved water sources and improved sanitation facilities from the rural north to the rural south. A corresponding clear trend could not be detected for the urban investigated communities. However, a similar pattern to energy access was identified in the urban communities, where access to clean energy was the highest at 49.2% for Katsina (north-urban), followed by 40.3% for Funtua (south-urban) and only 25.9% for Dutsinma (central-urban). No access to clean (non-solid) energy sources was recorded in any of the three rural communities.
The study indicated a progressive trend of access to food regarding monthly purchases from 1.7% in Dan-Yashe (north-rural) to 6.0% in Kuringafa (south-rural). In the urban investigated communities, there was no clear trend.
A significant proportion of access to improved water sources, basic sanitation facilities, clean energy and food was found in the urban communities, particularly in Katsina (urban north), where a high proportion of educated and high-income households were found. Education and income were key determinants of living standard. Hence, accessibilities to household water, sanitation facilities, energy and food correlate well with the standard of living.
6. Limitations and Future Research
Data collected on socio-economic variables yielded insights on various households’ water-energy-food access issues connected to specific SDG indicators. The original study survey was not designed for the primary purpose of tracking progress towards achieving SDG e, and so the data were mostly not useful according to common calculation methodologies. This is frequently a drawback in project-specific surveys; they are often not created with other assessments in mind.
As data gaps represent one of the main reasons why progress towards the SDG in Katsina state cannot be adequately computed or expressed, it is advisable that researchers be mindful of the opportunity for data compatibility between the SDG framework and survey data, for example, with respect to socio-economic characteristics and access to water-energy-food. If this is addressed, survey data can contribute to the understanding of local as well as national progress towards SDG achievement. This is particularly important for countries that lack resources focusing on socio-economic surveys, which leads to large data gaps.
Future research should take into account more household characteristics such as family size, gender, age and occupation. Furthermore, the research should be continued and extended to other low- and middle-income developing countries. The current data of the surveyed communities on census and the number of households have not been published previously, and they are available from the Katsina state office of the National Population Commission (NPC). Therefore, projections based on the available data were made and households in the communities were also estimated adopting World Health Organisation estimates for the study area. An overwhelming majority of the population in Katsina state, especially in the rural communities, is facing the ever increasing threat of banditry, a type of organised crime that includes kidnapping, murder, rape and cattle rustling. Thus, this limits the study to access more communities especially in the rural areas.
The authors also recommend that future surveys should be formulated in such a way that the survey results can be directly used for the calculation of relevant SDG target indicators. This would help to assess progress in meeting the SDG at both macro- and micro-levels. Moreover, decision-makers would be guided by carefully structured surveys to introduce tailored interventions and awareness campaigns.
Supplementary Materials
The following are available online at https://www.mdpi.com/article/10.3390/w13243595/s1. The questionnaire used in the survey is accessible as supplementary material SM1.
Author Contributions
Conceptualisation, Y.S. and M.S.; methodology, Y.S. and M.S.; formal analysis, Y.S.; investigation, Y.S.; data curation, Y.S.; writing—original draft preparation, Y.S.; writing—review and editing, M.S.; visualisation, Y.S.; supervision, M.S. All authors have read and agreed to the published version of the manuscript.
Funding
This research was funded by the Tertiary Education Tax Fund (TETFUND), Nigeria.
Institutional Review Board Statement
Ethical review and approval were waived for this study by the collaborating authorities in Nigeria.
Informed Consent Statement
Informed consent was obtained from all subjects involved in the study.
Data Availability Statement
Data are available on reasonable request following Nigerian state law.
Acknowledgments
The author would like to acknowledge the advice provided by Magnus Persson on methodology and conceptualisation. Aminu Yahaya El-Ladan supported the data curation and helped with the statistical analysis. Practical contributions by Nura Umar and other laboratory and field assistants were welcome. We would like to recognise the support of the Katsina State Government as well as the local authorities in the respective investigated communities.
Conflicts of Interest
The authors declare that they have no known competing financial interest or personal relationships that could have appeared to influence the work reported in this paper.
References
- Sarvajayakesavalu, S. Addressing challenges of developing countries in implementing five priorities for sustainable development goals. Ecosyst. Health Sustain. 2015, 1, 1–4. [Google Scholar] [CrossRef]
- Dhimal, M.; Dhimal, M.L.; Karki, K.; Montag, D.; Groneberg, D.A.; Kuch, U. Tracking health-related Sustainable Development Goals (SDGs) in Nepal. J. Health Soc. Sci. 2017, 2, 143–148. [Google Scholar]
- United Nations. IAEG-SDGs, Tier Classification for Global SDG Indicators. Available online: https://unstats.un.org/sdgs/iaeg-sdgs/tier-classification/ (accessed on 15 September 2020).
- Rasul, G.; Sharma, B. The nexus approach to water–energy–food security: An option for adaptation to climate change. Clim. Policy 2016, 16, 682–702. [Google Scholar] [CrossRef] [Green Version]
- Petrariu, R.; Constantin, M.; Dinu, M.; Pătărlăgeanu, S.R.; Deaconu, M.E. Water, Energy, Food, Waste Nexus: Between Synergy and Trade-Offs in Romania Based on Entrepreneurship and Economic Performance. Energies 2021, 14, 5172. [Google Scholar] [CrossRef]
- Nkiaka, E.; Okpara, U.T.; Okumah, M. Food-energy-water security in sub-Saharan Africa: Quantitative and spatial assessments using an indicator-based approach. Environ. Dev. 2021, 40, 100655. [Google Scholar] [CrossRef]
- Li, J.; Cui, J.; Sui, P.; Yue, S.; Yang, J.; Lv, Z.; Wang, D.; Chen, X.; Sun, B.; Ran, M.; et al. Valuing the Synergy in the Wa-ter-Energy-Food Nexus for Cropping Systems: A Case in the North China Plain. Ecol. Indic. 2021, 127, 107741. [Google Scholar] [CrossRef]
- Bonn Nexus Conference, the Water Energy and Food Security Nexus Solutions for the Green Economy. Bonn, Germany. 2011. Available online: https://library.wmo.int/index.php?lvl=notice_display&id=9202#.YbhUI55ByUk (accessed on 8 December 2021).
- Bazilian, M.; Rogner, H.; Howells, M.; Hermann, S.; Arent, D.; Gielen, D.; Steduto, P.; Mueller, A.; Komor, P.; Tol, R.; et al. Considering the energy, water and food nexus: Towards an integrated modelling approach. Energy Policy 2011, 39, 7896–7906. [Google Scholar] [CrossRef]
- FAO. The Water-Energy-Food Nexus: A New Approach in Support of Food Security and Sustainable Agriculture; Food and Agriculture Organization of the United Nations: Rome, Italy, 2014. [Google Scholar]
- World Economic Forum. Water Security: The Water-Food-Energy-Climate Nexus; Island Press: Washington, DC, USA, 2011. [Google Scholar]
- Hoff, H. Understanding the nexus. In Proceedings of the Bonn 2011 Conference: The Water, Energy and Food Security Nexus, Bonn, Germany, 16–18 November 2011; pp. 16–18. [Google Scholar]
- Leck, H.; Conway, D.; Bradshaw, M.; Rees, J. Tracing water-energy-food nexus: Description, theory and practice. Geogr. Compass 2015, 9, 445–460. [Google Scholar] [CrossRef] [Green Version]
- Simpson, G.B.; Jewitt, G. The Development of the Water-Energy-Food Nexus as a Framework for Achieving Resource Security: A Review. Front. Environ. Sci. 2019, 7, 1–7. [Google Scholar] [CrossRef] [Green Version]
- Chen, B.; Lu, Y. Urban nexus: A new paradigm for urban studies. Ecol. Model. 2015, 318, 5–7. [Google Scholar] [CrossRef]
- Wakeel, M.; Chen, B.; Hayat, T.; Alsaedi, A.; Ahmad, B. Energy consumption for water use cycles in different countries: A review. Appl. Energy 2016, 178, 868–885. [Google Scholar] [CrossRef]
- Hussien, W.A.; Memon, F.A.; Savic, D.A. An integrated model to evaluate water-energy-food nexus at a household scale. Environ. Model. Softw. 2017, 93, 366–380. [Google Scholar] [CrossRef] [Green Version]
- Wang, S.; Chen, B. Energy–water nexus of urban agglomeration based on multiregional input–output tables and ecological network analysis: A case study of the Beijing–Tianjin–Hebei region. Appl. Energy 2016, 178, 773–783. [Google Scholar] [CrossRef]
- Vieira, P.; Jorge, C.; Covas, D. Assessment of household water use efficiency using performance indices. Resour. Conserv. Recycl. 2017, 116, 94–106. [Google Scholar] [CrossRef]
- Abdullah; Zhou, D.; Shah, T.; Ali, S.; Ahmad, W.; Din, I.U.; Ilyas, A. Factors affecting household food security in rural northern hinterland of Pakistan. J. Saudi Soc. Agric. Sci. 2019, 18, 201–210. [Google Scholar] [CrossRef]
- Kipkorir, E. Analysis of rainfall climate on the Njemps Flats, Baringo District, Kenya. J. Arid. Environ. 2002, 50, 445–458. [Google Scholar] [CrossRef]
- Zeineddine, N.; Ovidiu, M. Rainfall Variability and Trend Analysis of Annual Rainfall in North Africa. Int. J. Atmos. Sci. 2016. [Google Scholar]
- Daryanto, S.; Wang, L.; Jacinthe, P.-A. Global Synthesis of Drought Effects on Food Legume Production. PLoS ONE 2015, 10, e0127401. [Google Scholar] [CrossRef] [Green Version]
- Twongyirwe, R.; Mfitumukiza, D.; Barasa, B.; Naggayi, B.R.; Odongo, H.; Nyakato, V.; Mutoni, G. Perceived effects of drought on household food security in South-western Uganda: Coping responses and determinants. Weather. Clim. Extremes 2019, 24, 100201. [Google Scholar] [CrossRef]
- Peña-Guerrero, M.D.; Nauditt, A.; Muñoz-Robles, C.; Ribbe, L.; Meza, F. Drought impacts on water quality and potential implications for agricultural production in the Maipo River Basin, Central Chile. Hydrol. Sci. J. 2020, 65, 1005–1021. [Google Scholar] [CrossRef] [Green Version]
- IPCC Summary for Policymakers. Climate change. The physical science basis. In Contribution of Working Group I to the Fifth Assessment Report of the Intergovernmental Panel on Climate Change; Stocker, T.F., Boschung, J., Nauels, A., Xia, Y., Bex, V., Midgley, P.M., Eds.; Cambridge University Press: Cambridge, UK; New York, NY, USA, 2013; pp. 1–30. [Google Scholar]
- Ketlhoilwe, M.J.; Kanene, K.M. Access to energy sources in the face of climate change: Challenges faced by women in rural communities. Jàmbá J. Disaster Risk Stud. 2018, 10, 8. [Google Scholar] [CrossRef]
- Afshar, N.R.; Fahmi, H. Impact of climate change on water resources in Iran. Int. J. Energy Water Resour. 2019, 3, 55–60. [Google Scholar] [CrossRef]
- Romano, G.; Salvati, N.; Guerrini, A. Estimating the Determinants of Residential Water Demand in Italy. Water 2014, 6, 2929–2945. [Google Scholar] [CrossRef]
- Harrisfry, A.H.; Azad, K.; Kuddus, A.; Shaha, S.; Nahar, B.; Hossen, M.; Younes, L.; Costello, A.; Fottrell, E. Socio-economic determinants of household food security and women’s dietary diversity in rural Bangladesh: A cross-sectional study. J. Health Popul. Nutr. 2015, 33, 1–12. [Google Scholar] [CrossRef] [Green Version]
- Fuerst, F.; Kavarnou, D.; Singh, R.; Adan, H. Determinants of energy consumption and exposure to energy price risk: A UK study. Zeitschrift für Immobilienökonomie 2019, 6, 65–80. [Google Scholar] [CrossRef] [Green Version]
- Koundouri, P.; Papadaki, L. Integrating Water-Food-Energy Nexus with Climate Services: Modelling and Assessment for a Case Study in Africa; Sustainability Concept in Developing Countries; Kulshreshtha, S.N., Ed.; Intech Open, 2020; Available online: https://www.intechopen.com/chapters/70971 (accessed on 8 December 2021). [CrossRef]
- Calow, R.; MacDonald, C.; Nicol, M.; Robins, N.S. Groundwater security and drought in Africa linking availability, access and demand. J. Ground Water 2010, 48, 246–256. [Google Scholar] [CrossRef]
- Friel, S.; Berry, H.; Dinh, H.; O’Brien, L.; Walls, H.L. The impact of drought on the association between food security and mental health in a nationally representative Australian sample. BMC Public Health 2014, 14, 1102. [Google Scholar] [CrossRef] [Green Version]
- Onyenechere, E.; Azuwike, D.; Enwereuzor, A. Effect of Rainfall Variability on Water Supply in Ikeduru L.G.A. of Imo State, Nigeria. Afr. Res. Rev. 2011, 5, 223–241. [Google Scholar] [CrossRef]
- Nyakundi, R.; Makokha, M.; Mwangi, J.; Obiero, C. Impact of rainfall variability on groundwater levels in Ruiru municipality, Kenya. Afr. J. Sci. Technol. Innov. Dev. 2015, 7, 1–7. [Google Scholar] [CrossRef]
- Pearson, A.L.; Zwickle, A.; Namanya, J.; Rzotkiewicz, A.; Mwita, E. Seasonal Shifts in Primary Water Source Type: A Comparison of Largely Pastoral Communities in Uganda and Tanzania. Int. J. Environ. Res. Public Health 2016, 13, 169. [Google Scholar] [CrossRef]
- Kinda, S.R.; Badolo, F. Does rainfall variability matter for food security in developing countries? Cogent Econ. Financ. 2019, 7, 1640098. [Google Scholar] [CrossRef]
- Katsina State Diary; Government Printers: Katsina, Nigeria, 2019.
- El-Tantawi, A. The Effects of Climate on Human’s Comfort and Health in North Western Region of Nigeria. Katsina J. Nat. Appl. Sci. 2012, 3, 161–174. [Google Scholar]
- Katsina State Urban and Regional Planning Board (KTURPB); Government Printers: Katsina, Nigeria, 2018.
- Isreal, G.D. Determining Sample Size; Institute of Food and Agricultural Science (IFAS), University of Florida: Gainesville, FL, USA, 2018. [Google Scholar]
- Katsina State Primary Health Care Development Agency (KTPHCDA); Government Printers: Katsina, Nigeria, 2019.
- Angelsen, A.; Lund, J.F. Designing the household questionnaire. In Measuring Livelihoods and Environmental Dependence Analytical Report at the National Level, Methods for Research and Fieldwork; Angelsen, A., Larsen, H.O., Lund, J.F., Smith-Hall, C., Wunder, S., Eds.; Earthscan Publications: Oxford, UK, 2011; pp. 107–126. [Google Scholar]
- Sustainable Energy for All. Global Tracking Framework: Workshop on Capacity Development for Mainstreaming Energy Sustainable Development Goals (SDGs), Target and Indicators into Statistical Programmes in Selected Latin Countries. 2015. Available online: https://sustainabledevelopment.un.org/content/documents/13139Global%20Tracking%20Framework_World%20Bank.pdf (accessed on 26 October 2021).
- United Nations Children’s Fund; World Health Organisation. Integrating Water Quality Testing into Household Survey: Thermatic Report on Drinking Water; UNICEF: New York, NY, USA, 2020. [Google Scholar]
- World Health Organisation (WHO). Fuel for Life: Household Energy and Health; WHO Library Cataloguing in Publication Data. 2006. Available online: http://www.who.int/indoorair/publications/fuelforlife.pdf?ua=1 (accessed on 12 February 2020).
- Frongillo, E.A.; Chowdhury, N.; Ekstrom, E.-C.; Naved, R.T. Understanding the Experience of Household Food Insecurity in Rural Bangladesh Leads to a Measure Different from That Used in Other Countries. J. Nutr. 2003, 133, 4158–4162. [Google Scholar] [CrossRef] [PubMed]
- Gittelsohn, J.; Mookherji, S.; Pelto, G. Operationalizing Household Food Security in Rural Nepal. Food Nutr. Bull. 1998, 19, 210–222. [Google Scholar] [CrossRef] [Green Version]
- Bhatia, M.; Angelou, N. Capturing Multi-Dimensionality of Energy Access; Live Wire; World Bank: Washington, DC, USA, 2014. [Google Scholar]
- Bhatia, M.; Angelou, N. Beyond Connections: Energy Access Redefined, ESMAP Technical Report, 008/15; World Bank: Washington, DC, USA, 2015; Available online: https://openknowledge.worldbank.org/handle/10986/24368 (accessed on 15 April 2020).
- Gomez, M.; Perdiguero, J.; Sanz, À. Socioeconomic factors affecting water access in rural areas of low and middle income countries. Water 2019, 11, 202. [Google Scholar] [CrossRef] [Green Version]
- Abubakar, I.R. Exploring the determinants of open defecation in Nigeria using demographic and health survey data. Sci. Total. Environ. 2018, 637–638, 1455–1465. [Google Scholar] [CrossRef]
- Armah, F.A.; Ekumah, B.; Yawson, D.O.; Odoi, J.O.; Afitiri, A.-R.; Nyieku, F.E. Access to improved water and sanitation in sub-Saharan Africa in a quarter century. Heliyon 2018, 4, e00931. [Google Scholar] [CrossRef] [Green Version]
- Moylan, H.G. The Impact of Rainfall Variability on Agricultural Production and Household Welfare in Rural Malawi; Graduate College of the University of Illinois: Champaign, IL, USA, 2012; Available online: http://www.illinois.edu/bitstream/handle/2142/3447/Moylan_Heather.pdf?sequence=1 (accessed on 14 November 2020).
- Sekela, T.; Manfred, F.B. Seasonal and Annual Rainfall Variability and Their Impact on Rural Water Supply Services in Wami River Basin, Tanzania. Water 2019, 11, 2055. [Google Scholar] [CrossRef] [Green Version]
- Tabari, H. Climate change impact on flood and extreme precipitation increases with water availability. Sci. Rep. 2020, 10, 13768. [Google Scholar] [CrossRef]
- Animashaun, I.M.; Oguntunde, P.G.; Akinwumiju, A.S.; Olubanjo, O.O. Rainfall Analysis over the Niger Central Hydrological Area, Nigeria: Variability, Trend, and Change point detection. Sci. Afr. 2020, 8, e00419. [Google Scholar] [CrossRef]
- De Janvry, A.; Sadoulet, E. Agricultural Growth and Poverty Reduction: Additional Evidence. World Bank Res. Obs. 2009, 25, 1–20. [Google Scholar] [CrossRef]
- Mahama, A.M.; Anaman, K.A.; Osei-Akoto, I. Factors influencing householders’ access to improved water in low-income urban areas of Accra, Ghana. J. Water Health 2014, 12, 318–331. [Google Scholar] [CrossRef] [Green Version]
- Simelane, M.S.; Shongwe, M.C.; Vermaak, K.; Zwane, E. Determinants of Households’ Access to Improved Drinking Water Sources: A Secondary Analysis of Eswatini 2010 and 2014 Multiple Indicator Cluster Surveys. Adv. Public Health 2020, 2020, 6758513. [Google Scholar] [CrossRef] [Green Version]
- Folayan, M.O.; Obiyan, M.; Olaleye, A.O. Association between water, sanitation, general hygiene and oral hygiene practices of street-involved young people in Southwest Nigeria. BMC Oral Health 2020, 20, 1–11. [Google Scholar] [CrossRef] [Green Version]
- Van Der Bruggen, B.; Borghgraef, K.; Vinckier, C. Causes of Water Supply Problems in Urbanised Regions in Developing Countries. Water Resour. Manag. 2009, 24, 1885–1902. [Google Scholar] [CrossRef]
- Lorenzo, T.E.; Kinzid, A.P. Double Exposure: Future Water Security across Urban Southeast Asia. Water 2020, 12, 116. [Google Scholar] [CrossRef] [Green Version]
- Win, Z.C.; Mizoue, N.; Ota, T.; Kajisa, T.; Yoshida, S. Consumption Rates and Use Patterns of Firewood and Charcoal in Urban and Rural Communities in Yedashe Township, Myanmar. Forest 2018, 9, 429. [Google Scholar] [CrossRef] [Green Version]
- Hussain, A.; Dasgupta, S.; Bargali, H.S. Fuelwood consumption patterns by semi-nomadic pastoralist community and its implication on conservation of Corbett Tiger Reserve, India. Energy Ecol. Environ. 2017, 2, 49–59. [Google Scholar] [CrossRef] [Green Version]
- Heltberg, R. Factors determining household fuel choice in Guatemala. Environ. Dev. Econ. 2005, 10, 337–361. [Google Scholar] [CrossRef]
- Miah, M.D.; Kabir, R.R.; Mohammad, S.; Koihe, M.; Akther, S.; Shin, M.Y. Rural household energy consumption pattern in disregarded villages of Bangladesh. Energy Policy 2010, 38, 997–1003. [Google Scholar] [CrossRef]
- Hlophe-Ginindza, S.N.; Mpandeli, N. The Role of Small-Scale Farmers in Ensuring Food Security in Africa. Food Secur. Afr. 2021. [Google Scholar] [CrossRef]
- Ambikapathi, R.; Rothstein, J.D.; Yori, P.P.; Olortegui, M.P.; Lee, G.; Kosek, M.; Caulfield, L.E. Food purchase patterns indicative of household food access insecurity, children’s dietary diversity and intake, and nutritional status using a newly developed and validated tool in the Peruvian Amazon. Food Secur. 2018, 10, 999–1011. [Google Scholar] [CrossRef] [Green Version]
- French, S.A.; Tangney, C.C.; Crane, M.; Wang, Y.; Appelhans, B.M. Nutrition quality of food purchases varies by household income: The SHoPPER study. BMC Public Health 2019, 19, 1–7. [Google Scholar] [CrossRef] [Green Version]
- French, A.S.; Wall, M.; Mitchell, N.R. Household income differences in food sources and food items purchased. Int. J. Behav. Nutr. Phys. Act. 2010, 7, 77–78. [Google Scholar] [CrossRef] [Green Version]
- Ogunniyi, A.I.; Omotoso, S.O.; Salman, K.K.; Omotayo, A.O.; Olagunju, K.O.; Aremu, A.O. Socio-economic Drivers of Food Security among Rural Households in Nigeria: Evidence from Smallholder Maize Farmers. Soc. Indic. Res. 2021, 155, 583–599. [Google Scholar] [CrossRef]
- IAEG-SDGs. Report of the Inter-Agency and Expert Group on Sustainable Development Goal Indicators; 2016. Available online: https://unstats.un.org/unsd/statcom/47th-session/documents/2016-2-IAEG-SDGs-Rev1-E.pdf (accessed on 15 July 2020).
- IAEG-SDGs. Tier Classification for Global SDG Indicators as of 17 July 2020; 2020. Available online: https://unstats.un.org/sdgs/files/Tier%20Classification%20of%20SDG%20Indicators_17%20July%202020_web.v2.pdf (accessed on 20 July 2020).
- United Nations. Transforming Our World: The 2030 Agenda for Sustainable Development 2015. Available online: https://sustainabledevelopment.un.org/post2015/transformingourworld (accessed on 24 September 2021).
- Prüss-Ustün, A.; Bartram, J.; Clasen, T.; Colford, J.M., Jr.; Cumming, O.; Curtis, V.; Bonjour, S.; Dangour, A.; De France, J.; Fewtrell, L.; et al. Burden of disease from inadequate water, sanitation and hygiene in low- and middle-income settings: A retrospective analysis of data from 145 countries. Trop. Med. Int. Health 2014, 19, 894–905. [Google Scholar] [CrossRef] [Green Version]
- Bekele, T.; Rahman, B.; Rawstorne, P. The effect of access to water, sanitation and handwashing facilities on child growth indicators: Evidence from the Ethiopia Demographic and Health Survey 2016. PLoS ONE 2020, 15, e0239313. [Google Scholar] [CrossRef]
- Van Tran, V.; Park, D.; Lee, Y.-C. Indoor Air Pollution, Related Human Diseases, and Recent Trends in the Control and Improvement of Indoor Air Quality. Int. J. Environ. Res. Public Health 2020, 17, 2927. [Google Scholar] [CrossRef] [Green Version]
Figure 1.
Maps of (a) Africa; and (b) Katsina state showing sampling communities across the isohyets.
Figure 1.
Maps of (a) Africa; and (b) Katsina state showing sampling communities across the isohyets.

Figure 2.
Socio-ecological model of water, energy and food access.

Figure 3.
Elements of access to safely managed household water services.

Figure 4.
Overall electricity access.

Figure 5.
Overall cooking energy access index.


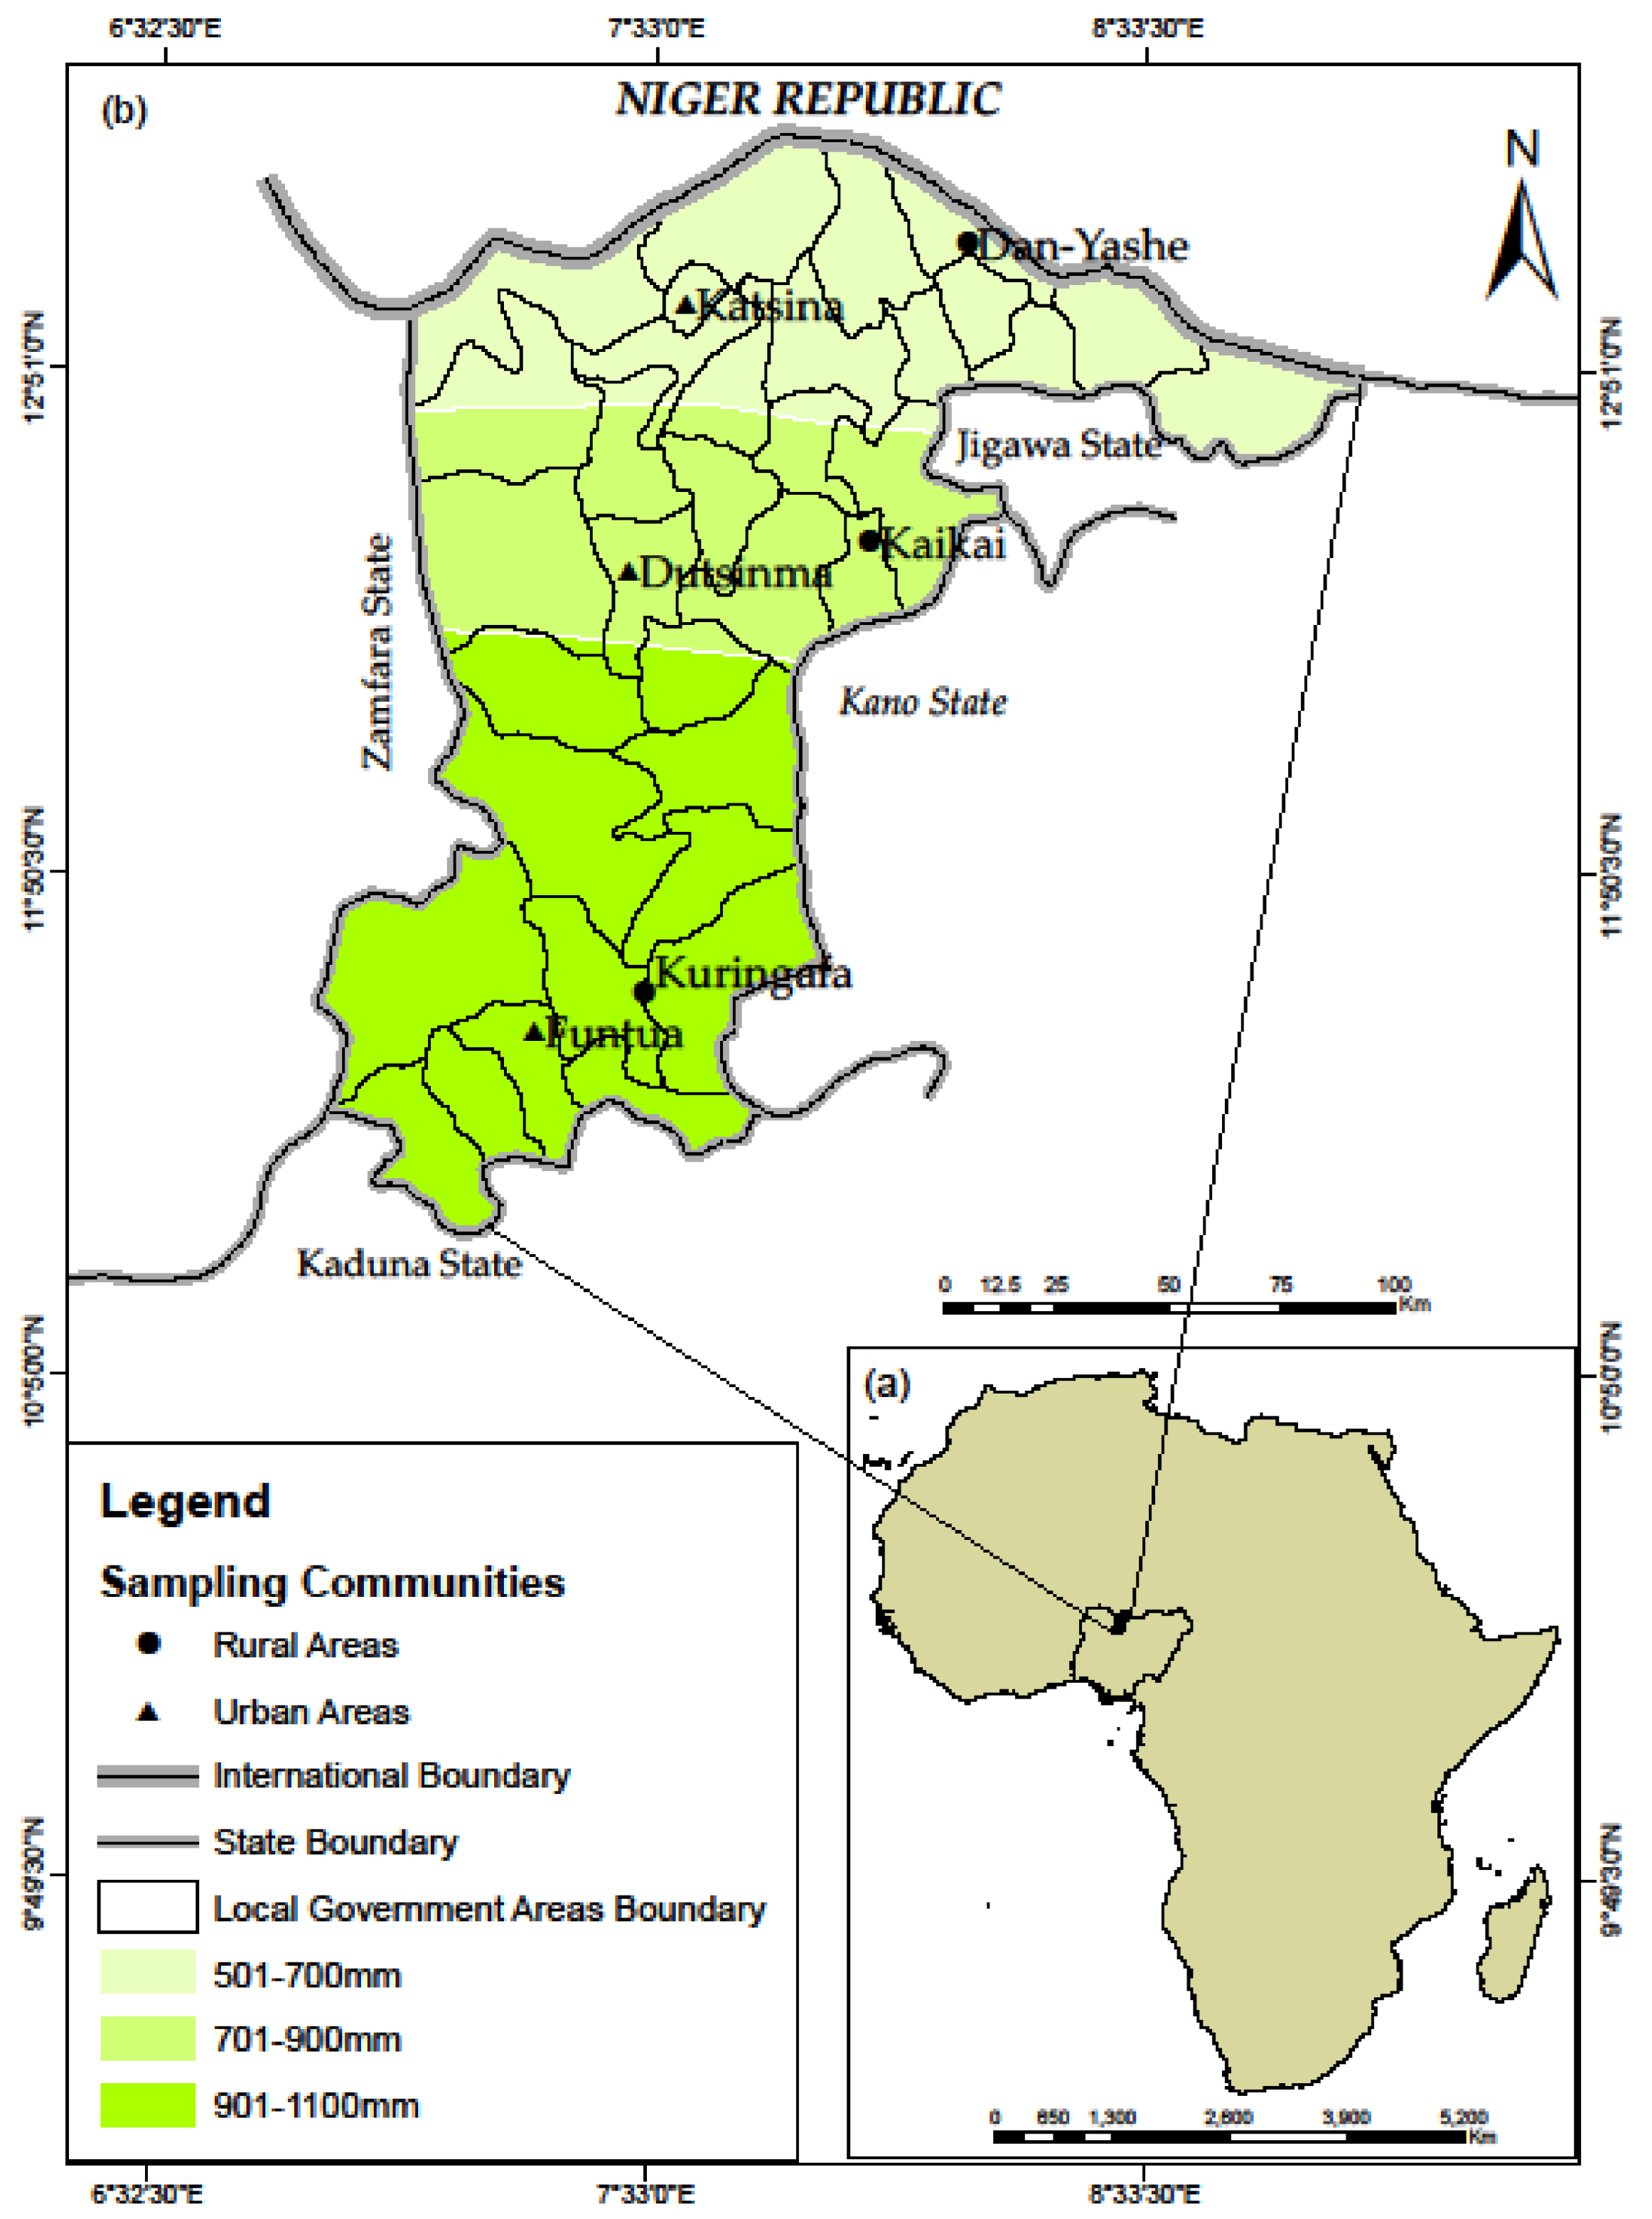
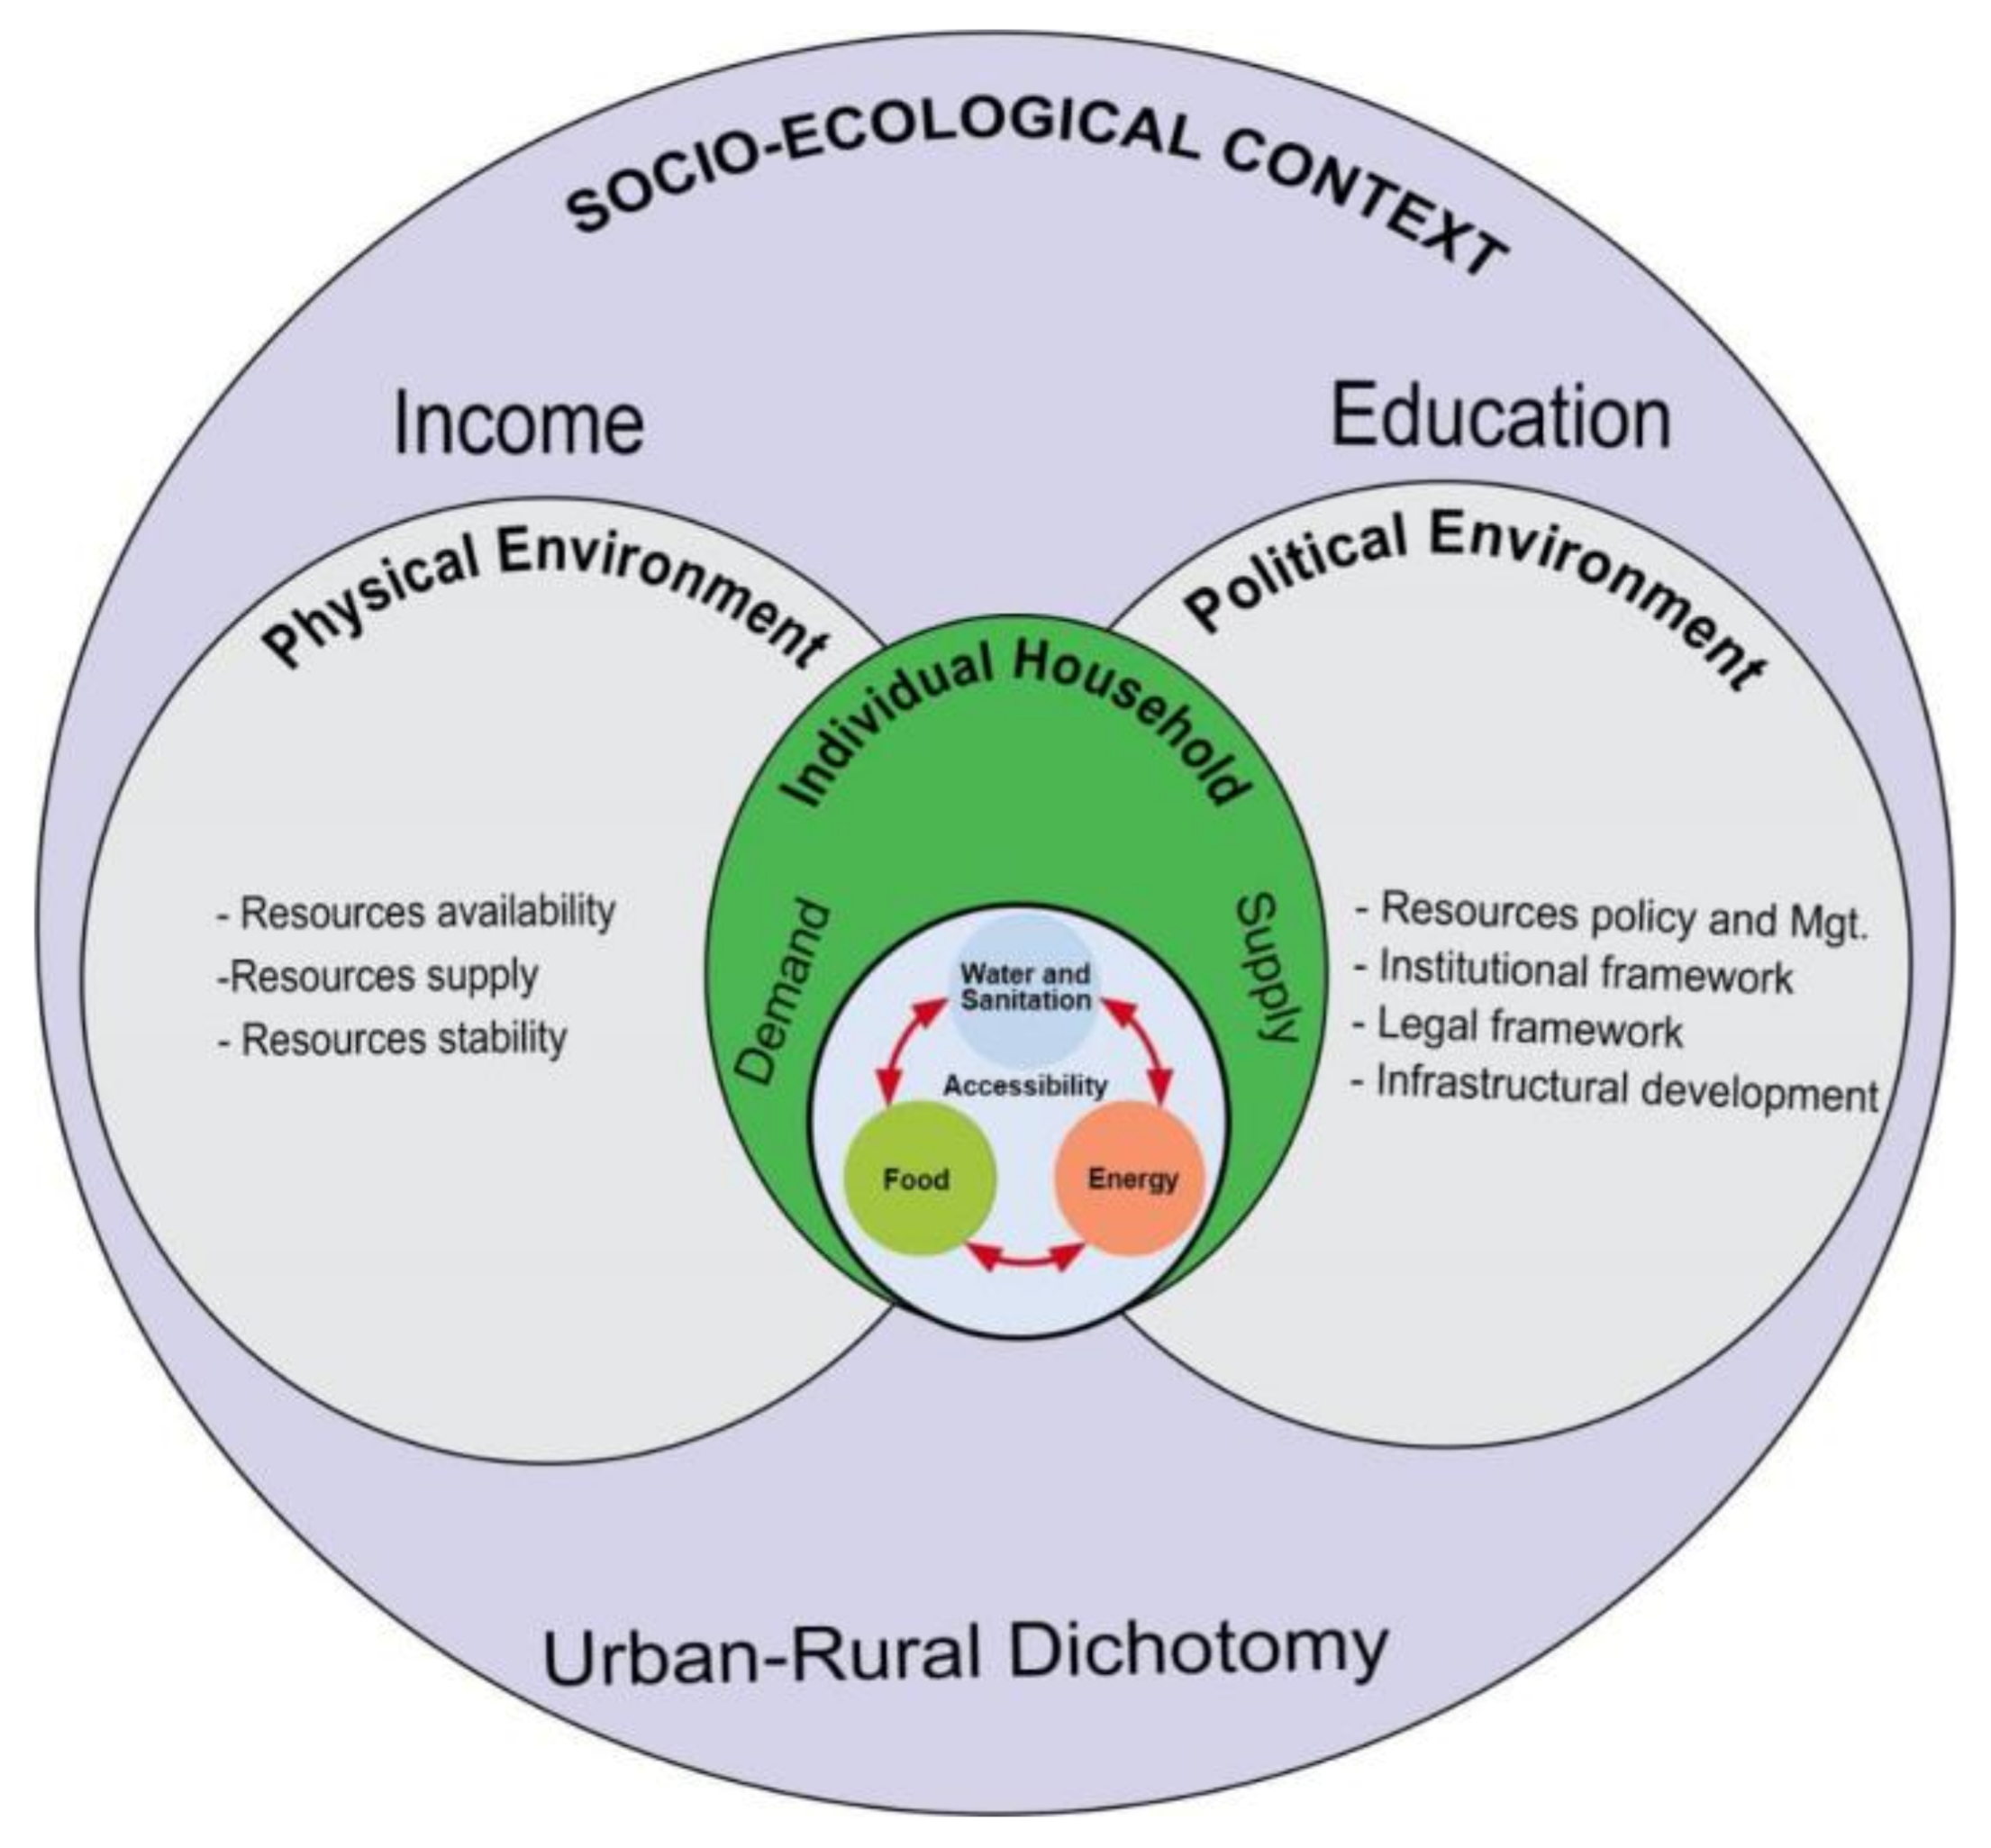
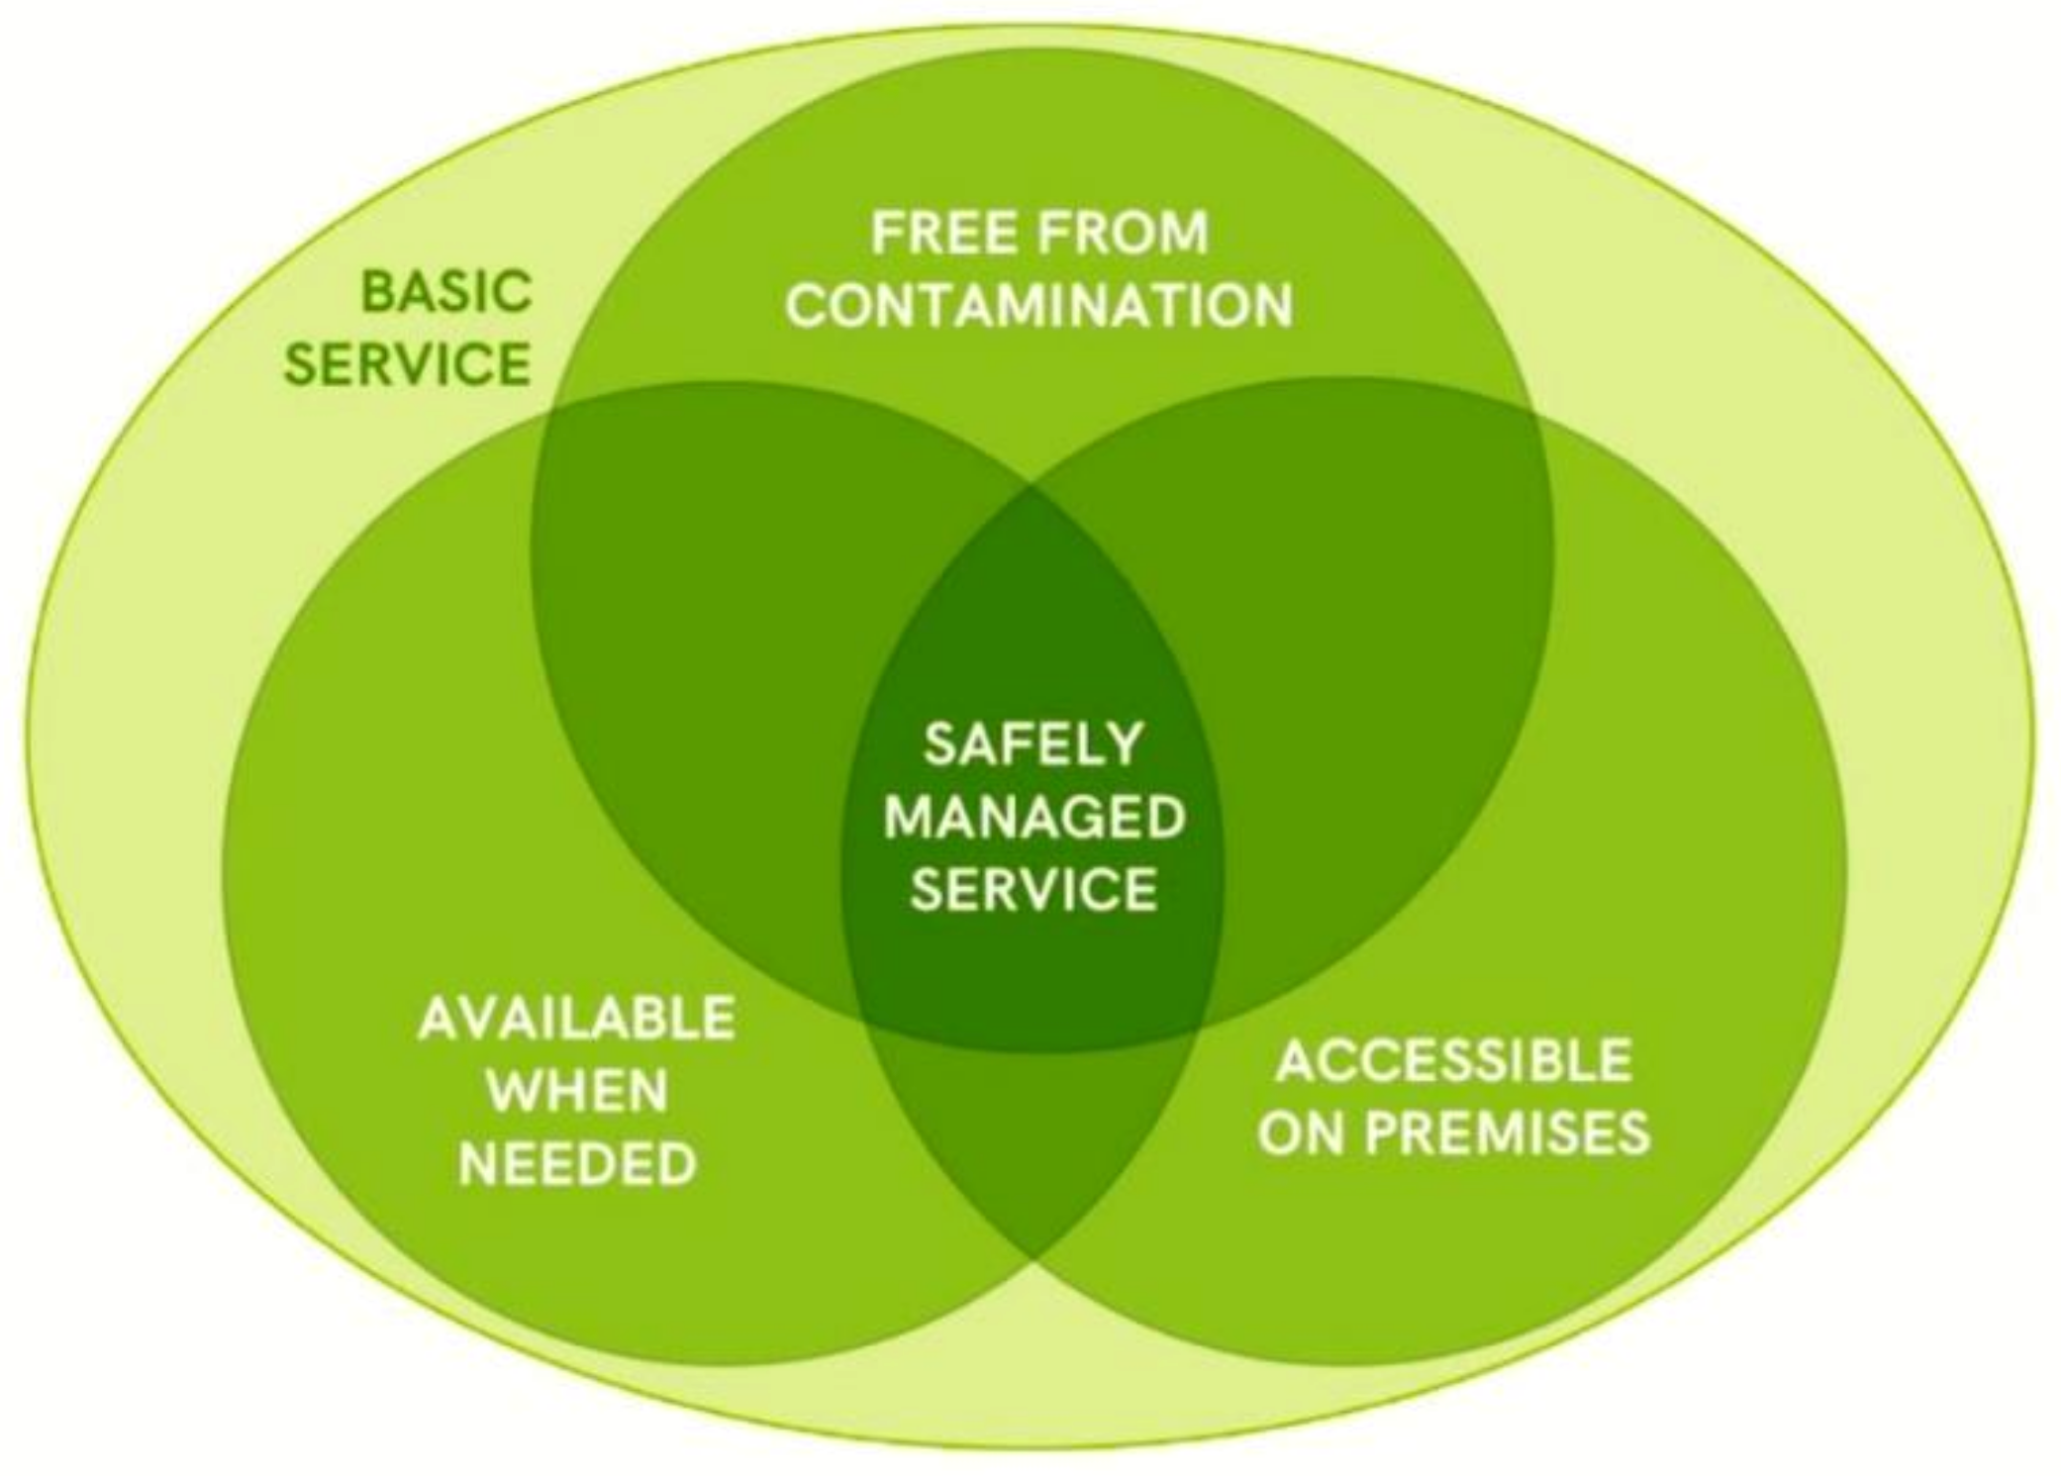
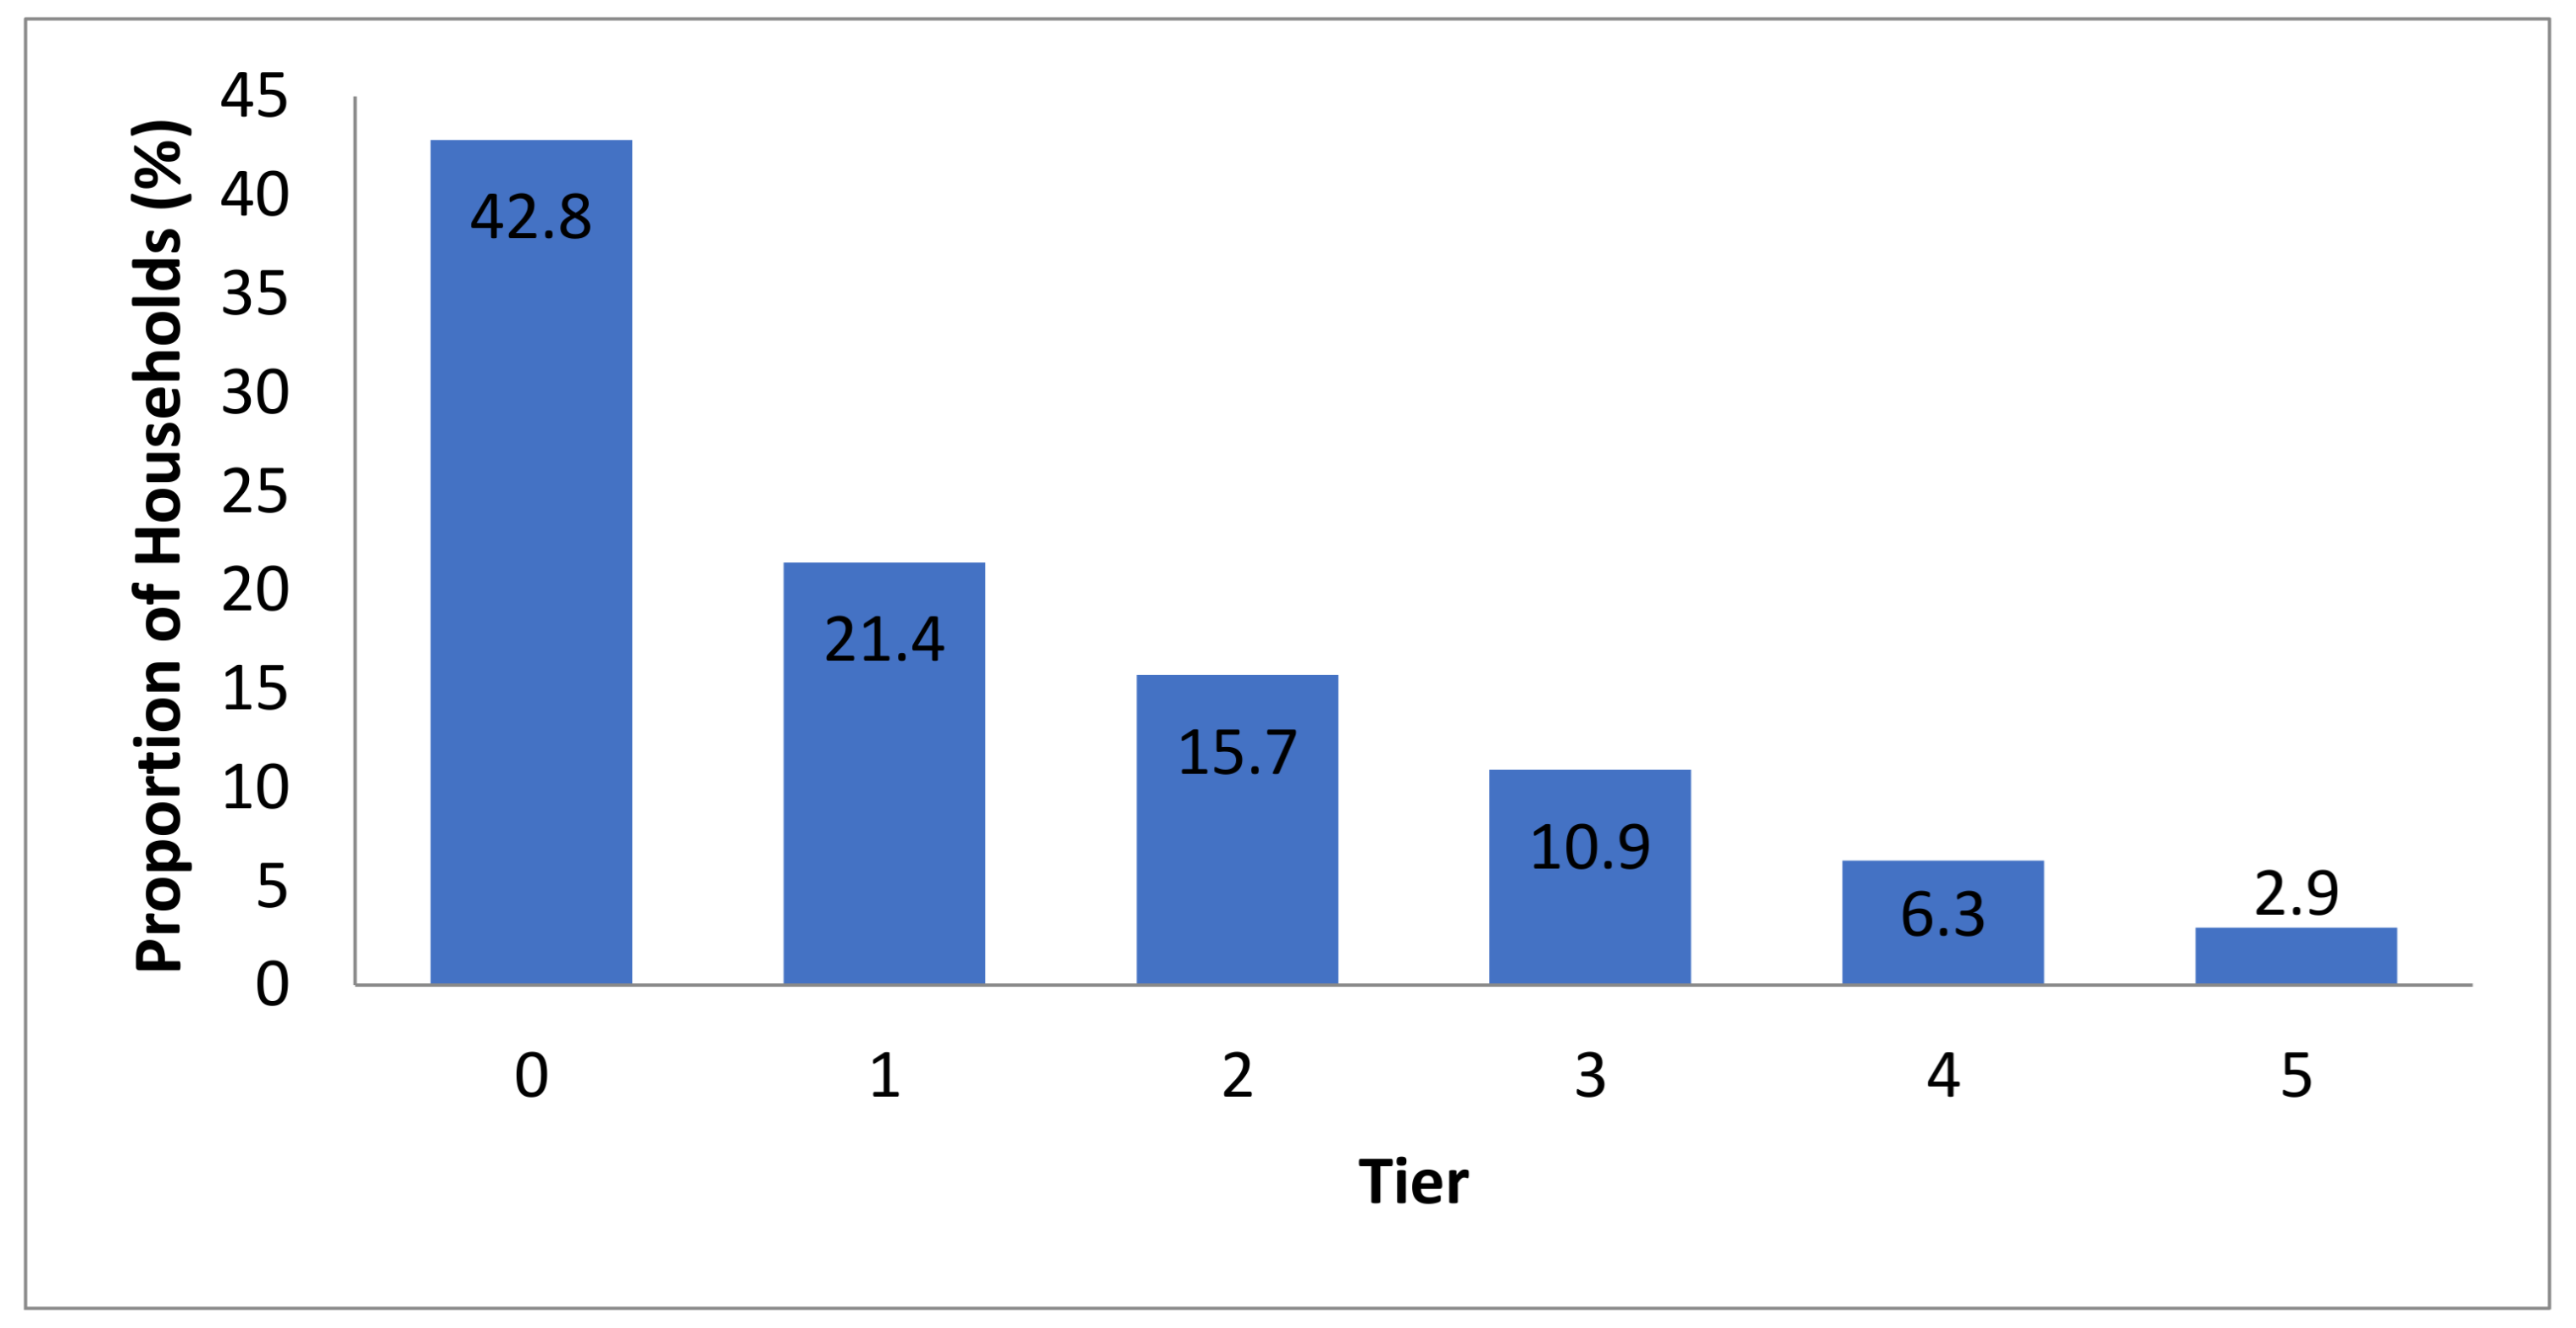
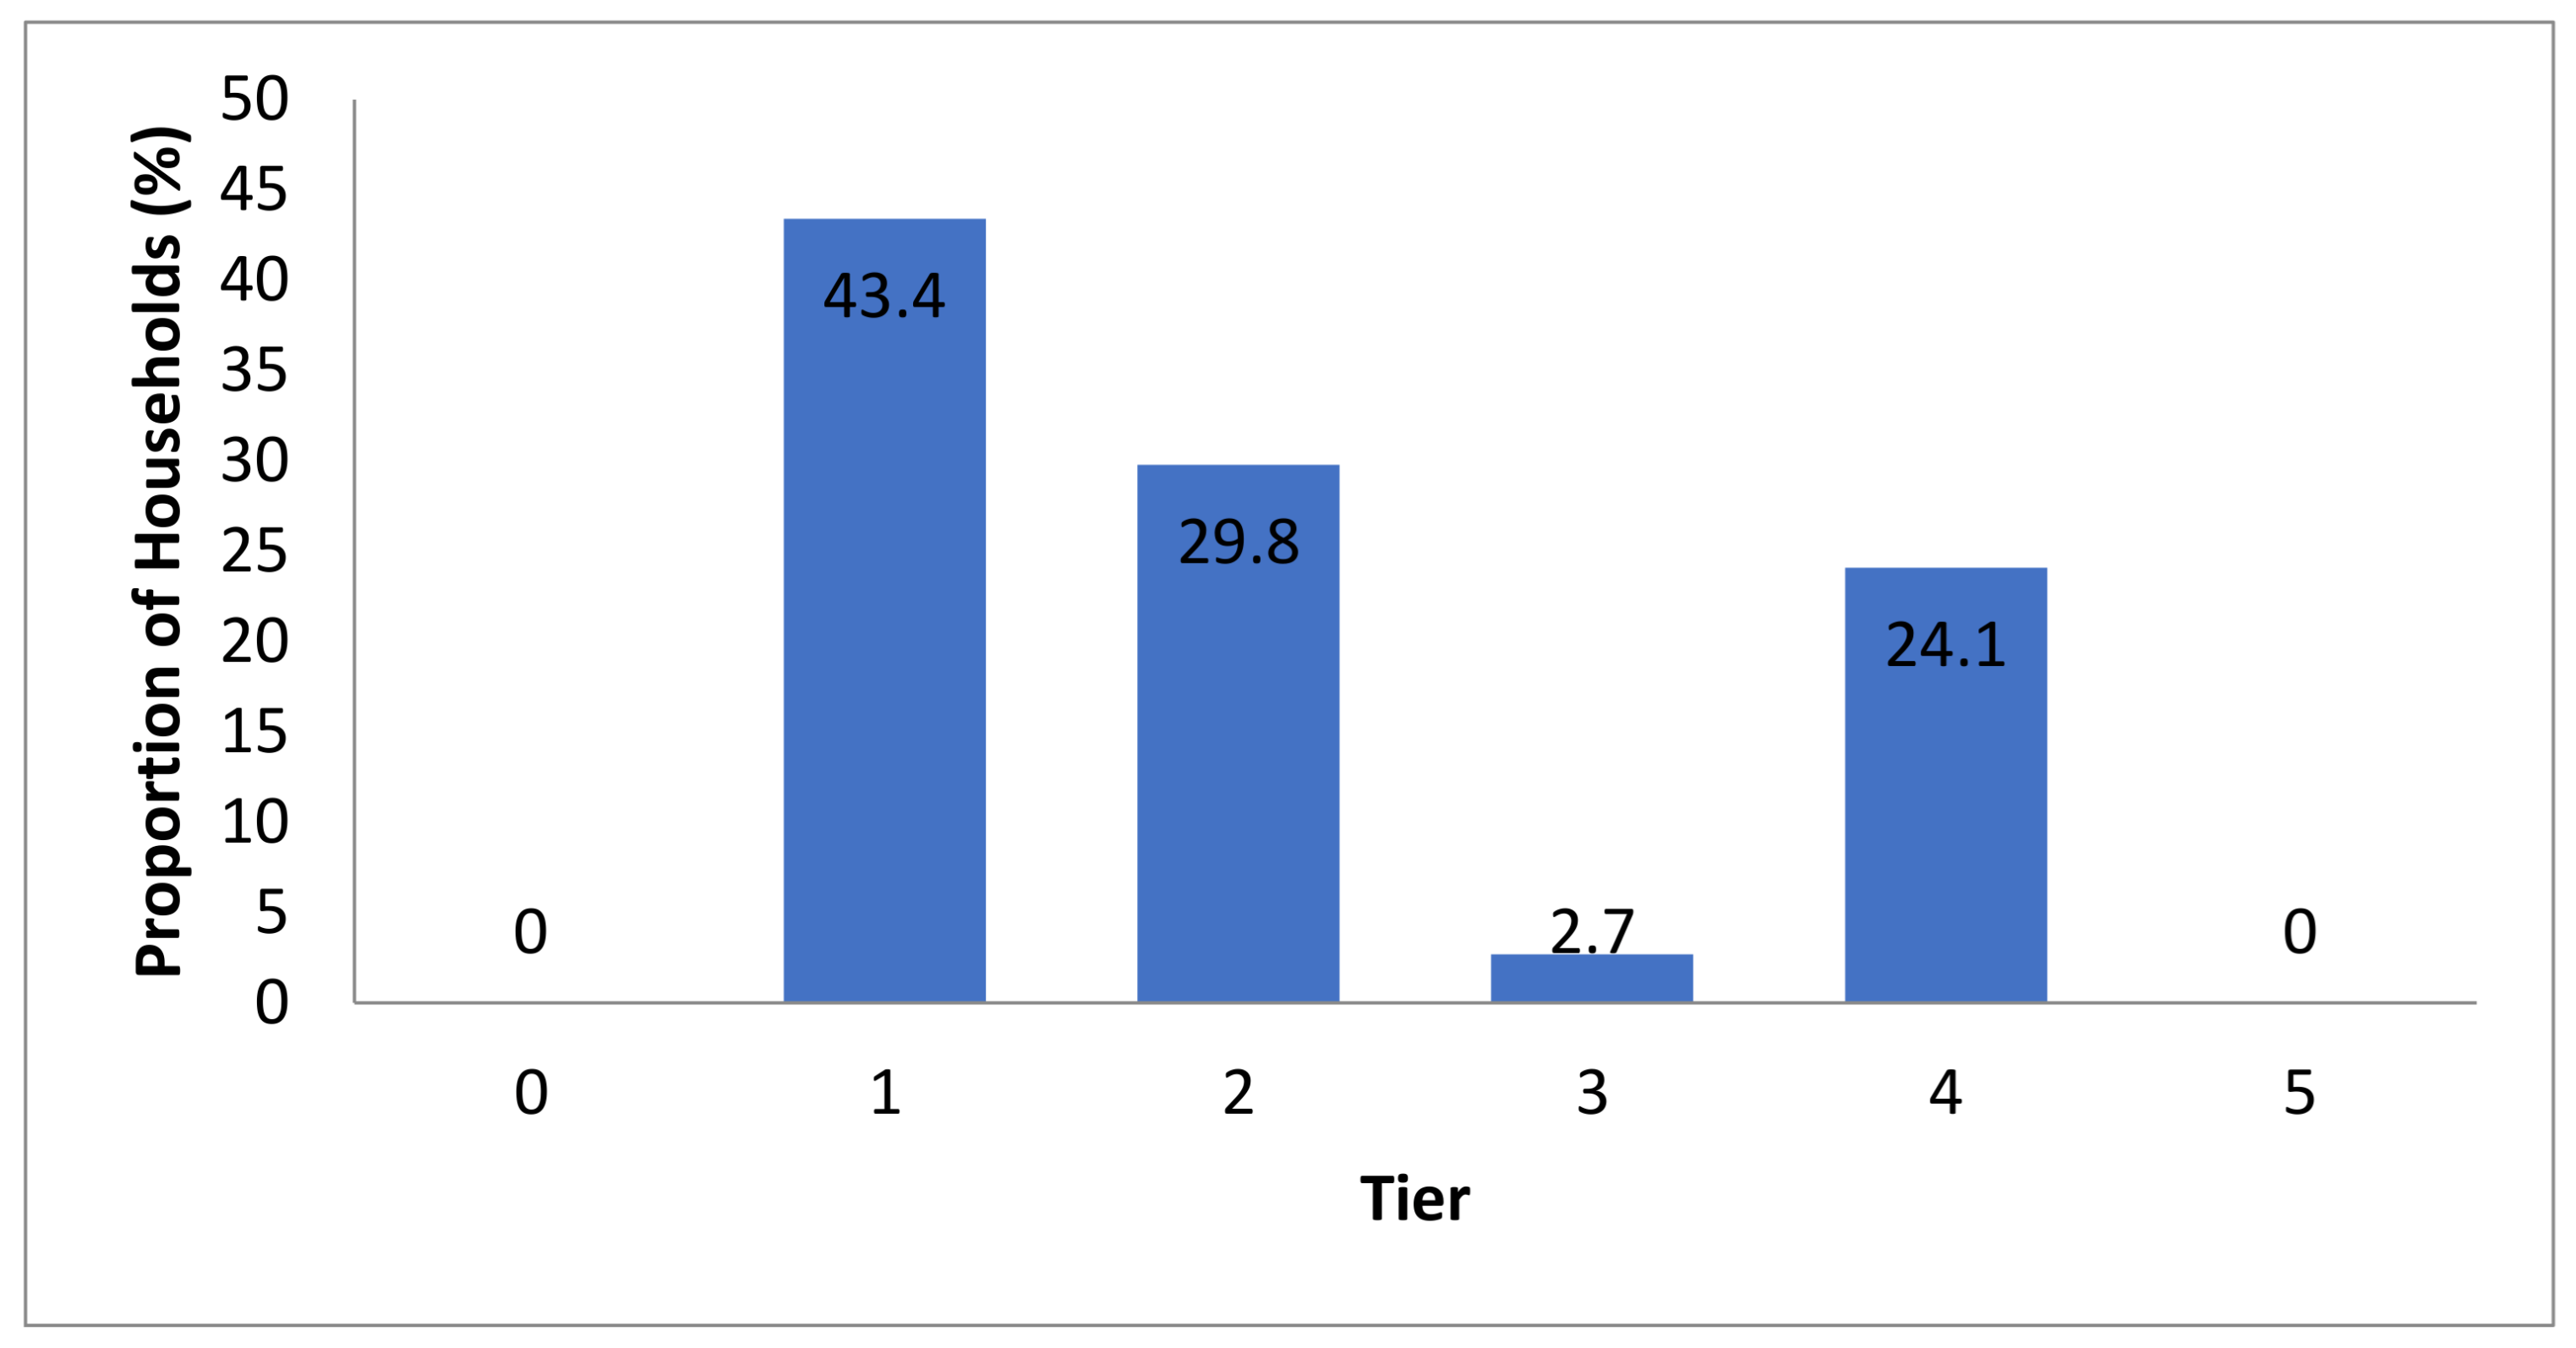
Table 1.
Format of questionnaire distribution.
| Isohyet | Stratum | Sampling Community | Estimated Population in 2019 | Estimated Number of Households | Number of Questionnaires Administered |
|---|---|---|---|---|---|
| South | Urban | Funtua | 190,092 | 31,682 | 397 |
| Rural | Kurigafaa | 2874 | 479 | 222 | |
| Central | Urban | Dutsinma | 78,275 | 13,682 | 390 |
| Rural | Kaikai | 1179 | 197 | 134 | |
| North | Urban | Katsina | 714,543 | 119,090 | 400 |
| Rural | Dan-Yashe | 3914 | 652 | 242 | |
| Total | 1,114,494 | 185,750 | 1785 | ||
Table 2.
Classification of household water, energy and food based on secure and unsecure access informing the questionnaire.
Table 2.
Classification of household water, energy and food based on secure and unsecure access informing the questionnaire.
| Variable | Secured | Unsecured |
|---|---|---|
| Access to water source (UNICEF and WHO [46]) | Piped water into dwelling Piped water to yard Public tap/standpipe Borehole/tube well Protected dug well Protected spring Rainwater | Unprotected spring Unprotected dug well Cart with tank or drum (water vending) Tanker truck Surface water |
| Access to sanitation facility (UNICEF and WHO [46]) | Flush toilet Pipe sewer system Septic tank Flush/pour to pit latrine Ventilated improved pit latrine Pit latrine with slab Compositing toilet | Flush/pour elsewhere Pit latrine without slab Bucket Hanging toilet No facility (open defecation) |
| Access to energy sources (WHO [47]) | Electricity Natural gas Liquefied petroleum gas Ethanol and methanol Kerosene | Coal Charcoal Fuelwood Agricultural residue Dung |
| Access to food flow and economic access [48,49] | Food security Bulk purchase Less frequent purchase | Food insecurity Small-quantity purchase High-frequency purchase |
Table 3.
Educational level and income of the household heads in the six sampling communities.
| Variable | Item | Location Category | |||||||||||
|---|---|---|---|---|---|---|---|---|---|---|---|---|---|
| Katsina | Dan-Yashe | Dutsinma | Kaikai | Funtua | Kuringafa | ||||||||
| N | % | N | % | N | % | n | % | n | % | n | % | ||
| Educational status | No education | 44 | 11.0 | 194 | 80.1 | 119 | 30.5 | 83 | 61.9 | 119 | 30.0 | 149 | 67.1 |
| Primary school | 55 | 13.7 | 35 | 14.5 | 81 | 20.8 | 25 | 18.7 | 42 | 10.6 | 40 | 18.0 | |
| Secondary school | 47 | 11.7 | 12 | 5.0 | 62 | 15.9 | 23 | 17.2 | 54 | 13.6 | 24 | 10.8 | |
| Ordinary National Diploma/National Certificate of Education | 90 | 22.5 | 1 | 0.4 | 48 | 12.3 | 3 | 2.2 | 58 | 14.6 | 7 | 3.2 | |
| University degree | 95 | 23.8 | - | - | 57 | 14.6 | - | - | 95 | 23.9 | 2 | 0.9 | |
| Advanced university degree | 69 | 17.3 | - | - | 23 | 5.9 | - | - | 29 | 7.3 | - | - | |
| Total | 400 | 100 | 242 | 100 | 390 | 100 | 134 | 100 | 397 | 100 | 222 | 100 | |
| Income/month | <N18,000 ($50) | 45 | 11.3 | 175 | 72.3 | 88 | 22.5 | 103 | 76.9 | 85 | 21.4 | 62 | 28.0 |
| N18,000–36,000 ($50–100) | 59 | 14.7 | 43 | 17.8 | 69 | 17.7 | 15 | 11.2 | 40 | 10.1 | 60 | 27.0 | |
| N36,001–72,000 (>$100–200) | 75 | 18.7 | 24 | 9.9 | 89 | 22.8 | 16 | 11.9 | 48 | 12.1 | 76 | 34.2 | |
| N72,001–144,000 (>$200–300) | 39 | 9.8 | - | - | 23 | 5.9 | - | - | 39 | 9.8 | 22 | 9.9 | |
| N144,001–180,000 (>400–500) | 60 | 15.0 | - | - | 79 | 20.3 | - | - | 61 | 15.4 | 2 | 0.9 | |
| Above 180,000 (>$500) | 122 | 30.5 | - | - | 42 | 10.8 | - | - | 124 | 31.2 | - | - | |
| Total | 400 | 100 | 242 | 100 | 390 | 100 | 134 | 100 | 397 | 100 | 222 | 100 | |
Table 4.
Correlation between household head educational status and income.
| Isohyet | Stratum | Sampling Community | Number of Household Heads | PPMC (r Value) | p-Value |
|---|---|---|---|---|---|
| South | Urban | Funtua | 397 | 0.640 | 0.000 |
| Rural | Kurigafaa | 222 | 0.458 | 0.000 | |
| Central | Urban | Dutsinma | 390 | 0.532 | 0.000 |
| Rural | Kaikai | 134 | 0.238 | 0.001 | |
| North | Urban | Katsina | 400 | 0.782 | 0.000 |
| Rural | Dan-Yashe | 397 | 0.366 | 0.000 |
PPMC, Pearson Product Moment Correlation.
Table 5.
Various household water sources across the sampling areas.
| Water Source | Community | |||||||||||
|---|---|---|---|---|---|---|---|---|---|---|---|---|
| Katsina | Dan-Yashe | Dutsinma | Kaikai | Funtua | Kuringafa | |||||||
| N | % | n | % | n | % | n | % | n | % | n | % | |
| Pipe water into dwelling | 26 | 6.5 | - | - | - | - | - | - | 7 | 1.7 | - | - |
| Pipe water to yard | 1 | 0.2 | - | - | - | - | - | - | 27 | 6.8 | - | - |
| Public tap | 7 | 1.8 | - | - | 3 | 0.8 | - | - | 1 | 0.3 | - | - |
| Private borehole | 143 | 35.8 | - | - | 80 | 20.5 | - | - | 117 | 29.5 | 1 | 0.4 |
| Public borehole | 30 | 7.5 | 12 | 5.0 | 31 | 8.0 | 18 | 13.4 | 46 | 11.6 | 52 | 23.4 |
| Protected dug well | 20 | 5.0 | - | - | 22 | 5.6 | 7 | 5.2 | 21 | 5.3 | 29 | 13.1 |
| Unprotected dug well | 1 | 0.2 | 24 | 9.9 | 45 | 11.5 | 8 | 6.0 | 77 | 19.4 | 64 | 28.8 |
| Water vendor | 161 | 40.2 | 108 | 44.6 | 133 | 34.1 | 55 | 41.1 | 72 | 18.1 | 7 | 3.2 |
| Surface water | - | - | - | - | - | - | - | - | - | - | 69 | 31.1 |
| Tanker truck | 11 | 2.8 | 98 | 40.5 | 76 | 19.5 | 46 | 34.3 | 29 | 7.3 | - | - |
| Total | 400 | 100 | 242 | 100 | 390 | 100 | 134 | 100 | 397 | 100 | 222 | 100 |
n, sample number.
Table 6.
The household water access service ladder.
| Service Level | Definition | Proportion (%) |
|---|---|---|
| Safely Managed | Access to water from an improved source that is located on premises, available when needed and free from faecal and priority chemical contaminant. | 16.5 |
| Basic | Access to household water from an improved source, AND provided collection time is not more than 30 min for a round trip, including queuing. | 10.2 |
| Limited | Access to household water from an improved source, for which collection time exceeds 30 min for a round trip, including queuing. | 12.5 |
| Unimproved | Access to household water from an unprotected dug well, tanker truck and water vending. | 56.9 |
| Surface Water | Access to household water directly from surface water. | 3.9 |
Table 7.
Household sanitation facilities across the sampling areas.
| Sanitation Facility | Community | |||||||||||
|---|---|---|---|---|---|---|---|---|---|---|---|---|
| Katsina | Dan-Yashe | Dutsinma | Kaikai | Funtua | Kuringafa | |||||||
| n | % | n | % | n | % | N | % | n | % | N | % | |
| Septic tank | 215 | 53.7 | - | - | 109 | 27.9 | - | - | 178 | 44.8 | 1 | 0.4 |
| Pit latrine with slab | 133 | 33.3 | 18 | 7.4 | 157 | 40.3 | 22 | 16.4 | 143 | 36.0 | 96 | 43.2 |
| Pit latrine without slab | 52 | 13.0 | 206 | 85.2 | 124 | 31.8 | 112 | 83.6 | 75 | 18.9 | 122 | 55.0 |
| No facility (open defecation) | - | - | 18 | 7.4 | - | - | - | - | 1 | 0.3 | 3 | 1.4 |
| Total | 400 | 100 | 242 | 100 | 390 | 100 | 134 | 100 | 397 | 100 | 222 | 100 |
n, sample number.
Table 8.
The households’ sanitation facilities access services ladder.
| Service Level | Definition | Proportion (%) |
|---|---|---|
| Safely managed | Access to improved facilities not shared with households, and excretes are safely disposed either in situ or transported and treated offsite. | 28.1 |
| Basic | Access to improved facilities that are not shared with households. | 26.7 |
| Limited | Access to improved facilities that are shared with households. | 5.3 |
| Unimproved | Access to pit latrines without a slab, bucket or hanging latrines. | 38.7 |
| Open defecation | Disposal of human faeces in the open field/spaces. | 1.2 |
Table 9.
Various household energy sources across the sampling areas.
| Energy Source | Community | |||||||||||
|---|---|---|---|---|---|---|---|---|---|---|---|---|
| Katsina | Dan-Yashe | Dutsinma | Kaikai | Funtua | Kuringafa | |||||||
| n | % | n | % | N | % | n | % | n | % | n | % | |
| Electricity | 15 | 3.7 | - | - | - | - | - | - | - | - | - | - |
| Cooking gas (liquefied petroleum gas) | 180 | 45.0 | - | - | 100 | 25.6 | - | - | 160 | 40.3 | - | - |
| Kerosene | 2 | 0.5 | - | - | 1 | 0.3 | - | - | - | - | - | - |
| Charcoal | 17 | 4.2 | - | - | 11 | 2.8 | 2 | 1.5 | 5 | 1.2 | 9 | 4.1 |
| Sawdust | 3 | 0.8 | - | - | 1 | 0.3 | - | - | - | - | - | - |
| Fuelwood | 180 | 45.0 | 131 | 54.1 | 276 | 70.7 | 125 | 93.3 | 221 | 55.7 | 145 | 65.3 |
| Agricultural residue | 3 | 0.8 | 104 | 43.0 | 1 | 0.3 | 7 | 5.2 | 11 | 2.8 | 62 | 27.9 |
| Dung | - | - | 7 | 2.9 | - | - | - | - | - | - | 6 | 2.7 |
| Total | 400 | 100 | 242 | 100 | 390 | 100 | 134 | 100 | 397 | 100 | 222 | 100 |
n, sample number.
Table 10.
Frequency of household food purchase.
| Frequency of Food Purchase | Community | |||||||||||
|---|---|---|---|---|---|---|---|---|---|---|---|---|
| Katsina | Dan-Yashe | Dutsinma | Kaikai | Funtua | Kuringafa | |||||||
| N | % | n | % | n | % | n | % | n | % | n | % | |
| Produced own food | 37 | 9.2 | 60 | 24.7 | 43 | 11.0 | 37 | 27.6 | 81 | 20.4 | 77 | 34.7 |
| Daily | 54 | 13.5 | 82 | 33.9 | 125 | 32.1 | 69 | 51.5 | 79 | 20.0 | 49 | 22.1 |
| Weekly | 55 | 13.8 | 96 | 39.7 | 84 | 21.5 | 20 | 14.9 | 71 | 17.8 | 74 | 33.3 |
| Monthly | 254 | 63.5 | 4 | 1.7 | 138 | 35.4 | 8 | 6.0 | 166 | 41.8 | 22 | 9.9 |
| Total | 400 | 100 | 242 | 100 | 390 | 100 | 134 | 100 | 397 | 100 | 222 | 100 |
n, sample number.
Table 11.
Tracking progress towards achieving sustainable development goals (SDG) using relevant indicators in Katsina state.
Table 11.
Tracking progress towards achieving sustainable development goals (SDG) using relevant indicators in Katsina state.
| SDG | SDG Indicator | Indicator’s Description | Context |
|---|---|---|---|
| SDG 1: End poverty | 1.1.1 | “Proportion of population below the international poverty line, sex, age, employment status and geographical region (urban/rural)” | At least 31.3% of respondents lived below the 2020 international poverty line at the time of the survey ($1.90/person/day). Precise data for respondents’ incomes were not obtainable, as data on income were collected as an ordinal variable. |
| 1.2.1 | Population living below the national poverty thershhold | 22.9% of respondents lived below the national poverty line of N137,430 ($381)/person/year. The proportion of people living below the poverty line could be marginally higher, considering that precise figures for respondents’ incomes were not available as data on income were collected as an ordinal variable. | |
| SDG 2: Zero hunger | 2.1.2 | “Prevalence of moderate or severe food insecurity in a population based on the Food Insecurity Experience Scale” | 25.7% and 22.4% of the surveyed households bought food stuff on a daily (severe food insecurity) or weekly (moderate food insecurity) basis, respectively. |
| SDG 3: Health and well-being | 3.9.1 | “Mortality attributed household and ambient air pollution” | 72.3% of households were using solid fuels (fuel wood, saw dust, charcoal, agricultural residue and dung). 1078 households accessed fuel wood for cooking. 40.2% and 49.8% households used modern moulded (higher burning efficiency stove) and traditional three stone stoves, respectively. |
| 3.9.2 | “Mortality attributed to unsafe water, sanitation and lack of hygiene” | Results indicated that 60.7% and 39.9%) of the surveyed households reported to have various sources of unimproved water, and sanitation facility access, respectively. | |
| SDG 6: Clean water and sanitation | 6.1.1 | “Proportion of population using safely managed drinking water services” | 39.3% of households had access to a basic drinking water source. This includes piped water into dwellings, yards or plots, public taps or standpipes, boreholes, protected dug wells and rainwater. |
| SDG 7: Affordable and clean energy | 7.1.1 | “Proportion of population with access to electricity” | 76.5% of the surveyed households were connected to the national electricity grid (erratic and unsustainable supply of the electricity) relevant to indicator 7.1.1. The access to electricity index was 1.84. |
| 7.1.2 | “Proportion of population with primary reliance on clean fuels and technology | 27.2% of households were using non-solid fuel (electricity, cooking gas and electricity), contrary to 72.3% of households relying on various solid fuel sources (fuel wood, saw dust, charcoal, agricultural residue and dung) for cooking. | |
| SDG 11: Sustainable cities and communities | 11.1.1 | “Proportion of urban population living in slums, informal settlements or inadequate housing” | Only 39.2% of the investigated urban households lived in formal dwellings. |
Publisher’s Note: MDPI stays neutral with regard to jurisdictional claims in published maps and institutional affiliations. |
© 2021 by the authors. Licensee MDPI, Basel, Switzerland. This article is an open access article distributed under the terms and conditions of the Creative Commons Attribution (CC BY) license (https://creativecommons.org/licenses/by/4.0/).
Share and Cite
MDPI and ACS Style
Sani, Y.; Scholz, M. Water-Energy-Food Accessibility and Tracking Progress towards Achieving Sustainable Development Goals in the Savannah Region of Katsina State, Nigeria. Water 2021, 13, 3595. https://doi.org/10.3390/w13243595
AMA Style
Sani Y, Scholz M. Water-Energy-Food Accessibility and Tracking Progress towards Achieving Sustainable Development Goals in the Savannah Region of Katsina State, Nigeria. Water. 2021; 13(24):3595. https://doi.org/10.3390/w13243595
Chicago/Turabian StyleSani, Yahaya, and Miklas Scholz. 2021. "Water-Energy-Food Accessibility and Tracking Progress towards Achieving Sustainable Development Goals in the Savannah Region of Katsina State, Nigeria" Water 13, no. 24: 3595. https://doi.org/10.3390/w13243595
Note that from the first issue of 2016, this journal uses article numbers instead of page numbers. See further details here.