
Simulation of Daily Snow Depth Data in China Based on the NEX-GDDP

1
State Key Laboratory of Cryospheric Science, Northwest Institute of Eco-Environment and Resources, Chinese Academy of Sciences, Lanzhou 730030, China
2
Key Laboratory of Ecohydrology of Inland River Basin, Northwest Institute of Eco-Environment and Resources, Chinese Academy of Sciences, Lanzhou 730030, China
3
University of Chinese Academy of Sciences, Beijing 100049, China
4
College of Resource and Environment, University of Chinese Academy of Sciences, Beijing 100049, China
5
China-Pakistan Joint Research Center on Earth Sciences, CAS-HEC, Islamabad 45320, Pakistan
*
Author to whom correspondence should be addressed.
†
The first two authors contributed equally to this paper.
Water 2021, 13(24), 3599; https://doi.org/10.3390/w13243599
Submission received: 31 October 2021
/
Revised: 9 December 2021
/
Accepted: 10 December 2021
/
Published: 15 December 2021
(This article belongs to the Special Issue The Role of Snow in High-Mountain Hydrologic Cycle)
Abstract
:In this study, a backpropagation artificial neural network snow simulation model (BPANNSIM) is built using data collected from the National Climate Reference Station to obtain simulation data of China’s future daily snow depth in terms of representative concentration pathways (RCP4.5 and RCP8.5). The input layer of the BPANNSIM comprises the current day’s maximum temperature, minimum temperature, snow depth, and precipitation data, and the target layer comprises snow depth data of the following day. The model is trained and validated based on data from the National Climate Reference Station over a baseline period of 1986–2005. Validation results show that the temporal correlations of the observed and the model iterative simulated values are 0.94 for monthly cumulative snow cover duration and 0.88 for monthly cumulative snow depth. Subsequently, future daily snow depth data (2016–2065) are retrieved from the NEX-GDPP dataset (Washington, DC/USA: the National Aeronautics and Space Administration(NASA)Earth Exchange/Global Daily Downscaled Projections data), revealing that the simulation data error is highly correlated with that of the input data; thus, a validation method for gridded meteorological data is proposed to verify the accuracy of gridded meteorological data within snowfall periods and the reasonability of hydrothermal coupling for gridded meteorological data.
1. Introduction
Snow cover is an important component of the cryosphere and indicator of climate change [1] as its properties change rapidly in response to changes in heat and water on the earth’s surface [2,3,4]. Snowfall also has an important impact on socioeconomic factors of humanity; for example, insufficient snowfall in spring can lead to drought, and excessive snowfall can create disasters, such as snow-melt floods, and major property losses [5,6,7,8,9]. Therefore, the effective prediction and detection of various snowfall parameters are crucial for alleviating or minimizing these effects. At present, the primary methods of acquiring snow parameter data include (1) on-site observations of meteorological stations [10]; (2) optical remote sensing methods for identifying the extent of snow cover, based on the high reflectivity of snow in the visible band, and low reflectivity in the NIR band to define a normalized difference snow index (NDSI) [11]; (3) passive microwave remote sensing for global/regional snow depth and snow water equivalent observations [12,13,14]; and (4) fusion of optical and microwave remote sensing inversions [15]. Thus, snow depth data acquisition mainly depends on two approaches: remote sensing observations and onsite observations.
Under changing global climate conditions, snow cover can serve as an important indicator. Accordingly, scientists have carried numerous studies examining the change in snow cover over historical periods [3,4,6,16], the relationship between snow cover change and climate, and the impact of snow cover change on human productivity. Some analyses have also studied future changes in snow cover based on the experimental data of the Coupled Model Intercomparison Project (CMIP) organized by the World Climate Research Programme (WCRP) [17,18]; however, there are few studies on the future daily snow depth, as snow accumulation and melting is a complex process affected by many factors, such as temperature, precipitation, wind speed, solar radiation, underlying surface type, and altitude [11,15,19].
Here, using NASA Earth Exchange/Global Daily Downscaled Projections data, future daily depth was simulated based on a selection of factors affecting the snow accumulation process in accordance with Leathers and Luff who found that the duration of snow is highly correlated with snowfall and temperature [20]. Here, snowfall (weight equivalent to solid precipitation in NEX-GDDP data) and temperature were selected as the input variables for simulating snow depth. A backpropagation neural network snow simulation model (BPNNSIM) was built using MATLAB, and data on the current daily snow depth, daily minimum air temperature, daily maximum air temperature, and daily precipitation were used to predict the next day’s snow depth. The neural network was trained, and model accuracy was verified with Climate Reference Station data. Based on the BPNNSI, the NEX-GDDP data were used as model input to simulate future snow depth in China. The NEX-GDDP data comprise the first multimodal high-resolution dataset based on Coupled Model Intercomparison Project Phase 5 (CMIP5) released by NASA in 2015 (Table 1). A statistical downscaling method was used to convert the daily precipitation, maximum and minimum air temperature data from 21 CMIP5 models during the historical period from 1986 to 2005, and two future climate scenarios (RCP4.5 and RCP8.5) over the projection period from 2006 to 2100, at a spatial resolution of 0.25° × 0.25° [21]. Comparatively, NEX-GDDP data have a higher and more uniform spatial resolution than CMIP5, and many studies have shown that the former can better reflect the characteristics of regional climate change in China than the direct use of CMIP5 data [22,23,24]. CMIP6 data are in the release and preliminary application stage, and the resolution of each mode varies greatly [25]; thus, the consistently higher and more uniform resolution of NEX-GDDP will continue to maintain high application value. Accordingly, the future daily snow depth dataset simulated using the NEX-GDDP can inform future research on snow cover and snow disaster risk assessment.
This paper is structured as follows: methods and data are presented in Section 2; Section 3 contains the results of the findings, including BPNNSIM construction, validation, and simulation of future daily snow depths in China; sources of errors in simulated snow depth data are discussed in Section 4; conclusions are presented in Section 5.
2. Materials and Methods
2.1. Data
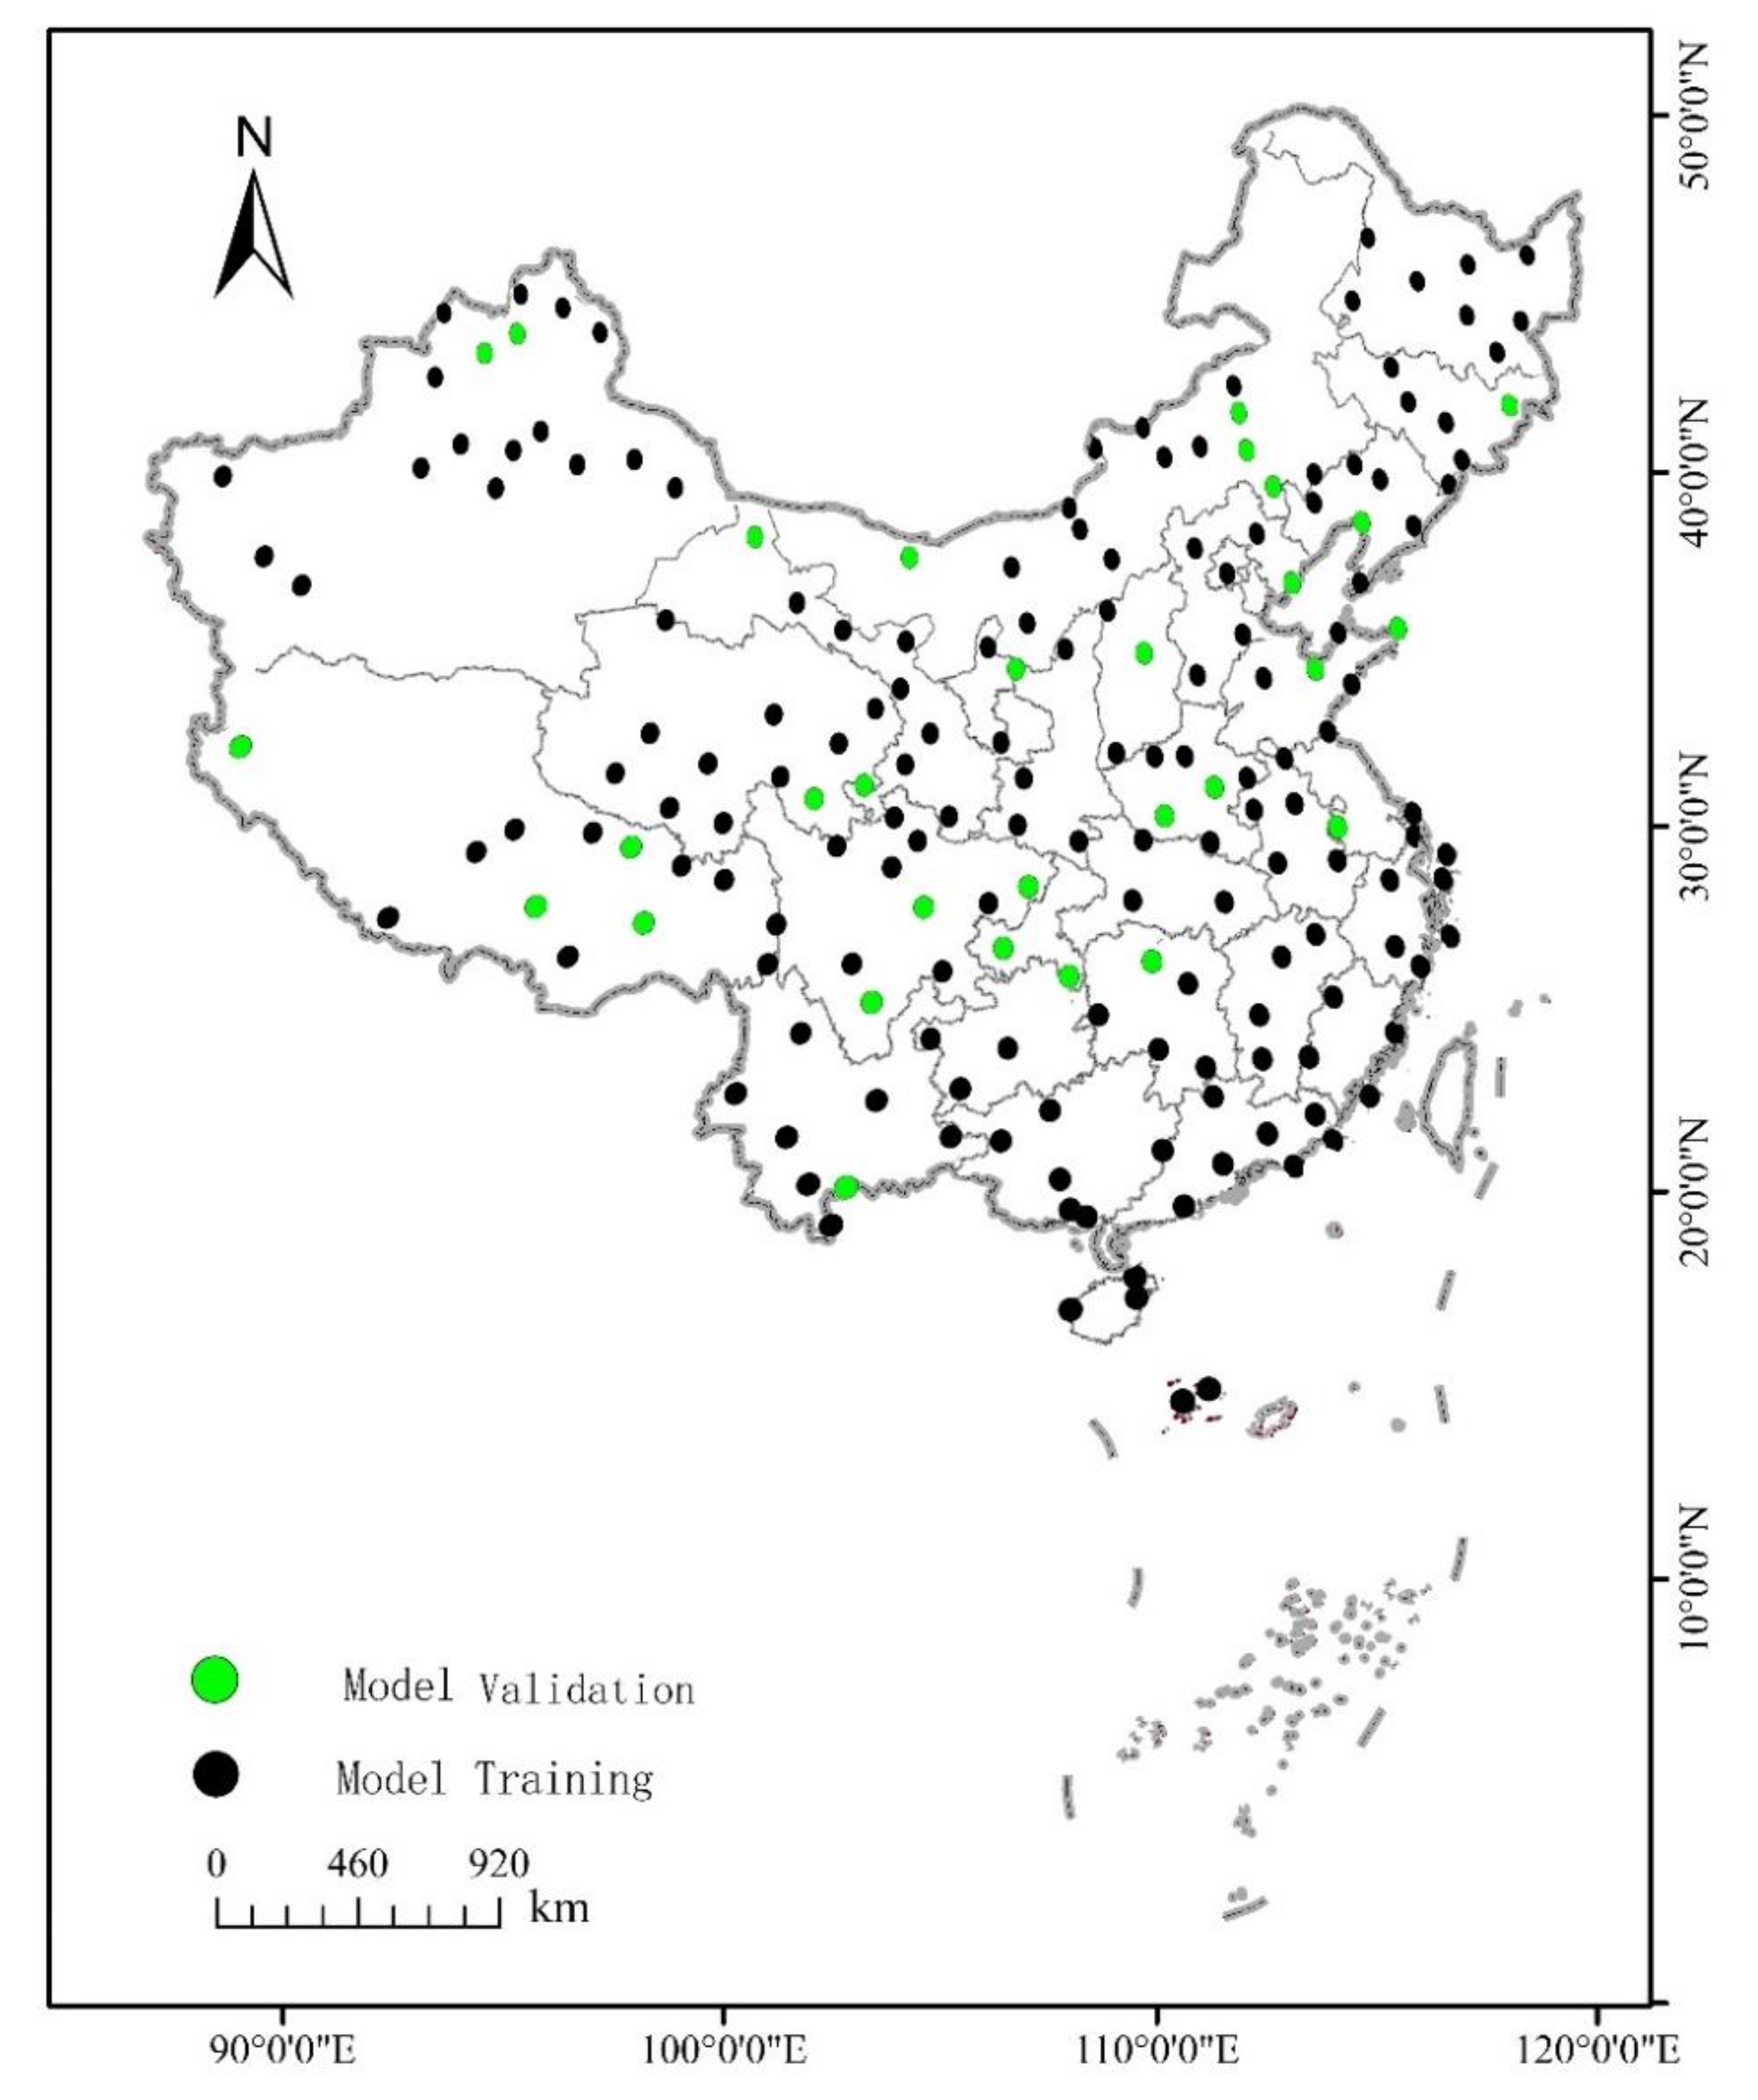
National Climate Reference Station data (1986–2005) were provided by the National Meteorological Science Data Center of China (12 December 2021: http://www.cma.gov.cn/2011qxfw/2011qsjgx/) and contained information on the daily maximum and minimum temperatures, precipitation, and snow depth. For a more complete time series of the various meteorological elements, 185 stations were selected. Among them, the data from 155 stations were randomly selected for model training, while data from the remaining 30 stations were used for model validation (Figure 1).
The NEX-GDDP dataset (12 December 2021: https://www.nccs.nasa.gov/services/) was released by NASA in 2015, and includes historical data for 1986–2005, and those for two future climate projection scenarios (RCP4.5 and RCP8.5) from 2006–2100, with a spatial resolution of 0.25° × 0.25°. Information on the 21 CMIP5 global climate models in this dataset is shown in Table 1.
The long-term snow depth dataset of China was derived from passive microwave remote sensing data, which provides the daily snow depth distribution in China from 24 October 1978 to 31 December 2012, at a spatial resolution of 0.25° × 0.25° [13].
2.2. Model Building and Validation Methods
2.2.1. Construction of Snow Depth Simulation Model
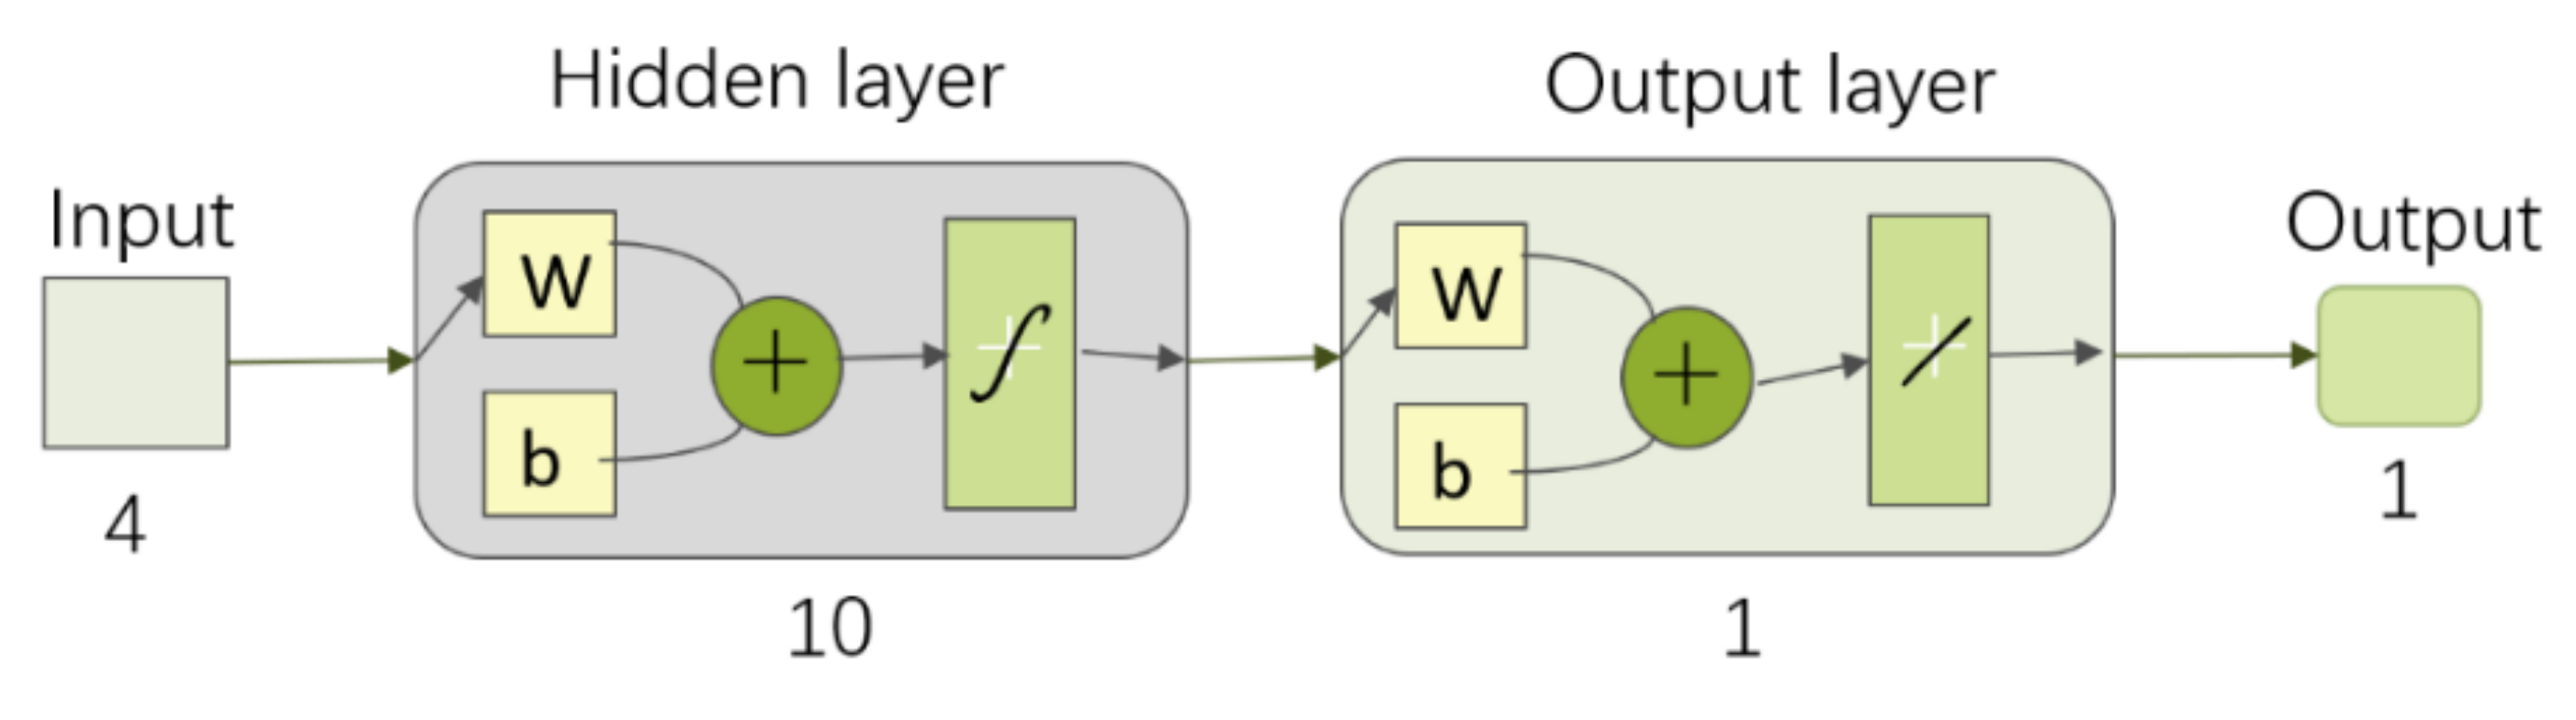
Deep learning is a recent research direction in the field of machine learning, where the rapid development of computer technology has made artificial intelligence (AI) more attainable. Recently, artificial neural networks (ANNs) have been applied in various fields, and widely used in geographical research [26,27]. Here, a backpropagation (BP) network was selected and built using MATLAB (Figure 2). A total of 155 sites were used to train the BP neural network, comprising 1,133,050 training and test samples.
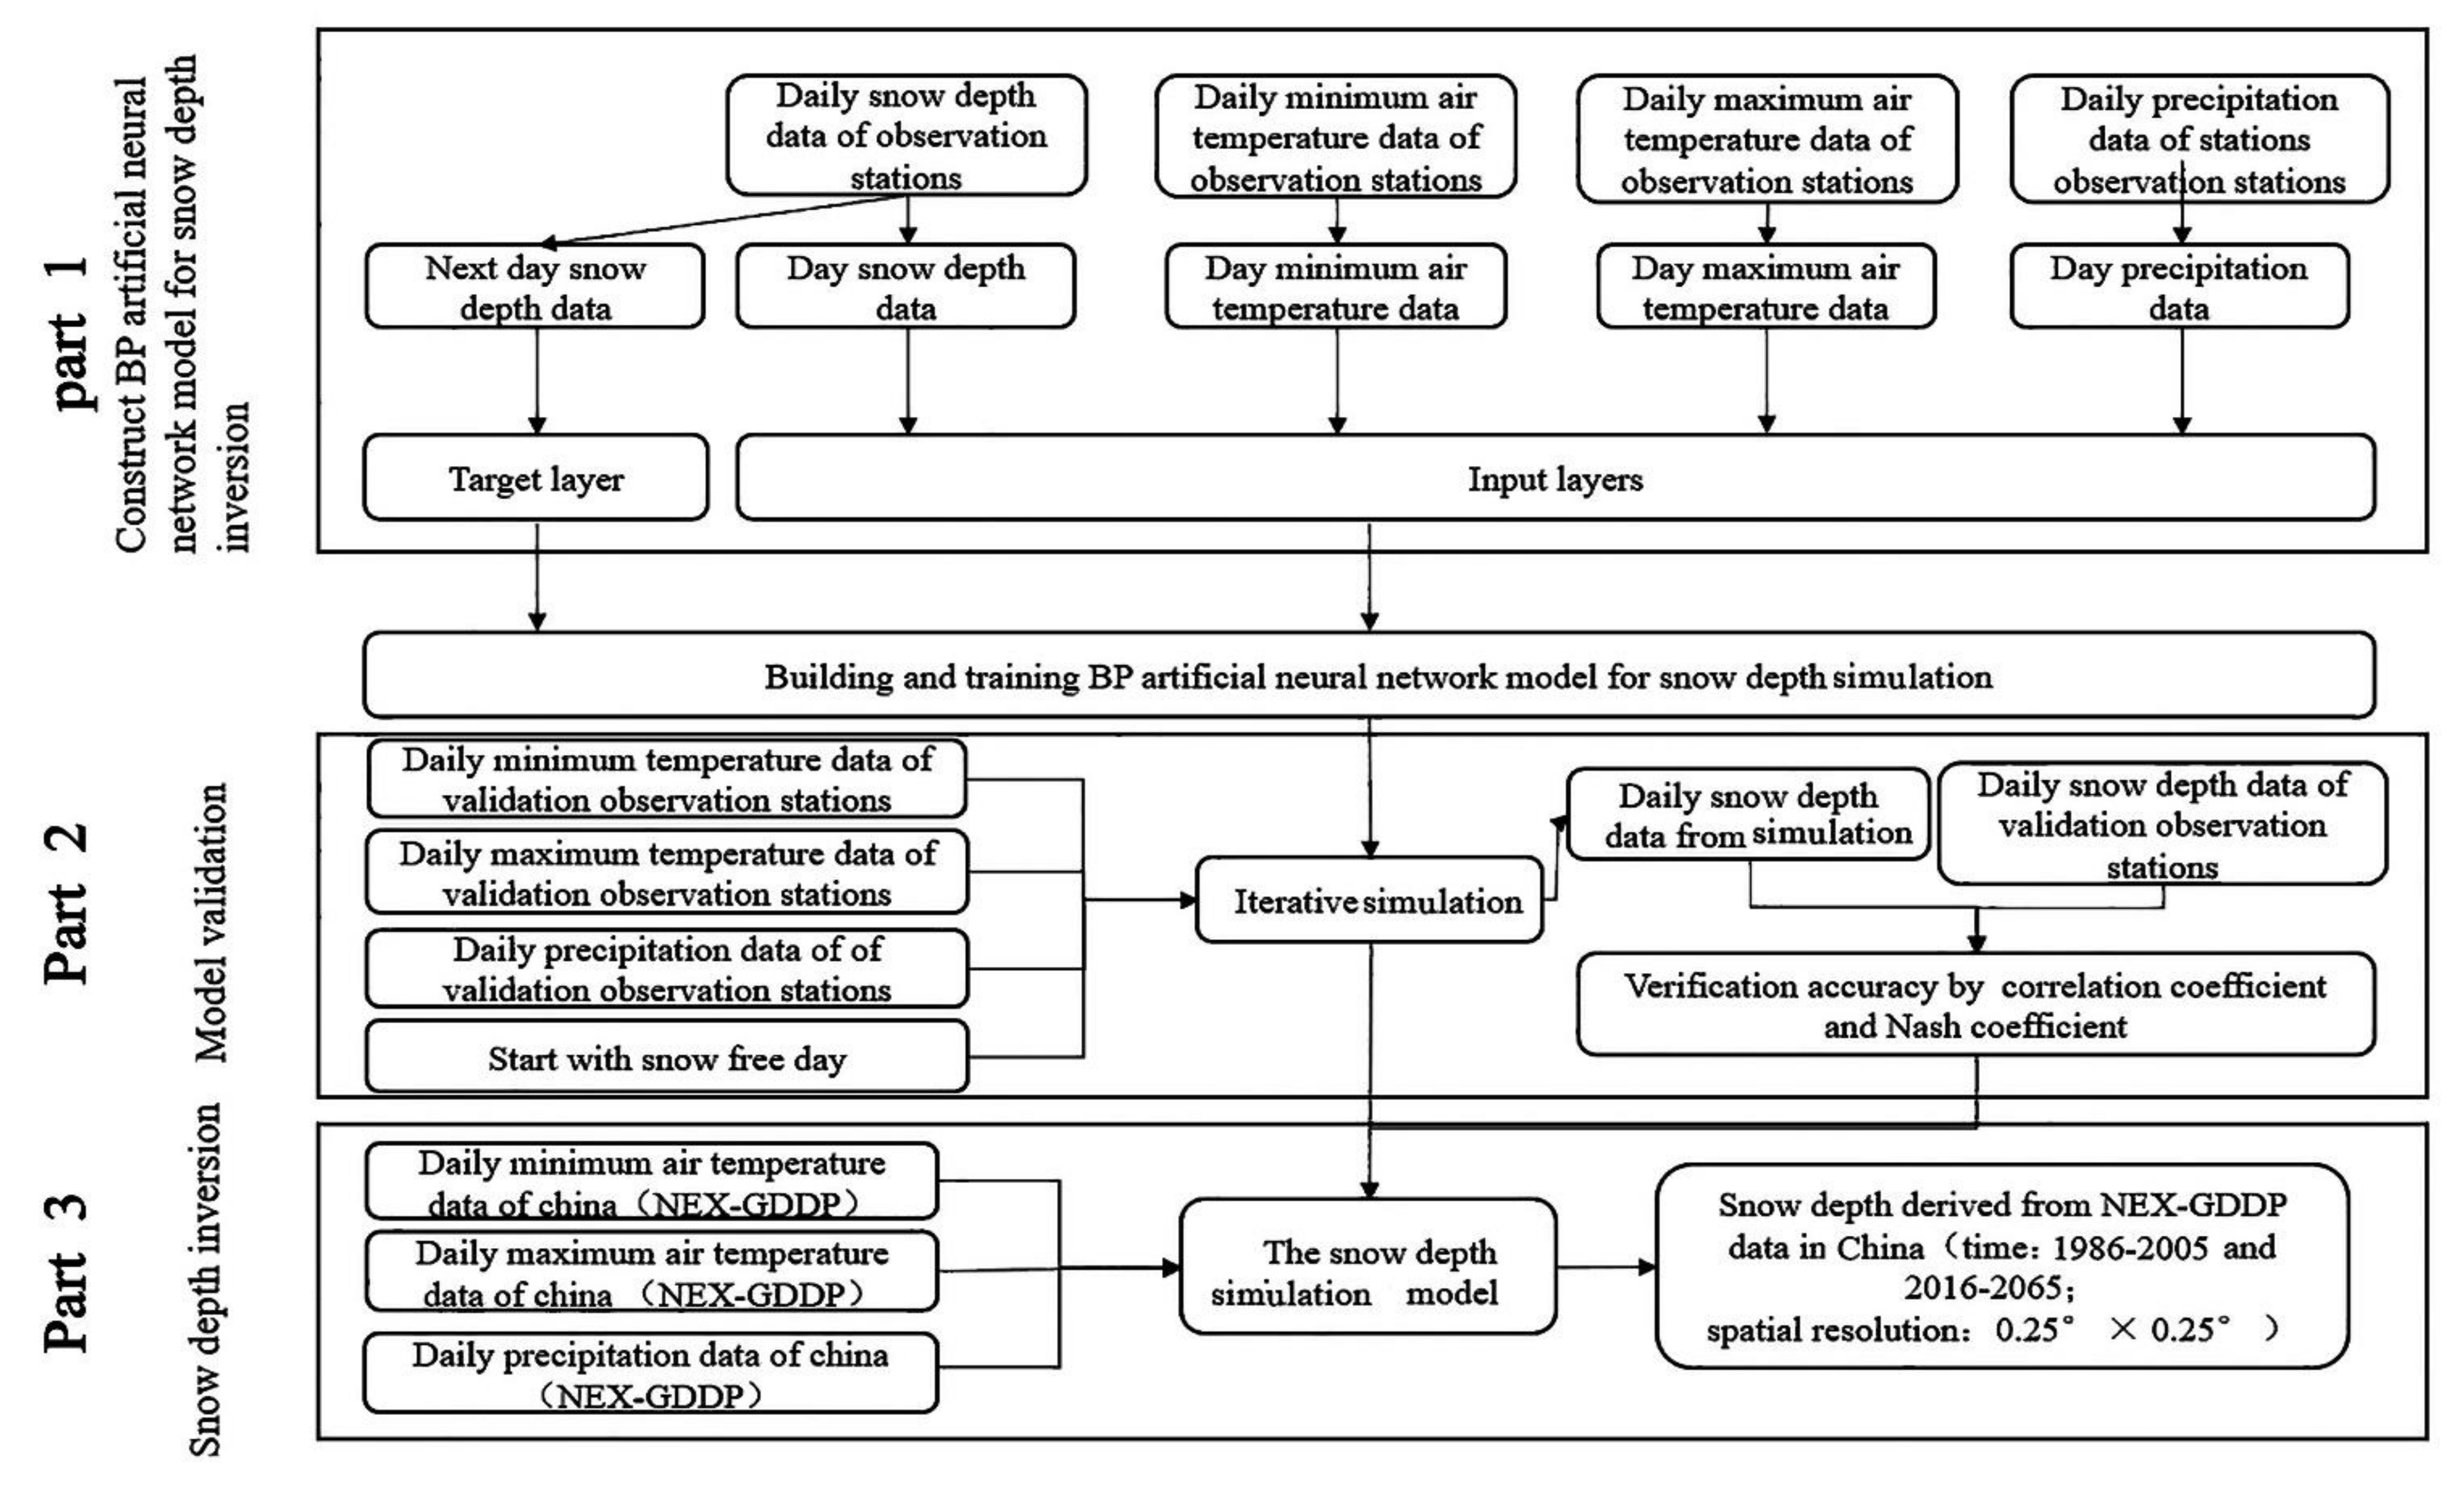
- Selection of input and output layer variables. The input layer included data of daily maximum and minimum temperatures, daily precipitation, and daily snow depth from the National Climate Reference Stations to predict the next day snow depth data at the National Climate Reference Station (Figure 3, Part 1).
- Determining the number of hidden layer nodes for network training (Equation (1)):where p is the number of hidden nodes, n is the number of input layer nodes (n = 4 here), m is the number of output layer nodes (m = 1 here), and a is a constant in the range from 1 to 10. Through trial and error, it was revealed that the training effect was the best when the p = 10.
- Setting the network training parameter is critical to model accuracy. To this end, trained sample data and test samples were compared numerous times, for determining the number of parameters in the BPNNSIM (Table 2).
2.2.2. Verification of Model Iteration Simulation Accuracy
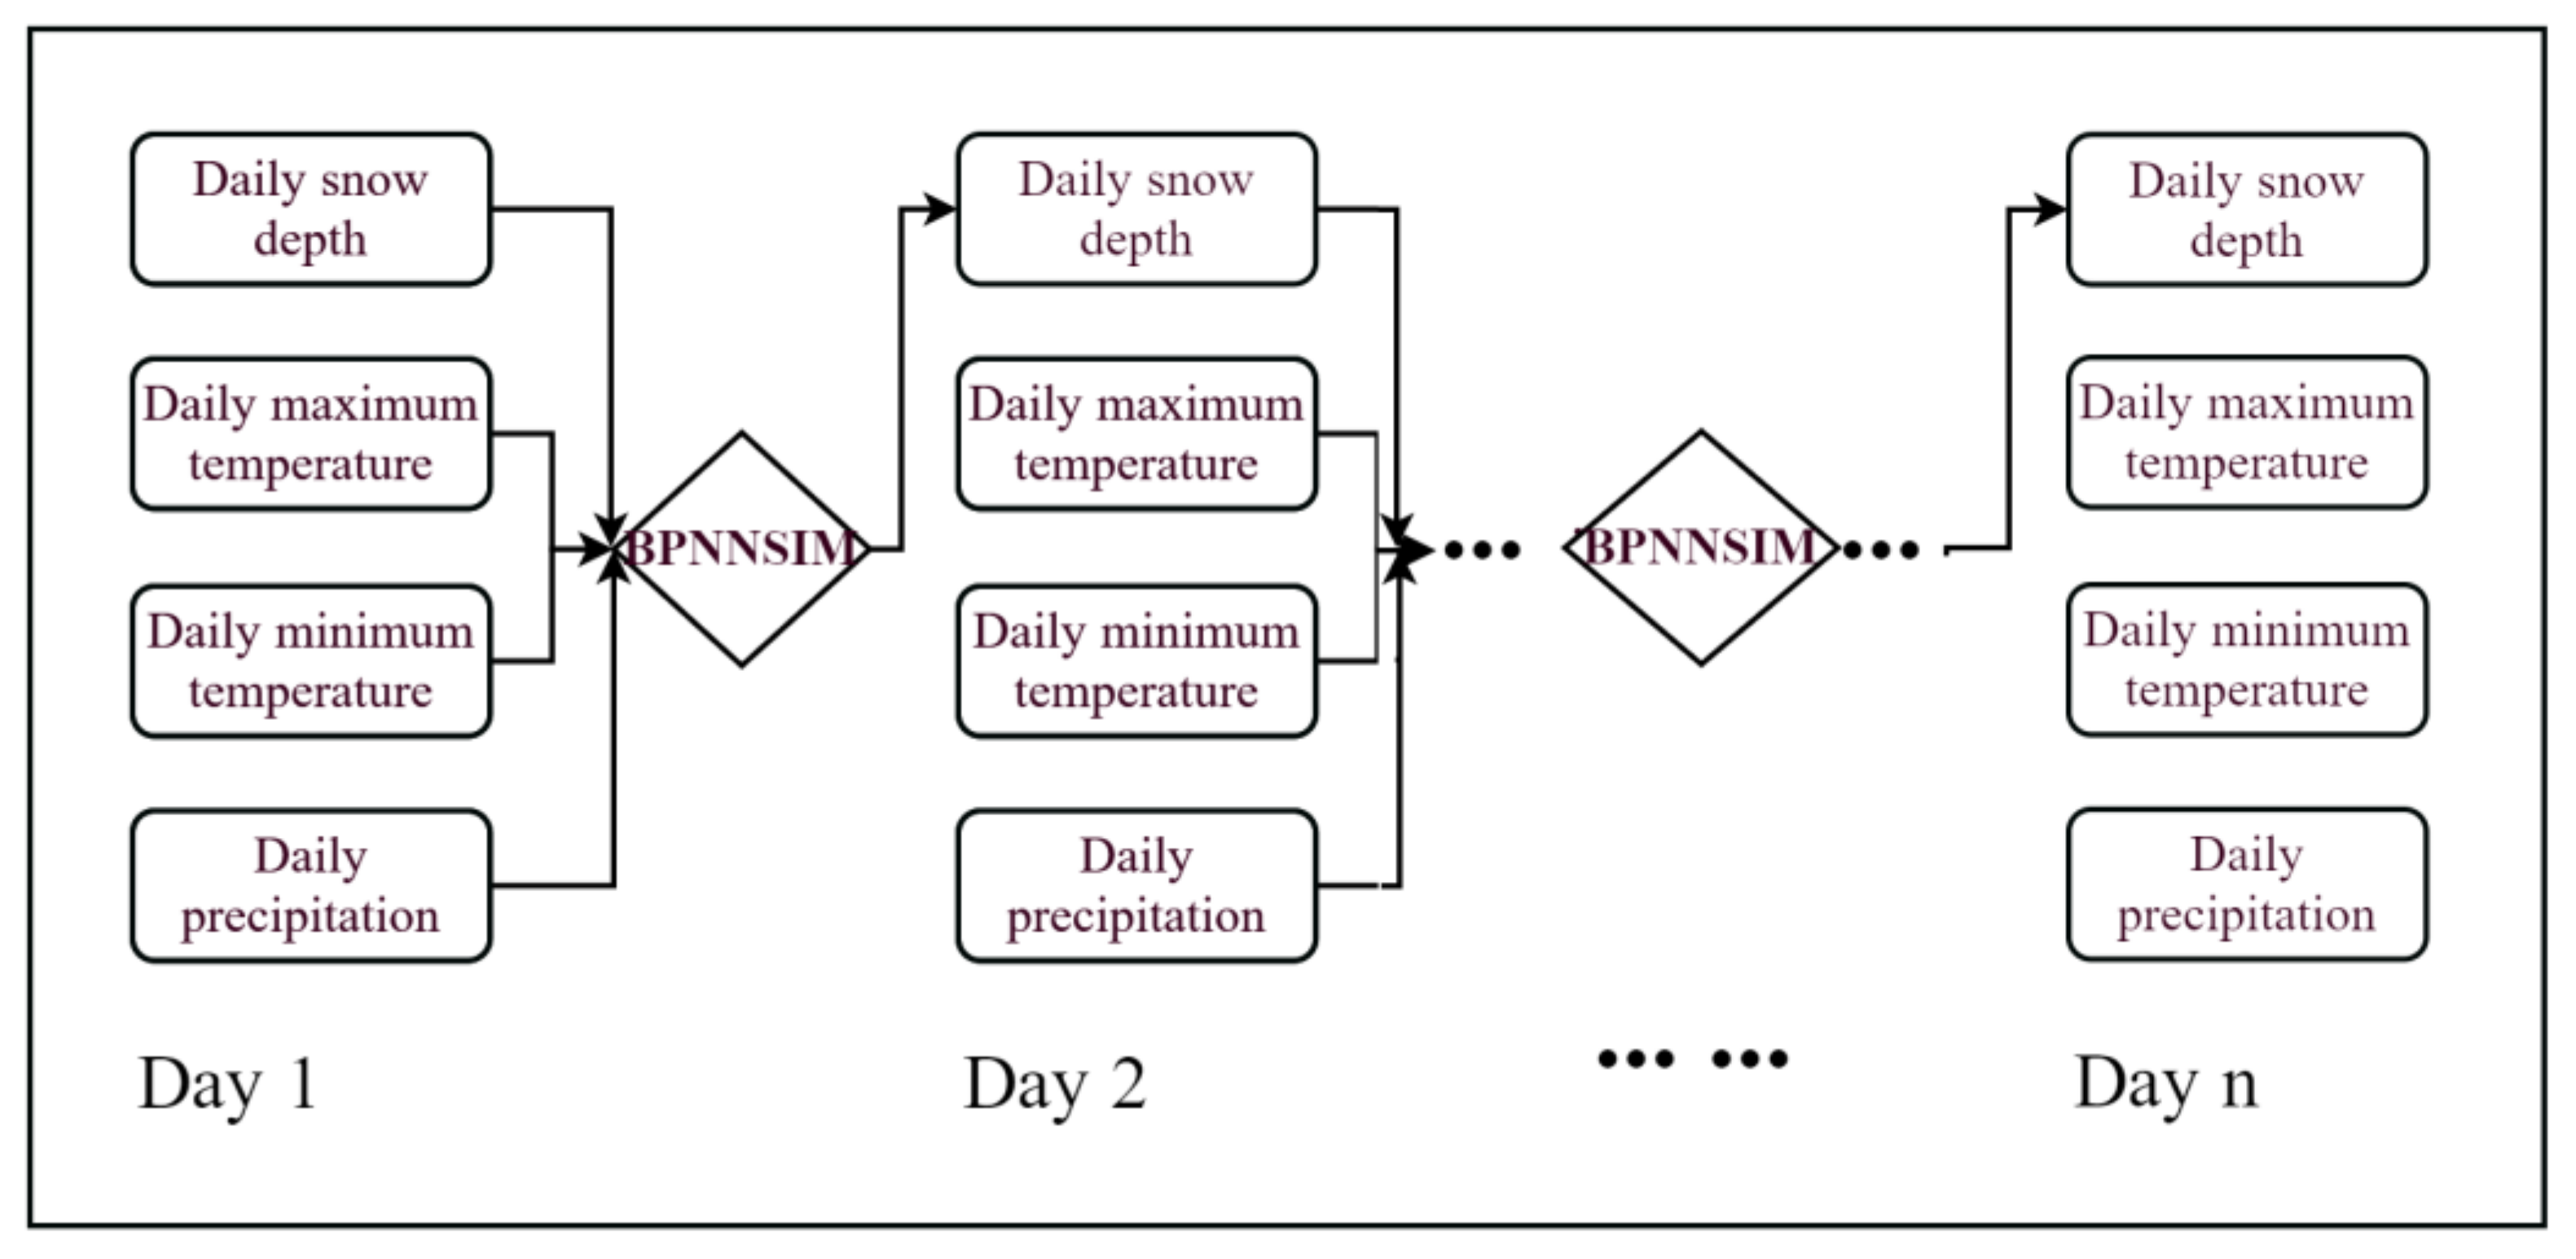
Based on the simulation model building and training, to determine the precision of the model iteration simulation, we used daily precipitation, daily minimum temperature, and daily maximum temperature data at 30 randomly selected National Climate Reference Stations. A day without snow cover was used as the model iteration starting simulation time. The daily simulation snow depth data were obtained on a daily time scale (Figure 4).
The simulated snow depths were used for comparison with the observations from the corresponding stations (Figure 3, Part 2) according to the following follow process. First, multisite monthly values of cumulative snow depth and snow cover days were calculated using the simulated and observed values from the 30 validation sites. Next, the Nash and correlation coefficients [28] between the simulated and observed values across the time series were calculated according to (Equations (2)–(5)):
where E is the Nash coefficient, is the observation value, is the observation value in month t, is the simulated value in month t, and is the total average of the observations. If E is close to 1, model quality is high and is credible, whereas if E is close to 0, it indicates that the simulation is close to the mean level of the observed values, although process errors are large. If E is much less than zero, the model is not credible.
The correlation value (r) is calculated as follows:
where x refers to the simulated value, refers to the average of the simulations, y refers to the observation values, refers to the average of the observations, and n refers to the number of mouths.
2.2.3. A Comparative Method for Remote Sensing and NEX-GDDP Snow Depth
First, annual snow depth observations from the climate stations were used to calculate a standard value of cumulative snow depth data for all stations. Further, annual averages of the cumulative snow depth data at the climate station locations were calculated using depth information derived from NEX-GDDP or microwave remote sensing data, and these were regarded as the simulated values for the corresponding model in NEX-GDDP or remote sensing. Lastly, the differences between the standard and simulated values were analyzed according to their RMSE and correlation coefficient.
where x denotes the simulated model, y is the observation values, and n represents the number of years, where a smaller RMSE indicates better simulation capability.
3. Results
3.1. Model Building
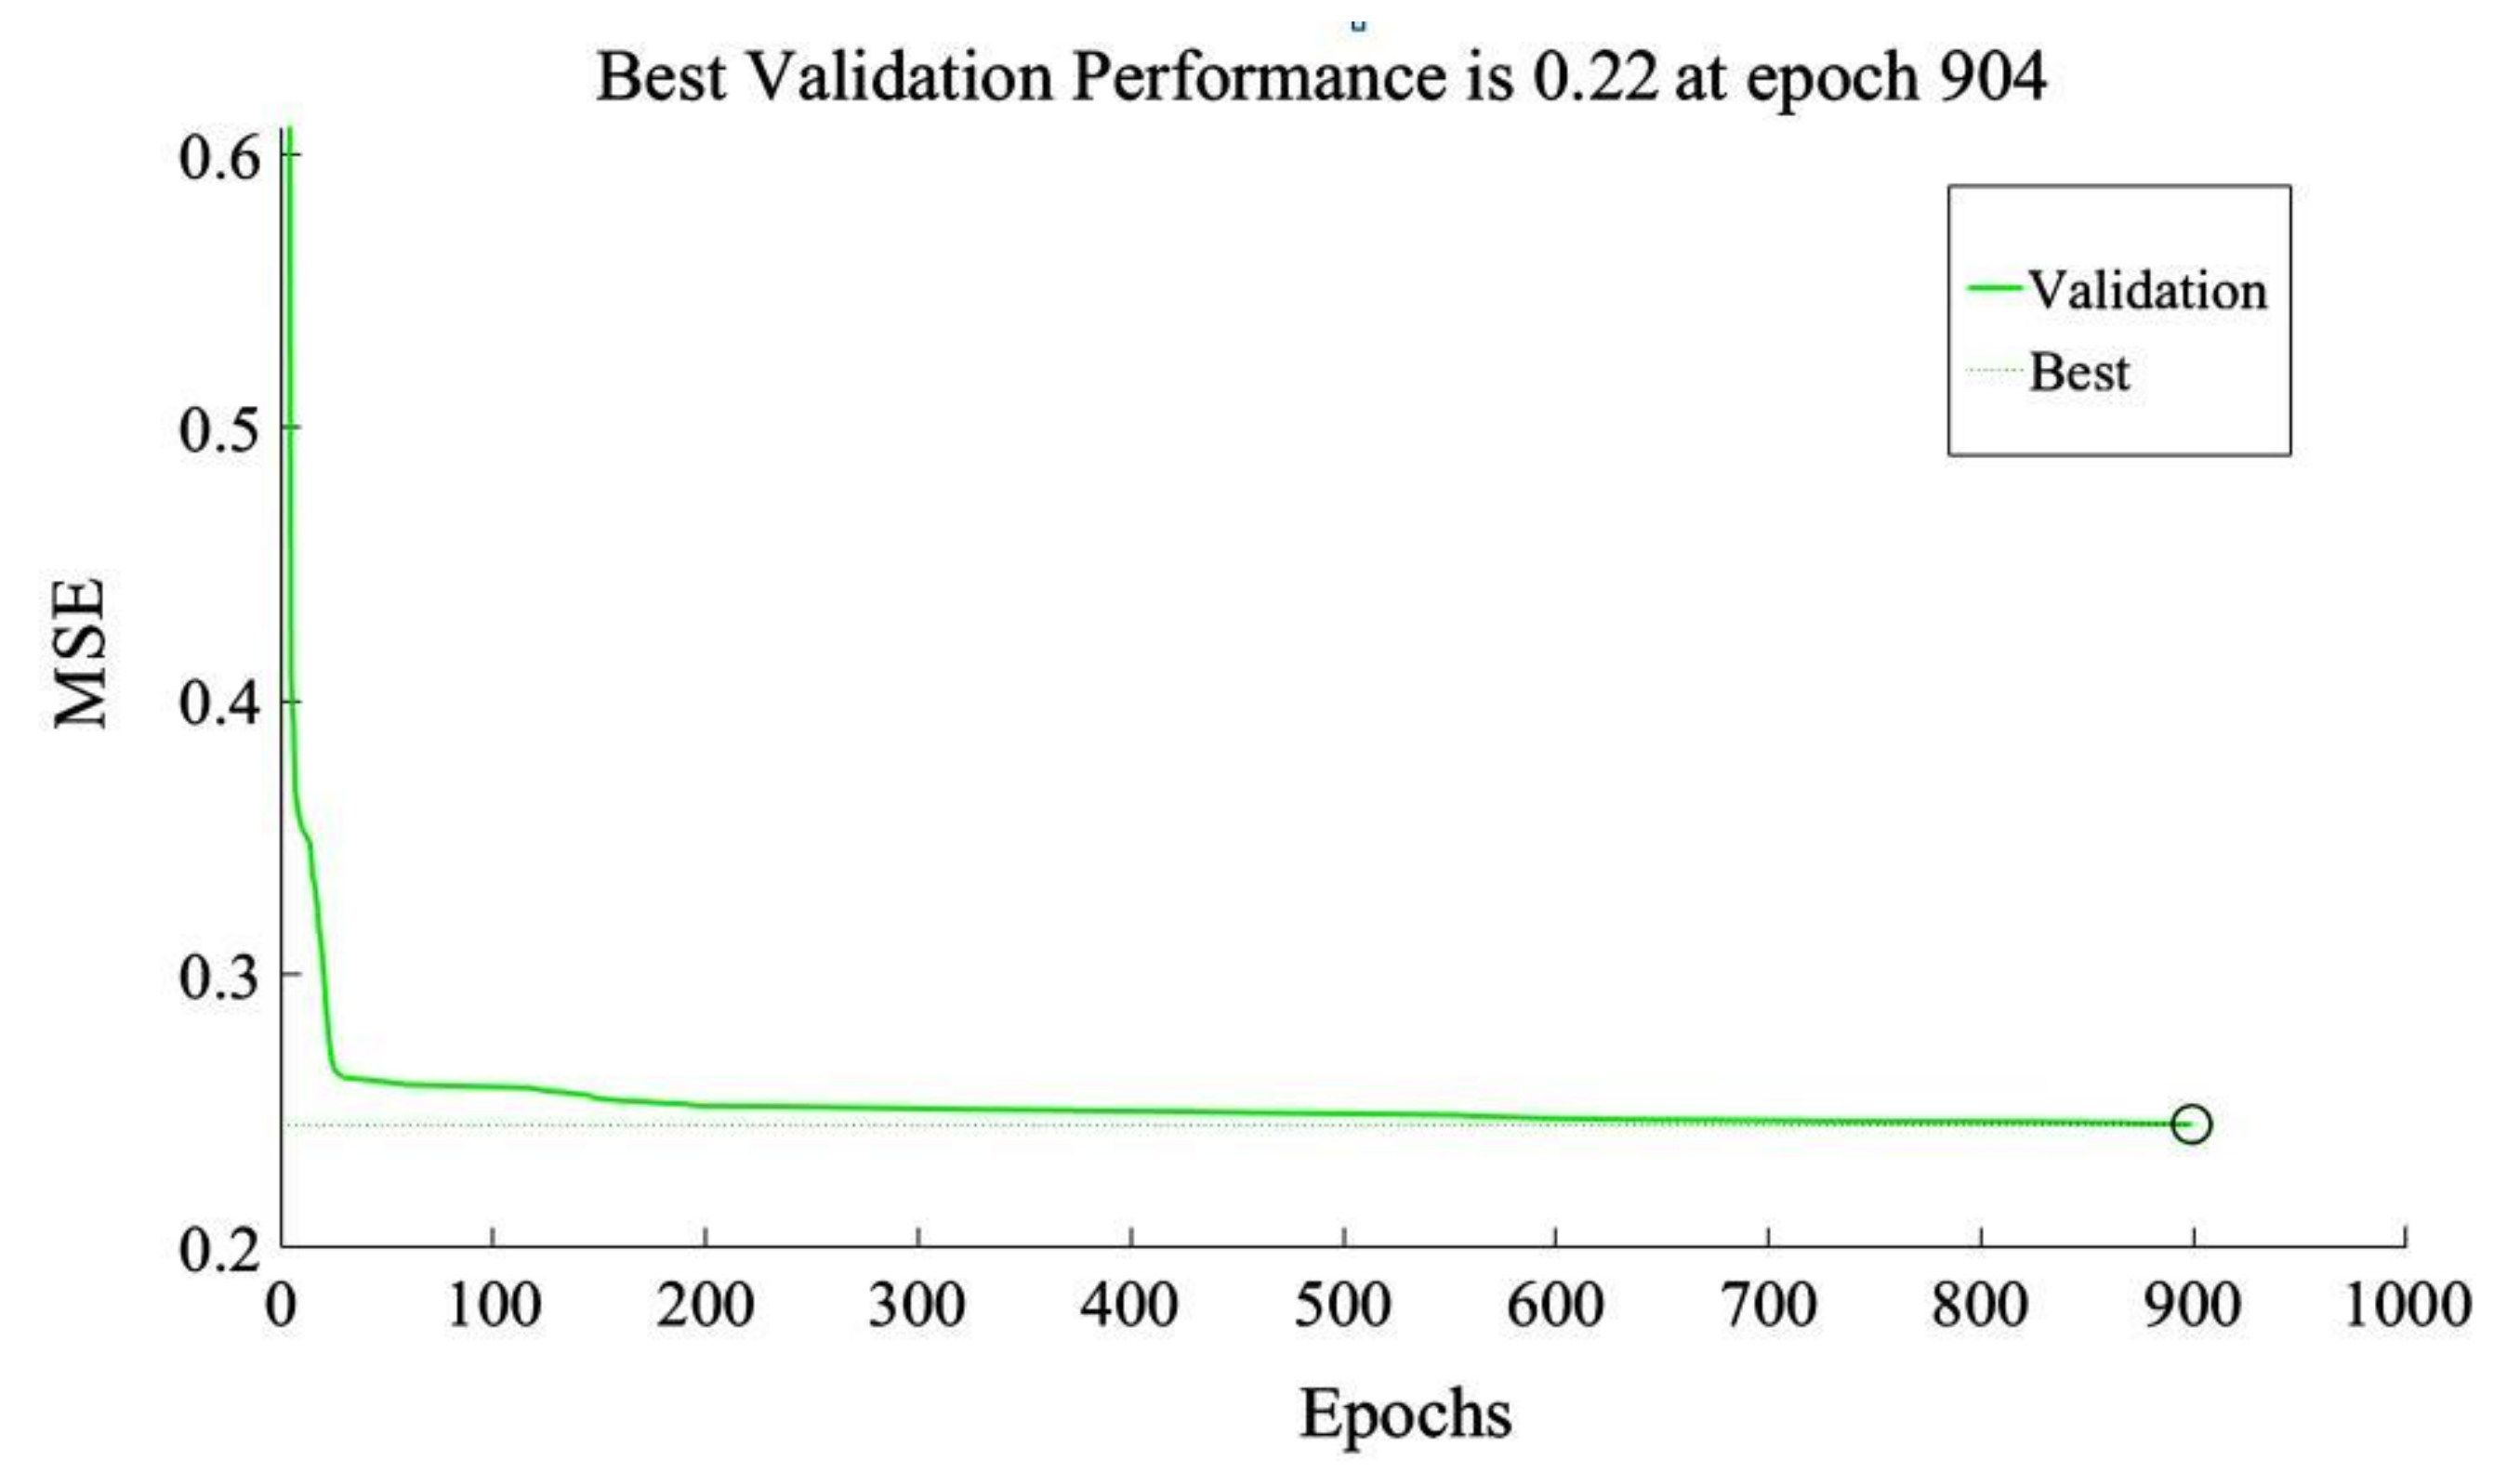
Model accuracy peaked at 904 training cycles, with a minimum root square error (MSE) of validation of 0.22 (Figure 5). The correlation coefficients (r) between the various simulated and actual values for the trained BP neural network were >0.95.
3.2. Validation Results of Model Iterative Simulation Capabilities
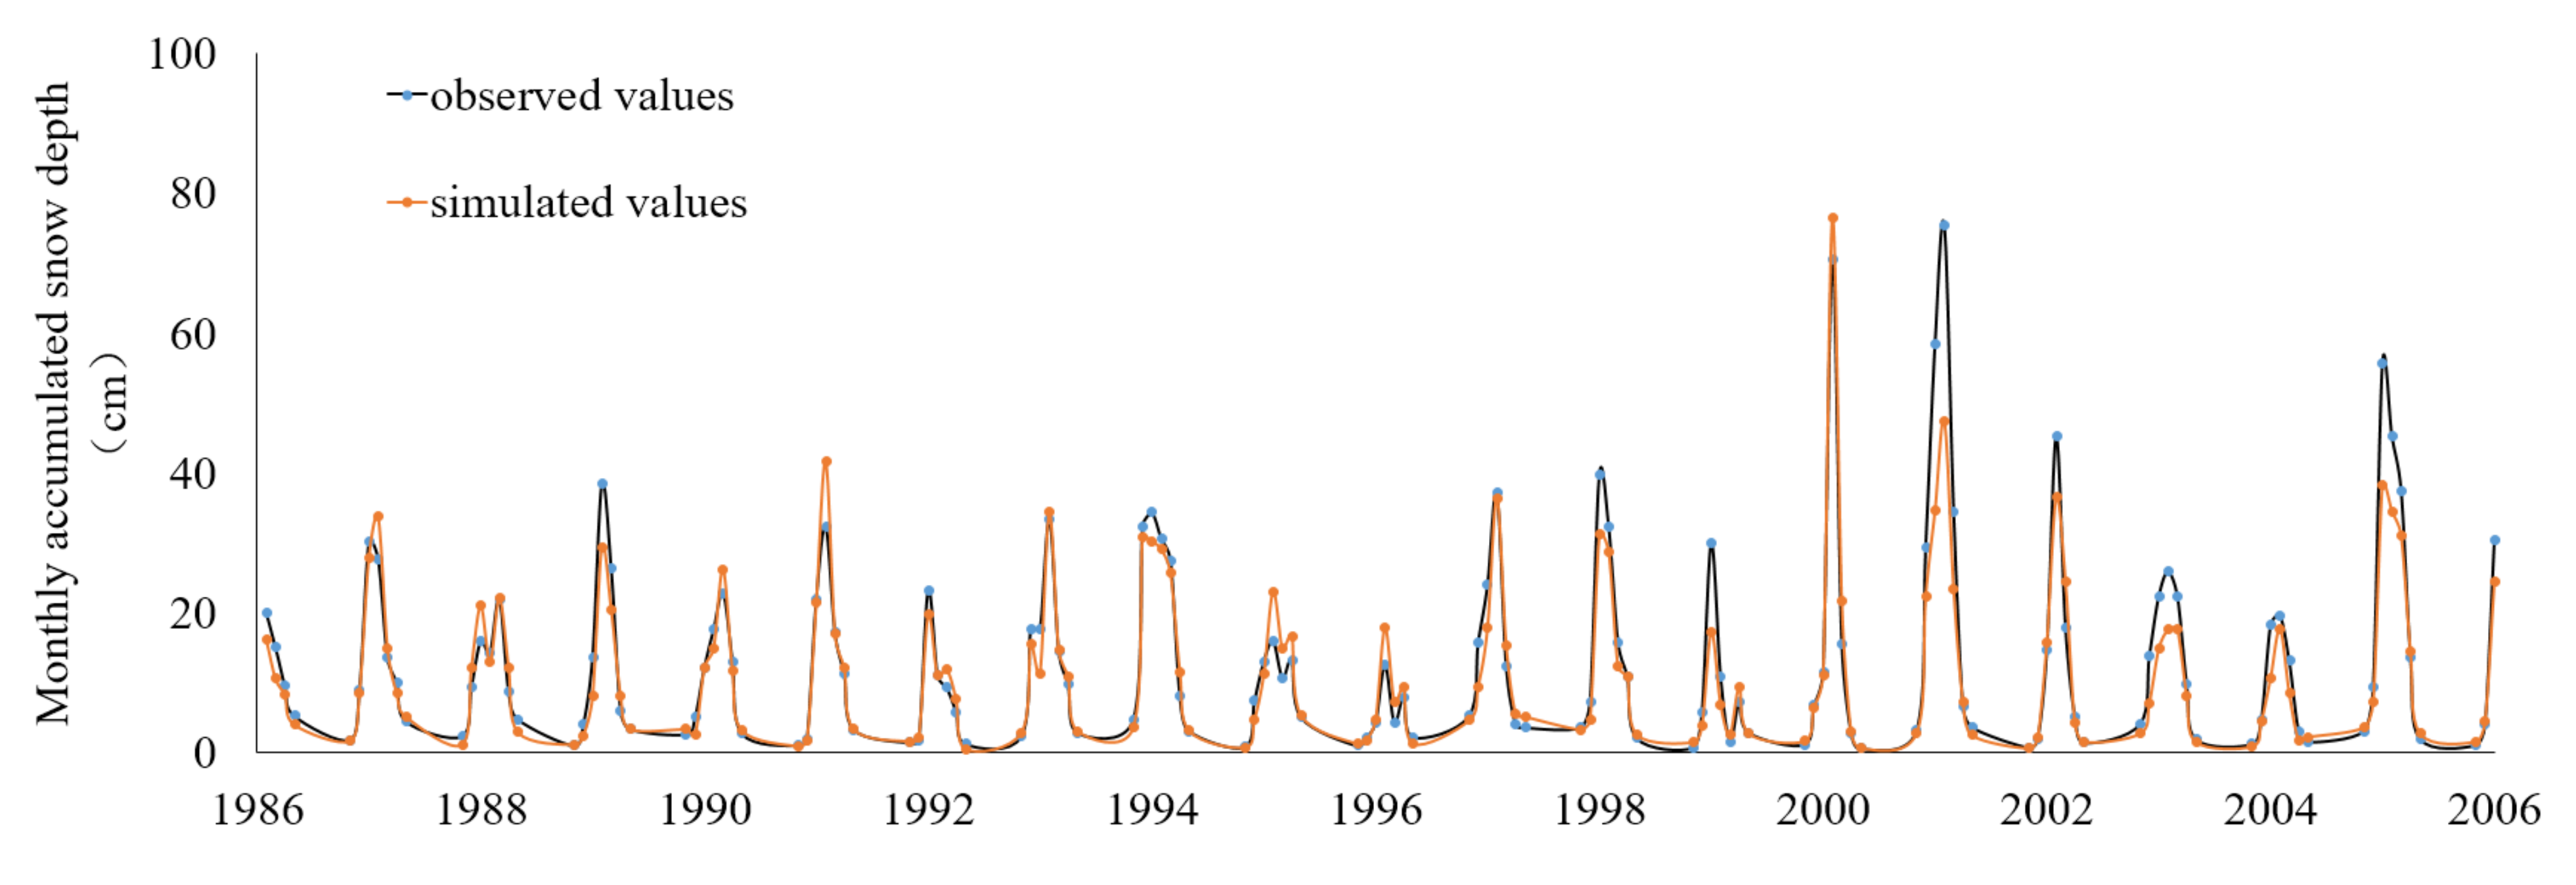
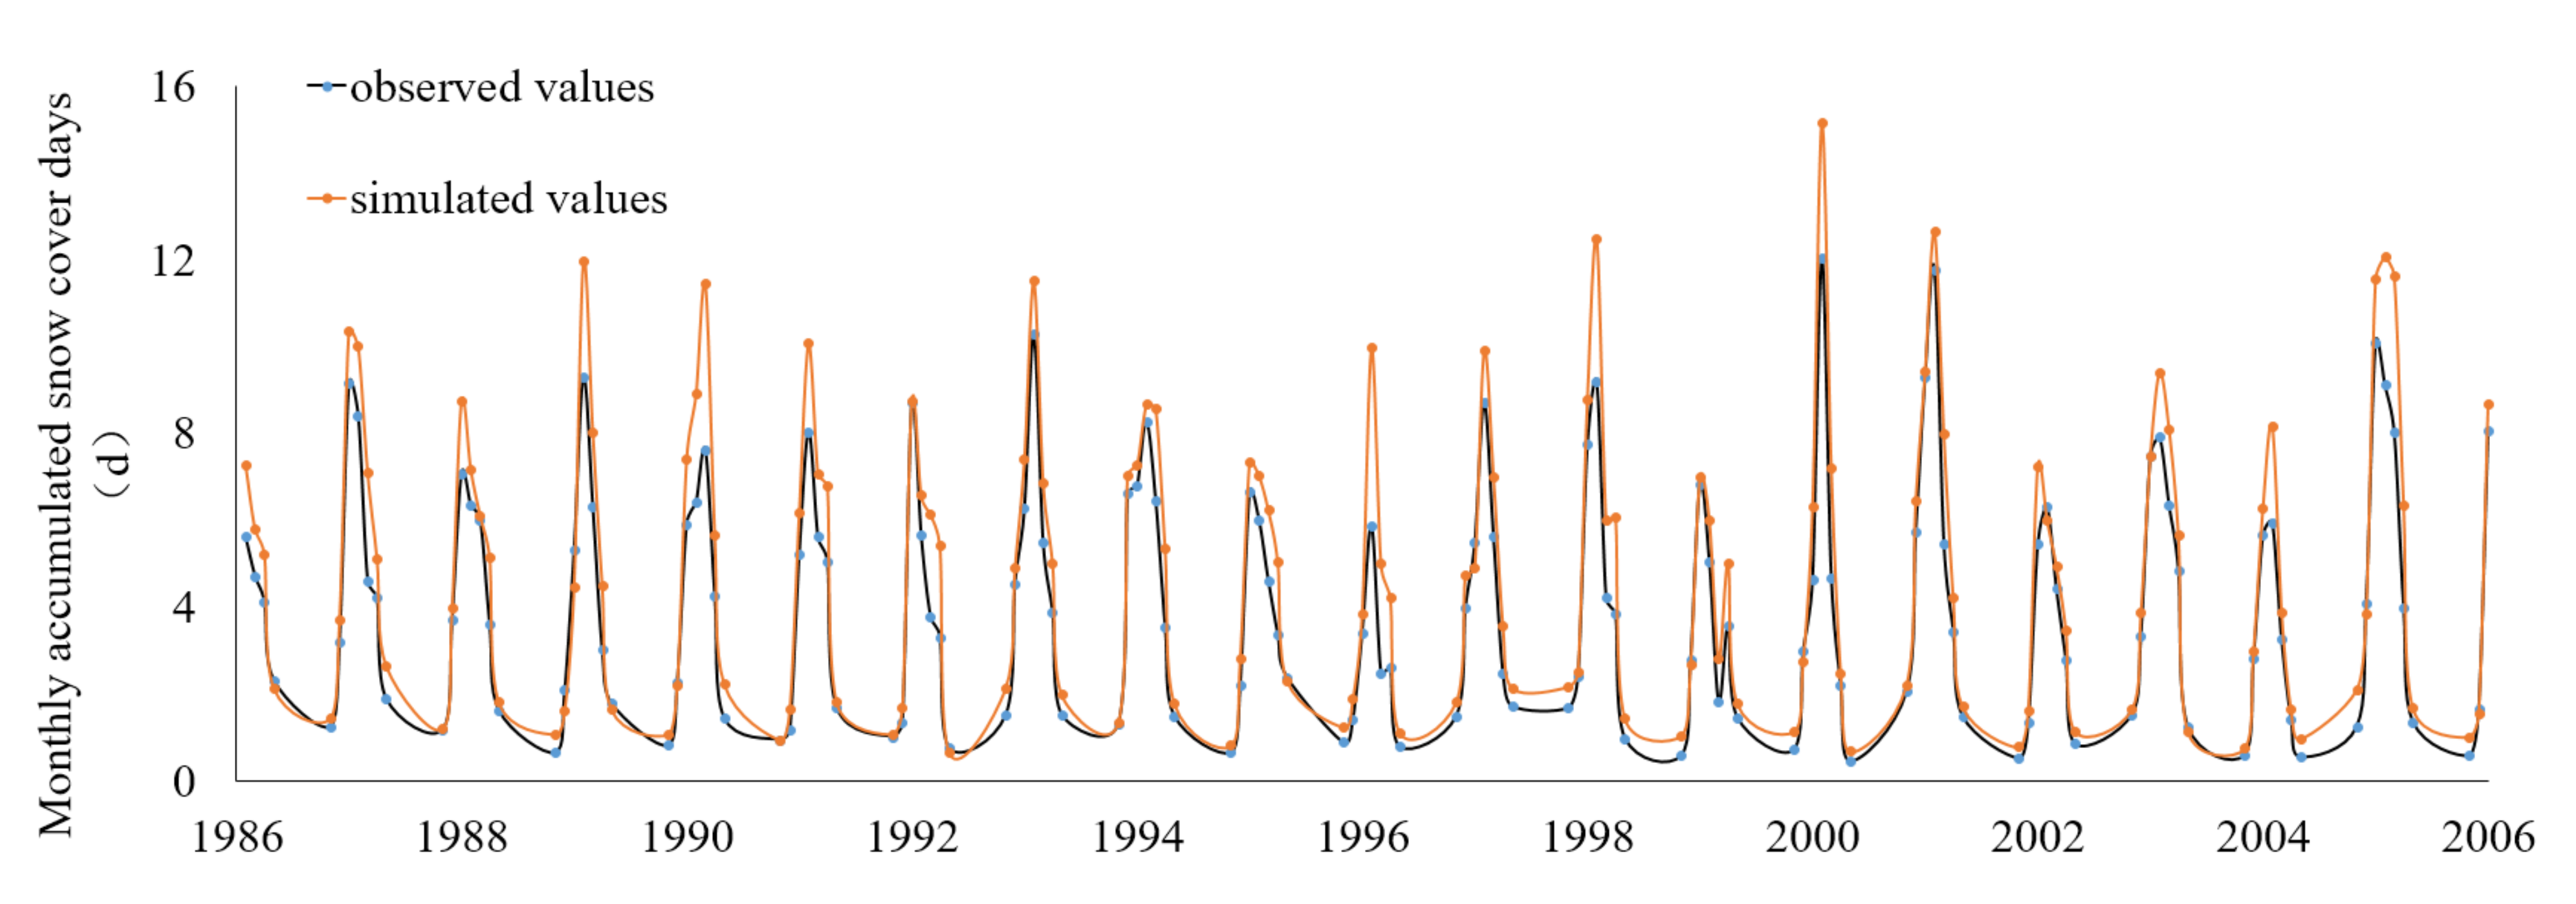
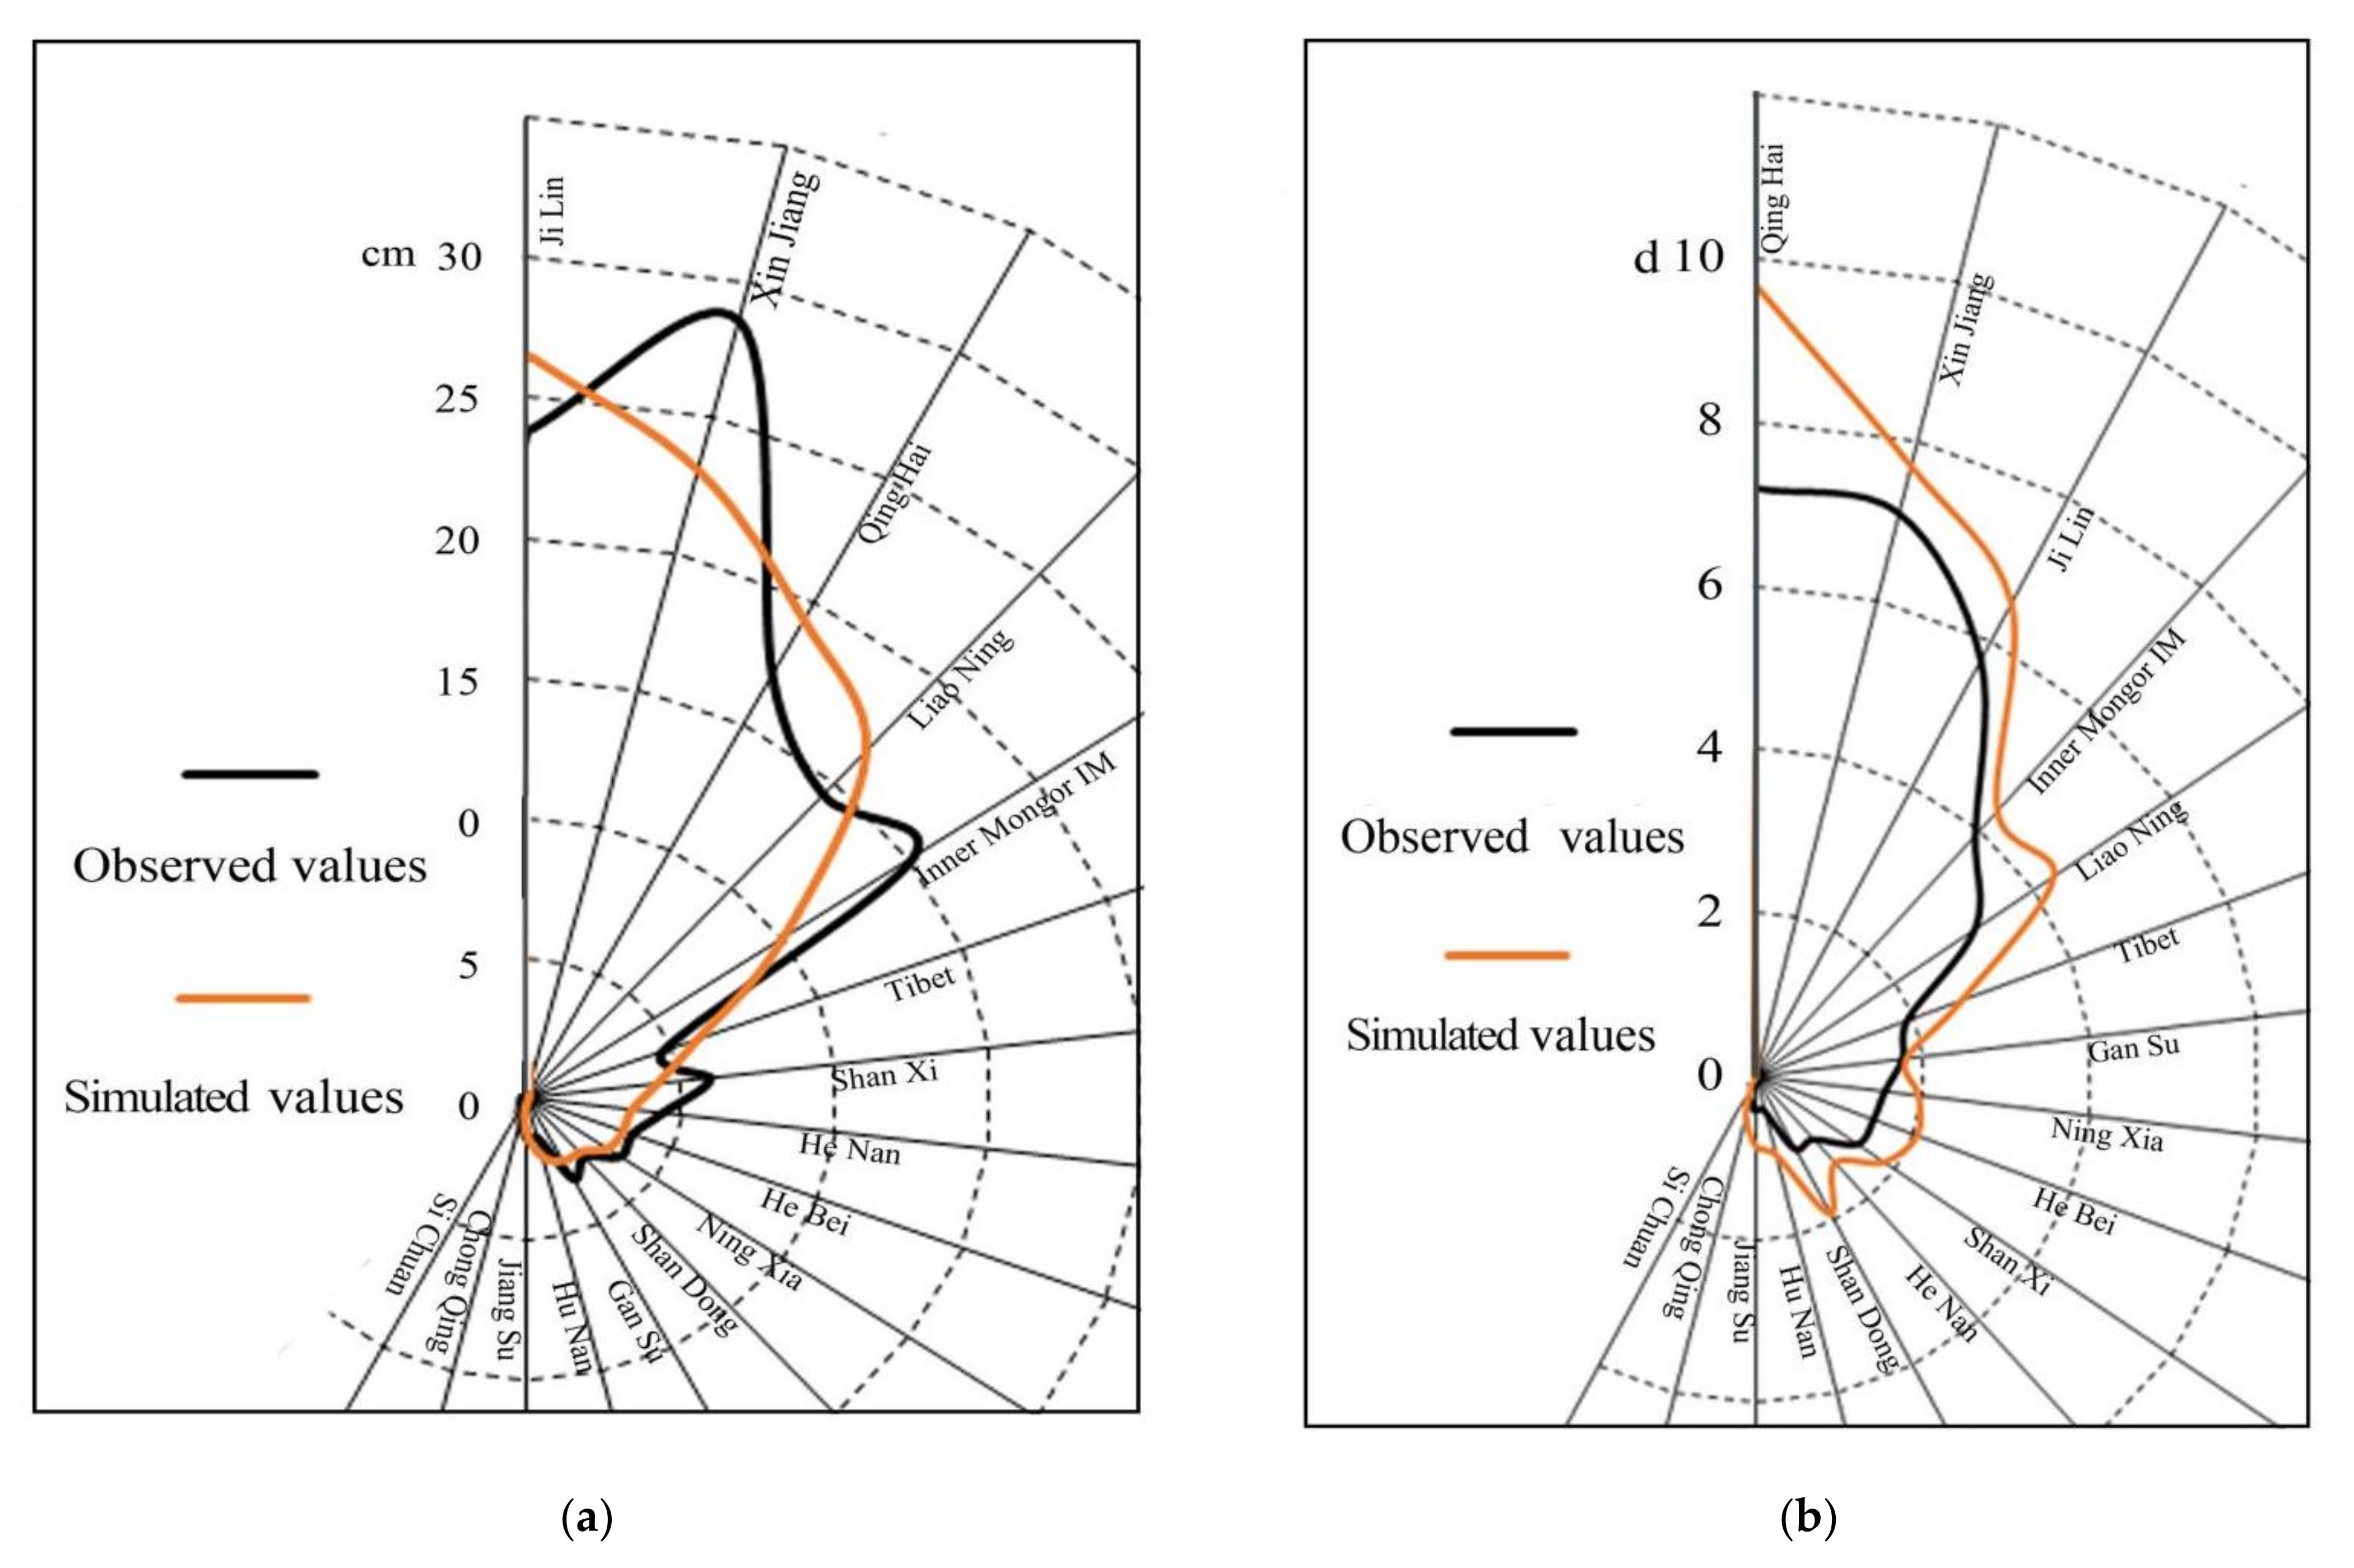
Figure 6 and Figure 7 show the correlation between the iterative simulations and observed values of cumulative monthly snow depth and snow cover days during the principal snow cover months (October to April). Simulated results were underestimated at larger cumulative snow depths and overestimated for cumulative snow cover days. The multi-year, monthly average of observed cumulative snow depth across all stations was 13.77 cm, compared to a modeled value of 12.40 cm. The monthly average observed cumulative snow cover days was 4.06 day, compared to a modeled value of 4.98 day.
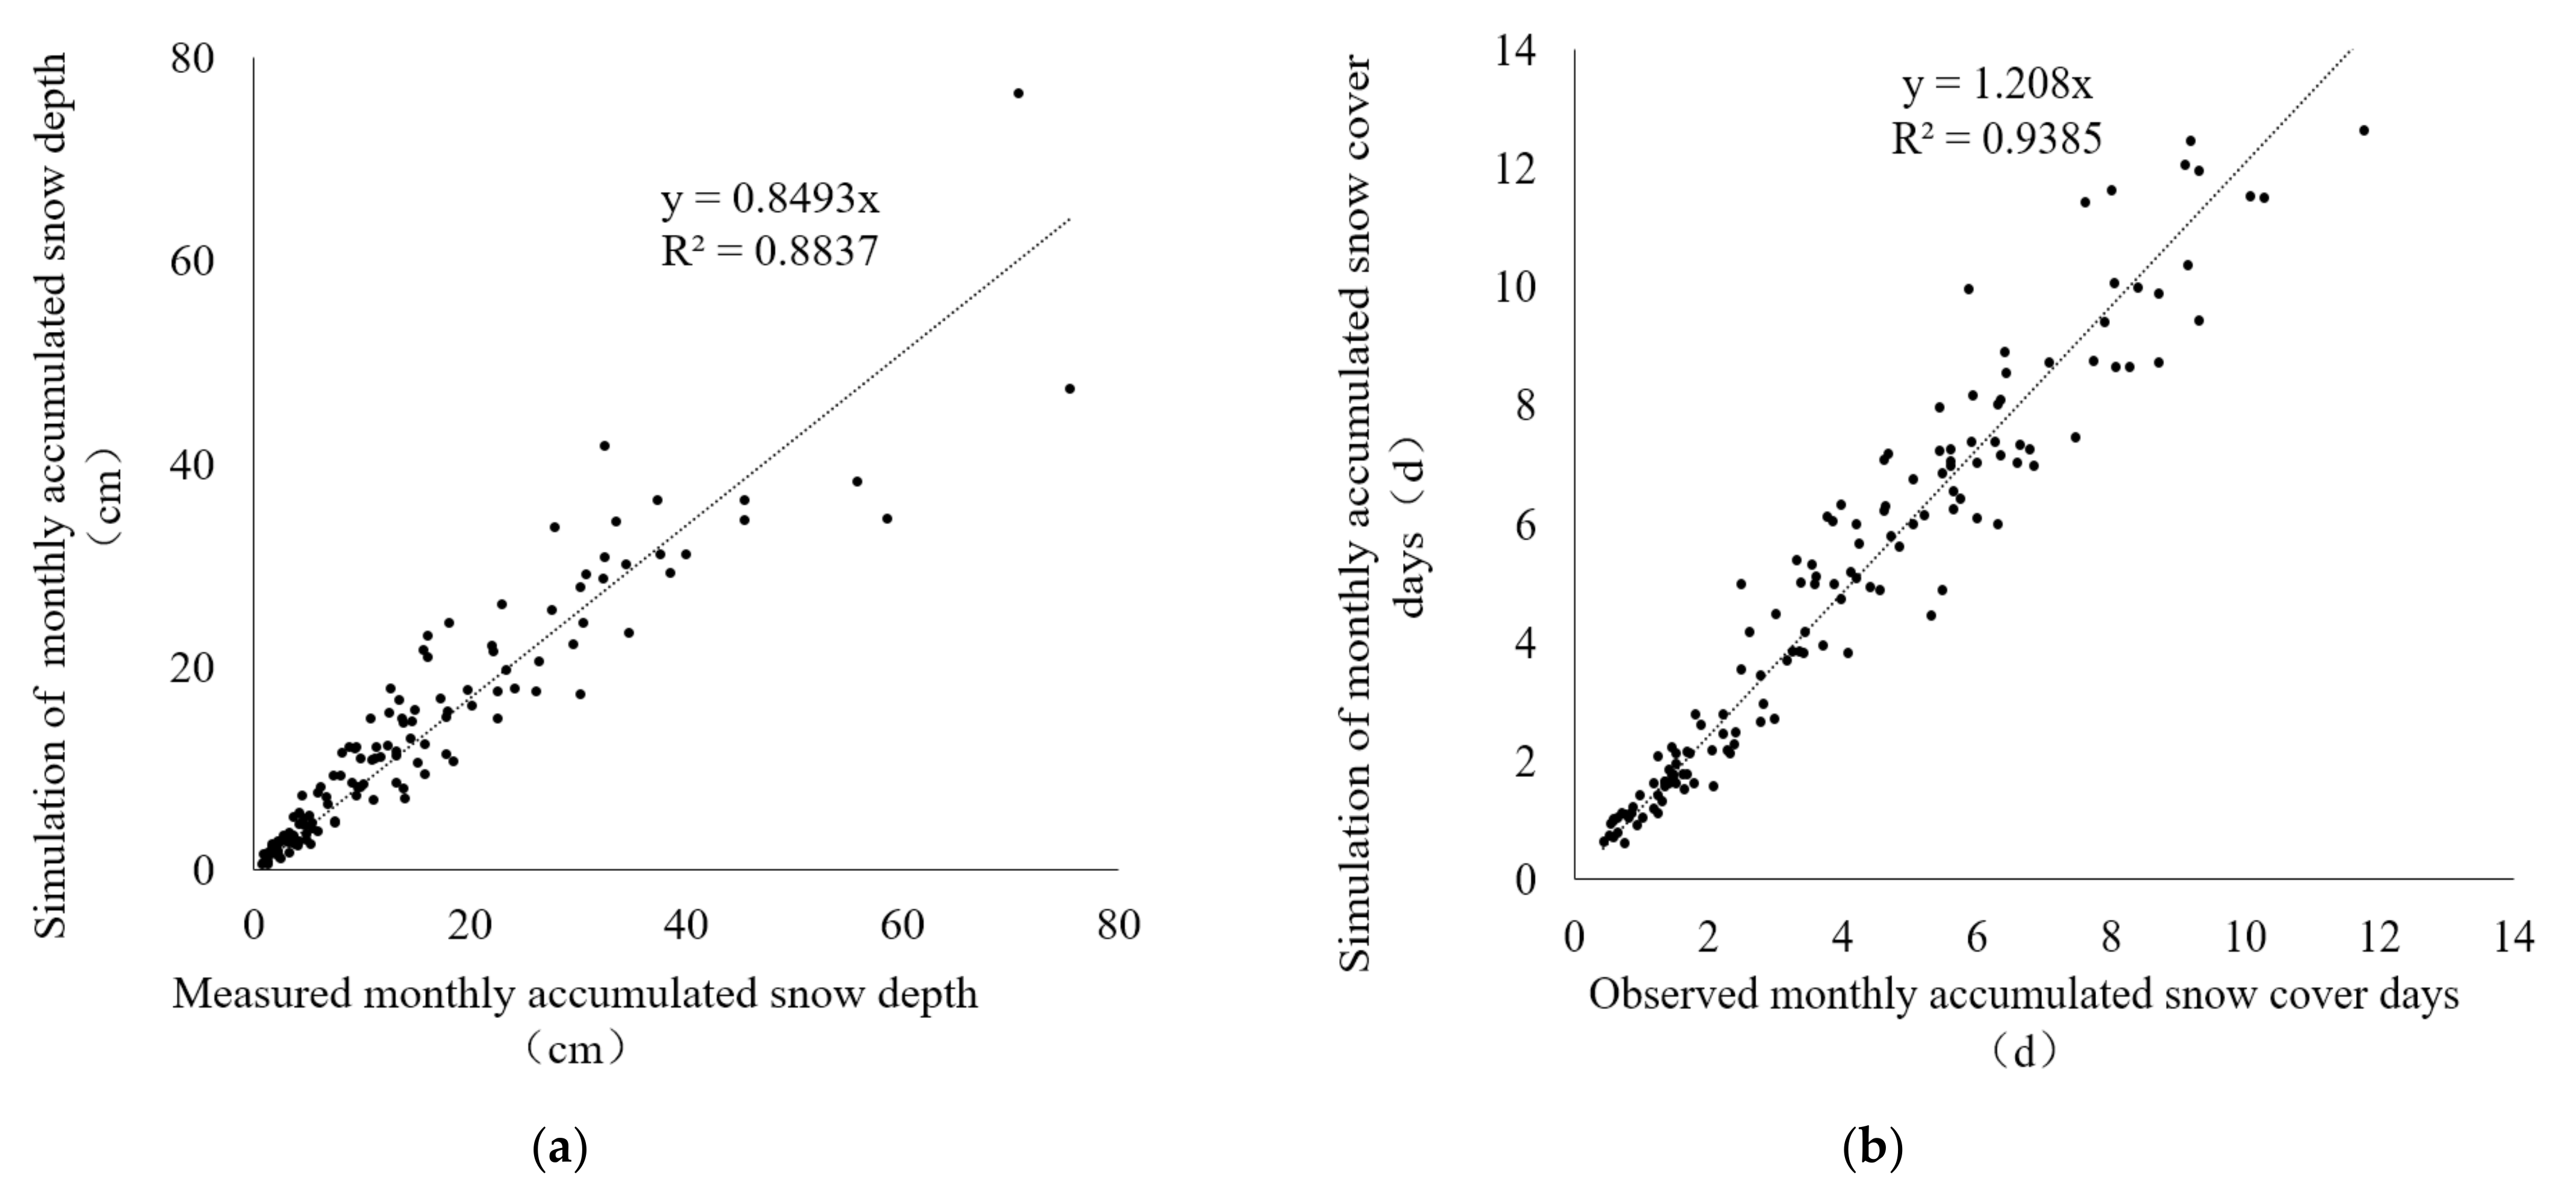
Figure 8 shows the correlation between the iterative observed and simulated values for monthly cumulative snow depth (R2 = 0.88) and snow cover days (R2 = 0.94). A Nash coefficient of 0.91 for cumulative snow depth and 0.87 for snow cover duration were also revealed between the observed and simulated values.
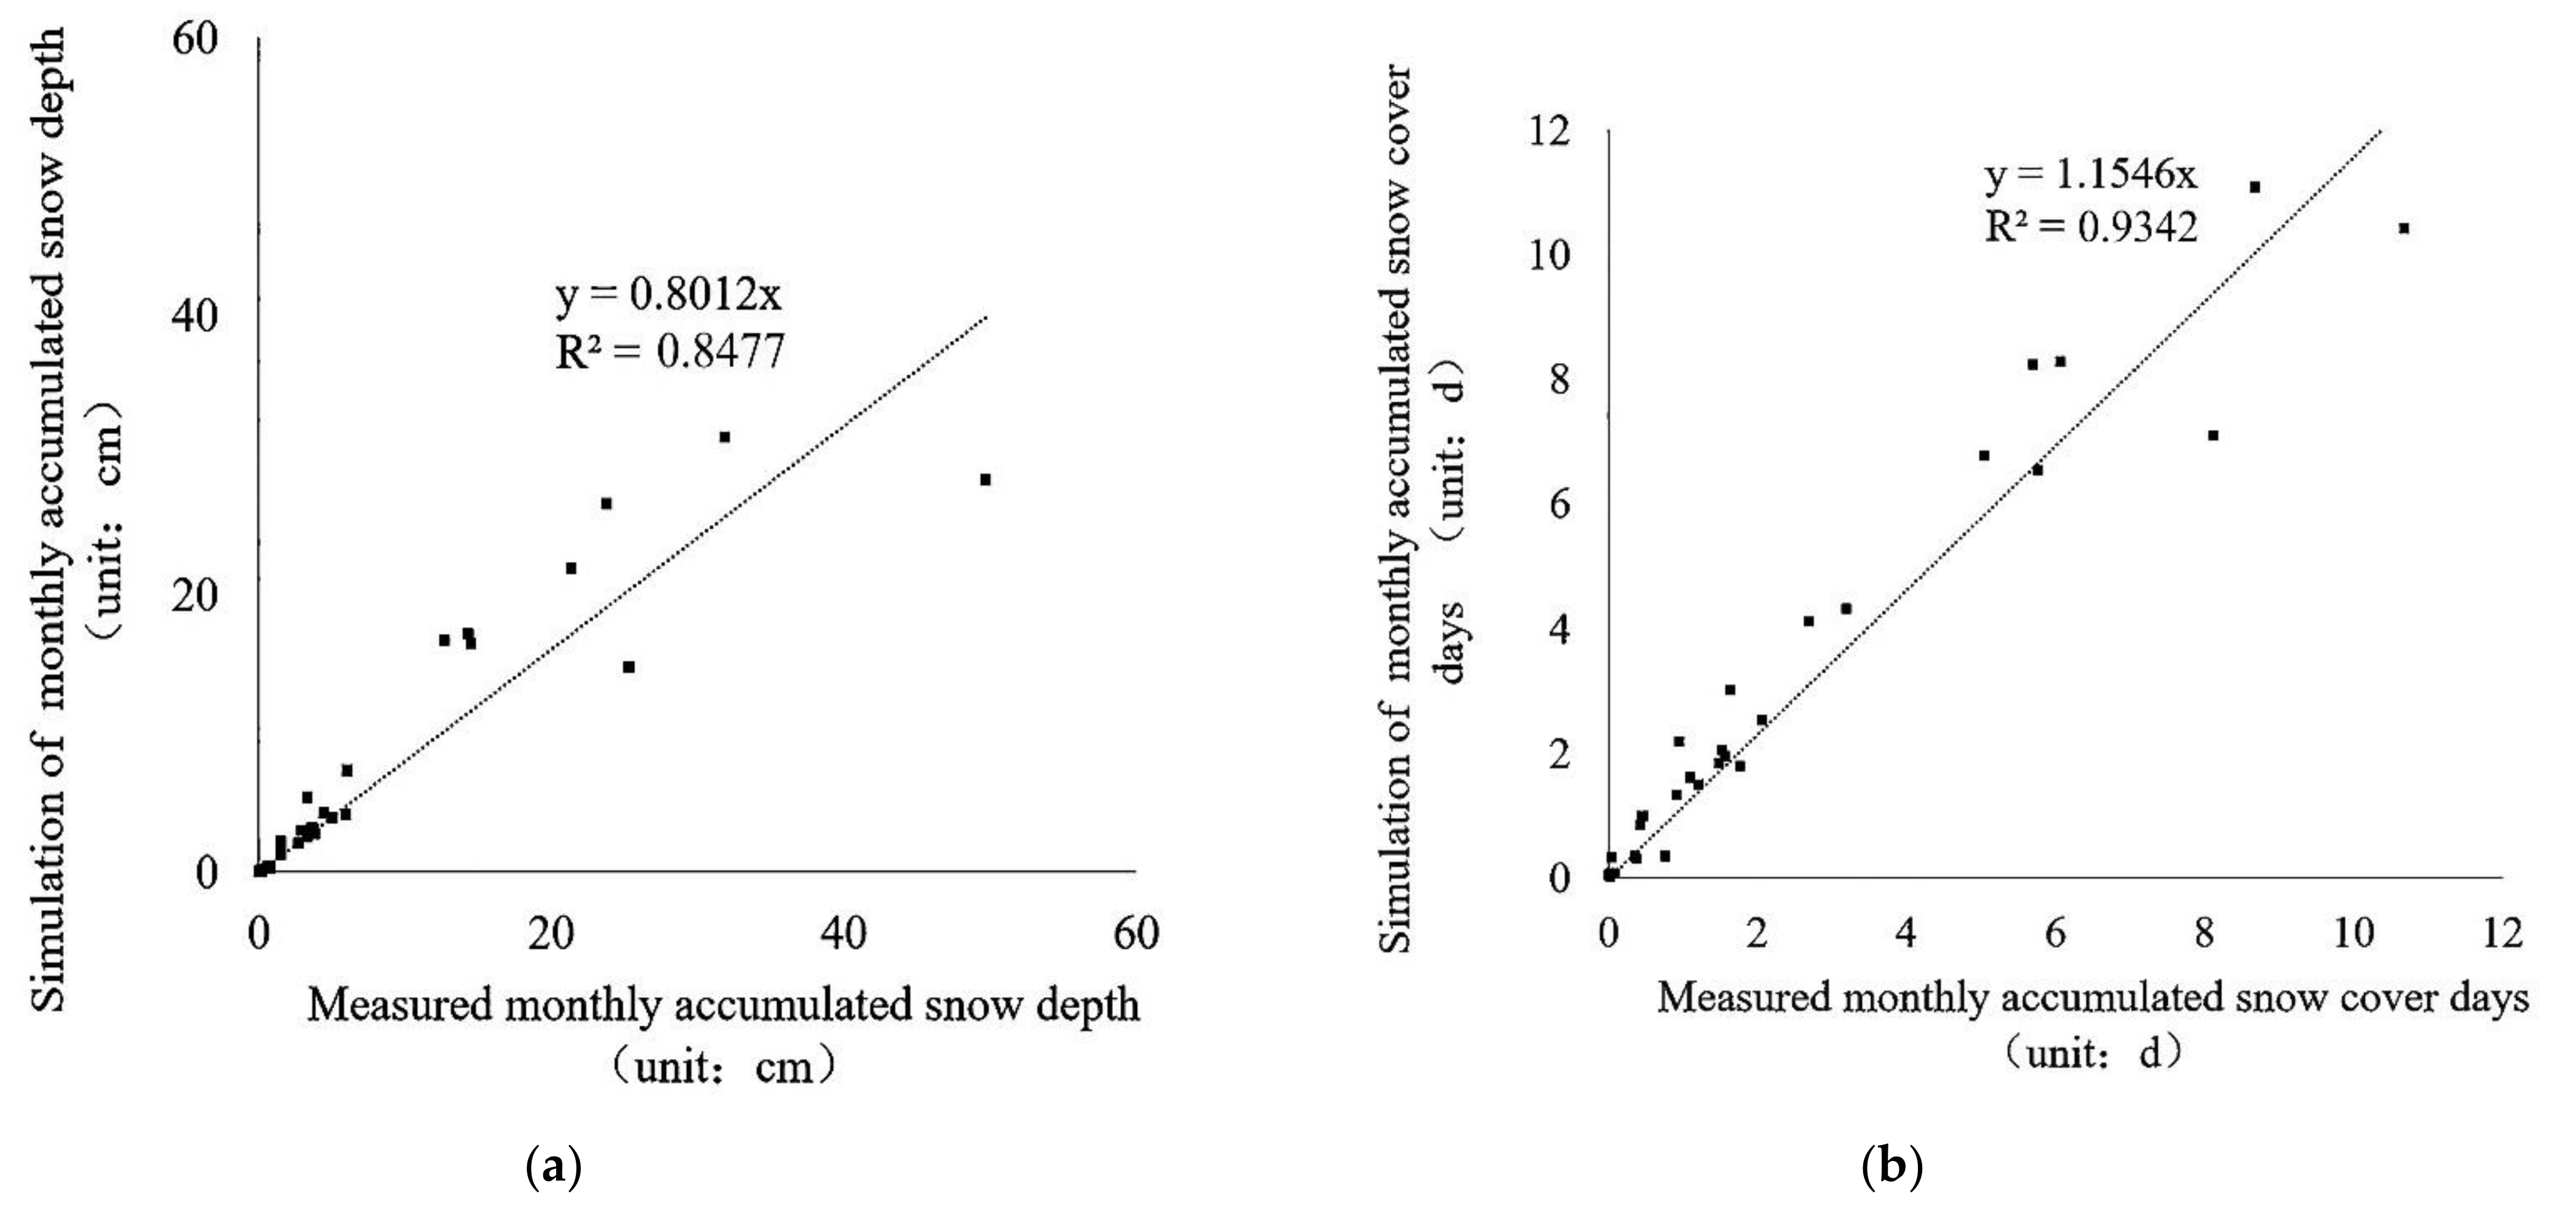
To clarify the regional differences in model simulation capabilities, the observed and iterative simulated average values of cumulative snow depth and cover duration for all stations within each provincial unit were tallied. The results yielded variability between the simulated and observed values of cumulative snow depth, and consistently overestimated values of cumulative snow cover duration across all provinces. At the provincial scale, the correlation coefficient between the observed and simulated monthly average values of cumulative snow depth was 0.93 (R2 = 0.85), and that for cumulative snow cover duration was 0.97 (R2 = 0.93) (Figure 9 and Figure 10).
3.3. Daily Snow Depth Simulation Based on NEX-GDDP
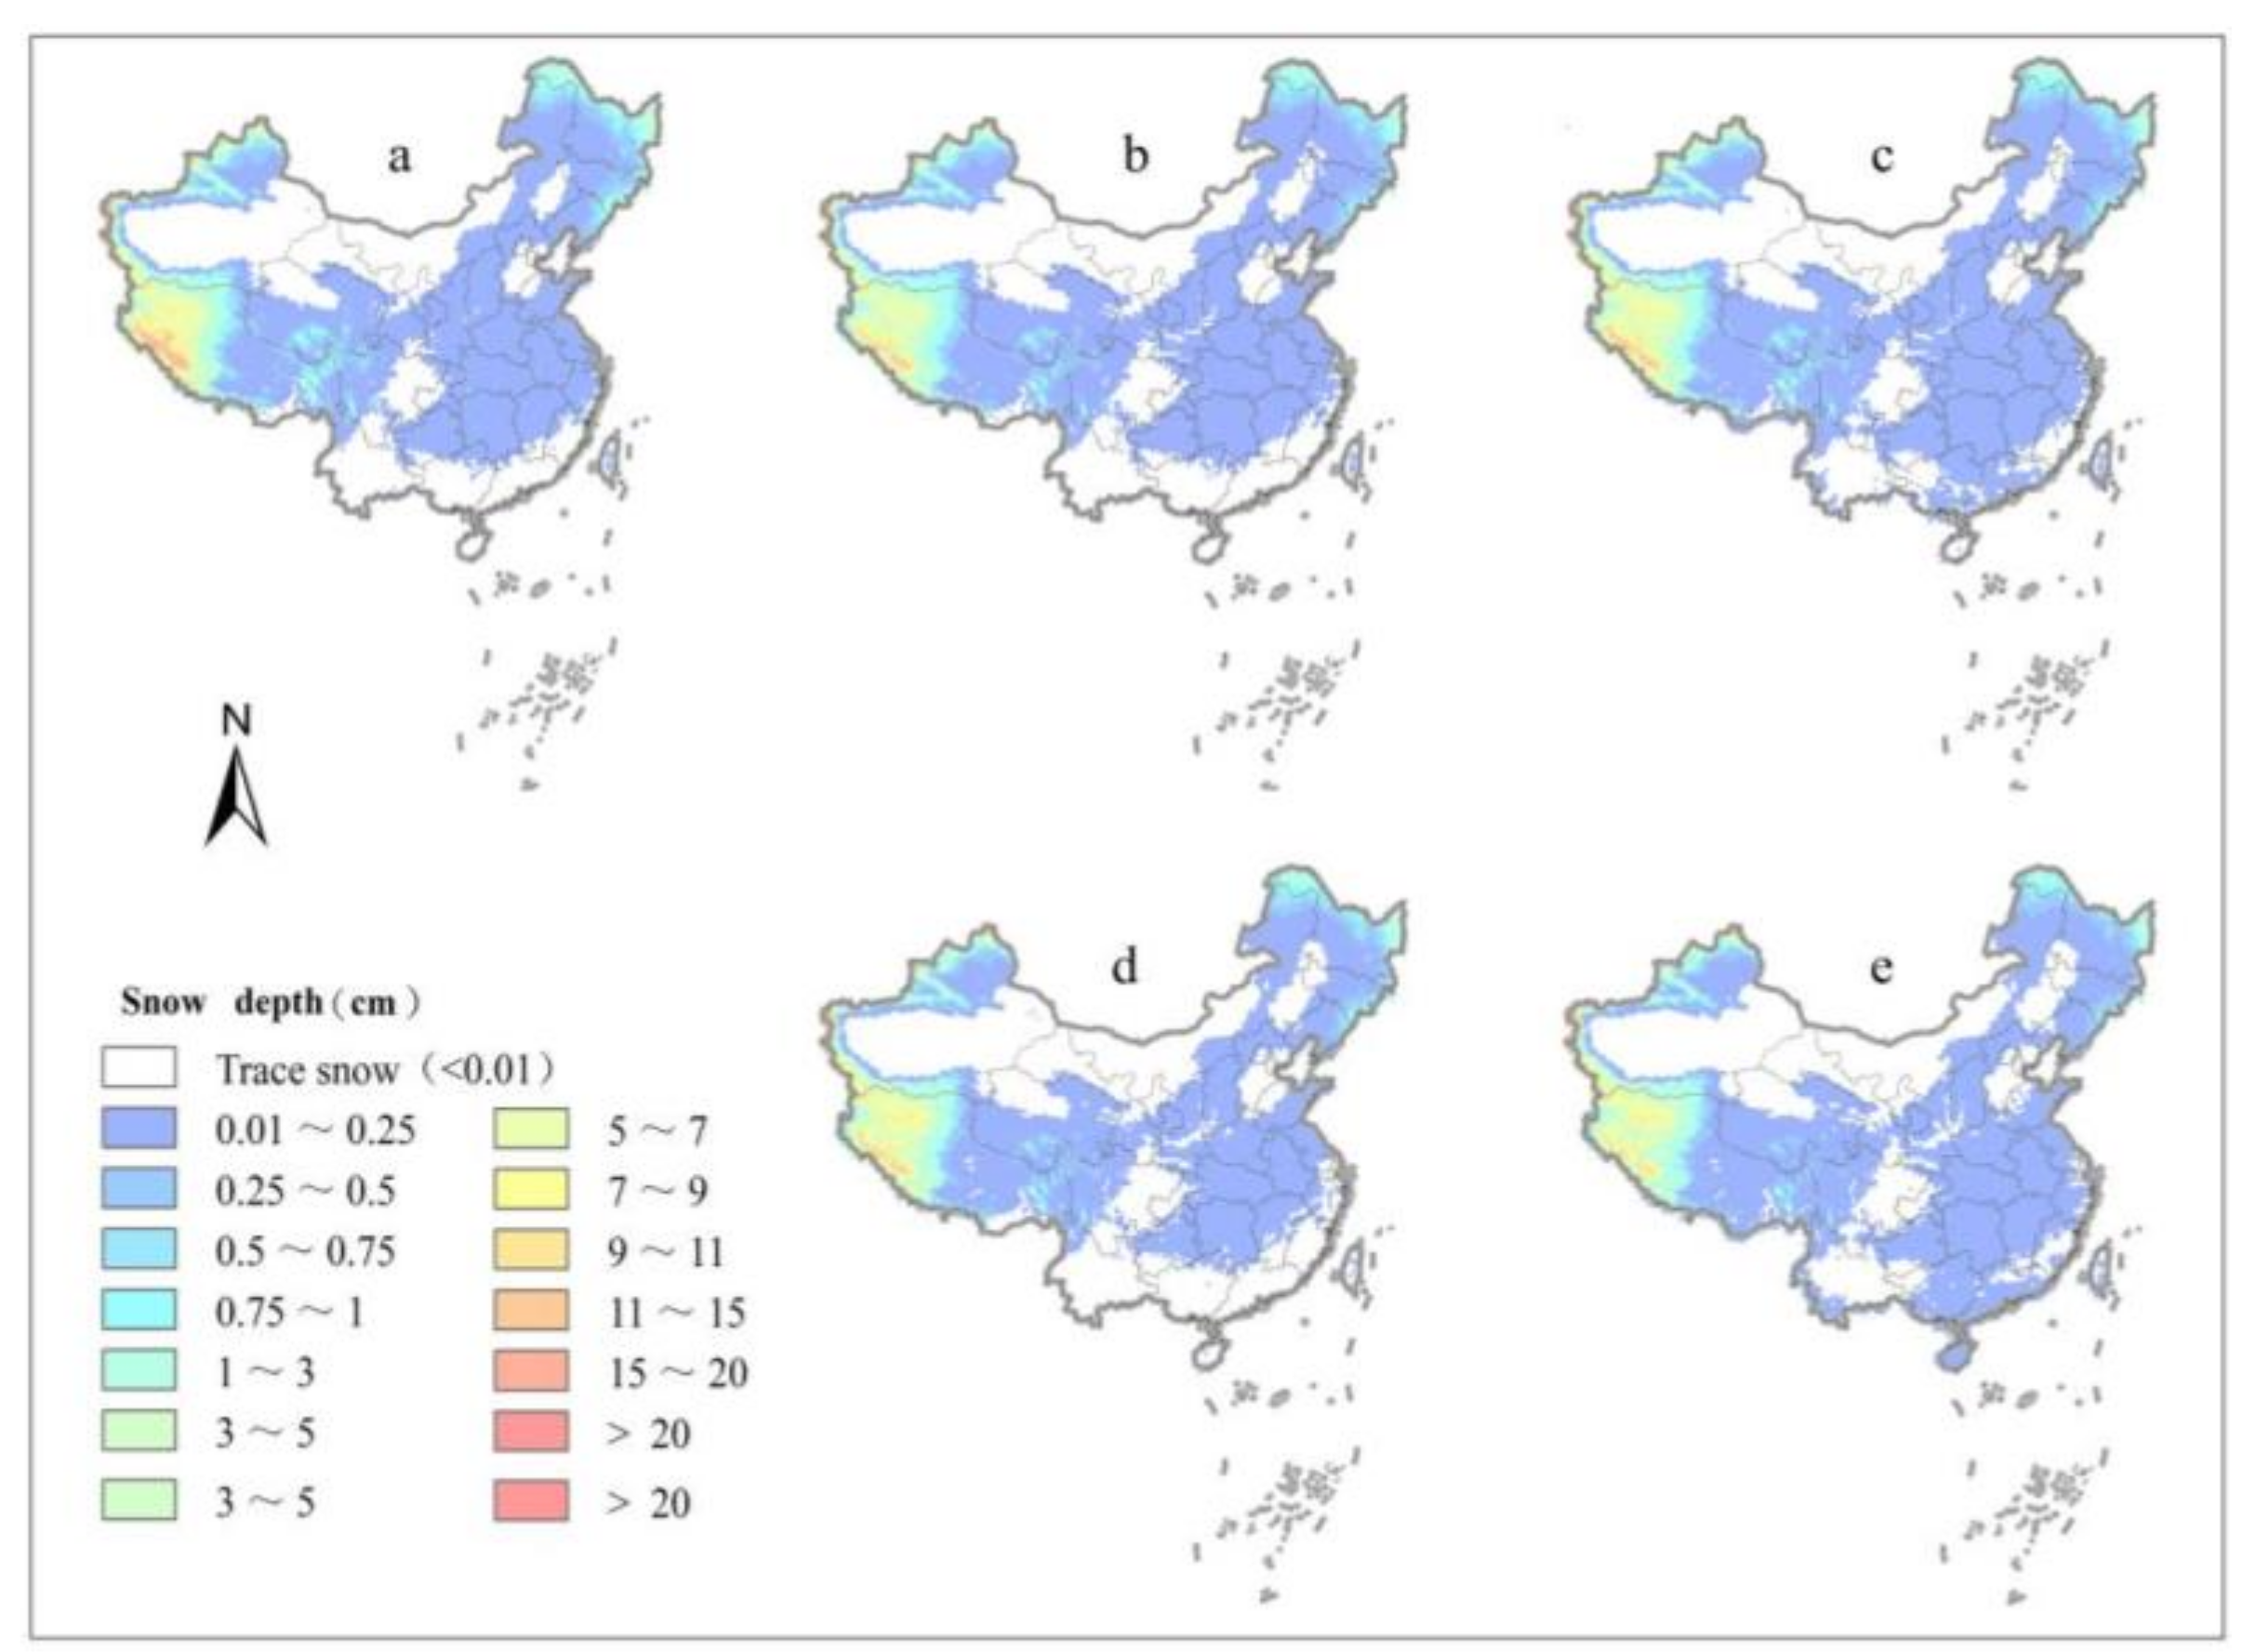
Based on the spatiotemporal accuracy evaluation of the iterative simulation, the NEX-GDDP data were selected as the input values for the BPNNSIM to iteratively simulate the daily snow depth data from the corresponding model in NEX-GDDP. The simulated data corresponds to that of NEX-GDDP, which contains 21 models under two climate scenarios (RCP4.5 and RCP8.5), at a spatial resolution of 0.25° × 0.25° for the periods of 1986–2005 and 2016–2065. The average annual snow depth distribution in China based on NEX-GDDP data is shown in Figure 11, and reveals that the future coverage under the RCP4.5 scenario is similar to that of the historical period. Moreover, under the RCP8.5 scenario, the coverage shows notable southward expansion, whereas Northeast and Northwest China, as well as the Qinghai-Tibet Plateau, comprise the primary snowfall regions in the country.
4. Discussion
4.1. Comparison of Remote Sensing and NEX-GDDP Snow Depth
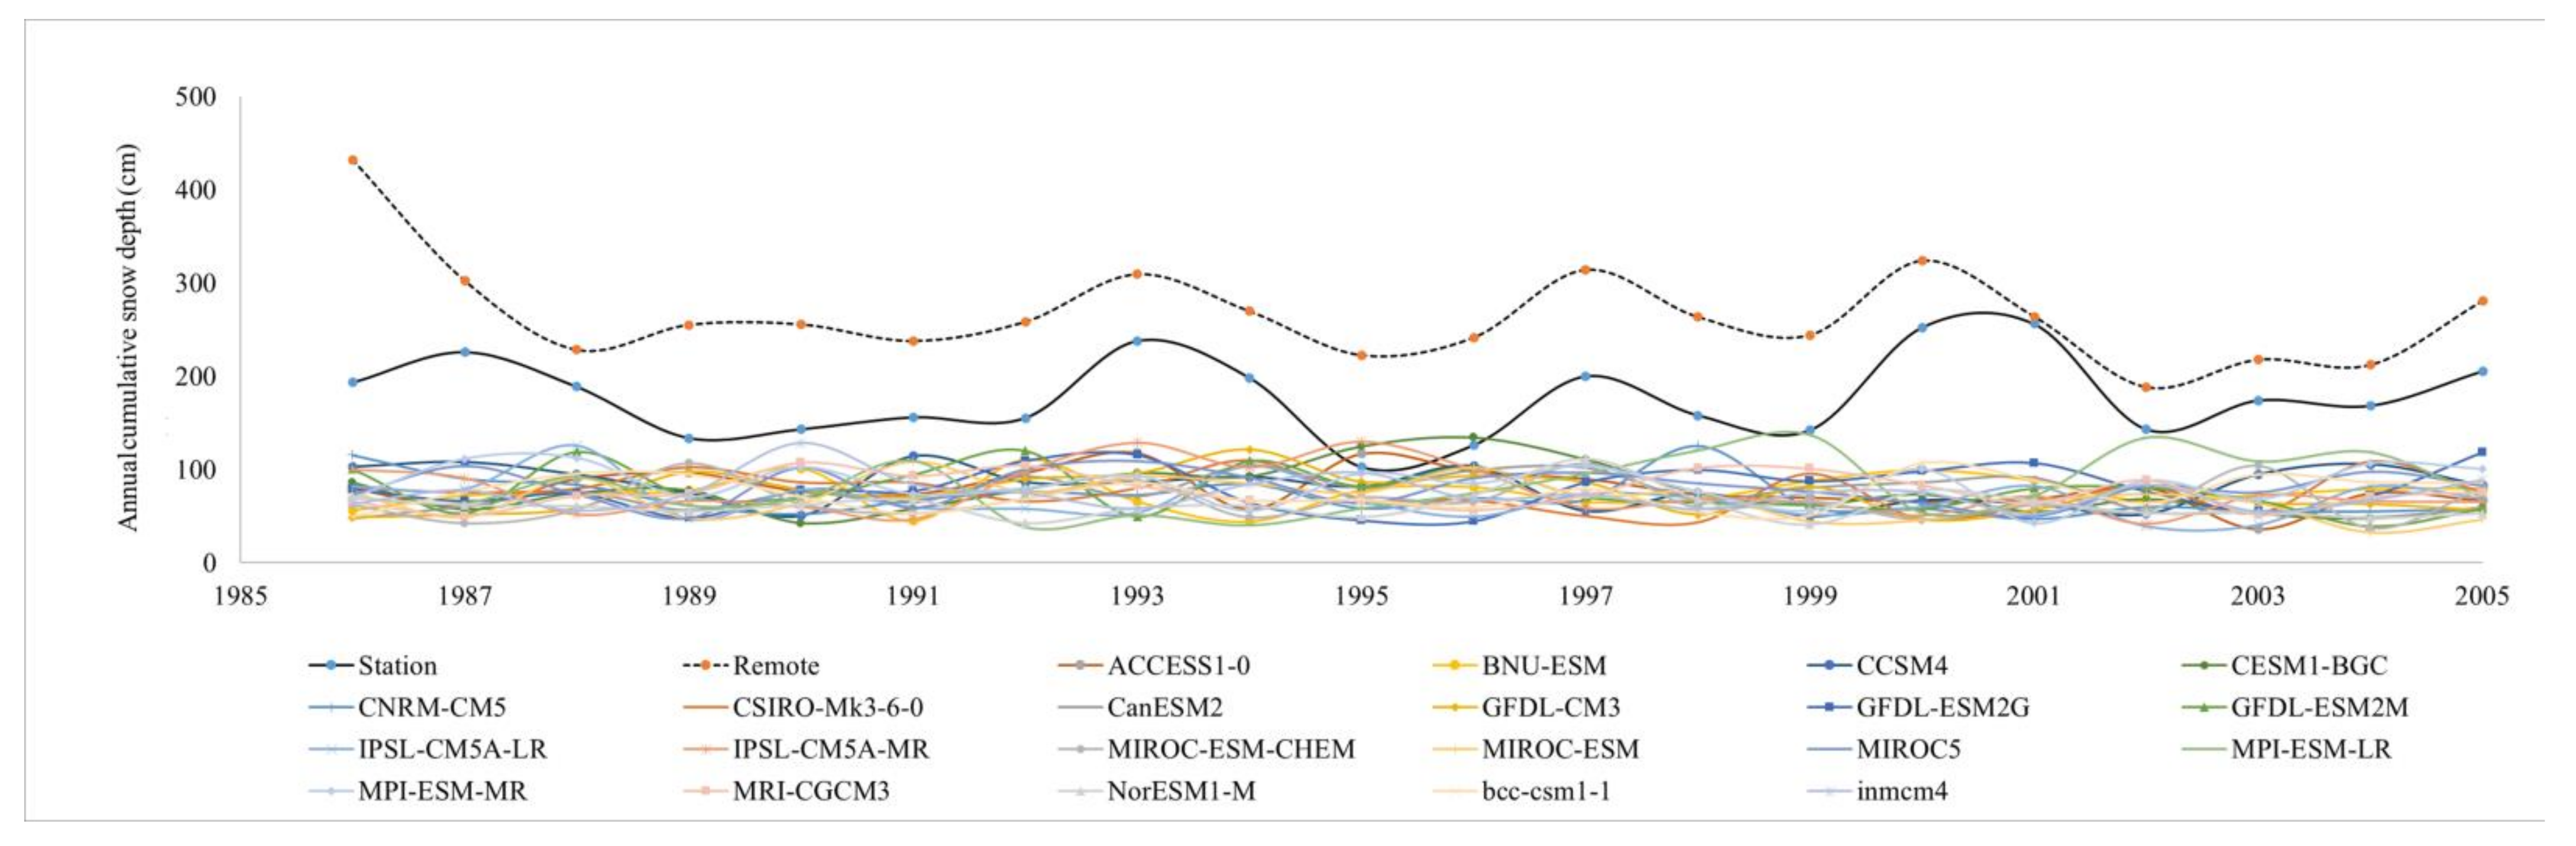
To clarify the differences between NEX-GDDP and remotely derived snow depth data, the dataset was compared with the long-term snow depth dataset for the period from 1986 to 2005 [13]. Figure 12 shows the time series variability of annual cumulative snow depth data from the simulations and station observations. The multi-year average of cumulative snow depth from the observation stations was 178.06 cm·y−1, 266.25 cm·y−1 from remote sensing data, and 75.55 cm·y−1 from NEX-GDDP data. In general, the snow depth values from remote sensing and NEX-GDDP data were higher and lower than the observations, respectively.
Simulation accuracy of snow depth data varied by models in the NEX-GDDP dataset. In terms of RMSE, the two models with the smallest simulation errors were GFDL-ESM2G and MPI-ESM-MR (29.88 and 29.97 cm, respectively). In terms of r, the two best models were GFDL-ESM2G and bcc-csm1-1 (0.58 and 0.50, respectively). Thus, the most accurate model was GFDL-ESM2G. Compared with remotely derived snow depth estimates, the RMSE and r were 28.78 and 0.52, respectively (Table 3), with an insignificant difference in accuracy between the two snow depth simulations, thus maintaining a similar ability to depict cumulative snow depth and cumulative snow cover days over China.
4.2. Simulated Snow Depth Error Sources in GFDL-ESM2G Model
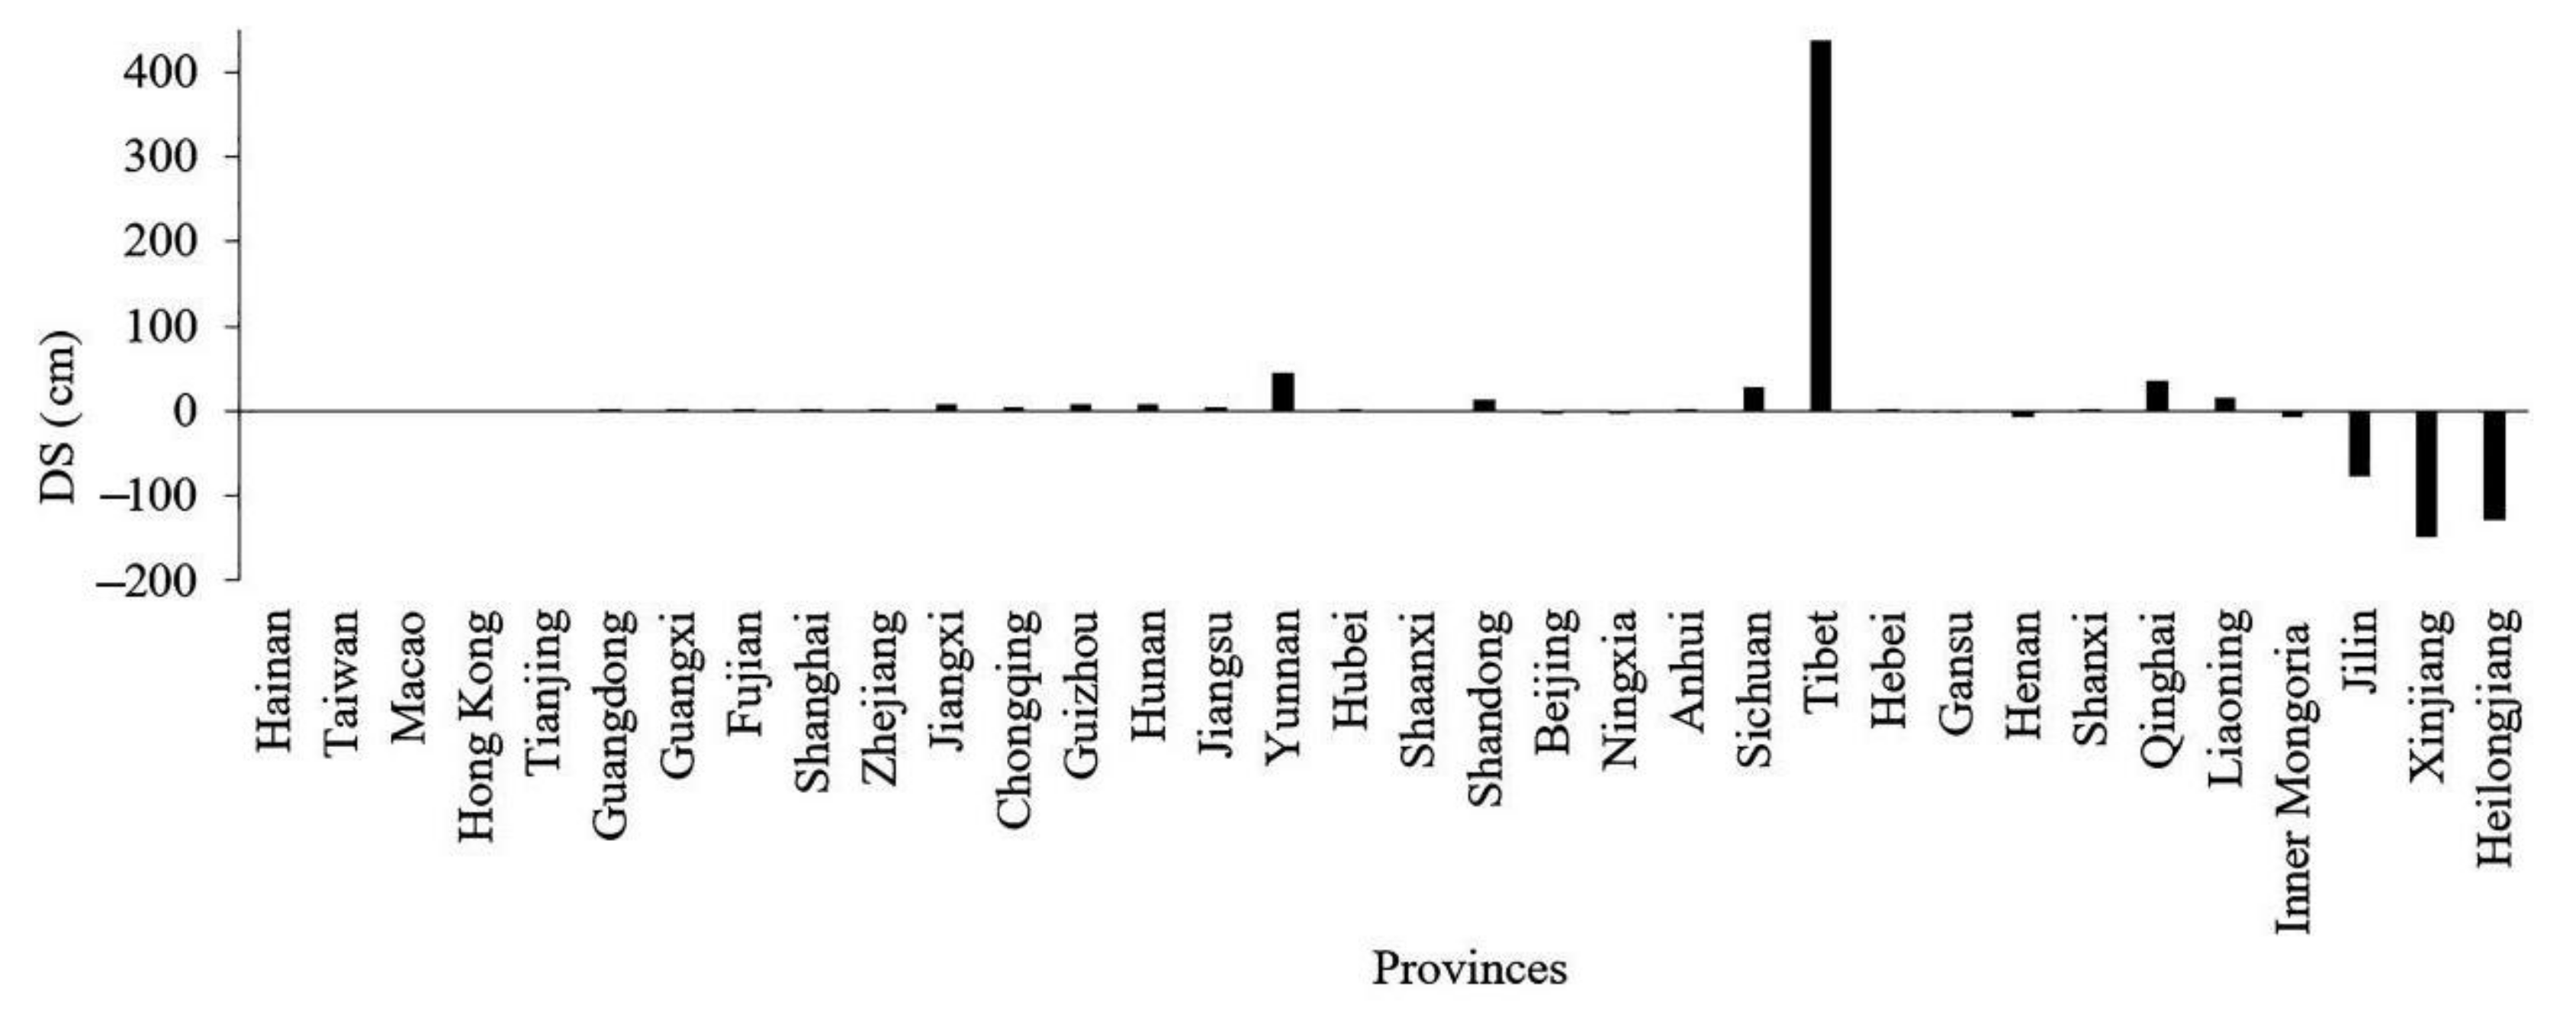
For conveniently simulated snow depth data using in future, the GFDL-ESM2G model provided the most accurate performance; however, the sources of error present deserve discussion. First, at the provincial scale, the difference in snowfall (DS, cm) and the difference in accumulated snow time (DST, days) between the snow depth data from the GFDL-ESM2G simulation and meteorological stations were calculated based on the station points. Figure 13 and Figure 14 show that the average annual snowfall levels from the GFDL-ESM2G simulation in Tibet, Yunnan, Shandong, Sichuan, Qinghai, and Liaoning provinces were higher than the observed values, whereas in Inner Mongolia, Henan, Jilin, Xinjiang, and Heilongjiang provinces, estimates were lower than the observations. Except for Tibet (where DS = 437 cm·year−1), the simulated values of snow duration according to the GFDL-ESM2G model were less than the station measured data for primary snowfall provinces.
Here, the model built for snow depth simulation was based on snow precipitation after the temperature has fallen to a certain value. As the model input variables were daily precipitation, as well as daily maximum and minimum temperatures, the amount of precipitation directly affected the amount of snowfall, while the snow cover duration was determined by a combination of air temperature and snowfall. Accordingly, to help resolve the differences in the DS and DST across all regions, we need to be clear about the difference in precipitation (DP) and difference in temperature (DT) between the snow depth data from the GFDL-ESM2G simulation and meteorological stations during snowfall periods.
4.2.1. Relationship between DS and DP
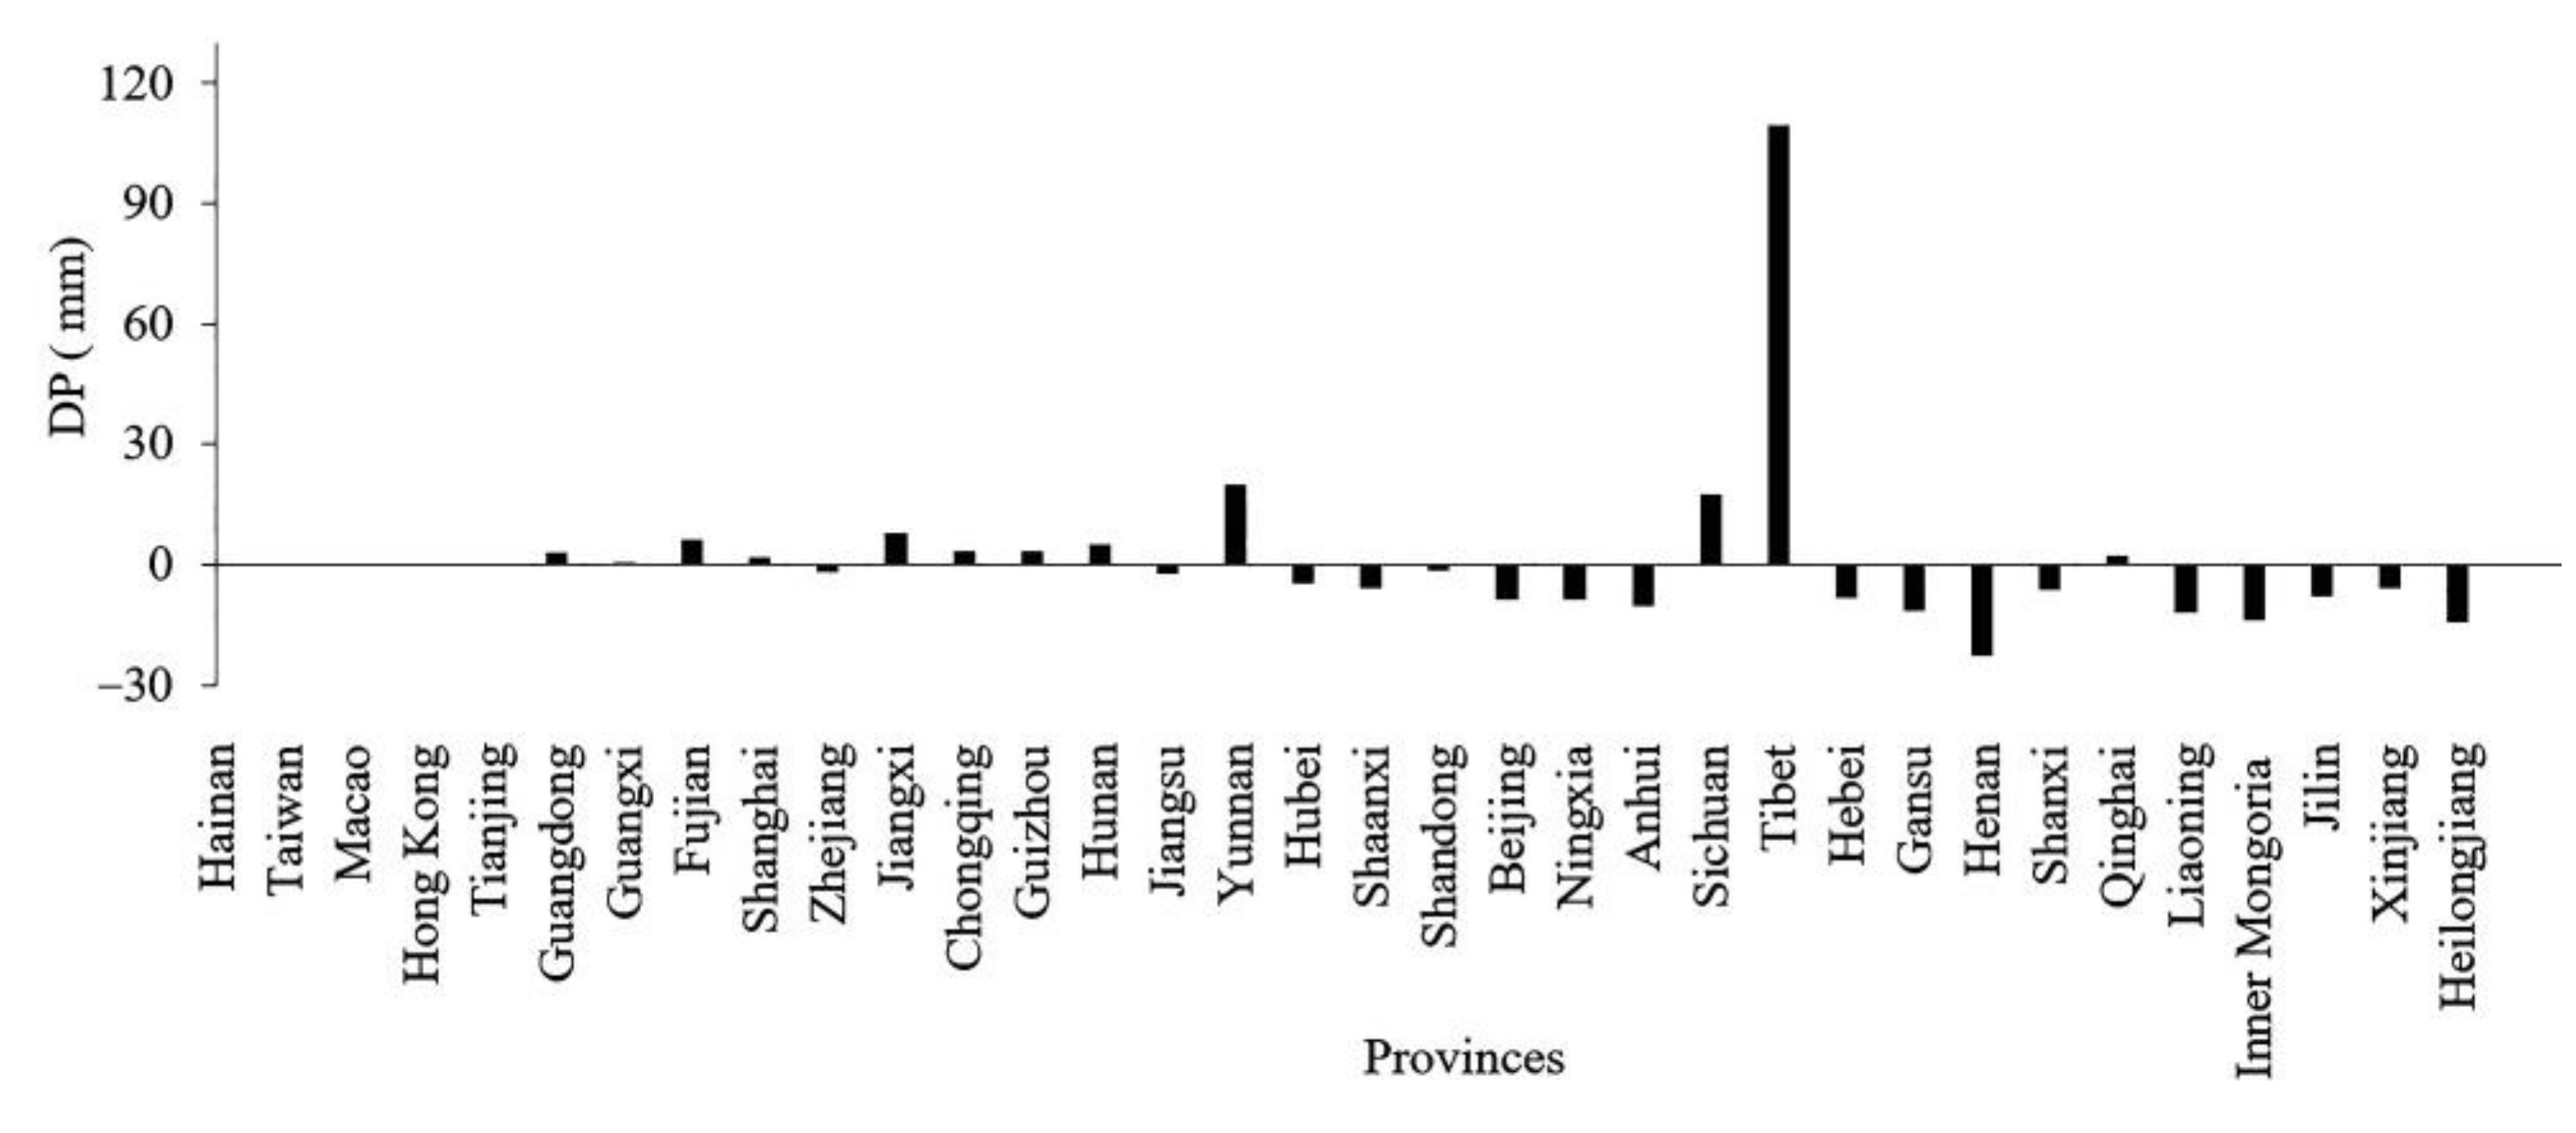
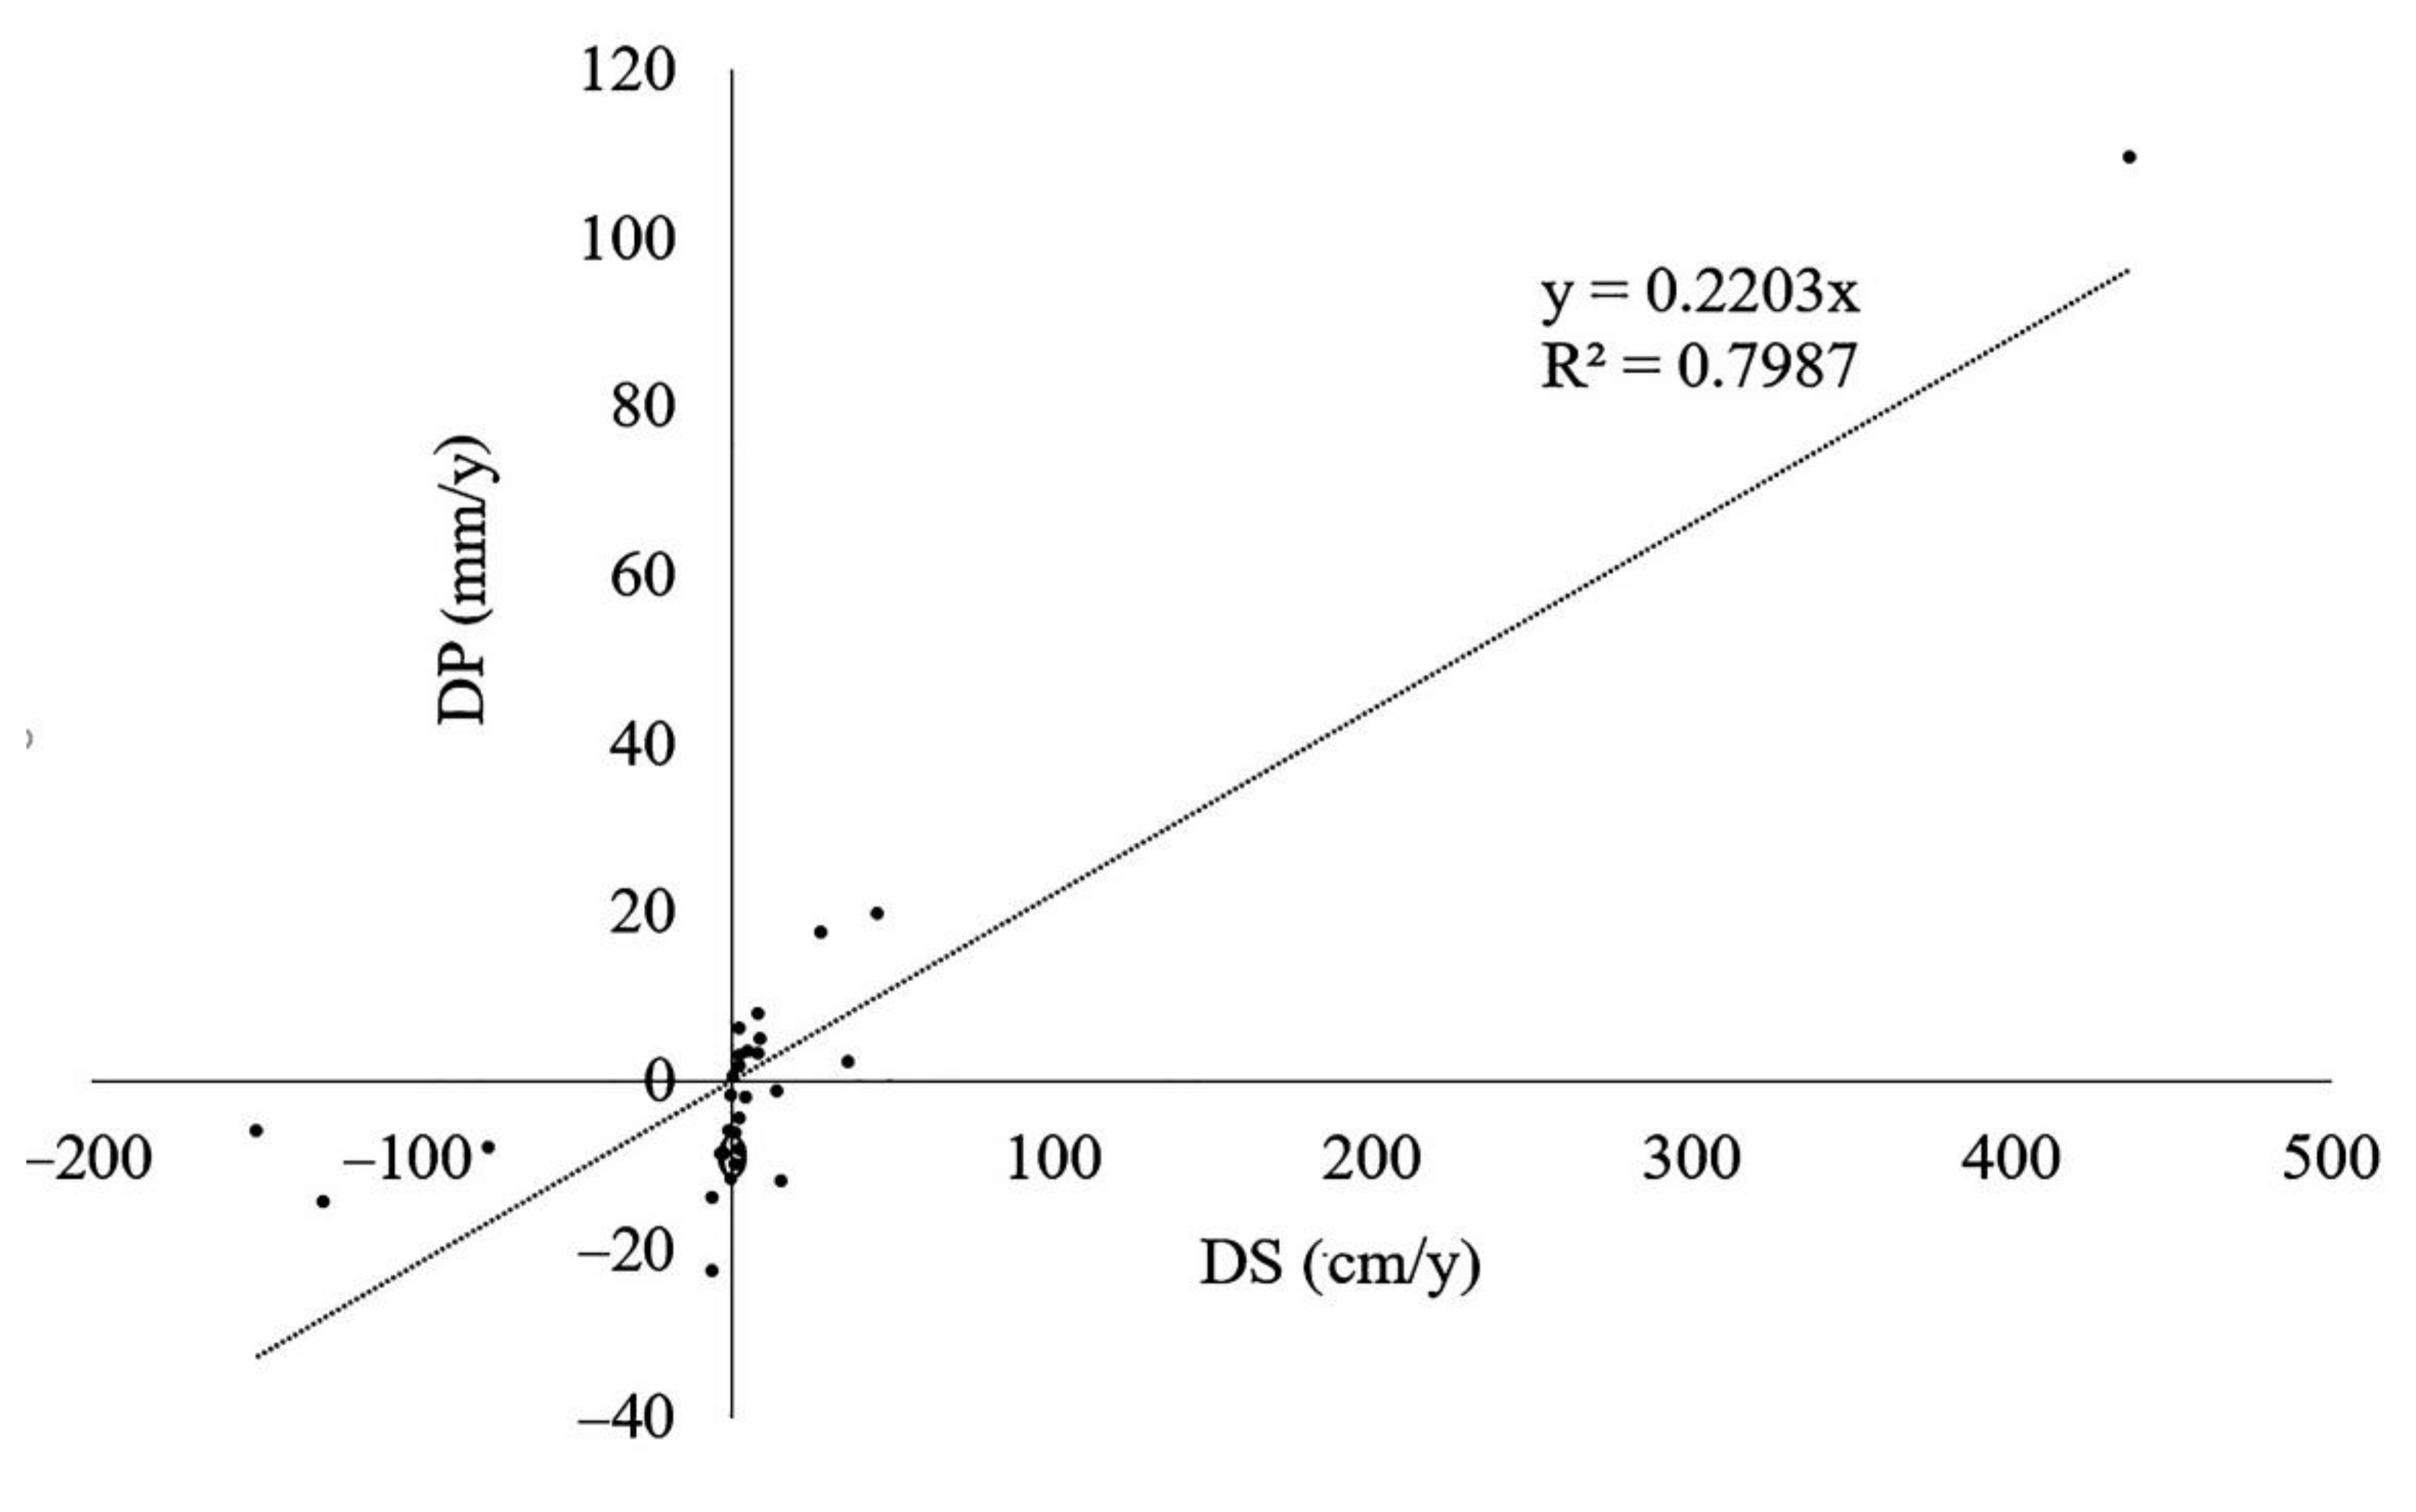
DP was first analyzed across different provinces during snowfall periods, and based on the initial results, further comparisons were made between the correlation of DP and DS. The results showed that the modeled precipitation of GFDL-ESM2G was higher than that of the meteorological station observations over Sichuan, Qinghai, and Tibet during the snowfall period; however, the remainder of the major snowfall provinces displayed the opposite phenomenon (Figure 15). Further, the correlation coefficient between DP and DS was 0.894 (R2 = 0.80, Figure 16).
4.2.2. Relationship between DST, DT, and DP
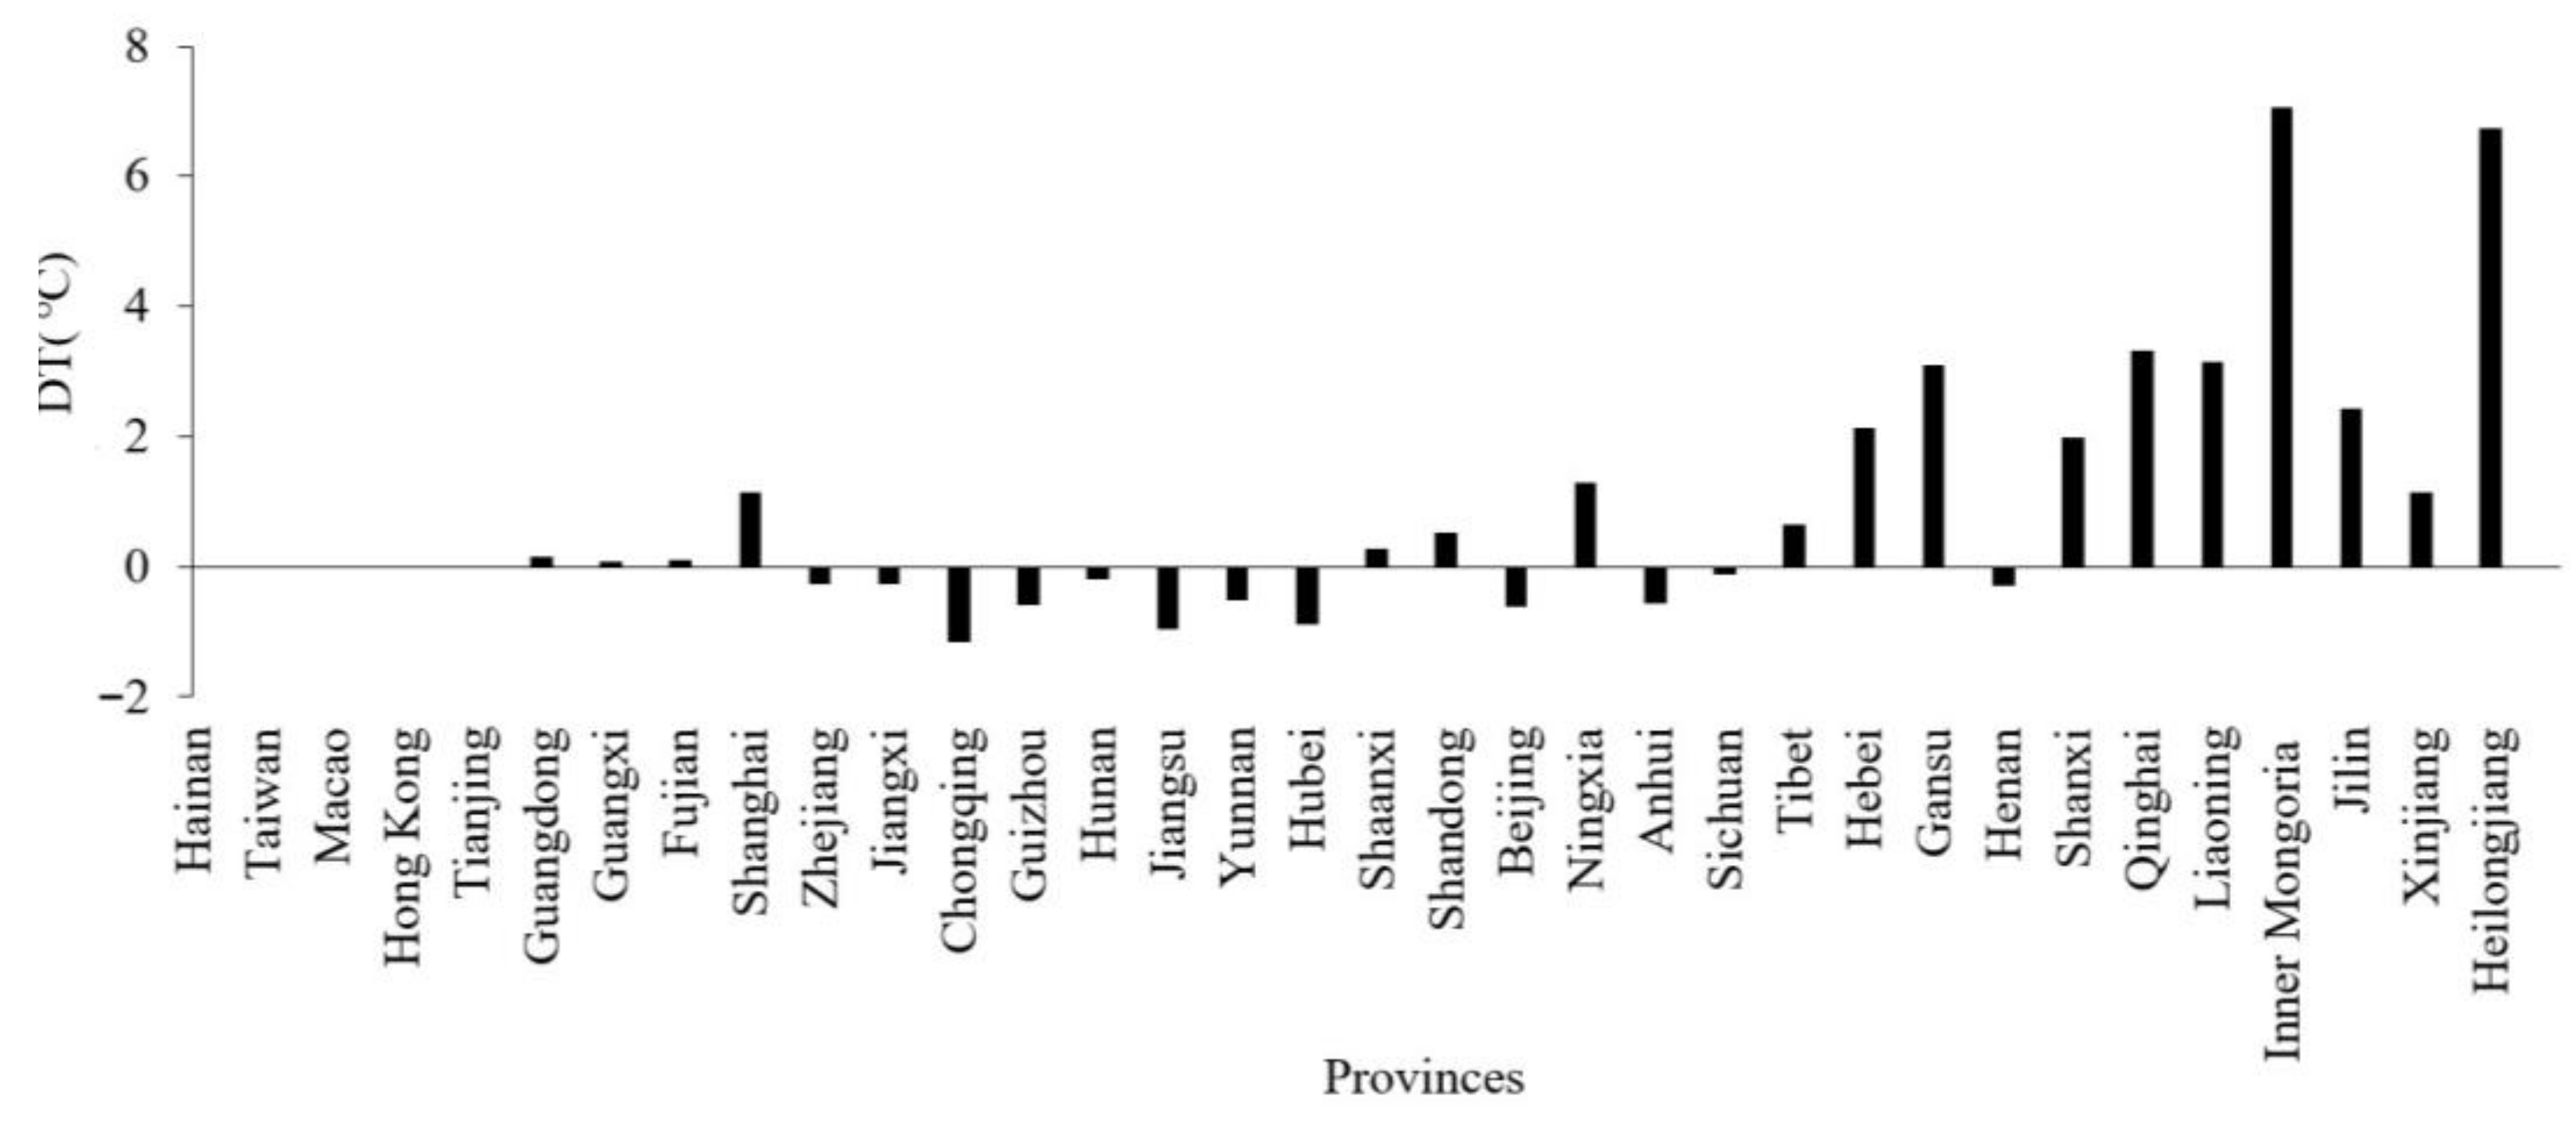
DT for the daily maximum and minimum temperatures were also calculated under different snow depth conditions, with the results showing that the temperature values from GFDL-ESM2G were higher than those from the meteorological stations in the major snow provinces during snowfall periods. In the provinces of Liaoning, Xinjiang, Inner Mongolia, Jilin, and Heilongjiang, DS and DT of both the daily maximum and minimum temperatures were positively correlated; however, other major snowfall provinces showed the opposite trend (Table 4, Figure 17). Accordingly, the relationship between average DT, DS, and DST was further studied by multi-factor analysis, revealing the following relationship (Equation (7)):
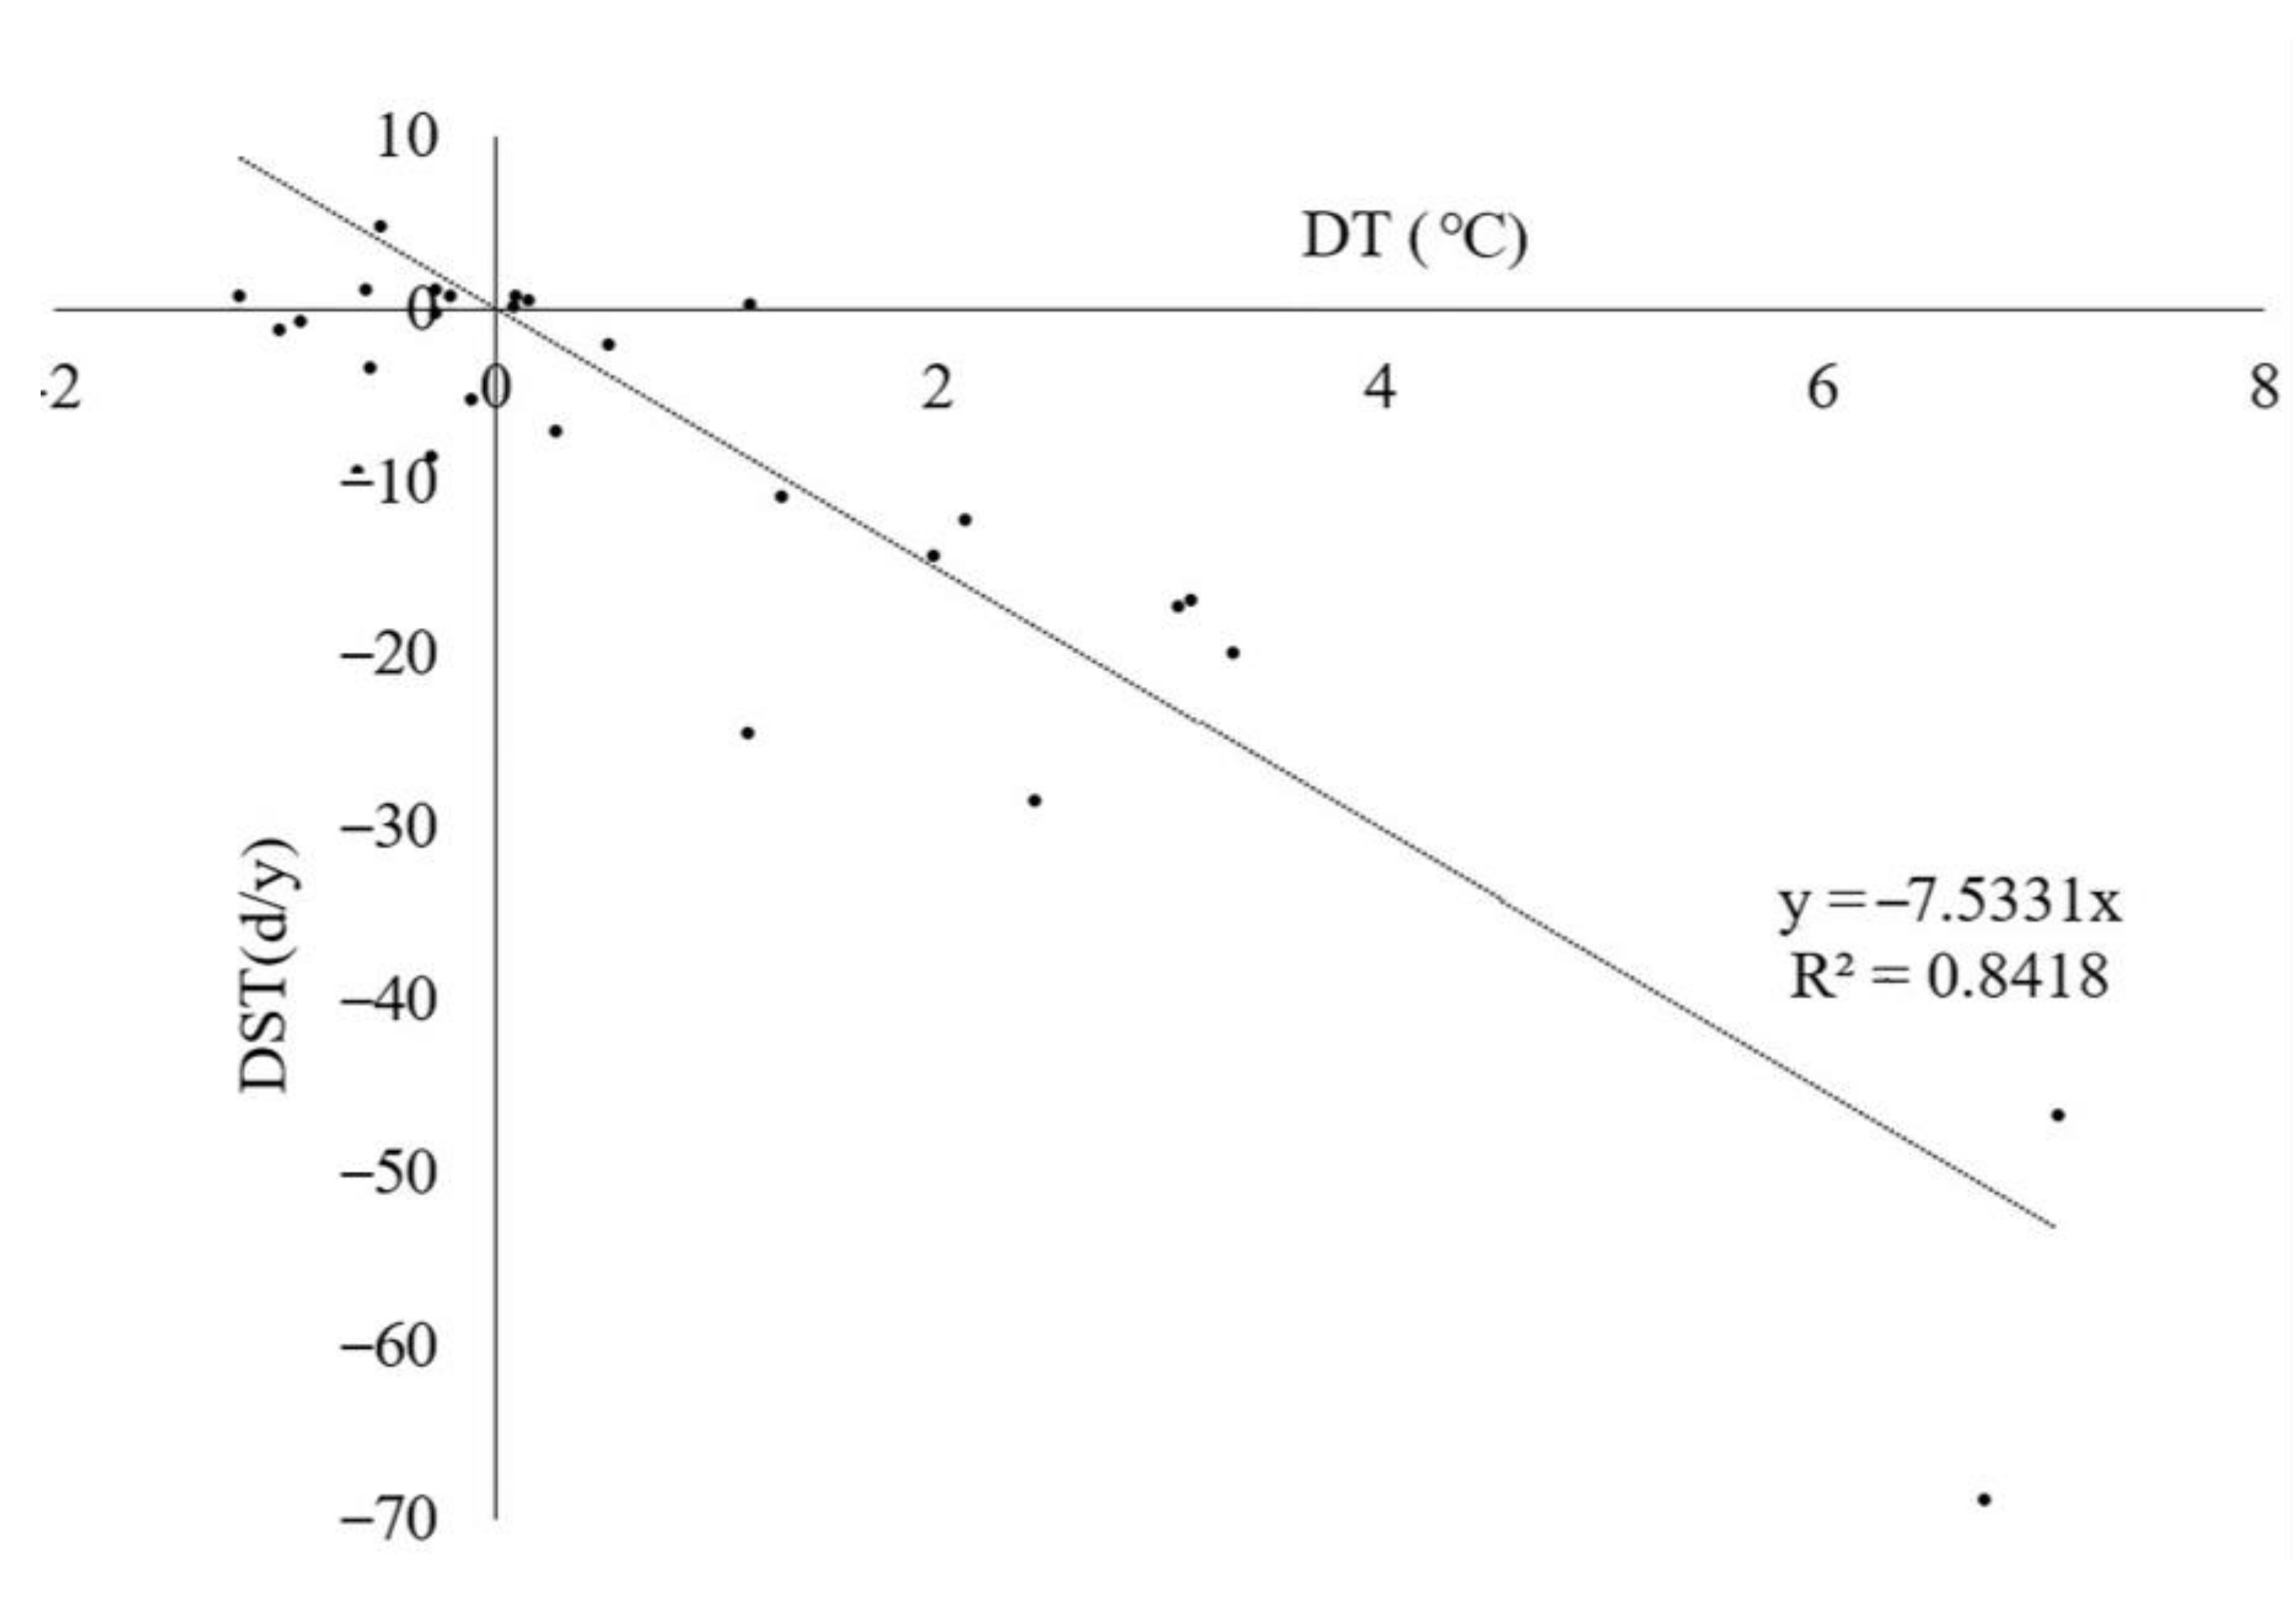
where L is the DST, T is the DT, S is the DS, and the formula maintains an R2 of 0.912. From Equation (7), it was determined that DT is the most influential factor on DST, corresponding to relatively small differences in the snowfall amount. Therefore, excluding Tibet, a region with a large DS, the relationship between DST and DT was analyzed for other provinces as well, revealing that the higher the DT, the lower the DST value (Figure 18). More specifically, DT and DST showed a negative correlation (R2 = 0.811), a result consistent with the findings of Leathers and Luff [20], who concluded that the duration of snow is highly correlated with snowfall and temperature.
Collectively, the error sources of daily snow depth data from GFDL-ESM2G varied by province, primarily in the form of precipitation data errors during snowfall periods over Tibet, and the temperature data errors in the northeastern provinces and Xinjiang. Overall, the coupling of precipitation and temperature data from the GFDL-ESM2G model was relatively poor during snowfall periods.
4.3. Extending the Snow Depth Simulation Model
4.3.1. Accuracy of the Gridded Meteorological Data
This study implemented a novel approach for verifying the raster data accuracy of temperature and precipitation in alpine regions. Currently, such validations are primarily based on either meteorological station, or interpolated, gridded meteorological data derived from these stations; however, station-based validation methods often do not reflect the integrated accuracy of gridded data, especially in poorly represented areas, or those with high terrain variability [29,30]. Accordingly, the new method for raster meteorological data validation proposed here was based on the results of the current study and designed according to the following process. The first step was to obtain highly accurate daily snow depth values via remote sensing, photogrammetry, or station observation data. The gridded meteorological data to be validated were converted into daily snow depth data using the model developed in the present study. The DS between the two snow depth datasets, or the DST between the two snow depth datasets were calculated. Finally, the differences between the validated grid meteorological data and the true weather data, as inferred from the relationship between DS, DST, DP, and DT, were obtained.
The following points should be noted when implementing this verification method: (1) The gridded meteorological data can only be verified during the snowfall period; thus, this method is most suitable for alpine weather data verification. (2) The validation error of this method is causally related to the grid cell size of the meteorological data; accordingly, obtaining high quality daily snow data are an important prerequisite for ensuring validation accuracy.
4.3.2. Simulated Snow Accumulation and Melting
The snow depth simulation model here also provides a route for the accurate simulation of snow accumulation and melting processes, provided that the complete set of influencing factors can be considered, and the spatiotemporal scales of the study can be controlled. ANNs model relationships using various influential factors on snow melt and snow melt data. Based on this training, the model can accurately simulate the snow melting process, although this method requires a large number of observations.
5. Conclusions
Based on previous findings of the most influential factors controlling snow accumulation, temperature and precipitation were selected here as the input variables for the backpropagation artificial neural network snow simulation model (BPANNSIM) created here using MATLAB. The model was trained and validated using the National Climate Reference Station data, and the results showed that the iterative simulation capability of the model was stronger for both spatiotemporal sequences, with temporal and regional correlations (R2) of monthly snow cover duration equal to 0.94 and 0.97, and 0.88 and 0.91 for monthly cumulative snow depth, respectively. The corresponding Nash coefficients between the observed and simulated values for the cumulative snow depth and duration were 0.91 and 0.87, respectively. Thus, the model’s temporal and snow depth, and iterative simulation capabilities were slightly weaker than its regional and snow cover duration abilities. The NEX-GDDP dataset was used as the input value for BPANNSIM to simulate the daily snow depth across China, and the corresponding snow depth data obtained from GFDL-ESM2G showed the highest level of accuracy. Finally, the causes of simulation errors in the GFDL-ESM2G model were also analyzed, revealing that the coupling of precipitation and temperature data from the GFDL-ESM2G model was relatively poor during snowfall periods. It was also found that DS and DST were highly correlated with DP and DT, and a new validation method for gridded meteorological data was proposed here based on this correlation. This method can verify the accuracy of gridded meteorological data within snowfall periods and verify whether the hydrothermal coupling of this data is reasonable. However, this method is applicable to the validation of meteorological data during the snowfall period. Meanwhile, the validation error of this method is causally related to the grid cell size of the meteorological data.
Author Contributions
Conceptualization and methodology: J.Y. and H.C.; data resources and curation: Q.H. and H.C.; analysis: J.Y., Q.H. and H.C.; visualization: H.C. and Q.J.; writing—original draft preparation: H.C.; writing—review and editing: J.Y. and Q.H.; funding acquisition: J.Y.; supervision and project administration: Y.D. All authors have read and agreed to the published version of the manuscript.
Funding
This research was supported by the National Key Research and Development Program of China (Grant No. 2016YFA0602404) and the Strategic Priority Research Program of Chinese Academy of Sciences (Grant No. XDA23060704).
Institutional Review Board Statement
Not applicable.
Informed Consent Statement
Not applicable.
Data Availability Statement
The Snow depth simulation dataset is publicly available. The data are currently being uploaded to the National Qinghai-Tibet Plateau Scientific Data Center (12 December 2021: http://data.tpdc.ac.cn/). The other data presented in this study are available on request from the corresponding author.
Acknowledgments
The authors would like to thank all the providers of the precipitation products for free; we would also like to thank the reviewers and editors who provided valuable comments and suggestions for this paper.
Conflicts of Interest
The authors have no conflict of interest to declare.
References
- Brown, R.D.; Goodison, B.E. Interannual variability in reconstructed Canadian snow cover, 1915–1992. J. Clim. 1996, 9, 1299–1318. [Google Scholar] [CrossRef] [Green Version]
- Goodrich, L.E. The influence of snow cover on the ground thermal regime. Can. Geotech. J. 1982, 19, 421–432. [Google Scholar] [CrossRef] [Green Version]
- Sturm, M.; McFadden, J.P.; Liston, G.E.; Stuart Chapin, F.; Racine, C.H.; Holmgren, J. Snow-shrub interactions in Arctic Tundra: A hypothesis with climatic implications. J. Clim. 2001, 14, 336–344. [Google Scholar] [CrossRef] [Green Version]
- Zhang, T. Influence of the seasonal snow cover on the ground thermal regime: An overview. Rev. Geophys. 2005, 43, 421–432. [Google Scholar] [CrossRef]
- Bulygina, O.N.; Razuvaev, V.N.; Korshunova, N.N. Changes in snow cover over Northern Eurasia in the last few decades. Environ. Res. Lett. 2009, 4, 45026. [Google Scholar] [CrossRef]
- Lv, C.; Gong, H.L. Snow disaster risk assessment in china based on environment & disaster monitoring and predicting small satellite. Adv. Mater. Res. 2013, 765–767, 2996–2999. [Google Scholar] [CrossRef]
- Newark, M.J.; Welsh, L.E.; Morris, R.J.; Dnes, W.V. Revised ground snow loads for the 1990 National Building Code of Canada. Can. J. Civ. Eng. 1989, 16, 267–278. [Google Scholar] [CrossRef]
- Strasser, U. Snow loads in a changing climate: New risks? Nat. Hazards Earth Syst. Sci. 2008, 8, 1–8. [Google Scholar] [CrossRef] [Green Version]
- Yin, Z.; Xu, S.; Yin, J.; Wang, J. Small-scale based scenario modeling and disaster risk assessment of urban rainstorm water-logging. Dili Xuebao/Acta Geogr. Sin. 2010, 65, 553–562. [Google Scholar]
- Cayan, D.R. Interannual climate variability and snowpack in the western United States. J. Clim. 1996, 9, 928–948. [Google Scholar] [CrossRef] [Green Version]
- Vikhamar, D.; Solberg, R. Snow-cover mapping in forests by constrained linear spectral unmixing of MODIS data. Remote Sens. Environ. 2003, 88, 309–323. [Google Scholar] [CrossRef]
- Armstrong, R.L.; Brodzik, M.J. Hemispheric-scale comparison and evaluation of passive-microwave snow algorithms. Ann. Glaciol. 2002, 34, 38–44. [Google Scholar] [CrossRef] [Green Version]
- Che, T.; Li, X.; Jin, R.; Armstrong, R.; Zhang, T. Snow depth derived from passive microwave remote-sensing data in China. Ann. Glaciol. 2008, 49, 145–154. [Google Scholar] [CrossRef] [Green Version]
- Pan, C.G.; Kirchner, P.B.; Kimball, J.S.; Du, J. A long-term passive microwave snowoff record for the alaska region 1988–2016. Remote Sens. 2020, 12, 153. [Google Scholar] [CrossRef] [Green Version]
- Liang, D.; Xu, X.; Tsang, L.; Andreadis, K.M.; Josberger, E.G. Modeling multi-layer effects in passive microwave remote sensing of dry snow using Dense Media Radiative Transfer Theory (DMRT) based on quasicrystalline approximation. Int. Geosci. Remote Sens. Symp. 2007, 46, 1215–1218. [Google Scholar] [CrossRef]
- Ghaderpour, E.; Vujadinovic, T.; Hassan, Q.K. Application of the Least-Squares Wavelet software in hydrology: Athabasca River Basin. J. Hydrol. Reg. Stud. 2021, 36. [Google Scholar] [CrossRef]
- Ma, L.-J.; Luo, Y.; Qin, D.-H. Snow water equivalent over Eurasia in the next 50 years projected by aggregated CMIP3 models. Sci. Cold Arid Reg. 2012, 4, 93. [Google Scholar] [CrossRef]
- Xian, Z. China Evaluation and Projection of Northern Hemisphere March—April Snow Covered Area Simulated by CMIP5 Coupled Climate Models. Progress. Inquisitiones Mutat. Clim. 2013, 9, 173. [Google Scholar]
- Pomeroy, J.W.; Gray, D.M.; Shook, K.R.; Toth, B.; Essery, R.L.H.; Pietroniro, A.; Hedstrom, N. An evaluation of snow accumulation and ablation processes for land surface modelling. Hydrol. Process. 1998, 12, 2339–2367. [Google Scholar] [CrossRef]
- Leathers, D.J.; Luff, B.L. Characteristics of snow cover duration across the Northeast United States of America. Int. J. Climatol. 1997, 17, 1535–1547. [Google Scholar] [CrossRef]
- Thrasher, B.; Xiong, J.U.N.; Wang, W.; Melton, F.; Michaelis, A.; Nemani, R. Downscaled climate projections suitable for resource management. EOS 2013, 94, 321–323. [Google Scholar] [CrossRef]
- Bao, Y.; Wen, X. Projection of China’s near- and long-term climate in a new high-resolution daily downscaled dataset NEX-GDDP. J. Meteorol. Res. 2017, 31, 236–249. [Google Scholar] [CrossRef]
- Chen, H.P.; Sun, J.Q.; Li, H.X. Future changes in precipitation extremes over China using the NEX-GDDP high-resolution daily downscaled data-set. Atmos. Ocean. Sci. Lett. 2017, 10, 403–410. [Google Scholar] [CrossRef] [Green Version]
- Li, W.; Jiang, Z.; Xu, J.; Li, L. Extreme precipitation indices over China in CMIP5 models. Part II: Probabilistic projection. J. Clim. 2016, 29, 8989–9004. [Google Scholar] [CrossRef]
- Bao, Q.; Liu, Y.; Wu, G.; He, B.; Li, J.; Wang, L.; Wu, X.; Chen, K.; Wang, X.; Yang, J.; et al. CAS FGOALS-f3-H and CAS FGOALS-f3-L outputs for the high-resolution model intercomparison project simulation of CMIP6. Atmos. Ocean. Sci. Lett. 2020, 13, 576–581. [Google Scholar] [CrossRef]
- McKeown, D.M. The Role of Artificial Intelligence in the Integration of Remotely Sensed Data with Geographic Information Systems. IEEE Trans. Geosci. Remote Sens. 1987, GE-25, 330–348. [Google Scholar] [CrossRef]
- Zhu, X.X.; Tuia, D.; Mou, L.; Xia, G.S.; Zhang, L.; Xu, F.; Fraundorfer, F. Deep Learning in Remote Sensing: A Comprehensive Review and List of Resources. IEEE Geosci. Remote Sens. Mag. 2017, 5, 8–36. [Google Scholar] [CrossRef] [Green Version]
- Carrier, C.A.; Kalra, A.; Ahmad, S. Long-range precipitation forecasts using paleoclimate reconstructions in the western United States. J. Mt. Sci. 2016, 13, 614–632. [Google Scholar] [CrossRef]
- Tucker, D. Orographic precipitation. Encycl. Earth Sci. Ser. 2005, 552–555. [Google Scholar] [CrossRef]
- Zhang, L.; Shi, H. Local modeling of tree growth by geographically weighted regression. For. Sci. 2004, 50, 225–244. [Google Scholar] [CrossRef]
Figure 1.
Distribution of the National Climate Reference Stations used for model training (n = 155) and validation (n = 30).
Figure 1.
Distribution of the National Climate Reference Stations used for model training (n = 155) and validation (n = 30).

Figure 2.
Conceptual diagram of the model used. (w: weight, b: bias).

Figure 3.
Technology process.

Figure 4.
BPNNSIM iterative simulation process.

Figure 5.
Validation error curves.

Figure 6.
Variation of simulated and observed monthly snow depths (October to April; same below).

Figure 7.
Variation of simulated and observed snow cover days per month.

Figure 8.
Correlation between simulated and observed monthly values on monthly for (a) cumulative snow depth, and (b) cumulative snow cover days.
Figure 8.
Correlation between simulated and observed monthly values on monthly for (a) cumulative snow depth, and (b) cumulative snow cover days.

Figure 9.
Observed and iterative simulated values at the provincial scale for: (a) cumulative snow depth, and (b) cumulative snow cover days.
Figure 9.
Observed and iterative simulated values at the provincial scale for: (a) cumulative snow depth, and (b) cumulative snow cover days.

Figure 10.
Correlation of observed and simulated values at the provincial scale for: (a) cumulative snow depth, and (b) cumulative snow cover days.
Figure 10.
Correlation of observed and simulated values at the provincial scale for: (a) cumulative snow depth, and (b) cumulative snow cover days.

Figure 11.
Average annual snow depth distribution in China based on NEX-GDDP data, according to: (a) 1986–2005; (b) RCP4.5, 2016–2035; (c) RCP8.5 2016–2035; (d) RCP4.5 2046–2065; and (e) RCP8.5 2046–2065.
Figure 11.
Average annual snow depth distribution in China based on NEX-GDDP data, according to: (a) 1986–2005; (b) RCP4.5, 2016–2035; (c) RCP8.5 2016–2035; (d) RCP4.5 2046–2065; and (e) RCP8.5 2046–2065.

Figure 12.
Temporal changes in annual cumulative snow depth during 1986–2005 as derived from observations, NEX-GDDP, and remote sensing data over China.
Figure 12.
Temporal changes in annual cumulative snow depth during 1986–2005 as derived from observations, NEX-GDDP, and remote sensing data over China.

Figure 13.
Difference in snowfall (DS) between the snow depth data from the GFDL-ESM2G model and meteorological station observations for each province.
Figure 13.
Difference in snowfall (DS) between the snow depth data from the GFDL-ESM2G model and meteorological station observations for each province.

Figure 14.
Difference in accumulated snow time (DST) between the GFDL-ESM2G model and meteorological station observations for each province.
Figure 14.
Difference in accumulated snow time (DST) between the GFDL-ESM2G model and meteorological station observations for each province.

Figure 15.
Difference in precipitation (DP) between the GFDL-ESM2G model and meteorological station observations for each province during snowfall periods.
Figure 15.
Difference in precipitation (DP) between the GFDL-ESM2G model and meteorological station observations for each province during snowfall periods.

Figure 16.
Correlation of DP and DS during snowfall periods.

Figure 17.
Average difference in temperature (DT) between the GFDL-ESM2G model and meteorological station observations for each province during snowfall periods.
Figure 17.
Average difference in temperature (DT) between the GFDL-ESM2G model and meteorological station observations for each province during snowfall periods.

Figure 18.
Correlation of DT and DST during snowfall periods.


Table 1.
Information for the 21 CMIP5 global climate models in NEX-GDDP dataset.
| No. | Model Name | Country | Organization |
|---|---|---|---|
| 1 | ACCESS1-0 | Australia | CSIRO-BOM |
| 2 | bcc-csm1-1 | China | BCC |
| 3 | BNU-ESM | China | GCESS |
| 4 | CanESM2 | Canada | CCCMA |
| 5 | CCSM4 | The United States | NCAR |
| 6 | CESM1-BGC | The United States | NSF-DOE-NCAR |
| 7 | CNRM-CM5 | France | CERFACS |
| 8 | CSIRO-Mk3-6-0 | Australia | CSIRO-QCCCE |
| 9 | GFDL-CM3 | The United States | NOAA-GFDL |
| 10 | GFDL-ESM2G | The United States | NOAA-GFDL |
| 11 | GFDL-ESM2M | The United States | NOAA-GFDL |
| 12 | inmcm4 | Russia | UNM |
| 13 | IPSL-CM5A-LR | France | IPSL |
| 14 | IPSL-CM5A-MR | France | IPSL |
| 15 | MIROC5 | Japan | MIROC |
| 16 | MIROC-ESM | Japan | MIROC |
| 17 | MIROC-ESM-CHEM | Japan | MIROC |
| 18 | MPI-ESM-LR | Germany | MPI-M |
| 19 | MPI-ESM-MR | Germany | MPI-M |
| 20 | MRI-CGCM3 | Japan | MRI |
| 21 | NorESM1-M | Norway | NCC |
Table 2.
Basic parameter settings of the backpropagation artificial neural network snow simulation model (BPNNSIM).
Table 2.
Basic parameter settings of the backpropagation artificial neural network snow simulation model (BPNNSIM).
| Parameter Name | Value | Definitions |
|---|---|---|
| activation function | Tansig, purelin | Transfer functions between neurons |
| net.trainParam.epochs | 1000 | Maximum times of training |
| net.trainParam.goal | 1 × 10⁻⁷ | Minimum error in training goal |
| net.trainParam.lr | 0.01 | Learning rate |
| net.trainParam.mc | 0.9 | Additional momentum factors |
| net.trainParam.show | 25 | The display frequency |
Table 3.
RMSE & r between the two sets of simulations and observed snow depth data.
| Model Name | Remote | ACCESS1-0 | BNU-ESM | CCSM4 | CESM1-BGC |
| RMSE | 28.78 | 32.01 | 32.39 | 30.67 | 33.20 |
| r | 0.52 * | −0.31 | −0.04 | 0.03 | −0.24 |
| Model name | CNRM-CM5 | CSIRO-Mk3-6-0 | CanESM2 | GFDL-CM3 | GFDL-ESM2G |
| RMSE | 33.61 | 32.80 | 32.61 | 33.70 | 29.88 |
| r | 0.05 | −0.23 | 0.10 | −0.38 | 0.58 ** |
| Model name | GFDL-ESM2M | IPSL-CM5A-LR | IPSL-CM5A-MR | MIROC-ESM-CHEM | MIROC-ESM |
| RMSE | 32.71 | 33.67 | 32.59 | 34.94 | 34.44 |
| r | −0.24 | 0.32 | −0.03 | −0.12 | −0.15 |
| Model name | MIROC5 | MPI-ESM-LR | MPI-ESM-MR | MRI-CGCM3 | NorESM1-M |
| RMSE | 30.75 | 32.41 | 29.97 | 32.34 | 35.40 |
| r | 0.06 | −0.31 | 0.02 | −0.26 | 0.35 |
| Model name | bcc-csm1-1 | inmcm4 | |||
| RMSE | 31.52 | 33.23 | |||
| r | 0.50 * | −0.39 |
Correlation is significant at the * p < 0.05 and ** p < 0.01 level.
Table 4.
Difference in temperature (DT) between the GFDL-ESM2G model and meteorological station observations for each province under different snow depth conditions.
Table 4.
Difference in temperature (DT) between the GFDL-ESM2G model and meteorological station observations for each province under different snow depth conditions.
| Province | DT of Daily Maximum Temperature | DT of Daily Minimum Temperature | Avg DT | ||||||||
|---|---|---|---|---|---|---|---|---|---|---|---|
| Snow Depth (cm) | 1–3 | 3–5 | 5–10 | 10–15 | >15 | 1–3 | 3–5 | 5–10 | 10–15 | >15 | |
| Hainan | 0.00 | 0.00 | 0.00 | 0.00 | 0.00 | 0.00 | 0.00 | 0.00 | 0.00 | 0.00 | 0.00 |
| Taiwan | 0.00 | 0.00 | 0.00 | 0.00 | 0.00 | 0.00 | 0.00 | 0.00 | 0.00 | 0.00 | 0.00 |
| Macao | 0.00 | 0.00 | 0.00 | 0.00 | 0.00 | 0.00 | 0.00 | 0.00 | 0.00 | 0.00 | 0.00 |
| Hong Kong | 0.00 | 0.00 | 0.00 | 0.00 | 0.00 | 0.00 | 0.00 | 0.00 | 0.00 | 0.00 | 0.00 |
| Tianjin | 0.00 | 0.00 | 0.00 | 0.00 | 0.00 | 0.00 | 0.00 | 0.00 | 0.00 | 0.00 | 0.00 |
| Guangdong | 0.83 | 0.48 | 0.47 | 0.24 | 0.00 | 0.07 | −0.11 | −0.19 | −0.24 | 0.00 | 0.15 |
| Guangxi | 1.54 | −0.72 | 0.38 | 0.00 | 0.00 | 0.20 | −0.23 | −0.37 | 0.00 | 0.00 | 0.08 |
| Fujian | 0.09 | 1.39 | 0.44 | −0.29 | 0.00 | 0.45 | −0.84 | −0.09 | −0.21 | 0.00 | 0.09 |
| Shanghai | 4.11 | 1.61 | 0.00 | 0.00 | 0.00 | 0.87 | 4.94 | 0.00 | 0.00 | 0.00 | 1.15 |
| Zhejiang | 1.10 | −2.96 | −0.44 | −2.31 | 0.00 | 1.34 | −0.27 | 0.63 | 0.20 | 0.00 | −0.27 |
| Jiangxi | 1.07 | 0.57 | 0.10 | −1.65 | −1.83 | 0.81 | 0.13 | −0.01 | −1.71 | −0.19 | −0.27 |
| Chongqing | 1.85 | −3.62 | −0.60 | −1.97 | 0.00 | −0.03 | −2.71 | −2.01 | −2.45 | 0.00 | −1.15 |
| Guizhou | 0.38 | −1.68 | −3.14 | −1.25 | 0.00 | −0.22 | −1.22 | −0.83 | 2.07 | 0.00 | −0.59 |
| Hunan | 1.00 | −0.26 | −0.04 | 0.26 | −2.53 | 1.01 | 0.00 | −0.24 | −0.79 | −0.45 | −0.20 |
| Jiangsu | 1.28 | 0.85 | −1.73 | −1.43 | −2.70 | −0.19 | −1.01 | −1.24 | −3.49 | −0.05 | −0.97 |
| Yunnan | 1.30 | −0.92 | 0.65 | −0.84 | −1.80 | −1.03 | −0.67 | −1.13 | −0.44 | −0.30 | −0.52 |
| Hubei | 0.66 | −0.68 | −2.05 | −2.70 | 0.00 | −0.58 | −1.38 | −1.40 | −0.63 | 0.00 | −0.88 |
| Shaanxi | 0.67 | −0.30 | −0.83 | −1.14 | 0.00 | 0.37 | −0.61 | 1.37 | 3.18 | 0.00 | 0.27 |
| Shandong | 1.29 | 1.36 | −0.15 | −0.77 | 0.63 | −0.82 | −1.01 | −1.31 | 2.98 | 2.95 | 0.52 |
| Beijing | 2.62 | 0.97 | −2.94 | −4.80 | 0.00 | −1.34 | −0.84 | −1.43 | 1.50 | 0.00 | −0.63 |
| Ningxia | 6.53 | 3.48 | 0.00 | 0.00 | 0.00 | 4.07 | −1.12 | 0.00 | 0.00 | 0.00 | 1.30 |
| Anhui | 0.38 | −0.12 | −0.05 | −0.96 | −1.31 | −0.12 | 0.12 | 0.07 | −2.96 | −0.73 | −0.57 |
| Sichuan | 0.45 | −0.13 | −0.49 | −0.26 | −0.53 | 0.13 | −0.66 | −0.08 | −0.38 | 0.89 | −0.11 |
| Tibet | 2.82 | 3.04 | 2.95 | 2.13 | 1.78 | 1.54 | 0.64 | 0.25 | −4.62 | −3.95 | 0.66 |
| Hebei | 4.72 | 3.20 | 2.53 | 0.45 | 0.00 | 2.97 | 1.06 | 2.55 | 3.82 | 0.00 | 2.13 |
| Gansu | 3.62 | 2.46 | 1.49 | 1.62 | 0.93 | 5.23 | 7.01 | 4.71 | 3.36 | 0.53 | 3.09 |
| Henan | 0.57 | −0.44 | −0.87 | −1.48 | 0.00 | −0.56 | −1.52 | −1.31 | 2.76 | 0.00 | −0.29 |
| Shanxi | 3.03 | 3.50 | 4.62 | 0.59 | 0.00 | 1.47 | 2.79 | 4.35 | −0.54 | 0.00 | 1.98 |
| Qinghai | 5.86 | 3.90 | 2.79 | 0.33 | 0.98 | 6.38 | 4.75 | 4.86 | 1.39 | 2.11 | 3.33 |
| Liaoning | 2.87 | 2.62 | 2.96 | 3.48 | 3.73 | 1.00 | 0.38 | 2.77 | 4.18 | 7.53 | 3.15 |
| Inner Mongolia | 10.07 | 8.32 | 7.51 | 4.92 | 0.00 | 7.83 | 7.88 | 11.65 | 12.48 | 0.00 | 7.07 |
| Jilin | 0.83 | 1.73 | 3.67 | 4.59 | 3.81 | −0.58 | −0.31 | 3.32 | 4.56 | 2.78 | 2.44 |
| Xinjiang | −0.63 | −0.78 | 0.33 | 2.22 | 2.75 | −1.64 | −0.85 | 1.11 | 4.39 | 4.54 | 1.14 |
| Heilongjiang | 1.69 | 6.00 | 9.33 | 7.71 | 6.12 | 0.71 | 4.68 | 9.42 | 7.56 | 14.13 | 6.74 |
Publisher’s Note: MDPI stays neutral with regard to jurisdictional claims in published maps and institutional affiliations. |
© 2021 by the authors. Licensee MDPI, Basel, Switzerland. This article is an open access article distributed under the terms and conditions of the Creative Commons Attribution (CC BY) license (https://creativecommons.org/licenses/by/4.0/).
Share and Cite
MDPI and ACS Style
Chen, H.; Yang, J.; Ding, Y.; He, Q.; Ji, Q. Simulation of Daily Snow Depth Data in China Based on the NEX-GDDP. Water 2021, 13, 3599. https://doi.org/10.3390/w13243599
AMA Style
Chen H, Yang J, Ding Y, He Q, Ji Q. Simulation of Daily Snow Depth Data in China Based on the NEX-GDDP. Water. 2021; 13(24):3599. https://doi.org/10.3390/w13243599
Chicago/Turabian StyleChen, Hongju, Jianping Yang, Yongjian Ding, Qingshan He, and Qin Ji. 2021. "Simulation of Daily Snow Depth Data in China Based on the NEX-GDDP" Water 13, no. 24: 3599. https://doi.org/10.3390/w13243599
Note that from the first issue of 2016, this journal uses article numbers instead of page numbers. See further details here.