
Characteristics of Low-Oxygen Oxidation Ditch with Improved Nitrogen Removal


Department of Water Supply and Wastewater Treatment, Moscow State University of Civil Engineering (National Research University), 129337 Moscow, Russia
*
Author to whom correspondence should be addressed.
Water 2021, 13(24), 3603; https://doi.org/10.3390/w13243603
Submission received: 17 November 2021
/
Revised: 8 December 2021
/
Accepted: 13 December 2021
/
Published: 15 December 2021
(This article belongs to the Section Wastewater Treatment and Reuse)
Abstract
:This article presents a study on the operational stability of laboratory oxidation ditches, designated for synthetic and real wastewater and operable at low concentrations of dissolved oxygen. The project encompassed the stability monitoring of activated sludge depending on sedimentation characteristics and hydrobiological indicator microorganisms, determining (1) the size of sludge floccules and (2) the main functional groups of microorganisms identified in the course of the PCR analysis and reaction rates, plotted using the Michaelis–Menten enzymatic kinetics for the mixed culture biomass. The most stable system involves a bioreactor featuring dissolved oxygen gradients that range from 1.9 to 0.15 mg/L s, a specific organic load of 0.21 gBOD/g/d and a hydraulic retention time of 12 h. A built-in settling tank allows the consideration of the potential generation of large floccules of activated sludge in oxidation ditches (at least 300 μm) that increase the efficiency of simultaneous nitrification and denitrification. Thus, the obtained reaction rates can be used in calculations and simulations of the operation of oxidation ditches at low concentrations of dissolved oxygen.
1. Introduction
According to the UN, water scarcity affects more than 40 percent of the global population and this is projected to rise. Furthermore, over 1.7 billion people are currently living in river basins, where water use exceeds recharge. One of the most important reasons for this situation is that more than 80 percent of wastewater resulting from human activities is discharged into rivers or the sea without any removal of pollution [1]. This situation is especially critical for numerous small and remote settlements experiencing acute problems with infrastructure and specialized employees [2]. The only global solution to this problem is to develop economical and energy-efficient wastewater treatment technologies featuring reduced operating costs and requirements for the qualifications of the service staff. Since the operation of wastewater treatment plant (WWTP) sites requires a large amount of electricity, the goal of energy self-sufficiency could only be reached by combining optimization/improvement processes in different plant sections. The key sections in which plant co-owners should concentrate their efforts include the secondary biological treatment section, where aeration is performed, and the water pumping section [3]. It has been estimated that up to 60% of power consumed by WWTPs can be attributed to aerobic reactors for biological treatment [4]. Thus, a significant contribution to improving the efficiency of WWTPs is associated with the optimization of aeration in biological wastewater treatment reactors. Present-day wastewater treatment technologies are focused on attaining the maximum reduction in energy consumption for biological treatment. The literature includes studies on aerobic denitrification using anammox processes (for example, CANON and SNaD) [5], the implementation of the principles of simultaneous CFD-ASM modeling aimed at the maximum optimization of aeration systems and flow creation/generation/intensification/stimulation [1,6], studies on granular aerobic sludge systems [7], novel aeration modes [8], etc.
One promising energy-saving technology involves the use of oxidation ditches (ODs). The oxidation ditch, originally developed in the Netherlands, is a variation of an extended aeration process for biological wastewater treatment that has been most widely used in small towns, isolated communities and institutions [9]. A standard OD is a round, oval or horseshoe-shaped reactor with a single channel or multiple channels. It increases the internal recirculation (IR) of wastewater [10]. Oxidation ditches are characterized by a long solids retention time (SRT), which is important for nitrification and the removal of organics; the minimized effect of shock load or hydraulic surge; and the possibility of introducing energy-saving technologies [11]. The energy efficiency of biological processes in the OD primarily relates to the optimization of an aeration system. This applies either to the setting-up of equipment (combining fine-bubble aeration with submersible mixers) or the general oxygen regime in a structure [12]. In this case, the main opportunity to reduce the cost of aeration involves the use of low-oxygen processes such as simultaneous nitrification and denitrification (SND) [13].
The SND process is a phenomenon that is an alternative to creating macrozones with different oxygen regimes in a reactor. It has particular importance in circulation-type aeration facilities such as ODs, where zoning is hampered by the high horizontal flow velocity of the sludge mixture [14]. SND represents a set of biological nitrogen removal processes in which nitrification and denitrification occur concurrently in one aerated reactor, eliminating the need for a separate anoxic compartment [15]. Studies have suggested that, under the conditions of low organic loading and a long solids retention time (SRT), nitrification could be completed in activated sludge systems at dissolved oxygen (DO) levels as low as 0.5 mg/L [16].
The main mechanisms of SND, as it occurs in ODs, were outlined by American scientists B.E. Rittman and W.E. Langeland in 1985 [17]. The peculiarity of simultaneous nitrification and denitrification is that these two biochemical reactions occur simultaneously in the same reactor under the same conditions. This process is also sometimes referred to as “aerobic denitrification”. The physical explanation of this phenomenon is that SND occurs inside the floccules of activated sludge as a result of the distribution of dissolved oxygen concentration gradients, which depend on diffusion characteristics and oxygen channels in the floccule structure.
Several microbiological theories supplement the physical explanation of simultaneous nitrification and denitrification. For example, it has been suggested that some of the denitrifying microorganisms involved in simultaneous nitrification and denitrification are autotrophic [18]. This translates into a lesser need for an easily oxidized carbon source for effective denitrification, which is important when dealing with wastewater that has low carbon-to-nitrogen (C/N) ratios.
The efficiency of the SND process in oxidation ditches was considered in a study by a group of scientists led by Liu [19]. The operation of several types of ODs was studied under different technological conditions, and it was concluded that the optimal concentration of dissolved oxygen for an efficient SND process, as well as other biological wastewater treatment processes, can be determined based on the reaction temperature and specific load. The optimal concentration of dissolved oxygen decreases with increasing temperature or decreasing specific nitrogen load.
A study on simultaneous nitrification and denitrification in the classic ‘Pasveer oxidation ditch’ was conducted by an international research group that used a pilot-scale OD reactor [20]. The OD, with a capacity of 150 m3, was equipped with mechanical aerators. They generated heterogeneous dissolved oxygen along the length of the bioreactor, which had certain anoxic and aerobic zones. The study was also conducted under winter conditions at low ambient temperatures, with the temperature of the sludge mixture reaching 1 °C. In the course of the experiment, the nitrification efficiency exceeded 95% with the average concentration of dissolved oxygen equal to about 1 mg/L and the temperature above 4 °C. At lower temperatures, the phenomenon of nitrite accumulation (up to 6.7 mg/L) was observed due to incomplete nitrification. The denitrification efficiency was low due to the higher concentration of dissolved oxygen; the extent of removal of total nitrogen reached 45%. In general, the co-authors made recommendations for increasing the anoxic zones in the OD and, possibly, creating contact zones with an attached biofilm, which could intensify denitrification and raise resistance to filamentous swelling.
Subsequently, many studies have proven that the SND process in ODs can maintain high efficiency. M. Jayasvasti and C. Ratanatamskul demonstrated that cafeteria wastewater was efficiently treated in a reactor at low DO concentrations [21]. The results obtained by Zhang showed that SND occurs when the oxygen concentration is 0.3–0.8 mg/L. The nitrogen removal rate was up to 60% with an SRT of 45 d, C/N of 10, and an F/M ratio of 0.1 g COD/(g MLSS d) [22]. A study on the moving-bed sequencing batch reactor (MBSBR) proved the efficiency of the SND process at low concentrations of dissolved oxygen and high hydraulic retention time (HRT), which correspond to OD operation modes [13]. The total nitrogen (TN) removal efficiency reached 83% with an HRT and DO of about 10 h and 1.5 mg/L, respectively.
A series of studies was focused on the simultaneous removal of nitrogen and phosphorus using the SND process [23]. G.C. Zhu reported that the SND process was successfully coupled with denitrifying phosphorus removal (DPR), aimed at simultaneous carbon and nutrient removal from synthetic wastewater. The majority of nutrients were removed at the low DO stage, and the process performance was higher at further anoxic and aerobic stages. The coupled SND-DPR system maintains the quality of effluent water, with COD, TP, NH4-N and TN concentrations equal to 8, 0.54, 1.92 and 11.65 mg/L, respectively.
Some studies have considered the influence of the hydrodynamic regime of oxidation channels on biochemical processes. According to [24], the optimal impeller radius ratio of the OD process was established to ensure highly efficient wastewater treatment, which can encompass the SND process. H. Pang investigated the characteristics of the flow in a pilot-scale airlift OD and assessed their influence on the efficiency of the ongoing processes [25].
As seen from the above, the OD process, combined with SND, has already been known for decades and there are enough works on its performance and efficiency. However, scarce information has been provided on the enzymatic kinetics of the SND process in the OD for mixed-microorganism-population systems. It can be noted that studies on the enzymatic kinetics of the SND process in ODs have been conducted, but in most cases these have focused on specific conditions. For example, a recent study [26] described the enzymatic kinetics of simultaneous nitrification and aerobic denitrification by a cyanide-degrading bacterium under cyanide-laden conditions. In this case, the enzymatic kinetics of a pure culture of Acinetobacter courvalinii was considered. Since the enzymatic kinetic dependences were established for an axenic culture of microorganisms under cyanide-laden conditions, they should not be used to describe the process of SND in ODs. A similar study was focused on the kinetic modeling of the pure heterotrophic nitrifying-aerobic denitrifier strain Paracoccus denitrificans ISTOD1 [27]. These studies are very important for the development of methods for the bioaugmentation of activated sludge. However, under real-life conditions, wastewater treatment is generally focused on mixed microorganisms. A fundamental study on the enzymatic kinetics of the SND process was conducted by Münch [28]. This work was focused on the technological schemes involving sequencing batch reactors (SBRs). That study examined the relationship between the rate of nitrification and the DO concentration rate. The Monod equation was used to describe the relationship, which strongly depended on the size of activated sludge floccules. According to [29], the floc size and horizontal flow velocities of the sludge mixture significantly affect the mass transfer of oxygen in the activated sludge floccule, and hence the kinetics of the processes. Another study addressed the expression of kinetic constants of the SND process in a membrane bioreactor (MBR) treating black water [30]. The obtained values of kinetic coefficients are relevant only for the selected operating mode of the MBR. Additional research is needed to assess the enzymatic kinetics of the SND process in ODs under specific conditions of higher internal recirculation and horizontal flow velocities. The study conducted by Mantziaras aimed at obtaining the constants and rates of reactions in ODs for the activated sludge model (ASM-1) [31]. In this case, the low-oxygen operating mode of the OD, which is necessary for an efficient SND process, was not considered.
Hence, the objectives of this study were to use enzyme kinetics to describe the SND process under low-oxygen OD conditions. The results of the preliminary work were reported [32,33]. The enzyme kinetics of the mixed microorganism population system is supposed to be expressed using the Michaelis–Menten equations. Since kinetics depends on the state of activated sludge, it is additionally necessary to determine the characteristics of biomass for various operating modes of the OD.
2. Materials and Methods
2.1. Chemicals
The study entails the use of VWR International LTD reagents, including ammonium chloride (NH4Cl, AnalaR NORMAPUR, 99%), potassium dihydrogen phosphate (KH2PO4, AnalaR NORMAPUR, 99.5%), sodium acetate (NaCH3COO, AnalaR NORMAPUR, 99%), peptone from meat (enzymatic digest) and ethanol (CH3CH2OH, absolute TechniSolv, 99.5%, pure).
Reagents were used in accordance with the pre-set methods to perform the chemical analyses and PCR tests. All these chemicals represented analytical-grade reagents, which were commercially available and used without further purification.
2.2. Wastewater Characteristics
Lab-scale reactors were used in the study, and the influents under study included synthetic and real wastewater. Synthetic wastewater was composed of 1.8 ± 0.75 g/L peptone, 0.05 ± 0.02 g/L NH4Cl, 0.08 ± 0.03 g/L NaCH3COO and 0.02 ± 0.008 g/L KH2PO4. If necessary, the proportion of biodegradable organics in the influent was regulated by adding ethanol (1.0 ± 0.5 mL/L). Throughout the study, concentrations of the influent changed in accordance with the experimental program; they varied within the range presented in Table 1.
Real wastewater was used at the 3rd stage of the experiment, conducted to control the research results. Feed wastewater was taken from the domestic wastewater treatment plant (having the capacity of 4000 m3/d) located in Putilkovo, in the Moscow region. Real wastewater concentrations are presented in Table 2.
Since this study assumes the operation of the WWTP without the stage of primary settling, unclarified wastewater was used as the influent. The concentrations of synthetic wastewater corresponded to those of real wastewater.
2.3. Analytical Methods and Calculations
The chemical analyses included the study of the chemical oxygen demand (COD, Hach Lange method LCI 400), ammonium (NH4-N, Hach Lange method 10,023), phosphate (PO4-P, Hach Lange method 10,127), nitrate (NO3-N, Hach Lange method 2,106,169) and nitrite (NO2-N, Hach Lange method 2,107,169). A DR5000 spectrophotometer (Hach Lange, Berlin, Germany) and a CR 4200 thermoreactor (WTW, Weilheim, Germany) were used to conduct the above chemical analyses. Samples, designated for the identification of soluble components, were immediately filtered using 0.45 μm filter paper, and cooled to prevent any further reaction after sampling. A SevenGo Duo (Mettler Toledo, Hightstown, NJ, USA) pH meter was used to measure the pH value. The biochemical oxygen demand (BOD5) values were measured using the respirometry method and an OxiTop Control 12 (WTW, Weilheim, Germany) unit. Total suspended solids (TSS) and mixed liquor suspended solids (MLSS) were measured according to standard methods [34].
ProfiLine Oxi 3310 with CellOx 325 (WTW, Weilheim, Germany) was used to identify the concentration of dissolved oxygen in the system and the temperature of the sludge mixture. The DO distribution was not absolutely uniform in a channel or even in the same oxygen zone or cross-section; the oxygen concentration in each OD or OD zone represented the average of the measurements of four different cross-sections and two points of measurement located at two different heights of each cross-section along the ditch.
The objective of the study was to identify the stable OD and SND operation modes and specify the reaction rates for these regimes. The reaction rates, depending on the wastewater treatment requirements, were calculated using the Michaelis–Menten equations of enzyme kinetics.
Below is the general case of the Michaelis–Menten equation:
where [S] is the concentration of substrate S; Vmax represents the maximum rate achieved by the system in the process of saturating the substrate concentration for a given enzyme concentration; the value of the Michaelis constant KM is numerically equal to the substrate concentration at which the reaction rate reaches one half of Vmax.
The values of KM and Vmax are calculated by transforming Equation (1) in an algebraic way using double reciprocals and the Lineweaver–Burk plot:
hence, the Lineweaver–Burk plot has 1/[S] on the x-axis and 1/V on the y-axis.
Equation (1) is used to construct the dependences of the nitrification rate on the concentration of NH4-N and the rate of organic matter removal on the concentration of BOD. When describing the reaction rates for processing a sample of analysis results, the coefficient of determination was set to at least 0.75.
To control the biological activity of biomass, batch activity tests were regularly conducted. They were aimed at determining the rate of nitrification, denitrification and aerobic oxidation of organic substances by activated sludge outside the experimental reactors (ex situ batch activity tests NIT.CHE, DEN.CHE.1 and DEN.CHE.2 [35]). Activated sludge samples were extracted from the return-activated sludge systems that the reactors encompass in accordance with their design.
The overall nitrogen removal performance via SND in oxidation ditches was estimated by means of SND efficiency (ENSND, %) and SND rate (RNSND, mg/L/h) at low DO concentrations [36]. ENSND and RNSND were calculated according to equations as below:
where is the sum of NH4-N, NO2-N and NO3-N in effluent and is the amount of NH4-N in influent.
A series of tests involving activated sludge was conducted to study the occurrence and maintenance of a stable SND process. All samples were extracted from the reaction spaces of bioreactors, as well as the full-scale benchmark WWTP operating according to the single-sludge denitrification-nitrification technological scheme.
Sedimentation characteristics were used to control the stability of activated sludge. The sludge volume index (SVI) was defined as the volume (in mL) occupied by 1 g of activated sludge after 30 min settling in a 1 L unstirred cylinder. SVI was calculated using Equation:
where is the volume occupied by the sludge from the graduated cylinder, mL, and is the concentration of activated sludge measured using a TSS test, g/L.
Sedimentation curves were used to determine the biomass-hindered settling velocity under conditions of the mutual influence of sludge floccules. According to the method described in [35], to measure a batch settling curve, a reservoir is filled with a sludge sample and a timer is started to keep track of the experiment’s duration. The sludge is allowed to settle and the position of the suspension–liquid interface is measured at different time intervals. The recording of the height of the suspension–liquid interface at several time intervals results in a curve with the evolution of the sludge blanket height over time. Typically, four different phases can be observed in a batch settling curve. Each phase marks a change in the settling behavior at the suspension–liquid interface: the log phase, the zone settling phase, the transition phase and the compression phase. The zone settling phase (or the hindered settling phase) is characterized by a distinct linear decline in the batch curve. At moderate sludge concentrations, sludge will initially settle according to the hindered settling phase. Thus, the slope of the linear part of a batch settling curve corresponds to the hindered settling velocity (Vhs). Vhs is computed by determining the steepest slope between three consecutive data points. Mathematically, the relation between the sludge concentration and Vhs can be described by means of an exponential decaying function:
where is the maximum settling velocity and rv is the model parameter, and a represents the activated sludge concentration (MLSS).
V0 and rv parameters can be estimated using the experimental data to minimize the sum of squared errors (SSE):
where N is the number of data points, is the measured hindered settling velocity at concentration i, and is the corresponding prediction by the function of Vesilind [37] for a particular parameter set [V0; rv].
An Analysette 22 laser particle sizer (FRITSCH), capable of measuring particles in the range of 0.5–1500 μm, was used to perform the static light scattering (laser diffraction) needed to measure the floc sizes. This method complies with International Standard ISO 13,320 (Particle size analysis–laser diffraction methods), which is a guideline that defines the minimum standards for laser particle sizers in terms of repeatability, reproducibility and measurement precision and thus regulates the verification of measurement results. The average size of sludge flocs was provided as the mean based on the equivalent volume diameter. Three measurements were taken per sample. During sample preparation, the selection of the mode of ultrasonic dispersion of individual floccules of activated sludge was carried out without destroying their own structure. A solid-state laser (15 mW; λ = 635 nm) was used as a laser. The experiments were carried out at a temperature of 20 °C. The diffusion coefficient was in the range from 10–6 to 10–9 cm2/s.
Optical (Olympus BX53M upright microscope, Olympus, Shinjuku, Japan) and electron microscopy (FEI Quanta 250 FEG scanning electron microscope (SEM), FEI Co., Hillsboro, OR, USA) methods were employed to perform the hydrobiological analysis of activated sludge within the framework of the study. The wet mount method was used without the preliminary sample preparation in order to perform the optical microscopy analysis. The SEM analysis was performed following sample centrifugation in the Frontier FC5515 230V centrifuge (1000 rpm, 5 min). The purpose of the analysis was to identify the number and the state of the main indicator microorganisms of activated sludge.
Additionally, the flocculation potential of activated sludge was determined at various technological parameters of the system operation (dispersed suspended solids or flocculated suspended solids of the supernatant—the DSS/FSS test) using a Stuart SW6 laboratory flocculator. The test consisted of identifying dispersed suspended solids in the supernatant 30 min after settling, identifying flocculated suspended solids in the supernatant 30 min after the pretreatment in a flocculator (30 min and 50 Hz) and finding the concentration of suspended solids in the purified wastewater after secondary settling.
2.4. Microbiological Analysis
The real-time PCR method (quantitative PCR) was used to assess the potential ability of the microbial community of activated sludge to conduct the processes of nitrification and denitrification. This method was employed to measure the number of genes encoding key enzymes of the nitrogen cycle: amoA encodes enzyme ammonium monooxygenase, which performs the first stage of ammonia oxidation. nirK and nirS encode two different nitrite reductases. Moreover, the number of ribosomal genes of bacteria and archaea was estimated to characterize the microbial communities of activated sludge samples.
The study was focused on the samples of activated sludge extracted at different research stages, provided that the technological parameters of experimental reactors also varied. In addition, samples of activated sludge were extracted from the existing treatment facilities operating according to the technological scheme of single-sludge denitrification.
In the study, conducted using the quantitative PCR (real-time PCR) method, the number of copies of ribosomal genes of bacteria and archaea in the samples and the number of copies of functional genes associated with nitrification (amoA) and denitrification (nirK, nirS) were estimated. 16S ribosomal RNA genes of bacteria and archaea were evaluated in the iCycler amplifier (Biorad). The mixture was prepared from buffers for a quantitative PCR (×2 BioMaster HS-qPCR SYBR Blue, Biolabmix, Russian Federation); 1 μL of the DNA template (extracted according to the protocol described above, DNA) and 0.5 μM of primers were added. We used primers Eub338 and Eub518 [38] for 16S rRNA archaea and 15f and 1059r to amplify conserved regions of bacterial DNA (16S rRNA).
Solutions containing a known concentration of 16S rRNA genes from Escherichia coli (for bacteria) and the FG-07 Halobacterium salinarum strain (for archaea), were used as standards for testing the PCR efficiency and determining the number of genes.
The number of functional genes, associated with two processes of the nitrogen cycle, was also estimated. The reaction mixture was prepared in the same way; the primer concentration was 0.8 μM. To amplify the genes associated with the nitrification process, we used the primers amoA-1F and amoA-2R for bacterial amoA [39] and Arch-amoAF, and Arch-amoAR for archaeal amoA. The amplification product of DNA, isolated from soil, was used as the standard for bacterial amoA. The PCR product was purified and its concentration was assessed using a Qubit fluorometer 2. No standards were used for archaeal amoA, so its determination was qualitative rather than quantitative. The following primers were chosen: nirK876 and nirK1040 for nirK and cd3af and R3cd for nirS [40,41] for the amplification and estimation of the number of genes associated with the denitrification process. These genes encode different enzymes that perform denitrification. DNA amplification products, isolated from the cultures of Sinorhizobium meliloti (for nirK) and Pseudomonas sp. (for nirS), were taken as the standards.
The nucleotide sequences of the primers are presented at Table 3.
The isolation of total DNA from each sample was carried out in duplicate for the subsequent independent analysis. DNA was isolated using the MPBio FastDNA Spin Kit for Soil (MP Biomedicals, California, USA) according to the developed protocol. Vortexing was performed as well. Homogenization was performed in a Precellys 24 homogenizer (Bertin Technologies, Paris, France).
2.5. Experimental Procedure
2.5.1. Experimental Set-Up at Stage 1
At the first stage of the experiment, a lab-scale OD reactor with a vertical flow was constructed. The reactor was made of acrylic tubes, having a diameter of 100 mm. Its effective volume was 20 L. The design of the reactor ensured perfect mixing across the entire width of the corridor, free from any influence of gravity. The OD was connected to the cone-shaped settling tank, with a volume of 4.5 L. Synthetic wastewater was fed into the OD by means of a Tekna AKS604 solenoid dosing pump (SEKO S.p.A) at the rate of 2.5–4.2 L/h.
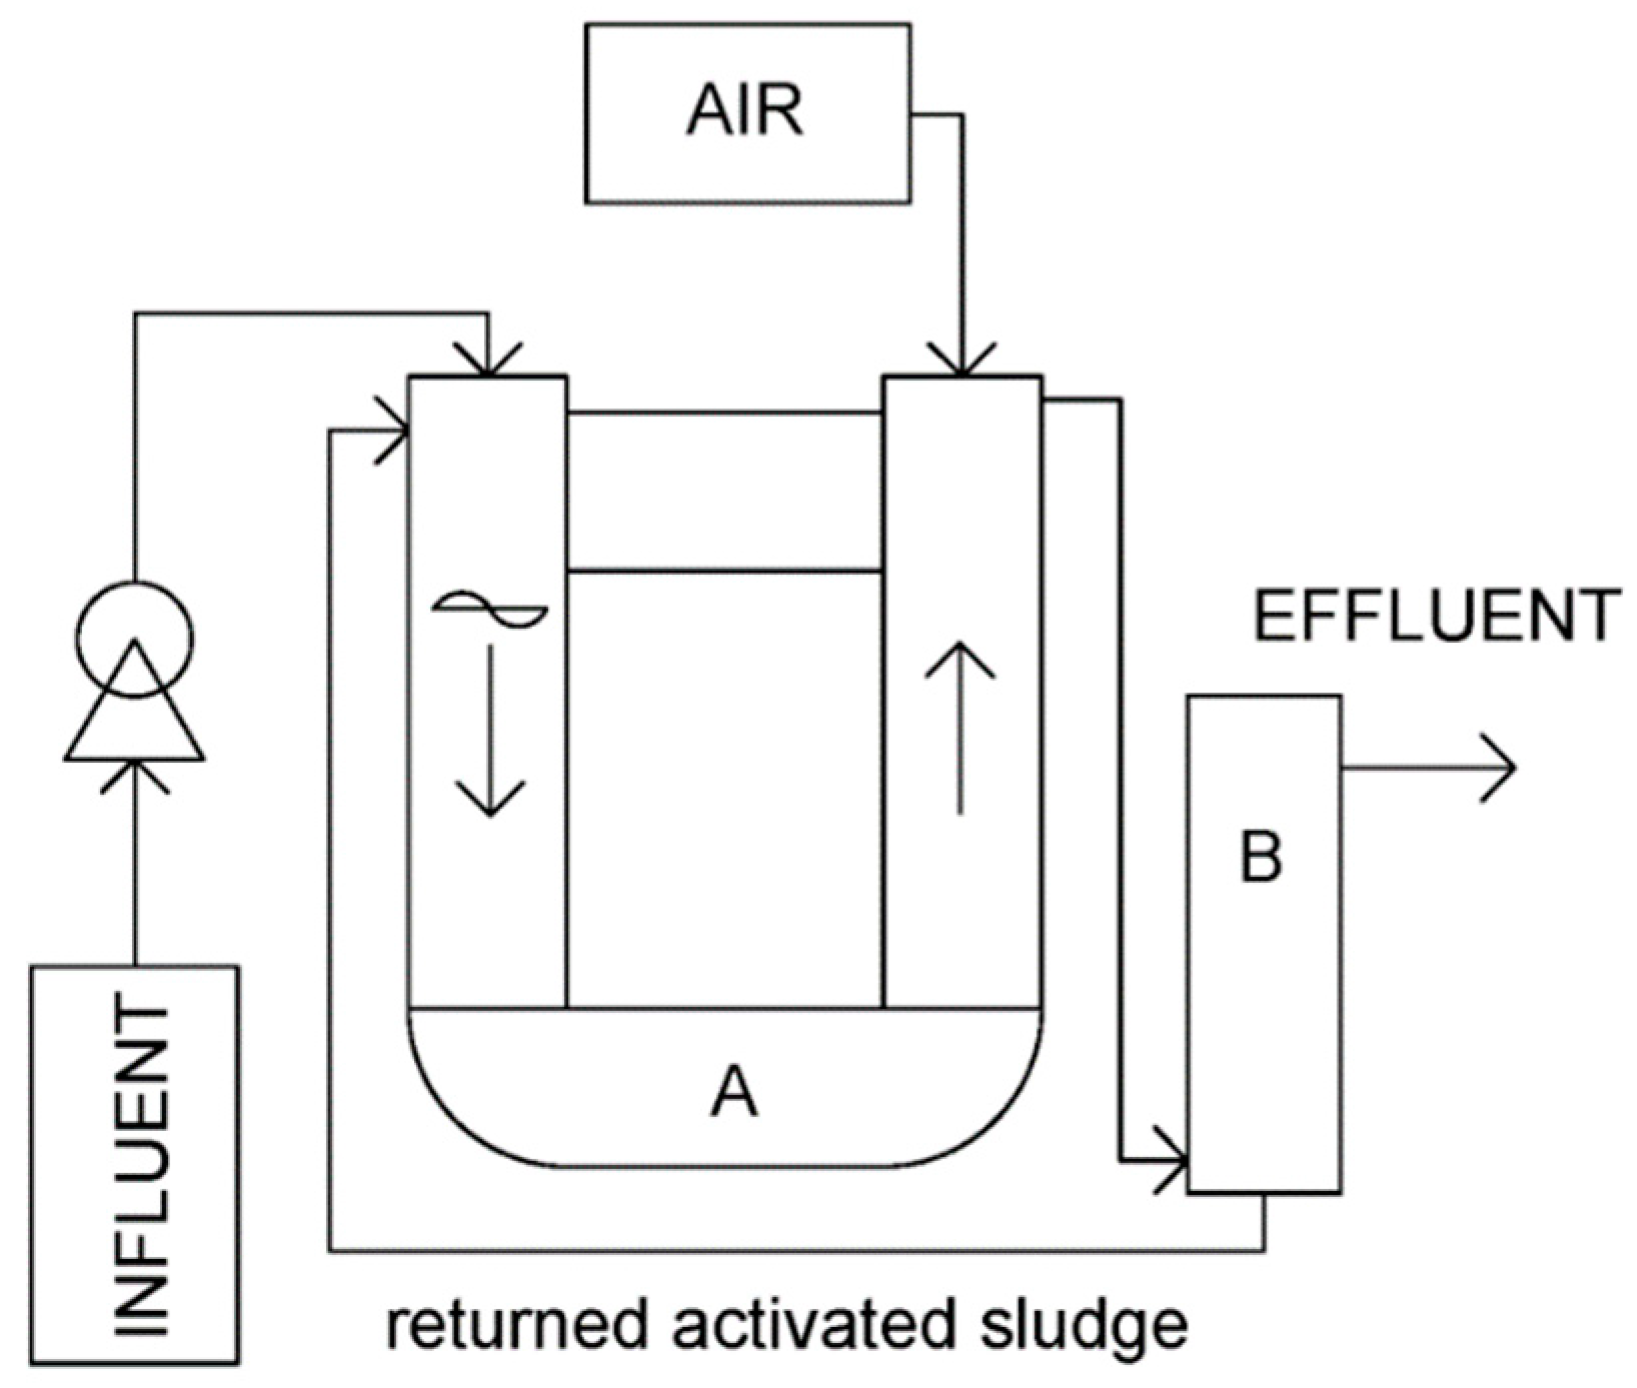
The task of this stage was to establish the relationship between the flow velocity of the sludge mixture, the efficiency of organic matter removal and nitrification, as well as to obtain information on the stability of the system under various oxygen conditions. The first stage consisted of two substages. The total duration of stage 1.1 of the experiment was 25 days. A schematic diagram is shown in Figure 1.
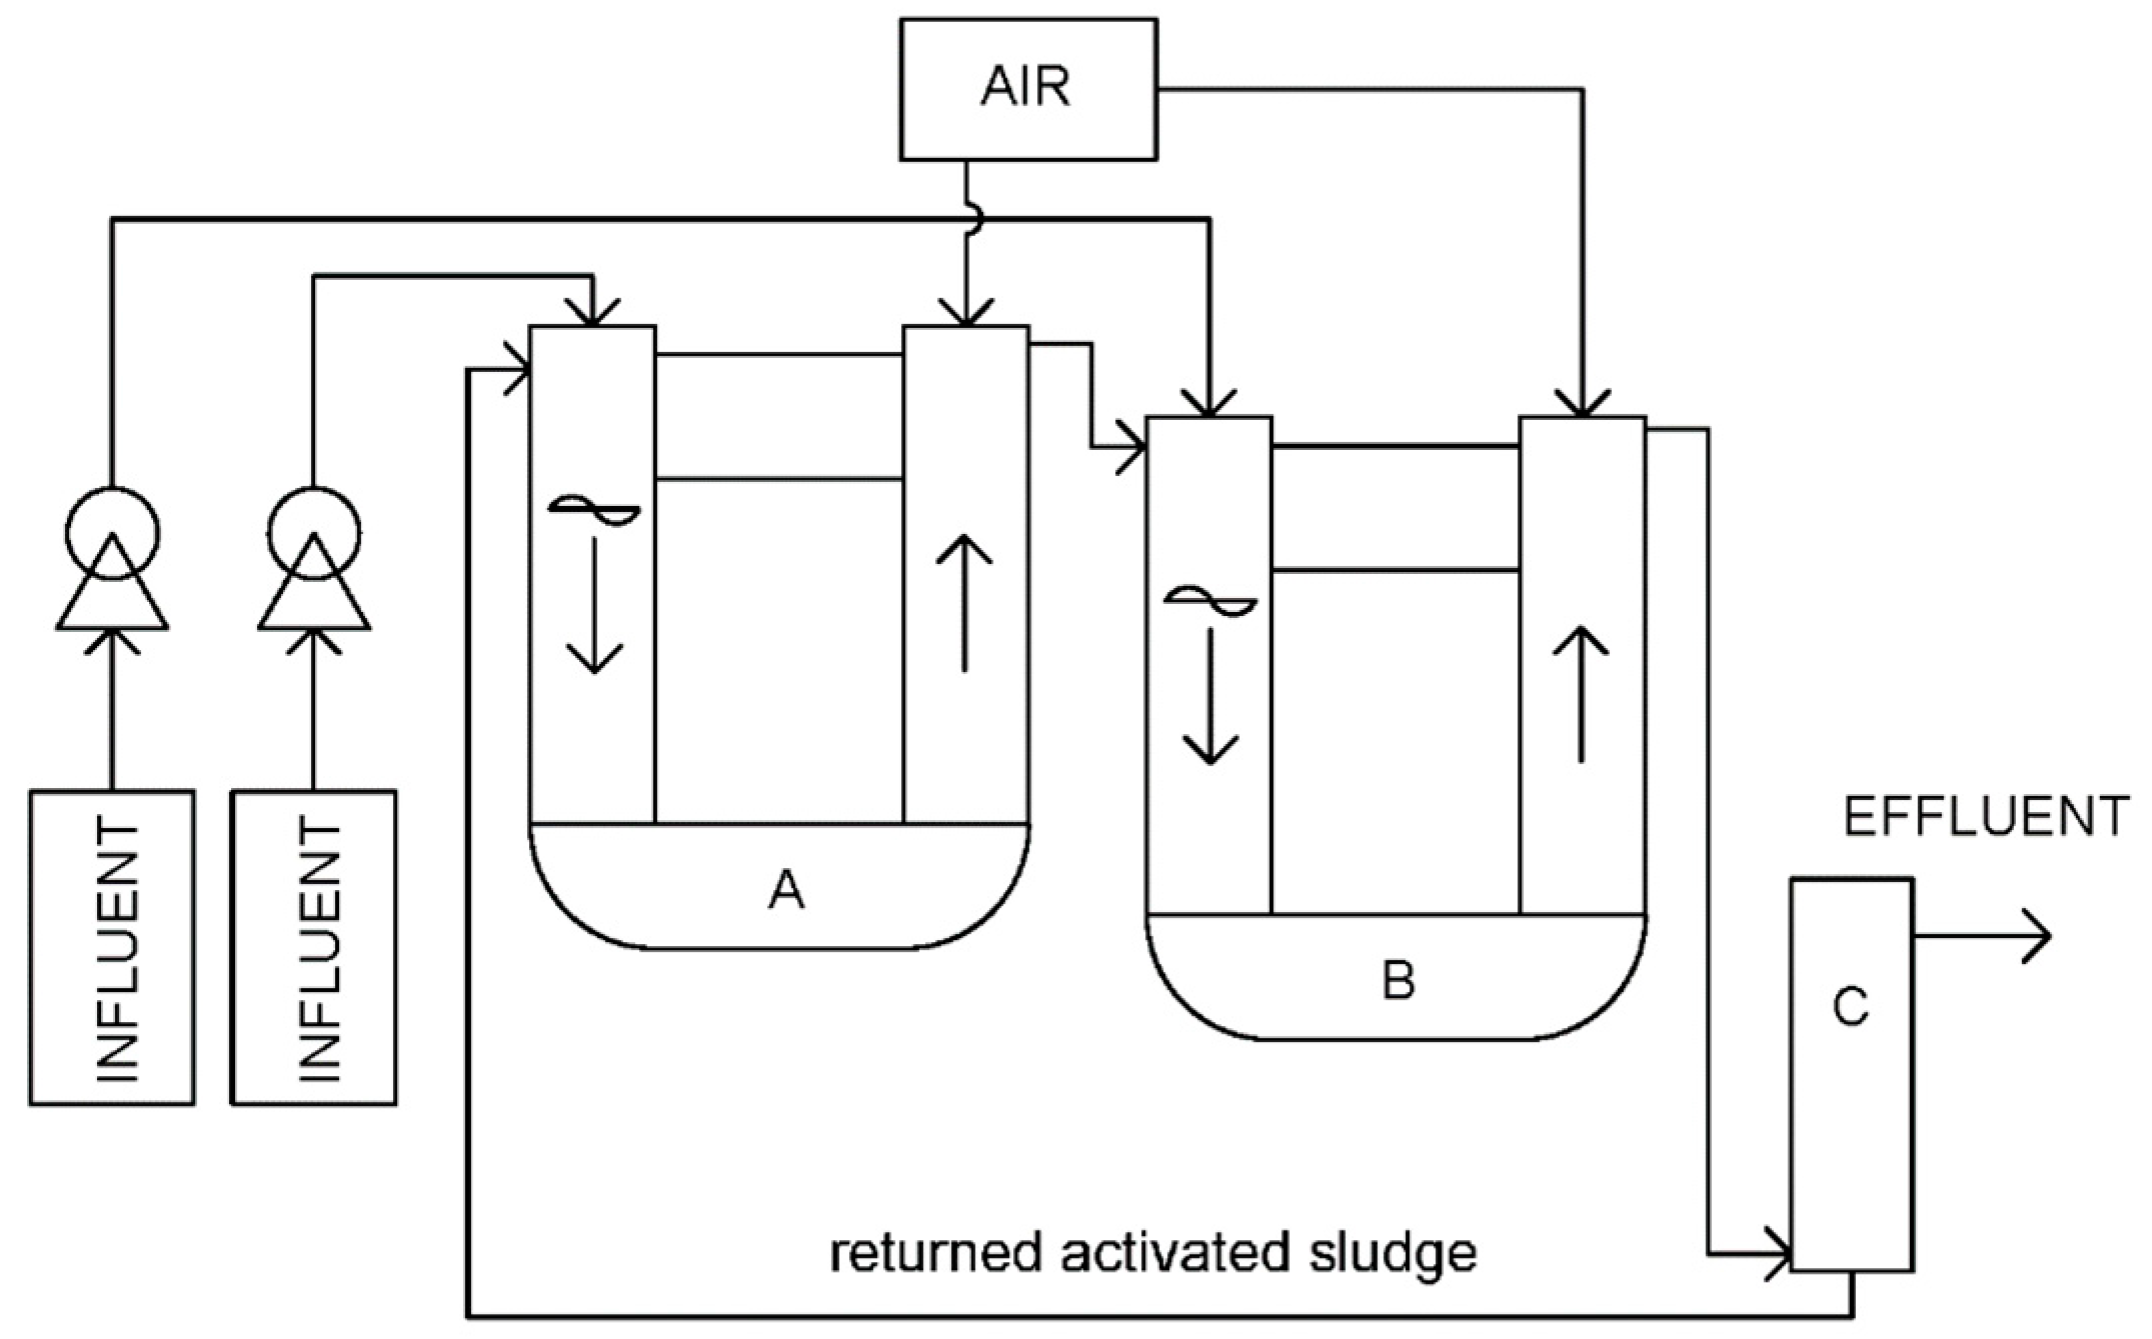
In stage 1.2 of the experiment, the second module was installed in the reactor. It allowed us to consider individual oxygen zones under the conditions of ideal mixing in each zone and at high flow velocities. The active volume of the second module was 17 L. The influent flow rate varied from 4.2 to 7.5 L/h. The reactor had one settling tank with a maximum active volume of 8 L. Synthetic wastewater was fed into the OD by means of two solenoid dosing pumps in fractional mode (50%/50%). A schematic diagram of the reactor is shown in Figure 2.
The duration of stage 1.2 of the experiment was six months. The aim of this stage was to assess the stability of the biomass and the efficiency of synthetic wastewater treatment under various oxygen conditions. In total, 4 oxygen modes were considered.
2.5.2. Experimental Set-Up at Stage 2
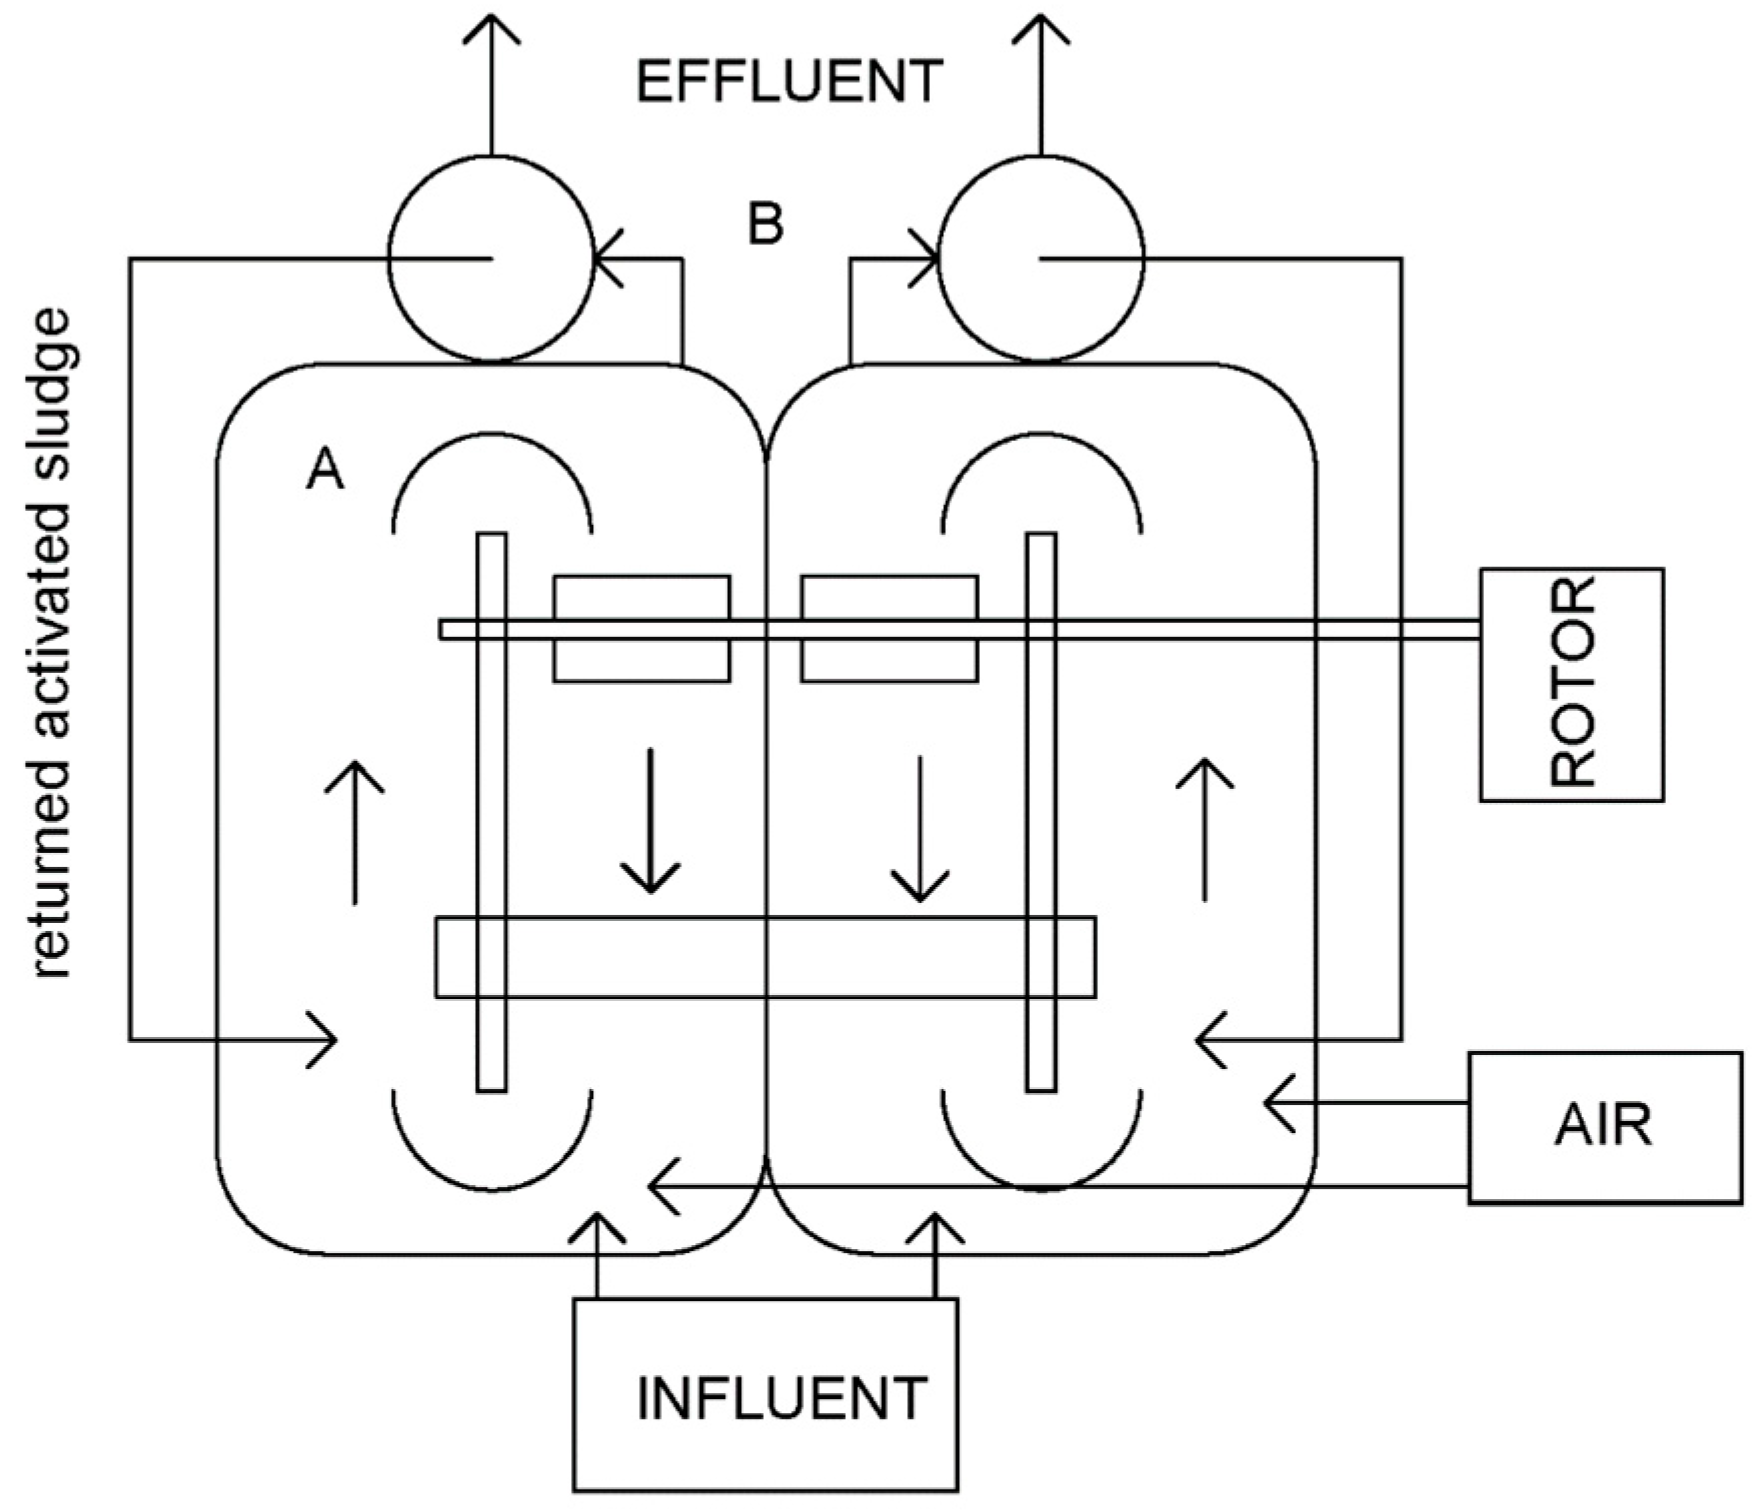
The second stage of the study was carried out in the reactor that had surface aerators combined with a pneumatic aeration system. The reactor consisted of two parallel ODs and settling tanks. The active volume of each OD was 42 L. The maximum volume of each settling tank was 8 L. Synthetic wastewater was fed into the reactor by means of two solenoid dosing pumps at the rate of 3.5–6.46 L/h for each OD.
The aim of this stage was to establish the relationship between the flow velocity of the sludge mixture, BOD specific loads, HRT, DO and the efficiency of organic matter removal/nitrogen removal. The reactor accommodated the directed horizontal flow of the sludge mixture. At this stage, the research had 4 substages and took 8 months. A schematic diagram of the reactor is shown in Figure 3.
2.5.3. Experimental Set-Up at Stage 3
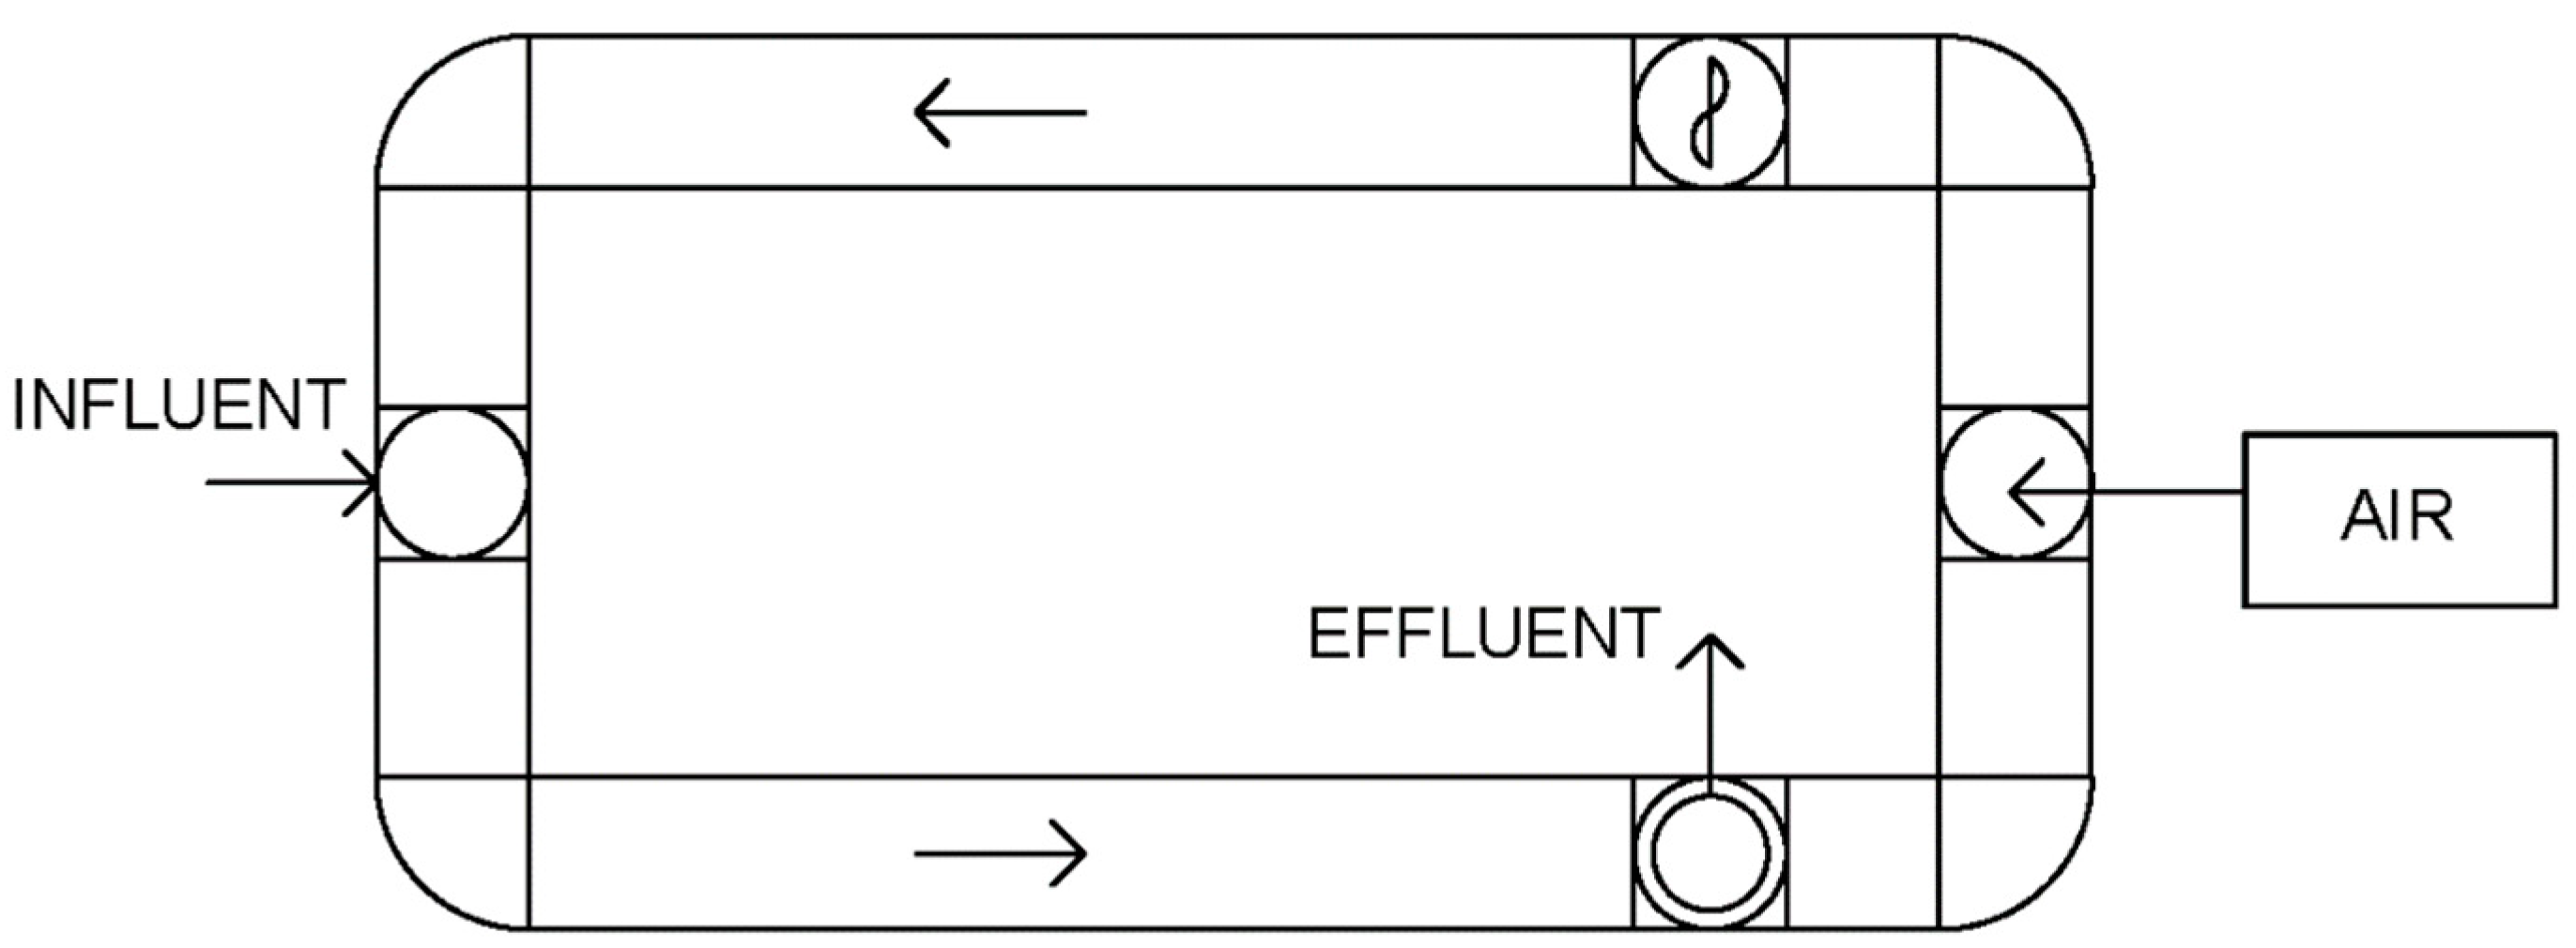
At this stage, the experiment was carried out in the reactor that had longer corridors, which was used to create a concentration gradient of dissolved oxygen along the length of the reactor in addition to SND. The total reactor volume was 144 L. The OD had an integrated secondary settling tank with an up-flow suspended bed to reduce the mechanical effect on activated sludge floccules. Real wastewater was fed into the reactor by means of two solenoid dosing pumps at the rate of 3.5–6.46 L/h.
Given the length of the OD corridors, a dissolved oxygen gradient was created in the direction of the sludge mixture’s motion, which ensured the formation of discernible anoxic and aerobic zones inside the reactor. The first oxygen zone was located at the point of air supply to the set-up. The second oxygen zone was located at the point of the treated wastewater outlet (the built-in secondary clarifier). The distribution of dissolved oxygen over the zones was carried out by adjusting the intensity of pneumatic aeration and horizontal flow velocity. The horizontal flow velocity and the flow rate also influenced IR. The total duration of stage 3 was 2 months.
A schematic diagram of the reactor at stage 3 is shown in Figure 4.
2.5.4. Operational Parameters of the Lab-Scale Reactors
The operational parameters of each stage of the study are shown in Table 4.
3. Results and Discussion
3.1. Activated Sludge: Charactreristics and Stability
In stage 1.1, the reactor was launched in the aerobic regime at the dissolved oxygen concentration of 6–7 mg/L throughout the entire volume of the bioreactor (stage 1.1.1). The first aim of this stage was to adapt the seeding of activated sludge to the experimental conditions and synthetic wastewater and make sure that the reactor was in the stable operating mode. On the 10th day after the launch of the experiment, the concentration of DO went down to 1.7 ± 0.25 mg/L (stage 1.1.2). Despite the growth in SVI, filamentous sludge bulking was not detected. Figure 5 shows the distribution of the sludge index over the system in stage 1.1.
In stage 1.1.1, activated sludge retained the characteristics of the nitrifying biomass taken from the full-size WWTP for seeding purposes. Given the average MLSS of 2.235 g/L, SVI values were 89–125 mL/g, VHS(a) = 10.675∙e−0.452a. The DSS/FSS test demonstrated values of 1.5/1.3 mg/L, which indicate the high flocculation capacity of activated sludge at this stage [35].
In stage 1.1.2, the average MLSS value was equal to 3.012 g/L, whereas SVI reached about 121–168 mL/g and VHS(a) = 8.201∙e−0.446a. A rapid reduction in the concentration of DO had a stressful effect on activated sludge, necessitating its adaptation. A similar mechanism has been described previously [44]. This can be used to launch and adapt low-oxygen biological treatment systems and nurture a suitable structure of activated sludge floccules. In general, the supernatant remained clear, and the DSS/FSS test showed values of 4.2/3.9 mg/L. On day 25, the reactor entered a stable operating mode.
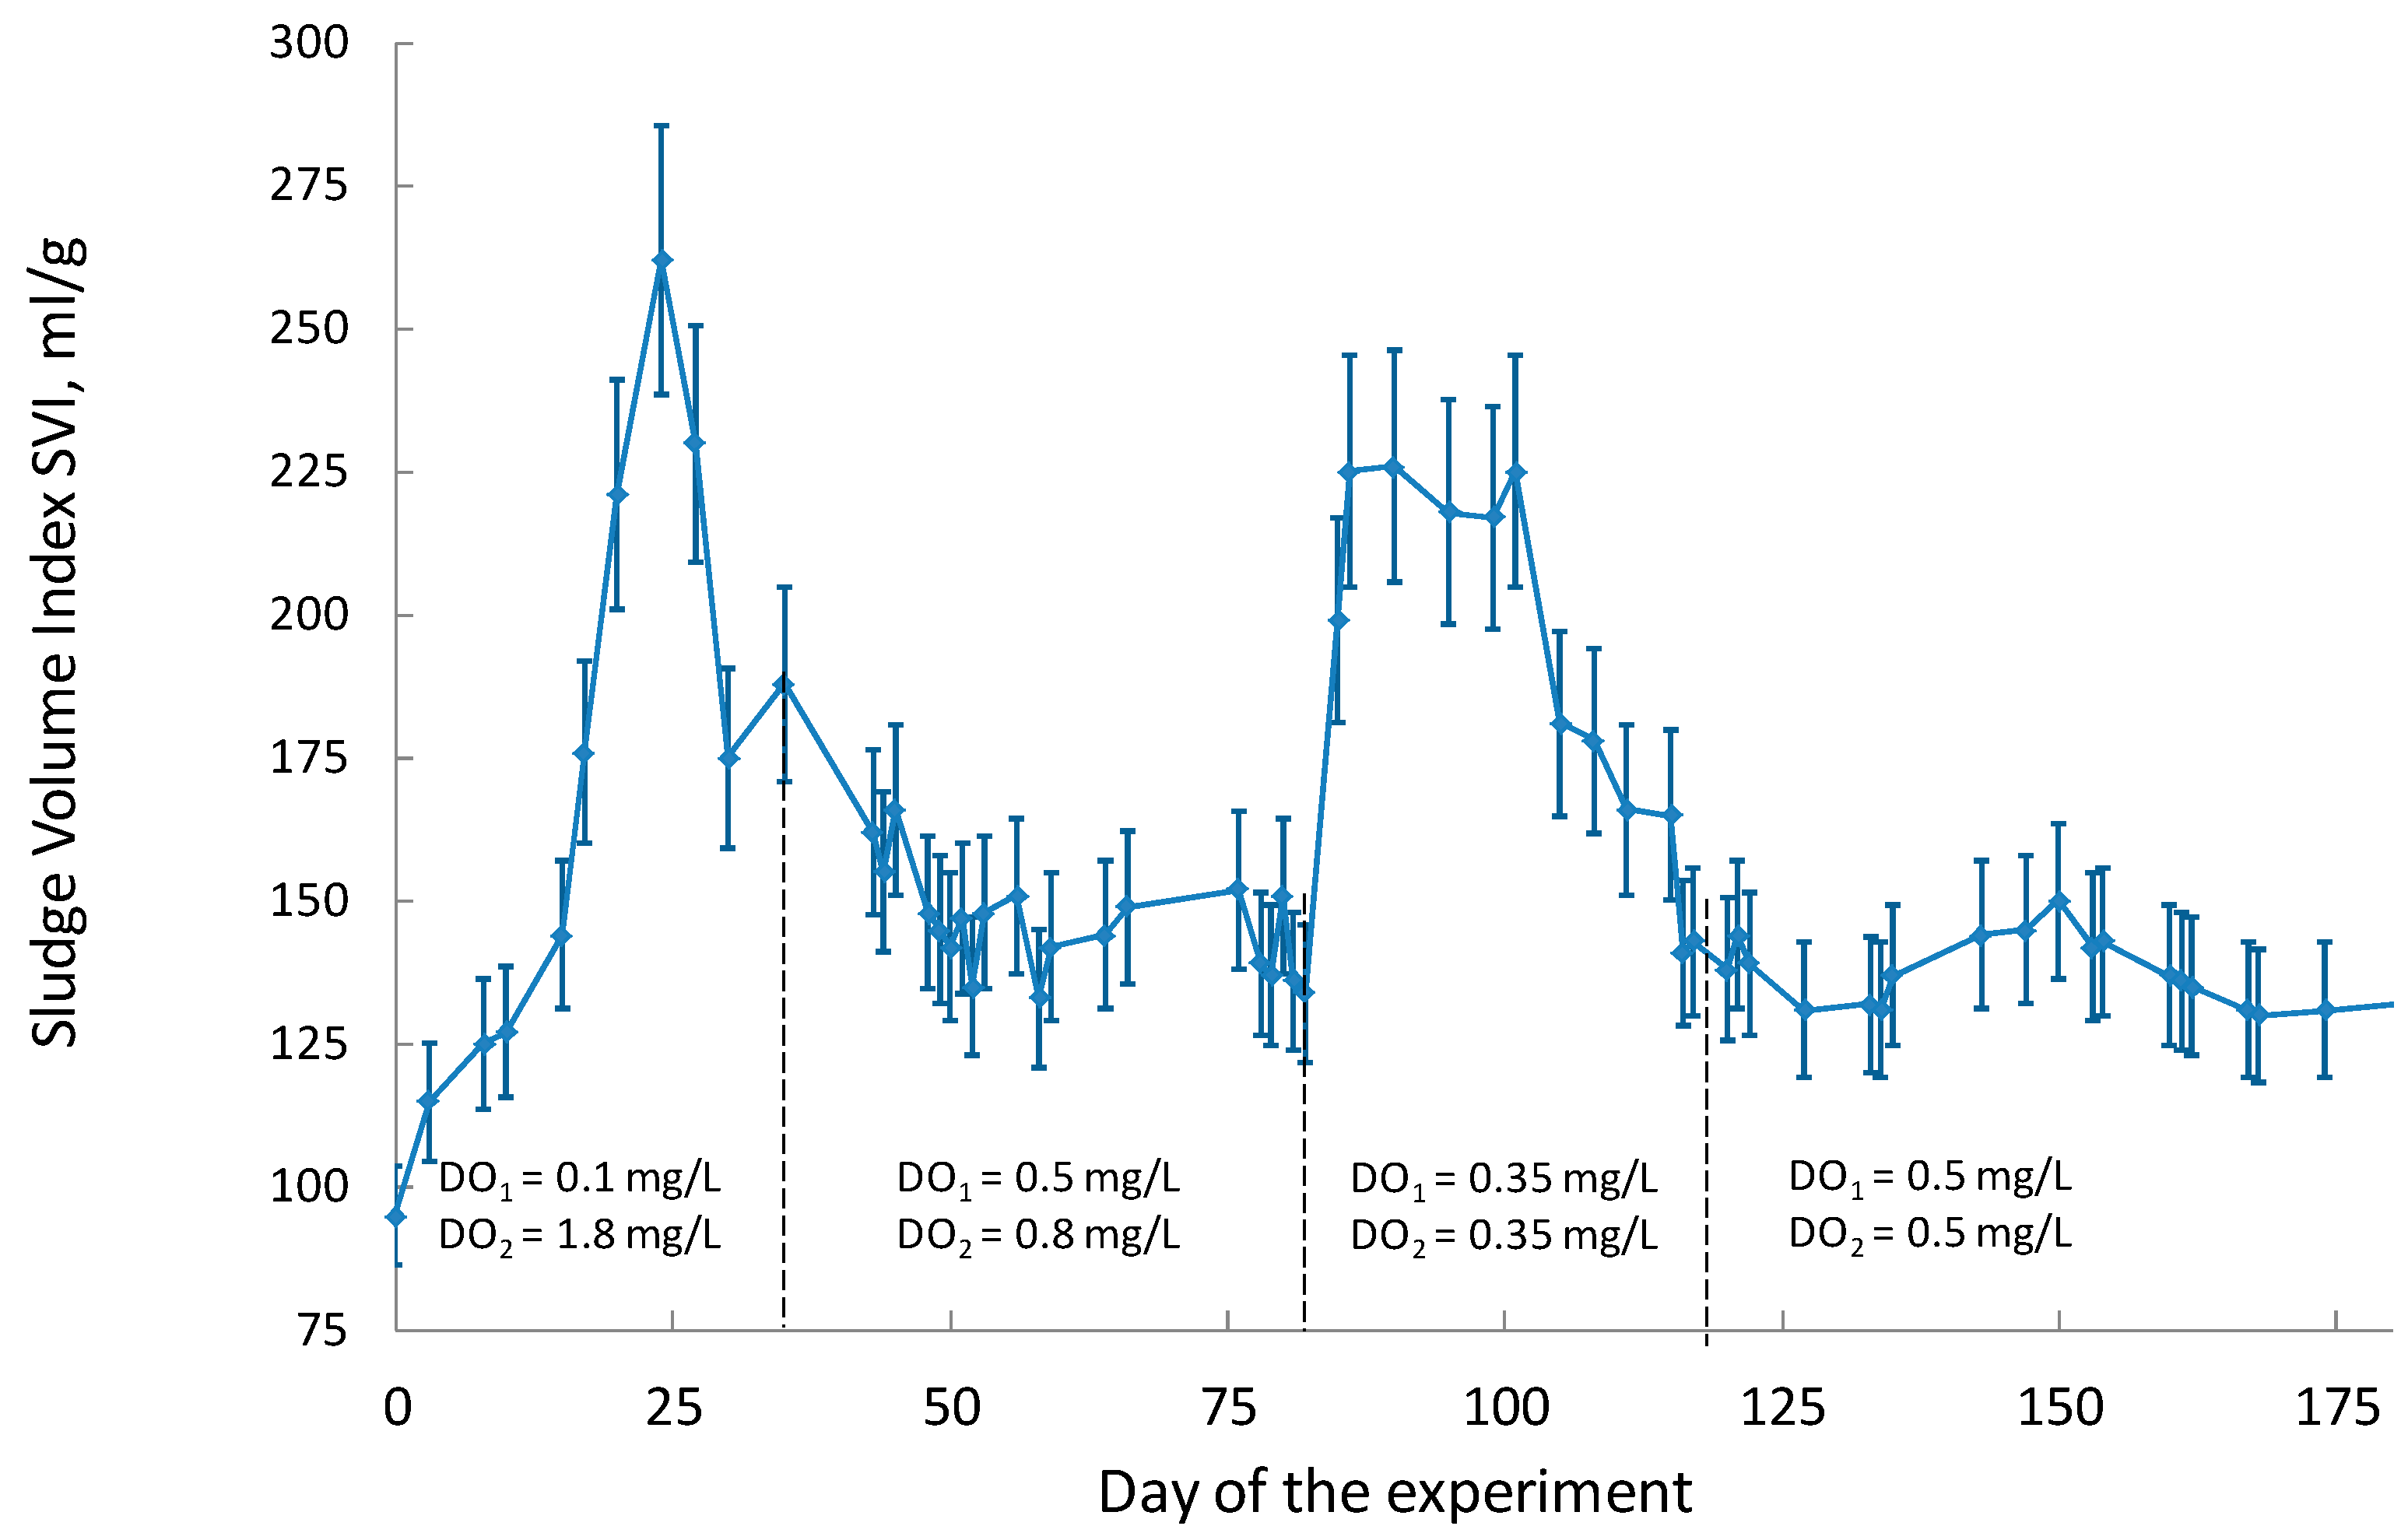
SVI returned to normal values on the way to stage 1.2. The SVI values in stage 1.2 are presented in Figure 6.
In stages 1.2.1 and 1.2.3, filamentous sludge bulking occurred. The average MLSS values reached 0.955 g/L and 0.857 g/L at SVI = 115–262 mL/g and 165–226 mL/g, respectively. DSS/FSS tests showed values equal to 18.8/15.6 mg/L and 19.5–19.1 mg/L, which indicate poor biological flocculation.
The hydrobiological analysis showed that the Sphaerotilus natans genus was predominant among filamentous forms of microorganisms. According to [45,46], the main reason may be a decrease in the concentration of dissolved oxygen with an increase in BOD-specific loads or a significant decrease in the specific organic load [11]. A higher horizontal flow rate mitigated the effect of oxygen deficiency on the efficiency of activated sludge; however, cases of sludge bulking made the system unstable. The oxidation rate was not high enough to oxidize the entire mass of organic substances adsorbed by biomass. In these stages, BOD-specific loads were about 0.45 gBOD/g/d. Since the earlier studies had also reported a stability loss in low-oxygen systems featuring SND at specific loads above 0.35 g BOD/g/d [47] and dissolved oxygen concentrations below 1.0 mg/L [48], this statement turned out to be true. A stable SND process in an OD requires an appropriate control of the BOD.
In stages 1.2.2 and 1.2.4, SVI was in the optimal range (MLSS = 1.544 g/L and 1.362 g/L, SVI = 133–166 mL/g and 130–150 mL/g). The activated sludge system showed stability. In both stages, activated sludge showed high biological flocculation capacity, and the DSS/FSS values were equal to 3.3/2.9 mg/L and 3.9/3.1 mg/L. Sedimentation characteristics were considered for stable activated sludge. For stage 1.2.2, VHS (a) = 6.308∙e−0.399a and for stage 1.2.4, VHS (a) = 8.651∙e−0.433a.
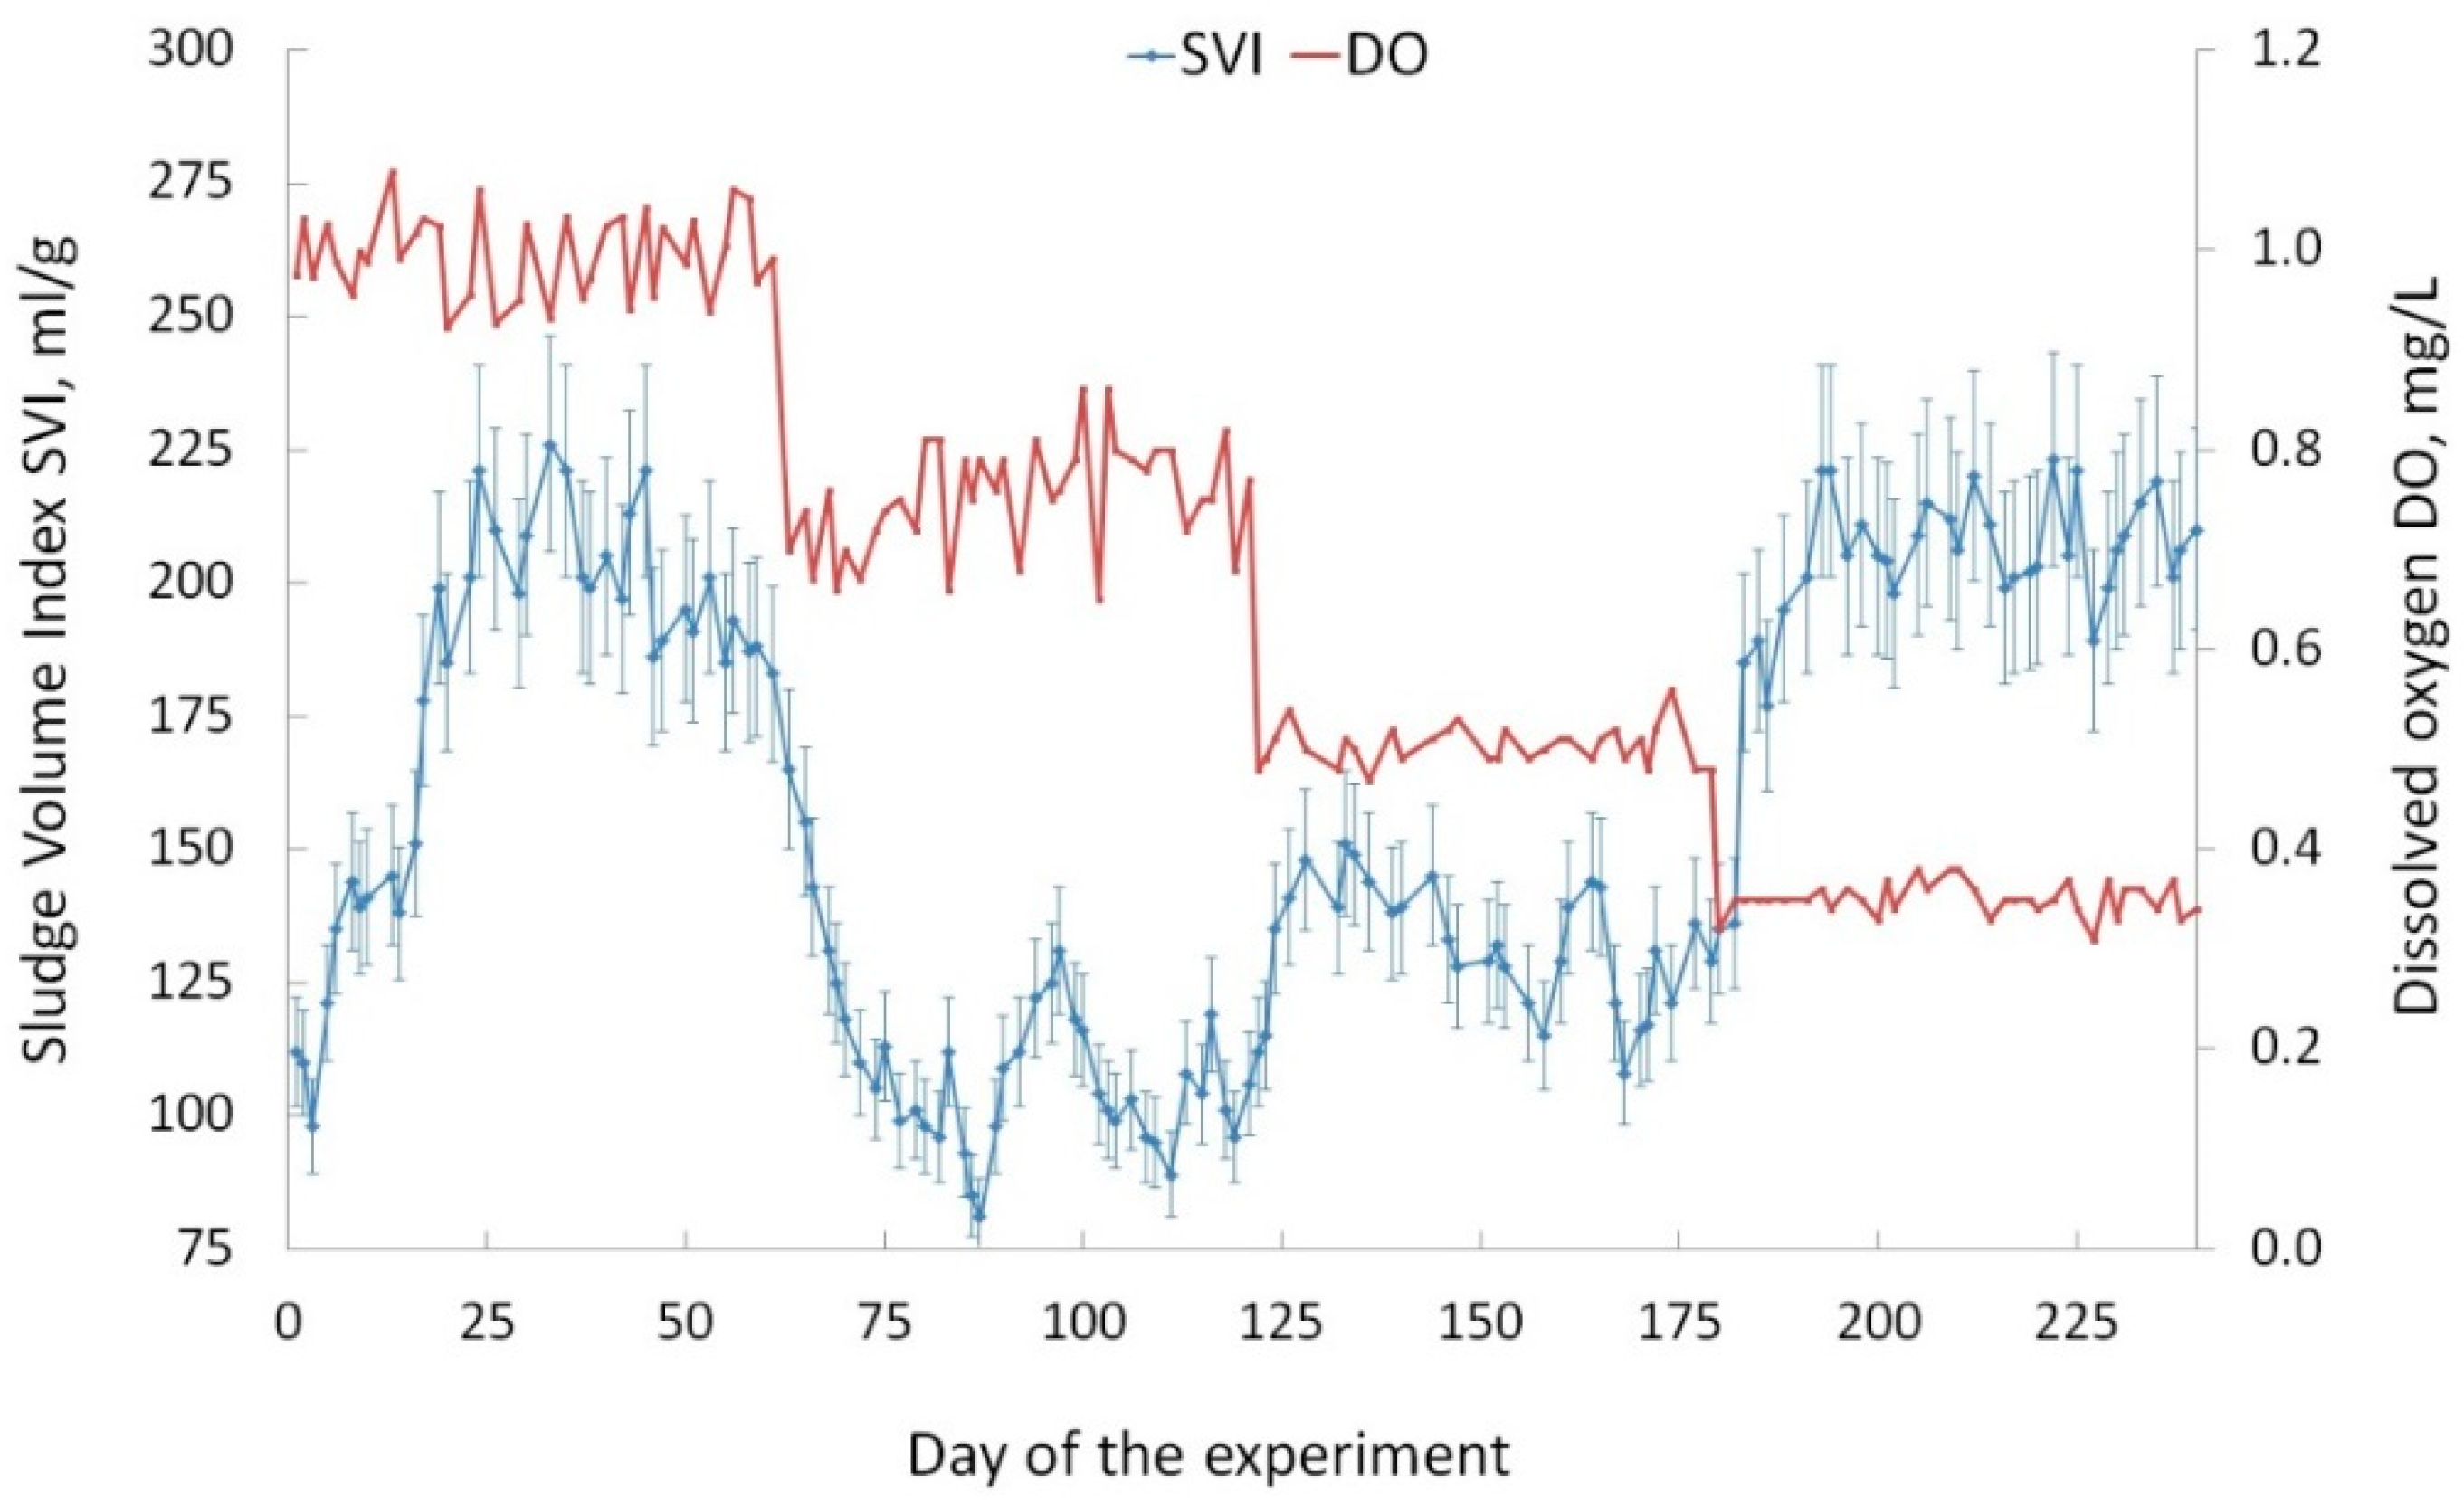
In stage 2, filamentous sludge bulking was also observed in the system featuring high specific organic load in stage 2.1 (0.41 gBOD/g/d), when DO was about 1.0 mg/L. Thus, it is recommended that the values of the specific organic load do not exceed 0.3 g BOD/g/d at low DO concentrations to maintain system stability. The average MLSS value for this stage was 1.290 g/L with SVI = 98–226 mL/g. The DSS/FSS value was 15.6/14.8 mg/L.
In stage 2.4, filamentous sludge bulking occurred when the concentration of DO dropped below 0.4 mg/L. Reports on the successful operation of an OD with SND at BS concentrations below 0.4 mg/L are rare. There is a study on SND at dissolved oxygen concentrations of about 0.1–0.25 mg/L [36]. However, the results of this study suggest a recommendation not to reduce the dissolved oxygen concentration below 0.4 mg/L. An average MLSS for stage 2.4 was 1.918 g/L with SVI = 135–223 mL/g. The DSS/FSS value was 17.8/16.5 mg/L, also indicating poor biological flocculation. The SVI values in stage 2 are presented in Figure 7.
In stages 2.2 and 2.3, the activated sludge system was stable. The average MLSS values were 1.699 g/L and 1.651 g/L with SVI = 81–165 mL/g and 108–151 mL/g, respectively. DSS/FSS tests showed values of 4.9/4.1 mg/L and 5.2/4.9 mg/L. For stage 2.2, VHS(a) = 8.711∙e−0.399a and for stage 2.3, VHS(a) = 9.012∙e−0.401a.
In stage 3 of the study, the activated sludge system remained stable. Real wastewater was fed into the system, and the specific organic load did not exceed 0.3 g BOD/g/day. SVI did not exceed 150 mL/g.
In stage 3.1, the average MLSS was 1.113 g/L with the SVI about 92–135 mL/g and VHS(a) = 8.215∙e−0.415a. DSS/FSS tests showed values of 4.5/4.3 mg/L. In stage 3.2, the average MLSS was 1.471 g/L with SVI about 95–141 mL/g and VHS(a) = 8.432∙e−0.401a. DSS/FSS tests showed values of 5.0/4.2 mg/L.
Thus, the enzyme kinetics of both 3.1 and 3.2 were considered. In this stage, the reactor had a built-in settling tank, which allowed us to preserve the large structure of the floccules. There are studies that cover similar solutions developed for sedimentation tanks, aimed at reducing the areas of structures and the formation of aerobic granules [7]. In this work, a decrease in the mechanical loading of active floccules was aimed at increasing the efficiency of SND when the recommended concentrations of dissolved oxygen were exceeded. Large floccules ensure an efficient SND process in the presence of zones with relatively high concentrations of dissolved oxygen. A similar possibility was previously assumed in [15] for ODs with a mechanical aeration system.
Despite the increased values of SVI, VHS in this study nearly corresponded to the previously established velocities for standard nitrifying activated sludge, with SVI = 80–100 mL/g. For example, V0 = 9.647 and rv = 0.488 [49], V0 = 9.993 and rv = 0.431 [50], and V0 = 5.669 and rv = 0.446 [51]. Presumably, this may happen due to the retention of dense central zones in the large floccules of activated sludge stored in the SND-OD system, especially in the one with built-in settling tanks.
To examine the dependence of efficiency on the SND processes and the sizes of the floccules, as well as to identify the modes of operation that promote the growth of large floccules, a comparative analysis of the size distribution of floccules was performed using the laser diffraction method.
Averaged results of the particle size analysis for different stages of the experiment are shown in Table 5.
In the absence of filamentous sludge bulking in bioreactors, the average sizes of floccules exceeded 450 μm. According to previous studies, the efficiency of SND increases dramatically when the size of the activated sludge floccules exceeds 110 μm, which is associated with more stable anoxic microzones in floccules [15]. In this study, activated sludge with floccules bigger than 250 μm corresponded to the maximum denitrification potential of biomass, both in terms of microbial composition, ex situ tests and long-term experiments, as shown below. At the same time, the efficiency and rate of nitrification increased with a decrease in the size of the activated sludge floccules to 80 μm, which is also in line with previous research [15]. All this confirms the physical nature of the SND process, which requires anoxic microzones in the center of large floccules. A natural way to intensify this process seems to be further increasing the size of floccules by regulating the hydraulic and aeration regimes of the OD. In this case, we propose to consider using built-in settling tanks, as well as to control the hydraulics of the system through the modified Froude number (Fr) [52]:
where u is the average cross-section horizontal flow velocity, m/s; g is acceleration by gravity, 9.8 m/s2; S is the submergence of diffuser, m; and uq is the air flow in the total aerated area (m3/m2/s). Usually, Fr is used to optimize aeration and mixing systems in OD; however, it has been suggested to reduce the hydraulic impact on floccules by keeping Fк below 0.3 [29].
3.2. PCR Testing
A total of 10 samples were examined. Sample numbers are shown in Table 6.
A PCR test, involving primers applied to 16S rRNA of bacteria, was conducted to determine the optimal dilution of DNA extracted from the activated sludge. When diluting DNA preparations 10 and 100 times, it is possible to achieve a decrease in the effect of contamination, which is often manifested due to insufficient DNA purification.
The number of copies of bacterial 16S rRNA genes varied within the range of 1011–1012 copies/g of substrate (activated sludge biomass) for all samples. The largest numbers of bacterial genes were observed in samples 7, 9 and 10. The index of the number of copies of genes of bacterial 16S rRNA was used to assess the relative abundance of genes associated with processes of the nitrogen cycle.
The number of copies of genes of archaeal 16S rRNA was the highest in sample 9 (7.25 × 10¹⁰ copies/g of substrate). In samples 2, 3, 6, 7 and 10, the number of archaean genes varied within 1.14–2.05 × 10¹⁰ copies/g of substrate. In samples 1, 4, 5 and 8 the number of archaeal genes was the smallest (about 250 copies/g of substrate).
The number of copies of the bacterial amoA gene significantly differed across the studied samples. The largest amount was found in sample 9 (3.77 × 10⁸ copies of amoA bacteria/g of substrate). In samples 3, 7 and 10, the number of copies of the amoA gene was 2.9–6.5 × 10⁷/g of substrate. The smallest amount of amoA (about 106/g of substrate) was found in samples 1 and 8.
The number of copies of the nirK gene was the highest in samples 10, 9 and 7 (up to 1010 copies of the nirK gene/g of substrate). In other samples, its amount varied within 0.7–6 × 10⁹ copies of the nirK gene/g of substrate. The ratio of the number of nirK and 16S rRNA of bacteria was the highest in samples 10 and 9; the ratios of genes in the remaining samples did not differ significantly.
Given the data obtained in the course of the study (the number of copies of ribosomal genes/g of substrate), it is possible to draw a conclusion about the number of microorganisms in the samples, which are close to real values. This estimate is relative, since variations in the number of ribosomal operons in the genomes of bacteria and archaea should be taken into account; however, it is possible to determine the ratio of the abundance of different groups of microorganisms in samples based on the number of copies of ribosomal genes.
When assessing the number of functional genes in the samples, one can judge the potential ability of the activated sludge microbiome to carry out a particular process. In this case, variations in the number of copies of a gene in a single genome are not significant.
The number of copies of ribosomal genes of bacteria is a characteristic of the total abundance of bacteria in the samples. The method of sampling biomass for the isolation of the total DNA (using a weighed portion or aliquot of activated sludge suspension) did not affect this indicator, which showed the same extraction efficiency for both cases.
According to the assessment of the number of copies of genes associated with nitrification and denitrification, samples of activated sludge were identified that had the highest potential activity aimed at the implementation of these processes. High potential activity for nitrification and denitrification was found in sample 9, due to the high number of copies of the bacteria amoA, nirK and nirS genes. Sample 7 revealed a large number of copies of genes associated with denitrification; the number of copies of the bacterial amoA gene was relatively small. However, archaeal amoA genes and a high abundance of archaeal 16S rRNA were detected in this sample, which may indicate the dominance of archaeal nitrifiers in the microbial community of sample 10.
The comparative analysis showed that simultaneous nitrification and denitrification, which are also underway in real wastewater, make the amount of corresponding DNA approximately comparable with a system operating according to the classical technology, whereas reaction rates in low-oxygen modes are slightly lower, which is explained by the operating conditions of activated sludge, rather than its composition. A larger number of archaea favorably affects the efficiency of nitrification, since such a system becomes more adapted to the stressful conditions of low concentrations of dissolved oxygen.
Previous detailed reports on activated sludge, obtained from municipal wastewater treatment plants, showed similar results [53]. The anaerobic, anoxic and oxic zones of a conventional Carrousel oxidation ditch system used for domestic wastewater treatment shared approximately similar percentages across the 50 most abundant genera, and only three genera presented statistically significantly differential abundance in the anoxic zone. The efficiency of the SND systems at low DO conditions was correlated with the presence of a significant fraction of AOB belonging to the Nitrosospira and Nitrosomonas oligotropha lineages [54]. A significant change in the microbial community composition of activated sludge in the OD was observed when the stability of the system is disturbed by filamentous bulking as well [55]. The microbial composition of activated sludge from the OD with the SND process corresponds to the control activated sludge of aeration tanks with a single-sludge denitrification activated sludge system [56].
This suggests that the kinetic features of the process are associated with physical, rather than microbiological mechanisms. The emergence of specific types of microorganisms in activated sludge is possible when certain conditions are in place, for example, during the implementation of SND-Anammox processes [57].
3.3. Reaction Rates
In general, experimental reactors have shown sufficient efficiency in wastewater treatment aimed at the removal of organic compounds and nitrogen. Table 7 shows the efficiency of wastewater treatment at various stages of research.
In cases of filamentous bulking, the systems showed extremely low treatment efficiency; therefore, they were not considered.
Stage 3.2 showed efficient wastewater treatment and high system stability. This stage involved the use of real wastewater. The results showed convergence with stages that involved the use of synthetic water; hence, this technological scheme is proposed as a recommended one. A comparison of the treatment efficiency of this scheme with other studies is presented in Table 8.
Evidently, the selected system allows us to treat wastewater at a relatively high organic loading rate with a comparable efficiency to that of the SND process. For ODs with higher organic rates and a short HRT, a sufficient oxygen intensity is required for organic oxidation and nitrification under the low-DO conditions. The studies presented in Table 8 also reported activated sludge problems at low dissolved oxygen concentrations and higher loads. The obtained RNSND rate corresponds to ODs with SND at DO concentrations of more than 1 mg/L; however, it was achieved at a significantly lower NRT and with higher organic loads. For these loads, a DO concentration nearing 1.0 mg/L ensures the system’s stability.
Stage 1 of the study, which showed the adaptation of activated sludge to low-oxygen conditions, maintained a stable biomass throughout the experiment. Despite the fact that in this stage the SND process was not fully supported, the reaction rates were also considered for this purpose.
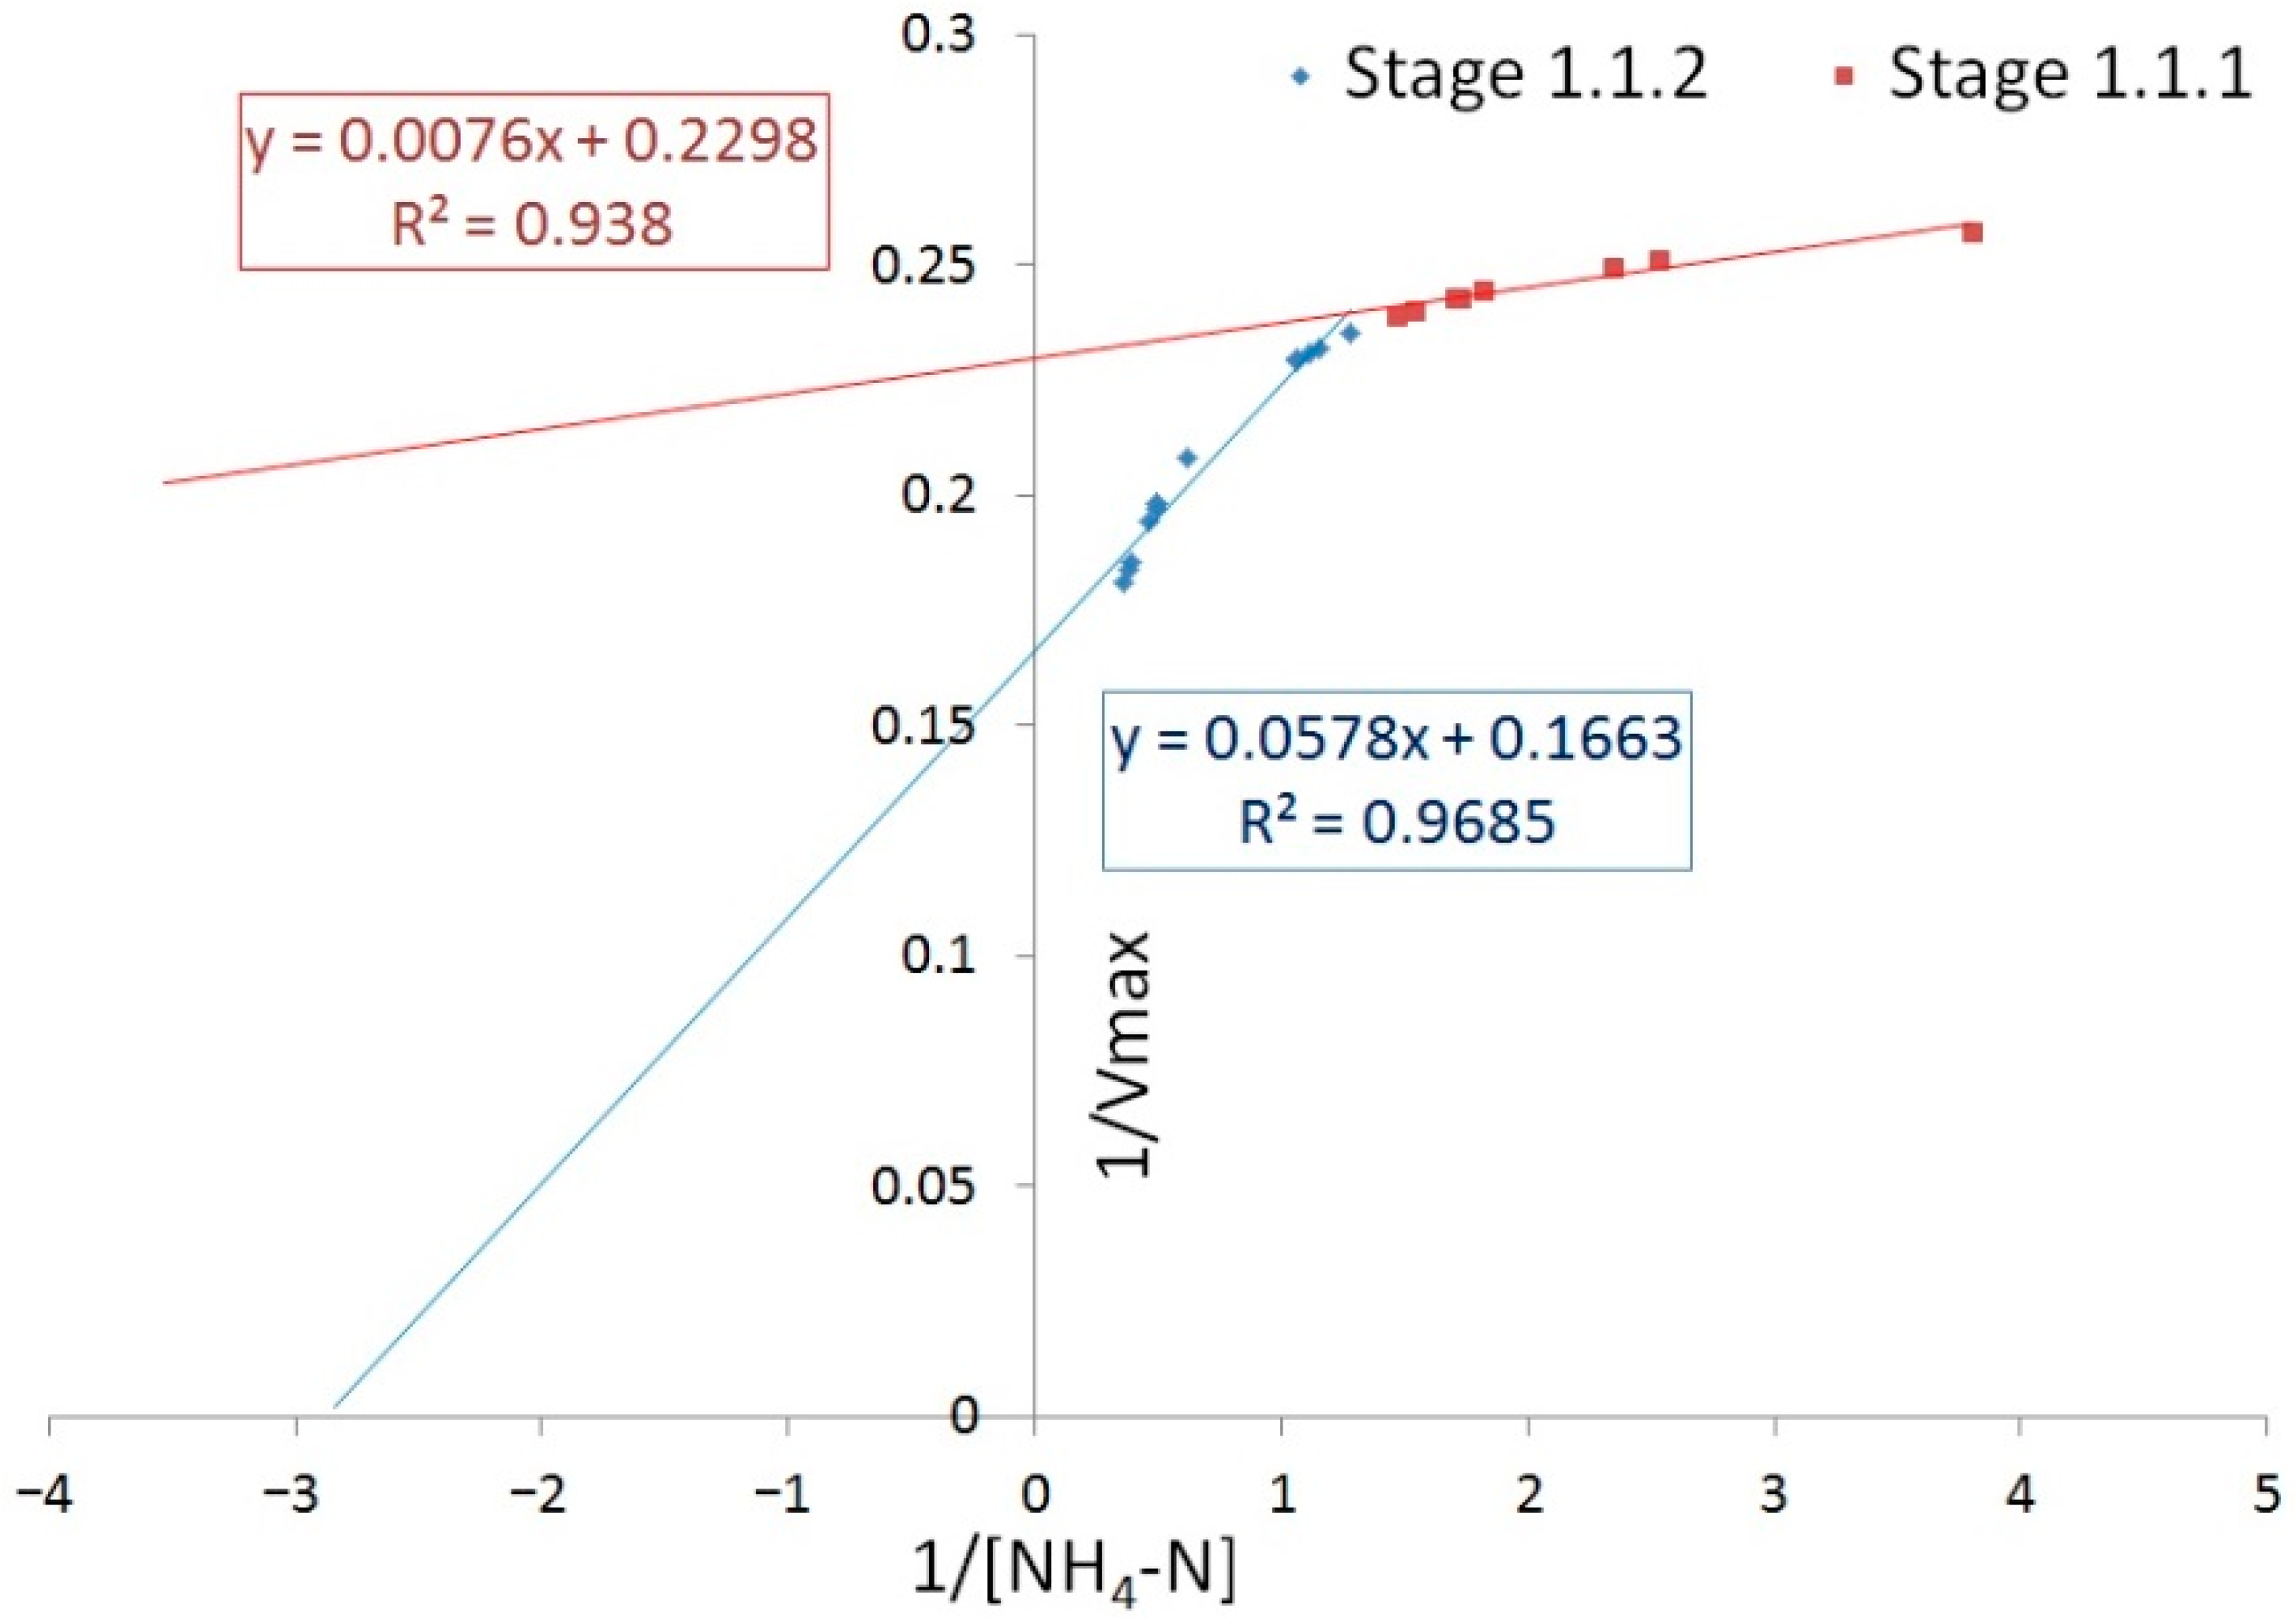
Figure 8 shows the Lineweaver–Burk plots for specific rates of nitrification in stages 1.1.1 and 1.1.2.
According to Figure 8, the Michaelis–Menten equations for rates of nitrification in stages 1.1.1 and 1.1.2. are obtained as follows:
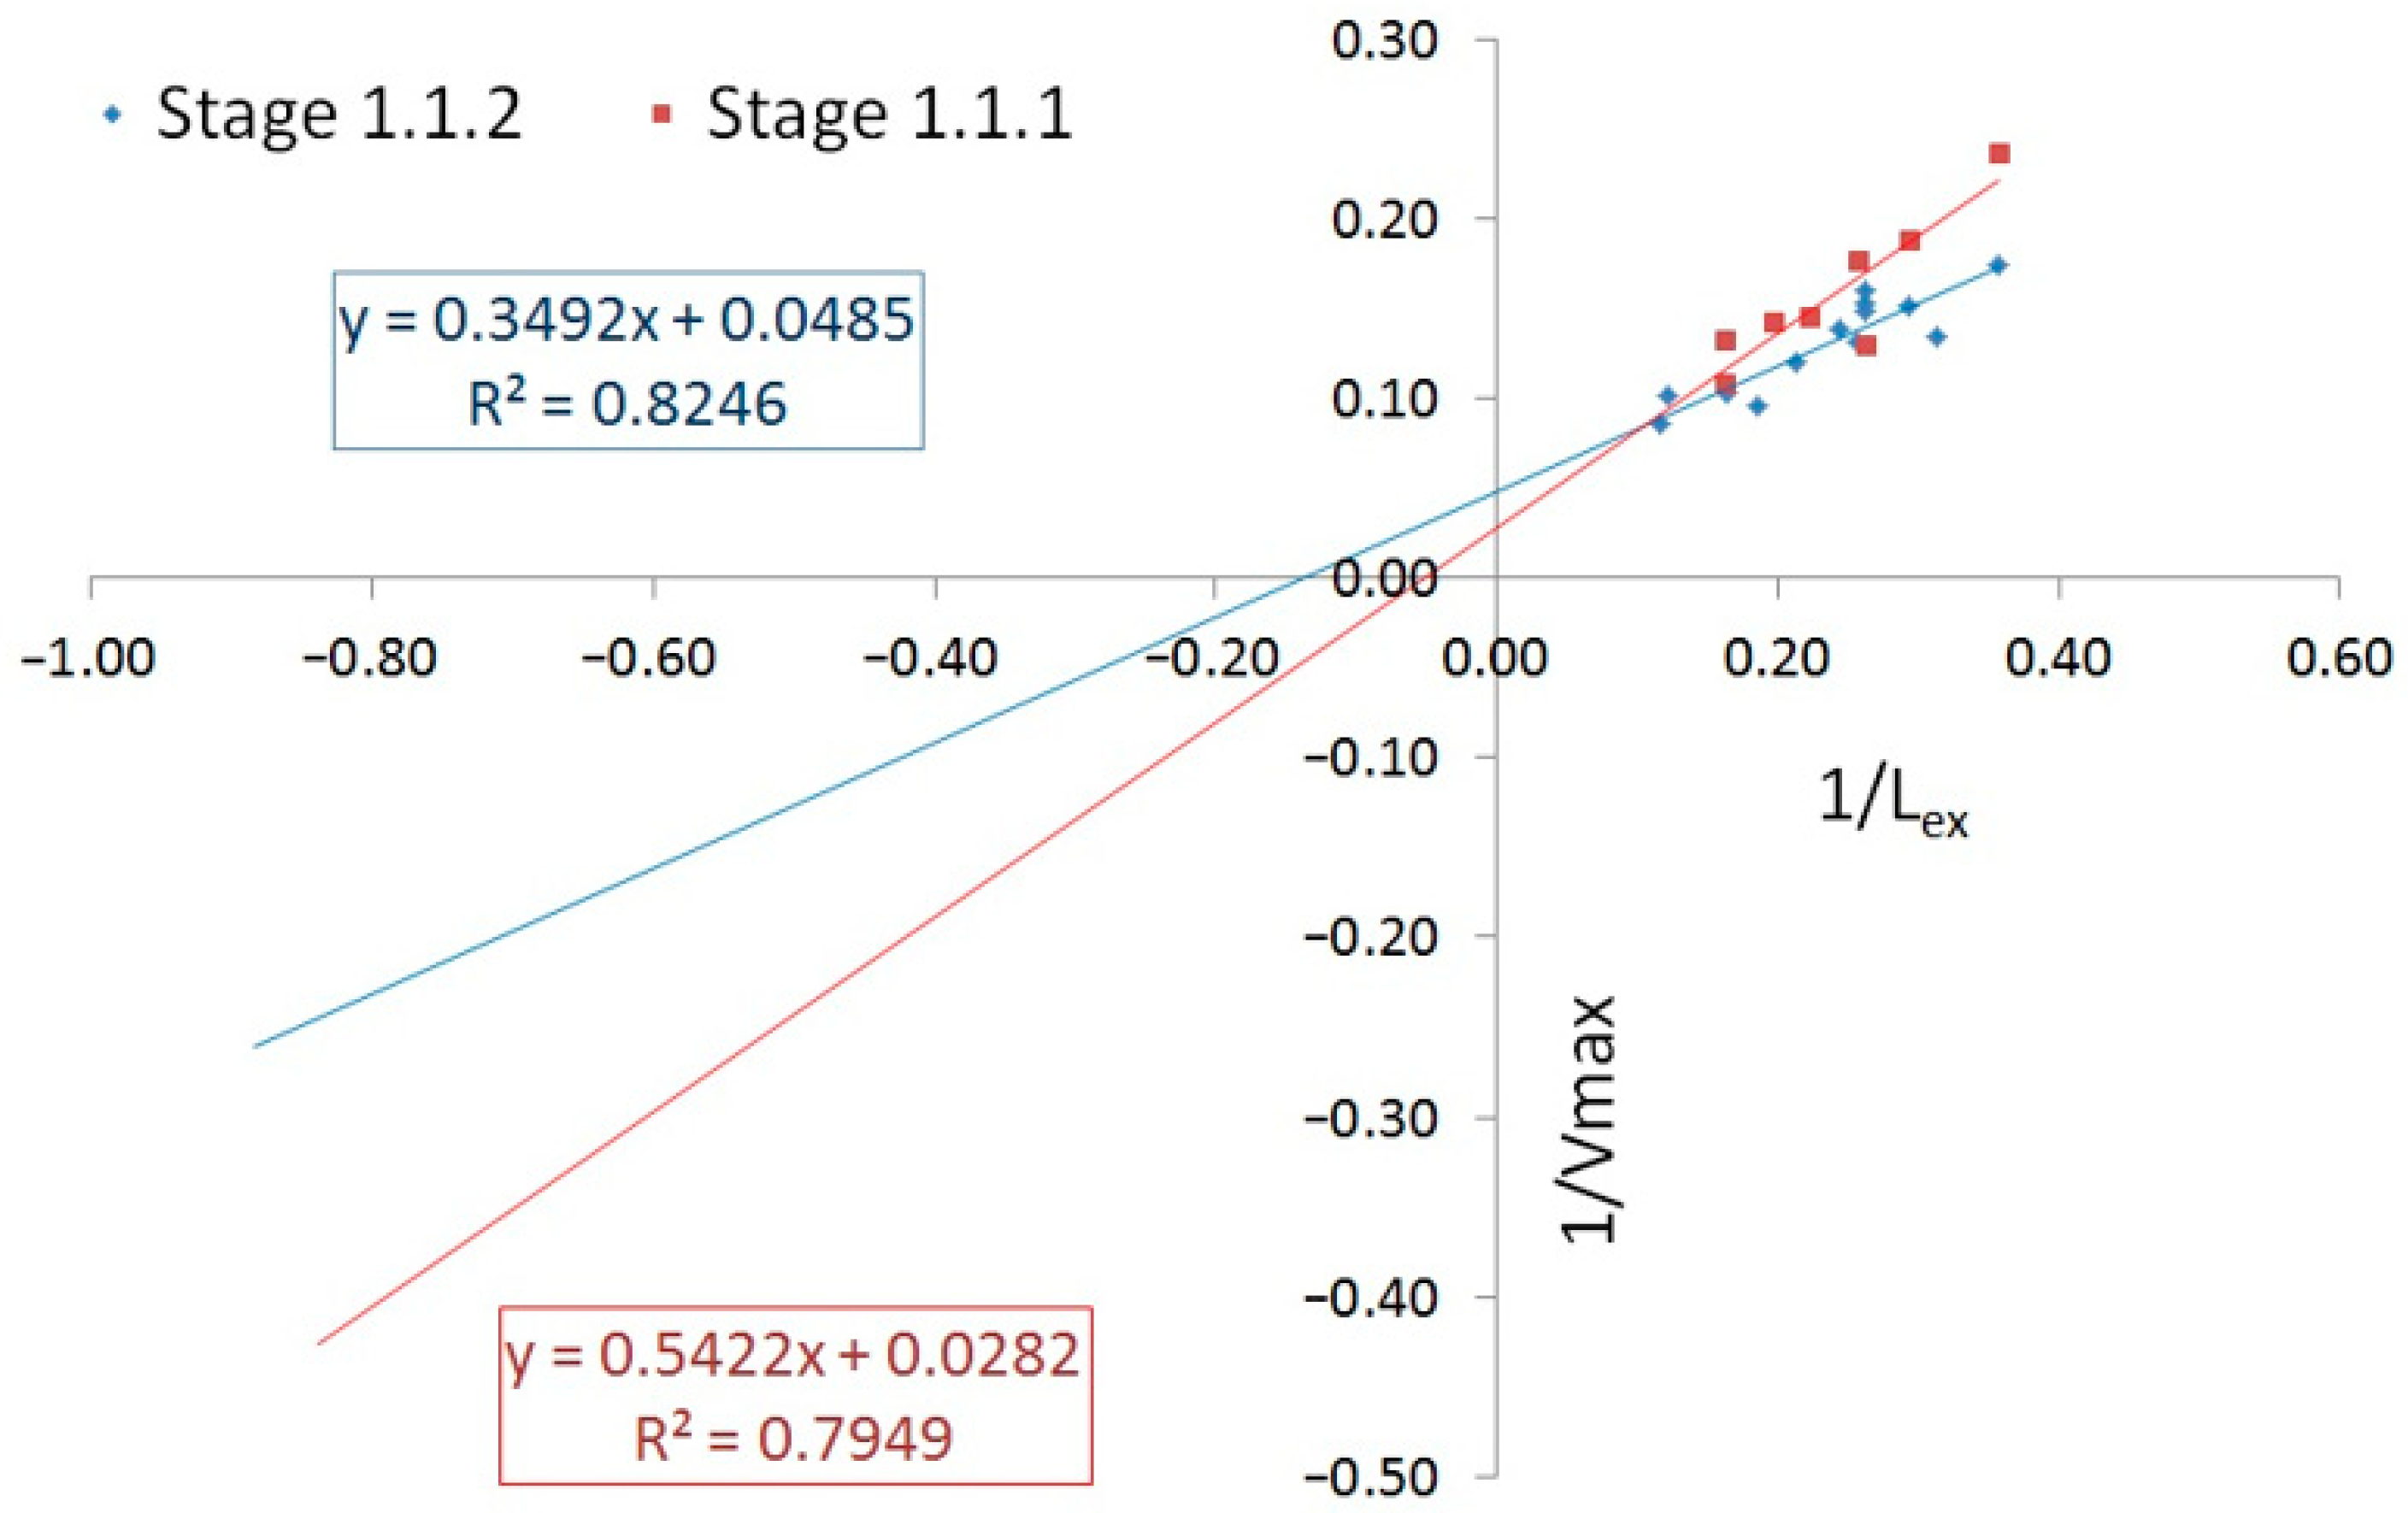
Figure 9 shows the Lineweaver–Burk plot for rates of organic matter removal in stages 1.1.1 and 1.1.2.
According to the plot in Figure 9, the Michaelis–Menten equations for the rate of organic matter removal in stages 1.1.1 and 1.1.2. were obtained thus:
where Lex is the effluent BOD concentration.
The Michaelis–Menten equations for the remaining stable stages of the study were obtained similarly according to Equations (1) and (2). The obtained values of Vmax and Km are presented in Table 9. In addition, this table also contains the results of batch activity tests conducted to determine the rate of nitrification, the rate of formation of nitrates ex situ and the results of batch activity tests to determine the specific denitrification rate ex situ.
For the stage featuring the maximum denitrification activity (stage 3.2), the heterotrophic denitrifying biomass growth yield was YOHO,Ax = 0.720 g/g.
The obtained values for the reaction rates show a convergence between synthetic and real wastewater. At the same time, the most stable and efficient system was identified in stage 3.2. It should be noted that this system corresponded to activated sludge with the largest average size of floccules (452 μm) and the largest relative content of nitrifying organisms according to the PCR test. Previously-determined dependences between constants, employing various approaches to the determination of the limiting substrate, have produced different characterizations of the biological processes involved in simultaneous nitrification and denitrification. In general, studies have use pure cultures and individual processes corresponding to these cultures. Kinetic models of the processes of ammonium oxidation, nitrate oxidation and denitrification by P. denitrificans culture are generalized in [28]. The following maximum reaction rates and half-saturation constants for these processes were obtained, respectively: Vmax = 71.56, Ki = 0.95 (NH4-N); Vmax = 47.28; Ki = 0.72 (NO2-N); Vmax = 65.97; Ki = 0.75 (NO3-N). The most closely related work [29] considered the reaction rates for mixed culture bench-scale sequencing batch reactors using the SND process. Relationships between nitrification rates (Vmax = 19.0; KM = 4.5), denitrification rates (Vmax = 3.8; KM = 0.67–0.4) and DO concentrations were obtained.
In this work, an attempt was made to assess the enzymatic kinetics of a mixed culture that implemented SND processes in an OD system. Under stable operating conditions, the relationships between organic matter removal rates and BODeff (Vmax = 27.17; KM = 6.29) and between nitrification and NH4-Neff (Vmax = 4.44; KM = 0.04) were observed. The reaction rates obtained during long-term experiments on the lab-scale OD turned out to be less than the values obtained in batch tests, which may be related to the influence of operating conditions in ODs. Furthermore, mixed culture rates had lower values than pure cultures, due to the specific features of reactions. In general, a decrease in the reaction rate is conditionally proportional to the content of the corresponding groups of microorganisms in activated sludge. To some extent, this is confirmed by comparing the results of the study with the results of [28,61]. The wide range observed for Km probably arose because the concentration of DO in the bulk liquid was not necessarily the same as that inside the biological flocs where the oxygen consumption took place. Consequently, the value of Km will depend on the size of the floc, the mixing intensity and the oxygen diffusion rate into the floc [28,62].
4. Conclusions
Lab-scale oxidation ditches were studied during the course of this experiment. The reactors were exposed to various operating conditions, differing mainly in the concentration of dissolved oxygen. Previously, it had been assumed that there was a need to maintain a uniform concentration of dissolved oxygen in the volume of the reactor at a level of 0.5 mg/L [17]. Separate anoxic and aerobic zones are difficult to create if the horizontal flow velocity of the sludge mixture is high. Highly efficient removal of nitrogen compounds, including nitrate nitrogen, was demonstrated for systems featuring simultaneous nitrification and denitrification. At the same time, systems having pronounced oxygen zones were found to be much more reliable in terms of preventing the filamentous bulking of activated sludge.
A stable technological scheme was selected for the simultaneous nitrification and denitrification of low-oxygen-concentration wastewater, in which the oxidation ditch has an organic loading rate of about 0.23 g/g/d, the HRT is 12 h, the DO is about 1.0 mg/L, and the internal recirculation rate is close to 350%.
Values of the rates of nitrification and oxidation reactions, involving organic compounds, were established for each type of laboratory reactor modeling oxidation ditches. For a stable regime, the rate constants of the reactions, expressed through Michaelis–Menten relationships, were Vmax = 27.17; KM = 6.29 for the organic matter removal rate and Vmax = 4.44; KM = 0.04 for the nitrification rate. These relationships were relative to the concentrations of NH4-N and BOD as substrates, required for the analysis of treatment facilities according to the methods described in [63]. The values of these rates were obtained for activated sludge with large floccules (at least 300 μm); further studies will be aimed at describing the process of aerobic granulation in ODs with SND and built-in settling tanks, and obtaining the corresponding characteristics of biomass for WWTP design.
Author Contributions
Writing—original draft preparation, I.G.; writing—review and editing, E.G. and I.G.; modeling, E.G. and I.G.; conceptualization, E.G.; methodology, E.G. and I.G.; data curation, I.G.; supervision, E.G.; funding acquisition, I.G. All authors have read and agreed to the published version of the manuscript.
Funding
This work was financially supported by the Ministry of Science and Higher Education of Russian Federation (grant # 075-15-2021-686). Tests were carried out using research equipment of The Head Regional Shared Research Facilities of the Moscow State University of Civil Engineering.
Institutional Review Board Statement
Not applicable.
Informed Consent Statement
Not applicable.
Data Availability Statement
The data presented in this study are available on request from the corresponding author.
Conflicts of Interest
The authors declare no conflict of interest.
References
- Pierre, K.C. Computational Fluid Dynamics (CFD) Analysis of the Hydraulic Performance and Bio-Kinetics in A Full-Scale Oxidation Ditch. Doctoral Dissertation, University of South Florida, Tampa, FL, USA, 9 July 2021. [Google Scholar]
- Uçan, R.; Şanlıer, H.; Özay, M.E. Investigation of Job Satisfaction and Occupational Safety Perceptions of Employees in Wastewater Treatment Plants: Study of Istanbul. Int. J. Occup. Saf. Health 2020, 10, 3–10. [Google Scholar] [CrossRef]
- Gandiglio, M.; Lanzini, A.; Soto, A.; Leone, P.; Santarelli, M. Enhancing the Energy Efficiency of Wastewater Treatment Plants through Co-digestion and Fuel Cell Systems. Front. Environ. Sci. 2017, 5, 70. [Google Scholar] [CrossRef] [Green Version]
- Luo, Y.; Yao, J.; Wang, X.; Zheng, M.; Guo, D.; Chen, Y. Efficient municipal wastewater treatment by oxidation ditch process at low temperature: Bacterial community structure in activated sludge. Sci. Total Environ. 2020, 703, 135031. [Google Scholar] [CrossRef]
- Li, X.; Zhang, J.; Zhang, X.; Li, J.; Liu, F.; Chen, Y. Start-up and nitrogen removal performance of CANON and SNAD processes in a pilot-scale oxidation ditch reactor. Process. Biochem. 2019, 84, 134–142. [Google Scholar] [CrossRef]
- Matko, T.; Chew, J.; Wenk, J.; Chang, J.; Hofman, J. Computational fluid dynamics simulation of two-phase flow and dissolved oxygen in a wastewater treatment oxidation ditch. Process. Saf. Environ. Prot. 2021, 145, 340–353. [Google Scholar] [CrossRef]
- Xu, D.; Li, J.; Ma, T. Rapid aerobic sludge granulation in an integrated oxidation ditch with two-zone clarifiers. Water Res. 2020, 175, 115704. [Google Scholar] [CrossRef]
- Wang, X.; Chen, T.; Jin, P.; Zhang, A.; Gao, C.; Qi, X.; Zhang, Y. Enhanced total nitrogen removal performance in a full scale Orbal oxidation ditch by a novel step aeration mode. Bioresour. Technol. 2019, 294, 122228. [Google Scholar] [CrossRef]
- Agbewornu, K.C.D.; Adyel, T.M.; Zhai, J. Optimizing nitrogen removal in a hybrid oxidation ditch. J. Environ. Chem. Eng. 2021, 9, 105443. [Google Scholar] [CrossRef]
- Xu, X.; Wei, W.; Liu, F.; Wei, W.; Liu, Z. Experimental study on aeration efficiency in a pilot-scale decelerated oxidation ditch equipped with fine bubble diffusers and impellers. Can. J. Chem. Eng. 2021, 99, 1410–1420. [Google Scholar] [CrossRef]
- Zhang, M.; Yao, J.; Wang, X.; Hong, Y.; Chen, Y. The microbial community in filamentous bulking sludge with the ultra-low sludge loading and long sludge retention time in oxidation ditch. Sci. Rep. 2019, 9, 13693. [Google Scholar] [CrossRef] [PubMed]
- Subtil, E.L.; Silva, M.V.; Lotto, B.A.; Moretto, M.R.D.; Mierzwa, J.C. Pilot-scale investigation on the feasibility of simultaneous nitrification and denitrification (SND) in a continuous flow single-stage membrane bioreactor. J. Water Process. Eng. 2019, 32, 100995. [Google Scholar] [CrossRef]
- Wang, J.; Rong, H.; Cao, Y.; Zhang, C. Factors affecting simultaneous nitrification and denitrification (SND) in a moving bed sequencing batch reactor (MBSBR) system as revealed by microbial community structures. Bioprocess Biosyst. Eng. 2020, 43, 1833–1846. [Google Scholar] [CrossRef] [PubMed]
- Liu, T.; Jia, G.; Xu, J.; He, X.; Quan, X. Simultaneous nitrification and denitrification in continuous flow MBBR with novel surface-modified carriers. Environ. Technol. 2021, 42, 3607–3617. [Google Scholar] [CrossRef] [PubMed]
- Pochana, K.; Keller, J. Study of factors affecting simultaneous nitrification and denitrification (SND). Water Sci. Technol. 1999, 39, 61–68. [Google Scholar] [CrossRef]
- Zhao, H.W.; Mavinic, D.S.; Oldham, W.K.; Koch, F.A. Controlling factors for simultaneous nitrification and denitrification in a two-stage intermittent aeration process treating domestic sewage. Water Res. 1999, 33, 961–970. [Google Scholar] [CrossRef]
- Rittmann, B.E.; Langeland, W.E. Simultaneous denitrification with nitrification in single-channel oxidation ditches. J. Water Pollut. Control Fed. 1985, 57, 300–308. [Google Scholar]
- Sun, S.-P.; Pellicer-Nàcher, C.; Merkey, B.; Zhou, Q.; Xia, S.-Q.; Yang, D.-H.; Sun, J.-H.; Smets, B.F. Effective Biological Nitrogen Removal Treatment Processes for Domestic Wastewaters with Low C/N Ratios: A Review. Environ. Eng. Sci. 2010, 27, 111–126. [Google Scholar] [CrossRef] [Green Version]
- Liu, B.; Lin, H.; Yu, G.; Zhang, S.; Zhao, C. Fate of dissolved organic nitrogen during biological nutrient removal wastewater treatment processes. J. Environ. Biol. 2013, 34, 325. [Google Scholar]
- Hao, O.J.; Huang, J. Alternating aerobic-anoxic process for nitrogen removal: Process evaluation. Water Environ. Res. 1996, 68, 83–93. [Google Scholar] [CrossRef]
- Jayasvasti, M.; Ratanatamskul, C. Appropriate Lab Scale Oxidation Ditch Tank for Cafeteria Building Wastewater Treatment. Int. J. Adv. Agric. Environ. Eng. 2014, 1, 127–130. [Google Scholar]
- Zhang, P.; Qi, Z. Simultaneous nitrification and denitrification in activated sludge system under low oxygen concentration. Front. Environ. Sci. Eng. China 2007, 1, 49–52. [Google Scholar] [CrossRef]
- Zhu, G.-C.; Lu, Y.-Z.; Xu, L.-R. Effects of the carbon/nitrogen (C/N) ratio on a system coupling simultaneous nitrification and denitrification (SND) and denitrifying phosphorus removal (DPR). Environ. Technol. 2021, 42, 3048–3054. [Google Scholar] [CrossRef] [PubMed]
- Liu, Y.; Wei, W.; Lv, B.; Yang, X. Research on optimal radius ratio of impellers in an oxidation ditch by using numerical simulation. Desalination Water Treat. 2013, 52, 2811–2816. [Google Scholar] [CrossRef]
- Pang, H.; Shi, H.; Shi, H. Flow characteristic and wastewater treatment performance of a pilot-scale airlift oxidation ditch. Front Environ. Sci. Eng 2009, 3, 470. [Google Scholar] [CrossRef]
- Mpongwana, N.; Ntwampe, S.K.O.; Omodanisi, E.I.; Chidi, B.S.; Razanamahandry, L.C.; Dlangamandla, C.; Mukandi, M.R. Bio-Kinetics of Simultaneous Nitrification and Aerobic Denitrification (SNaD) by a Cyanide- Degrading Bacterium Under Cyanide-Laden Conditions. Appl. Sci. 2020, 10, 4823. [Google Scholar] [CrossRef]
- Medhi, K.; Singhal, A.; Chauhan, D.; Thakur, I.S. Investigating the nitrification and denitrification kinetics under aerobic and anaerobic conditions by Paracoccus denitrificans ISTOD1. Bioresour. Technol. 2017, 242, 334–343. [Google Scholar] [CrossRef]
- Münch, E.V.; Lant, P.; Keller, J. Simultaneous nitrification and denitrification in bench-scale sequencing batch reactors. Water Res. 1996, 30, 277–284. [Google Scholar] [CrossRef]
- Henkel, J. Oxygen Transfer Phenomena in Activated Sludge. Doctoral Dissertation, TU Darmstadt, Darmstadt, Hessen, Germany, 2010. [Google Scholar]
- Hocaoglu, S.M.; Insel, G.; Cokgor, E.U.; Orhon, D. Effect of low dissolved oxygen on simultaneous nitrification and denitrification in a membrane bioreactor treating black water. Bioresour. Technol. 2011, 102, 4333–4340. [Google Scholar] [CrossRef] [PubMed]
- Mantziaras, I.D.; Katsiri, A. Reaction rate constants and mean population percentage for nitrifiers in an alternating oxidation ditch system. Bioprocess Biosyst. Eng. 2010, 34, 57–65. [Google Scholar] [CrossRef]
- Gogina, E.; Gulshin, I. Simultaneous Nitrification and Denitrification with Low Dissolved Oxygen Level and C/N ratio. Procedia Eng. 2016, 153, 189–194. [Google Scholar] [CrossRef] [Green Version]
- Gulshin, I. The Settling Behaviour of An Activated Sludge with Simultaneous Nitrification and Dentrification. In Web of Conferences; EDP Sciences: Les Ulis, France, 2017; Volume 106, p. 07002. [Google Scholar]
- Water Environment Federation; APH Association. Standard Methods for the Examination of Water and Wastewater; American Public Health Association (APHA): Washington, DC, USA, 2005. [Google Scholar]
- Van Loosdrecht, M.C.; Nielsen, P.H.; Lopez-Vazquez, C.M.; Brdjanovic, D. Experimental Methods in Wastewater Treatment; IWA Publishing: London, UK, 2016. [Google Scholar]
- Zhou, X.; Han, Y.; Guo, X. Identification and evaluation of SND in a full-scale multi-channel oxidation ditch system under different aeration modes. Chem. Eng. J. 2015, 259, 715–723. [Google Scholar] [CrossRef]
- Vesilind, P.A. Design of prototype thickeners from batch settling tests. Water Sew. Work. 1968, 115, 302–307. [Google Scholar]
- Fierer, N.; Jackson, J.A.; Vilgalys, R.; Jackson, R.B. Assessment of Soil Microbial Community Structure by Use of Taxon-Specific Quantitative PCR Assays. Appl. Environ. Microbiol. 2005, 71, 4117–4120. [Google Scholar] [CrossRef] [PubMed] [Green Version]
- Hallin, S.; Jones, C.; Schloter, M.; Philippot, L. Relationship between N-cycling communities and ecosystem functioning in a 50-year-old fertilization experiment. ISME J. 2009, 3, 597–605. [Google Scholar] [CrossRef]
- Michotey, V.; Méjean, V.; Bonin, P. Comparison of Methods for Quantification of Cytochrome cd 1 -Denitrifying Bacteria in Environmental Marine Samples. Appl. Environ. Microbiol. 2000, 66, 1564–1571. [Google Scholar] [CrossRef] [Green Version]
- Throbäck, I.N.; Enwall, K.; Jarvis, Å.; Hallin, S. Reassessing PCR primers targeting nirS, nirK and nosZ genes for community surveys of denitrifying bacteria with DGGE. FEMS Microbiol. Ecol. 2004, 49, 401–417. [Google Scholar] [CrossRef]
- Yu, Y.; Lee, C.; Hwang, S. Analysis of community structures in anaerobic processes using a quantitative real-time PCR method. Water Sci. Technol. 2005, 52, 85–91. [Google Scholar] [CrossRef]
- Park, S.-J.; Park, B.-J.; Rhee, S.-K. Comparative analysis of archaeal 16S rRNA and amoA genes to estimate the abundance and diversity of ammonia-oxidizing archaea in marine sediments. Extremophiles 2008, 12, 605–615. [Google Scholar] [CrossRef] [PubMed]
- Wilén, B.-M.; Balmér, P. The effect of dissolved oxygen concentration on the structure, size and size distribution of activated sludge flocs. Water Res. 1999, 33, 391–400. [Google Scholar] [CrossRef]
- Casey, T.G.; Wentzel, M.C.; Ekama, G.A. Filamentous organism bulking in nutrient removal activated sludge systems. A historical overview of causes and control. Water S. Afr. 1995, 21, 231–238. [Google Scholar]
- Jenkins, D.; Richard, M.G.; Daigger, G.T. Manual on the Causes and Control of Activated Sludge Bulking, Foaming, and Other Solids Separation Problems; CRC Press: Boca Raton, FL, USA, 2003. [Google Scholar]
- Liu, Y.; Shi, H.; Xia, L.; Shi, H.; Shen, T.; Wang, Z.; Wang, G.; Wang, Y. Study of operational conditions of simultaneous nitrification and denitrification in a Carrousel oxidation ditch for domestic wastewater treatment. Bioresour. Technol. 2010, 101, 901–906. [Google Scholar] [CrossRef]
- Hao, X.; Doddema, H.J.; van Groenestijn, J.W. Conditions and mechanisms affecting simultaneous nitrification and denitrification in a Pasveer oxidation ditch. Bioresour. Technol. 1997, 59, 207–215. [Google Scholar] [CrossRef]
- Härtel, L.; Pöpel, H.J. A Dynamic Secondary Clarifier Model including Processes of Sludge Thickening. Water Sci. Technol. 1992, 25, 267–284. [Google Scholar] [CrossRef]
- Koopman, B.; Cadee, K. Prediction of thickening capacity using diluted sludge volume index. Water Res. 1983, 17, 1427–1431. [Google Scholar] [CrossRef]
- Pitman, A.R. Settling of Nutrient Removal Activated Sludges. Water Sci. Technol. 1985, 17, 493–504. [Google Scholar] [CrossRef]
- Uby, L. Handbook of Mixing for Wastewater and Similar Applications; Xylem Water Solutions AB: Sundbyberg, Sweden, 2012. [Google Scholar]
- Xu, D.; Liu, S.; Chen, Q.; Ni, J. Microbial community compositions in different functional zones of Carrousel oxidation ditch system for domestic wastewater treatment. AMB Express 2017, 7, 40. [Google Scholar] [CrossRef] [PubMed] [Green Version]
- Park, H.-D.; Regan, J.; Noguera, D. Molecular analysis of ammonia-oxidizing bacterial populations in aerated-anoxic Orbal processes. Water Sci. Technol. 2002, 46, 273–280. [Google Scholar] [CrossRef] [Green Version]
- Meyer, R.L.; Zeng, R.J.; Giugliano, V.; Blackall, L.L. Challenges for simultaneous nitrification, denitrification, and phosphorus removal in microbial aggregates: Mass transfer limitation and nitrous oxide production. FEMS Microbiol. Ecol. 2005, 52, 329–338. [Google Scholar] [CrossRef] [Green Version]
- Wen, J.; Lechevallier, M.W.; Tao, W. Microbial community similarity and dissimilarity inside and across full-scale activated sludge processes for simultaneous nitrification and denitrification. Water Sci. Technol. 2020, 81, 333–344. [Google Scholar] [CrossRef]
- Xia, Z.; Wang, Q.; She, Z.; Gao, M.; Zhao, Y.; Guo, L.; Jin, C. Nitrogen removal pathway and dynamics of microbial community with the increase of salinity in simultaneous nitrification and denitrification process. Sci. Total Environ. 2019, 697, 134047. [Google Scholar] [CrossRef]
- Applegate, C.S.; Wilder, B.; DeShaw, J.R. Total nitrogen removal in a multichannel oxidation system. J. Water Pollut. Control Fed. 1980, 52, 568–577. [Google Scholar]
- Daigger, G.T.; Littleton, H.X. Characterization of Simultaneous Nutrient Removal in Staged, Closed-Loop Bioreactors. Water Environ. Res. 2000, 72, 330–339. [Google Scholar] [CrossRef]
- Gao, S.-Y.; Peng, Y.-Z.; Wang, S.-Y.; Yan, J. Novel strategy of nitrogen removal from domestic wastewater using pilot Orbal oxidation ditch. J. Environ. Sci. 2006, 18, 833–839. [Google Scholar] [CrossRef]
- WRC. Theory, Design and Operation of Nutrient Removal Activated Sludge Processes; Water Research Commission of South Africa: Pretoria, South Africa, 1984. [Google Scholar]
- Eckenfelder, W.W.; Argaman, Y.; Miller, E. Process selection criteria for the biological treatment of industrial wastewaters. Environ. Prog. 1989, 8, 40–45. [Google Scholar] [CrossRef]
- Shvetsov, V.; Stepanov, S.; Khar’kina, O. Comparison of the calculation results for aeration tanks using the NII VODGEO/SAMGTU and ASM2d models. Vodosnabzhenie Sanitarnaya Tekhnika 2021, 5, 18–29. [Google Scholar] [CrossRef]
Figure 1.
A schematic diagram of the reactor at stage 1.1. A—oxidation ditch; B—settling tank.

Figure 2.
Schematic diagram of the reactor at stage 1.2. A—oxidation ditch, module one; B—oxidation ditch, module two; C—settling tank.
Figure 2.
Schematic diagram of the reactor at stage 1.2. A—oxidation ditch, module one; B—oxidation ditch, module two; C—settling tank.

Figure 3.
Schematic diagram of the reactor at stage 2. A—oxidation ditches; B—settling tanks.

Figure 4.
Schematic diagram of the reactor at stage 3.

Figure 5.
SVI values in stage 1.1.

Figure 6.
SVI values in stage 1.2.

Figure 7.
SVI values in stage 2.

Figure 8.
Lineweaver–Burk plot for rates of nitrification in stages 1.1.1 and 1.1.2.

Figure 9.
Lineweaver–Burk plots for the rate of organic matter removal in stages 1.1.1 and 1.1.2.


Table 1.
Concentrations of synthetic wastewater.
| Parameter | Max. | Min. | Average |
|---|---|---|---|
| COD, mg/L | 215 | 52.8 | 145 |
| BOD5, mg/L | 185 | 35.3 | 138 |
| NH4-N, mg/L | 81.8 | 18.5 | 37 |
| PO4-P, mg/L | 13.5 | 2.8 | 7.2 |
| TSS, mg/L | 194.15 | 89.88 | 115.36 |
| pH | 8.7 | 7.3 | 7.7 |
Table 2.
Real wastewater concentrations.
| Parameter | Max. | Min. | Average |
|---|---|---|---|
| COD, mg/L | 325 | 64.8 | 152 |
| BOD5, mg/L | 211 | 56 | 143 |
| NH4-N, mg/L | 73.5 | 29.6 | 42.8 |
| PO4-P, mg/L | 32.6 | 5.3 | 8.9 |
| TSS, mg/L | 236.4 | 144.31 | 178.89 |
| pH | 8.3 | 7.6 | 7.9 |
Table 3.
Primer nucleotide sequences.
| Target Group or Process | Target Gene | Primer | Primer Sequence (F, R) | Standard Source | Refs |
|---|---|---|---|---|---|
| Bacteria | 16S rRNA | Eub338 Eub518 | ACTCCTACGGGAGGCAGCAG ATTACCGCGGCTGCTGG | Escherichia coli | [38] |
| Archaea | 16S rRNA | 915f 1059r | AGGAA TTGGC GGGGG AGCAC GCCAT GCACC WCCTC T | strain FG-07 Halobacterium salinarum | [42] |
| Nitrification | bacterial amoA | amoA-1F amoA-2R | GGGGTTTCTACTGGTGGT CCCCTCKGSAAAGCCTTCTTC | Soil | [39] |
| archaeal amoA | Arch-amoAF Arch-amoAR | GCTCTAATTATGACAGTATAC AYCATGTTGAAYAATGGTAATGAC | - | [43] | |
| Denitrification | nirK | nirK876 nirK1040 | ATY GGC GGV CAY GGC GA GCC TCG ATC AGR TTR TGG TT | Sinorhizobium meliloti | [39] |
| nirS | cd3af R3cd | GTSAACGTSAAGGARACSGG GASTTCGGRTGSGTCTTGA | Pseudomonas sp. | [40] |
Table 4.
The operational parameters of the lab-scale reactors.
| Stage | Lab-Scale Reactor | Operational Modes |
|---|---|---|
| 1.1.1 | Lab-scale reactor operating in the mode close to the conditions of ideal mixing with discernible longitudinal mixing (synthetic wastewater). | DO—6–7 mg/L; horizontal flow velocity—0.02 m/s |
| 1.1.2 | DO—1.5–2.0 mg/L; horizontal flow velocity—0.2 m/s | |
| 1.2.1 | Lab-scale reactor operating in the mode close to the conditions of ideal mixing with discernible longitudinal mixing. Consists of two modules capable of operating in various oxygen modes under the conditions of intensive longitudinal mixing (synthetic wastewater). | DO—the first zone: 0.1 mg/L, the second zone: 1.8 mg/L, average concentration—0.95 mg/L; horizontal flow velocity—0.15 m/s |
| 1.2.2 | DO—the first zone: 0.5 mg/L, the second zone: 0.8 mg/L, average concentration—0.65 mg/L; horizontal flow velocity—0.15 m/s | |
| 1.2.3 | DO—the first zone: 0.35 mg/L, the second zone: 0.35 mg/L, average concentration—0.35 mg/L; horizontal flow velocity—0.2 m/s | |
| 1.2.4 | DO—the first zone: 0.5 mg/L, the second zone: 0.5 mg/L, average concentration—0.5 mg/L; horizontal flow velocity—0.2 m/s | |
| 2.1 | Laboratory reactor with mechanical aeration and a flow circulation system. There are no dedicated oxygen zones. Observation of the SND process (synthetic wastewater). | DO—average concentration—1.00 mg/l; horizontal flow velocity—0.2 m/s; BOD specific load—0.41 g/g/d; HRT—6.5 h |
| 2.2 | DO—average concentration—0.75 mg/l; horizontal flow velocity—0.2 m/s; BOD specific load—0.29 g/g/d; HRT—7 h | |
| 2.3 | DO—average concentration—0.50 mg/l; horizontal flow velocity—0.3 m/s; BOD specific load—0.23 g/g/d; HRT—10 h | |
| 2.4 | DO—average concentration—0.35 mg/l; horizontal flow velocity—0.3 m/s; BOD specific load—0.13 g/g/d; HRT—12 h | |
| 3.1 | Laboratory reactor with dedicated oxygen zones along the length of the channel. The dissolved oxygen concentration gradient is determined by the oxygen consumption along the channel. Mixing and aeration are combined. The unit has a built-in secondary clarifier (real wastewater). | DO—the first zone: 2.5 mg/L, the second zone: 1.3 mg/L, average concentration—1.9 mg/L; horizontal flow velocity—0.2 m/s; internal recirculation rate—250% |
| 3.2 | DO—the first zone: 1.9 mg/L, the second zone: 0.15 mg/L, average concentration—1.03 mg/L; horizontal flow velocity—0.25 m/s; internal recirculation rate—350% |
Table 5.
Average sizes of floccules.
| Stage | Average Sizes of Floccules by the Equivalent Diameter, μm |
|---|---|
| 1.1 | 78 |
| 1.2.2 | 115 |
| 1.2.4 | 168 |
| 2.2 | 104 |
| 2.3 | 244 |
| 3.1 | 369 |
| 3.2 | 452 |
Table 6.
PCR test samples.
| Sample | Stage |
|---|---|
| 1 | 1.2.1 |
| 2 | 1.2.2 |
| 3 | 1.2.3 |
| 4 | 1.2.4 |
| 5 | 2.1 |
| 6 | 2.2 |
| 7 | 2.3 |
| 8 | 2.4 |
| 9 | 3 |
| 10 | Full-scale WWTP (control comparison) |
Table 7.
The efficiency of wastewater treatment in each of the stages.
| Stage | BOD | NH4-N | NO2-N | NO3-N | ENSND | PO4-P | |||
|---|---|---|---|---|---|---|---|---|---|
| Efficiency, % | Min., mg/L | Efficiency, % | Min., mg/L | Min., mg/L | Min., mg/L | Efficiency, % | Efficiency, % | Min., mg/L | |
| 1.1.1 | 97.8 | 2.8 | 98.5 | 0.26 | 0.05 | 6.4 | 21.3 | - | - |
| 1.1.2 | 96.9 | 6.9 | 92.9 | 0.78 | 0.04 | 5.1 | 49.5 | - | - |
| 1.2.2 | 98.0 | 2.5 | 99.5 | 0.31 | 0.05 | 35.0 | 69.7 | 35.9 | 9.2 |
| 1.2.4 | 97.8 | 2.1 | 98.1 | 0.26 | 0.07 | 25.6 | 77.5 | 37.2 | 7.8 |
| 2.2 | 97.8 | 1.2 | 97.6 | 0.85 | 0.01 | 17.7 | 37.8 | 6.9 | 12.1 |
| 2.3 | 98.0 | 1.3 | 96.9 | 0.58 | 0.01 | 11.7 | 63.1 | 23.8 | 8.2 |
| 3.1 | 96.4 | 4.1 | 97.2 | 0.21 | 0.02 | 17.7 | 29.5 | 23.6 | 8.3 |
| 3.2 | 97.8 | 2.2 | 98.9 | 0.37 | 0.03 | 8.4 | 69.4 | 36.3 | 7.8 |
Table 8.
A comparison of ENSND and RNSND rates among different OD studies [36].
Table 8.
A comparison of ENSND and RNSND rates among different OD studies [36].
| Refs | Organic Loading Rate, g/g/d | DO, mg/L | HRT, h | ENSND, % | RNSND, mg/L/h |
|---|---|---|---|---|---|
| [17] | 0.04 | 0.1–0.5 | 20.5 | 75.7 | 1.19 |
| [17] | 0.11 | 0.1–0.5 | 17.2 | 97.6 | 1.42 |
| [48] | 0.02–0.21 | >1.0 | 60.0 | 45 | 1.58 |
| [58] | 0.03 | 0.1 | 33.1 | 76 | 0.56 |
| [59] | 0.05 | <0.1 | 35.9 | 90.5 | 0.41 |
| [56] | - | Near 0 | 30–43 | 97.9 | 0.39 |
| [60] | 0.06 | 0.1 | 16.5 | 72.1 | 3.63 |
| [36] | 0.26 | 0.2 | 10.5 | 74.9 | 5.91 |
| This study | 0.23 | Near 1.0 | 12.0 | 69.4 | 1.59 |
Table 9.
Michaelis constant Km and maximum reaction rates Vmax for rates of nitrification and organic matter removal.
Table 9.
Michaelis constant Km and maximum reaction rates Vmax for rates of nitrification and organic matter removal.
| Stage | Organic Matter Removal | Nitrification | Nitrification Rate, mg/L/h | Nitrate Formation Rate, mg/L/h | Specific Denitrification Rate, mg/g/h | ||
|---|---|---|---|---|---|---|---|
| Vmax | KM | Vmax | KM | ||||
| 1.1.1 | 35.46 | 19.23 | 4.35 | 0.03 | 8.15 | 7.91 | 6.15 |
| 1.1.2 | 20.61 | 7.2 | 6.03 | 0.35 | 6.51 | 6.66 | 8.56 |
| 1.2.2 | 35.71 | 3.64 | 5.03 | 0.08 | 9.15 | 9.11 | 8.51 |
| 1.2.4 | 30.67 | 2.53 | 4.58 | 0.04 | 8.62 | 8.73 | 9.28 |
| 2.2 | 33.44 | 2.87 | 5.63 | 0.23 | 8.99 | 8.76 | 11.12 |
| 2.3 | 14.35 | 0.61 | 4.76 | 0.08 | 8.15 | 7.91 | 6.15 |
| 3.1 | 33.90 | 8.98 | 4.22 | 0.02 | 7.53 | 7.62 | 8.98 |
| 3.2 | 27.17 | 6.29 | 4.44 | 0.04 | 9.15 | 9.11 | 8.51 |
Publisher’s Note: MDPI stays neutral with regard to jurisdictional claims in published maps and institutional affiliations. |
© 2021 by the authors. Licensee MDPI, Basel, Switzerland. This article is an open access article distributed under the terms and conditions of the Creative Commons Attribution (CC BY) license (https://creativecommons.org/licenses/by/4.0/).
Share and Cite
MDPI and ACS Style
Gogina, E.; Gulshin, I. Characteristics of Low-Oxygen Oxidation Ditch with Improved Nitrogen Removal. Water 2021, 13, 3603. https://doi.org/10.3390/w13243603
AMA Style
Gogina E, Gulshin I. Characteristics of Low-Oxygen Oxidation Ditch with Improved Nitrogen Removal. Water. 2021; 13(24):3603. https://doi.org/10.3390/w13243603
Chicago/Turabian StyleGogina, Elena, and Igor Gulshin. 2021. "Characteristics of Low-Oxygen Oxidation Ditch with Improved Nitrogen Removal" Water 13, no. 24: 3603. https://doi.org/10.3390/w13243603
Note that from the first issue of 2016, this journal uses article numbers instead of page numbers. See further details here.