
Scour at Bridge Piers Protected by the Riprap Sloping Structure: A Review


Department of Hydroscience and Engineering, Faculty of Civil Engineering, University of Zagreb, 10000 Zagreb, Croatia
*
Author to whom correspondence should be addressed.
Water 2021, 13(24), 3606; https://doi.org/10.3390/w13243606
Submission received: 17 November 2021
/
Revised: 7 December 2021
/
Accepted: 13 December 2021
/
Published: 15 December 2021
(This article belongs to the Special Issue Flow Hydrodynamic in Open Channels: Interaction with Natural or Man-Made Structures)
Abstract
:Bridge piers on large rivers are often protected from scouring using launchable stone, such as a riprap sloping structure. While such scour countermeasures are effective for pier protection, they significantly alter flow conditions in the bridge opening by overtopping flow and flow contraction, deflecting the formation of the scour hole downstream and exposing the downstream riverbed to additional scour. This paper provides a comprehensive and relevant review of bridge scour estimation methods for piers with a riprap sloping structure installed as a scour countermeasure. Research on empirical methods for bridge scour estimation is reviewed and analyzed with formulae used for comparable structures—complex pier formulae and formulae for river training structures. A summary of relevant formulae applicable to piers with installed scour countermeasures is provided, as well as a discussion on the possible future research directions that could contribute to the field.
1. Introduction
The majority of bridges have been built to provide an effective connection between the banks over the waterways, impacting society both economically and politically, and at the same time interacting with the waterway flow regime [1]. During the lifespan of the bridge crossing rivers, changes in the flow and sediment regime are anticipated, as well as consequent change in the variable action-imposed loads on the structure [2], or even complete undermining of the foundation soil [3], which can result in bridge failure or even collapse. Economic losses resulting from traffic disruption following the bridge failure exceed its construction value [4], making bridges critical infrastructure assets [5].
The bridge failures data recorded world-wide indicate that hydraulic causes (scour, floods, stream instability, lateral migration and floating debris) are prevailing among the factors causing bridge collapses: Imhof [6] reports that flooding/scour was the most frequent natural hazard (66%) causing bridge failure in Europe and North America; Muñoz Diaz et al. reported scour as causing 35% of bridge failures in Columbia, with an additional 7% failing from overtopping/floods; Schaap and Caner [7] reported 45% of failures in Turkey were hydraulic-caused, and 22% were directly caused by scour; available data for United States suggests that hydraulic-caused failures account for >50% of the collapses, and scour >20% [8,9,10,11]. Common materials used for construction of bridges are concrete/reinforced concrete or steel, with a 75-year design life in service [12]. According to the US bridge failure data, the majority of failed bridges are steel bridges (>60%), although their portion in the National Bridge Inventory is significantly smaller than the concrete ones, at 30% compared with 65%, respectively [13]. The average age of the bridges at the time of the failure was 64 years, and <50 years for steel and concrete material types, respectively.
Among the various types of erosion processes that occur in the riverine environment, the ones influencing bridges are generally divided into long-term general scour, contraction scour and local scour [14], acting independently or in combination with other hydraulic causes. Bridge piers obstruct the flow, forcing it to accelerate around the pier and generate large-scale turbulence structures, consequently increasing the turbulence in the flow downward towards the bed (horseshoe vortex) and flow downstream behind the pier (wake vortex) [15], causing local scouring. Therefore, local scour is inherently associated with the hydraulic structures interfering with the natural flow field [16] and its occurrence is often simultaneous with on one (or both) of other two types of scour, causing deepening of the entire riverbed in the vicinity of piers and abutments.
Bridge piers can be protected from scouring by either indirect or direct methods [17]. Indirect methods, such as collars [18], vanes [19], sacrificial piers [20], or self-protected piers with openings within the pier [21], change the flow pattern around the bridge pier and thus reduce the strength of downflow and horseshoe vortex [22]. Direct methods (riprap, geobags, cable-tied blocks or similar launchable material) increase the riverbed resistance in order to withstand the turbulent flow around the piers [23]. They are less expensive and easier to construct in comparison to indirect methods [24], and flexible which allows them to be retrofitted if necessary. The most common bed-armoring protection against scour is riprap [25], which consists of a material larger and heavier than riverbed sediment with the main purpose of preventing removal of the riverbed sediment downstream [26]. There are several types of riprap countermeasures: horizontal riprap layer [17] placed just above the riverbed level, riprap sloping structure [27] formed by stones conically mounded around the pier, gabion mattresses [28], sacks filled with stones [29], etc. Although riprap is considered stable, there is evidence of riverbed particle erosion during floods and consequent riprap slumping and sliding. Breusers et al. [30] pointed out that riprap protection can also induce scour, thus not fully fulfilling its purpose. Nielsen et al. [31] investigated the velocity distribution and critical bed shear stress under the riprap protection. Fredsoe et al. [25] described the horseshoe vortex as the primary mechanism that causes undermining the stones at the junction between the riprap and the riverbed. This way, riprap protection causes formation of the deflected scour hole next to the riprap scour protection, introducing hazard to the pier or adjacent river structures [32].
Scouring locally deepens the riverbed next to bridge piers, exposing a larger area of the pier to direct oncoming flow, thus subjecting them to greater hydrodynamic forces in comparison to nonscoured conditions [33]. Changes in hydrodynamic loading coinciding with other natural hazards, e.g., earthquakes, can have devastating consequences for both infrastructure and society [34]. Morphodynamic analysis of the river reach influencing the bridge is integrated into the bridge management system [35] in order to log changes developed since the historical reports and assess the current condition of the riverbed. Riverbed condition assessment is not unified—each county has adapted inspection procedures to the diversity of their infrastructure, respecting viable methods and instruments for gathering relevant and reliable data [36].
Scour holes reach their maximum depth during floods [37], after which they are backfilled by the bedload of the receding flow, reducing the apparent scour depth [33,38,39,40]. Most research in recent decades has focused on describing scour depth based on maximum equilibrium scour depth and for steady flow conditions [41,42]. Morphodynamic changes in the riverbed and consequently the scour process around bridge structures, when considered on a larger spatial scale, are not only caused by anthropogenic changes in the watershed, but also by changes in the natural flood regime and extreme climatic events such as floods, that affect the overall stability of bridge structures. Therefore, bathymetric data acquired post-flood are not reliable enough to determine the full extent of scouring, and analyses based on such data can lead to erroneous estimates of bridge safety. Real-time monitoring of scour development during floods is recognized as essential [43] to enable safety monitoring and systematic inspection of the riverbed condition and avoid unnecessary maintenance. Some of the monitoring equipment used for scour detection are magnetic sliding collars [44], sonar devices [45], float-out devices [46] or tilt sensors [47]. The current scour-monitoring systems are being constantly enhanced through development of advanced monitoring techniques, mainly to achieve more robust devices, reduce maintenance cost and enable integration with other sensors. Recent advances in scour monitoring include assessment based on vehicle-induced vibrations measured by acceleration sensors [48], influence of soil characteristics on the change in the predominant natural frequency of a bridge pier [49], scour depth measurement using vibration-based micro-electro-mechanical systems [50], instrumented particles [51], interferometric synthetic aperture radar stacking techniques [52], amongst others.
Regardless of the data acquirement method, in order to complete the risk assessment for preliminary hazard analysis in the bridge management system, hydraulic analysis must be performed. Hydraulic analysis will combine the scour data with other relevant variables: flow environment, pier geometry and riverbed composition, to quantify the scour hazard in comparison to foundation depth. Flow velocity, flow constriction and scour protection measures are the most important factors that should be considered when assessing scour risk to bridges [53]. For this purpose, empirical formulae are mostly used that calculate the maximum scour depth, taking into account all relevant variables as input. These empirical formulae are reliable if their usage adheres to conditions under which they were developed and validated on field-measured data, if possible.
Previous studies have focused on the scour development for a wide range of pier geometries, arrangements and spacing, riverbed compositions, sediment transport conditions, etc. However, there exists an evident gap in knowledge regarding the scour occurring at piers protected with riprap sloping structure and associated scour at the periphery of the riprap mound. The aim of this paper is to provide a comprehensive and relevant review of bridge scour estimation methods and provide discussion of their applicability for piers with riprap sloping structure installed as a scour countermeasure. Research on empirical methods for bridge scour estimation is reviewed and compared to complex pier formulae and formulae for river training structures similar to riprap sloping structure scour protection. Scour formulae in this paper are categorized considering the following: the data used for their development (field vs. experimental); pier geometry (single vs. complex piers); scour type (local vs. contraction), and riprap type (riprap sloping structure vs. layer riprap). A summary of relevant formulae applicable for piers with installed scour countermeasures is provided, as well as a discussion on the possible future research directions.
2. Bridge Scour Assessment
Most often, the approach for developing a scour depth formula is the application of dimensional analysis technique to an experimental dataset. The overall formula is assessed by validation with field-measured data and incorporation of one of the mathematical fitting models. Dataset for establishing formula can be obtained in the field and experimental environment.
2.1. Field and Experimental Data
Compared to the field data, the experimental data obtained in the laboratory provide a controlled flow environment, which is why the maturity of the scour hole is reliable only from the laboratory experiments [54]. However, the experimentally developed formulae have numerous disadvantages: a limited applicability in a range of input data due to scaling issues between geometric and sediment scales; oversimplified conditions that do not correspond to the field conditions (rectangular flume, uniform sediment gradation, clear-water conditions, and steady uniform flow), and time-consuming simulations to acquire the desired dataset. Time to reach equilibrium scour depth condition is reached asymptotically, so duration of the experimental test needs to be much more than at least 48 h to reach at least 90% of the equilibrium [55,56]. Melville and Chiew [43] define a formula for time needed for development of the equilibrium scour hole as s rate of 5% of the pier diameter in a 24 h period, which means that based on first 24 h-long experiment duration, equilibrium scour depth can be calculated. Their results showed that after 10% of the total time, scour depth is in the range of 50% to 80% of the equilibrium scour depth. To shorten time-consuming simulations, some authors accept semiequilibrium conditions, so each experiment lasted 4 to 6 h, and subsequently extend the scour depth values to 100% of the equilibrium scour depths.
Sheppard and Melville [55] noticed why scour depths are overestimated in small-scale experiments—because the forces of the pressure gradients on sediment particles near the smaller bridge piers are much greater than for larger piers. A similar observation was made by Huang et al. [57] in a scale effects study, where a comparison of results from a large-scale numerical model and a small-scale physical model was conducted. They found better prediction of turbulence flow pattern and sediment scour by the numerical model in comparison to the physical model, because the physical model introduces Froude similarity and ignores the effect of turbulent Reynolds number.
The numerical model or computational fluid dynamic (CFD) model is powerful tool to simulate interaction between the sediment transport process and the vortex system in the complex geometry environment. In contrast to time-consuming laboratory experiments and field investigations, numerical simulations are inexpensive and fast way to collect a large and comprehensive amount of the essential scour data. Numerous turbulent models have been already developed to calculate turbulent velocity and sediment scour (, , LES, RSM, RNG and others). For example, Aly and Dougherty [58] examined different turbulence models in predicting the bed shear stress around different pier scour countermeasures. They concluded that performed better than the model in approximating the experimental data, since simulates adverse pressure gradients, while the realizable model successfully simulates velocity components. Alemi et al. [59] used the LES turbulence model to investigate the flow around a complex bridge pier on the scoured fixed bed. They validated the numerical model based on laboratory experiments by Graf and Istiarto [60] and achieved high correspondence with their results. By combining LES and wall function, a fast simulation process is achieved since the wall function simplifies fully developed flow with zero velocity near the wall region. Developing a scour numerical model can be challenging due to establishing mesh on complex riverbed geometry, which changes gradually as scour occurs. Once the computational grid is established, the flow field will scour the bed form from the first timestep, and the computational domain needs to be re-meshed. Zhu and Liu [61] presented three re-meshing strategies: -level grid, shaved grid, and grid. Jalal and Hassan [62] examined various types and sizes of cells to identify optimum cell (5–10 mm) that balances the accuracy of results and reduction in computation time. Song et al. [63] developed a 3D scour model, ibScourFoam, based on an immersed boundary method, validated against available data from the literature and their own flume experiment. Their model showed advantage over previous scour models in accurate simulation of the scour process around complex structures.
Experimental and numerical data must be validated by field data to ensure the reliability of experimental results [64]. Field measurements of hydraulic parameters during a flood are essential to understand the morphodynamic evolution of the local scour phenomenon. Despite today’s sophisticated survey techniques, it is not easy to accurately measure velocity and depth during floods in real-time due to instrument functionality under oscillating flow depths and instrument durability, as it is exposed to impact damage by floating debris. Scour monitoring is challenging from the perspective of instrument placement, where approximate location of the scour hole needs to be known. Surveying implies collecting data at a certain point in time, which means that the maturity of the local scour hole is unknown at the time of measurement. In addition to the difficulty of obtaining accurate scour depth data, the flow field upstream and downstream of the bridge pier must also be collected. Maneuvering a boat during a flood is difficult and hazardous in vicinity of the structures. Moreover, there are some difficulties in estimation of bed material size which used to be highly variable on site, and inaccuracy due to neglecting scour-hole backfilling effect [65].
For these reasons, in the present state-of-the-art data from field surveys are limited and do not encompass a sufficient range of hydraulic properties and characteristics of the river channel to represent a solid basis for high-quality research. Therefore, most of the local scour formulae have been developed based on laboratory experiments [14,22,30,66,67]. Yet, there are several empirical formulae developed from field data only. Governing parameters for scour depth () formula developed from field data are width of bridge pier (), water depth () and Froude number () at the approach section and correction factor for pier-nose shape () as presented in Table 1.
Many authors have expressed concern about the lack of information available in the published studies regarding the source of dataset used to develop the empirical formulae [55,59,71] and insufficient information about the conditions that were present during the measurements. For example, there is no information on the methods that Zhuravlyov [72] used to obtain the data, neither the dimensions of the structures nor their shapes, and a field survey by Froehlich [68] does not contain a sediment gradation parameter.
2.2. Variables Governing the Scour Process
Numerous studies have aimed to evaluate the accuracy of the relevant formulae for scour depth estimation [73,74,75,76,77]. These comparative studies generally summarize that most existing formulae tend to overestimate the scour depth equilibrium. However, evaluating reliability of scour formulae must be done with caution because single variables within each scour depth formula may be defined with several curves, which implies dependency of a third variable [73].
Scour can be greatly affected by sediment size distribution which can be uniform or nonuniform. Initial movement of smaller particle sizes could be achieved at lower velocities, so scour may occur more readily in sandy riverbeds than in coarser sediment material [58]. For nonuniform sediment environments bed armoring occurs where the coarser gravel size protects finer particles from being transported by the flow. Pandey et al. [78] emphasize that the influence of the armored layer regarding local scour is poorly investigated because sediment transport in the armored riverbed is generally challenging to explicitly define. However, the authors analyzed how the formation of the armored layer in the scour hole stops further scouring processes during clear-water conditions. They proposed a new graphical approach for estimating maximum scour depth in an armor riverbed, showing that changes in dimensionless scour depth () with armor ratio () are minor when it exceeds 0.5, where is the median diameter of armor layer is median sediment size.
Most of scour formulae differentiate clear-water or live-bed conditions respective to bedload sediment transport: under clear-water conditions no bedload transport is present, while live-bed condition considers initiated sediment bedload transport. Landers and Mueller [73] evaluated the scour formulae by Gao et al. [69], comparing them to field measurements, and concluded that there was underprediction in deeper live-bed scour conditions (for > 3 mm). On the contrary, the HEC-18 [41] formula overestimates scour depth under live-bed conditions, especially for greater flow intensities, while it shows good agreement with clear-water threshold scour [79]. Scour depth at the clear-water scour is considered to be 10% greater than the scour depth in live-bed conditions [58], but that finding is based on small-scale models. However, recent studies have shown that the reverse phenomena may occur in the field or in large-scale numerical models [79]. Sheppard and Melville [55] assembled field and experimental datasets of scour data from different authors in the literature and eliminated unreasonable ones by quality control screening, where 441 are experimental and 791 are field data. These data were used to test the accuracy of different scour formulae. The best performance showed the new Sheppard–Melville formula which was originated from modification of Sheppard and Miller’s [67] and Melville’s formulae [80]. Hereafter, Yang et al. [81] proposed a modified Sheppard–Melville formula regarding the influence of flow shallowness ratio (), where is pier diameter. They prove the considerable influence of flow shallowness ratio scour on scour depth, which increases with an increasing (). Although modified the Sheppard–Melville formula still retains a small level of overestimation, Yang et al. demonstrate better accuracy of the formula than the HEC-18 formula. Overestimation is greater with smaller shallowness () ratio. Yang et al. collected live-bed field data during short-peak flood waves and concluded that live-bed scour peak may exceed the threshold peak.
Changes in the natural flow regime of a river can be defined in terms of ecological [82] and morphological processes [83], by magnitude, frequency, timing, duration, and unsteadiness. In contrast to engineering design practice, where typical flood events with a return period of 100 or 200 years are chosen to account for the scour susceptibility of bridges [84], Tubaldi et al. [85] propose a more rigorous assessment of scour susceptibility, that examines not only a single flood event but also subsequent events, as floods of short duration or low intensity can lead to partial erosion of the riverbed, making it easier for a subsequent flood to reach a maximum scour depth. Therefore, although the flow magnitude is the main factor influencing scour depth development, hydrograph duration and shape also have an important influence on the scour process and should be taken into account. The maximum scour depth is significantly lower when actual hydrograph shape is considered than the equilibrium scour depth for the constant flow rate. According to Plumb et al. [83], the effects of hydrograph shape, addressing the number of cycled hydrographs and duration of each hydrograph, as well as changes in the flow regime, should be examined in the scour development analysis. In addition, the inclusion of more complex sediment grain size distributions in the estimation of scour next to the bridges, along with the hydrograph shape parameters, results in a potentially higher threshold for bed motion state, complicating the prediction of instantaneous flux using formulae for steady-flow conditions [86,87]. Some empirical formulae have been developed for evaluation of time-dependent scour depth, i.e., considering hydrograph shape characteristics [43,88]. However, these formulae were mostly developed for steady-state flow conditions or adapted to unsteady conditions using various approaches, such as superposition of the hydrograph as a sequence of steady-state discharge steps [89,90,91], introducing a mathematical function for form of the hydrograph [92], or defining a dimensionless effective flow [93,94]. Apart from the fact that real-time field measurements are rarely available at high turbidity during a flood, the main challenge in studying the effects of flow characteristics, i.e., unsteady flow characteristics and the influence of multiple flood waves [95] on bedload transport and the scour process, is to separate the effects of flow conditions from the effects of bed material properties and sediment supply conditions [96]. It can be concluded that in future research it is necessary to investigate the effects on the development of maximum scour depth not only during a single flood event and the associated flood wave characteristics, but also previous flood events should be considered. Particular attention should be paid to the development of formulae and field measurement techniques that would allow the determination and measurement of the temporal evolution of scour depth.
2.3. Local Scour Formulae for Complex Piers
Many studies of local scour formulae refer to the single pier formula [30,70,97] which is a function of pier width (), flow depth (), Froude number (), critical flow velocity (), and sediment bed size (). Sometimes the formulae are expanded to include the shape pier factor (), the angle of flow attack () (if the pier is skewed), or the sediment characteristic () [98,99] and generally the formula can be written as follows:
Physical, economic, and geotechnical considerations usually indicate the need for bridge piers to be constructed with a column founded on a pile group with a pile cap or on a caisson, so-called complex piers [100]. The process of scour development at complex piers differs from that on uniform piers because lee-wake vortices dominate sediment transport, whereas on uniform piers horseshoe vortex has governing influence on scouring [101]. In recent decades, a number of studies on scouring around complex bridge piers have been conducted. Melville and Raudkivi [102] proposed an approach to calculate the scour around complex piers composed of a cylindrical pier (with diameter ) and of a foundation (with diameter and with the top elevation ). In their study, an alternative approach using the effective diameter () is employed. Effective diameter represents a diameter of a circular pile that induces the same scour depth as the scour depth at the complex pier. Melville and Raudkivi [102] examined the influence of effective diameter concept and proposed following formula:
Finally, Melville and Raudkivi’s scour depth formula for complex piers introduces three scour zones dependent of the top of the foundation elevation, as presented in Table 2.
Even though using the equivalent single pier simplification shortens the computational time considering the complex flow field and turbulence around the pier, Melville and Raudkivi [102] showed that it could lead to conservative estimates of scour depth.
One of the most commonly used [65,75,103,104] scour formulae is the HEC-18 formula, developed by the Federal Highway Administration (FHWA) [41]. To account for the effects of foundation geometry on scour depth, the superposition of scour components is proposed. In this method, each pier component is calculated separately and superimposed on the total scour depth, as follows:
Afterwards, Coleman [105] expanded scour estimation of complex piers (comprising column, pile cap and pile group) into the five following cases dependent of the top of the foundation elevation: (I) buried pile cap; (II) pile cap at the bed level of the scour hole with no exposure of the pile group; (III) pile cap and pile group extending over the base of the scour hole while water level is above the pile cap; (IV) pile cap and pile group extending over the base of the scour hole while water level is at the top of the pile cap; and (V) pile cap and pile group extending over the base of the scour hole while water level is below the pile cap. Coleman also provides formulae for equivalent pier diameter () based on variation of the pile cap elevation () relative to the bed level (Table 3.):
A similar study by Sheppard and Glasser [66] resulted in a detailed iterative procedure for determining effective diameter for the geometry case where the top of the pile cap is above the bed level with no exposure of the pile group—equivalent to the piers founded on the exposed caisson. The outlined procedure was developed in clear-water and live-bed conditions, whereas effective diameter is a function of the shapes, locations, and orientations of each pier component, and as a function of the sediment and flow properties (Table 4).
Furthermore, Jannaty et al. [77] conducted an investigation to determine the cause of the Adinan complex bridge failure. They examined the performance of several formulae and demonstrated substantial distinction between calculated and measured scour depth values. Several stages of scouring can be noticed in their study: (I) if the bottom of scour hole is above the up edge of the pile cap, the pile cap has a protective effect against scour; (II) if the bottom of scour hole is between the up and the down edge of the pile cap, the column is the prominent component to produce scour; (III) if the scour hole induced by the column reaches the down edge of the pile cap, the pile cap will play the most important role in scouring. Analysis of results show that the cause of Adinan Bridge failure is the large width of the foundation in comparison to the column width. Additionally, scouring was intensified due to lot of accumulated debris. Based on study by Jannaty et al., it can be concluded that scour depth increases if obstruction area (either foundation or debris) increases. This leads us to the conclusion that in estimating scour depth, the component of flow area reduction should be considered in addition to local scour. Similarly, Yang et al. [106] found that for complex bridge piers in close proximity, the upstream pier significantly affects scouring at the downstream pier in comparison to individual piers, reducing scour rate for clear-water conditions and increasing the bedform celerity for live-bed conditions.
2.4. Contraction Scour Formulae
One of the first contraction scour formulae was presented by Laursen and Toch [107]. They evolve Straub’s contraction scour for the long contractions to the local scour at the pier. The formula is valid for bridges where the spacing between the piers is much larger than the piers’ width (for contraction of cross-section approximately 10%). The effect of contraction scour will become present when scour depth achieves a value that corresponds to scour depth which would occur in a long contraction, or when scour holes from adjacent piers overlap. The formula is as follows:
where is width ratio of the contracted to the uncontracted profile. Briaud et al. [108] verified contraction scour data using previous experimental results, employed a new parameter , that presents averaged velocity at the contracted section, and provided the following formula:
Furthermore, one of the most commonly used contraction scour formulae is HEC-18 [109], that assumes contraction scour as a long contraction, where the length of the contracted section is longer than the section width. The HEC-18 contraction scour formula is developed as a part of total scour formula, which presents superposition of both separately calculated processes. The formula contains flow, bottom channel width, and Manning’s roughness coefficient ratios as provided below:
Like many other contraction scour formulae in the literature, HEC-18 also overestimates the scour depth [75,110]. One of the possible reasons for that inaccuracy could be neglecting the possible dependence of local and contraction scour [65].
Recently, several researchers have observed uncertainty in the scour formulae due to the interaction of contraction and local pier scour estimation. Hong [110] conducted laboratory experiments comparing the bridge cross-section with piers and abutments with the cross-section without piers. The results demonstrate that the model without piers has 25% greater scour depth. A decrease in contraction scour depth implies possible interactions between local scour and contraction scour processes. Contraction scour development requires a longer time to reach equilibrium than local scour, as well as a possible consequence of local and contraction scour dependance. Additionally, experimental results of contraction scour depth were compared to the values obtained by Laursen’s formula and results shows overestimation of Laursen’s formula results of about 30–60%. Recently, Saha et al. [104] carried out laboratory experiments in the presence of flow contraction and compared results with reference local scour depth data obtained by new theoretical method developed from a combination of HEC-18 and M-S formulae. Additional contraction scour estimation showed that the discharge contraction ratio has a great influence on the contraction effect on the total scour depth, where the cross-section at the upstream face of bridge is labeled with number 2 and approach section with number 1. However, their experiments were only conducted under clear-water conditions, and the nonuniform sediment size is neglected. Mueller and Wagner [64] emphasize that long-term in situ measurements are essential to separate local scour from contraction to identify reference bed elevation. They suggested that long-term scour in the uncontracted section can be determined by adding the general slope of the line to eliminate general aggradation or degradation. Afterwards, short-term scour determination should be performed by comparing the uncontracted and contracted cross-sections in the preflood and flood conditions.
3. Riprap Sloping Structure
When riprap is selected as a scour countermeasure, it is usually placed flushed with the riverbed level if flow conditions are favorable for detailed installation, or as a riprap sloping structure when flow conditions do not allow fine maneuvering of the machinery.
Some authors consider layer riprap as a more suitable protection than a riprap sloping structure [26,30,107] because of excessive exposure of the sloping structure that induces unwanted contraction. Recommended placement of the layer riprap depends on the hydraulic environment and sediment transport, i.e., the occurrence of bedforms. Riprap should be placed deep enough so it does not protrude above the bed level and disturb the flow. Installation in rivers with significant amounts of bedload should be buried below the estimated through of the dunes occurring during floods [10]. The number of studies in the literature describing layer riprap and its failure mechanisms is higher than that of riprap sloping structures, which have been rarely investigated. Generally, hydraulic processes that occur downstream of the riprap sloping structure and its consequences are ambiguous—flow obstruction, debris accumulation and scouring at the periphery of the riprap mound. Since there is no such research about estimating scouring around the riprap sloping structure, an analogy with complex piers can be drawn. Contours of the piers protected with riprap sloping structure (pier + riprap) are similar to the contours of complex piers (pier + caisson), as can be seen in Figure 1.
If analogy between the riprap sloping structure shape and complex piers geometry is considered valid, then the scour formulae applicable for the riprap sloping structure also have to be case-specific depending on the top elevation of the riprap, similar to the scour formulae for complex piers that are distinguished depending on the caisson submergence [66,77,102,105]. According to Melville [111], there are three cases for scour around complex piers: case I—where the top of the caisson foundation is below general bed level; case II—where the top of the caisson foundation is above general bed level; case III—where the top of the caisson foundation is above the water surface, as depicted by Figure 2.
Melville [111] and Ghorbani [112] draw further conclusions: if the top of the caisson (or riprap sloping structure) is exposed above general bed level, the scour depth is increased; if the overflow above the top of the pile cap (crest of the riprap) is less shallow, the scour depth is increased. The riprap sloping structure is a wide structure, in terms of reducing the flow area, so conclusions about wide piers might be comparable. Yang et al. [81] stated that the downflow in front of the wider piers () is weakened, as well as there being horseshoe vortex. Thus, wake vortices consequently remain the main turbulence structures that produce scour hole, the maximum of which will occur at side of the pier.
The design of riprap considers calculating the size of riprap stone that can withstand flow attack. One of the first formulae for riprap sizing was developed by Izbash [113]:
As can be seen from previous formula, water depth (), Froude number (), and specific gravity of riprap () were governing parameters in riprap sizing formulae [30,114,115], until Parola [116] introduced new characteristic factors. Factors are proportional to the size of the riprap stones () and related to pier geometry—pier shape () and pier width (). Subsequently, several formulae with pier characteristic factors were developed [46,117]. Furthermore, Froehlich [118] compared the range of riprap sizes obtained by formulae from different authors, and came out with conclusion of quite a wide range of results, and therefore proposed a new formula for calculating minimum diameter of loose rock riprap, introducing new parameters that introduce crossflow shear (), transverse pier spacing factor () and approach flow influence () as follows:
Besides riprap sizing, the design of the riprap sloping structure stability includes calculating an appropriate slope to prevent the riprap stones from sliding into the scour hole, considering protection at the toe due to undermining, and determining the riprap stone diameter to resist the hydrodynamic force of the flow. For riprap side slope, Park et al. [27] used the U.S. Army Corps of Engineering (USACE) method for calculating riprap size as follows:
which was developed primarily for bank and channel protection. Parameter represents particle diameter, corresponding to a 30% finer grain-size of the granulometric curve, is stability coefficient for incipient failure, is vertical velocity distribution coefficient, is blanket thickness coefficient and is side-slope correction factor. According to Breusers et al. [30], the horizontal dimension of riprap protection depends on the pier diameter, and it needs to be at least two times larger.
3.1. Riprap Failure Mechanisms
Riprap failure mechanisms in clear-water conditions can be divided into: (I) shear failure—dislodging of individual riprap stones due to hydrodynamic forces; (II) edge failure—undermining of the riverbed at the toe of the riprap; and (III) winnowing failure—movement of finer material through voids between riprap stones principally initiated by turbulence [117]. In addition, two more failure mechanisms have been identified under live-bed conditions: (IV) bedform-induced failure—fluctuations in flow of the bed level prompted by bed features, such as ripples and dunes, causes lack of stone stability; (V) bed-degradation-induced failure—due to general bed degradation, riprap stones protrude above the general bed level causing a reduction in bed shear stress and consequently disintegration of the riprap structure [119]. Fredsoe et al. [25] described horseshoe vortices in front of the individual stones as the primary reason for undermining at the junction between the riprap countermeasure and the bed in a steady parallel current. The following conclusion is determined—scour depth increases if the Shields parameter increases, a slope of the revetment increases, and if the stone shape is angular. Vasquez et al. [24] conducted physical and numerical investigation of scour around the riprap layer protection in Golden Ears Bridge. In their study, the riprap layer is called riprap apron. The bridge is located in a wide section of a sand-bed river just upstream from a bifurcation, subjected to migrating dunes under live-bed conditions, and with piers oriented at an angle to the flow attack, except the pile group that is exposed above the natural riverbed level. The study proves that a 16 m-wide and 2 m-thick riprap layer successfully eliminates local scour around the pier, even in the presence of an unfavorable combination of passing dunes and general scour. The riprap, however, will partially destabilize and reallocate individual riprap stones, especially at the edges of the layer to the form of a semiconical mound around the pier, but it will still prevent scour hole from forming near piers.
However, at the contacts of the riprap and sediment bed in terms of live-bed conditions, the edges of the riprap will inevitably start to destabilize. The upper stones at the edges roll down the riprap slope or towards the dunes through into the scour hole. Vasquez et al. [24] noticed that after the dune passes by, the riprap side slope formed a conical mound with an angle of repose of about 30°. This process continues downstream until the riprap becomes scattered and forms a riprap mound. Chiew [120] states that such a riprap mound still serves its function of protecting the pier from erosion, but nevertheless the riprap mound shifts the scour area away from the riprap toe and scour continues downstream. This phenomenon has been noticed in Croatian rivers [121]. Gilja et al. establish a sediment transport model to investigate morphological characteristics of a section of the Sava River where a bridge with three piers remediated with riprap sloping structure are placed. It has been noticed that erosional processes affect downstream sections of the river due to increased flow velocities at the constricted bridge opening. The location of the final scour hole is unknown, because it is formed based on the interaction between the flow and the structure under site-specific conditions [122]. Petersen et al. [123] noticed scour of the riprap in the farther downstream area. They conducted a detailed experimental and field investigation on the three-dimensional flow field via Particle Image Velocimetry (PIV) measurements to improve the understanding of scour in the interaction of the riprap protection and the sand. The study was based on monopiles in the marine environment in terms of steady current, waves and the combination of current and waves, where analogy with sea current and river flow can be correlated. They concluded that a pair of symmetrical, counter-rotating vortices induced by a steady current cause significant scour hole downstream of the scour protection. Whitehouse et al. [71] support the statement that the riprap placed around the pier and above the level of the natural bed initiates the development of the secondary scour response. As the scour continues downstream at the edge of the riprap, a deeper scour hole is created than around the unprotected bridge pier. In addition, it has been shown that with this type of riprap protection, scour wakes extend to distance of 100 times the pier diameter. The riprap scour countermeasure is considered to be inadequate, because after secondary scour, more vortices appear near the piers and accelerate the scour process [124].
3.2. Similar Structures Analogy
Groynes, spur dikes, and sloping abutments are geometrically similar to the riprap sloping structures, and thus comparable complex interactions between the flow and riverbed material occur—shallow and on occasion supercritical flow overtopping the structure and hydraulic jump forming on the downstream slope, undermining the toe.
Affecting parameters in local scour formulae at the groyne are same as those for local scour at bridge piers (hydraulic and sediment parameters), except for geometrical parameters that encompass scour depth’s dependency on the distance from the first groyne or from the entrance of the bend, as can be seen in Przedwojski [125] formula:
Another formula developed by Rashak and Khassaf [126] in clear-water conditions for T-shape submerged groynes is as follows:
As can be seen in abovementioned formulae, local scour around groynes depend on parameter of spacing between groynes (). Since one groyne case is comparable to the riprap sloping structure, Rashak and Khassaf’s formula can be considered for the riprap sloping structure in the case where spacing between groynes is zero (). In a sequence of groynes, maximum scour depth occurs at the nose of the upstream groyne.
According to Han and Lin [127], groynes are most vulnerable when the upcoming flood reaches an elevation just above the groyne crest and a shallow submerged condition is reached. Such overtopping flow has a vertical stream direction down the lee side of the groyne, and thus causes small sediment particles to be carried away at relatively low threshold velocities. Rashak and Khassaf [128] noticed that the magnitude of the groyne submergence affects scour depth inversely, which means that an increase in submerged ratio () will result in smaller scour depth ratios (). During relatively deep submergence, the overtopping flow near the free surface is parallel to the flow direction, while recirculatory motions are present at the bottom around the groyne. Meaning that in the low submergence level case, the recirculation region affects stones at the groyne surface.
McCoy et al. [129] investigated the horseshoe vortex system and shear distribution around the groyne to clarify evolution of the scour hole around the groyne region. They showed that deflection of the horizontal, detached shear layer will be magnified if the groyne crest elevation is higher. Furthermore, they support statement that mass exchange is larger in the submerged conditions than for emerged groynes due to a large increase in the inflow velocities downstream of the groyne. Melville and Coleman [14] mentioned that the vortex system will not change in higher water levels, which means that flow depth has a limited influence on scour depth.
Pandey et al. [130] have tested the accuracy of formulae for scour depth around groynes developed by different authors, concluding that although the position of scour depth varies remarkably, a maximum value typically occurs near the nose of the groyne on the upstream side and spreads up to a width of three times the spur dike length. The extent of the scour region is greater on the downstream side compared to the upstream, but the volume of the upstream scour hole is about 65% of the total volume. They indicate that Froude number is a significant parameter in scour depth around the groyne, and other parameters play secondary role, which was later also confirmed by Rashak and Khassaf [126]. Giglou et al. [131] conducted an analysis of flow pattern around spur dikes by a 3D numerical model, and showed that vortex length behind the spur dike is four times longer than the length of spur dike, and with approximately 1.2 times the spur dike length. Pandey et al. [132] developed two novel methods to estimate maximum scour depth around the spur dike in a uniform sediment condition that consists of three standalone machine-learning approaches. Experimentally collected data were obtained in a clear-water condition with uniform sediment material. The result of their model is presented as the ratio of scour depth and spur dike (), while input parameters were ratio of average to critical velocity (), ratio of water depth to spur dike length (), ratio of spur dike length to mean sediment diameter () and densimetric Froude number (). Based on sensitivity analysis of the input parameters, showed the most significant influence on model performance. Eventually, statistical metrics showed the good performance of the developed model in assessing maximum scour depth near the spur dike.
Scour hole geometry at the abutment is similar to those at groynes by means of strong scour activity as a consequence of contraction scouring, which causes a scour hole to be located slightly downstream along the centerline of the watercourse, complementary with turbulent intensity pattern and the time-averaged velocity pattern [109]. However, at long abutments, the scour hole is slightly more elongated to the downstream in comparison to the short abutments [14]. It can be concluded that increasing the obstruction of the flow area will cause larger principal vortex that deflects the scour hole away until it reaches a more elongated shape.
4. Discussion
The purpose of the bridge pier scour design formulae are to determine the required depth of the foundation before the bridge is built, or to estimate bridge safety margins during its design life, with the goal of identifying the need for maintenance or scour protection measures’ installment. Numerous pier scour formulae are available for scour depth estimation—however, they do not provide reliable results as most of them are developed from limited datasets, experimentally acquired or measured directly in case-specific conditions. Formulae developed experimentally may result in under- or over-estimation of scour depth if applicated at bridge piers in prototype scale [77,133]. Thus, formula must be cautiously selected based on conditions that are similar to those for which the formula is developed [17]. In order to find out the most applicable empirical formulae, sensitivity analysis is often required [134].
Any kind of obstruction in the river, such as a bridge pier, inevitably leads to morphodynamic changes, especially in sand-bed rivers with median particle size that can be easily moved during floods [135]. Since the occurrence of scour hole is only a matter of time, it is inevitable that some sort of scour protection will have to be installed during the design life of the bridge. Riprap scour protection using launchable stone almost exclusively requires the riprap to be placed above the riverbed level in a form of riprap sloping structure, which represents additional rigid obstacles in contact with the erodible sediment bed. On the other hand, scour countermeasures could have adverse effect if not installed properly. Therefore, the effect of the proposed scour countermeasures on flow environments should be investigated in detail to achieve design effectiveness during use [136].
The riprap sloping structure contracts the flow through the bridge opening, increasing the velocity and shear stress, resulting in additional lowering of the riverbed elevation next to piers. The installment of the riprap sloping structure has an effect on the bridge hydraulics similar to the flow constrictions resulting from other bridge-related structures—abutments placed in the main channel or long embankments traversing the overbanks. Sudden contraction of the oncoming flow concentrates the flow through the bridge opening, increasing the flow velocity, shear stress and turbulence in the proximity of bridge piers. Depending on the contraction ratio and associated afflux, increased flow velocity and shear stress can significantly surpass the threshold value. Thus, the riverbed deepening will be continuous until the equilibrium is reached, undermining the bridge piers. The effect of the flow contraction is local, i.e., the extent of the morphodynamic changes is rarely evident on the wider river reach, contributing to late identification of the potential hazard to the bridge. While contraction scour is not always present in the bridge locations, depending on the flow approach section layout, it will always accompany the riprap sloping structure, as the volume of the mounded stone presents significant flow constriction. Therefore, the effect of the constriction scour must not be neglected as an influencing factor in studies focusing on scour at riprap sloping structures [137]. For many bridges protected by riprap sloping structures, scour has been found to occur further downstream, often causing a deeper scour hole [121]. Yet, the final depth and relative position of the scour hole next to the riprap sloping structure has not been investigated. Scarce data about scour monitoring next to piers with installed riprap sloping structures do not allow us to draw conclusions regarding the potentially adverse effects of such pier protection. The actual position of the scour hole could be deflected from the pier as a result of toe undermining and subsequent gradual collapsing of the riprap stones into the erosion zone, propagating the scouring process downstream of the unprotected riverbed [61].
Research focusing on the riprap primarily addresses the riprap failure mechanisms [25,64,123,138], while formulae which would estimate the scour depth downstream of the riprap protection are lacking. Similarly, the formulae used for pier scour are not applicable for piers protected by riprap sloping structures. Considering that a number of existing bridges have been retrofitted with riprap sloping structures following scour hazard occurrence, future research should be oriented towards determining the effectiveness of such scour countermeasures as well as their adverse effects on the riverbed and adjacent structures. Similarities between riprap sloping structures and river training structures exist, highlighting the need for in-detail research, as flow overtopping and additional contraction scour can significantly reduce the bridge safety under more frequent flood events driven by climate change. Although many researchers have investigated the effects of flow events on bedload transport and scour processes in laboratory studies [83,85,139,140,141,142] (for a systemic review, see also [96]), studies with field measurements are still rare [39,40], especially those with continuously measured flow waves and associated scour depths [95,143].
Based on the literature review, this study hypothesizes the following: if a large database with a sufficient range of independent hydraulic parameters, riprap geometries, and resulting scour hole depth is established, an empirical formula that provides a reliable estimation of scour depth next to bridge piers protected by riprap sloping structure can be derived. This hypothesis can be tested using field data, experimental data, numerical simulation data, as well as hybrid modeling approaches. Field data are the most reliable, but occurrence of flood events often surpasses the timeframe available for the research. Therefore, field data can be used for calibration and verification of experimental and numerical simulations on more frequent flood events. Experimental and numerical simulations provide means to simulate flood events of longer return periods, such as 1000-year floods. However, preparation of a physical model may be both time-consuming and challenging from a scaling perspective. Therefore, a physical model can be used to investigate local turbulent flow field in the vicinity of the pier. Interaction between the complex geometry and the vortex system can be explored utilizing 3D numerical simulations. The 3D CFD model overperforms the physical model in predicting turbulent velocities and sediment scour, especially if the physical model relies on a single similarity method for scaling [57]. Compared to time-consuming laboratory experiments and field investigations, numerical simulations are a relatively inexpensive and fast way to collect a large and comprehensive dataset for analysis of the scour process. Numerical models can be established for a larger flow area influencing the bridge, providing representative flow conditions at the bridge opening for the boundary conditions of the physical model. Data should be complementary in the sense that each dataset addresses the shortcomings of the others, obtaining the relevant variables across the entire range.
The state-of-the-art review and discussion on the potential research direction are the basis of the project R3PEAT (Remote Real-time Riprap Protection Erosion AssessmenT on large rivers), aiming to contribute to the field by developing empirical formulae for scour estimation next to the bridges with installed scour countermeasures in the form of the riprap sloping structure. Currently, this field is not adequately researched, while similarities with other river training structures exist. Therefore, it can be hypothesized that reliable scour equations can be developed that would combine the influencing variables used for pier scour, contraction scour and toe scour.
5. Conclusions
The bridge failures data recorded worldwide indicate that hydraulic causes are the most common causes of the bridge collapses. Therefore, scour monitoring in real-time is crucial for efficient bridge management. Maximum scour depth for the design flood must be estimated, which can be compared to scour development under specific flood events and associated risk calculated. Once the scour risk is determined in the life cycle of bridges over large rivers, piers are usually retrofitted with riprap sloping structures as scour protection measures. In the literature there are numerous empirical equations developed for different pier shapes and sizes, but the ones taking into account complex flow conditions in the bridge opening with installed riprap sloping structure as scour countermeasure are lacking. This paper provides a comprehensive and relevant review of bridge scour estimation methods for piers with riprap sloping structure installed as scour countermeasure. From the state-of-the-art review, hydrodynamic conditions characteristic for such structures are singled out, separating them from single pier equations. These are shallow and on occasion supercritical flow overtopping the structure and hydraulic jump forming on the downstream slope, undermining the toe. The contributions of this work to the research field are the following:
- (1)
- Systematic formulation of the scouring problem occurring next to the riprap sloping structure—flow contraction as the driving mechanism, including the flow overtopping and associated relevant hydraulic variables;
- (2)
- Overview of the currently available empirical formulae for pier scour estimation and analysis of their applicability for the piers protected with riprap sloping structure—similarity to the complex piers regarding the pier shape and river training structures regarding the flow pattern;
- (3)
- Proposal of the future research direction—utilizing the advantages of available numerical models to investigate complex flow patterns in the bridge opening.
The presented research framework is the basis of the project R3PEAT (Remote Real-time Riprap Protection Erosion AssessmenT on large rivers), aiming to contribute to the field by developing empirical formulae for scour estimation next to the bridges with installed scour countermeasures in the form of the riprap sloping structure.
Author Contributions
Conceptualization, A.H. and G.G.; resources, A.H., G.G., K.P. and M.L.; writing—original draft preparation, A.H., G.G., K.P. and M.L.; writing—review and editing, A.H., G.G., K.P. and M.L.; visualization, A.H.; supervision, G.G.; project administration, G.G.; funding acquisition, G.G. All authors have read and agreed to the published version of the manuscript.
Funding
This work has been funded in part by the Croatian Science Foundation under the project R3PEAT (UIP-2019-04-4046).
Institutional Review Board Statement
Not applicable.
Informed Consent Statement
Not applicable.
Data Availability Statement
Not applicable.
Acknowledgments
This work has been supported in part by Croatian Science Foundation under “Young Researchers’ Career Development Project—Training New Doctoral Students” (DOK-01-2020).
Conflicts of Interest
The authors declare no conflict of interest.
Glossary
| scour depth | |
| contraction scour depth | |
| water depth at the approach section | |
| water depth at the contracted section | |
| unperturbed water depth | |
| water depth above the submerged groyne crest | |
| maximum water depth | |
| width of bridge pier | |
| effective width of bridge pier | |
| column width | |
| column length | |
| column height from the bed level | |
| pile-cap width | |
| pile-diameter | |
| mean particle size of bed material | |
| mean particle size of armor layer | |
| Manning’s roughness coefficient | |
| pile-cap thickness | |
| exposure of pile cap at which cap is scoured. | |
| averaged approach velocity | |
| averaged velocity at the contracted section | |
| critical velocity | |
| approach velocity that induces incipient motion | |
| critical shear stress | |
| the top elevation of the foundation (or pile cap) | |
| pier diameter | |
| foundation diameter | |
| effective pier diameter | |
| riprap rock diameter | |
| specific gravity of riprap | |
| stability coefficient for incipient failure | |
| vertical velocity distribution coefficient | |
| blanket thickness coefficient | |
| side-slope correction factor | |
| angle between the groyne or pier and flow attack | |
| ratio of the contracted to the uncontracted width | |
| turbulent kinetic energy | |
| turbulent dissipation rate | |
| specific dissipation rate | |
| the exponent in the sediment transport formula. | |
| Froude number | |
| bottom channel width at the approached section | |
| bottom channel width at the contracted section | |
| meander length | |
| distance from the entrance of the bend | |
| spacing between groynes | |
| number of groynes | |
| discharge at the approached section | |
| discharge at the contracted section | |
| part of discharge stopped by groyne | |
| medial fall velocities of the sediment | |
| the correction factor for pier-nose shape | |
| the correction factor for angle of flow attack | |
| the correction factor for bed condition | |
| the correction factor for armoring of coarse bed material | |
| the correction factor for pile extension | |
| rock properties’ slope effects factor for riprap sizing | |
| pier width factor for riprap sizing | |
| crossflow shear factor for riprap sizing | |
| transverse pier spacing factor for riprap sizing | |
| pier shape factor for riprap sizing | |
| approach flow alignment factor for riprap sizing |
References
- Sholtes, J.S.; Ubing, C.; Randle, T.J.; Fripp, J.; Cenderelli, D.; Baird, D.C. Managing Infrastructure in the Stream Environment; U.S. Department of the Interior & U.S. Department of Agriculture: Denver, CO, USA, 2017; p. 65. [Google Scholar]
- Lee, M.; Yoo, M.; Jung, H.-S.; Kim, K.H.; Lee, I.-W. Study on dynamic behavior of bridge pier by impact load test considering scour. Appl. Sci. 2020, 10, 6741. [Google Scholar] [CrossRef]
- Gilja, G.; Kuspilić, N.; Bekić, D. Impact of morphodynamical changes on the bridge stability: Case study of Jakuševac bridge in Zagreb. In Current Events in Hydraulic Engineering; Sawicki, J.M., Zima, P., Eds.; Gdansk University of Technology: Gdansk, Poland, 2011; pp. 112–122. [Google Scholar]
- Zhang, Y. Economic Impact of Bridge Damage in a Flood Event. Master’s Thesis, RMIT University, Melbourne, Australia, 2016. [Google Scholar]
- Honfi, D.; Lange, D.; Pursiainen, C.; Rød, B. On the contribution of technological concepts to the resilience of bridges as critical infrastructure assets. In Proceedings of the IABSE Congress: Challenges in Design and Construction of an Innovative and Sustainable Built Environment, Stockholm, Sweden, 21–23 September 2016; pp. 975–982. [Google Scholar]
- Imhof, D. Risk Assessment of Existing Bridge Structures. Ph.D. Thesis, University of Cambridge, Cambridge, UK, 2004. [Google Scholar]
- Schaap, H.S.; Caner, A. Bridge collapses in Turkey: Causes and remedies. Struct. Infrastruct. Eng. 2021, 1–16. [Google Scholar] [CrossRef]
- Cook, W. Bridge Failure Rates, Consequences, and Predictive Trends. Ph.D. Thesis, Utah State University, Logan, UT, USA, 2014. [Google Scholar]
- Wardhana, K.; Hadipriono, F.C. Analysis of recent bridge failures in the United States. J. Perform. Constr. Facil. 2003, 17, 144–150. [Google Scholar] [CrossRef] [Green Version]
- Lagasse, P.F.; Clopper, P.E.; Zevenbergen, L.W.; Girard, L.G. Countermeasures to Protect Bridge Piers from Scour; National Cooperative Highway Research Program—Transportation Research Board: Fort Collins, CO, USA, 2007; p. 284. [Google Scholar]
- Yao, C.; Briaud, J.-L.; Gardoni, P. Risk Analysis on Bridge Scour Failure. In Proceedings of the International Foundations Congress and Equipment Expo, San Antonio, TX, USA, 17–21 March 2015; pp. 1936–1945. [Google Scholar]
- Barker, R.M.; Puckett, J.A. Design of Highway Bridges: An LRFD Approach; Wiley: Hoboken, NJ, USA, 2021. [Google Scholar]
- Lee, G.C.; Mohan, S.B.; Huang, C.; Fard, B.N. A Study of U.S. Bridge Failures (1980–2012); University at Buffalo, State University of New York: Buffalo, NY, USA, 2013; p. 128. [Google Scholar]
- Melville, B.W.; Coleman, S.E. Bridge Scour; Water Resources Publications: Colorado, CO, USA, 2000. [Google Scholar]
- Unger, J.; Hager, W.H. Down-Flow and horseshoe vortex characteristics of sediment embedded bridge piers. Exp. Fluids 2007, 42, 1–19. [Google Scholar] [CrossRef] [Green Version]
- Breusers, H.N.C.; Raudkivi, A.J. Scouring: Hydraulic Structures Design Manual Series; CRC Press: London, UK, 1991; Volume 2. [Google Scholar]
- Dey, S. Hydrodynamic Principles. In Fluvial Hydrodynamics: Hydrodynamic and Sediment Transport Phenomena; Springer: Berlin/Heidelberg, Germany, 2014; Volume 52, pp. 870–871. [Google Scholar]
- Chen, S.-C.; Tfwala, S.; Wu, T.-Y.; Chan, H.-C.; Chou, H.-T. A hooked-collar for bridge piers protection: Flow fields and scour. Water 2018, 10, 1251. [Google Scholar] [CrossRef] [Green Version]
- Fathi, A.; Zomorodian, S.M.A. Effect of submerged vanes on scour around a bridge abutment. KSCE J. Civ. Eng. 2018, 22, 2281–2289. [Google Scholar] [CrossRef]
- Elnikhely, E.A. Minimizing scour around bridge pile using holes. Ain Shams Eng. J. 2017, 8, 499–506. [Google Scholar] [CrossRef] [Green Version]
- Abudallah Habib, I.; Wan Mohtar, W.H.M.; Muftah Shahot, K.; El-Shafie, A.; Abd Manan, T.S. Bridge failure prevention: An overview of self-protected pier as flow altering countermeasures for scour protection. Civ. Eng. Infrastruct. J. 2021, 54, 1–22. [Google Scholar] [CrossRef]
- Ettema, R.; Nakato, T.; Muste, M. An Illustrated Guide for Monitoring and Protecting Bridge Waterways Against Scour; Iowa Highway Research Board: Ames, IA, USA, 2006. [Google Scholar]
- Agrawal, A.K.; Khan, M.A.; Yi, Z. Handbook of Scour Countermeasures Designs; University Transportation Research Center: New York, NY, USA, 2005; p. 201. [Google Scholar]
- Vasquez, J.; McLean, D.; Walsh, B. Modeling Scour and Riprap Protection in Golden Ears Bridge. In Proceedings of the 18th Canadian Hydrotechnical Conference, Winnipeg, MB, Canada, 22–24 August 2007. [Google Scholar]
- Fredsoe, J.; Sumer, B.; Bundgaard, K. Scour at a riprap revetment in currents. In Proceedings of the 2nd IAHR Symposium on River, Coastal and Estuarine Morphodynamics, Obihiro, Japan, 10–14 September 2001; pp. 245–254. [Google Scholar]
- Lauchlan, C.S.; Melville, B.W. Riprap protection at bridge piers. J. Hydraul. Eng. 2001, 127, 412–418. [Google Scholar] [CrossRef]
- Park, S.K.; Julien, P.Y.; Ji, U.; Ruff, J.F. Case Study: Retrofitting Large Bridge Piers on the Nakdong River, South Korea. J. Hydraul. Eng. 2008, 134, 1639–1650. [Google Scholar] [CrossRef] [Green Version]
- Craswell, T.; Akib, S. Reducing bridge pier scour using gabion mattresses filled with recycled and alternative materials. Eng 2020, 1, 188–210. [Google Scholar] [CrossRef]
- Yoon, T.; Kim, D.-H. Bridge Pier Scour Protection by Sack Gabions. In Proceedings of the World Water and Environmental Resources Congress 2001, Orlando, FL, USA, 20–24 May 2001; pp. 1–8. [Google Scholar]
- Breusers, H.N.C.; Nicollet, G.; Shen, H.W. Local scour around cylindrical piers. J. Hydraul. Res. 1977, 15, 211–252. [Google Scholar] [CrossRef]
- Nielsen, A.W.; Liu, X.; Sumer, B.M.; Fredsøe, J. Flow and bed shear stresses in scour protections around a pile in a current. Coast. Eng. 2013, 72, 20–38. [Google Scholar] [CrossRef]
- Cikojević, A.; Gilja, G. Research approach for spatial and temporal development of deflected scour hole next to riprap scour protection. In Proceedings of the 5. Simpozij Doktorskog Studija Građevinarstva, Zagreb, Croatia, 9–10 September 2019; pp. 59–68. [Google Scholar]
- Hung, C.-C.; Yau, W.-G. Behavior of scoured bridge piers subjected to flood-induced loads. Eng. Struct. 2014, 80, 241–250. [Google Scholar] [CrossRef]
- Argyroudis, S.A.; Mitoulis, S.A. Vulnerability of bridges to individual and multiple hazards- floods and earthquakes. Reliab. Eng. Syst. Saf. 2021, 210, 107564. [Google Scholar] [CrossRef]
- FHWA. National Bridge Inspection Standards; 23 CFR Part 650 [FHWA Docket No. FHWA–2001–8954]; FHWA: Washington, DC, USA, 2004; pp. 74419–74439. [Google Scholar]
- Aberle, J.; Rennie, C.D.; Admiraal, D.M.; Muste, M. Experimental Hydraulics: Methods, Instrumentation, Data Processing and Management; Taylor & Francis Group: London, UK, 2017; Volume II, p. 448. [Google Scholar]
- Borghei, S.M.; Kabiri-Samani, A.; Banihashem, S.A. Influence of unsteady flow hydrograph shape on local scouring around bridge pier. Proc. Inst. Civ. Eng. Water Manag. 2012, 165, 473–480. [Google Scholar] [CrossRef]
- Manfreda, S.; Link, O.; Pizarro, A. A theoretically derived probability distribution of scour. Water 2018, 10, 1520. [Google Scholar] [CrossRef] [Green Version]
- Lu, J.-Y.; Hong, J.-H.; Su, C.-C.; Wang, C.-Y.; Lai, J.-S. Field measurements and simulation of bridge scour depth variations during floods. J. Hydraul. Eng. 2008, 134, 810–821. [Google Scholar] [CrossRef] [Green Version]
- Su, C.-C.; Lu, J.-Y. Comparison of sediment load and riverbed scour during floods for gravel-bed and sand-bed reaches of intermittent rivers: Case study. J. Hydraul. Eng. 2016, 142, 05016001. [Google Scholar] [CrossRef]
- Richardson, E.V.; Davis, S.R. Evaluating Scour at Bridges, 4th ed.; FHWA NHI 01-001; Federal Highway Administration Hydraulic Engineering Circular No. 18: May 2001; FHWA: Washington, DC, USA, 2001; p. 378. [Google Scholar]
- Ettema, R.; Constantinescu, G.; Melville, B. Evaluation of Bridge Scour Research: Pier Scour Processes and Predictions; Transportation Research Board of the National Academies: Washington, DC, USA, 2011. [Google Scholar]
- Melville, B.W.; Chiew, Y.-M. Time scale for local scour at bridge piers. J. Hydraul. Eng. 1999, 125, 59–65. [Google Scholar] [CrossRef]
- Lagasse, P.F.; Richardson, E.V.; Schall, J.D.; Price, G.R. Instrumentation for Measuring Scour at Bridge Piers and Abutments; NCHRP Report No 396; Transportation Research Board: Washington, DC, USA, 1997. [Google Scholar]
- De Falco, F.; Mele, R. The monitoring of bridges for scour by sonar and sedimetri. NDT E Int. 2002, 35, 117–123. [Google Scholar] [CrossRef]
- Lagasse, P.F.; Clopper, P.E.; Pagán-Ortiz, J.E.; Zevenbergen, L.W.; Arneson, L.A.; Schall, J.D.; Girard, L.G. Bridge Scours and Stream Instability Countermeasures: Experience, Selection and Design Guidance; Hydraulic Engineering Circular No. 23; Federal Highway Administration: Washington, DC, USA, 2009. [Google Scholar]
- Orsak, J. A New Method for Detecting the Onset of Scour and Managing Scour Critical Bridges; SENSR Monitoring Technologies: Washington, DC, USA, 2019; p. 93. [Google Scholar]
- Fitzgerald, P.C.; Malekjafarian, A.; Cantero, D.; Obrien, E.J.; Prendergast, L.J. Drive-By scour monitoring of railway bridges using a wavelet-based approach. Eng. Struct. 2019, 191, 1–11. [Google Scholar] [CrossRef]
- Bao, T.; Liu, Z.L.; Bird, K. Influence of soil characteristics on natural frequency-based bridge scour detection. J. Sound Vib. 2019, 446, 195–210. [Google Scholar] [CrossRef]
- Lin, Y.-B.; Lee, F.-Z.; Chang, K.-C.; Lai, J.-S.; Lo, S.-W.; Wu, J.-H.; Lin, T.-K. The artificial intelligence of things sensing system of real-time bridge scour monitoring for early warning during floods. Sensors 2021, 21, 4942. [Google Scholar] [CrossRef]
- Al-Obaidi, K.; Xu, Y.; Valyrakis, M. The design and calibration of instrumented particles for assessing water infrastructure hazards. J. Sens. Actuator Netw. 2020, 9, 36. [Google Scholar] [CrossRef]
- Selvakumaran, S.; Plank, S.; Geiß, C.; Rossi, C.; Middleton, C. Remote monitoring to predict bridge scour failure using Interferometric Synthetic Aperture Radar (InSAR) stacking techniques. Int. J. Appl. Earth Obs. Geoinf. 2018, 73, 463–470. [Google Scholar] [CrossRef]
- Lamb, R.; Aspinall, W.; Odbert, H.; Wagener, T. Vulnerability of Bridges to Scour: Insights from an International Expert Elicitation Workshop; University of Bristol: Bristol, UK, 2016; pp. 1393–1409. [Google Scholar]
- Pizarro, A.; Manfreda, S.; Tubaldi, E. The science behind scour at bridge foundations: A review. Water 2020, 12, 374. [Google Scholar] [CrossRef] [Green Version]
- Sheppard, D.M.; Melville, B.W. Scour at Wide Piers and Long Skewed Piers; The National Academies Press: Washington, DC, USA, 2011; p. 55. [Google Scholar]
- Hamidifar, H.; Zanganeh-Inaloo, F.; Carnacina, I. Hybrid scour depth prediction equations for reliable design of bridge piers. Water 2021, 13, 2019. [Google Scholar] [CrossRef]
- Huang, W.; Yang, Q.; Xiao, H. CFD modeling of scale effects on turbulence flow and scour around bridge piers. Comput. Fluids 2009, 38, 1050–1058. [Google Scholar] [CrossRef]
- Aly, A.M.; Dougherty, E. Bridge pier geometry effects on local scour potential: A comparative study. Ocean Eng. 2021, 234, 109326. [Google Scholar] [CrossRef]
- Alemi, M.; Pêgo, J.P.; Maia, R. Numerical simulation of the turbulent flow around a complex bridge pier on the scoured bed. Eur. J. Mech. B/Fluids 2019, 76, 316–331. [Google Scholar] [CrossRef]
- Graf, W.H.; Istiarto, I. Flow pattern in the scour hole around a cylinder. J. Hydraul. Res. 2002, 40, 13–20. [Google Scholar] [CrossRef]
- Zhu, Z.-W.; Liu, Z.G. CFD prediction of local scour hole around bridge piers. J. Cent. S. Univ. 2012, 19, 273–281. [Google Scholar] [CrossRef]
- Jalal, H.K.; Hassan, W.H. Three-dimensional numerical simulation of local scour around circular bridge pier using Flow-3D software. IOP Conf. Ser. Mater. Sci. Eng. 2020, 745, 012150. [Google Scholar] [CrossRef]
- Song, Y.; Xu, Y.; Ismail, H.; Liu, X. Scour modeling based on immersed boundary method: A pathway to practical use of three-dimensional scour models. Coast. Eng. 2021, 171, 104037. [Google Scholar] [CrossRef]
- Mueller, D.S.; Wagner, C. Field Observations and Evaluations of Streambed Scour at Bridges; Federal Highway Administration: MsLean, VA, USA, 2005. [Google Scholar]
- Johnson, P.A.; Clopper, P.E.; Zevenbergen, L.W.; Lagasse, P.F. Quantifying Uncertainty and Reliability in Bridge Scour Estimations. J. Hydraul. Eng. 2015, 141, 04015013. [Google Scholar] [CrossRef]
- Sheppard, M.D.; Glasser, T.L. Sediment Scour at Piers with Complex Geometries. In Proceedings of the International Conference on Scour and Erosion (ICSE-2), Singapore, 14–17 November 2004. [Google Scholar]
- Sheppard, D.M.; Miller, W. Live-Bed local pier scour experiments. J. Hydraul. Eng. 2006, 132, 635–642. [Google Scholar] [CrossRef] [Green Version]
- Froehlich, D.C. Analysis of onsite measurements of scour at piers. In Proceedings of the Hydraulic Engineering: Proceedings of the 1988 National Conference on Hydraulic Engineering, Colorado Springs, CO, USA, 8–12 August 1988; pp. 534–539. [Google Scholar]
- Gao, D.G.; Pasada, L.G.; Nordin, C.F. Pier Scour Equations Used in the People’s Republic of China: Review and Summary; FHWA-SA-93-076; U.S. Federal Highway Administration, Office of Technology Applications: Washington, DC, USA, 1993; p. 66. [Google Scholar]
- Ansari, S.A.; Qadar, A. Ultimate Depth of Scour Around Bridge Piers. In Proceedings of the ASCE National Hydraulic Conference, Buffalo, NY, USA, 1–5 August 1994; pp. 51–55. [Google Scholar]
- Whitehouse, R.J.; Harris, J.; Sutherland, J.; Rees, J. The nature of scour development and scour protection at offshore windfarm foundations. Mar. Pollut. Bull. 2011, 62, 73–88. [Google Scholar] [CrossRef] [Green Version]
- Zhuravlyov, M.M. New Method for Estimation of Local Scour Due to Bridge Piers and Its Substantiation; State All Union Scientific Research Institute on Roads: Moscow, Russia, 1978. [Google Scholar]
- Landers, M.N.; Mueller, D.S. Evaluation of selected pier-scour equations using field data. Transp. Res. Rec. 1996, 1523, 186–195. [Google Scholar] [CrossRef]
- Gaudio, R.; Grimaldi, C.; Tafarojnoruz, A.; Calomino, F. Comparison of formulae for the prediction of scour depth at piers. In Proceedings of the First European IAHR Congress, Edinburgh, UK, 4–6 May 2010; pp. 6–12. [Google Scholar]
- Zevenbergen, L.W. Comparison of the HEC-18, Melville, and Sheppard Pier Scour Equations. In Proceedings of the International Conference on Scour and Erosion (ICSE-5) 2010, San Francisco, CA, USA, 7–10 November 2010. [Google Scholar]
- Sheppard, D.; Melville, B.; Demir, H. Evaluation of existing equations for local scour at bridge piers. J. Hydraul. Eng. 2014, 140, 14–23. [Google Scholar] [CrossRef]
- Jannaty, M.H.; Eghbalzadeh, A.; Hosseini, S.A. Using field data to evaluate the complex bridge piers scour methods. Can. J. Civ. Eng. 2016, 43, 218–225. [Google Scholar] [CrossRef]
- Pandey, M.; Chen, S.-C.; Sharma, P.K.; Ojha, C.S.P.; Kumar, V. Local scour of armor layer processes around the circular pier in non-uniform gravel bed. Water 2019, 11, 1421. [Google Scholar] [CrossRef] [Green Version]
- Sheppard, D.M.; Renna, R. Bridge Scour Manual; Florida Department of Transportation: Tallahassee, FL, USA, 2010. [Google Scholar]
- Melville, B.W. Pier and abutment scour: Integrated approach. J. Hydraul. Eng. 1997, 123, 125–136. [Google Scholar] [CrossRef]
- Yang, Y.; Melville, B.W.; Sheppard, D.M.; Shamseldin, A.Y. Live-Bed scour at wide and long-skewed bridge piers in comparatively shallow water. J. Hydraul. Eng. 2019, 145, 06019005. [Google Scholar] [CrossRef]
- Poff, N.L.; Allan, J.D.; Bain, M.B.; Karr, J.R.; Prestegaard, K.L.; Richter, B.D.; Sparks, R.E.; Stromberg, J.C. The natural flow regime. BioScience 1997, 47, 769–784. [Google Scholar] [CrossRef]
- Plumb, B.D.; Juez, C.; Annable, W.K.; McKie, C.W.; Franca, M.J. The impact of hydrograph variability and frequency on sediment transport dynamics in a gravel-bed flume. Earth Surf. Process. Landf. 2020, 45, 816–830. [Google Scholar] [CrossRef]
- Kirby, A.; Roca, M.; Kitchen, A.; Escarameia, M.; Chesterton, J. Manual on Scour at Bridges and Other Hydraulic Structures; CIRIA: London, UK, 2015. [Google Scholar]
- Tubaldi, E.; Macorini, L.; Izzuddin, B.A.; Manes, C.; Laio, F. A framework for probabilistic assessment of clear-water scour around bridge piers. Struct. Saf. 2017, 69, 11–22. [Google Scholar] [CrossRef] [Green Version]
- Mao, L. The effect of hydrographs on bed load transport and bed sediment spatial arrangement. J. Geophys. Res. Space Phys. 2012, 117, F03024. [Google Scholar] [CrossRef] [Green Version]
- Guney, M.S.; Bombar, G.; Aksoy, A.O. Experimental study of the coarse surface development effect on the bimodal bed-load transport under unsteady flow conditions. J. Hydraul. Eng. 2013, 139, 12–21. [Google Scholar] [CrossRef]
- Oliveto, G.; Hager, W.H. Temporal evolution of clear-water pier and abutment scour. J. Hydraul. Eng. 2002, 128, 811–820. [Google Scholar] [CrossRef]
- Kothyari, U.C.; Garde, R.C.J.; Raju, K.G.R. Temporal variation of scour around circular bridge piers. J. Hydraul. Eng. 1992, 118, 1091–1106. [Google Scholar] [CrossRef]
- López, G.; Teixeira, L.; Ortega-Sánchez, M.; Simarro, G. Estimating final scour depth under clear-water flood waves. J. Hydraul. Eng. 2014, 140, 328–332. [Google Scholar] [CrossRef]
- Waters, K.A.; Curran, J.C. Linking bed morphology changes of two sediment mixtures to sediment transport predictions in unsteady flows. Water Resour. Res. 2015, 51, 2724–2741. [Google Scholar] [CrossRef]
- Hager, W.H.; Unger, J. Bridge pier scour under flood waves. J. Hydraul. Eng. 2010, 136, 842–847. [Google Scholar] [CrossRef] [Green Version]
- Link, O.; Castillo, C.; Pizarro, A.; Rojas, A.; Ettmer, B.; Escauriaza, C.; Manfreda, S. A model of bridge pier scour during flood waves. J. Hydraul. Res. 2016, 55, 310–323. [Google Scholar] [CrossRef]
- Pizarro, A.; Ettmer, B.; Manfreda, S.; Rojas, A.; Link, O. Dimensionless effective flow work for estimation of pier scour caused by flood waves. J. Hydraul. Eng. 2017, 143, 06017006. [Google Scholar] [CrossRef]
- Link, O.; García, M.; Pizarro, A.; Alcayaga, H.; Palma, S. Local scour and sediment deposition at bridge piers during floods. J. Hydraul. Eng. 2020, 146, 04020003. [Google Scholar] [CrossRef]
- Mrokowska, M.M.; Rowiński, P.M. Impact of unsteady flow events on bedload transport: A review of laboratory experiments. Water 2019, 11, 907. [Google Scholar] [CrossRef] [Green Version]
- Laursen, E.M. Scour at bridge crossings. Trans. Am. Soc. Civ. Eng. 1962, 127, 166–179. [Google Scholar] [CrossRef]
- Raudkivi, A.; Ettema, R. Clear-Water scour at cylindrical piers. J. Hydraul. Eng. 1983, 109, 338–350. [Google Scholar] [CrossRef]
- Melville, B.W.; Sutherland, A.J. Design method for local scour at bridge piers. J. Hydraul. Eng. 1988, 114, 1210–1226. [Google Scholar] [CrossRef]
- Moreno, M.; Maia, R.; Couto, L.; Cardoso, A. Contribution of complex pier components on local scour depth. In Proceedings of the 3rd IAHR Europe Congress, Porto, Portugal, 14–16 April 2014. [Google Scholar]
- Umeda, S.; Yamazaki, T.; Yuhi, M. An Experimental Study of Scour Process and Sediment Transport around a Bridge Pier with Foundation. In Proceedings of the International Conference on Scour and Erosion (ICSE-5), San Francisco, CA, USA, 7–10 November 2010; pp. 66–75. [Google Scholar]
- Melville, B.W.; Raudkivi, A.J. Effects of foundation geometry on bridge pier scour. J. Hydraul. Eng. 1996, 122, 203–209. [Google Scholar] [CrossRef]
- Namaee, M.R.; Li, Y.; Sui, J.; Whitcombe, T. Comparison of three commonly used equations for calculating local scour depth around bridge pier under ice covered flow condition. World J. Eng. Technol. 2018, 06, 50–62. [Google Scholar] [CrossRef] [Green Version]
- Saha, R.; Lee, S.O.; Hong, S.H. A Comprehensive method of calculating maximum bridge scour depth. Water 2018, 10, 1572. [Google Scholar] [CrossRef] [Green Version]
- Coleman, S.E. Clearwater local scour at complex piers. J. Hydraul. Eng. 2005, 131, 330–334. [Google Scholar] [CrossRef]
- Yang, Y.; Melville, B.W.; Macky, G.H.; Shamseldin, A.Y. Local scour at complex bridge piers in close proximity under clear-water and live-bed flow regime. Water 2019, 11, 1530. [Google Scholar] [CrossRef] [Green Version]
- Laursen, E.M.; Toch, A. Scour around Bridge Piers and Abutments; Iowa Institute of Hydraulic Research: Iowa City, IA, USA, 1956. [Google Scholar]
- Briaud, J.L.; Chen, H.C.; Chang, K.A.; Oh, S.J.; Chen, X. Abutment Scour in Cohesive Materials; National Cooperative Highway Research Program, Transportation Research Board: Washington, DC, USA, 2009; p. 435. [Google Scholar]
- Arneson, L.A.; Zevenbergen, L.W.; Lagasse, P.F.; Clopper, P.E. Evaluating Scour at Bridges, 5th ed.; FHWA-HIF-12-003 HEC-18; U.S. Department of Transportation Federal Highway Administration: Washington, DC, USA, 2012; pp. 71–73. [Google Scholar]
- Hong, S. Interaction of Bridge Contraction Scour and Pier Scour in a Laboratory River Model. Master’s Thesis, Georgia Institute of Technology, Atlanta, GA, USA, 2005. [Google Scholar]
- Melville, B.W. The Physics of Local Scour At Bridge Piers. In Proceedings of the Fourth International Conference on Scour and Erosion, Chuo University, Tokyo, Japan, 5–7 November 2008. [Google Scholar]
- Ghorbani, B. A Field Study of Scour at Bridge Piers in Flood Plain Rivers. Turk. J. Eng. Environ. Sci. 2008, 32, 189–199. [Google Scholar]
- Izbash, S.V. Construction of Dams by Dumping Stones into Flowing Water; US Engineering Office, War Department: Eastport, ME, USA, 1935. [Google Scholar]
- Faraday, R.V.; Charlton, F.G. Hydraulic Factors in Bridge Design; Hydraulics Research: Wallingford, UK, 1983. [Google Scholar]
- Parola, A.C.; Jones, J.S. Sizing riprap to protect bridge piers from scour. Transp. Res. Rec. 1991, 1290, 276–280. [Google Scholar]
- Parola, A.C. Stability of riprap at bridge piers. J. Hydraul. Eng. 1993, 119, 1080–1093. [Google Scholar] [CrossRef]
- Chiew, Y.-M. Mechanics of riprap failure at bridge piers. J. Hydraul. Eng. 1995, 121, 635–643. [Google Scholar] [CrossRef]
- Froehlich, D.C. Protecting bridge piers with loose rock riprap. J. Appl. Water Eng. Res. 2013, 1, 39–57. [Google Scholar] [CrossRef]
- Chiew, Y.M. Failure Mechanisms of Riprap Layer Around Bridge Piers. In Proceedings of the First International Conference on Scour of Foundations, Texas A&M University, College Station, TX, USA, 17–20 November 2002; pp. 70–91. [Google Scholar]
- Chiew, Y.M. Riprap Protection Around Bridge Piers In A Degrading Channel. In Proceedings of the First International Conference on Scour of Foundations, Texas A&M University, College Station, TX, USA, 17–20 November 2002; pp. 707–718. [Google Scholar]
- Gilja, G.; Kuspilić, N.; Tečić, D. Morphodynamic impact of scour countermeasures on riverbed topography. In Proceedings of the 15th International Symposium Water Management and Hydraulics Engineering, Primošten, Croatia, 7–8 September 2017; pp. 176–183. [Google Scholar]
- Gilja, G.; Cikojević, A.; Potočki, K.; Varga, M.; Adžaga, N. Remote Real-time Riprap Protection Erosion Assessment on large rivers. In Proceedings of the EGU General Assembly 2020, Vienna, Austria, 3–8 May 2020. [Google Scholar]
- Petersen, T.U.; Sumer, B.M.; Fredsøe, J.; Raaijmakers, T.C.; Schouten, J.-J. Edge scour at scour protections around piles in the marine environment—Laboratory and field investigation. Coast. Eng. 2015, 106, 42–72. [Google Scholar] [CrossRef]
- Veerappadevaru, G.; Gangadharaiah, T.; Jagadeesh, T.R. Vortex scouring process around bridge pier with a caisson. J. Hydraul. Res. 2011, 49, 378–383. [Google Scholar] [CrossRef]
- Przedwojski, B. Bed topography and local scour in rivers with banks protected by groynes. J. Hydraul. Res. 1995, 33, 257–273. [Google Scholar] [CrossRef]
- Rashak, B.M.; Khassaf, S.I. Local scour around t-shape submerged groynes in clearwater conditions. Int. J. Geomate 2020, 20, 163–172. [Google Scholar] [CrossRef]
- Han, X.; Lin, P. 3D numerical study of the flow properties in a double-spur dikes field during a flood process. Water 2018, 10, 1574. [Google Scholar] [CrossRef] [Green Version]
- Rashak, B.M.; Khassaf, S.I. Study the local scour around different shapes of single submerged groyne. J. Water Land Dev. 2020, 47, 1–9. [Google Scholar] [CrossRef]
- McCoy, A.; Constantinescu, G.; Weber, L. A numerical investigation of coherent structures and mass exchange processes in channel flow with two lateral submerged groynes. Water Resour. Res. 2007, 430, 1–26. [Google Scholar] [CrossRef]
- Pandey, M.; Ahmad, Z.; Sharma, P. Estimation of maximum scour depth near a spur dike. Can. J. Civ. Eng. 2016, 43, 270–278. [Google Scholar] [CrossRef] [Green Version]
- Giglou, A.N.; Mccorquodale, J.A.; Solari, L. Numerical study on the effect of the spur dikes on sedimentation pattern. Ain Shams Eng. J. 2018, 9, 2057–2066. [Google Scholar] [CrossRef]
- Pandey, M.; Jamei, M.; Karbasi, M.; Ahmadianfar, I.; Chu, X. Prediction of maximum scour depth near spur dikes in uniform bed sediment using stacked generalization ensemble tree-based frameworks. J. Irrig. Drain. Eng. 2021, 147, 04021050. [Google Scholar] [CrossRef]
- Tabarestani, M.K.; Salamatian, S.A. Physical modelling of local scour around bridge pier. Malays. J. Civ. Eng. 2018, 28, 349–364. [Google Scholar] [CrossRef]
- Cikojević, A.; Gilja, G.; Kuspilić, N. Sensitivity analysis of empirical equations applicable on bridge piers in sand-bed rivers. In Proceedings of the 16th International Symposium on Water Management and Hydraulic Engineering WMHE 2019, Skopje, Macedonia, 5–7 September 2019; pp. 100–109. [Google Scholar]
- Lee, S.O.; Sturm, T.W. Effect of sediment size scaling on physical modeling of bridge pier scour. J. Hydraul. Eng. 2009, 135, 793–802. [Google Scholar] [CrossRef]
- Valela, C.; Nistor, I.; Rennie Colin, D.; Lara Javier, L.; Maza, M. Hybrid modeling for design of a novel bridge pier collar for reducing scour. J. Hydraul. Eng. 2021, 147, 04021012. [Google Scholar] [CrossRef]
- Fischenich, C.; Landers, M. Computing Scour; U.S. Army Engineer Research and Development Center: Vicksburg, MS, USA, 1999; p. 5. [Google Scholar]
- Ji, U.; Yeo, W.; Kang, J. Subsidence of riprap protection without filters for different installation types of riprap around a pier in sands. J. Hydro-Environ. Res. 2013, 7, 41–49. [Google Scholar] [CrossRef]
- Mao, L. The effects of flood history on sediment transport in gravel-bed rivers. Geomorphology 2018, 322, 196–205. [Google Scholar] [CrossRef] [Green Version]
- Redolfi, M.; Bertoldi, W.; Tubino, M.; Welber, M. Bed load variability and morphology of gravel bed rivers subject to unsteady flow: A laboratory investigation. Water Resour. Res. 2018, 54, 842–862. [Google Scholar] [CrossRef]
- Wang, L.; Cuthbertson, A.J.S.; Pender, G.; Cao, Z. Experimental investigations of graded sediment transport under unsteady flow hydrographs. Int. J. Sediment Res. 2015, 30, 306–320. [Google Scholar] [CrossRef] [Green Version]
- Phillips, C.B.; Hill, K.M.; Paola, C.; Singer, M.B.; Jerolmack, D.J. Effect of flood hydrograph duration, magnitude, and shape on bed load transport dynamics. Geophys. Res. Lett. 2018, 45, 8264–8271. [Google Scholar] [CrossRef]
- Sturm, T.; Sotiropoulos, F.; Landers, M.; Gotvald, T.; Lee, S.O.; Ge, L.; Navarro, R.; Escauriaza, C. Laboratory and 3D Numerical Modeling with Field Monitoring of Regional Bridge Scour in Georgia; Georgia Department of Transportation: Atlanta, GA, USA, 2004. [Google Scholar]
Figure 1.
Similarity of outer contours between the riprap sloping structure (left) and complex piers (right), outlined in red.
Figure 1.
Similarity of outer contours between the riprap sloping structure (left) and complex piers (right), outlined in red.

Figure 2.
Pier scour countermeasure retrofitting cases distinctive by the position of the top of the riprap sloping structure relative to the riverbed level: top of the riprap below the general bed level (left); top of the riprap above the general bed level (middle); and top of the riprap above the mean water level (right).


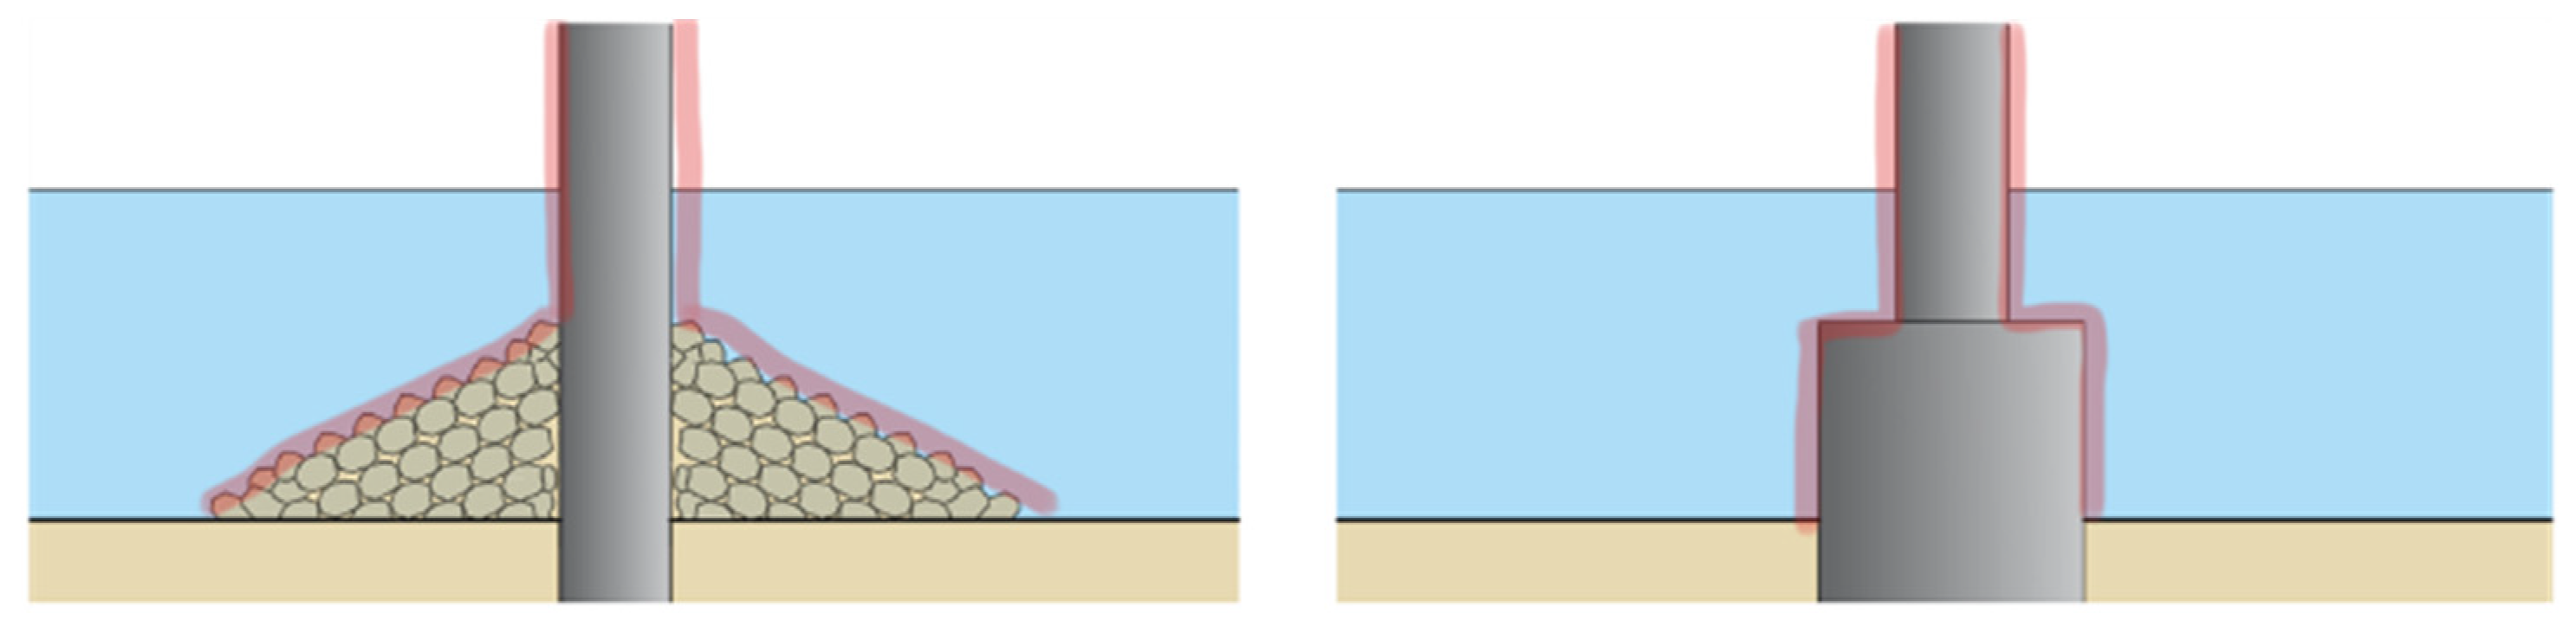
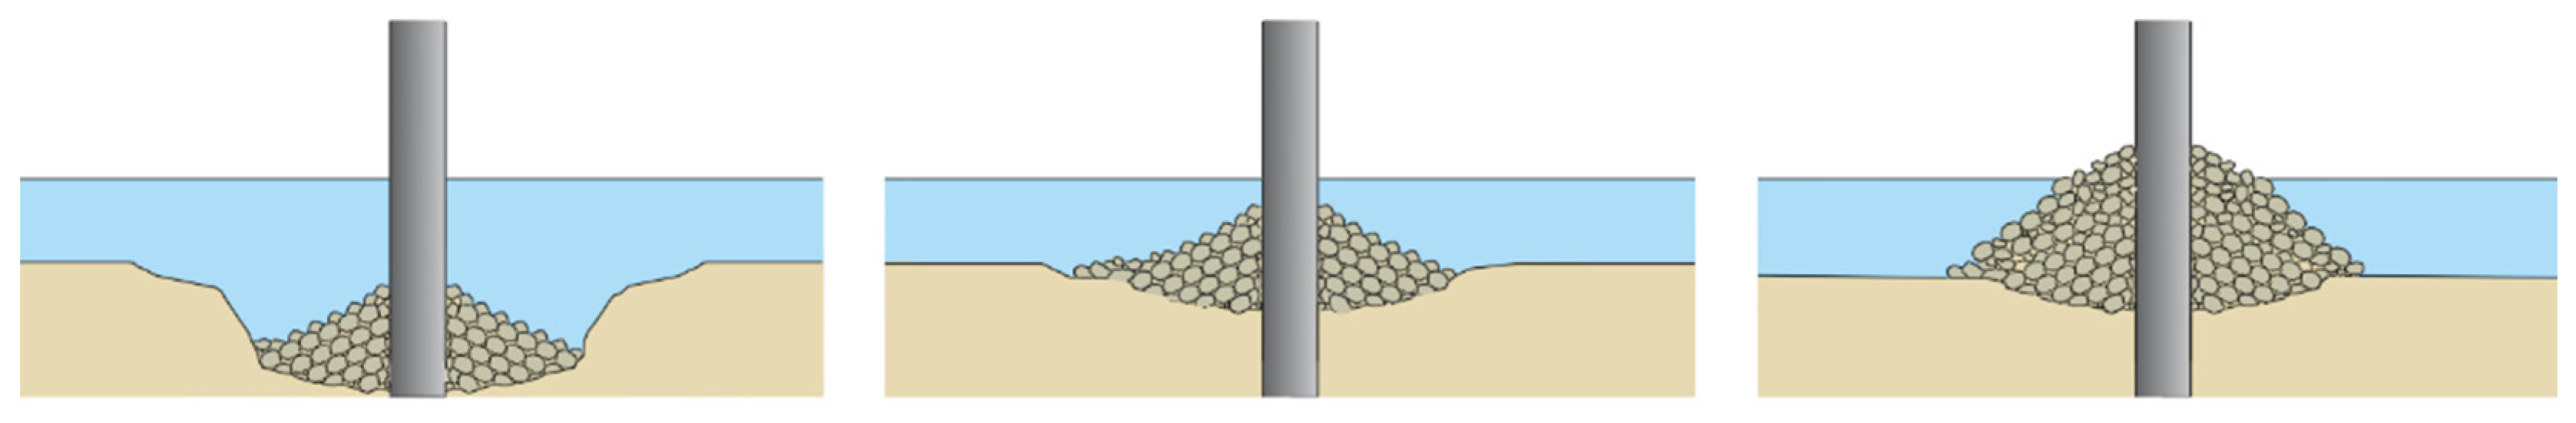
Table 1.
Local scour data obtained by field survey and corresponding formulae.
| Field Data by | Number of Data | Formulae | |
|---|---|---|---|
| Froehlich [68] | 83 | (1) | |
| Gao et al. [69] | 137 | (2) | |
| Ansari and Qadar [70] | 100 | (3) | |
| Richardson and Davis [41] | - | (4) |
Table 2.
Scour depth formula around complex piers based on influence of the top of the foundation.
| Zone | Condition | Formula | |
|---|---|---|---|
| Foundation below the bottom of the scour hole | (7) | ||
| Foundation is above the bottom of the scour hole and below the bed level | 1 | (8) | |
| Foundation is above the bed level | (9) |
1 Except and
Table 3.
Equivalent pier diameter formulae based on influence of the pile cap elevation.
| Formula | Condition | |
|---|---|---|
| (11) | ||
| (12) | ||
| (13) | ||
| (14) |
Table 4.
Procedure for calculating effective width of complex piers for estimating scour depth.
| Element | Formulae | |
|---|---|---|
| column | ||
| , | (15) | |
| caisson 1 | ||
| (16) | ||
| total | (17) |
1 Caisson is interpreted as buried pile cap.
Publisher’s Note: MDPI stays neutral with regard to jurisdictional claims in published maps and institutional affiliations. |
© 2021 by the authors. Licensee MDPI, Basel, Switzerland. This article is an open access article distributed under the terms and conditions of the Creative Commons Attribution (CC BY) license (https://creativecommons.org/licenses/by/4.0/).
Share and Cite
MDPI and ACS Style
Harasti, A.; Gilja, G.; Potočki, K.; Lacko, M. Scour at Bridge Piers Protected by the Riprap Sloping Structure: A Review. Water 2021, 13, 3606. https://doi.org/10.3390/w13243606
AMA Style
Harasti A, Gilja G, Potočki K, Lacko M. Scour at Bridge Piers Protected by the Riprap Sloping Structure: A Review. Water. 2021; 13(24):3606. https://doi.org/10.3390/w13243606
Chicago/Turabian StyleHarasti, Antonija, Gordon Gilja, Kristina Potočki, and Martina Lacko. 2021. "Scour at Bridge Piers Protected by the Riprap Sloping Structure: A Review" Water 13, no. 24: 3606. https://doi.org/10.3390/w13243606
Note that from the first issue of 2016, this journal uses article numbers instead of page numbers. See further details here.