Article

Studying Onset and Evolution of Agricultural Drought in Mekong River Basin through Hydrologic Modeling

1
Department of Agriculture Engineering, Saveetha Engineering College, Chennai 602105, India
2
Department of Civil Engineering, Indian Institute of Technology-Madras, Chennai 620036, India
3
Department of Project Implementation, City of Alexandria, Alexandria, VA 22314, USA
4
Spatial Sciences Laboratory, Department of Ecosystem Science and Management, Texas A&M University, College Station, TX 77843, USA
5
Technical Support Division, Mekong River Commission Secretariat, Vientiane 01000, Laos
*
Author to whom correspondence should be addressed.
Water 2021, 13(24), 3622; https://doi.org/10.3390/w13243622
Submission received: 6 November 2021 / Revised: 2 December 2021 / Accepted: 6 December 2021 / Published: 16 December 2021
(This article belongs to the Section Water, Agriculture and Aquaculture)

Abstract

:
Departures in precipitation from the normal are the cause of the onset of agricultural drought. In this study, we aim to identify extreme precipitation deficits using an index called Percent Normal (PN). We applied the proposed PN index to the agriculturally productive Mekong River Basin (MRB) to evaluate the propagation of precipitation deficits into agricultural drought based on the change in slope and mean of the precipitation, soil moisture and evapotranspiration anomalies. The results of the study showed the proposed PN index identified historical droughts in the years 1992, 1997–1998 and 2000–2006 in MRB; of these, 1992 was shown to be the longest drought, which lasted from the 43rd week (October) of 1991 to the 49th week (December) of 1994. The short-term but extreme drought was identified to occur in 2005 with below-normal precipitation that lasted for more than a year. An immediate effect of precipitation deficit was observed in evapotranspiration (ET) and soil water for agricultural (Thailand) and forested regions (Parts of Cambodia) of the basin with <5 weeks lag. We conclude that the drought indices adopted in this study are suitable to identify the small and long-term drought events, which will facilitate the development of a drought-resilient agricultural production system.

1. Introduction

Drought is a multi-variate phenomenon that evolves from precipitation deficiency into deficit in terrestrial hydrologic storage. The droughts are triggered by a delayed monsoon, an increase in the number of dry days into the monsoon or early withdrawal of the wet season. Agriculturally dominant areas are vulnerable to such fluctuations and triggers to short-term droughts despite growing irrigation infrastructures. Agricultural drought develops because of precipitation deficit combined with higher evapotranspiration (ET) especially during the crop-growing season. These droughts are primarily influenced by land cover and vegetation, and their recovery is highly dependent on ET in arid regions and by snow cover in cold regions [1,2]. Reduction in soil moisture and plant-available water eventually propagates into hydrologic drought.
Various definitions of agricultural drought are available e.g., it is “where the soil moisture in the root zone is at or below the permanent wilting point. The condition continues until the rain falls in excess of daily evapotranspiration” [3]; it is defined as the “condition in which the soil moisture is not sufficient to support average crop production on farms” [4]. In determining the soil moisture deficit, not only are the number of dry days important for determining agricultural drought, the number of ‘consecutive’ dry days also help accurately define the drought [3]. In addition to this, below-average rainfall in the cropping season is also a major factor in the development of soil moisture deficiency. During the dry season, agricultural drought is triggered by a precipitation deficit whereas during the cropping season, a precipitation deficit combined with ET initiates the soil moisture deficit. Hence, the pooled effect of rainfall, both in wet and dry seasons, and ET needs to be studied to understand how the precipitation deficit evolves to initiate agricultural drought.
Knowledge of the transient behavior of soil moisture is also important, not only for vegetative production but also for the sustenance of the hydrologic cycle in catchments. Irrigation of agricultural crops may help reduce the soil moisture stress but long-term soil moisture deficits resulting from pooled rainfall deficiencies and increased ET will increase the irrigation demand. As active transpiration of plants occurs within the first 30 cm of the soil profile during early growing stages, the propagation of a precipitation deficit into agricultural drought can develop over different depths of the soil profile without having to reach the wilting point. This substantiates the role of land cover and catchment characteristics in drought development in addition to the severity and frequency of the precipitation deficit. The impacts of topography, soil types, land-use practices and climatic conditions are highly variable. Hence, the basin-wide study of soil moisture is required for comprehensive spatio-temporal exploration of drought development.
This type of analysis is particularly significant in transboundary basins such as the Mekong River Basin (MRB) that has diverse landcover from agriculture, forest and wetlands with varying rainfall distribution from upstream to downstream. MRB covers China, Myanmar, Thailand, Lao PDR, Cambodia and Vietnam (Figure 1). In MRB, the Upper Mekong Basin (UMB) originates from the Tibetan Plateau, which covers an area of approximately 195,000 km2 and flows through Qinghai, Tibet and Yunnan in China [5]. The Lower Mekong Basin (LMB), which is 76% of the total MRB area of 795,000 km2, is responsible for 80–85% of MRB flow volume [6]. Despite having relatively higher annual average precipitation in the range of 850–2500 mm, it is subjected to frequent droughts, particularly in LMB [5]. Economic and human losses resulting from the droughts that occurred during 1992, 1997–1998 and in 2002–2005 across various regions of the Mekong River Basin (MRB) were attributed to meteorological extremes; in Thailand alone, the below-normal rainfall throughout the growing season caused 210 million USD in damage [5]. The physiography of the basin varies with the forest-covered highlands receiving the highest rainfall and the middle region (Khorat Plateau) with little relief receiving less than 1000 mm per year [6]. The downstream basin, Tonle Sap Basin, drains into the largest freshwater lake, Tonle Sap. The most downstream part of the MRB is the Mekong Delta, characterized by mangrove swamps, sand dunes and irrigated paddy fields. The downstream regions of Tonle Sap Basin and Mekong Delta are home to the most productive and diverse ecosystem.
Although there are numerous drought studies carried out in LMB, the majority of them focused on deficiencies in current and future precipitation, land-use change and its effects on streamflow [5,7,8,9]. With these, the changes in hydrological processes may not be fully captured because soil moisture fluctuations, with respect to plant water requirements, vary spatially and temporally. Therefore, soil moisture is the key index of agriculture drought as it characterizes water fluxes to and from the atmosphere [10], the consequences of which are generally realized in variations in precipitation patterns [11] and ET during the growing season [12].
The rainfall occurring in the dry season will primarily be used to satisfy ET demands of vegetation, and rainfall excess of this demand will be used to replenish hydrologic stores. Anomalies in soil moisture and ET can together act as better indicators of how agricultural drought evolves as a function of rainfall anomalies. Besides meteorological extremes, human alteration to the land surface for water conservation and for land-use activities (e.g., dams) alter hydrologic regimes, which eventually leads to droughts in the basin [13]. Hence, the determination and evaluation of one drought from another become a necessity in drought-related studies in this region.
Basin-wide analysis of precipitation, soil moisture and ET requires large spatial coverage, which can be obtained from satellite data and simulated estimates from hydrological models. The Soil and Water Assessment Tool (SWAT), UHP-HRU and WaSIM have been used extensively to derive soil-plant water variables and the factors associated with the multi-drought assessment [14,15,16]. Simulated estimates of hydrologic variables are validated by the observed hydro-meteorological dataset as well as satellite data to overcome the scarcity and incompleteness of the observation network.
The SWAT model for MRB has also been validated with satellite estimates such as evapotranspiration from the Moderate Resolution Imaging Spectroradiometer (MODIS) and soil moisture data from the European Space Agency (ESA), which was developed under its Climate Change Initiative (CCI) [9,17,18,19,20]. The model has been found to estimate soil moisture and ET in good agreement with corresponding satellite measurements and has been concluded to be used as a decision support tool for water balance studies. However, the propagation of agricultural drought from these simulations has to be studied in greater detail. As basin-level agricultural drought is not immediately and easily measured, the rainfed agriculture-based economy in this basin becomes the most vulnerable sector [8] and hence the onset and evolution of agricultural drought need to be understood for developing better adaptation techniques.
In this study, we used the SWAT-model-derived soil moisture and evapotranspiration deficits for understanding the propagation of agricultural drought from the pooling of several meteorological deficits in MRB. We aim to quantify agricultural drought propagation characteristics of soil moisture and ET from meteorological deficits, which would aid in the development of MRB as a drought-proof, resilient agricultural production system. The temporal effects of a meteorological deficit on soil moisture and plant available water addressed in this paper will be useful for policy makers to propose conservation measures during the drought period.

2. Materials and Methods

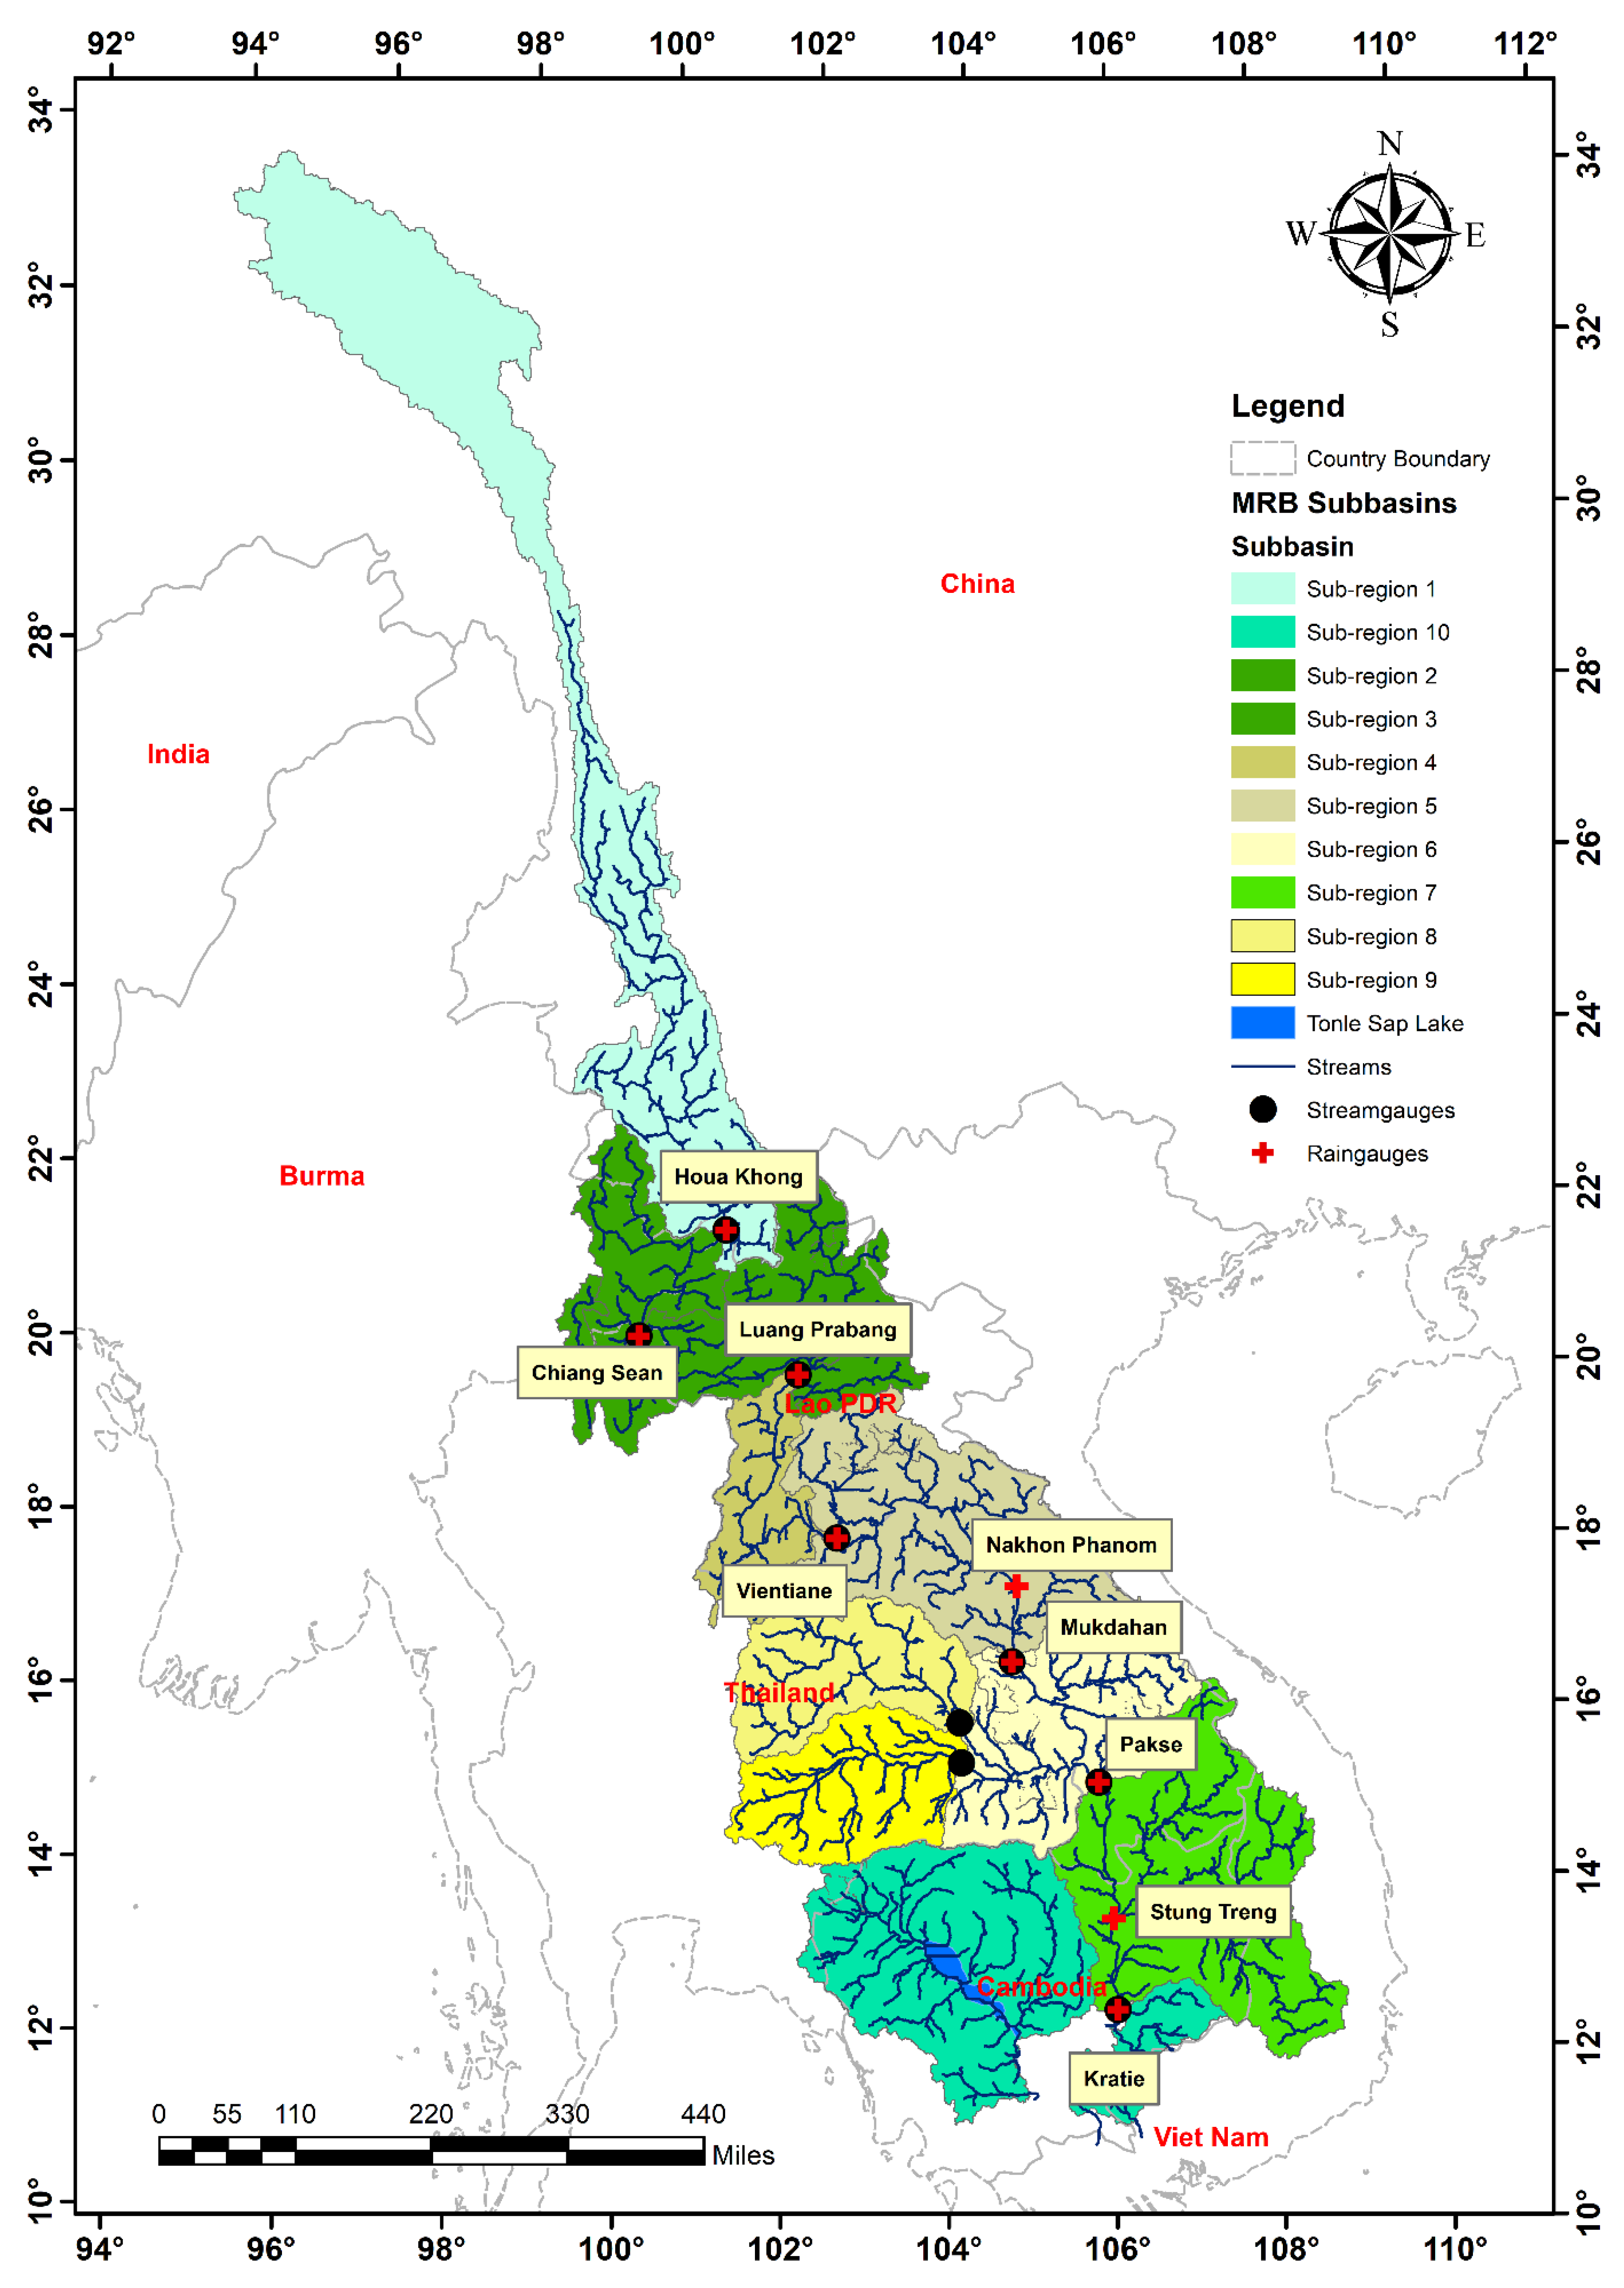
2.1. Data Collection and Model Set-Up

MRB was subdivided into ten sub-regions, 1–10, based on the locations of stream gauges (Figure 1), which were further divided into 870 sub-basins with individual areas ranging between approximately 5 km2 and 5100 km2 with an average size of 873.44 km2. The SWAT model that was calibrated and validated based on the observed streamflow values and that integrated within the Decision Support Framework (DSF) of the Mekong River Commission (MRC) [21] was used to simulate land surface hydrology for the years 1980 to 2008. Daily precipitation data collected from nine rain gauges in the basin (Figure 1) were used to generate the area-weighted average precipitation of the drainage areas of sub-regions. The SWAT simulation was carried out from 1 January 1980 to 31 December 2008, with a warm-up period of five years. Therefore, simulation results from 1 January 1985 to 31 December 2008 were used in this study for the calculation of deficits in precipitation, soil moisture and evapotranspiration.

2.2. Deficit Calculation

Deficits in precipitation, soil moisture and ET were calculated using three indices: (1) Percent Normal (PN), (2) Soil Moisture Deficit Index (SMDI) and (3) Evapotranspiration Deficit Index (ETDI) on a weekly basis. The normalized weekly precipitation, called percent normal (PN), was calculated for each subbasin as a fraction of the long-term weekly mean in 1985–2008 and expressed as a percentage (Equation (1)).
PN i , j = P i , j P a v g ( i ) × 100
P i , j = Precipitation value for the subbasin, mm.
P a v g ( i , j ) = Average precipitation within a subbasin, mm.
‘i’ refers to 1980–2008 and ‘j’ refers to weeks 1–52.
The Soil Moisture Deficit Index (SMDI) was calculated based on the weekly average soil moisture within each sub-basin using Equation (2) [22] as below:
SD i , j = SW i , j - MSW j MSW j - Min ( SW j ) ×   100 ,   if   SW i ,   j     MSW j
SD i , j = SW i , j - MSW j Max ( SW j ) - MSW j ×   100 ,   if   SW i ,   j   >   MSW j
SMDI 1 = SD 1 50
SMDI j = 0 . 5   ×   SMDI j - 1 + SD 1 50
where:
SD i , j = Soil water deficit, %.
SW i , j = Average weekly soil moisture within a subbasin, mm.
MSW j ,   MaxSW j ,   MinSW j = Median, maximum, minimum weekly soil moisture within a subbasin, mm.
The Evapo-Transpiration Deficit Index (ETDI), based on the weekly average potential ET and actual ET, is shown in Equation (3) [22].
WSA i , j = MWS i , j - WS j MWS j - Min ( WS j ) ×   100 ,   if   WS i , j     MWS j
WSA i , j = MWS i , j - WS j Max ( WS j ) j - MWS j ×   100 ,   if   WS i , j   >   MWS j
WS = PET - AET PET
ETDI 1 = WSA 1 50
ETDI j = 0 . 5   ×   ETDI j - 1 + WSA 1 50
where:
WSA i , j = Weekly water stress anomaly.
WS i , j = Weekly water stress, mm.
MWS j ,   Max ( WS j ) ,   Min ( WS j ) =   Median, Maximum, Minimum water stress, mm.
The categorization of drought resulting from PN, SMDI and ETDI is expressed in Table 1. Based on these drought conditions, its characteristics (frequency and duration) were derived to assess the severity of the drought. The drought frequency was defined as the number of weeks within a given year a drought index was below the threshold (Table 1).

2.3. Evaluation of Agricultural Drought Propagation

The ET deficit developed from the continuous precipitation deficiency eventually leads to a soil moisture deficit. MRB experiences seasonal climate with the dry season prevailing from November to March, the wet season occurring from May to October and the transition between the dry and wet seasons that occur in April and from mid-October to November (Figure 2). Therefore, in this study, the dry seasonal deficit was not considered as a drought period, but only those dry seasons that extended for a continuous period or below-normal rainfall from wet seasons were identified as extreme, severe or moderate drought based on the PN values as in Table 1. The propagation of agricultural drought from meteorological deficits is defined in terms of the following characteristics: Lag, lengthening, pooling and attenuation [23] (Table 2).
Identifying these progression characteristics is an important step in understanding the role of catchment and climate in the quantification and recovery of droughts. The change in temporal anomalies of PN, ETDI and SMDI were determined based on significant changes in the mean and slope using MATLAB [24]. Corresponding change points in the mean and slope of ETDI and SMDI were identified for obtaining the attenuation and lengthening in soil moisture and evapotranspiration deficits that result from meteorological deficits.
Cross correlation [25] between the indices was determined to identify the lag at which anomalies of soil moisture and evapotranspiration occur with respect to that of precipitation. Lag at which the maximum correlation occurs with PN as the leading variable was obtained and used to identify the time of response of PN on ETDI and SMDI. Similarly, the response time of the soil moisture deficit due to the ET deficit was also determined using the maximum correlation between ETDI and SMDI.

3. Results

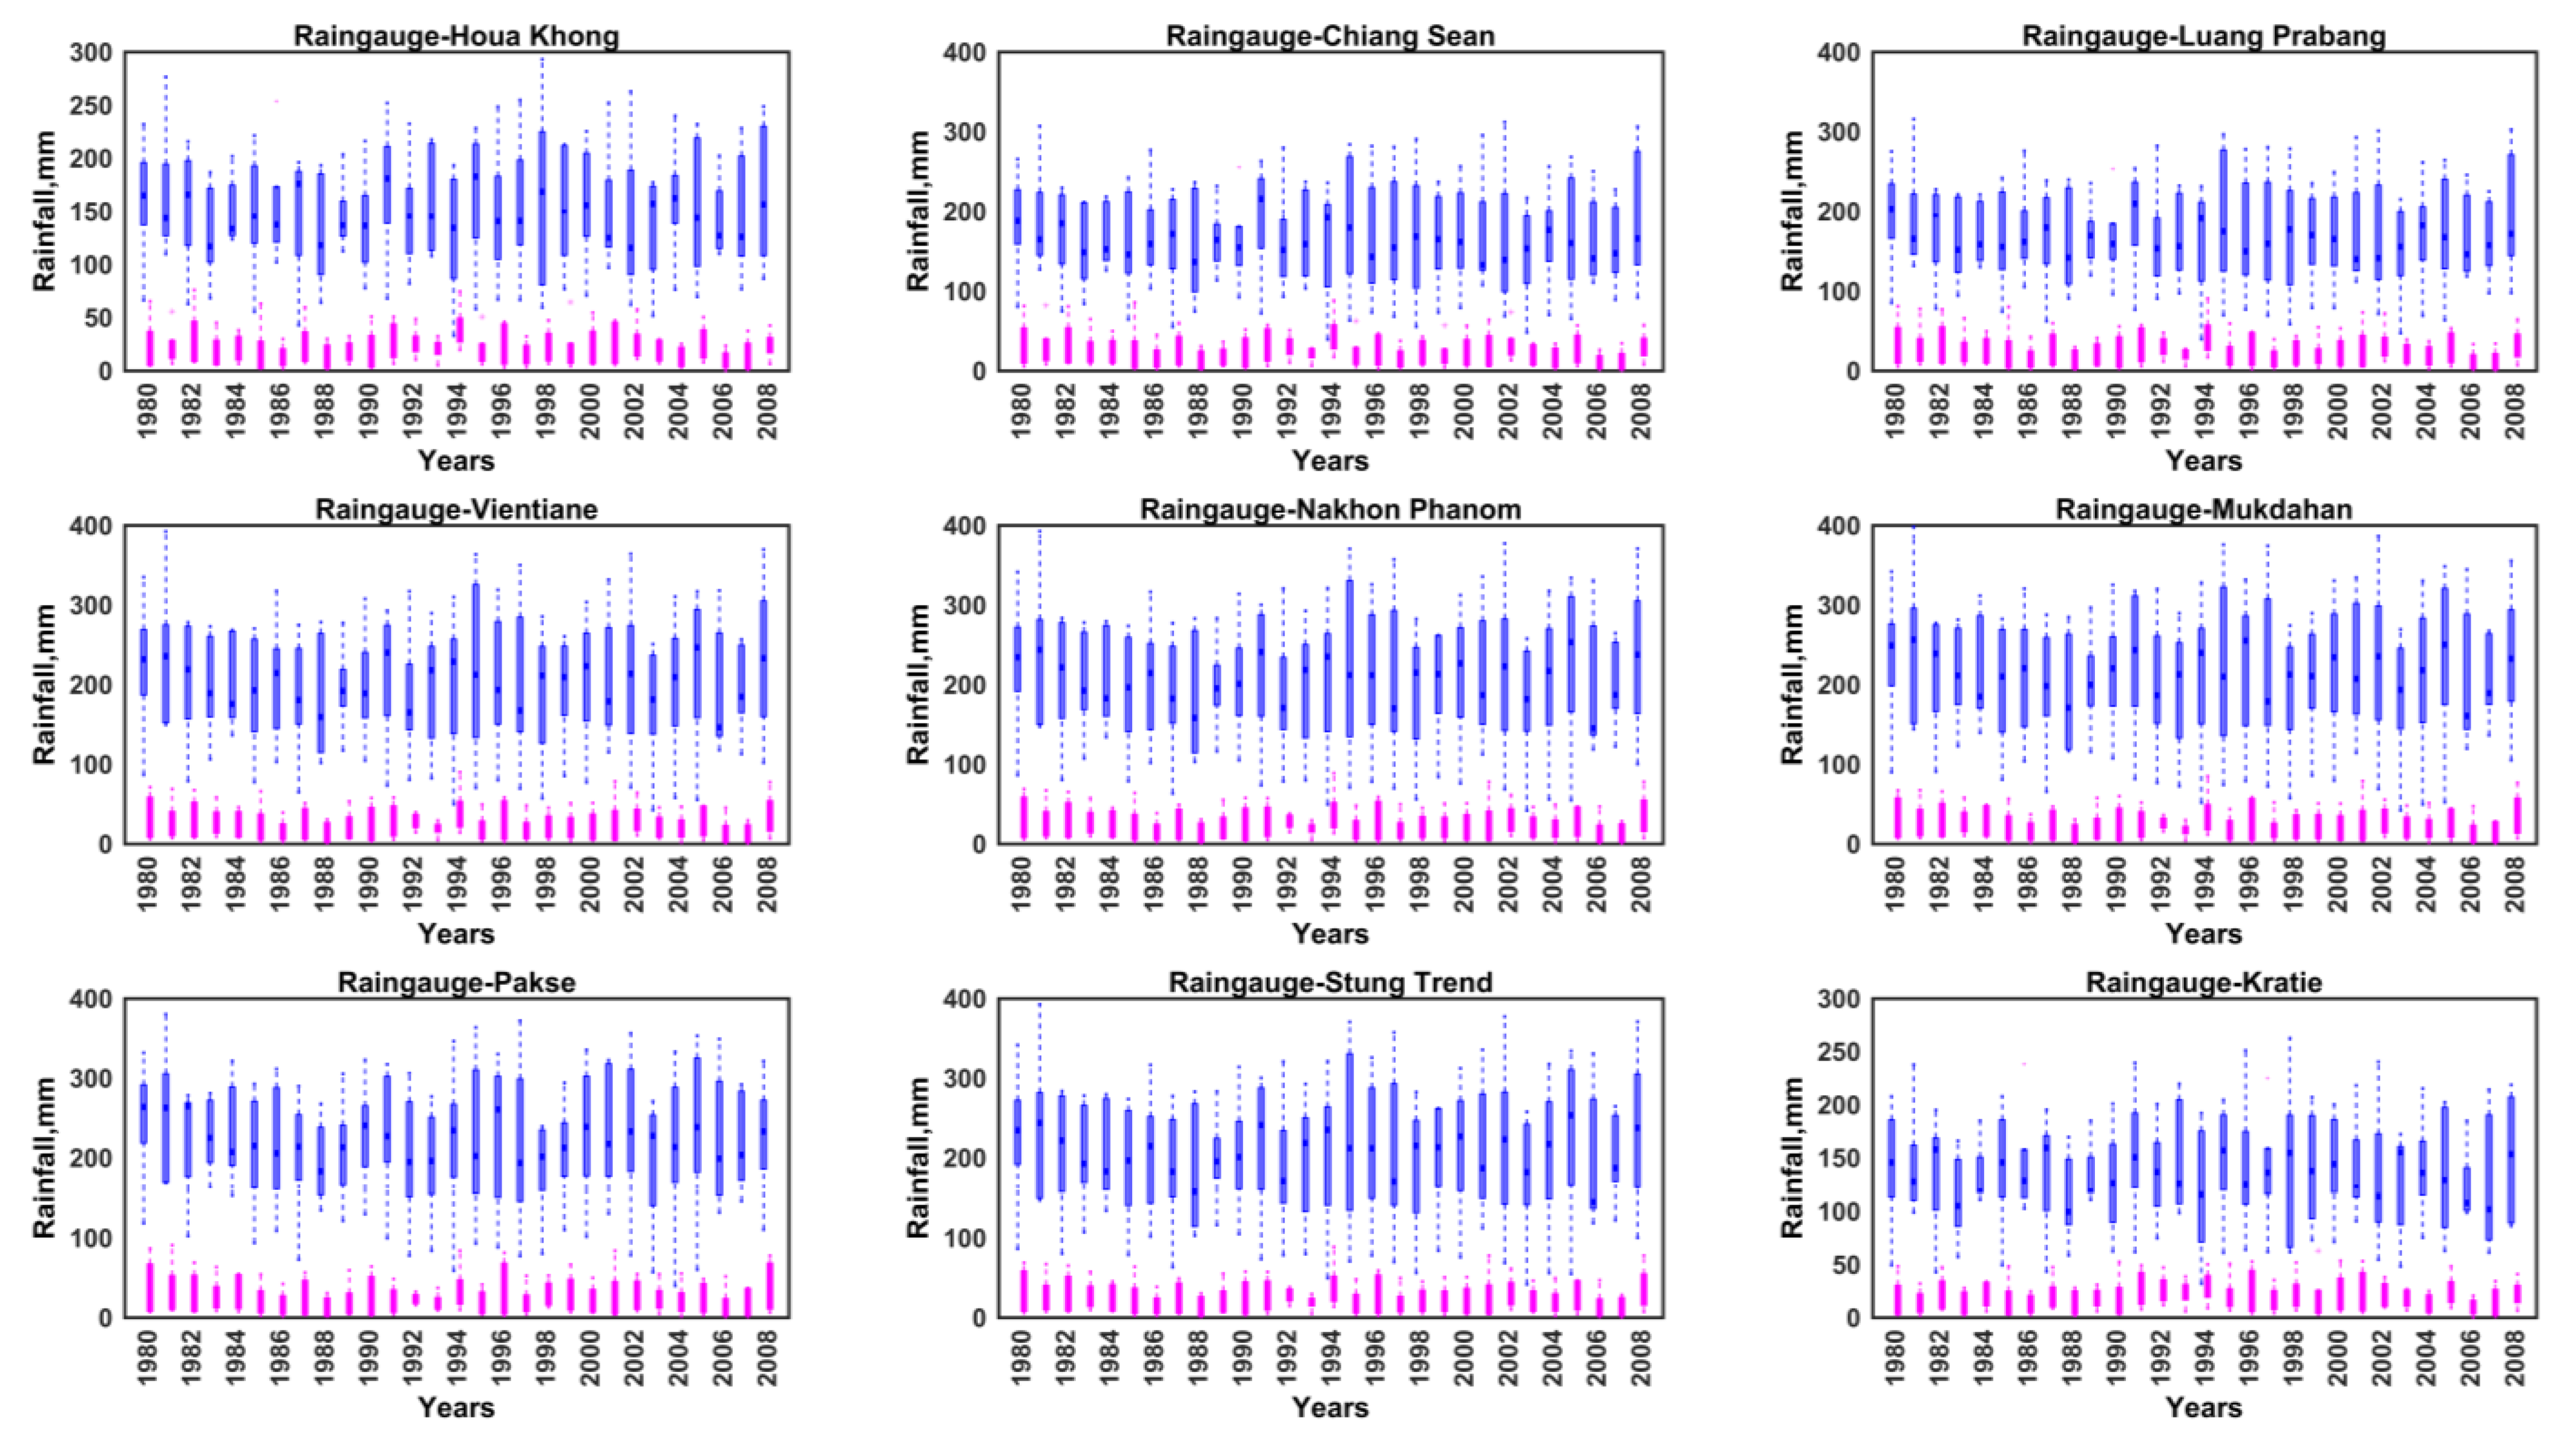
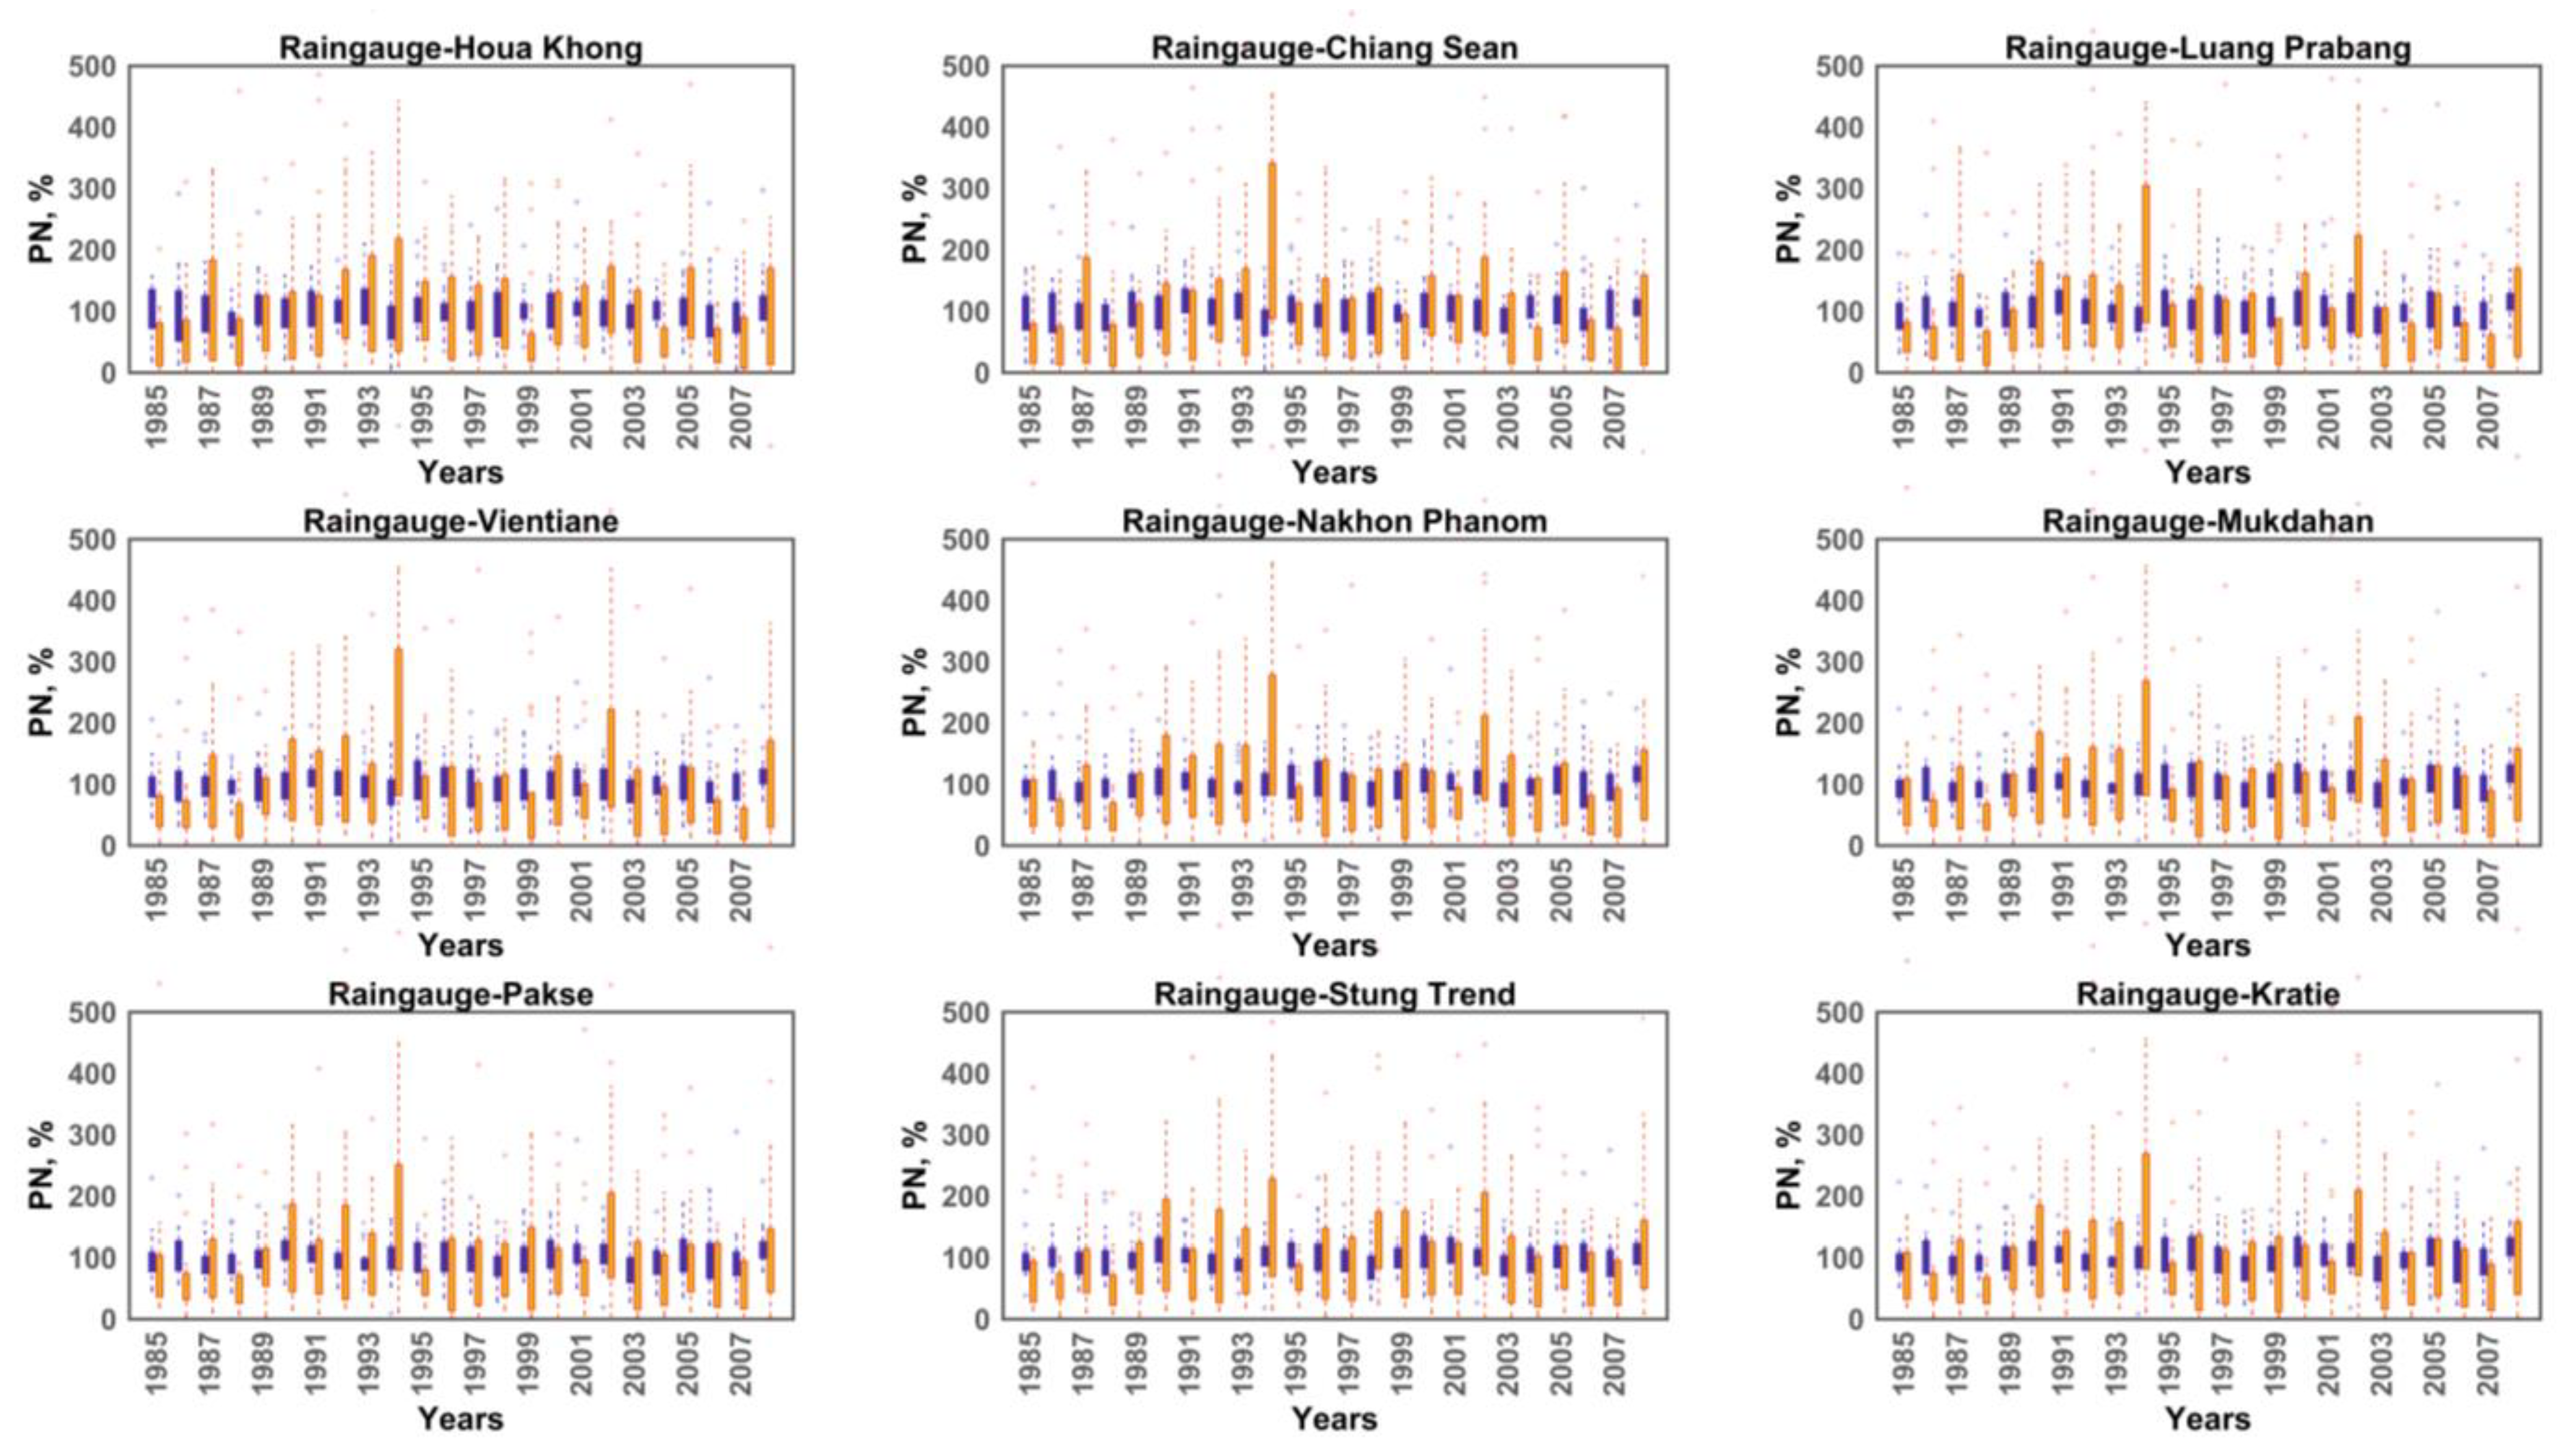
3.1. Precipitation Deficit in Comparison with Other Drought Indices

Figure 3 shows historical droughts in LMB occurring in the years 1987, 1992, 1997–1998 and 2000–2006 as validated by other studies [5,26,27,28] are identified by the proposed PN index. These drought years were used for agricultural drought propagation analysis in the Southwest (SW) season, which is described as rainfall occurring between the 22nd and 43rd weeks of a year and the dry Northeast (NE) season that occurs between the 44th and 52nd weeks and the 1st and 13th weeks of the following year.
The SW seasonal rainfall is highly predictable with distinct variations of anomalies occurring during the drought years. This feature will be beneficial in the identification of droughts, i.e., any deviation from the SW monsoon rainfall, when they occur, would represent a large departure from the long-term trend [26]. Such a departure could be used to define the onset of drought as explained in the subsequent sections. From Figure 2 and Figure 3, we can also observe that historical droughts in 1992 and 1997–1998 were triggered primarily by the deviation from normal rainfall during the SW season.
The 2000 drought sets in from the decreased rainfall in 2003 and pooled as deficient rainfall occurring until 2006. The number of occurrences of the precipitation deficiency during the NE monsoon in Figure 4 illustrated the years 1987–1989, 1992, 1997–1999 and 2000–2006 experienced extreme drought and normal years persisted in 1981, 1994 and 2008. The extreme drought condition (Figure 4a) showed a greater number of deficits each year with pronounced deficits in the years 1988 and 2003–2006. In the severe drought category (Figure 4b), the years 1991 and 2005 show a greater number of occurrences during the NE monsoon. In wetter categories (Figure 4d,e), 1994, 2001–2002 and 2008 were shown to have received fewer precipitation deficits.
The number of occurrences of precipitation deficiencies in the SW monsoon (Figure 5) in each year showed a wetter condition (Figure 5e) persisted throughout the study period than those in extreme and severe drought categories (Figure 5a,b). The severe drought years 2003 and 2005, as identified from PN values, show fewer occurrences in near-normal and moderately wet conditions (Figure 5d,e) and a greater number of occurrences in drought categories (Figure 5a–c).
Spatial variation in the deficit was also observed from upstream to downstream, primarily in sub-regions 2–10 in LMB. Near-normal conditions in the SW monsoon lessened in the years 1990, 1997 and 2005 whilst moderately wet conditions decreased significantly in the years 1988 and 2003. The years 2004–2005 had more occurrences of precipitation deficits with a drought duration of more than five weeks in most of the sub-regions as they were drought years [26,28].
The duration of the precipitation deficit for the year 2003 lasted up to 6–8 weeks; during the normal year in 2008, the deficit lasted up to 2–3 weeks. The spatial variation of the average annual drought as seen from Figure 6a shows the drought occurrence is higher in sub-regions that are agriculturally dominant (sub-regions 5, 6, 8 and 9) and eastern parts of sub-regions 2, 3 and 7. Of these, sub-regions 5, 6, 8 and 9 with rice cultivation were investigated for the impact of rainfall deficit on soil moisture and plant water dynamics.
The sub-regions 2, 3 and 7 are forested and hence were evaluated to understand the development of drought due to deficits in precipitation and plant available water. The duration of deficit in plant available water and soil moisture (Figure 6b,c) showed affected areas in parts of Thailand and Lao PDR are of primarily single-season agricultural land use with more than 30 weeks of the crop-growing season. The ET deficit is concentrated in parts of Cambodia, Vietnam and the Deltaic region where forests and croplands are dominant vegetations.

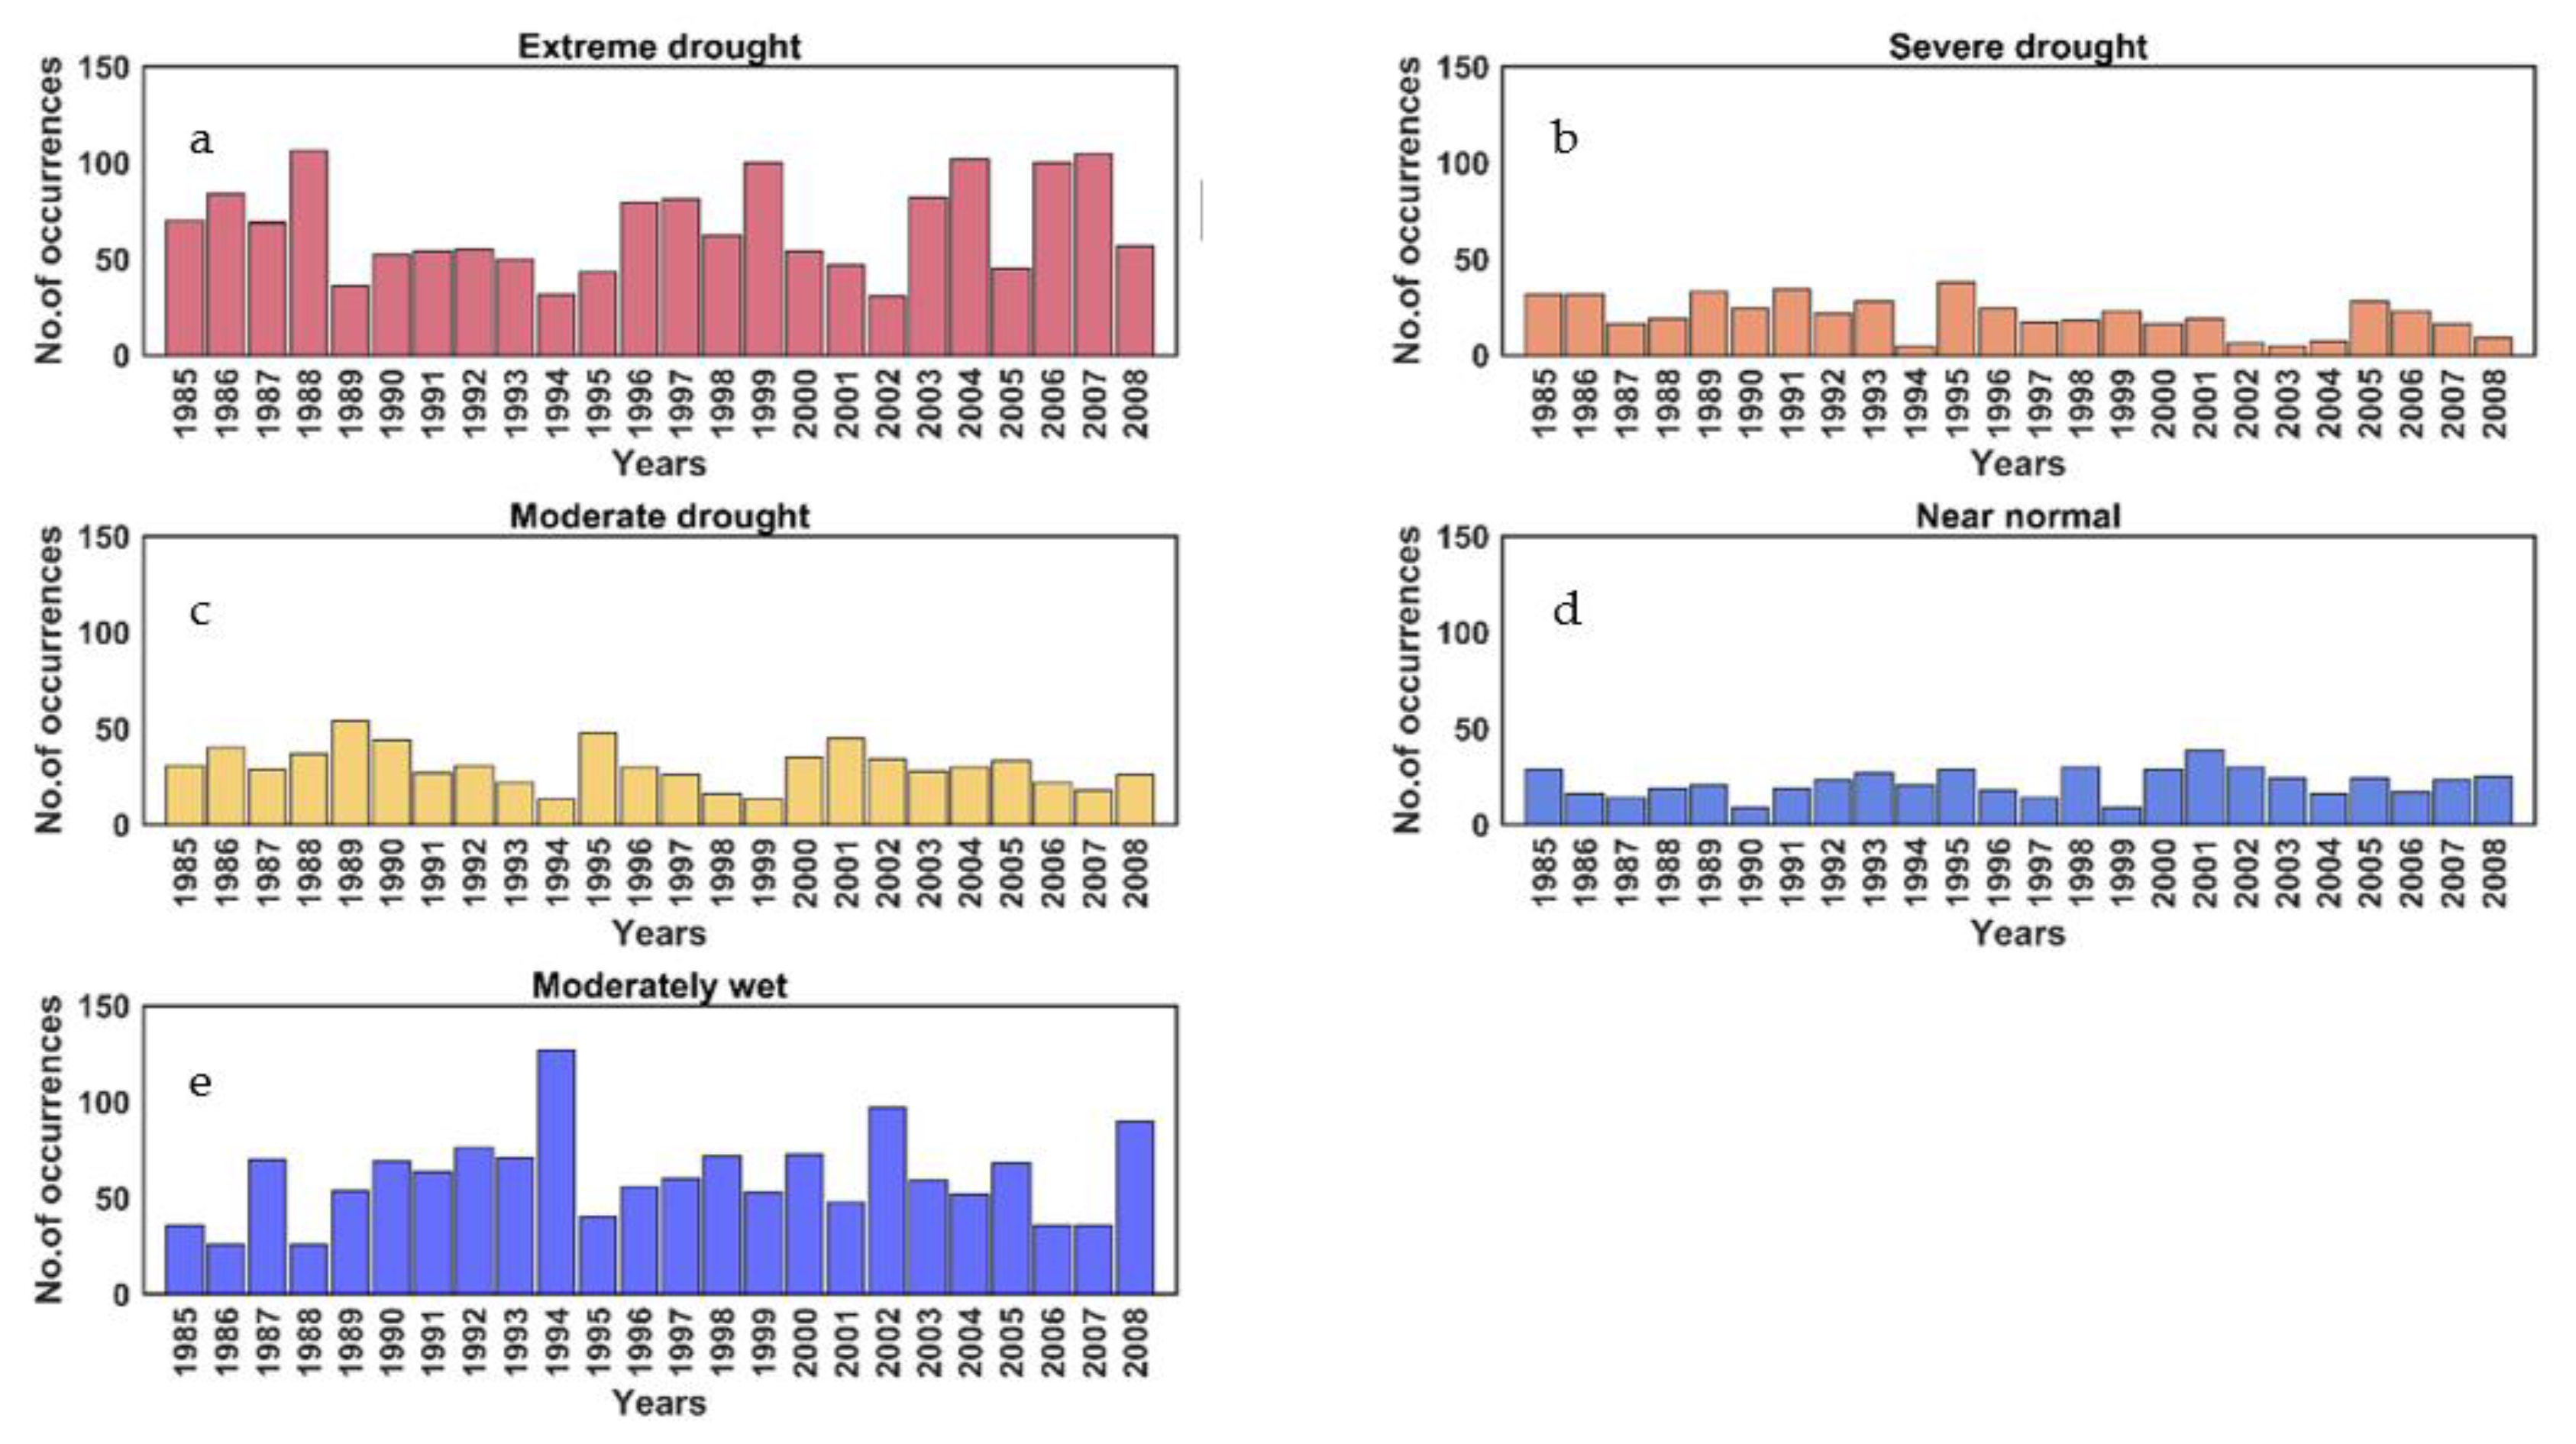
3.2. Agricultural Drought Progression and Its Characteristics

The progression of meteorological deficits into agricultural drought was evaluated for the sub-regions that experience the maximum drought duration over the analysis period. As identified from Figure 6, sub-regions 6, 7, 8, 9 and 10 experienced a longer duration of drought than the other sub-regions; these regions are dominated by agriculture and forested land cover. Therefore, the propagation study was carried out in one of the agricultural sub-regions (sub-region 9) and forested sub-regions (sub-region 7).
The historical droughts occurring in 1992 and 2000 were used for studying the propagation based on the characteristics as shown in Table 2. First, the pools of rainfall deficits were identified from the change in the mean and slope of the PN time series (Figure 7). For the 1992 drought, one of such pools of deficits started from the 43rd week (October) of 1991 in sub-region 9 and lasted for about 839 days until the 49th week (December) of 1993. The continued deficit in soil moisture was noted after the 49th week (December) of 1991, which shows about 6 weeks of lag between the pooled precipitation deficit and its effect on the soil moisture.
The maximum attenuation that occurred was −1.0 for SMDI and −1.9 for ETDI, which falls into the severe drought category (Table 1). Sub-region 9 with single-season agricultural land cover experienced frequent extreme precipitation deficits in the year 2000 during the NE monsoon (Figure 8), the effect of which is reflected in soil moisture and evapotranspiration. The soil moisture deficit lasted for 476 days in 2004- 2005 with a maximum attenuation of SMDI of −2.95 in 2004.
The ET deficit was almost always followed by the precipitation deficit, and soil moisture progressed to a severe drought 7 weeks after the onset of the precipitation deficit. The soil water deficit remained above normal from the 25th week (June) in 2000 (SW monsoon) with a declining trend until 2005; the maximum deficit of soil moisture of −2.95 that occurred in the 46th week (November) of 2004 was caused by the maximum ETDI of −2.73 in the 41st week (October) of 2004.
A closer look at the weekly rainfall in the previous year i.e., 2003, indicated that during the 52 weeks of the year, about 39 weeks received below-average rainfall. Both SMDI and ETDI deficits lasted until the 29th week (July) of 2005, which makes the length of the propagation of 420 days. The forested sub-region 7 showed a similar response to precipitation deficits during the 1992 drought (Figure 9). The deficit in rainfall during the SW monsoon reduced soil moisture and resulted in a long-term effect on it. However, the rainfall that occurred during the NE monsoon increased the near-surface soil water to a greater extent and was primarily used for the ET demand. It can also be noticed from SMDI and ETDI that when the rainfall was closer to the larger values of PN (wet category), the soil moisture began to increase (Figure 9a,b). On the 33rd (August) week of 1991, when the wet season rainfall was closer to normal rainfall, there was an increasing trend observed in ETDI and SMDI towards positive values.
Beginning from the NE monsoon of 1991–1992, the rainfall remained below normal causing ETDI to attain the maximum deficit of −1.60 in the 14th (April) week of 1992 (moderate drought) and consequently, SMDI attenuated to a maximum of −2.0 in the 18th week (May) of 1992 (severe drought). Until the 30th week (July) of 1992, the rainfall was increasing, close to the long-term average, thus allowing the soil water and plant water deficit to decrease. After the 30th week, there was a decreasing trend in PN values, as shown by the change points, causing the ETDI and SMDI to not recuperate towards the surplus. The 2000 drought showed (Figure 10) a similar pattern where the occurrence of the precipitation deficit in the 31st week (August) of 2004 caused an SMDI deficit until the end of 2005. Once the anomaly in precipitation began to decrease after the 23rd week (June) of 2005 (beginning of SW monsoon), there was a slight increase in the SMDI value.
However, the increase in rainfall was not adequate to increase the soil water and hence the available plant water was deficient for vegetation. The lengthening of the drought lasted for more than a year and the attenuation fell into moderate to severe drought as per Table 1. The lag at which the drought progresses from the precipitation anomalies into soil moisture and ET anomalies shows (Figure 11a–c) that these sub-regions are vulnerable to anomalies in precipitation with a response time of less than 5 weeks (Figure 11a). ETDI in more than 95% of the area of LMB showed a lag of 0–1 week with precipitation anomalies (Figure 11b). Longer time lags in SMDI were noticed where evergreen forests are dominant and where rainfed rice cultivation, especially the single season cropping, is practiced in parts of sub-regions 2, 7, 8 and 9 (Figure 11c). The percentage area impacted by shorter lags in each of these sub-basins was 100%, whereas in sub-region 7, 9% of the area (primarily forested areas) showed a longer response time, i.e., this region sustained soil moisture for a longer duration during the periods of precipitation deficits.

4. Discussions

4.1. Indices of Precipitation, Soil Moisture and ET Deficits

The precipitation, soil moisture and ET deficit metrics PN, SMDI and ETDI captured the drought years in LMB as identified in the literature [26,27,28]. The basin-wide deficit that occurred in 1992 (Figure 4 and Figure 5) and the 1997–1998 and 2003–2006 extreme deficit years were identified by PN. The drought that occurred in 1991–1994 was the longest with the deficits pooling from May 1991 until June 1994 i.e., 38 months as identified by [28]. Our results showed the 1991–1994 drought was the longest drought with more than 839 days of pools of precipitation deficits (Figure 7) until 22 May 1994.
The pooled deficits vary with intermittent rainfall in 1991–1994. For the 1992 drought, the effect of reduced precipitation began to be reflected in plant available water and soil moisture in the last week of September 1991 and continued until the second week of December 1993. The lowland rice cultivation is more vulnerable to the precipitation deficit when the NE monsoon is extended well into the period of SW monsoon as described above for the drought year 1992. Similarly, the 1997–1998 drought was identified as having a drought duration of 20–22 weeks by [26], which was also identified by the proposed precipitation deficit index PN.
The historical drought events in 2000–2006 have also been captured by these indices. Deficits in these years were reported to occur in April-May of 2001–2003 and 2005. PN detected these deficits in weeks 17–23 with index values below 55%, i.e., in the severely dry category. The 2005 drought was caused by the delayed SW monsoon, which can be noted by the PN values in the moderately dry to severely dry category until the 29th week (July) of 2005 that can be traced back to the 39th (September-October) week of 2004 where the PN values are under the moderately dry to severely dry condition [28]. The severe drought in the year 2005 in fact started in 2003 and lasted until 2006 [27], which can be seen by the decreasing trend of rainfall as well as the increasing number of rainfall anomalies from 2003 to 2005 (Figure 8 and Figure 10).
Soil moisture fluctuations identified using PDSI [28] also showed the drought from 2003–2006, while the year 2005 was shown to have experienced a severe but short-duration drought. The SMDI (Figure 8) depicted this deficiency in 2005, which started in the last quarter of 2004 and extended until July 2005. As noted by [26], the meteorological deficit that lasted 2003–2006 caused an increase in the soil moisture deficit from the 40th week of 2002 and extended past 2005. The maximum soil moisture deficit occurred in the 43rd week (October) of 2004, which corresponds to the precipitation deficit that started in the 39th week (September–October) of 2004. The deficit in plant water availability also reflected these changes in precipitation and soil moisture; the declining trend of ETDI began after the 40th week (September–October) of 2002 and extended until late 2005 with an intermittent surplus of water in the first few weeks of 2004. Considering the complexity of MRB with the high spatial variability and distinctive drainage patterns [29], SMDI and ETDI indices were able to mimic these deficits and are therefore considered to be suitable indices for describing drought identification and its progression in MRB.

4.2. Drought Propagation

The drought events identified using SMDI and ETDI began as short-term incidences that might either recover or facilitate the onset of an impending long-term drought [30]. The soil moisture anomalies are fewer and longer in response to fewer and longer meteorological anomalies in 1991–1994, during which the most severe and longest precipitation deficit was observed in 1992 (Figure 6b–c). When we move on to the extremely dry period in 2000–2006, there are many smaller precipitation anomalies that resulted in smaller soil moisture deficiencies (Figure 8 and Figure 10).
The deficit years 2001–2005 in the agricultural sub-region resulted in ETDI in the 13th–17th weeks, i.e., the growing season, of 2002 and 2003 and the 18th–21st weeks (May) of 2005, which could cause vegetative stress. The crop yield in the region [29] also showed a reduction of primary vegetation productivity in the year 2005 compared to the previous year 2004. The reduction in ET during this period corroborated with a decrease in crop yield as may be seen from Figure 10. The reduction in soil moisture and plant available water was at its maximum in the 1st week of 2005 until June-July of 2005 in both agricultural and forested sub-regions. This led to the seven-month-long reduction in gross primary productivity in LMB [26]. The last quarter (September–October) of 2004 (39th week) with decreasing precipitation and soil moisture was the trigger point for the 2005 region-wide drought as rainfall during this period is essential for autumn rice planting of rain-fed cultivation.
In the wettest year observed in 2008, the NE monsoon received above normal precipitation in January-May causing surplus soil water (SMDI > 0) and hence more plant available water (ETDI > 0). Similar predictions of soil moisture and ET were observed in January-May 2008, which proves that any positive anomaly in monsoon rainfall results in a wetter year while a long-duration negative anomaly leads to a drier year. any rainfall in extreme dry years was supplied to vegetation ET [31] as shown by the positive ETDI values (Figure 9 and Figure 10); this consequently leads to a soil moisture deficit as observed from the negative SMDI values. The pooling of such soil moisture deficits lasted for more than two years and progressed from the 46th week of 1991 to the 48th week of 1993. On the contrary, the pooling of ETDI lasted throughout the extreme dry years in 2003–2006 with a soil moisture pooling of 420 days. Therefore, for agricultural drought studies, ET deficits must be incorporated with precipitation deficits to capture soil moisture variations. In this aspect, the indices SMDI and ETDI are effective in identifying the drought progression characteristics and hence could also be used to identify vulnerable areas in MRB.
Eastern Thailand and Cambodia in MRB have been identified as the drought-prone regions in the basin based on the indices adopted in the study. Parts of northern Lao PDR, where evergreen forests are the predominant land cover, also show vulnerability to precipitation deficits (Figure 6a–c). As [8] noted, areas with homogeneous cover respond rapidly compared to non-homogenous vegetative cover. Our results substantiate agricultural areas are susceptible to deficits caused by seasonal variations of precipitation and ET demand. This is also proven by the shorter lags at which the soil moisture anomalies develop due to precipitation anomalies, compared to the longer duration lags in forested areas (Figure 11). With shallow rooted rice plants having low water-holding capacities, the agriculturally dominated sub-regions are vulnerable to precipitation deficits. Single-season rice cultivation is shown to have longer drought durations and less time to respond to precipitation anomalies as it is rainfed and the ET demand is high in periods of no or low rainfall. The deep-rooted forest vegetation on the other hand can withstand short-term precipitation deficits as they have more water-holding capacities than shallow rooted rice plants [32].
The deficit in precipitation that occurs in the NE monsoon used for ET was also shown to lessen the surface water stress [33], implying near-surface soil moisture conditions have stronger temporal stability (Figure 8 and Figure 10) during dry years than in wet years [31]. The pooling of drought events was in part controlled by the frequency and duration of the precipitation deficit in addition to the catchment and land cover characteristics. If shorter and less-frequent deficits in precipitation with surplus soil moisture storage occurs, then the entire precipitation was used for ET. The seasonal fluctuations in precipitation and ET result in SMDI > 0 and ETDI > 0 as crops experience water stress only after ET begins to decrease.
It has also been noted by [8] for LMB that homogeneous vegetation such as agriculture cover responds instantaneously to the precipitation deficit in comparison to the vegetation that is heterogeneous, as may be seen from Figure 11c. The maximum time to respond for SMDI with respect to ETDI was higher in areas covered by evergreen forests in parts of Cambodia and Thailand; the areas with agricultural practices in parts of Thailand and Lao PDR showed ET deficits increasing with the soil moisture deficit. Forest landcover with a deeper root profile shows a longer time of response between ETDI and SMDI compared to the shallow-rooted agricultural areas. Therefore, studies on the evolution of agricultural drought should not be limited to precipitation and soil moisture but must have ET as a primary variable to describe soil moisture fluctuations.
The properties of drought propagation (lag, attenuation, lengthening) showed surface soil moisture responds quickly (since top-layer soil moisture from SWAT is used) to the precipitation deficits with a lag ranging from 0–3 weeks, the attenuation of SMDI maximize at −2.95 in severe drought years such as in 2005 and the recovery takes more than a year. In the drought year 1992, the deficient precipitation showed instantaneous fluctuations in soil moisture with no lag. However, due to the degree of deficit in precipitation, the recovery of the soil deficit is slowed down and the dry period is extended until the end of 1993, resulting in a moderate drought in the plant water deficit (with an ETDI value of −1.6).

5. Conclusions

In summary, the key factor in risk identification of agricultural drought is the computation of its spatio-temporal features e.g., frequency and duration, because it follows a meteorological drought. Past literature on agricultural drought, particularly in LMB, focused on the determination of these characteristics but lacks understanding of the temporal evolution of drought. To achieve this, we studied the progression of agricultural drought from meteorological drought. Not all meteorological drought transforms into agricultural drought, because of its lagged response and continuous land–surface atmospheric interaction coupled with positive feedback to and from the atmosphere [34]. This feedback mechanism could only be identified from propagation studies, rather than merely deriving drought characteristics. From our study, we draw the following conclusions about the evolution of meteorological drought into agricultural drought in the Mekong River Basin:
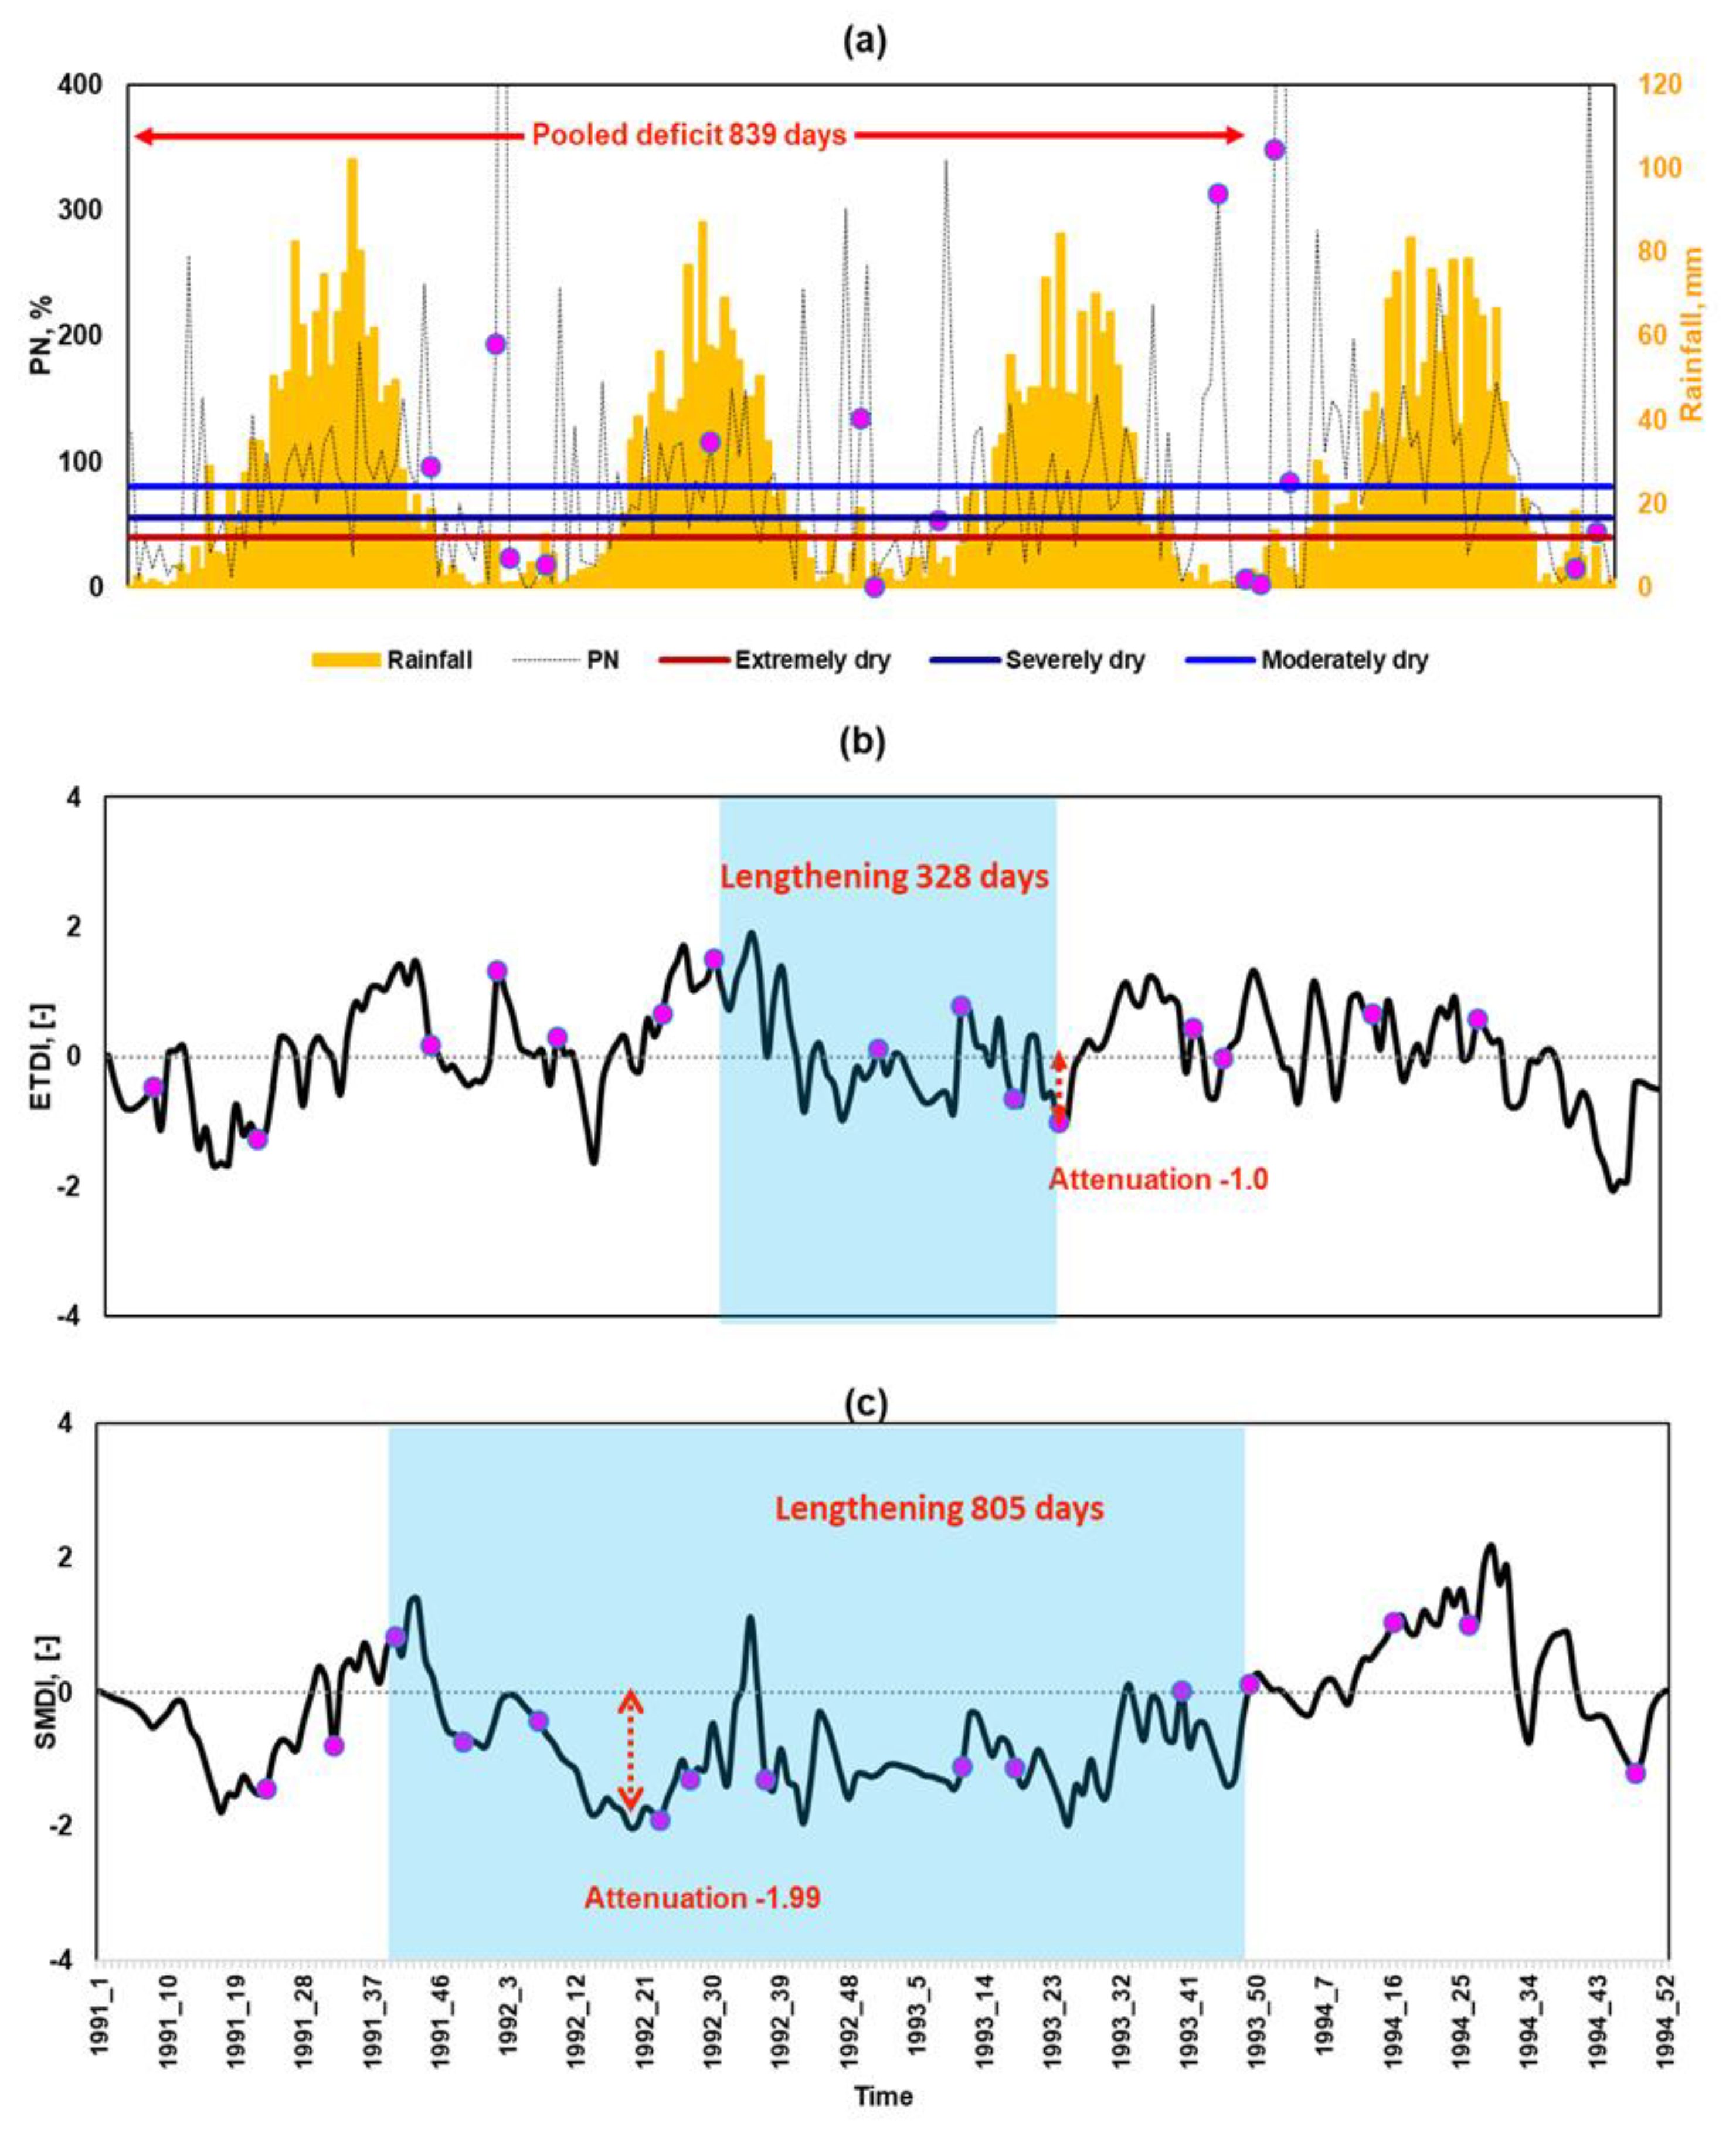
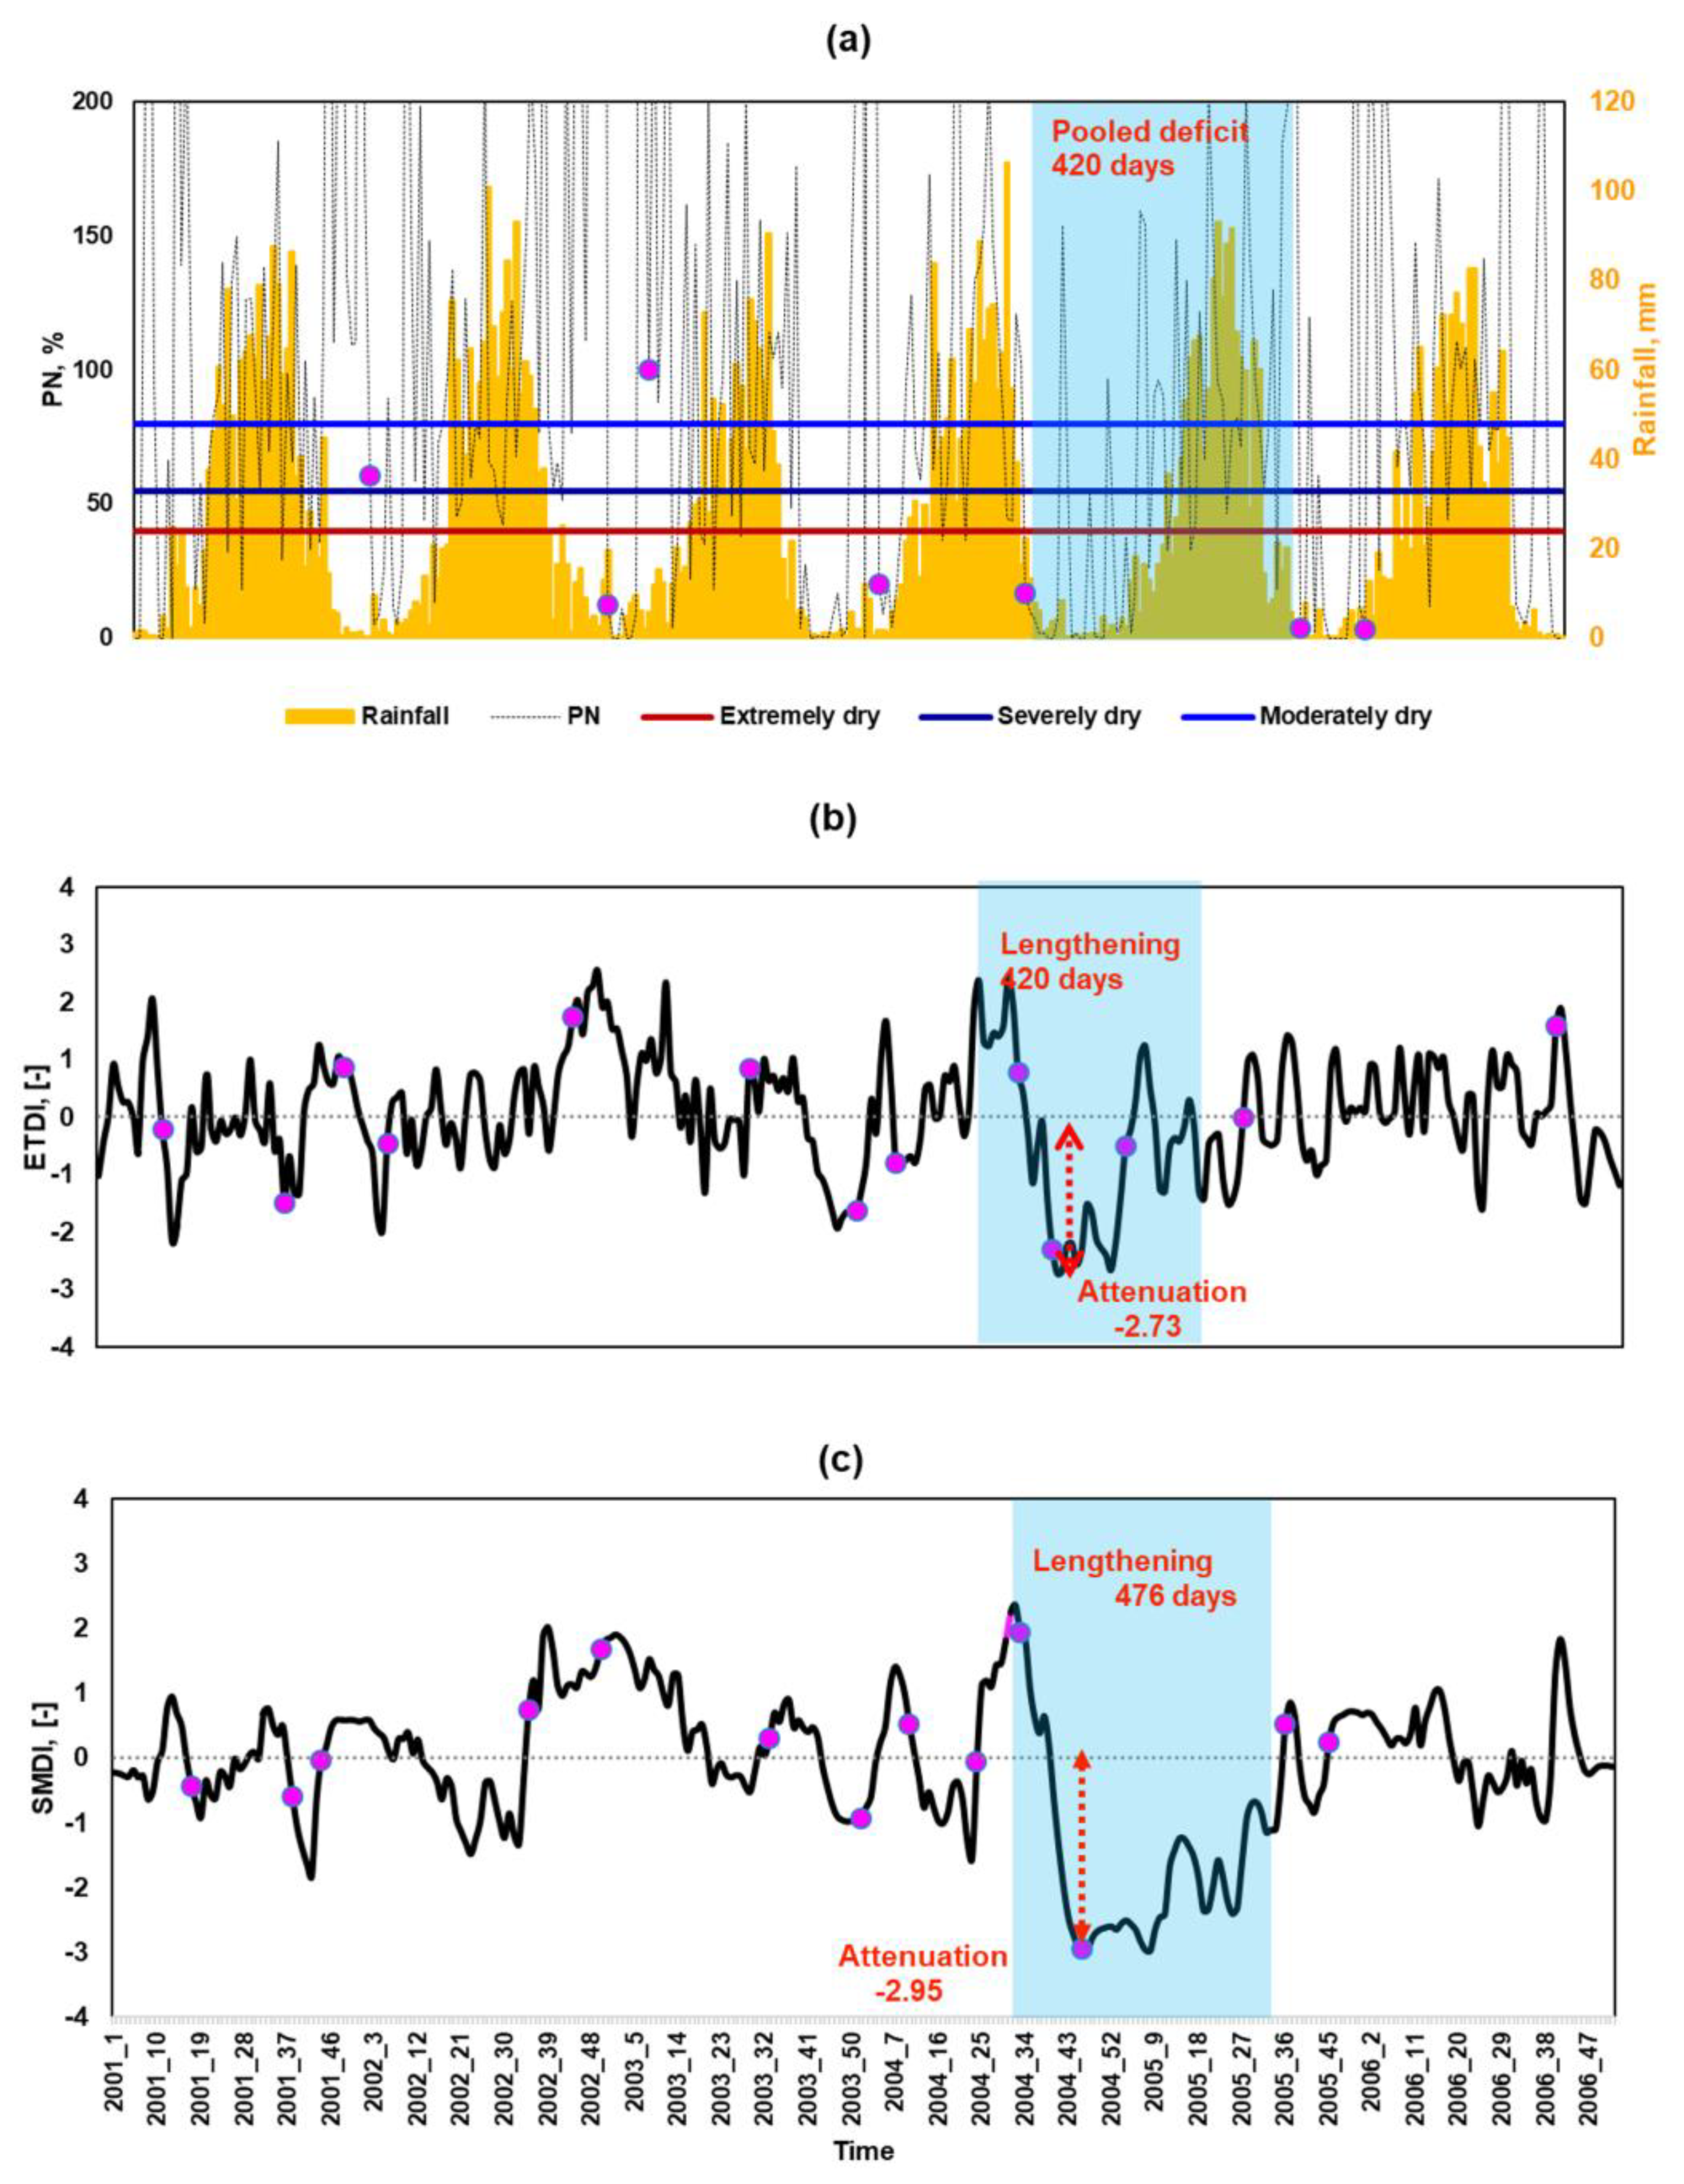
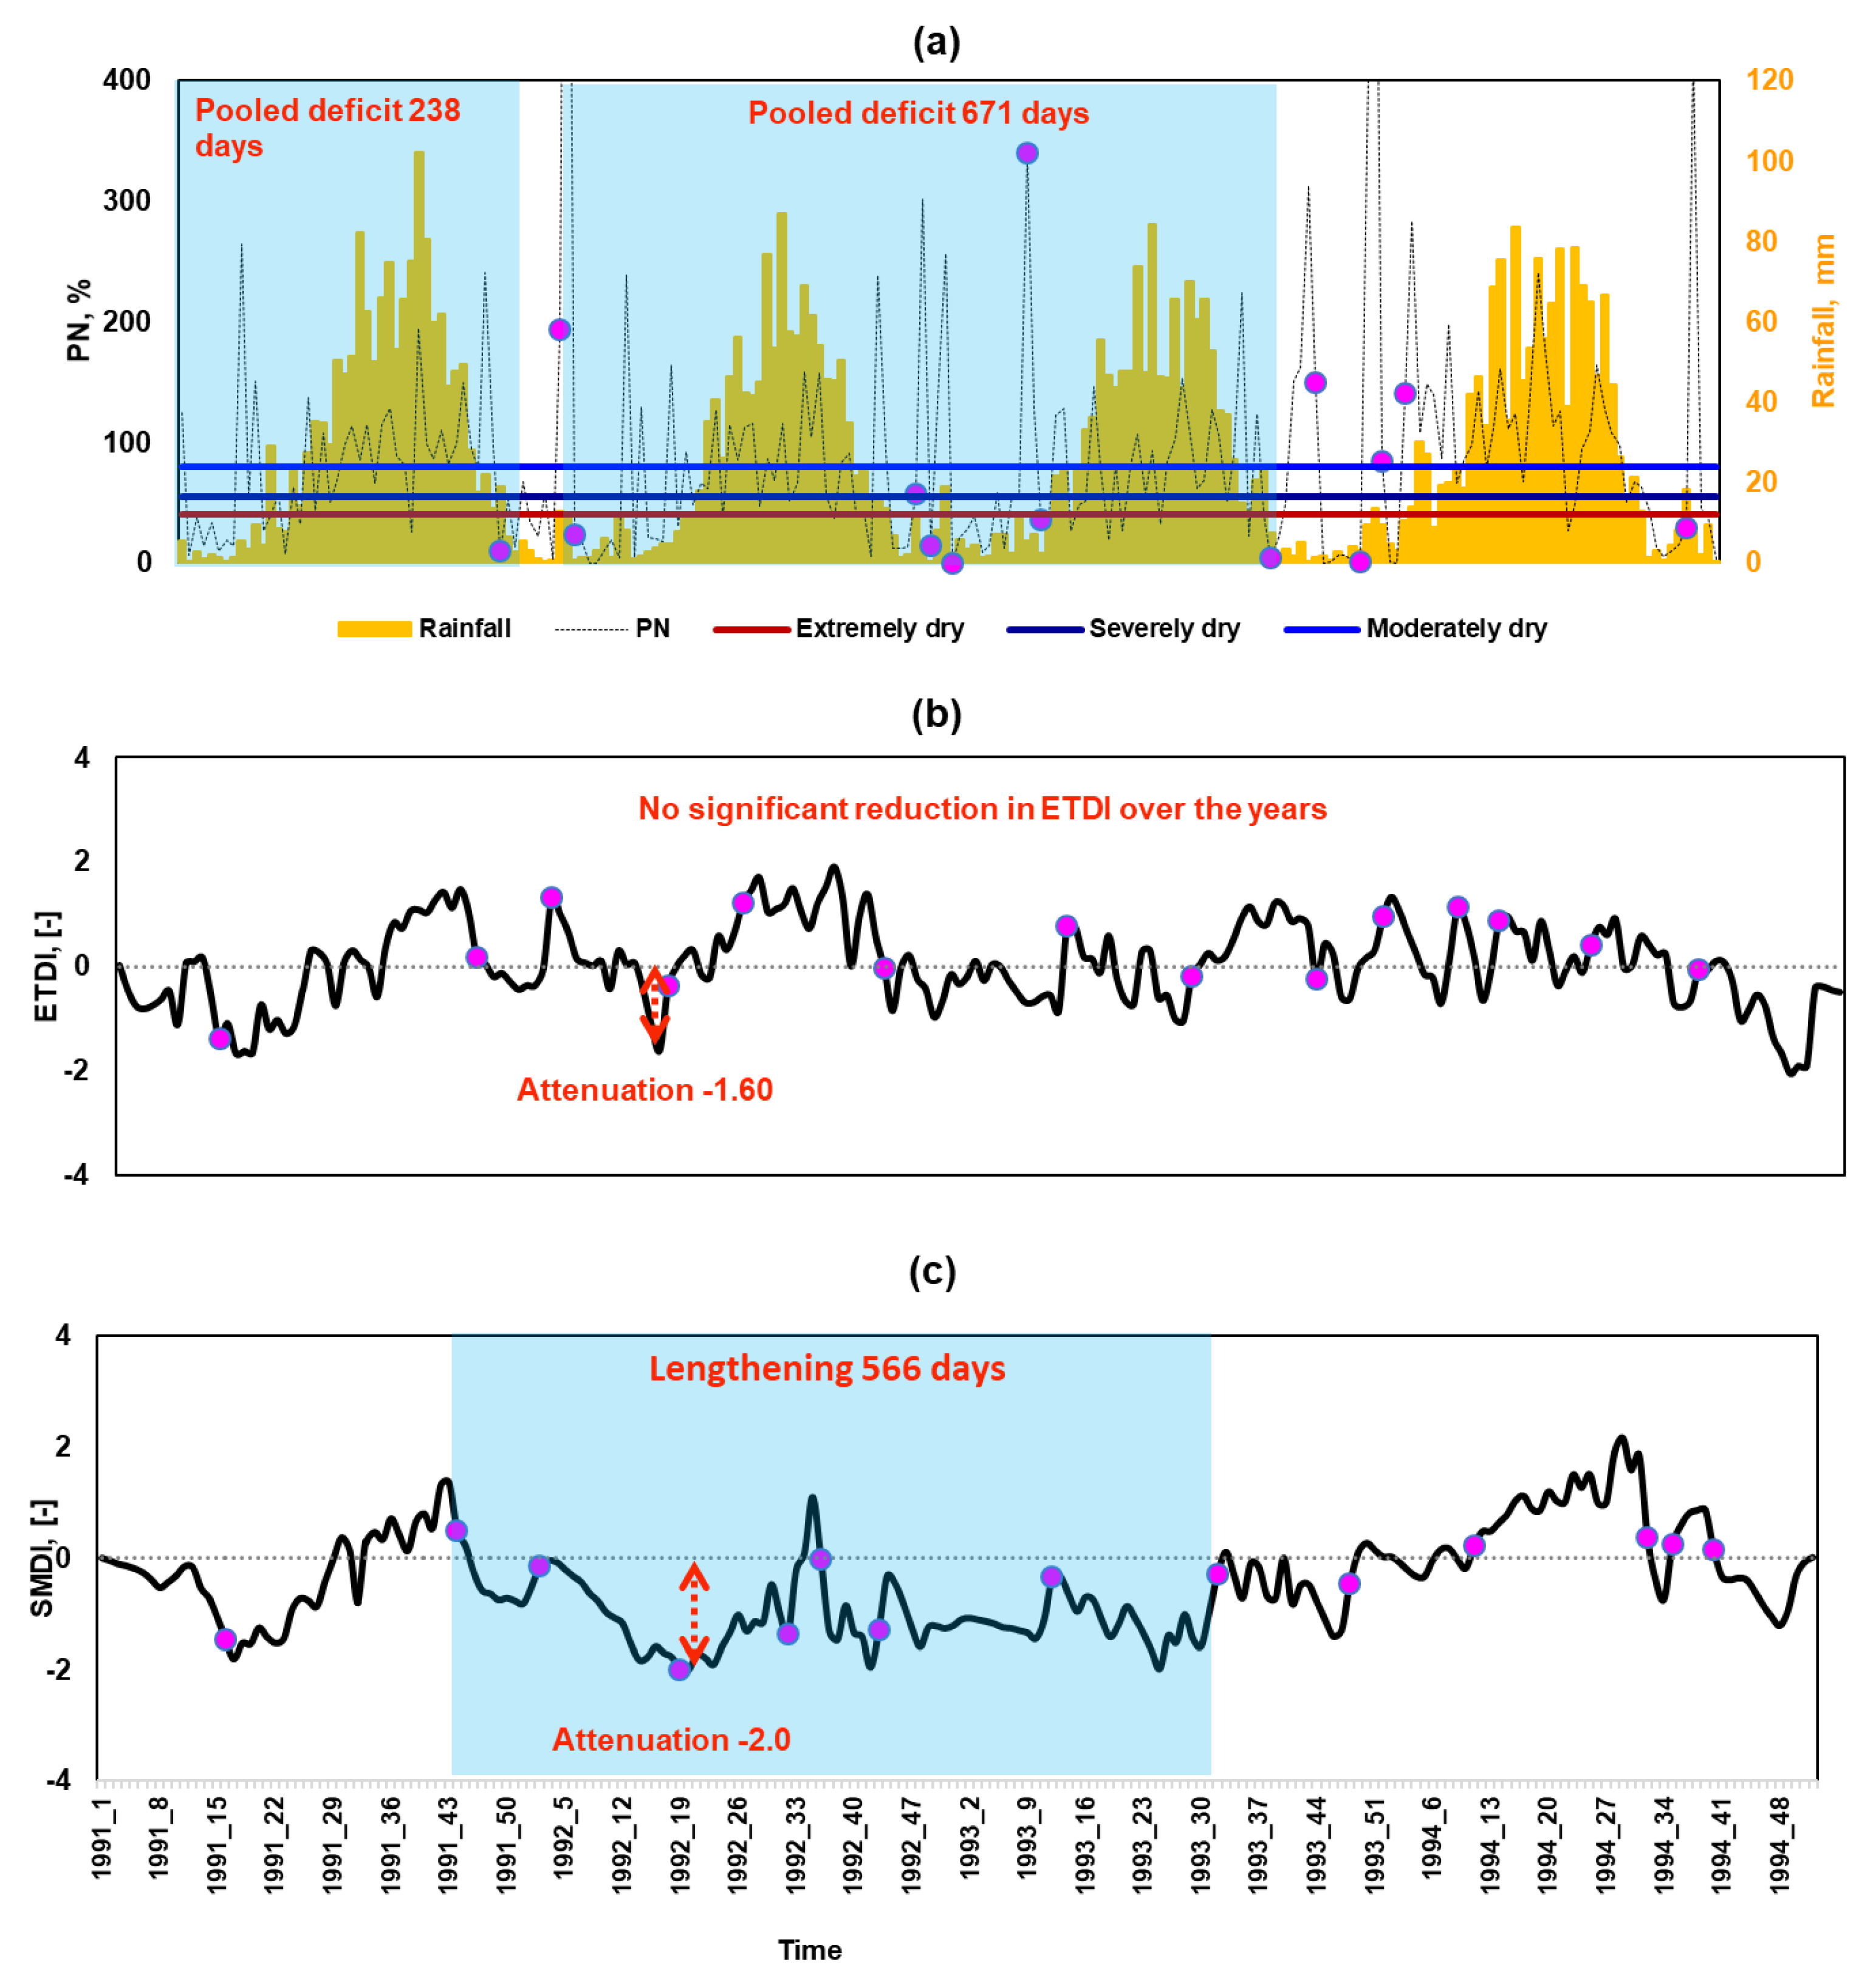
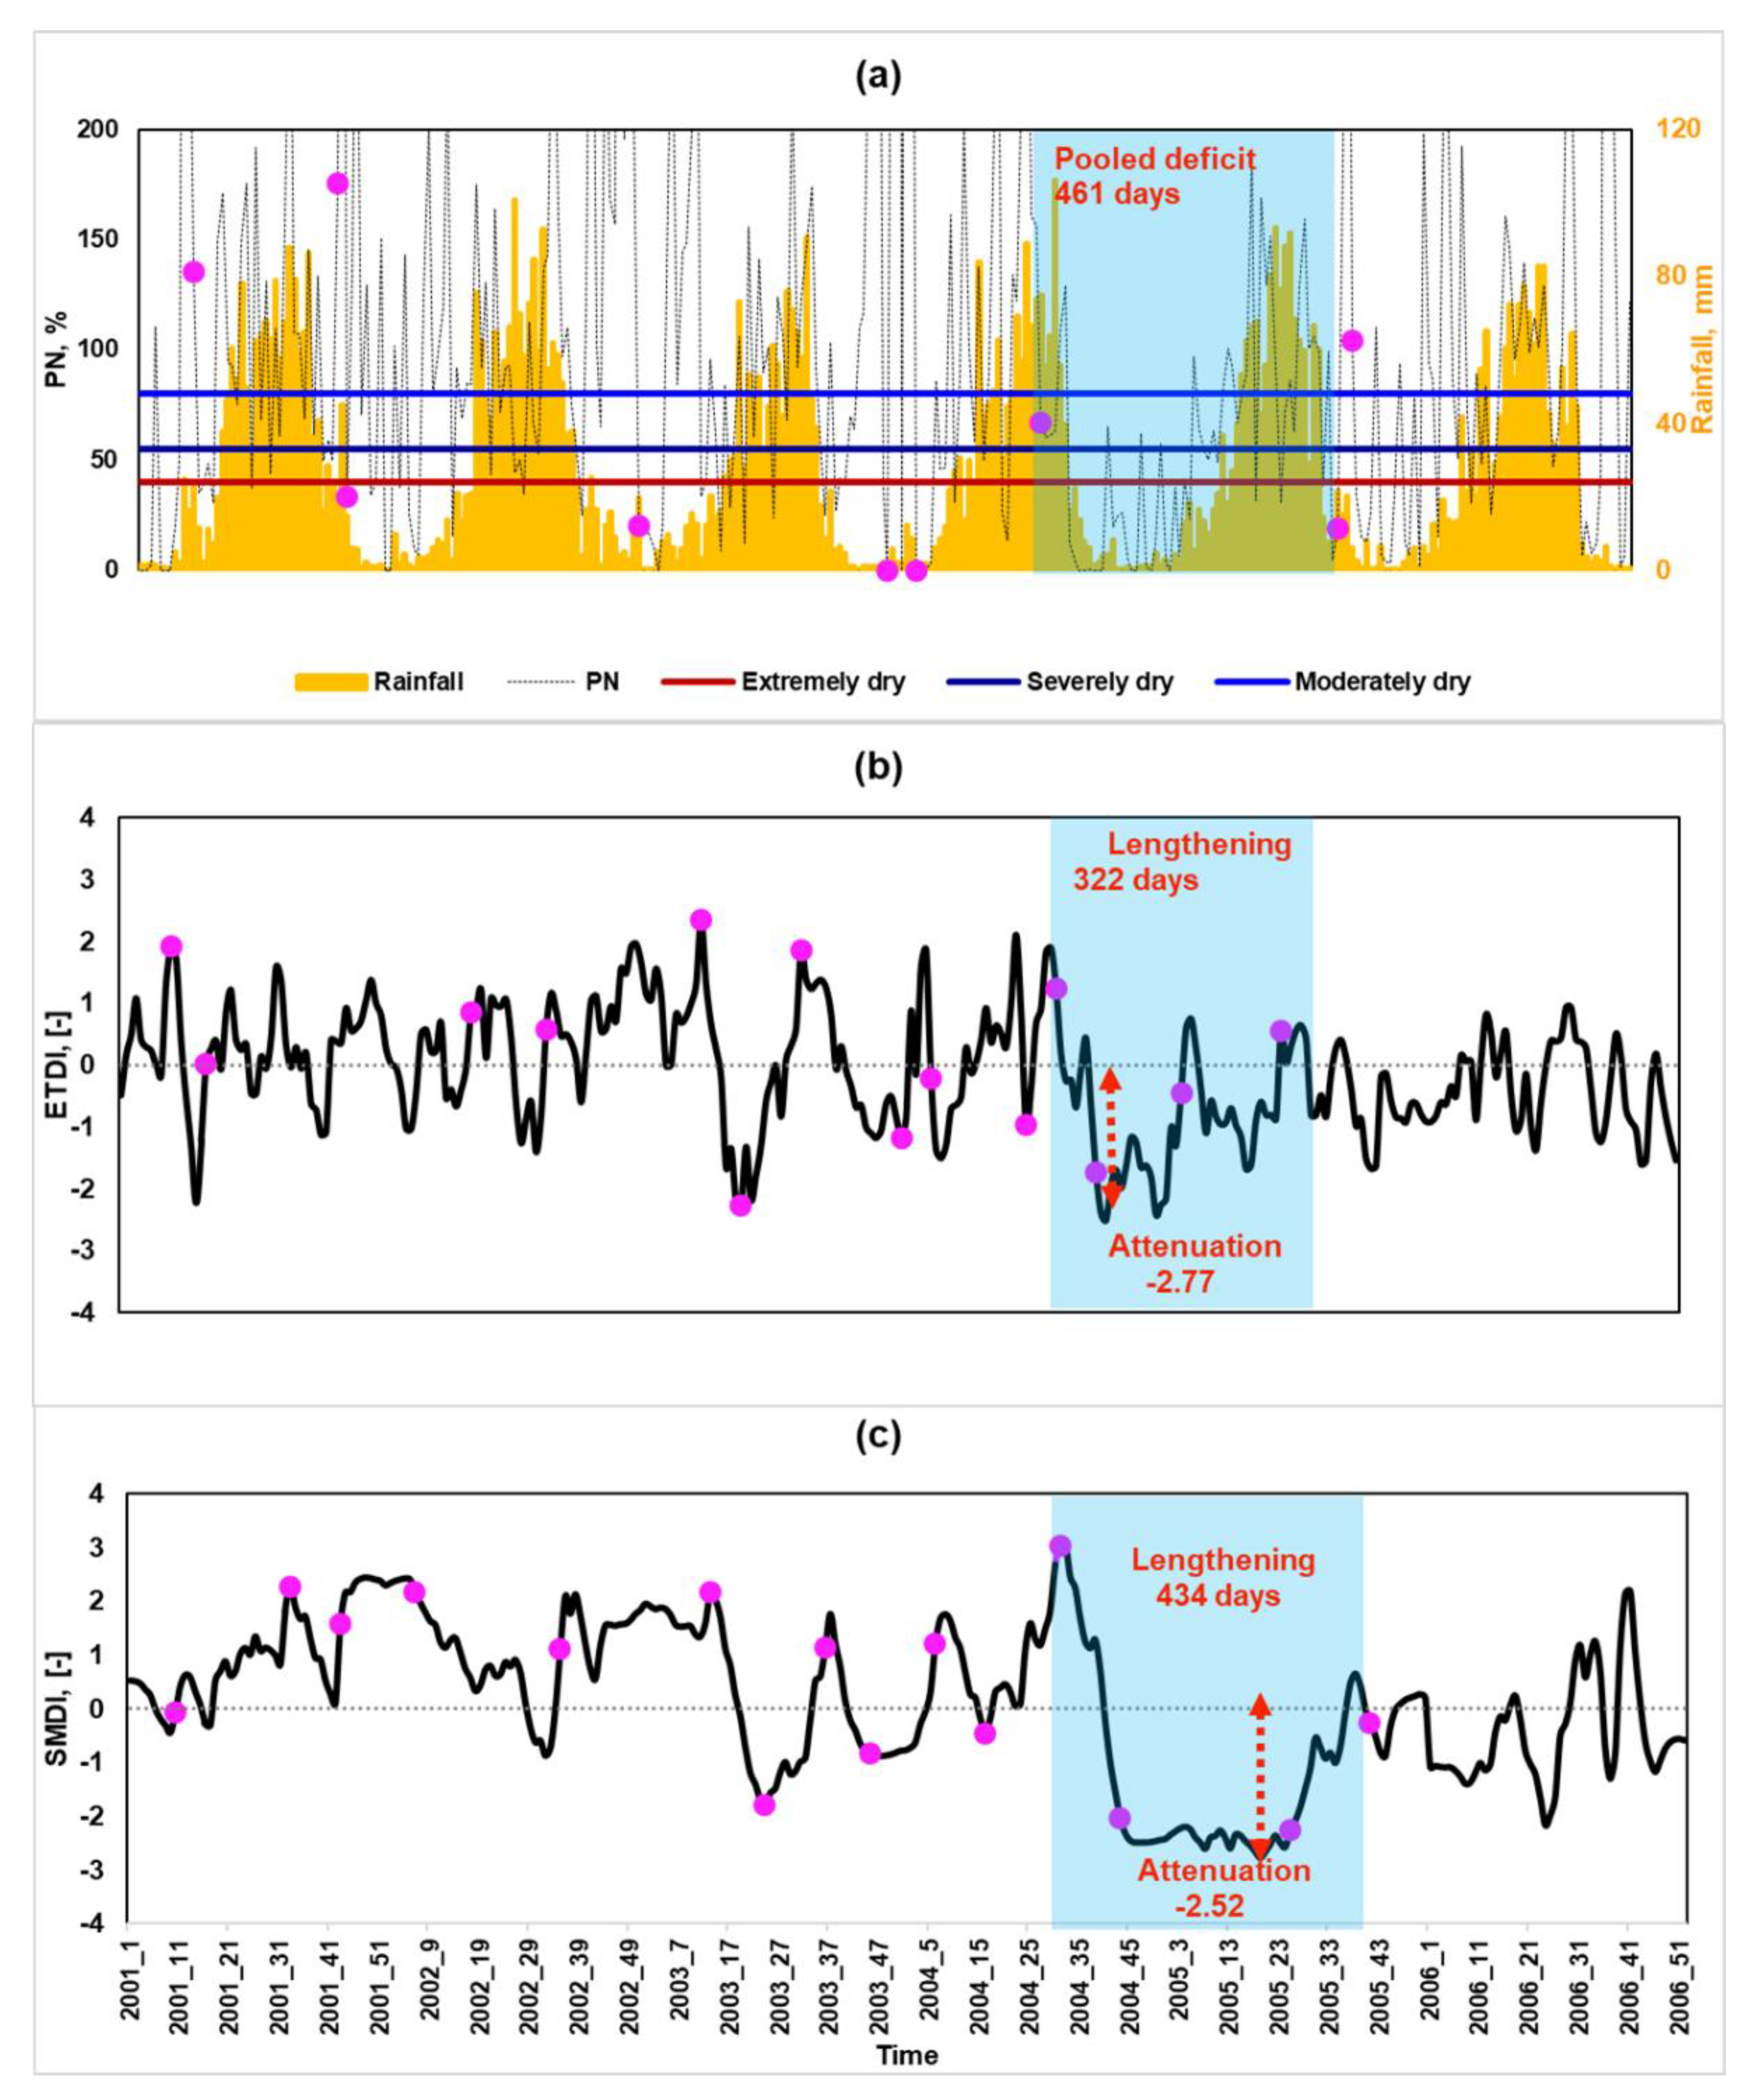
  • In LMB, the duration of the deficit during the historic 1992 drought resulted from precipitation anomalies that occurred in the first few weeks of 1991 and lasted until the first few weeks of 1994. The most-reported severe, short-term drought in 2005 started due to the early withdrawal of the SW monsoon in the 28th week (July) of 2004 and lasted until the 24th week (June) of 2005.
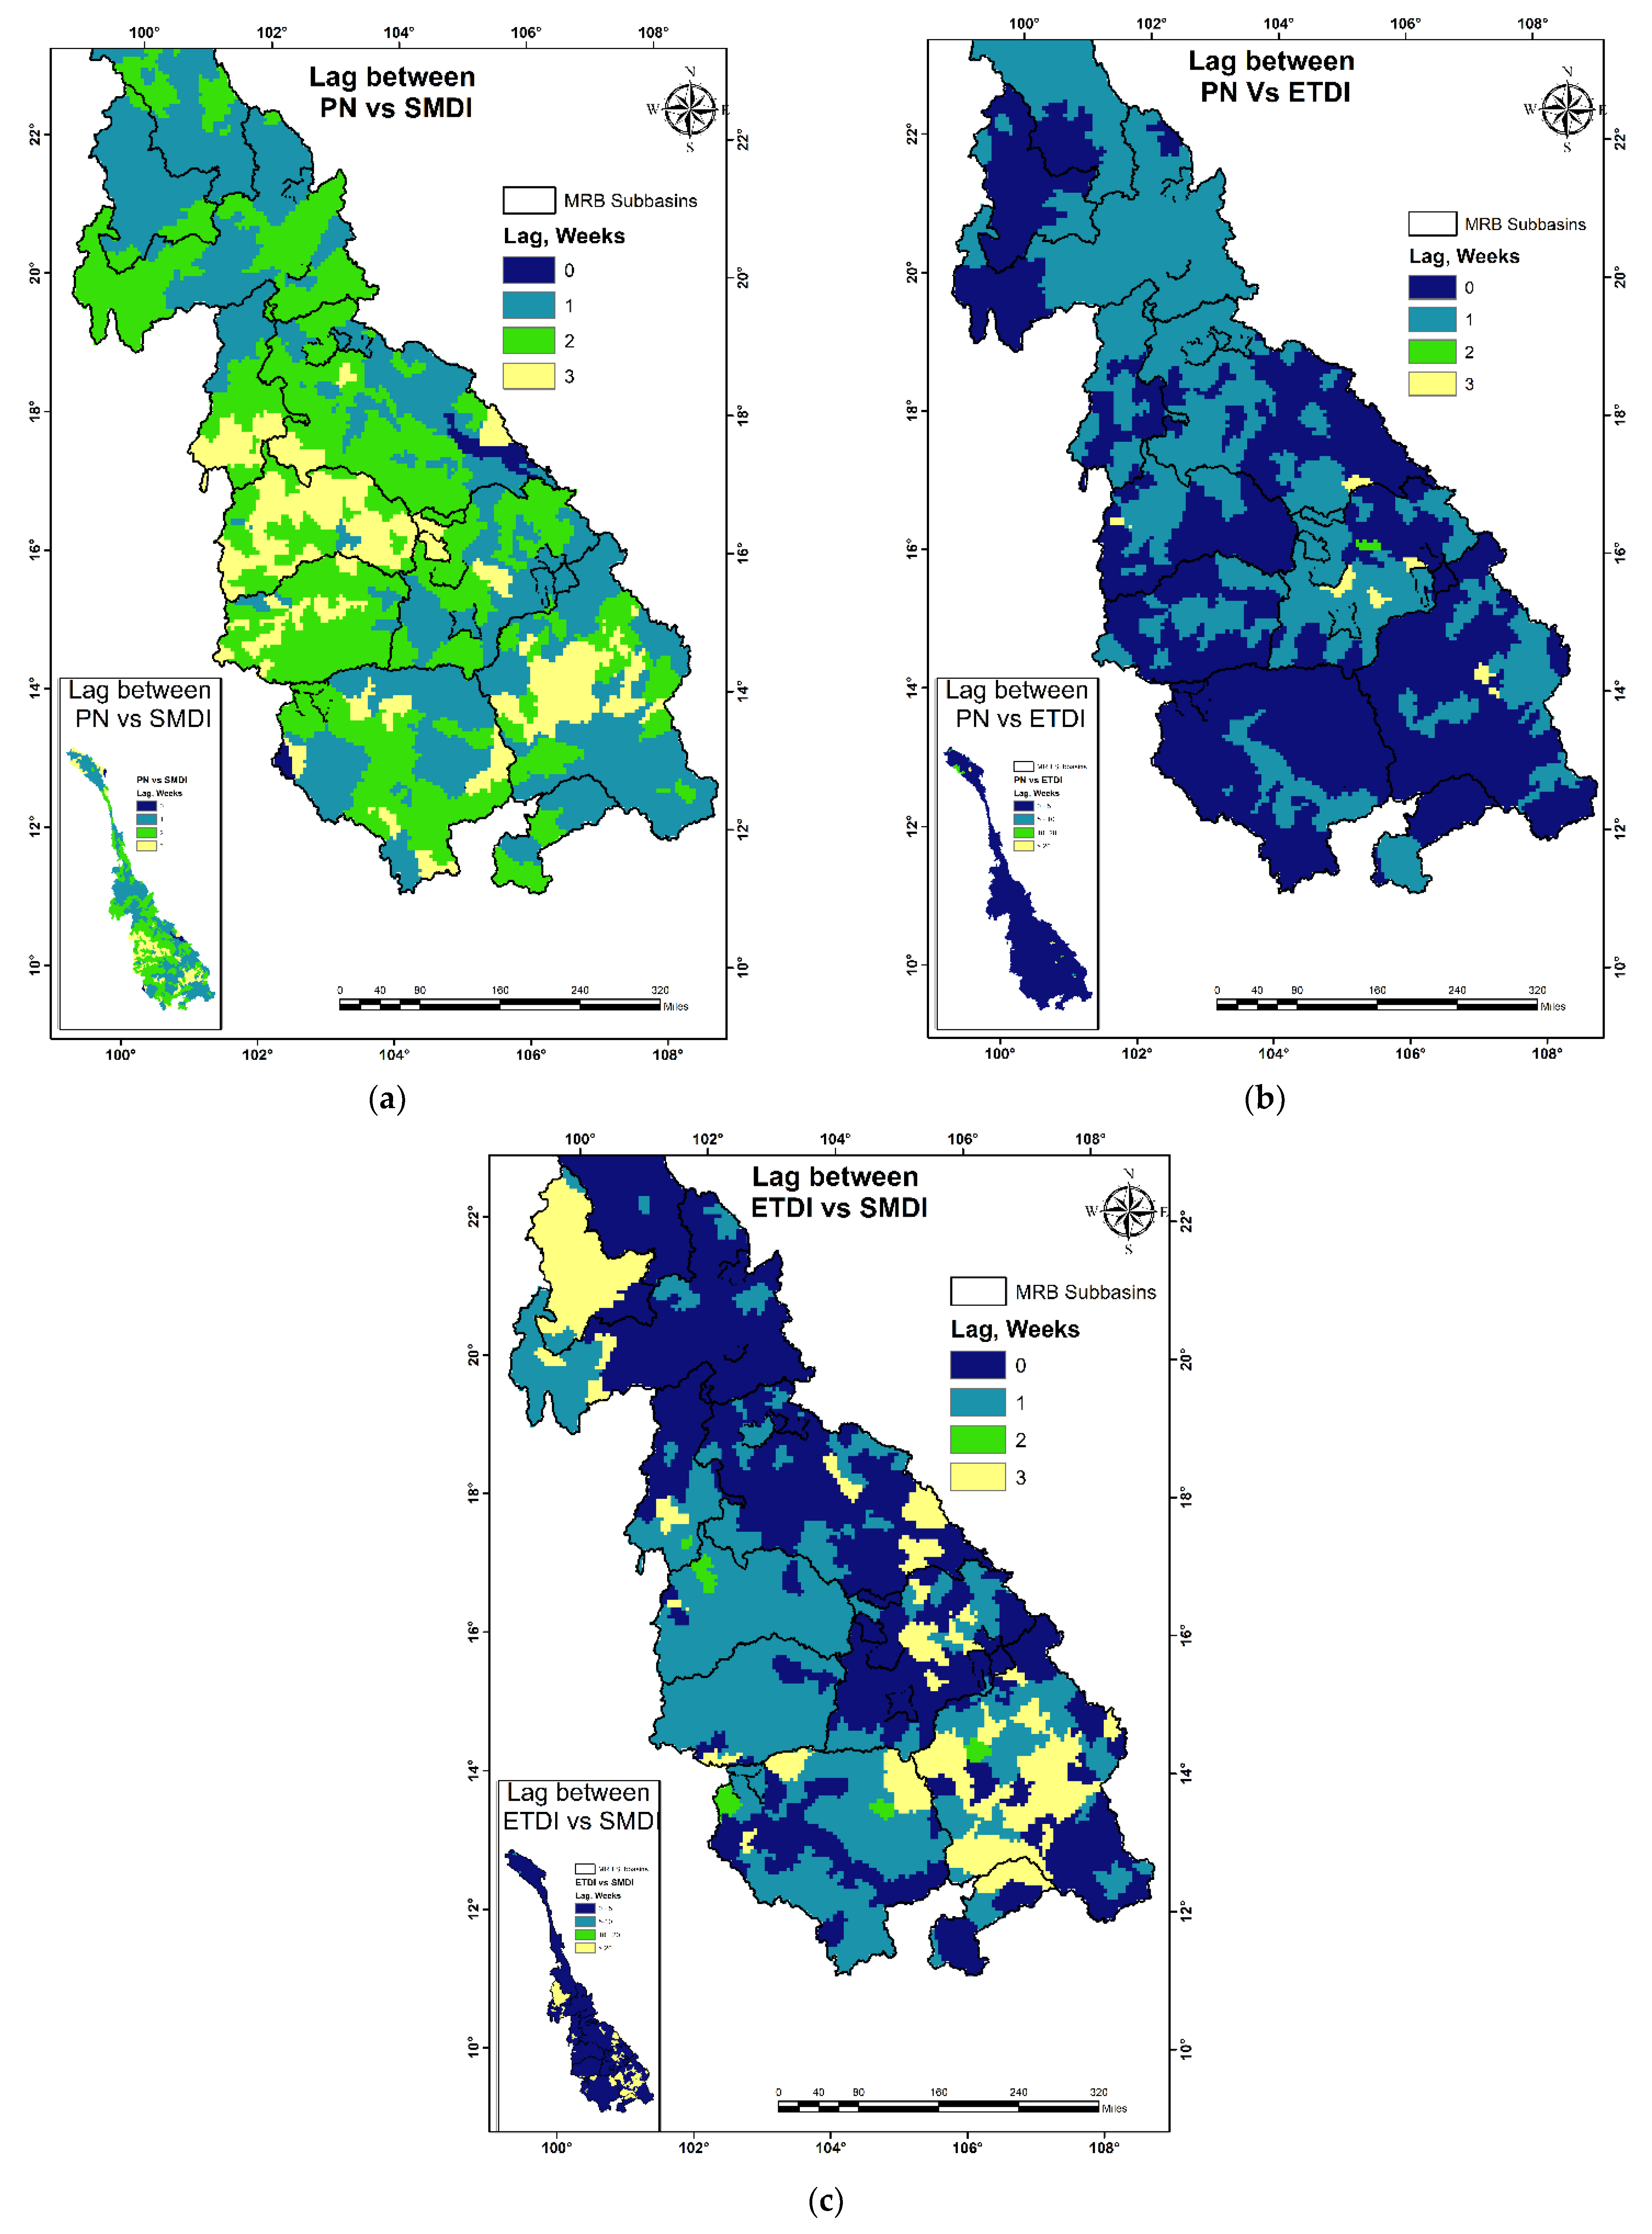
  • The response of soil moisture, as shown by SMDI, to the precipitation deficit was immediate in both agricultural and forested catchments as it is representative of near-surface moisture content. On the other hand, plant available water in the agricultural region, as shown by ETDI, was affected by the changes in meteorological deficits. In the natural vegetation region, however, the available water remained unaffected due to its deeper root profile.
  • The propagation from the precipitation deficit into an agricultural drought has shown that the 1992 drought resulted from fewer and longer soil moisture anomalies in response to fewer and longer meteorological anomalies from 1991. However, when we move on to relatively drier period in 2000–2006, many smaller precipitation anomalies resulted in many smaller soil moisture deficiencies. Any rainfall in extremely dry years was supplied to vegetation ET; this consequently leads to a soil moisture deficit. The pooling of such soil moisture deficits lasted for more than two years and progressed from the 46th week (November) of 1991 to the 48th week (November-December) of 1993.
  • The maximum attenuation of soil moisture and plant available water in response to pooled meteorological deficits in 1991–1992 for agricultural regions was in the moderate drought category, whereas in forested regions, it was in the severe drought category; the 2005 drought, however, was in the severe category for both natural and agricultural landcovers.
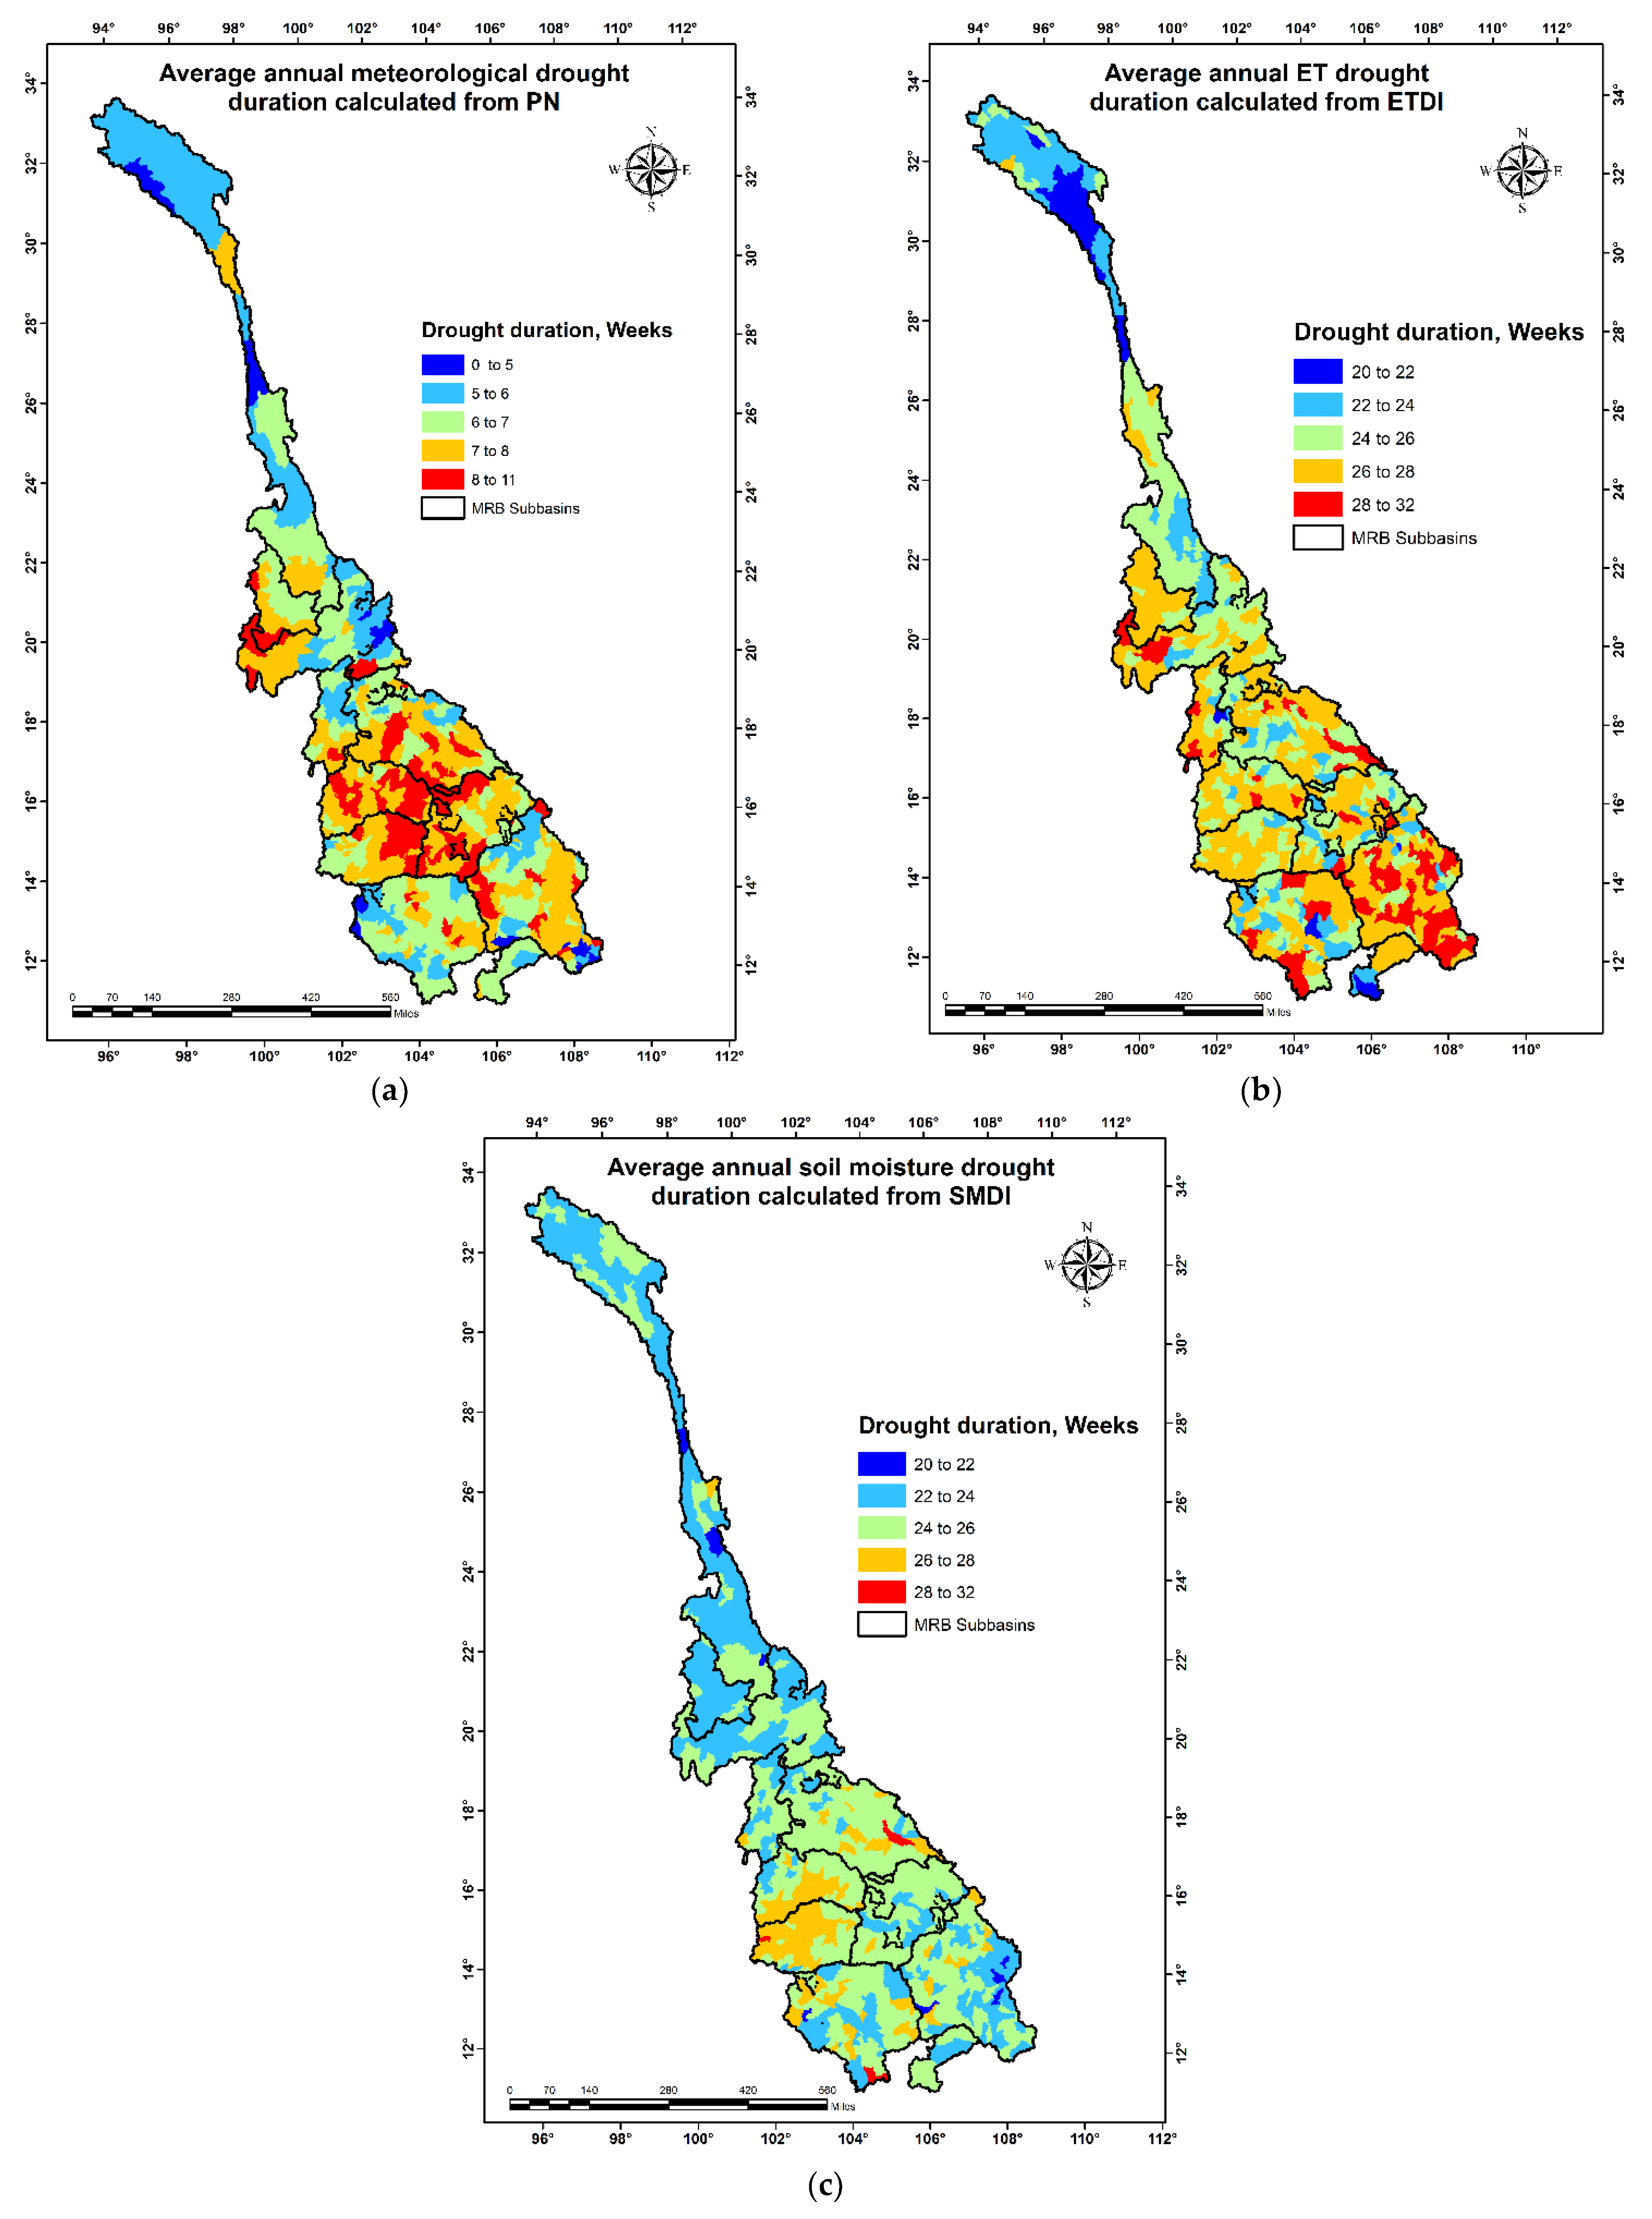
  • The spatial distribution of meteorological and soil moisture deficits showed Thailand, Cambodia and Lao, dominated by agricultural land use, are the most affected. Among these, areas with single-season rice cultivation are affected severely due to droughts. Further, the plant water deficit was predominant in parts of Cambodia and Thailand with natural forest land cover.
In concluding remarks, to understand the challenges in drought management and better drought preparedness, we need to improve our knowledge not only of their spatial and temporal variability but also on the evolution of drought. By understanding the development of one drought (e.g., soil moisture) from another (e.g., from rainfall deficits), effective drought prediction strategies can be devised to inform policymakers. The deficit indices adopted in this study predicted the propagation of historical meteorological drought into agricultural drought and provided insights into the feedback between soil moisture and plant water deficits based on SMDI and ETDI indices. Being short-term indices, SMDI and ETDI could be utilized to understand variations in soil moisture and plant water requirement during critical stages of crop growth. As drought propagation study facilitates understanding the evolution of agricultural drought from meteorological drought, our study provides a framework for further research in agricultural drought prediction strategies for developing drought-resilient agroecosystems.

Author Contributions

Author Contributions: B.P., B.N., and S.P. conceived and conceptualized this study; S.P., B.P., and B.N carried out formal analysis and investigation. Data curation and SWAT model calibration and validation by W.W., S.L., and R.S. (Rattykone Sayasane) with R.S assistance; supervision, project management by R.S. (Raghavan Srinivasan). Writing—original draft preparation by B.P.; writing—review and editing by all authors. All authors have read and agreed to the published version of the manuscript.

Funding

This research received no external funding.

Institutional Review Board Statement

Not applicable.

Informed Consent Statement

Not applicable.

Conflicts of Interest

The authors declare no conflict of interest.

References

  1. Beyene, B.S. Drought Classification, Propagation Analysis, and Prediction of Anomalies; No. 37; Wageningen University: Wageningen, The Netherlands, 2015. [Google Scholar]
  2. Swetalina, N.; Thomas, T. Evaluation of Hydrological Drought Characteristics for Bearma Basin in Bundelkhand Region of Central India. Procedia Technol. 2016, 24, 85–92. [Google Scholar] [CrossRef] [Green Version]
  3. Rickard, D.S. The occurrence of agricultural drought at Ashburton, New Zealand. N. Z. J. Agric. Res. 1960, 3, 431–441. [Google Scholar] [CrossRef] [Green Version]
  4. Carrão, H.; Russo, S.; Sepulcre-Canto, G.; Barbosa, P. An empirical standardized soil moisture index for agricultural drought assessment from remotely sensed data. Int. J. Appl. Earth Obs. Geoinf. 2016, 48, 74–84. [Google Scholar] [CrossRef]
  5. Thilakarathne, M.; Sridhar, V. Characterization of future drought conditions in the Lower Mekong River Basin. Weather. Clim. Extrem. 2017, 17, 47–58. [Google Scholar] [CrossRef]
  6. Mekong River Commission. Overview of the hydrology of the Mekong Basin; Mekong River Commission: Vientiane, Laos, 2005; p. 73. [Google Scholar]
  7. Li, D.; Long, D.; Zhao, J.; Lu, H.; Hong, Y. Observed changes in flow regimes in the Mekong River basin. J. Hydrol. 2017, 551, 217–232. [Google Scholar] [CrossRef]
  8. Lyon, S.W.; King, K.; Polpanich, O.-U.; Lacombe, G. Assessing hydrologic changes across the Lower Mekong Basin. J. Hydrol. Reg. Stud. 2017, 12, 303–314. [Google Scholar] [CrossRef]
  9. Mohammed, I.N.; Bolten, J.D.; Srinivasan, R.; Lakshmi, V. Improved Hydrological Decision Support System for the Lower Mekong River Basin Using Satellite-Based Earth Observations. Remote Sens. 2018, 10, 885. [Google Scholar] [CrossRef] [Green Version]
  10. Liu, Y.; Liu, Y.; Wang, W. Inter-comparison of satellite-retrieved and Global Land Data Assimilation System-simulated soil moisture datasets for global drought analysis. Remote Sens. Environ. 2018, 220, 1–18. [Google Scholar] [CrossRef]
  11. Duerinck, H.M.; van der Ent, R.; van de Giesen, N.; Schoups, G.; Babovic, V.; Yeh, P.J.-F. Observed Soil Moisture–Precipitation Feedback in Illinois: A Systematic Analysis over Different Scales. J. Hydrometeorol. 2016, 17, 1645–1660. [Google Scholar] [CrossRef]
  12. Kim, D.; Rhee, J. A drought index based on actual evapotranspiration from the Bouchet hypothesis. Geophys. Res. Lett. 2016, 43, 10277–10285. [Google Scholar] [CrossRef]
  13. Lu, X.X.; Li, S.; Kummu, M.; Padawangi, R.; Wang, J. Observed changes in the water flow at Chiang Saen in the lower Mekong: Impacts of Chinese dams? Quat. Int. 2014, 336, 145–157. [Google Scholar] [CrossRef]
  14. Trisurat, Y.; Aekakkararungroj, A.; Ma, H.-O.; Johnston, J.M. Basin-wide impacts of climate change on ecosystem services in the Lower Mekong Basin. Ecol. Res. 2017, 33, 73–86. [Google Scholar] [CrossRef]
  15. Piman, T.; Lennaerts, T.; Southalack, P. Assessment of hydrological changes in the lower Mekong Basin from Basin-Wide development scenarios. Hydrol. Process. 2013, 27, 2115–2125. [Google Scholar] [CrossRef]
  16. Mainuddin, M.; Kirby, M.; Hoanh, C.T. Impact of climate change on rainfed rice and options for adaptation in the lower Mekong Basin. Nat. Hazards 2012, 66, 905–938. [Google Scholar] [CrossRef]
  17. Poméon, T.; Diekkrüger, B.; Springer, A.; Kusche, J.; Eicker, A. Multi-Objective Validation of SWAT for Sparsely-Gauged West African River Basins—A Remote Sensing Approach. Water 2018, 10, 451. [Google Scholar] [CrossRef] [Green Version]
  18. Badou, D.F.; Diekkrüger, B.; Montzka, C. Validation of satellite soil moisture in the absence of in situ soil moisture: The case of the Tropical Yankin Basin. S. Afr. J. Geomat. 2019, 7, 243. [Google Scholar] [CrossRef]
  19. Odusanya, A.E.; Mehdi, B.; Schürz, C.; Oke, A.O.; Awokola, O.S.; Awomeso, J.A.; Adejuwon, J.O.; Schulz, K. Multi-site calibration and validation of SWAT with satellite-based evapotranspiration in a data-sparse catchment in southwestern Nigeria. Hydrol. Earth Syst. Sci. 2019, 23, 1113–1144. [Google Scholar] [CrossRef] [Green Version]
  20. Ha, L.T.; Bastiaanssen, W.G.M.; Van Griensven, A.; Van Dijk, A.I.J.M.; Senay, G.B. Calibration of Spatially Distributed Hydrological Processes and Model Parameters in SWAT Using Remote Sensing Data and an Auto-Calibration Procedure: A Case Study in a Vietnamese River Basin. Water 2018, 10, 212. [Google Scholar] [CrossRef] [Green Version]
  21. Rossi, C.G.; Srinivasan, R.; Jirayoot, K.; Le Duc, T.; Souvannabouth, P.; Binh, N.; Gassman, P.W. Hydrologic evaluation of the Lower Mekong River Basin with the soil and water assessment tool model. Int. Agric. Eng. J. 2009, 18, 1–13. [Google Scholar]
  22. Narasimhan, B.; Srinivasan, R. Development and evaluation of Soil Moisture Deficit Index (SMDI) and Evapotranspiration Deficit Index (ETDI) for agricultural drought monitoring. Agric. For. Meteorol. 2005, 133, 69–88. [Google Scholar] [CrossRef]
  23. Van Loon, A.F. Hydrological drought explained. Wiley Interdiscip. Rev. Water 2015, 2, 359–392. [Google Scholar] [CrossRef]
  24. Killick, R.; Fearnhead, P.; Eckley, I.A. Optimal detection of changepoints with a linear computational cost. arXiv 2012, arXiv:1101.143v3. [Google Scholar] [CrossRef]
  25. Box, G.E.P.; Jenkins, G.M.; Reinsel, G.C. Time Series Analysis: Forecasting and Control, 3rd ed.; Prentice-Hall: Upper Saddle River, NJ, USA, 1994. [Google Scholar]
  26. Adamson, P.; Bird, J. The Mekong: A Drought-Prone Tropical Environment? Int. J. Water 2010, 26, 579–594. [Google Scholar] [CrossRef]
  27. Son, N.; Chen, C.; Chang, L.; Minh, V. Monitoring agricultural drought in the Lower Mekong Basin using MODIS NDVI and land surface temperature data. Int. J. Appl. Earth Obs. Geoinf. 2012, 18, 417–427. [Google Scholar] [CrossRef]
  28. Guo, H.; Bao, A.; Liu, T.; Ndayisaba, F.; He, D.; Kurban, A.; De Maeyer, P. Meteorological Drought Analysis in the Lower Mekong Basin Using Satellite-Based Long-Term CHIRPS Product. Sustainability 2017, 9, 901. [Google Scholar] [CrossRef] [Green Version]
  29. Zhang, B.; Zhang, L.; Guo, H.; Leinenkugel, P.; Zhou, Y.; Li, L.; Shen, Q. Drought impact on vegetation productivity in the Lower Mekong Basin. Int. J. Remote Sens. 2014, 35, 2835–2856. [Google Scholar] [CrossRef]
  30. Nguyen, H.Q.; Kappas, M. Modeling Surface Runoff and Evapotranspiration using SWAT and BEACH for a Tropical Watershed in North Vietnam, Compared to MODIS Products. Int. J. Adv. Remote Sens. GIS 2015, 4, 1367–1384. [Google Scholar] [CrossRef] [Green Version]
  31. Hillel, D. Environmental Soil Physics: Fundamentals, Applications, and Environmental Considerations; Elsevier Science: Amsterdam, The Netherlands, 1998; p. 771. [Google Scholar]
  32. Sridhar, V.; Hubbard, K.G.; You, J.; Hunt, E.D. Development of the Soil Moisture Index to Quantify Agricultural Drought and Its “User Friendliness” in Severity-Area-Duration Assessment. J. Hydrometeorol. 2008, 9, 660–676. [Google Scholar] [CrossRef] [Green Version]
  33. Hao, L.; Sun, G.; Liu, Y.; Zhou, G.; Wan, J.; Zhang, L.; Niu, J.; Sang, Y.; He, J. Evapotranspiration and Soil Moisture Dynamics in a Temperate Grassland Ecosystem in Inner Mongolia, China. Trans. ASABE 2016, 59, 577–590. [Google Scholar] [CrossRef]
  34. Miguez-Macho, G.; Fan, Y. The role of groundwater in the Amazon water cycle: 2. Influence on seasonal soil moisture and evapotranspiration. J. Geophys. Res. Space Phys. 2012, 117, D15114. [Google Scholar] [CrossRef] [Green Version]
Figure 1. Sub regions delineated for the Mekong River Basin (MRB) excluding Mekong Delta with reference to hydrometeorological stations in the basin.
Water 13 03622 g001
Figure 2. Seasonal distribution of rainfall measured from rain gauges in Mekong River Basin (South-West monsoon (blue); North-East monsoon (pink)); likewise, the duration of drought was defined as the number of consecutive weeks where the drought index was below the selected threshold.
Water 13 03622 g002
Figure 3. Seasonal precipitation anomalies calculated using Percent Normal index in Mekong River Basin (North-East monsoon(orange); South-West monsoon (purple)).
Water 13 03622 g003
Figure 4. Frequency of occurrences of percent normal North-East monsoon as per the categorization given in Table 1.
Water 13 03622 g004
Figure 5. Frequency of occurrences of percent normal South-West monsoon as per the categorization given in Table 1.
Water 13 03622 g005
Figure 6. Average annual duration of (a) meteorological, (b) evapotranspiration (plant available water), (c) soil moisture drought.
Water 13 03622 g006
Figure 7. Drought propagation in Sub−region 9 for the historical drought event 1992 (pink circles are data points that show significant change in mean and slope). (a) Identification of precipitation deficit pools from Percent Normal is presented as per Table 1 and identification of lengthening and attenuation of evapotranspiration deficit from ETDI and soil moisture deficit from SMDI are shown in (b) and (c), respectively.
Water 13 03622 g007
Figure 8. Drought propagation in Sub-region 9 for the historical drought event 2001–2006. Pink circles are data points that show significant change in mean and slope. (a) Identification of precipitation deficit pools from Percent Normal is presented as per Table 1 and identification of lengthening and attenuation of evapotranspiration deficit from ETDI and soil moisture deficit from SMDI are shown in (b) and (c), respectively.
Water 13 03622 g008
Figure 9. Drought propagation in Sub-region 7 for the historical drought event in 1992. Pink circles are data points that show significant change in mean and slope. (a) Identification of precipitation deficit pools from Percent Normal is presented as per Table 1 and identification of lengthening and attenuation of evapotranspiration deficit from ETDI and soil moisture deficit from SMDI are shown in (b) and (c), respectively.
Water 13 03622 g009
Figure 10. Drought propagation in Sub-region 7 for the historical drought event in 2000–2006. Pink circles are data points that show significant change in mean and slope. (a) Identification of precipitation deficit pools from Percent Normal is presented as per Table 1 and identification of lengthening and attenuation of evapotranspiration deficit from ETDI and soil moisture deficit from SMDI are shown in (b) and (c), respectively.
Water 13 03622 g010
Figure 11. Temporal lag between (a) PN vs. SMDI, (b) PN vs. ETDI and (c) SMDI vs. ETDI in Lower Mekong Basin (LMB). The subset shows the lags between PN, SMDI and ETDI in Mekong River Basin (MRB).
Water 13 03622 g011
Table 1. Classification of meteorological and agricultural deficit indices.
VariableRangeClassification
Precipitation Normal(PN), %≤40Extremely Dry
40 to 55Severely Dry
55 to 80Moderately Dry
80 to 110Near Normal
≥110Moderately Wet
SMDI, [-]0Normal Supply
0 to 2Above Normal Supply
2 to 4Abundant Water Supply
0 to −2Moderate Drought
−2 to −4Severe Drought
ETDI, [-]0Normal Supply
0 to 2Above Normal Supply
2 to 4Abundant Water Supply
0 to −2Moderate Drought
−2 to −4Severe Drought
Table 2. Drought propagation characteristics.
Drought Propagation CharacteristicsDefinitionExample
PoolingContinuous deficit in one variable that causes development of deficit in another variableIntegration of various durations of meteorological drought that develops into hydrological drought
LagTemporal delay in onset of one type of drought by another droughtTiming of onset of soil moisture deficit due to meteorological drought
AttenuationMany meteorological deficiencies are pooled to produce reduction in hydrologic stores Reduction in groundwater in response to meteorological deficits
LengtheningCumulative drought scenario, which is experienced as the drought progressesThe meteorological drought progresses into soil moisture, which will in turn progress into hydrological drought
Publisher’s Note: MDPI stays neutral with regard to jurisdictional claims in published maps and institutional affiliations.

