
Quantitative Analysis of Winter Wheat Growth and Yields Responding to Climate Change in Xinjiang, China
by
 , , and
Haixia Lin
1,2,†, 
Na Li
2,†,
Yi Li
2,*,
Hongguang Liu
1,*,
Jian Liu
1,
Linchao Li
3,
Puyu Feng
4,
Deli Liu
5,6 and
Chuncheng Liu
7 1
College of Water Resources and Architectural Engineering, Shihezi University, Shihezi 832003, China
2
College of Water Resources and Architectural Engineering, Northwest A&F University, Xianyang 712100, China
3
College of Nature Resources and Environment, Northwest A&F University, Xianyang 712100, China
4
College of Land Science and Technology, China Agricultural University, Beijing 100193, China
5
NSW Department of Primary Industries, Wagga Wagga Agricultural Institute, Wagga Wagga, NSW 2650, Australia
6
Climate Change Research Centre, University of New South Wales, Sydney, NSW 2052, Australia
7
Key Laboratory of High-Efficient and Safe Utilization of Agriculture Water Resources, Institute of Farmland Irrigation of CAAS, Chinese Academy of Agricultural Sciences, Xinxiang 453002, China
*
Authors to whom correspondence should be addressed.
†
Haixia Lin and Na Li contributed equally.
Water 2021, 13(24), 3624; https://doi.org/10.3390/w13243624
Submission received: 4 November 2021
/
Revised: 10 December 2021
/
Accepted: 14 December 2021
/
Published: 16 December 2021
(This article belongs to the Section Water, Agriculture and Aquaculture)
Abstract
:The knowledge of climate change effects on variations of winter wheat yields are crucial for productions. Our objectives were to investigate the relationship between yield-related indices of winter wheat and the related climatic variables (selected using variance inflation factors) at the 20 sites of Xinjiang, China over 1981–2017. The background of climate and yield changes was analyzed from temporal and spatial respects. The number of independent climatic variables was selected with the variance inflation factor method to remove the multicollinear feature. The Pearson correlation was conducted between the first difference values of climatic variables and yield-related indices of winter wheat (namely plant height, growth period duration, 1000-kernel weight, kernel number per ear, biomass and yield) to find the key climatic variables that impacted winter wheat growth and yields. The multi-variate linear and nonlinear functions were established step by step using the selected key climatic variables. The best function was determined for each site (significant for p < 0.05). From the results, there were general wetter and warmer trends of the climatic variables. Correspondingly, shortened winter wheat phenology and increased growth and yields were observed for most sites. Still, the climatic trends had mixed effects on winter wheat yields. The effects of precipitation, mean air temperature and relative humidity on plant height and growth period duration agreed well. Different sites had different major climatic drivers for winter wheat growth or yields, and the best functions of growth and yields could be linearly or nonlinearly, mostly described by multi-variate functions. The winter wheat growth or yield indices were also found to be closely connected with the soil water content status at the eight sites. The relationship between winter wheat growth or yield and climate provided useful references for forecasting crop production and for projecting the impact of future climate changes.
1. Introduction
Climate change has resulted in both positive and negative effects on global crop production, with the latter being more common than the former [1]. The theme for World Food Day is “Climate is changing. Food and agriculture must be too.” Climate change threatens global crop production and security [2,3]. Sustainably improving crop production is urgently required to meet people’s living demand. Nevertheless, the ongoing influences of climate change will increase the risk of meeting this demand for maintaining steady crop production [4]. Understanding the relationship between climatic variables and historical crop production is of importance for assessing the sustainability of the agricultural production.
Wheat is one of the most prevalent grain crops which supports 35–40% people in the world [5]. Wheat is the second food crops following rice in China. The wheat production accounts for approximately 29% of total food production in China [6]. In recent years, climate change has posed huge risks to wheat grain production. With growing population and enhanced living standards following economic development, it is much important to maintain and increase wheat production. Therefore, to quantity the influence of climate change on winter wheat yields is highly necessary for guiding regional farmland production practice and for taking measures to adapt to the global climate change.
Agricultural production is highly dependent on climate, which affects the quantity and quality of harvested crops [7]. Several researchers have reported the effects of climate change on yields of wheat or other crops. For example, Lobell and Field [8] found that growing season temperatures and precipitation explained 30% or more of annual variations in global average wheat yields. Lobell et al. [9] showed that global corn and wheat production decreased by 3.8% and 5.5%, respectively, due to climate change. Ray et al. [10] analyzed the relationship between climate and crop yields and highlighted the roles in temperature, precipitation and their interaction to explain yield variability. Nicholls [11] estimated the impact of climate trends on wheat yields in Australia since 1952–1992 and found that the minimum temperature was the main influencing factor in the related climate variables that contributed to increased wheat yield by 30–50%. Lobell et al. [12] found that the increased wheat yield by 25% in Mexico over 1980–2001, mostly due to climate trends in the northwest United States, especially the decline in nighttime temperature during the growing season. Tao et al. [13] found that China’s rice, wheat, corn and soybean production changed by 3.2 × 10⁵, −1.2 × 10⁵, −21.2 × 10⁵ and 0.7 × 10⁵ t decade− 1, respectively, due to the climate change. Tao et al. [14] concluded that the trends in mean temperature, precipitation and sunshine duration over 1980–2008 reduced wheat, maize and soybean yields by 1.27%, 1.73% and 0.41%, respectively, while they increased rice yields by 0.56%. Zhang and Huang [15] revealed overall negative effects of the average temperature and diurnal temperature range on wheat and maize yields over 1980–2008 in China. Xiong et al. [16] found that the increasing growing-season temperature had negative responses to wheat, maize and soybean yields in China. Wei et al. [3] estimated the effects of temperature and precipitation on the yields of main grain crops based on provincial data from 1980 to 2008 in China. They found that the contribution rates of temperature change to wheat and yield growth were 1.3% and 0.4%, respectively, and the effect of precipitation change was very small. Yang et al. [17] reported that rising temperatures had a positive impact on the productions of wheat, maize and rice in China. In addition, Bhatt et al. [18] reported that the warming trends of average temperature in the past few decades had a negative impact on yields of rice, corn and wheat in the Koshi River basin of Nepal. Wang et al. [19] found that recent climatic changes have increased wheat yields by 8.5% to 21.2% in four different wheat belts of New South Wales in Australia over 1922–2000. Although studies of climate change effects on wheat yields have been conducted at different scales with much useful and referable results, their applications are confined to varying regions, which require updated relationships between crop yields and climatic variables. This brings difficulties to applying the previous research results to the other places.
To reveal the effects of climate variability on winter wheat yields is a challenging topic since crop yields data are precious and lacking in most places. There are usually two methods to reveal the effects of climate yield relationships: statistical models and crop models [20]. Statistical method is a useful technique to reveal the effects [11,12,21]. Most research focused on the effects of temperature, precipitation and solar radiation rather than wind speed or relative humidity [19,22,23,24,25,26]. Though temperature, precipitation and solar radiation has significant effects on winter wheat yields, whether the statistical method is a better strategy or not than crop model remains an unanswered question. It is still a matter of importance to study the effects of the statistical method [27,28,29,30]. Statistical models can be obtained quickly and simply. Since climate variabilities often have a non-monotonic effect on winter wheat yields (e.g., increased temperatures will have a positive effect on yields at cool temperatures; however, it will have a negative effect on yields at high temperatures). Therefore, there are linear and nonlinear relationships in statistical methods [7,8]. Nonlinear relationships have a polynomial, cubic spline and interactive. In recent decades, machine learning methods have attracted more and more attention. They have been applied in many fields, such as digital water metering [31], climate extremes and crop yields [29]. Machine learning methods can be used to study the nonlinear and hierarchical relationships between predictors and responses, including artificial neural network-based methods, regression tree-based methods, stochastic-based methods and hybrid methods [32]. These methods generally perform better than traditional linear regression models.
The best relationship between crop growth-yield and climatic variables are not so easy to determine, since the growth-yield data for different sites are not as easy to collect as the climatic variables. Our overall objective was to determine the best quantitative relationship between winter wheat growth-yields and climatic variables at the selected 20 sites of Xinjiang, China. Our specific objectives were (i) to investigate the spatiotemporal variation characteristics in the related climatic variables during the winter wheat growth periods of 1981–2017, (ii) to identify the major climatic drivers of winter wheat and (iii) to establish the best quantitative relationships between yield-related indices of winter wheat and the key climatic variables. This research would provide useful references for further prediction of regional wheat production.
2. Materials and Methods
2.1. Study Area and Data Sets
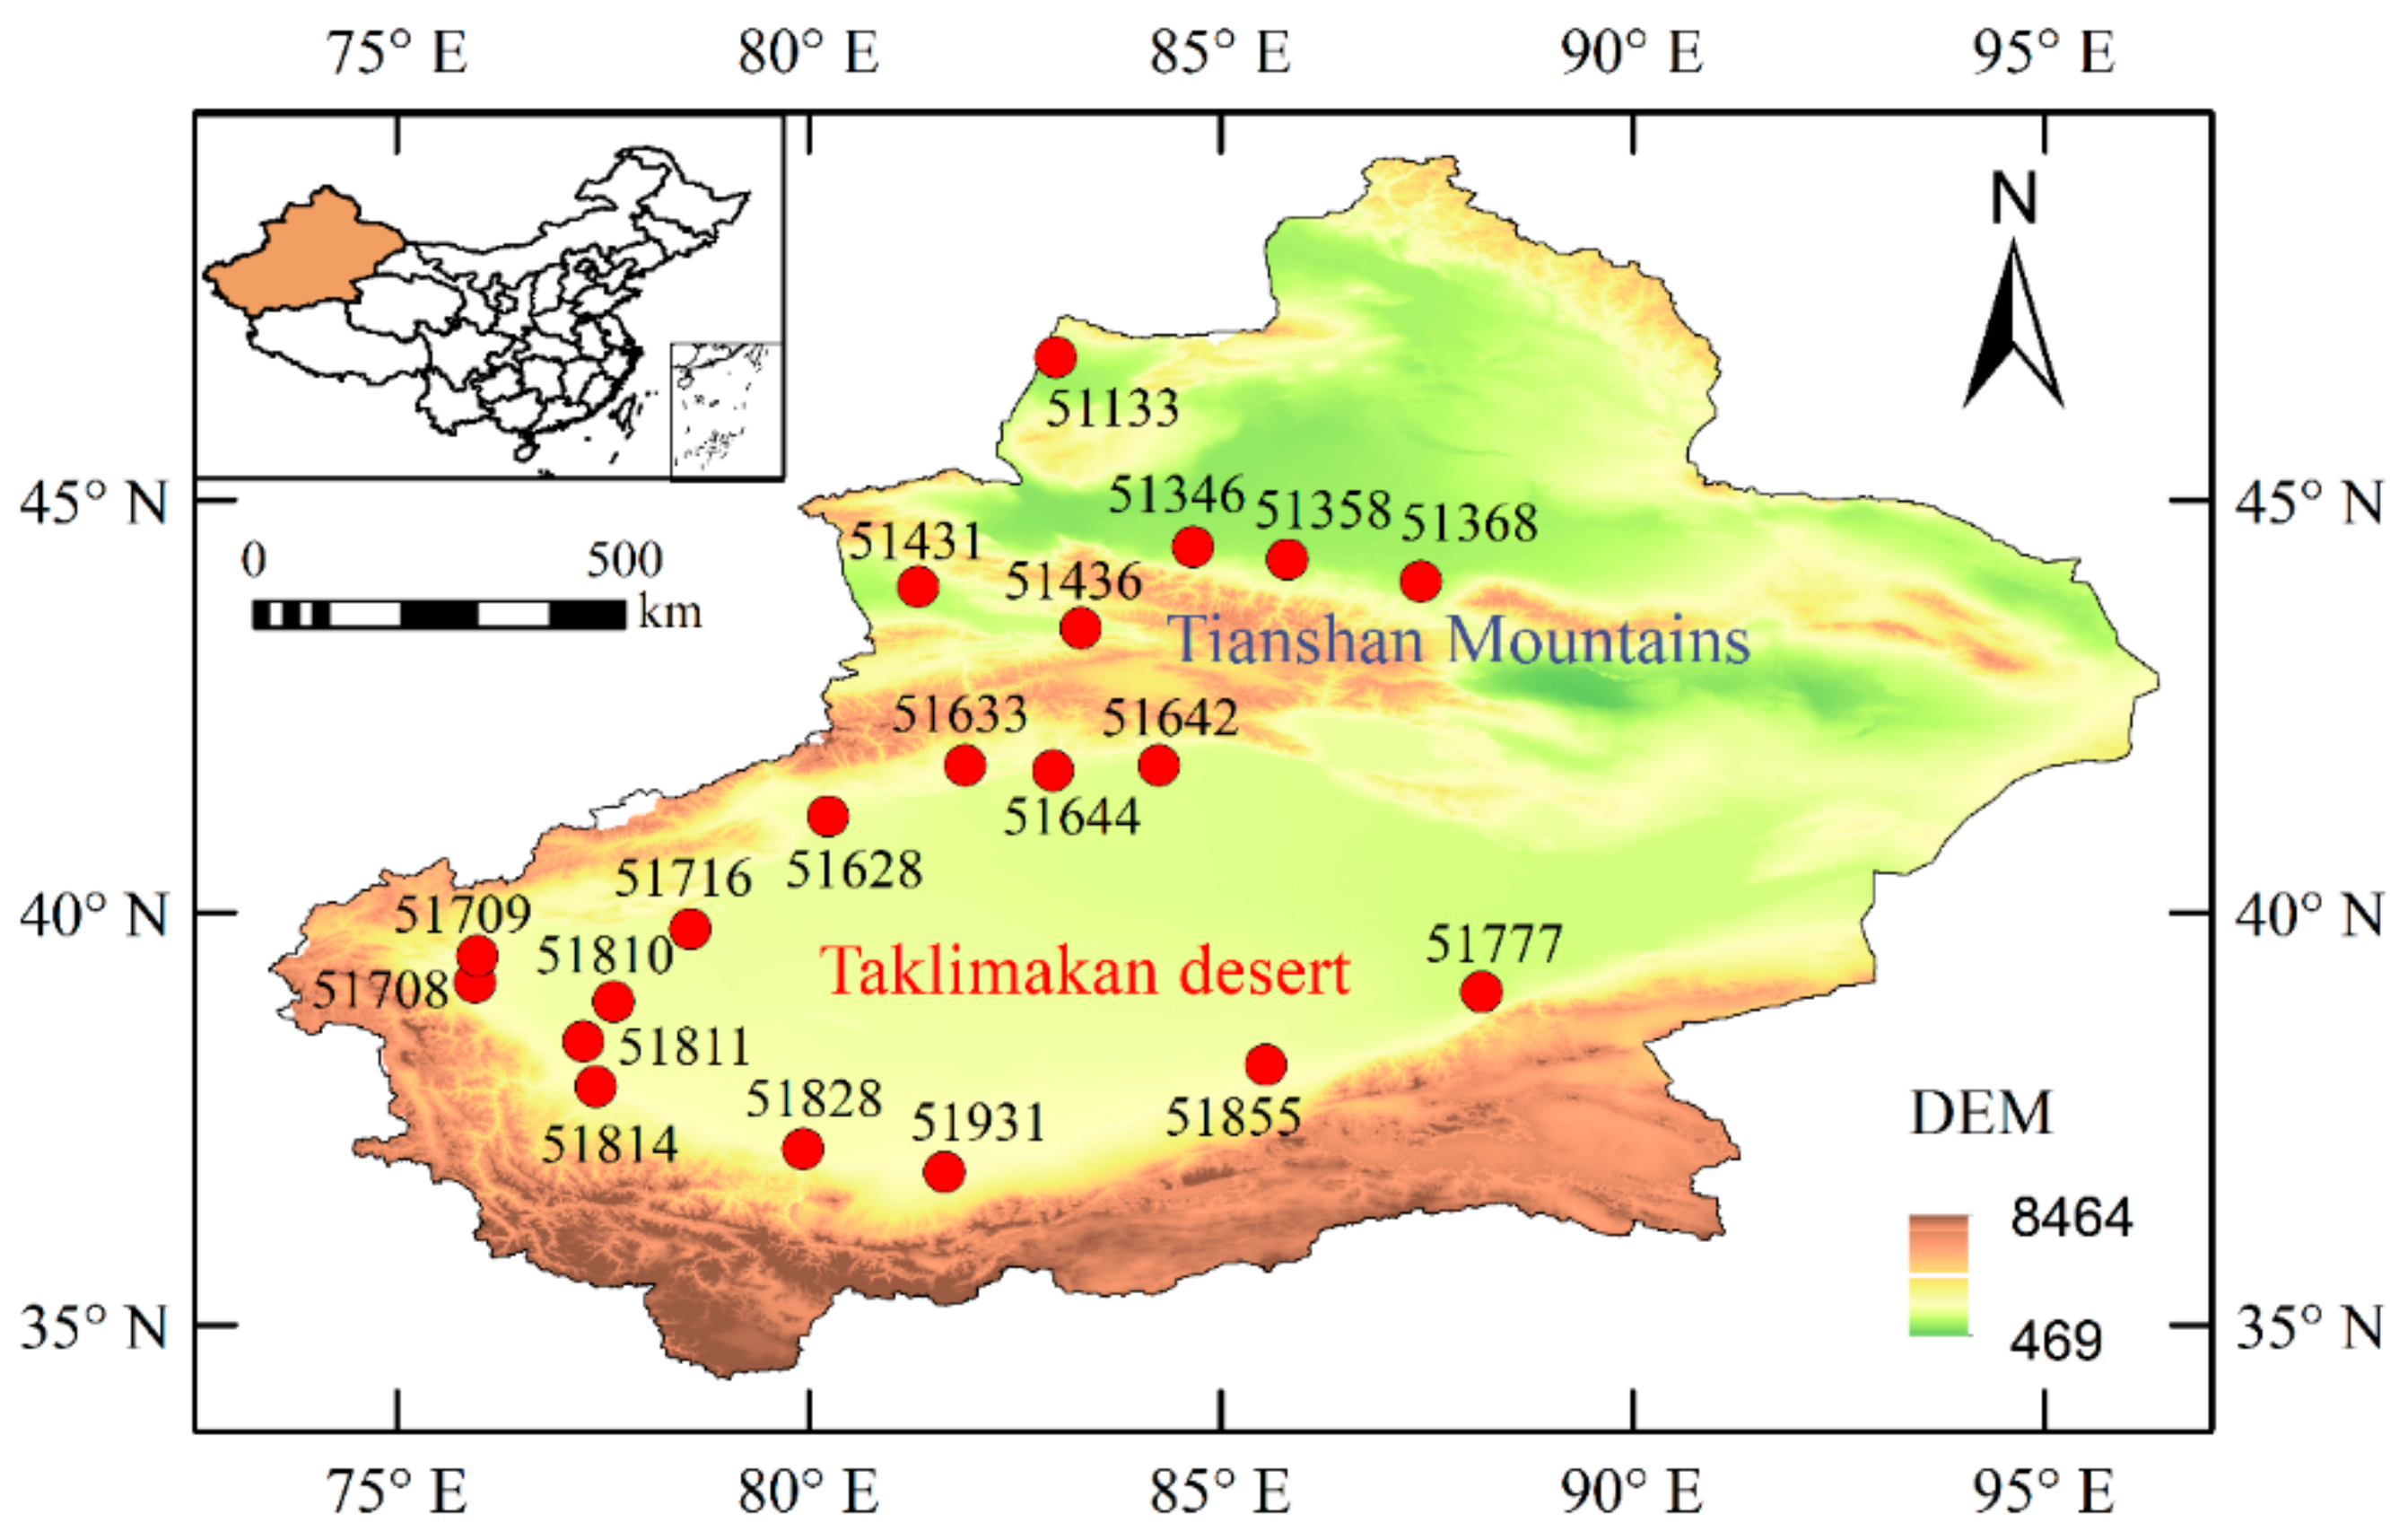
Xinjiang Uygur Autonomous Region is located in northwestern China (73°40′–96°23′ E, 34°22′–49°10′ N). Xinjiang is a typical arid and semi-arid region and belongs to a temperate continental dry climate. It is characterized by ‘three mountains (i.e., the Kunlun Mountains in the south, the Tianshan Mountains in central Xinjiang, and the Altai Mountains in the northeast) and two basins (i.e., Zhungaer and Tulufan)’ [24,33,34]. Winter wheat is one of the three major food crops in Xinjiang.
Daily weather, growth and yield data during the winter wheat growth period from 20 agricultural meteorological stations in Xinjiang during 1981–2017 are collected from the China Meteorological Data Sharing Network with strict quality control. Site distribution and the corresponding geographical information is mapped in Figure 1. The elevations of the selected sites range between 469 and 8464 m.
The related climatic variables include precipitation (Pre), mean temperature (Tmean), maximum temperature (Tmax), minimum temperature (Tmin), wind speed at 2 m (U2), sunshine hour (Sun) and relative humidity (RH). Detailed geographical, regional and long-term mean meteorological information during wheat growth period is presented in Table 1. The Pre, Tmean, U2, Sun and RH during the winter wheat growth period range from 23–489 mm, 6.6–12.2 °C, 1.2–2.3 m s−1, 7.2–8.3 h and 41–65%, respectively. Detail soil types at the 20 stations are presented in Appendix A Table A1.
Winter wheat experimental data from 1981 to 2017 include plant height (H), growth period (G), 1000-kernel weight (W), kernel number per ear (K), biomass (B) and yield (Yie). The values of H, G, W, K, B and Yie during the winter wheat growth period range from 71–88 cm, 241–347 days, 33–44 g, 25–36, 14226–26306 kg ha−1 and 4426–8866 kg ha−1, respectively.
2.2. The Multicollinearity Test among the Selected Climate Variables
Crop yield is influenced by both climatic and non-climatic factors, which include improved varieties, fertilization development, biocide application, cultivation, irrigation, etc. To remove the non-climatic effects and only evaluate the impacts of climate change on winter wheat growth and yields, the first-difference (∆) of the variable has been effectively used [11,23,35].
Before selecting the best models of yields, the multicollinearity should be analyzed for the selected climate variables to remove the variable that is highly dependent to another. The variance inflation factor (VIF) is useful in assessing the multicollinearity between the studied climatic variables [36]:
where R2 is the coefficient of determination between pairs of climatic variables. The variable which has R2 > 0.9 or VIF > 10 is removed from the selected climatic variables because of high collinearity. The multicollinearity test is repeated several times until the collinearity relationship is not shown. Finally, the climatic variables which are independent from each other for establishing models of winter wheat growth and yields are kept. In this study, Tmax is removed from the first run and Tmin is removed from the second run. After the third run, the variables without any multicollinearity are determined, namely P, Tmean, U2, Sun and RH.
2.3. Trend Test
The modified Mann-Kendall test is used here to detect the temporal trends of the climatic and the yield-related variables [37,38,39]. This method accounts for the effects of autocorrelation in the studied time series. The modified Mann-Kendall statistic Zm considers the influences of auto-correlation on original Mann-Kendall statistic (Z) using a correction factor [40], described as follows:
where:
where rj is the jth-order of serial auto-correlation coefficient.
If Z (or Zm) is positive (negative), the time series have an upward (downward) trend. The null hypothesis is rejected if |Zm| ≥ Z1−β/2 at a confidence level of β. For β = 0.05, when |Zm| ≥ 1.96, the series have a significant trend [40].
2.4. The Best Equations for Growth- and Yield-Related Indices of Winter Wheat
2.4.1. The Best Linear Equations
The Pearson correlation is conducted between pairs of the first-order difference of growth indices (including Yie, B, G, H, K and W) and climate variables (Pre, Tmean, U2, Sun and RH) during winter wheat growth seasons. From this procedure, the sensitive climate variables that influence winter wheat yields are primarily shown. The equation that had the largest Pearson correlation coefficient is selected as a best linear function for winter wheat growth-yield indicators.
The stepwise single and multi-variate linear regression is then conducted to find the best linear functions of winter wheat growth-yield indices, described by the following equation [11]:
where ∆Yi is first-order difference of winter wheat growth indices (Yie, B, G, H, L or W), ∆Xi is first-order difference of climate variables (Pre, Tmean, U2, Sun or RH) and ai is the regression coefficients (i = 1 to 37 years). The intercept is forced through the origin to avoid trend effects [11].
The stability of the regression functions is estimated by the adjusted coefficient of determination (Radj2). The larger the Radj2 values, the more stable the model at a significant level [7]. The t-test is used to examine the significance of the functions at the confidence levels of 0.01 or 0.05.
2.4.2. The Selection of the Best Nonlinear Equations
The climatic variables probably have nonlinear and non-monotonic effects on winter wheat growth and yields caused partially by climate variability [7,41]. Considering this nonlinear feature, the multivariate nonlinear regressions are conducted for the winter wheat growth-yield indices and the climatic variables. The nonlinear components include cubic, quadratic and interactive items. If the linear equation includes n climatic variables, 2n + of nonlinear variables are added to the basis of the original n linear variables, then a total of 3n + variables are used to improve the linear equation. The 1-, 2-, …, to 3n + -variable regression procedure contains , , , …, to (Equation (5)), total ∑ equations for each growth-yield indicator will be obtained. The multi-variate regression model [30] is described as:
Among all the available nonlinear equations, the equation with the largest Radj2 is chosen as the best multivariate nonlinear equation of the wheat growth indicators. Its performance is compared with the former obtained best linear equation. Finally, the best equation of the winter wheat growth indices is determined with the largest Radj2.
The regression analysis and other statistical analysis are performed via R 3.5.3 language software. The spatial distributions of the studied variables are mapped in ArcGIS 10.3 software.
3. Results
3.1. Spatiotemporal Variation Characteristics of the Climatic and Yield-Related Variables
3.1.1. Variations of the Climatic Variables
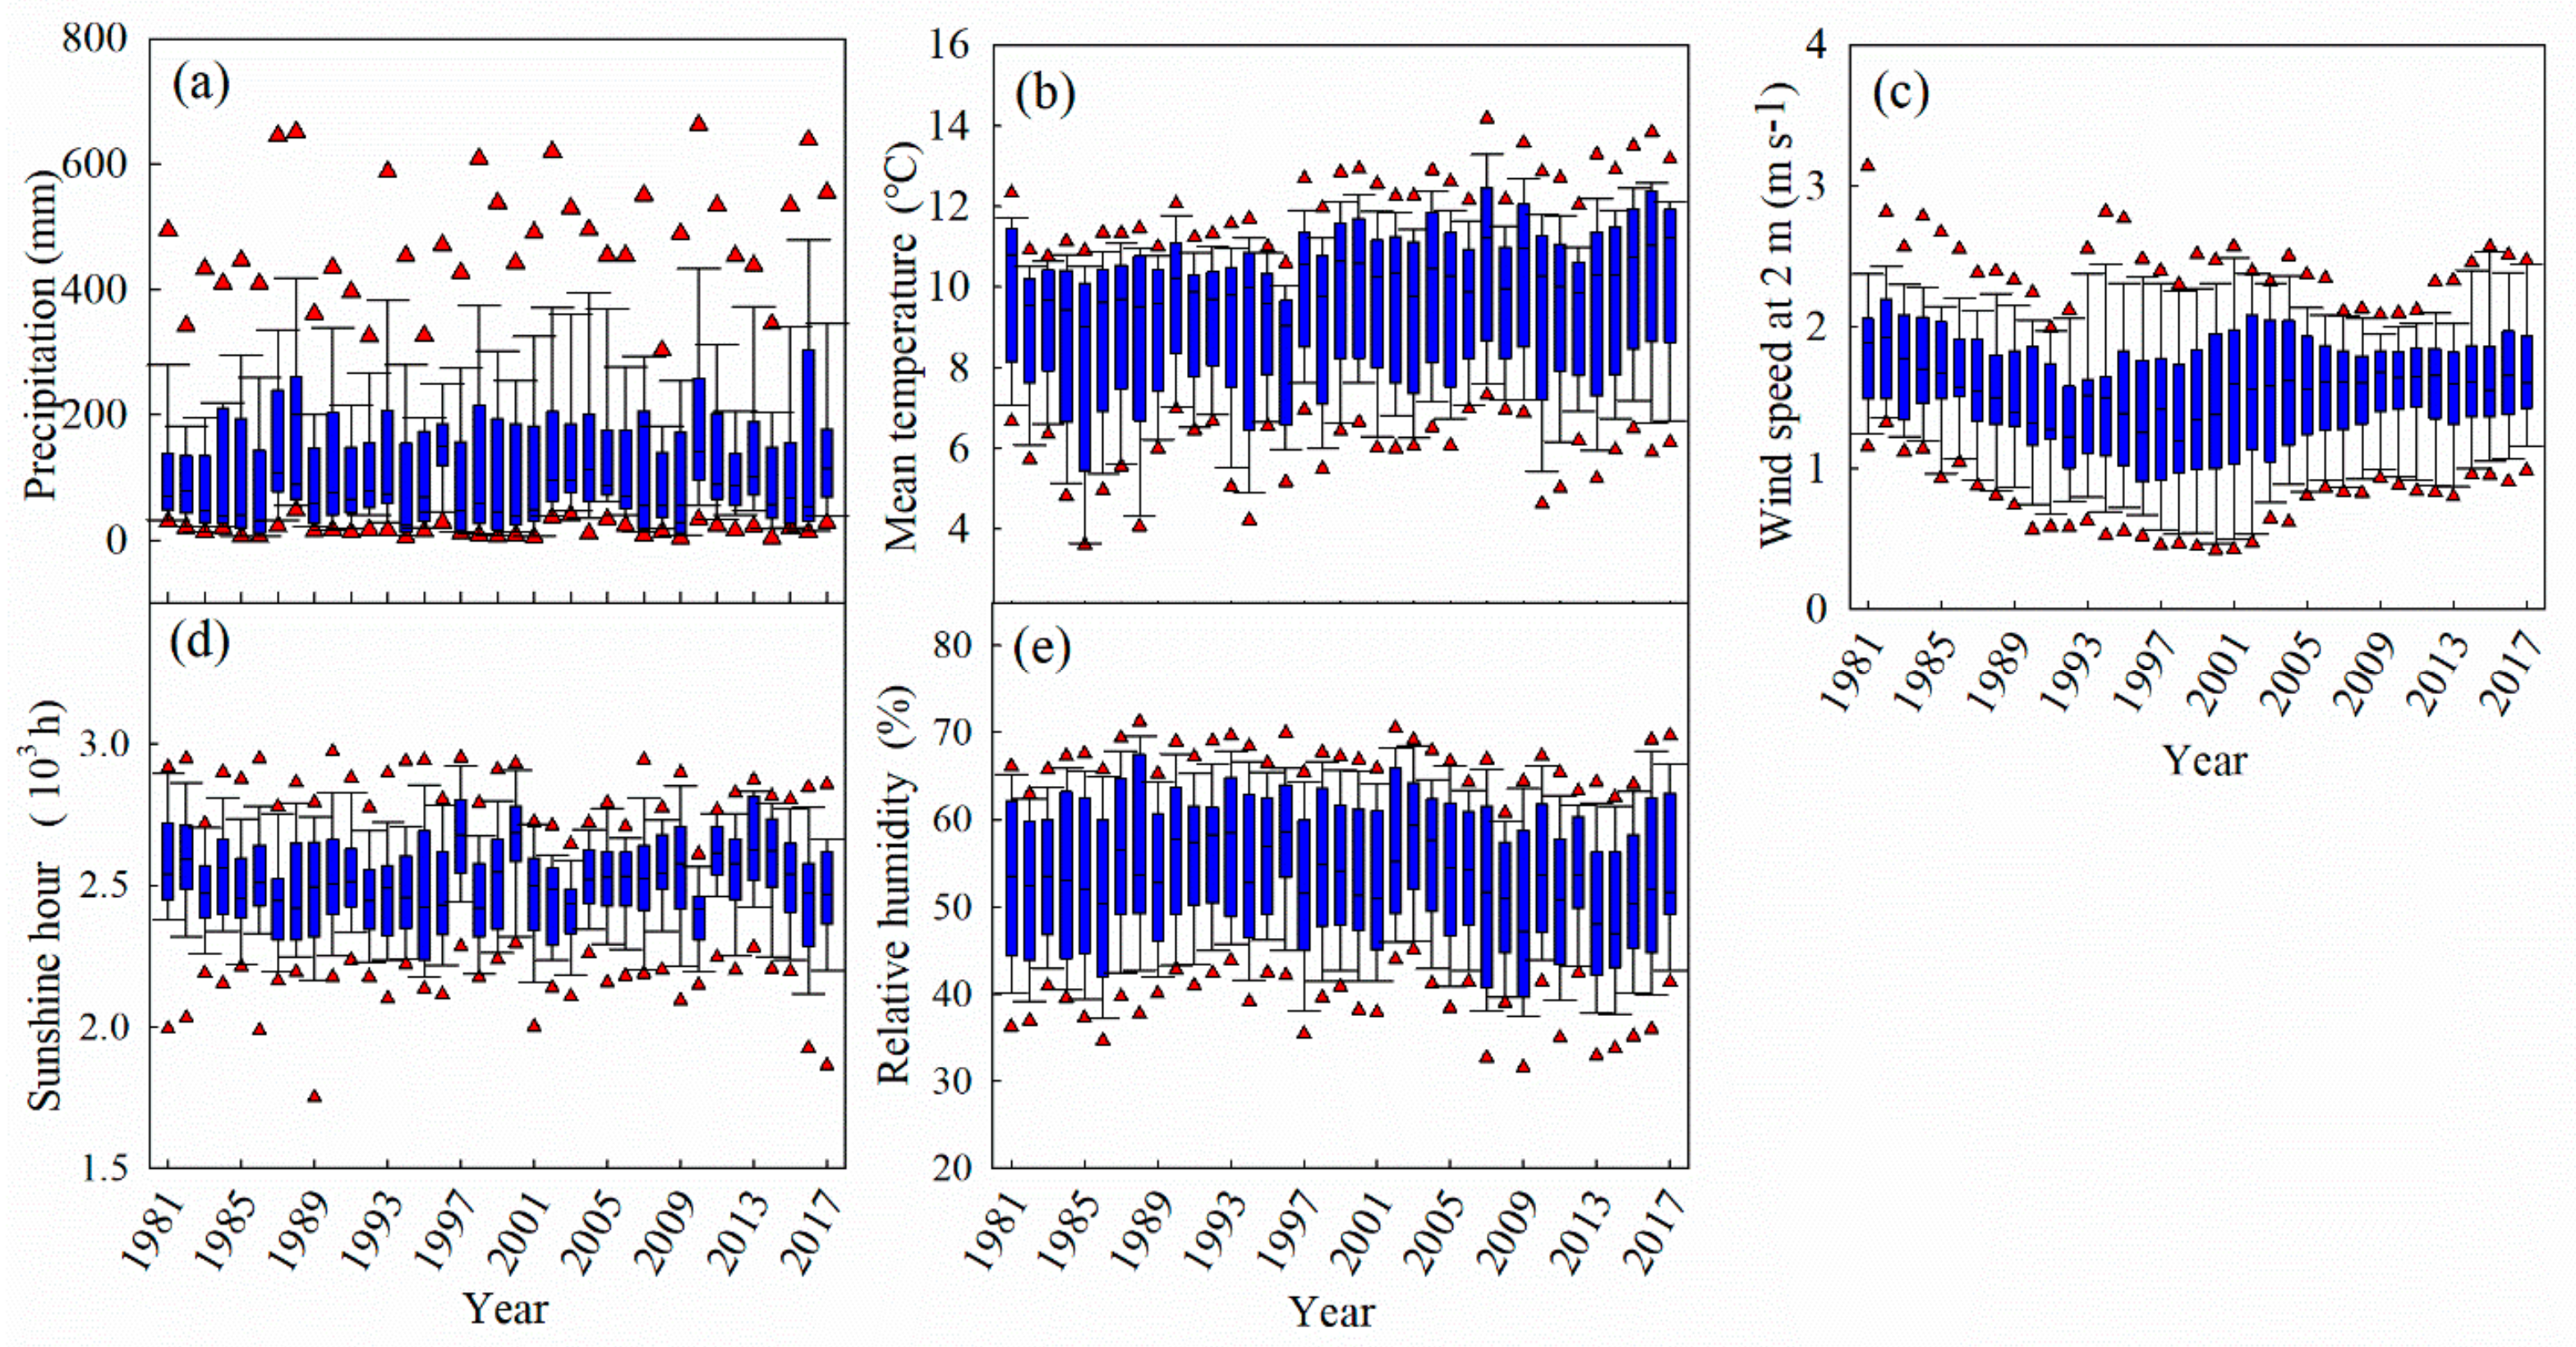
Five climatic variables of Pre, Tmean, U2, Sun and RH passed the multicollinearity test and were selected as the dependent variables for describing winter wheat production. The variations of the selected climatic variables during winter wheat-growing season of 1981–2017 at the studied 20 sites of Xinjiang are plotted in Figure 2. Pre ranged from 28.4 to 156 mm (Figure 2a). Tmean ranged from 3.6–14.3 °C (Figure 2b). The U2, Sun and RH ranged from 1.2 to 1.9 m s−1, 2404 to 2662 h and 47 to 59%, respectively (Figure 2c–e). Differences of climate between the 20 sites were visually observed. This climate variation supplied the overall background for winter wheat growth and productions.
The trends and significance of the five selected climatic variables during the winter wheat-growing season over 1981–2017 are mapped for each site of Xinjiang, China in Figure 3. The increasing trends of Pre were observed at 16 stations, of which the trends of Pre at four stations (located mainly in north Xinjiang) were significant (Figure 3a). Tmean at 12 stations showed significant increasing trends (Figure 3b). A total of 11, 11 and 15 stations showed decreasing trends in U2, Sun and RH, respectively (Figure 3c–e). Only one site had significant trends in Sun and RH. These variation trends of the climatic variables would contribute to the growth and yields of winter wheat.
3.1.2. Variations of Growth- and Yield-Related Variables
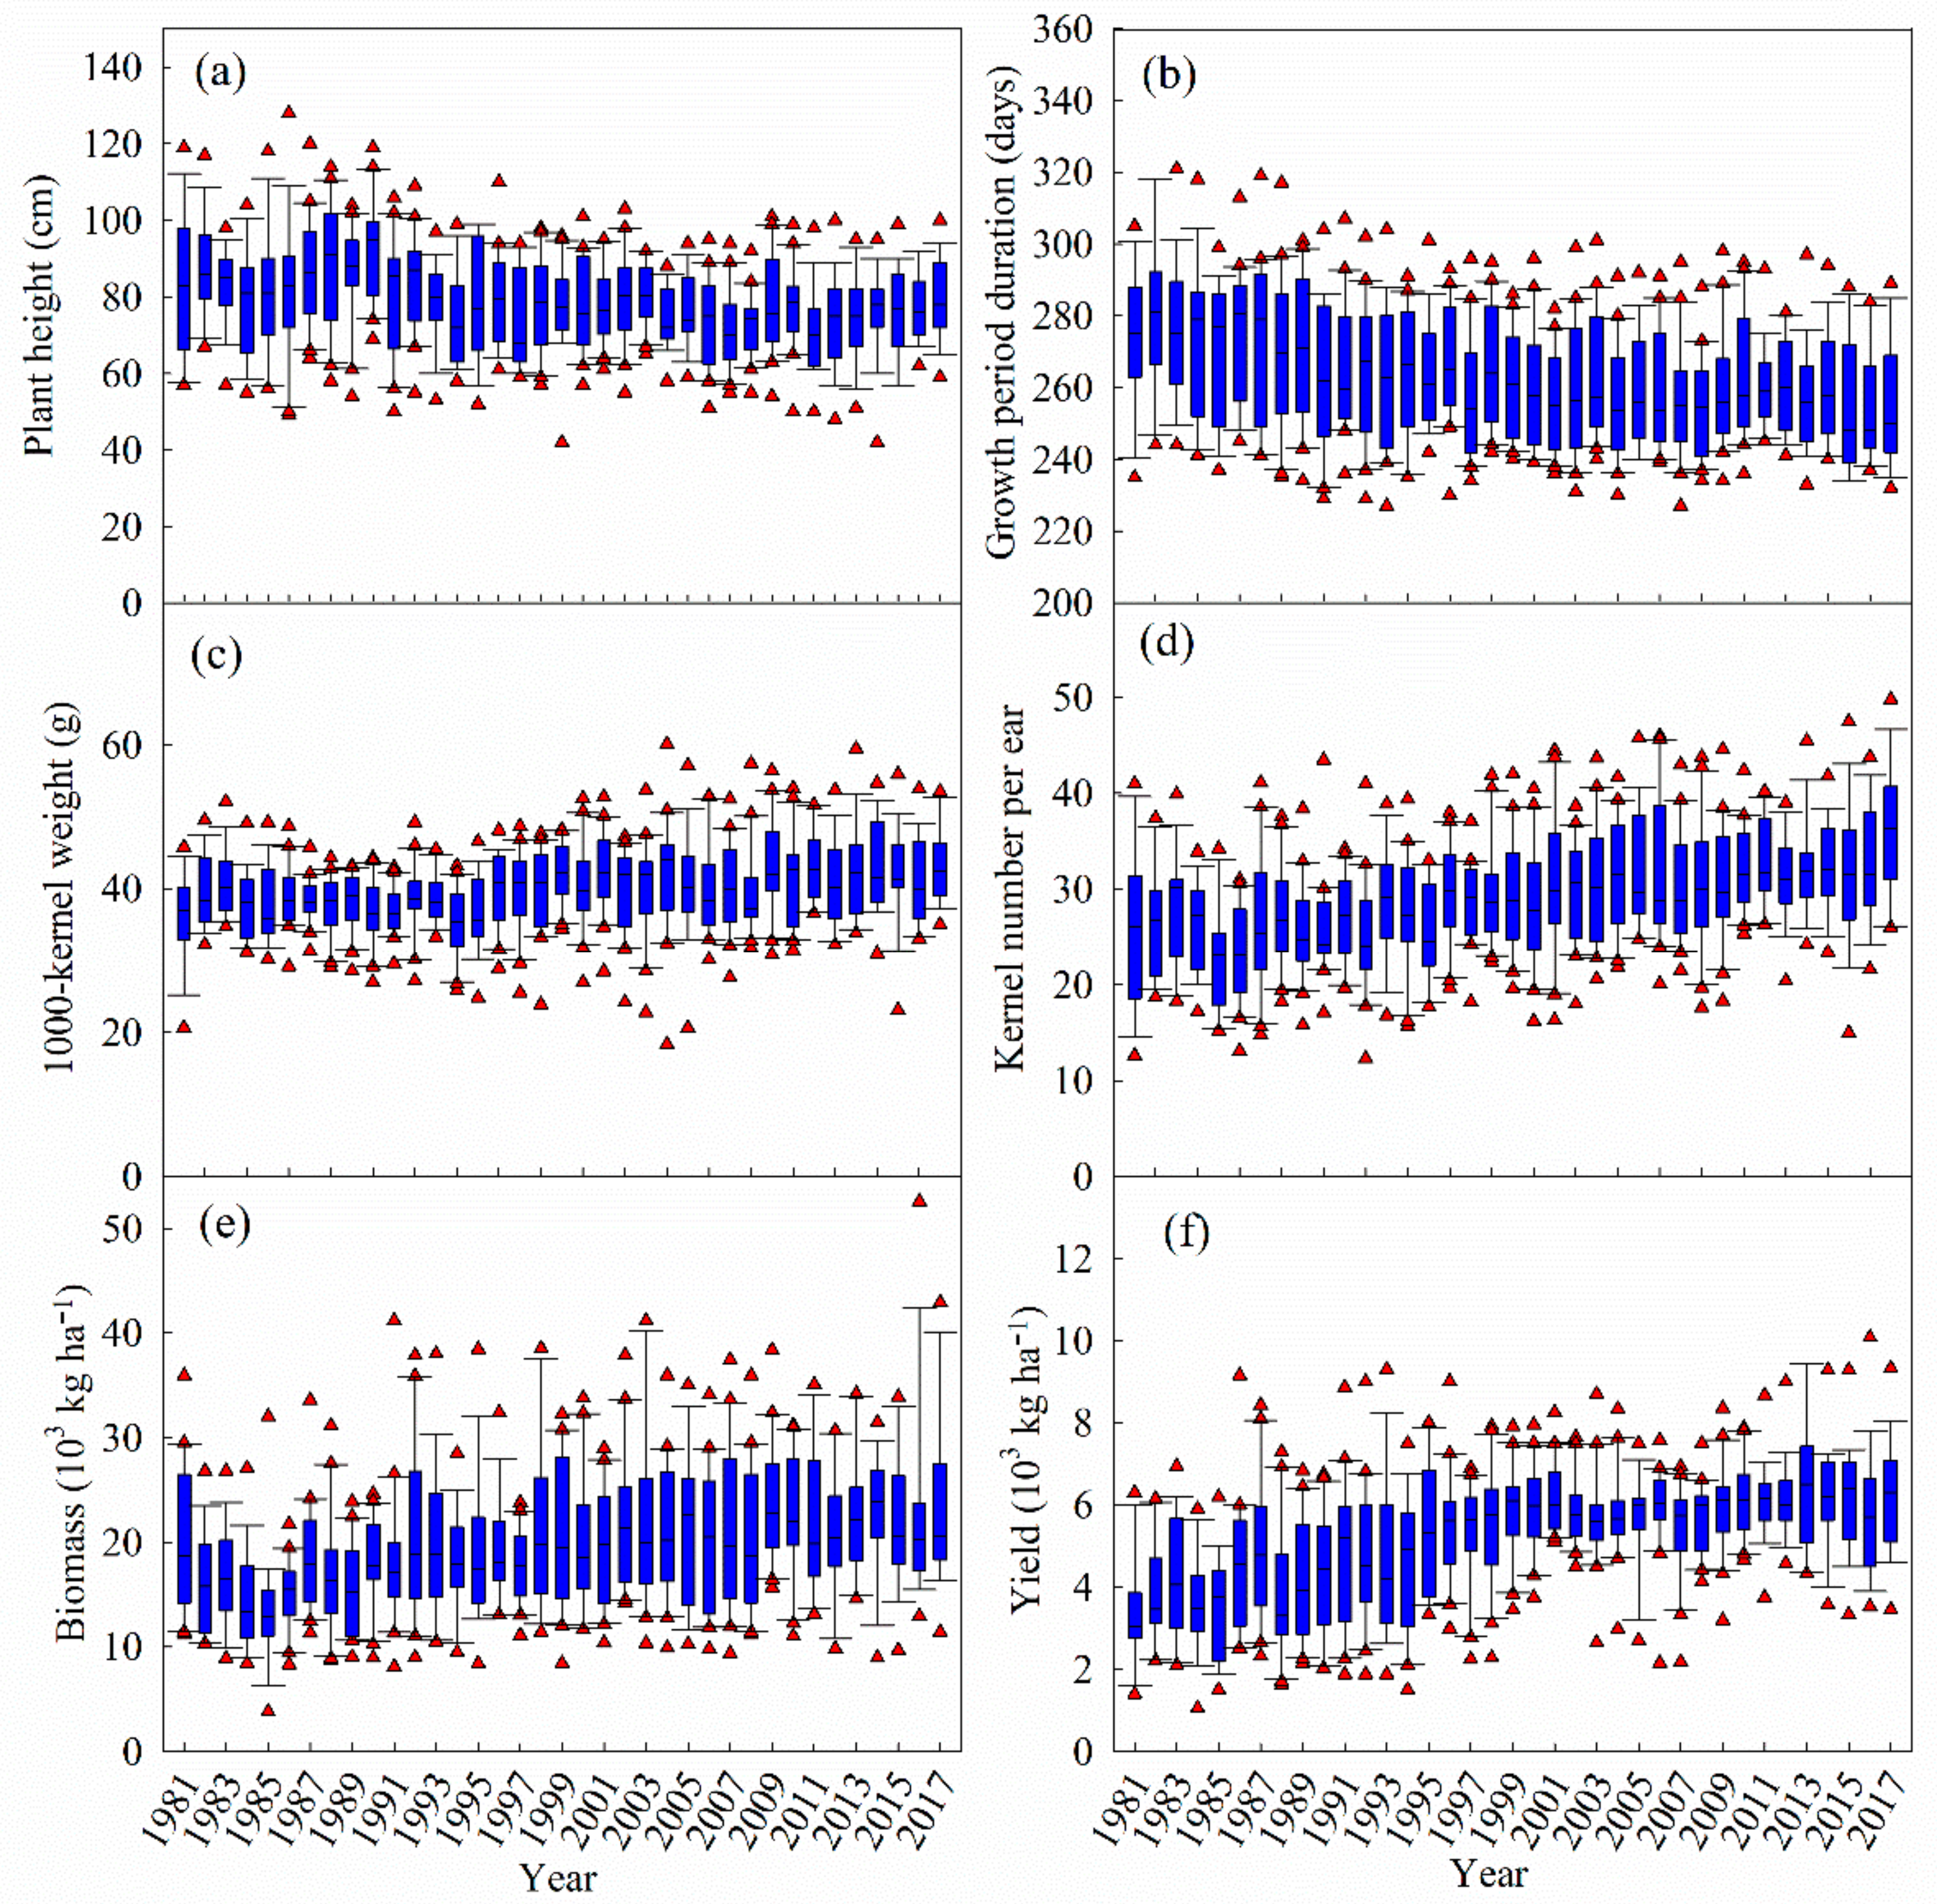
The box plots of the yield-related winter wheat indicators during wheat-growth season at the 20 sites of Xinjiang are shown in Figure 4 for the period 1981–2017. The plant height, growth period duration, 1000-kernel weight, kernel number per ear, biomass and yield varied 42–121 cm, 225–320 days, 18.8–58.7 g, 13–50 kg ha−1, 4219–52,648 kg ha−1 and 919–9478 kg ha−1, respectively. The temporal variations in the growth- and yield-related parameters of winter wheat generally showed great variability both in time and space.
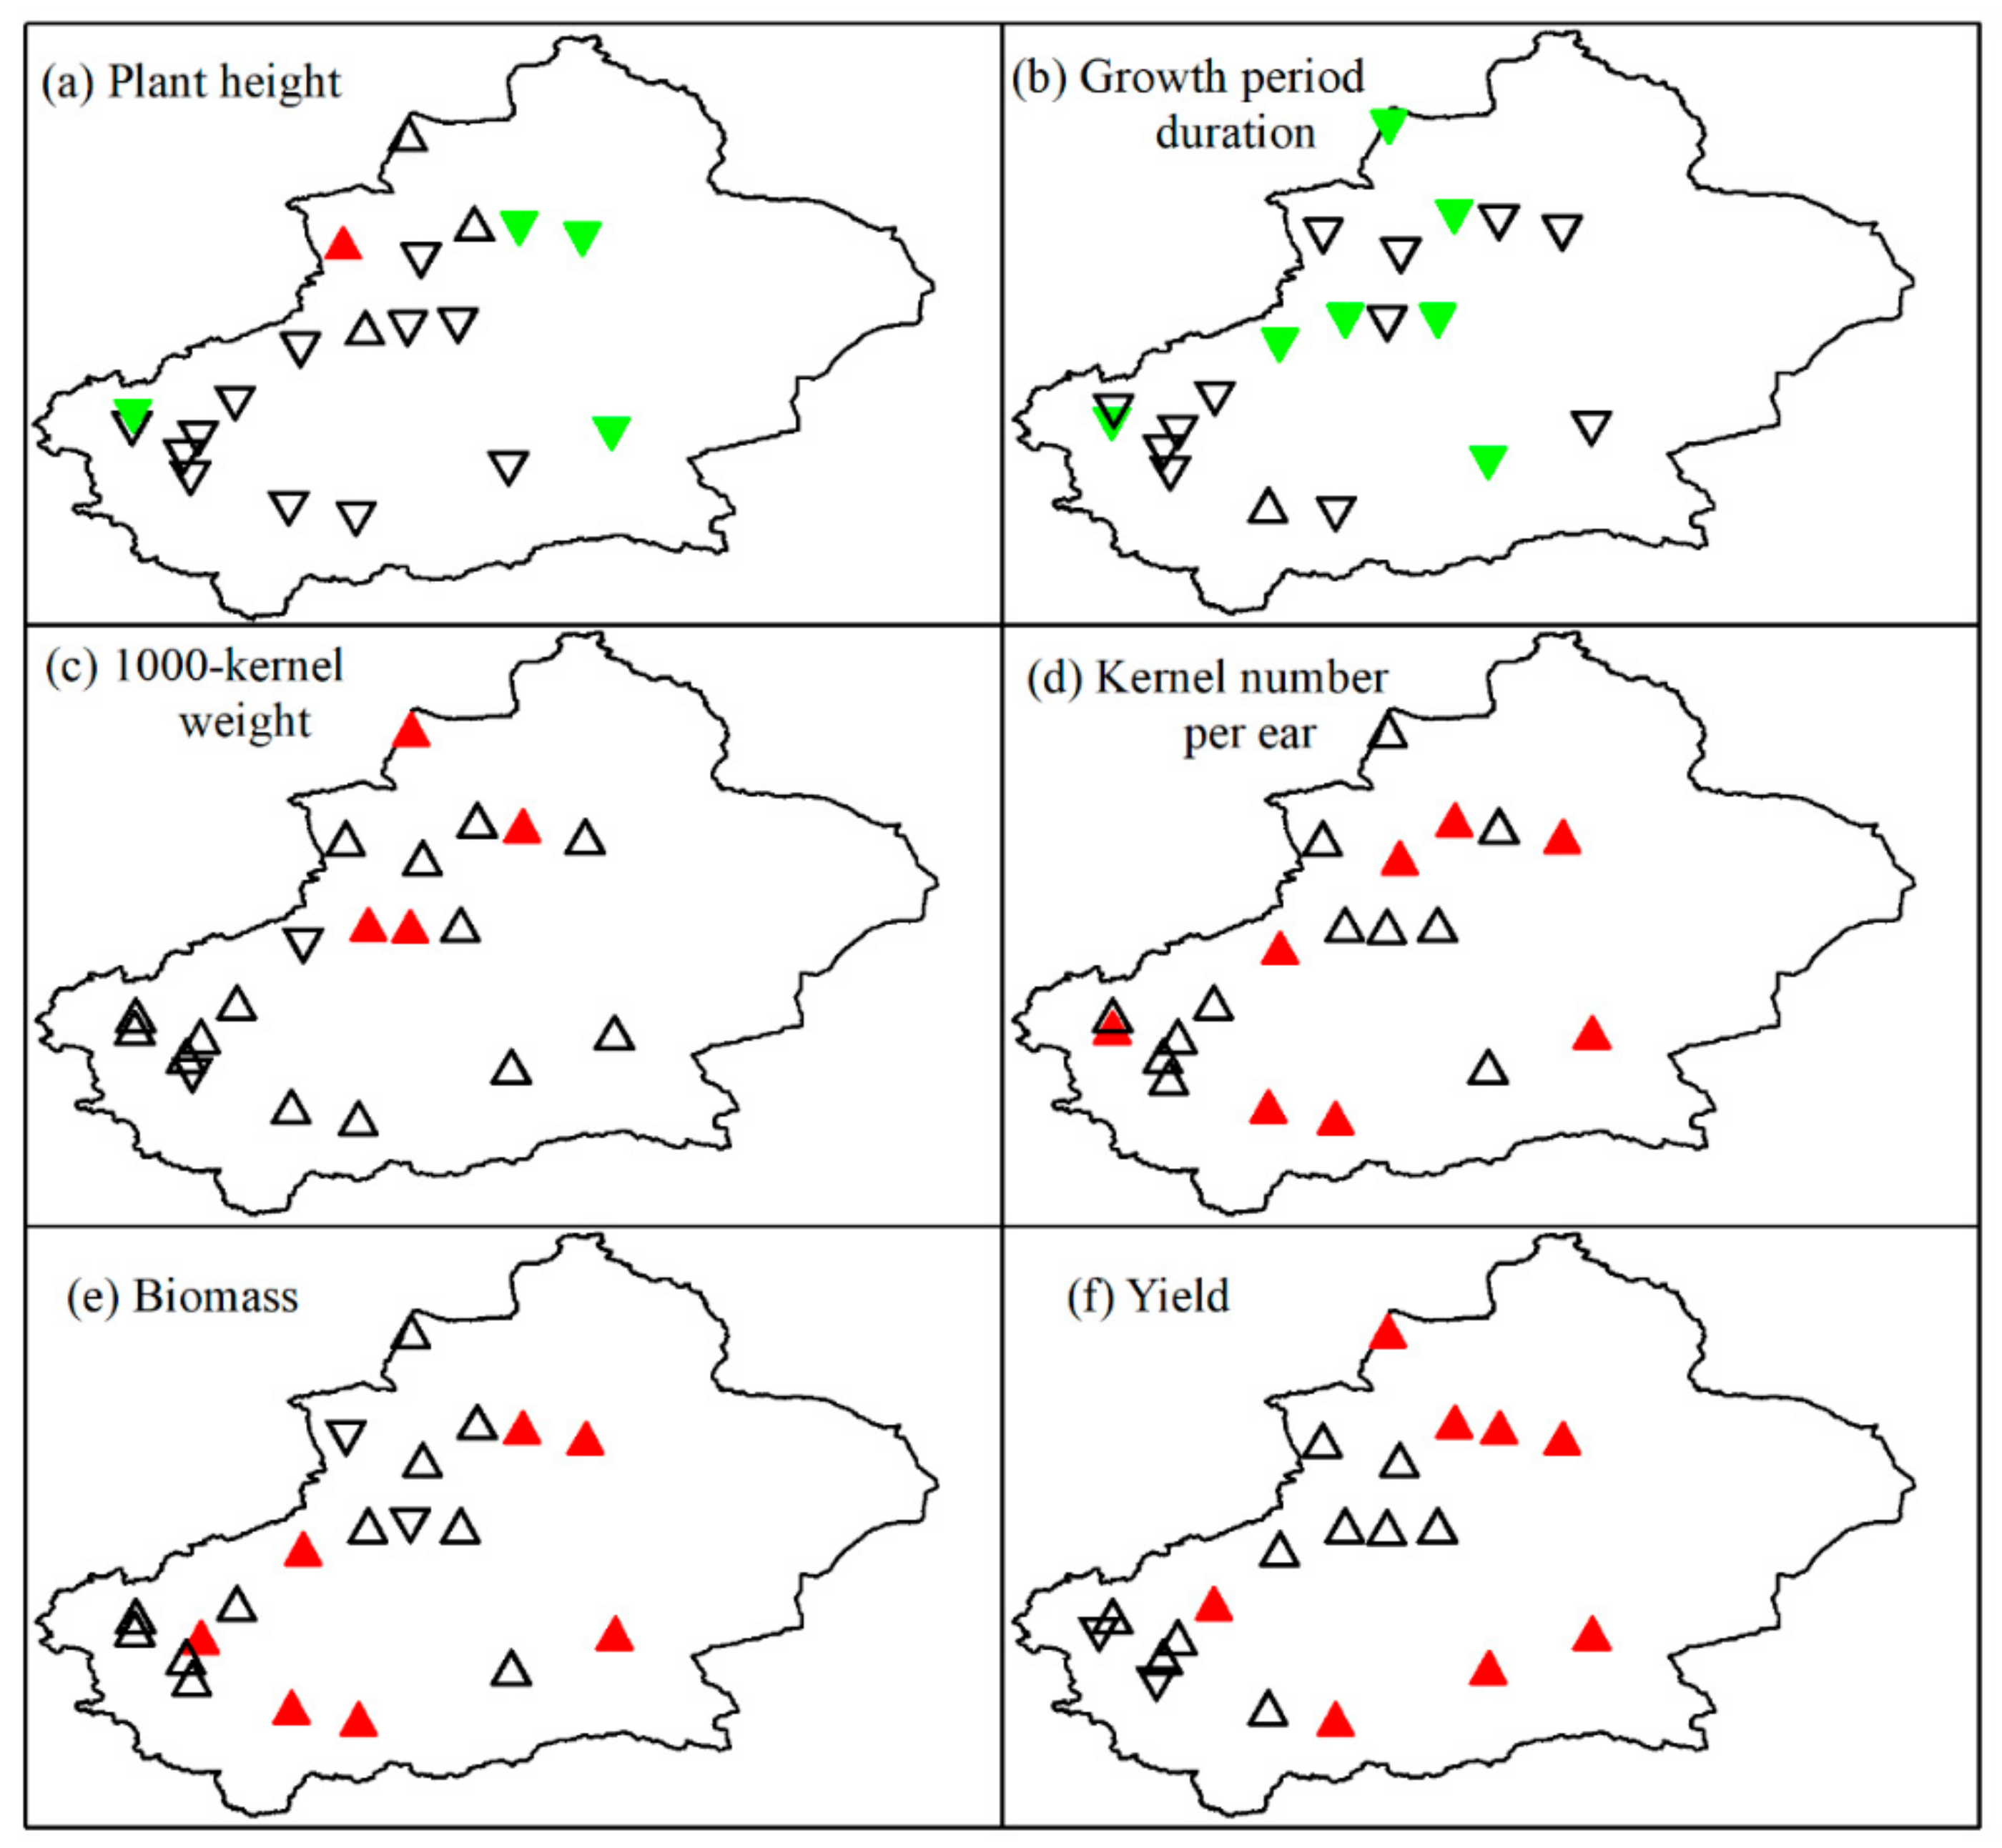
The trends of the growth- and yield-related parameters over 1981–2017 are mapped for the 20 sites in Figure 5. Different trends were observed for different sites. Few sites showed significant trends. Trends in kernel number per ear increased at all 20 sites. Plant height at 16 and growth period duration at 19 sites had decreasing trends, while 1000-kernel weight, biomass and yield at 18 sites showed increasing trends. General shortened winter wheat phenology and increased growth and yields were observed in Xinjiang.
3.2. The Best Functions of Winter Wheat Growth and Yields
3.2.1. Pearson Correlation Analysis
The matrix of Pearson correlation coefficients (r) between yield-related indices and climatic variables at each site were obtained (Table 2 and Table 3). The results demonstrated that (1) ∆H was positively correlated to ∆Pre and ∆RH but negatively correlated to ∆U2, ∆Tmean and ∆Sun at most of the sites. (2) ∆G had negative correlations with ∆Tmean but positive correlations with ∆Pre or ∆RH at most of the sites. However, the correlations between ∆G and ∆U2 or ∆Sun were not consistent for different sites. The effects of precipitation, mean temperature and relative humidity on plant height and growth period duration agreed well. (3) Correlations between the first differences of 1000-kernel weight (or kernel number per ear, yield and biomass) and climatic variables differed with sites. Values of r changed with sites and variables.
3.2.2. The Best Multivariate Linear Regression Equations
For selecting the best multivariate linear functions, the yield at the site Wusu is taken for example. The first difference of yield (ΔYie) was linear correlated with each of the selected five climate variables (i.e., Pre, Tmean, U2, Sun and RH) (Table 4). A linear function of ΔYie that performed the best and had the largest Radj2 among the five was selected (∆Yie = −8.4∆Pre).
The multivariate linear functions of ΔYie correlated with 2, 3, 4 and 5 climate variables (22 functions in total) were obtained step by step, of which the equations are given in Table 5. The best 2-, 3-, 4-, 5-variate linear functions that had the largest Radj2 values in each group were selected (bold in Table 5). Through further comparing four better equations, one 2-variate equation was selected (∆Yie = −12.2∆Pre − 623∆Tmean) as the best linear function of ∆Yie. However, this best relationship performed not very good with Radj2 value of 0.29. Nonlinear relationship should be tried to see if the performance could be improved.
3.2.3. The Best Multivariate Linear Regression Equations
The performance of the single and multi-variate nonlinear regression is shown in Table 6, also taking the site Wusu as an example. It was shown that both 2- and 3-order polynomial and interactive regression functions had improved performance (Radj2 > 0.34) compared to all of the linear functions. Finally, the equation ∆Yie = −12.1∆Pre − 604∆Tmean − 4.04 ∆Pre × ∆Tmean was considered the best function for describing the relationship of ∆Yie with climate variables, considering its largest and relatively simple format.
A similar procedure was conducted for finding the best functions of the other growth- and yield-related variables at all sites. The site-specific best functions at all sites are presented in Table 7. Unfortunately, not all of the yield-related variables could be described as functions of climatic variables, and the best functions were obtained for only less than half the studied sites. In addition, the largest Radj2 values for plant height, growth period duration, 1000-kernel weight, kernel number per ear, biomass and yield were 0.41, 0.27, 0.27, 0.50, 0.41 and 0.40, respectively. The performance of these relationships showed that climate change only explained less than 50% of the variability in winter wheat growth. The obtained equations could be used in prediction of winter wheat yields but with not too high accuracy. Still, these equations are useful, since yield prediction is important.
3.2.4. Roles of Soil Water Storage (Content) on Winter Wheat Growth and Yields
The yield and growth of winter wheat should also be related to soil water content, since irrigation is also a key technique when soil water is deficient. However, since soil moisture data were not as complete as weather data, the best functions of the growth and yield indices did not include the effects of soil water content. Still, its effects on winter wheat growth and yields could be discussed using some limited data. The volumetric soil water content (θv) at a depth of 0–10, 10–20, 20–30, 30–40 and 40–50 cm of eight sites during 1981–2012 were collected for assessing its effects on winter wheat growth and yields. The mean θv during winter wheat growth period at different depths were correlated to the winter wheat yield-related indices for the eight sites and the Pearson correlation coefficients are presented in Table 8. It was shown that θv had complicated varying influences on winter wheat growth and yields. This result agreed well with Li et al. [30]; their results showed that cotton stalk weight was positively correlated with soil moisture at depths of 0–10 to 40–50 cm at 11, 9, 10, 9 and 10 sites, while negative correlations were also detected between soil moisture at different depths and cotton yield indices. Previous studies have emphasized the importance of soil moisture on crop yields [42,43]. The plant height, growth period duration, 1000-kernel weight and kernel number per ear could be positively or negatively related to θv at certain depth. This occurred because (i) θv values were averaged for the entire growth period, (ii) the depths played different roles and (iii) the other factors including wheat variety and soil properties also affected θv. Overall, θv at different depths explained less than 61% of variability in the winter wheat growth and yields.
4. Discussion
In this research, the winter wheat growth period duration reduced during the research period (Figure 5b). Previous studies agree with our results very well [44,45,46]. The trends of winter wheat’s 1000-kernel weight, kernel number per ear, biomass and yield in Xinjiang increased at most sites. Adaptions such as delaying sowing date and changing cultivars would be considered. Zhou et al. [47] reported that the genetic improvement in grain yield was mainly contributed to increased grain weight per spike and reduced plant height, their results also supported our results in Figure 5a,c.
The impacts of climate change on crop yields can vary generally depending on the assessment technique (e.g., crop models or statistical models), crop varieties, climate data and crop model initial settings; therefore, the impacts of climate change on winter wheat growth and yields can be different [19,48,49,50]. Research using crop models without changing crop variety and management measures have shown that climate change had a negative impact on crop yields over the past three decades because of reduced growth duration [21,51,52,53]. In this research, the site-level data showed that first-difference climate variables had both negative and positive effects on the first-difference of yield-related indices (Table 2 and Table 3). One possible explanation is that in different growth periods, winter wheat had changing temperature thresholds and optimum temperatures [27,54]. The second reason is that the studied sites had different topographies. The third is that wheat growth processes (e.g., photosynthesis) occurred exclusively during the day, and the temperature during the day may not always increase during night [55].
The largest Radj2 values for the best functions of plant height, growth period duration, 1000-kernel weight, kernel number per ear, biomass and yield were 0.41, 0.27, 0.27, 0.50, 0.41 and 0.40, respectively, all <0.50. This was due to the complexity (non-linearity) of the climate system and the complexity of crop growth and yield processes. Our research showed that the significance of climate change only explained less than 50% of the variability in winter wheat growth. Previous studies obtained different ranges of Radj2. For example, Lobell et al. [12] obtained an Radj2 value of 0.56 when using the multivariate linear regression functions between first differences of wheat yield and climatic settings in Mexico. The highest R2 value of regression model between wheat yield and climate over 1988–2002 was 0.47 in the southwestern plains of Australia [19]. Lobell and Field [8] established a regression model between yield and climate first-differences over 1988–2002 with an R2 value of 0.41 for global scale of wheat. Liu et al. [5] and Lobell and Burke [21] obtained a large R2 value of 0.37 in the key wheat-growing region of China during 1960–2009. Since the advances in genotype and agricultural management measures such as fertilization and irrigation also affect and contribute to winter wheat yields, it was reasonable that climate change could not explain more than 56% of the winter wheat growth and yield.
Further research is, therefore, needed to better understand the roles of other factors, such as genotype and agronomic management, on winter wheat production.
5. Conclusions
Five climate variables (namely Pre, Tmean, U2, Sun and RH) without any multicollinearity were selected for further finding the best functions of winter wheat yield-related indices at the 20 stations in Xinjiang, China. Most sites were wetter, warmer, received less sunshine and experienced lower wind speed and humidity. Correspondingly, winter wheat plant height and growth period duration decreased, and the kernel number per ear, biomass and yield increased at most of the sites.
The Pearson correlation coefficients between yield-related indices and climatic variables ranged between −0.66 and 0.57. In general, the yield-related indices had strong or weak positive correlations with P and RH, but had negative correlations with Tmean, U2 and Sun. From the Pearson correlations, some key climatic variables that affected winter wheat crop yields were selected and used for further multi-variate linear and nonlinear regressions. The best functions of the wheat growth- and yield-related indices which could be linear or nonlinear were finally obtained step by step. The adjusted coefficient of determination varied between 0.09 to 0.50, which implied that climate change only explained at largest 50% of the variability in winter wheat growth and yields. Some other factors, such as genotype and agronomic management should be considered in future study.
Author Contributions
Conceptualization, Y.L. and H.L. (Hongguang Liu); methodology, H.L. (Haixia Lin), N.L., P.F. and D.L.; software, H.L. (Haixia Lin), L.L., N.L. and J.L.; validation, H.L. (Haixia Lin), N.L. and J.L.; formal analysis, H.L. (Haixia Lin) and N.L.; writing—original draft preparation, Y.L., H.L. (Haixia Lin), J.L., N.L. and C.L. All authors have read and agreed to the published version of the manuscript.
Funding
This research was funded by High-end Foreign Experts Introduction Project, grant number G20200027071 and China 111 project, grant number B12007.
Institutional Review Board Statement
Not applicable.
Informed Consent Statement
Not applicable.
Data Availability Statement
Not applicable.
Acknowledgments
We thank the Meteorological Data Sharing Service Network in China and Xinjiang Meteorological Bureau for supplying weather and winter wheat growth- and yield-related data. Wang Huijuan helped with language editing and grammar corrections.
Conflicts of Interest
The authors declare no conflict of interest.
Abbreviations
Precipitation—Pre; Maximum temperature—Tmax; Minimum temperature—Tmin; Mean temperature—Tmean; Wind speed—U2; Sunshine hours—Sun; Relative humidity—RH; Adjusted coefficient of determination —Radj2; Plant height—H, Growth period duration—G, 1000-kernel weight—W, Kernel number per ear—K, Biomass—B, and Yield—Yie.
Appendix A

Table A1.
The sand, silt and clay content and soil type at the 20 stations in Xinjiang, China.
| Site | Site No. | Clay (%) | Silt (%) | Sand (%) | Texture |
|---|---|---|---|---|---|
| Tacheng | 51133 | 22 | 631 | 47 | Clay loam |
| Wusu | 51346 | 11 | 36 | 53 | Loam |
| Wulanwusu | 51358 | 23 | 36 | 41 | Clay loam |
| Changji | 51368 | 18 | 35 | 47 | Clay loam |
| Yining | 51431 | 29 | 29 | 42 | Loamy clay |
| Xinyuan | 51436 | 22 | 32 | 46 | Clay loam |
| Akesu | 51628 | 12 | 32 | 56 | Sandy loam |
| Baicheng | 51633 | 22 | 31 | 47 | Clay loam |
| Luntai | 51642 | 4 | 23 | 73 | Sandy loam |
| Kuche | 51644 | 5 | 17 | 78 | Sandy loam |
| Aketao | 51708 | 29 | 45 | 26 | Silty clay |
| Kashi | 51709 | 18 | 32 | 50 | Clay loam |
| Bachu | 51716 | 12 | 32 | 56 | Sandy loam |
| Ruoqiang | 51777 | 9 | 31 | 60 | Sandy loam |
| Maigaiti | 51810 | 29 | 29 | 42 | Loamy clay |
| Shache | 51811 | 12 | 32 | 56 | Sandy loam |
| Yecheng | 51814 | 18 | 32 | 50 | Clay loam |
| Hetian | 51828 | 18 | 32 | 50 | Clay loam |
| Qiemo | 51855 | 4 | 3 | 93 | Sandy and loamy sandy |
| Yutian | 51931 | 22 | 32 | 46 | Clay loam |
References
- Stocker, T.F.; Qin, D.; Plattner, G.K.; Tignor, M.M.B.; Allen, S.K.; Boschung, J.; Nauels, A.; Xia, Y.; Bex, V.; Midgley, P.M. Summary for policymakers. In Climate Change 2014: Impacts, Adaptation, and Vulnerability; Part A: Global and Sectoral Aspects. Contribution of Working Group II to the Fifth Assessment Report of the Intergovernmental Panel on Climate Change; Cambridge University Press: Cambridge, UK; New York, NY, USA, 2014; pp. 1–32. [Google Scholar]
- Tao, F.; Zhang, S.; Zhang, Z.; Rotter, R.P. Maize growing duration was prolonged across China in the past three decades under the combined effects of temperature, agronomic management, and cultivar shift. Glob. Chang. Biol. 2014, 20, 3686–3699. [Google Scholar] [CrossRef] [PubMed]
- Wei, T.; Cherry, T.L.; Glomrod, S.; Zhang, T. Climate change impacts on crop yield: Evidence from China. Sci. Total Environ. 2014, 499, 133–140. [Google Scholar] [CrossRef] [PubMed] [Green Version]
- Howden, S.M.; Soussana, J.F.; Tubiello, F.N.; Chhetri, N.; Dunlop, M.; Meinke, H. Adapting agriculture to climate change. Proc. Natl. Acad. Sci. USA 2007, 104, 19691–19696. [Google Scholar] [CrossRef] [Green Version]
- Liu, B.; Liu, L.; Tian, L.; Cao, W.; Zhu, Y.; Asseng, S. Post-heading heat stress and yield impact in winter wheat of China. Glob. Chang. Biol. 2014, 20, 372–381. [Google Scholar] [CrossRef] [PubMed]
- CNBS. China Statistical Yearbook 2017; China Statistics Press: Beijing, China, 2017. [Google Scholar]
- Lobell, D.B.; Cahill, K.N.; Field, C.B. Historical effects of temperature and precipitation on California crop yields. Clim. Chang. 2007, 81, 187–203. [Google Scholar] [CrossRef]
- Lobell, D.B.; Field, C.B. Global scale climate–crop yield relationships and the impacts of recent warming. Environ. Res. Lett. 2007, 2, 014002. [Google Scholar] [CrossRef]
- Lobell, D.B.; Schlenker, W.; Costa-Roberts, J. Climate trends and global crop production since 1980. Science 2011, 333, 616–620. [Google Scholar] [CrossRef] [PubMed] [Green Version]
- Ray, D.K.; Gerber, J.S.; Macdonald, G.K.; West, P.C. Climate variation explains a third of global crop yield variability. Nat. Commun. 2015, 6, 5989. [Google Scholar] [CrossRef] [PubMed] [Green Version]
- Nicholls, N. Increased Australian wheat yield due to recent climate trends. Nature 1997, 387, 484–485. [Google Scholar] [CrossRef]
- Lobell, D.B.; Ortiz-Monasterio, J.I.; Asner, G.P.; Matson, P.A.; Naylor, R.L.; Falcon, W.P. Analysis of wheat yield and climatic trends in Mexico. Field Crops Res. 2005, 94, 250–256. [Google Scholar] [CrossRef]
- Tao, F.; Yokozawa, M.; Liu, J.; Zhang, Z. Climate–-crop yield relationships at provincial scales in China and the impacts of recent climate trends. Clim. Res. 2008, 38, 83–94. [Google Scholar] [CrossRef]
- Tao, F.; Zhang, Z.; Zhang, S.; Zhu, Z.; Shi, W. Response of crop yields to climate trends since 1980 in China. Clim. Res. 2012, 54, 233–247. [Google Scholar] [CrossRef]
- Zhang, T.; Huang, Y.; Yang, X. Climate warming over the past three decades has shortened rice growth duration in China and cultivar shifts have further accelerated the process for late rice. Glob. Chang. Biol. 2013, 19, 563–570. [Google Scholar] [CrossRef] [PubMed]
- Xiong, W.; Holman, I.P.; You, L.; Yang, J.; Wu, W. Impacts of observed growing-season warming trends since 1980 on crop yields in China. Reg. Environ. Chang. 2013, 14, 7–16. [Google Scholar] [CrossRef]
- Yang, X.; Chen, F.; Lin, X.; Liu, Z.; Zhang, H.; Zhao, J.; Li, K.; Ye, Q.; Li, Y.; Lv, S. Potential benefits of climate change for crop productivity in China. Agric. For. Meteorol. 2015, 208, 76–84. [Google Scholar] [CrossRef]
- Bhatt, D.; Maskey, S.; Babel, M.S.; Uhlenbrook, S.; Prasad, K.C. Climate trends and impacts on crop production in the Koshi River basin of Nepal. Reg. Environ. Chang. 2014, 14, 1291–1301. [Google Scholar] [CrossRef] [Green Version]
- Wang, B.; Chen, C.; Li Liu, D.; Asseng, S.; Yu, Q.; Yang, X. Effects of climate trends and variability on wheat yield variability in eastern Australia. Clim. Res. 2015, 64, 173–186. [Google Scholar] [CrossRef]
- White, J.W.; Hoogenboom, G.; Kimball, B.A.; Wall, G.W. Methodologies for simulating impacts of climate change on crop production. Field Crops Res. 2011, 124, 357–368. [Google Scholar] [CrossRef] [Green Version]
- Lobell, D.B.; Burke, M.B. On the use of statistical models to predict crop yield responses to climate change. Agric. For. Meteorol. 2010, 150, 1443–1452. [Google Scholar] [CrossRef]
- Fang, S.; Cammarano, D.; Zhou, G.; Tan, K.; Ren, S. Effects of increased day and night temperature with supplemental infrared heating on winter wheat growth in North China. Eur. J. Agron. 2015, 64, 67–77. [Google Scholar] [CrossRef]
- Wang, B.; Li Liu, D.; Asseng, S.; Macadam, I.; Yu, Q. Impact of climate change on wheat flowering time in eastern Australia. Agric. For. Meteorol. 2015, 209, 11–21. [Google Scholar] [CrossRef]
- Li, C.; Wang, R.; Ning, H.; Luo, Q. Changes in climate extremes and their impact on wheat yield in Tianshan Mountains region, northwest China. Environ. Earth Sci. 2016, 75, 1228. [Google Scholar] [CrossRef]
- Liu, B.; Asseng, S.; Müller, C.; Ewert, F.; Elliott, J.; Lobell, D.B.; Martre, P.; Ruane, A.C.; Wallach, D.; Jones, J.W. Similar estimates of temperature impacts on global wheat yield by three independent methods. Nat. Clim. Chang. 2016, 6, 1130–1136. [Google Scholar] [CrossRef]
- Li, Y.; Yao, N.; Chau, H.W. Influences of removing linear and nonlinear trends from climatic variables on temporal variations of annual reference crop evapotranspiration in Xinjiang, China. Sci. Total Environ. 2017, 592, 680–692. [Google Scholar] [CrossRef] [PubMed] [Green Version]
- Tao, F.; Xiao, D.; Zhang, S.; Zhang, Z.; Rötter, R.P. Wheat yield benefited from increases in minimum temperature in the Huang-Huai-Hai Plain of China in the past three decades. Agric. For. Meteorol. 2017, 239, 1–14. [Google Scholar] [CrossRef] [Green Version]
- Xiao, L.; Liu, L.; Asseng, S.; Xia, Y.; Tang, L.; Liu, B.; Cao, W.; Zhu, Y. Estimating spring frost and its impact on yield across winter wheat in China. Agric. For. Meteorol. 2018, 260, 154–164. [Google Scholar] [CrossRef]
- Feng, P.; Wang, B.; Li Liu, D.; Xing, H.; Ji, F.; Macadam, I.; Ruan, H.; Yu, Q. Impacts of rainfall extremes on wheat yield in semi-arid cropping systems in eastern Australia. Clim. Chang. 2018, 147, 555–569. [Google Scholar] [CrossRef]
- Li, N.; Lin, H.; Wang, T.; Li, Y.; Liu, Y.; Chen, X.; Hu, X. Impact of climate change on cotton growth and yields in Xinjiang, China. Field Crops Res. 2019, 247, 107590. [Google Scholar] [CrossRef]
- Rahim, M.S.; Nguyen, K.A.; Stewart, R.A.; Giurco, D.; Blumenstein, M. Machine Learning and Data Analytic Techniques in Digital Water Metering: A Review. Water 2020, 12, 294. [Google Scholar] [CrossRef] [Green Version]
- Hara, P.; Piekutowska, M.; Niedbała, G. Selection of Independent Variables for Crop Yield Prediction Using Artificial Neural Network Models with Remote Sensing Data. Land 2021, 10, 609. [Google Scholar] [CrossRef]
- Ding, Y.; Li, Y.; Li, L.; Yao, N.; Hu, W.; Yang, D.; Chen, C. Spatiotemporal variations of snow characteristics in Xinjiang, China over 1961–2013. Hydrol. Res. 2018, 49, 1578–1593. [Google Scholar] [CrossRef] [Green Version]
- Liu, Y.; Li, Y.; Li, L.C.; Chen, C.Y. Spatiotemporal Variability of Monthly and Annual Snow Depths in Xinjiang, China over 1961–2015 and the Potential Effects. Water 2019, 11, 19. [Google Scholar] [CrossRef] [Green Version]
- Prabnakorn, S.; Maskey, S.; Suryadi, F.X.; De, C.F. Rice yield in response to climate trends and drought index in the Mun River Basin, Thailand. Sci. Total Environ. 2018, 621, 108–119. [Google Scholar] [CrossRef] [PubMed]
- Liu, D.L.; Ji, F.; Wang, B.; Waters, C.; Feng, P.; Darbyshire, R. The implication of spatial interpolated climate data on biophysical modelling in agricultural systems. Int. J. Climatol. 2019, 40, 2870–2890. [Google Scholar] [CrossRef]
- Yue, S.; Wang, C.Y. Regional streamflow trend detection with consideration of both temporal and spatial correlation. Int. J. Climatol. A J. R. Meteorol. Soc. 2002, 22, 933–946. [Google Scholar] [CrossRef]
- Mann, H. Nonparametric tests against trend. Econometrica 13 245259Milly PCD, Dunne KA (2002) Macro scale water fluxes 2, water and energy supply control of their enter-annual variability. Water Resour. Res. 1945, 38, 241–249. [Google Scholar]
- Kendall, M. Rank Correlation Methods. Charles, G., Ed.; Google Scholar: London, UK, 1975. [Google Scholar]
- Li, Y.; Horton, R.; Ren, T.; Chen, C. Prediction of annual reference evapotranspiration using climatic data. Agric. Water Manag. 2010, 97, 300–308. [Google Scholar] [CrossRef]
- Malone, R.W.; Meek, D.W.; Hatfield, J.L.; Mann, M.E.; Jaquis, R.J.; Ma, L. Quasi-biennial corn yield cycles in Iowa. Agric. For. Meteorol. 2009, 149, 1087–1094. [Google Scholar] [CrossRef]
- Li, L.; Wang, B.; Feng, P.; Wang, H.; He, Q.; Wang, Y.; Liu, D.L.; Li, Y.; He, J.; Feng, H. Crop yield forecasting and associated optimum lead time analysis based on multi-source environmental data across China. Agric. For. Meteorol. 2021, 308–309, 108558. [Google Scholar] [CrossRef]
- Chen, X.; Li, Y.; Chau, H.W.; Zhao, H.; Li, M.; Lei, T.; Zou, Y. The spatiotemporal variations of soil water content and soil temperature and the influences of precipitation and air temperature at the daily, monthly, and annual timescales in China. Theor. Appl. Climatol. 2020, 140, 429–451. [Google Scholar] [CrossRef]
- Xiao, D.; Tao, F.; Liu, Y.; Shi, W.; Wang, M.; Liu, F.; Zhang, S.; Zhu, Z. Observed changes in winter wheat phenology in the North China Plain for 1981–2009. Int. J. Biometeorol. 2013, 57, 275–285. [Google Scholar] [CrossRef]
- Wang, J.; Wang, E.; Feng, L.; Yin, H.; Yu, W. Phenological trends of winter wheat in response to varietal and temperature changes in the North China Plain. Field Crops Res. 2013, 144, 135–144. [Google Scholar] [CrossRef]
- He, L.; Asseng, S.; Zhao, G.; Wu, D.; Yang, X.; Zhuang, W.; Jin, N.; Qiang, Y. Impacts of recent climate warming, cultivar changes, and crop management on winter wheat phenology across the Loess Plateau of China. Agric. For. Meteorol. 2015, 200, 135–143. [Google Scholar] [CrossRef]
- Zhou, Y.; He, Z.H.; Sui, X.X.; Xia, X.C.; Zhang, X.K.; Zhang, G.S. Genetic Improvement of Grain Yield and Associated Traits in the Northern China Winter Wheat Region from 1960 to 2000. Crop Sci. 2007, 47, 245–253. [Google Scholar] [CrossRef]
- Tao, F.; Zhang, S.; Zhang, Z. Spatiotemporal changes of wheat phenology in China under the effects of temperature, day length and cultivar thermal characteristics. Europ. J. Agron. 2012, 43, 201–212. [Google Scholar] [CrossRef]
- Tao, F.; Zhang, Z. Climate change, wheat productivity and water use in the North China Plain: A new super-ensemble-based probabilistic projection. Agric. For. Meteorol. 2013, 170, 146–165. [Google Scholar] [CrossRef]
- Xiao, D.; Tao, F. Contributions of cultivars, management and climate change to winter wheat yield in the North China Plain in the past three decades. Europ. J. Agron. 2014, 52, 112–122. [Google Scholar] [CrossRef]
- Asseng, S.; Foster, I.A.N.; Turner, N.C. The impact of temperature variability on wheat yields. Glob. Chang. Biol. 2011, 17, 997–1012. [Google Scholar] [CrossRef]
- Sun, S.; Yang, X.; Lin, X.; Zhao, J.; Liu, Z.; Zhang, T.; Xie, W. Seasonal variability in potential and actual yields of winter wheat in China. Field Crops Res. 2019, 240, 1–11. [Google Scholar] [CrossRef]
- Lu, C.; Fan, L. Winter wheat yield potentials and yield gaps in the North China Plain. Field Crops Res. 2013, 143, 98–105. [Google Scholar] [CrossRef] [Green Version]
- Sacks, W.J.; Kucharik, C.J. Crop management and phenology trends in the U.S. Corn Belt: Impacts on yields, evapotranspiration and energy balance. Agric. For. Meteorol. 2011, 151, 882–894. [Google Scholar] [CrossRef]
- Lobell, D.B. Changes in diurnal temperature range and national cereal yields. Agric. For. Meteorol. 2007, 145, 229–238. [Google Scholar] [CrossRef]
Figure 1.
Location and elevations (m) of the selected 20 agro-meteorological sites in Xinjiang, China.
Figure 1.
Location and elevations (m) of the selected 20 agro-meteorological sites in Xinjiang, China.

Figure 2.
Variations of the selected climatic variables during winter wheat-growing seasons over 1981–2017 at the 20 sites of Xinjiang, China. (a) Precipitation, (b) Mean temperature, (c) Wind speed at 2 m, (d) Sunshine hour, and (e) Relative humidity. Black horizontal line: median; box-boundaries: 25th and 75th percentiles; whiskers: 10th and 90th percentiles; triangles: outliers.

Figure 3.
The spatial distribution of the trends and significance of the selected climatic variables during the winter wheat-growing season in 1981–2017. The trends were tested by the MMK method.
Figure 3.
The spatial distribution of the trends and significance of the selected climatic variables during the winter wheat-growing season in 1981–2017. The trends were tested by the MMK method.

Figure 4.
The box plots of the growth- and yield-related parameters of winter wheat over 1981–2017 at the 20 sites of Xinjiang, China. (a) Plant height of maturity stage, (b) growth period duration, (c) 1000-kernel weight, (d) kernel number per ear, (e) biomass of maturity period, and (f) yield.
Figure 4.
The box plots of the growth- and yield-related parameters of winter wheat over 1981–2017 at the 20 sites of Xinjiang, China. (a) Plant height of maturity stage, (b) growth period duration, (c) 1000-kernel weight, (d) kernel number per ear, (e) biomass of maturity period, and (f) yield.

Figure 5.
Spatial distributions of the trends and significance of the growth-related and yield-related variables of winter wheat. (a) Plant height of maturity stage, (b) growth period duration, (c) 1000-kernel weight, (d) kernel number per ear, (e) biomass of maturity period and (f) yield.
Figure 5.
Spatial distributions of the trends and significance of the growth-related and yield-related variables of winter wheat. (a) Plant height of maturity stage, (b) growth period duration, (c) 1000-kernel weight, (d) kernel number per ear, (e) biomass of maturity period and (f) yield.

Table 1.
The geographical information and the long-term mean values of Pre, Tmean, U2, Sun, RH and yield-related variables include plant height (H), growth period (G), 1000-kernel weight (W), kernel number per ear (K), biomass (B) and yield (Yie) over 1981–2017 during the winter wheat growth period at the 20 ago-meteorological stations in Xinjiang, China.
| Site Name | Site Number | Latitude (°) | Longitude (°) | Elevation (m) | Pre (mm) | Tmean (°C) | U2 (m s−1) | Sun (h) | RH (%) | H (cm) | G (days) | W (g) | K | B (kg ha−1) | Yie (kg ha−1) |
|---|---|---|---|---|---|---|---|---|---|---|---|---|---|---|---|
| Tacheng | 51133 | 83.0 | 46.7 | 535 | 278 | 6.6 | 2.2 | 7.7 | 59 | 85 | 296 | 40 | 34 | 25,113 | 4806 |
| Wusu | 51346 | 84.7 | 44.4 | 479 | 173 | 7.2 | 1.7 | 7.2 | 60 | 81 | 279 | 39 | 30 | 15,151 | 6045 |
| Wulanwusu | 51358 | 85.8 | 44.3 | 469 | 209 | 6.6 | 1.5 | 7.7 | 65 | 85 | 279 | 44 | 33 | 22,010 | 5491 |
| Changji | 51368 | 87.4 | 44.0 | 516 | 180 | 7.1 | 2.0 | 7.4 | 64 | 84 | 279 | 40 | 34 | 25,456 | 5083 |
| Yining | 51431 | 81.3 | 44.0 | 663 | 285 | 8.5 | 1.6 | 7.6 | 65 | 84 | 266 | 43 | 26 | 15,865 | 4878 |
| Xinyuan | 51436 | 83.3 | 43.5 | 929 | 489 | 8.4 | 1.9 | 7.5 | 62 | 88 | 273 | 41 | 29 | 18,863 | 4742 |
| Akesu | 51628 | 80.2 | 41.2 | 1105 | 71 | 9.9 | 1.6 | 7.8 | 56 | 79 | 260 | 41 | 29 | 18,087 | 4768 |
| Baicheng | 51633 | 81.9 | 41.8 | 1230 | 113 | 8.3 | 0.8 | 8.0 | 64 | 74 | 279 | 40 | 25 | 16,897 | 5566 |
| Luntai | 51642 | 84.3 | 41.8 | 978 | 76 | 11.7 | 1.3 | 7.3 | 48 | 71 | 265 | 42 | 26 | 18,825 | 4595 |
| Kuche | 51644 | 83.0 | 41.7 | 1083 | 66 | 11.3 | 1.9 | 7.6 | 48 | 78 | 266 | 42 | 28 | 18,732 | 5887 |
| Aketao | 51708 | 75.95 | 39.2 | 1325 | 82 | 9.9 | 0.8 | 7.2 | 59 | 81 | 249 | 43 | 28 | 19,629 | 5251 |
| Kashi | 51709 | 75.98 | 39.5 | 1291 | 67 | 11.3 | 1.7 | 7.7 | 50 | 75 | 347 | 38 | 26 | 21,371 | 5577 |
| Bachu | 51716 | 78.57 | 39.8 | 1117 | 58 | 11.3 | 1.5 | 7.7 | 47 | 75 | 241 | 40 | 35 | 21,869 | 4426 |
| Ruoqiang | 51777 | 88.2 | 39.0 | 889 | 30 | 10.8 | 2.3 | 8.3 | 41 | 77 | 271 | 33 | 25 | 21,771 | 4487 |
| Maigaiti | 51810 | 77.6 | 38.9 | 1179 | 50 | 11.0 | 1.3 | 7.8 | 54 | 79 | 246 | 37 | 36 | 26,306 | 8866 |
| Shache | 51811 | 77.3 | 38.4 | 1232 | 52 | 11.0 | 1.3 | 7.7 | 52 | 74 | 245 | 38 | 29 | 20,324 | 5996 |
| Yecheng | 51814 | 77.4 | 37.9 | 1360 | 62 | 11.3 | 1.5 | 7.9 | 46 | 75 | 250 | 39 | 29 | 17,861 | 5103 |
| Hetian | 51828 | 79.9 | 37.1 | 1375 | 40 | 12.2 | 1.8 | 7.3 | 40 | 71 | 248 | 38 | 27 | 14,226 | 5135 |
| Qiemo | 51855 | 85.6 | 38.2 | 1248 | 23 | 9.8 | 1.6 | 7.5 | 42 | 87 | 276 | 39 | 25 | 18,482 | 5069 |
| Yutian | 51931 | 81.7 | 36.9 | 1423 | 50 | 10.9 | 1.2 | 7.9 | 46 | 73 | 253 | 38 | 29 | 19,005 | 5852 |
Table 2.
The Pearson correlation coefficients between first differences of four growth indices (plant height, growth period duration, 1000-kernel weight and kernel number per ear) and climatic variables over 1981–2017 at the 20 sites in Xinjiang, China. Red and blue grids represent positive and negative correlations, respectively.
| ∆Plant Height vs. | ∆Growth Period Duration vs. | |||||||||
|---|---|---|---|---|---|---|---|---|---|---|
| Site | ∆Pre | ∆U2 | ∆Tmean | ∆RH | ∆Sun | ∆Pre | ∆U2 | ∆Tmean | ∆RH | ∆Sun |
| Tacheng | −0.14 | 0.04 | 0.13 | 0.00 | 0.05 | 0.15 | −0.20 | 0.33 * | 0.21 | −0.17 |
| Wusu | 0.20 | −0.30 | −0.18 | 0.42 * | −0.18 | −0.31 * | 0.18 | 0.18 | −0.31 * | 0.23 |
| Wulanwusu | 0.28 | −0.02 | 0.00 | 0.30 | −0.27 | 0.09 | −0.26 | −0.35 * | 0.31 * | −0.37 * |
| Changji | 0.49 ** | −0.30 * | −0.07 | 0.32 * | −0.20 | −0.05 | −0.11 | −0.36 * | 0.04 | −0.38 * |
| Yining | −0.01 | −0.07 | 0.06 | 0.13 | 0.06 | −0.01 | −0.27 | −0.28 | 0.16 | 0.04 |
| Xinyuan | 0.29 | 0.21 | −0.10 | 0.15 | −0.19 | −0.02 | 0.13 | −0.31 * | 0.12 | −0.13 |
| Akesu | 0.08 | −0.27 | −0.09 | 0.02 | −0.11 | 0.12 | −0.05 | −0.35 * | 0.16 | −0.29 |
| Baicheng | −0.13 | −0.24 | −0.28 | −0.13 | −0.01 | 0.02 | 0.13 | 0.11 | −0.06 | 0.09 |
| Luntai | 0.49 ** | −0.02 | −0.22 | 0.28 | −0.07 | −0.34 * | 0.13 | −0.33 * | 0.11 | −0.14 |
| Kuche | 0.25 | −0.13 | −0.20 | 0.31 * | 0.15 | 0.17 | −0.24 | −0.16 | 0.15 | 0.30 |
| Aketao | 0.02 | 0.28 | 0.03 | −0.12 | 0.26 | −0.05 | 0.11 | 0.09 | −0.06 | 0.09 |
| Kashi | 0.27 | −0.06 | −0.07 | 0.30 | 0.19 | 0.04 | 0.06 | 0.06 | 0.07 | 0.08 |
| Bachu | −0.23 | −0.06 | −0.25 | 0.30 | −0.27 | −0.34 * | −0.09 | 0.02 | −0.21 | 0.22 |
| Ruoqiang | 0.10 | −0.06 | −0.14 | 0.39 * | −0.16 | −0.21 | −0.10 | −0.18 | 0.21 | −0.07 |
| Maigaiti | −0.01 | 0.02 | 0.03 | 0.04 | −0.02 | 0.21 | 0.25 | −0.30 | 0.21 | 0.07 |
| Shache | 0.01 | −0.16 | −0.15 | 0.26 | 0.09 | 0.30 | 0.10 | −0.32 * | 0.13 | −0.18 |
| Yecheng | 0.01 | 0.01 | −0.29 | 0.23 | −0.16 | 0.15 | −0.18 | −0.53 ** | 0.38 * | −0.34 * |
| Hetian | 0.00 | 0.07 | −0.17 | 0.14 | −0.01 | 0.11 | −0.24 | −0.37 * | 0.07 | −0.22 |
| Qiemo | −0.28 | 0.02 | 0.39 * | −0.26 | 0.38 * | 0.21 | 0.13 | −0.12 | −0.06 | −0.03 |
| Yutian | −0.15 | −0.17 | 0.31 * | −0.09 | 0.21 | −0.14 | −0.11 | −0.27 | −0.16 | −0.10 |
| ∆1000-kernel weight vs. | ∆Kernel number per ear vs. | |||||||||
| Site | ∆Pre | ∆U2 | ∆Tmean | ∆RH | ∆Sun | ∆Pre | ∆U2 | ∆Tmean | ∆RH | ∆Sun |
| Tacheng | −0.21 | 0.40 * | 0.06 | −0.06 | 0.01 | −0.01 | 0.32 * | −0.11 | −0.12 | −0.04 |
| Wusu | −0.14 | 0.20 | 0.29 | 0.04 | 0.18 | −0.04 | −0.16 | −0.31 | 0.08 | −0.14 |
| Wulanwusu | −0.15 | 0.10 | 0.22 | −0.15 | 0.30 | 0.29 | −0.24 | −0.40 * | 0.19 | −0.36 * |
| Changji | −0.25 | 0.05 | 0.08 | 0.11 | −0.04 | 0.28 | 0.05 | −0.07 | 0.24 | −0.43 * |
| Yining | 0.21 | 0.13 | −0.66 ** | 0.21 | −0.30 | −0.08 | 0.18 | 0.17 | −0.18 | 0.20 |
| Xinyuan | −0.28 | −0.02 | 0.15 | −0.17 | 0.37 * | 0.56 ** | −0.06 | 0.02 | 0.53 ** | −0.41 * |
| Akesu | −0.05 | 0.32 * | −0.07 | −0.22 | 0.04 | 0.28 | −0.02 | −0.05 | 0.02 | 0.04 |
| Baicheng | 0.29 | 0.05 | −0.30 | 0.14 | −0.05 | 0.06 | −0.22 | −0.45 ** | 0.54 ** | −0.34 * |
| Luntai | −0.30 | 0.08 | 0.19 | −0.45 ** | 0.42 ** | −0.17 | 0.30 | 0.29 | −0.43 * | 0.49 ** |
| Kuche | 0.02 | −0.04 | 0.09 | −0.14 | 0.02 | −0.03 | 0.18 | 0.35 * | −0.18 | 0.16 |
| Aketao | 0.06 | 0.17 | −0.13 | 0.10 | −0.12 | 0.03 | 0.17 | 0.09 | −0.03 | −0.08 |
| Kashi | 0.20 | 0.03 | −0.24 | 0.13 | −0.27 | 0.10 | −0.27 | −0.11 | 0.28 | 0.11 |
| Bachu | 0.02 | 0.08 | 0.03 | 0.12 | −0.06 | −0.04 | −0.04 | −0.19 | 0.01 | 0.05 |
| Ruoqiang | −0.17 | −0.09 | −0.30 | 0.20 | −0.17 | 0.08 | −0.07 | −0.14 | 0.13 | 0.03 |
| Maigaiti | −0.15 | −0.17 | −0.09 | 0.09 | −0.29 | 0.01 | 0.12 | −0.12 | −0.02 | −0.01 |
| Shache | 0.30 | 0.04 | −0.02 | 0.28 | −0.20 | 0.37 * | 0.10 | −0.35 * | 0.25 | 0.06 |
| Yecheng | 0.31 * | 0.08 | −0.26 | 0.08 | −0.20 | −0.03 | −0.15 | 0.04 | 0.16 | −0.09 |
| Hetian | 0.09 | −0.26 | 0.19 | −0.16 | 0.06 | 0.05 | 0.03 | −0.06 | 0.17 | −0.05 |
| Qiemo | −0.25 | −0.07 | 0.14 | 0.22 | −0.16 | 0.34 * | −0.09 | −0.01 | −0.15 | 0.07 |
| Yutian | 0.22 | −0.24 | 0.04 | 0.13 | −0.21 | 0.25 | −0.27 | −0.20 | 0.03 | −0.01 |
* and ** mean significance at confidence levels of 0.05 and 0.01, respectively.
Table 3.
The Pearson correlation coefficients between first differences of two growth indices, biomass or yield and climatic variables, over 1981–2017 at the 20 sites in Xinjiang, China. Red and blue grids represent positive and negative correlations, respectively.
Table 3.
The Pearson correlation coefficients between first differences of two growth indices, biomass or yield and climatic variables, over 1981–2017 at the 20 sites in Xinjiang, China. Red and blue grids represent positive and negative correlations, respectively.
| ∆Biomass vs. | ∆Yield vs. | |||||||||
|---|---|---|---|---|---|---|---|---|---|---|
| Site | ∆Pre | ∆U2 | ∆Tmean | ∆RH | ∆Sun | ∆Pre | ∆U2 | ∆Tmean | ∆RH | ∆Sun |
| Tacheng | 0.30 | −0.02 | 0.19 | 0.37 * | −0.36 * | −0.20 | 0.23 | 0.57 ** | −0.23 | 0.22 |
| Wusu | −0.19 | 0.08 | 0.09 | −0.05 | 0.14 | −0.42 * | −0.05 | −0.19 | −0.39 * | 0.19 |
| Wulanwusu | 0.04 | 0.16 | 0.28 | 0.25 | −0.30 | 0.07 | −0.02 | 0.05 | −0.02 | 0.19 |
| Changji | 0.40 * | −0.36 * | −0.25 | 0.20 | −0.19 | 0.16 | 0.09 | −0.04 | −0.01 | −0.01 |
| Yining | −0.13 | 0.26 | 0.20 | −0.16 | −0.05 | −0.43 * | −0.10 | −0.16 | −0.42 * | 0.24 |
| Xinyuan | 0.27 | 0.30 | −0.05 | 0.40 * | −0.31 * | −0.14 | 0.03 | 0.27 | −0.14 | 0.20 |
| Akesu | 0.04 | 0.10 | −0.12 | −0.02 | −0.15 | −0.21 | 0.08 | 0.05 | 0.03 | 0.10 |
| Baicheng | −0.13 | −0.24 | −0.28 | −0.13 | −0.01 | −0.24 | 0.01 | 0.29 | −0.24 | −0.08 |
| Luntai | −0.05 | 0.07 | 0.16 | −0.18 | 0.17 | −0.23 | 0.16 | 0.11 | −0.26 | 0.22 |
| Kuche | 0.12 | −0.11 | 0.00 | 0.10 | 0.44 * | 0.21 | 0.30 | 0.13 | −0.47 ** | 0.00 |
| Aketao | 0.05 | 0.17 | −0.21 | 0.10 | −0.11 | 0.11 | 0.03 | −0.18 | 0.08 | −0.01 |
| Kashi | 0.13 | −0.07 | −0.24 | 0.33 * | −0.33 * | 0.36 * | −0.03 | −0.30 | 0.37 * | −0.33 * |
| Bachu | 0.18 | −0.23 | −0.09 | 0.17 | −0.10 | 0.03 | 0.00 | 0.08 | 0.13 | −0.18 |
| Ruoqiang | 0.09 | −0.05 | −0.30 | 0.27 | −0.19 | −0.12 | −0.05 | −0.06 | 0.25 | −0.34 * |
| Maigaiti | −0.36 * | 0.22 | 0.04 | −0.31 * | 0.04 | −0.27 | 0.18 | −0.02 | −0.06 | −0.08 |
| Shache | −0.16 | −0.03 | −0.10 | 0.17 | −0.26 | 0.35 * | 0.14 | −0.11 | 0.14 | −0.06 |
| Yecheng | 0.09 | −0.24 | −0.18 | 0.11 | −0.28 | 0.15 | −0.07 | −0.31 * | 0.34 * | −0.43 * |
| Hetian | −0.02 | −0.12 | 0.15 | −0.09 | 0.00 | 0.01 | 0.03 | 0.07 | 0.14 | 0.03 |
| Qiemo | −0.10 | −0.12 | 0.34 * | −0.10 | 0.29 | −0.16 | 0.01 | 0.35 * | −0.05 | 0.09 |
| Yutian | −0.37 * | −0.06 | 0.28 | −0.25 | 0.01 | 0.21 | −0.36 * | 0.20 | −0.09 | 0.01 |
* and ** mean significance at confidence levels of 0.05 and 0.01, respectively.
Table 4.
The linear equations for ∆Yie at Wusu.
| No. | Linear Regression | Radj2 |
|---|---|---|
| 1 | ∆Yie = −8.4∆Pre | 0.15 * |
| 2 | ∆Yie = 2.41∆Sun | 0.001 |
| 3 | ∆Yie = −624.1∆U2 | - |
| 4 | ∆Yie = −153.61∆RH | 0.12 |
| 5 | ∆Yie = −262.8∆Tmean | 0.003 |
* means significance at a confidence level of 0.05.
Table 5.
The multivariate linear equations for ΔYie correlated with two to five climatic variables and their performance at site Wusu.
Table 5.
The multivariate linear equations for ΔYie correlated with two to five climatic variables and their performance at site Wusu.
| Model Type | Linear Regression | Radj2 |
|---|---|---|
| Two variables | ∆Yie = −11∆Pre − 3327∆U2 | 0.18 * |
| ∆Yie = −12.2∆Pre − 623∆Tmean | 0.29 ** | |
| ∆Yie = −5.9∆Pre − 65∆RH | 0.13 * | |
| ∆Yie = −10∆Pre − 1.8∆Sun | 0.13 * | |
| ∆Yie = −1776∆Sun + 3.13∆U2 | -- | |
| ∆Yie = −2.32∆Sun − 202.3∆RH | 0.11 | |
| ∆Yie = 3.976∆Sun − 425.6∆Tmean | 0.05 | |
| ∆Yie = −4336.93∆U2 − 224.23∆RH | 0.18 * | |
| ∆Yie = 1043.6∆U2 − 327.7∆Tmean | -- | |
| ∆Yie = −214.87∆RH − 556.7∆Tmean | 0.24 ** | |
| Three variables | ∆Yie = −12∆Pre − 889∆U2 − 577∆Tmean | 0.27 ** |
| ∆Yie = −6.1∆Pre − 4409∆U2 − 134∆RH | 0.02 | |
| ∆Yie = −11∆Pre − 3618∆U2 – 1.08∆Sun | 0.16 | |
| ∆Yie = −8.7∆Pre − 651∆Tmean − 94∆RH | 0.27 ** | |
| ∆Yie = 13∆Pre − 614∆Tmean − 0.61∆Sun | 0.13 | |
| ∆Yie = −7∆Pre − 116∆RH − 3.2∆Sun | 0.13 | |
| ∆Yie = −12.5∆U2 − 0.32∆Tmean − 7.6∆RH | 0.23 | |
| ∆Yie = 121∆U2 − 432∆Tmean + 3.95∆Sun | 0.02 | |
| Four variables | ∆Yie = −8.4∆Pre − 1952∆U2 − 556∆Tmean − 120∆RH | 0.02 |
| ∆Yie = −13∆Pre − 834∆U2 − 572∆Tmean − 0.52∆Sun | 0.28 * | |
| ∆Yie = −2399∆U2 − 425∆Tmean − 267∆RH − 1.3∆Sun | 0.21 * | |
| Five variables | ∆Yie = −9.1∆Pre − 2026∆U2 − 527∆Tmean − 156∆RH − 2.28∆Sun | 0.28 * |
* and ** mean significance at confidence levels of 0.05 and 0.01, respectively.
Table 6.
Performance of different nonlinear regression functions between ∆Yie and climatic variables at the site Wusu.
Table 6.
Performance of different nonlinear regression functions between ∆Yie and climatic variables at the site Wusu.
| Model Type | Linear Regression | Radj2 |
|---|---|---|
| Two order polynomial regression | ∆Yie = −8.48∆Pre + 0.012(∆Pre)2 | 0.13 |
| ∆Yie = (−527∆Tmean − 11.4∆Pre − 163(∆Tmean)2 − 0.02(∆Pre)2 − 7.55∆Pre × ∆Tmean | 0.346 ** | |
| ∆Yie = −262∆Tmean − 0.547(∆Tmean)2 | - | |
| Three order polynomial regression | ∆Yie = −13.0∆Pre − 0.009 (∆Pre)2 − 0.0002(∆Pre)3 | 0.12 |
| ∆Yie = −642.9∆Tmean − 17.4 ∆Pre − 118.4(∆Tmean)2 − 0.037(∆Pre)2 + 40.1(∆Tmean)3 − 0.0003(∆Pre)3 − 8.31∆Pre × ∆Tmean | 0.35 * | |
| ∆Yie = −630∆Tmean − 55.0(∆Tmean)2 + 122.94(∆Tmean)3 + 7.4618(∆Tmean)3 | - | |
| Interactive regression | ∆Yie = −12.1∆Pre − 604∆Tmean − 4.04∆Pre × ∆Tmean | 0.351 ** |
* and ** mean significance at confidence levels of 0.05 and 0.01, respectively.
Table 7.
The selected best functions for wheat yield-related parameters.
| Yield- Related Variable | Site | Regression | Radj2 |
|---|---|---|---|
| Plant Height | Wusu | ∆H = 4.20∆RH − 0.018(∆RH)2 − 0.052(∆RH)3 | 0.17 * |
| Changji | ∆H = 0.113∆Pre − 26.5∆U2 | 0.26 * | |
| Baicheng | ∆H = 3.331∆Pre − 0.125∆RH | 0.41 ** | |
| Luntai | ∆H = 0.285∆RH + 0.111∆Pre + 0.0009(∆Pre)2 − 0.00003(∆Pre)3 + 0.025∆Pre × ∆RH | 0.22 ** | |
| Aketao | ∆H = 0.027∆Sun − 24.8∆U2 − 4.97(U2)2 + 2595(∆U2)3 − 0.397∆Sun × ∆U2 | 0.29 ** | |
| Kashi | ∆H = 0.0267∆Pre + 1.13∆RH | 0.19 * | |
| Bachu | ∆H = 3.74∆RH − 0.506∆Pre + 0.0002(∆Pre)2 − 0.00002(∆Pre)3 | 0.37 ** | |
| Ruoqiang | ∆H = 1.67∆RH − 5.96∆Tmean − 0.333(∆RH)2 + 0.018(∆RH)3 − 2.44∆Tmean × ∆RH | 0.22 * | |
| Qiemo | ∆H = −0.050∆Pre + 18.5∆Tmean + 5.11(∆Tmean)2 − 11.3(∆Tmean)3 − 0.439∆Tmean × ∆Pre | 0.24 * | |
| Growth period duration | Wulanwusu | ∆G = −0.014∆Sun − 2.12∆Tmean | 0.20 ** |
| Changji | ∆G = −0.020∆Sun | 0.16 ** | |
| Xinyuan | ∆G = 0.025∆Pre | 0.29 ** | |
| Luntai | ∆G = 0.021∆Sun | 0.27 ** | |
| Kuche | ∆G = 3.04∆Tmean | 0.10 * | |
| Kashi | ∆G = −0.638∆U2 + 0.010∆Sun − 0.049Pre + 0.841∆RH | 0.21 * | |
| Shache | ∆G = 11.4∆U2 + 0.015∆Sun + 0.048Pre − 4.9∆Tmean | 0.20 * | |
| 1000-kernel weight | Wulanwusu | ∆W =24.9∆U2 + 2.89(∆U2)2 − 348(∆U2)3 | 0.17 * |
| Changji | ∆W =−0.075∆Pre + 1.28∆RH | 0.20 ** | |
| Xinyuan | ∆W =0.029∆Sun + 0.669∆RH | 0.14 * | |
| Luntai | ∆W =0.011∆Sun − 0.834∆RH − 0.003∆Pre × ∆RH | 0.27 ** | |
| Kernel number per ear | Wulanwusu | ∆K = −0.031∆Sun − 12.1∆U2 − 2.19∆Tmean − 0.035∆Pre | 0.24 ** |
| Changji | ∆K = −0.023∆Sun − 0.086∆Pre + 1.70(∆Tmean)2 − 1.22(∆Tmean)3 + 0.0704∆Pre × ∆Tmean | 0.31 ** | |
| Akesu | ∆K= −4.41∆Tmean | 0.10 * | |
| Luntai | ∆K = −1.02∆Tmean + 0.280∆RH − 2.24∆Pre + 3.86(∆Tmean)2 − 5.15(∆Tmean)3 − 0.00182(∆Pre)2 − 0.0000147(∆Pre)3 + 0.81∆RH × ∆Tmean + 0.030∆Pre × ∆RH | 0.50 ** | |
| Bachu | ∆K= −0.077∆Pre | 0.09 * | |
| Maigaiti | ∆K = 0.269∆Sun + 23.3∆U2 − 9.26∆Tmean | 0.19 * | |
| Hetian | ∆K = −14.1∆Tmean − 0.715 ∆RH − 1.43(∆Tmean)2 − 2.48(∆Tmean)3 | 0.16 * | |
| Shache | ∆K= −3.28∆Tmean | 0.08 * | |
| Yecheng | ∆K= −6.14∆Tmean | 0.26 ** | |
| Yutian | ∆K = −11.8∆Tmean − 1.67∆RH + 4.35(∆Tmean)2 − 0.22(∆RH)2+ 4.47(∆Tmean)3 − 0.03(∆RH)3 | 0.27 * | |
| Tacheng | ∆B = −10.9∆RH + 479∆Tmean − 103∆RH × ∆Tmean | 0.41 ** | |
| Wulanwusu | ∆B = −17.7∆Sun + 2190∆Tmean | 0.16 * | |
| Changji | ∆B = −3.90∆Pre + 0.324(∆Pre)2 − 0.007(∆Pre)3 − 27,330∆U2 | 0.24 * | |
| Biomass | Xinyuan | ∆B = 747∆RH + 10,916∆U2 | 0.20 ** |
| Baicheng | ∆B =823∆RH − 59.9∆Pre − 1574∆Tmean | 0.26 ** | |
| Kuche | ∆B = 26.8∆Sun − 231∆RH − 79.3(∆RH)2 + 26.3(∆RH)3 | 0.24 * | |
| Kashi | ∆B = −11.7∆Sun | 0.09 * | |
| Maigaiti | ∆B = 9050∆U2 − 37.5∆Pre + 475∆Pre × ∆Tmean | 0.29 ** | |
| Yutian | ∆B = −26.5∆Pre | 0.11 * | |
| Yield | Tacheng | ∆Yie = 159∆Tmean + 92.4(∆Tmean)2 + 128(∆Tmean)3 | 0.40 ** |
| Wusu | ∆Yie = −12.1∆Pre − 604∆Tmean − 4.04∆Pre × ∆Tmean | 0.35 ** | |
| Baicheng | ∆Yie= −1650∆Tmean − 8936∆U2 − 199∆RH + 25.4(∆RH)2 − 4.03(∆RH)3 | 0.38 ** | |
| Ruoqiang | ∆Yie = −3.03∆Sun | 0.09 ** | |
| Kashi | ∆Yie = 307∆RH − 0.95(∆RH)2 − 3.34(∆RH)3 | 0.16 * | |
| Yecheng | ∆Yie = 0.282∆Sun − 0.004(∆Sun)2 − 0.00003(∆Sun)3 | 0.26 ** | |
| Yining | ∆Yie = −9.15∆Pre − 565∆Tmean | 0.22 ** | |
| Kuche | ∆Yie = 1337∆U2 − 345∆Tmean + 8.16Pre − 153∆RH | 0.33 ** | |
| Shache | ∆Yie = 15.7∆Pre | 0.10 * | |
| Yutian | ∆Yie = −3485∆U2 − 388∆Tmean + 11.5Pre − 107∆RH | 0.22 * |
* and ** mean significance at confidence levels of 0.05 and 0.01, respectively.
Table 8.
The Pearson correlation coefficients between the first differences of six growth- and yield-related indices and the mean volumetric soil water content during winter wheat growth period (θv) at different depths over 1981–2017 at the eight sites in Xinjiang, China.
Table 8.
The Pearson correlation coefficients between the first differences of six growth- and yield-related indices and the mean volumetric soil water content during winter wheat growth period (θv) at different depths over 1981–2017 at the eight sites in Xinjiang, China.
| ∆ Plant Height vs. θv at the Depth of | ∆Growth Period Duration vs. θv at the Depth of | |||||||||
|---|---|---|---|---|---|---|---|---|---|---|
| Site | 0–10 | 10–20 | 20–30 | 30–40 | 40–50 cm | 0–10 | 10–20 | 20–30 | 30–40 | 40–50 cm |
| Wulanwusu | −0.25 | −0.25 | −0.01 | −0.41 * | −0.53 * | −0.08 | −0.19 | 0.07 | −0.12 | −0.21 |
| Changji | 0.32 | 0.26 | 0.20 | 0.20 | 0.19 | −0.13 | −0.15 | −0.19 | −0.18 | −0.13 |
| Yining | −0.03 | −0.03 | −0.07 | −0.10 | −0.23 | −0.36 * | −0.31 * | −0.29 | −0.23 | −0.13 |
| Xinyuan | 0.33 * | 0.25 | 0.25 | 0.19 | 0.17 | 0.63 | 0.60 | 0.63 | 0.56 | 0.51 |
| Kashi | 0.19 | 0.20 | 0.35 * | 0.24 | 0.26 | −0.22 | −0.18 | −0.29 | −0.28 | −0.31 |
| Bachu | 0.02 | −0.28 | −0.39 * | 0.06 | 0.24 | −0.18 | −0.10 | 0.03 | 0.45 * | 0.41 * |
| Shache | 0.15 | −0.02 | 0.14 | 0.34 * | 0.22 | 0.31 | 0.24 | 0.14 | 0.10 | 0.11 |
| Hetian | −0.16 | 0.06 | 0.22 | 0.23 | 0.17 | −0.20 | −0.15 | −0.31 * | −0.39 * | −0.31 * |
| ∆1000-kernel weight vs. θv at the depth of | ∆Kernel number per ear vs. θv at the depth of | |||||||||
| Site | 0–10 | 10–20 | 20–30 | 30–40 | 40–50 cm | 0–10 | 10–20 | 20–30 | 30–40 | 40–50 cm |
| Wulanwusu | 0.20 | 0.22 | −0.15 | 0.07 | 0.13 | 0.34 * | 0.35 * | 0.11 | 0.43 * | 0.32 * |
| Changji | −0.18 | −0.17 | −0.06 | 0.09 | 0.14 | −0.20 | −0.16 | −0.08 | −0.03 | 0.08 |
| Yining | 0.16 | 0.10 | 0.11 | 0.20 | 0.14 | −0.08 | −0.10 | −0.11 | −0.16 | −0.21 |
| Xinyuan | −0.52 ** | −0.47 ** | −0.26 | −0.02 | 0.01 | 0.83 ** | 0.81 ** | 0.67 ** | 0.42 * | 0.42 * |
| Kashi | 0.33 * | 0.29 | −0.03 | −0.24 | −0.20 | −0.22 | −0.31 * | −0.33 * | −0.21 | −0.22 |
| Bachu | −0.35 * | −0.37 * | −0.36 * | −0.29 | −0.15 | 0.16 | 0.31 | 0.23 | −0.26 | −0.34 * |
| Shache | 0.06 | 0.10 | −0.38 * | −0.56 ** | −0.56 ** | 0.31 * | 0.21 | −0.23 | −0.07 | 0.07 |
| Hetian | 0.40 * | 0.35 * | 0.40 * | 0.31 * | 0.36 * | −0.11 | −0.26 | −0.59 ** | −0.60 ** | −0.42 * |
| ∆Biomass vs. θv at the depth of | ∆Yield vs. θv at the depth of | |||||||||
| Site | 0–10 | 10–20 | 20–30 | 30–40 | 40–50 cm | 0–10 | 10–20 | 20–30 | 30–40 | 40–50 cm |
| Wulanwusu | 0.03 | 0.14 | −0.06 | 0.01 | 0.02 | 0.24 | 0.29 | 0.12 | 0.59 ** | 0.66 ** |
| Changji | −0.30 | −0.26 | −0.24 | −0.17 | −0.11 | −0.36 * | −0.36 * | −0.27 | −0.24 | −0.19 |
| Yining | −0.27 | −0.29 | −0.33 * | −0.26 | −0.39 * | −0.23 | −0.24 | −0.17 | −0.02 | −0.08 |
| Xinyuan | 0.71 ** | 0.68 ** | 0.66 ** | 0.48 * | 0.47 * | 0.11 | 0.29 | 0.46 * | 0.61 ** | 0.62 ** |
| Kashi | 0.10 | 0.02 | −0.35 * | −0.58 ** | −0.64 ** | −0.02 | −0.12 | −0.45 * | −0.54 ** | −0.55 ** |
| Bachu | 0.24 | 0.26 | 0.32 * | −0.23 | −0.36 * | 0.40 * | 0.47 * | 0.47 * | −0.15 | −0.32 * |
| Shache | 0.46 * | 0.32 * | 0.01 | −0.03 | −0.06 | 0.46 * | 0.45 * | −0.06 | −0.22 | −0.18 |
| Hetian | −0.04 | −0.14 | −0.38 * | −0.49 * | −0.38 * | 0.11 | −0.02 | −0.34 * | −0.31 * | −0.25 |
* and ** mean significance at confidence levels of 0.05 and 0.01, respectively.
Publisher’s Note: MDPI stays neutral with regard to jurisdictional claims in published maps and institutional affiliations. |
© 2021 by the authors. Licensee MDPI, Basel, Switzerland. This article is an open access article distributed under the terms and conditions of the Creative Commons Attribution (CC BY) license (https://creativecommons.org/licenses/by/4.0/).
Share and Cite
MDPI and ACS Style
Lin, H.; Li, N.; Li, Y.; Liu, H.; Liu, J.; Li, L.; Feng, P.; Liu, D.; Liu, C. Quantitative Analysis of Winter Wheat Growth and Yields Responding to Climate Change in Xinjiang, China. Water 2021, 13, 3624. https://doi.org/10.3390/w13243624
AMA Style
Lin H, Li N, Li Y, Liu H, Liu J, Li L, Feng P, Liu D, Liu C. Quantitative Analysis of Winter Wheat Growth and Yields Responding to Climate Change in Xinjiang, China. Water. 2021; 13(24):3624. https://doi.org/10.3390/w13243624
Chicago/Turabian StyleLin, Haixia, Na Li, Yi Li, Hongguang Liu, Jian Liu, Linchao Li, Puyu Feng, Deli Liu, and Chuncheng Liu. 2021. "Quantitative Analysis of Winter Wheat Growth and Yields Responding to Climate Change in Xinjiang, China" Water 13, no. 24: 3624. https://doi.org/10.3390/w13243624
Note that from the first issue of 2016, this journal uses article numbers instead of page numbers. See further details here.