1. Introduction
Land degradation is a global problem that affects billions of people [
1]. In the particular case of central Argentina, the agricultural frontier continues to expand from the humid Pampean plain to hilly arid and semi-arid environments despite the increasing water shortages. Therefore, it is essential to improve the efficiency and effectiveness of soil conservation and management strategies [
2].
Water erosion depends on several factors, such as the type of LU, the slope of the terrain, the cover and the type of vegetation, the inherent erodibility of the soil (due to the type of lithology) and the intensity of the erosive forces [
3]. Therefore, to control erosive processes, it is important to identify the critical areas prone to erosion or the most vulnerable critical points that correspond to the possible sources of mobilized sediments. Knowledge of the sources of sediments is a key factor in understanding sediment transport and delivery processes [
4].
Today, fingerprint techniques are becoming an accessible and affordable alternative tool for assessing soil sheet erosion over time and space. These techniques have been successfully applied in different ecosystems using stable and radioactive isotopes, biomarkers, soil properties and/or trace elements, to identify areas susceptible to erosion [
4,
5,
6,
7,
8].
In particular, the geochemical fingerprint method has been used in arid or semi-arid agro-environments in Latin America to determine the origin of sediments [
9,
10]. The main objective of the technique is to use the concentrations of some geochemical elements (tracers) present in the soil origin samples as labels or “geomarkers”. The tracers present in each source are conditioned by the geological substrate and the type and use of the soil from which they originate [
11]. The application of unmixing models (MM) allows us to identify and quantify the sources that contribute to the mixtures.
In the study catchment, Durazno del Medio, different LU have been incorporated, especially in the last 10 years, replacing areas of native vegetation by agriculture fields, livestock and reforestation. Therefore, it is important to identify how these changes in LU have affected the dynamic of the catchment and its erosive processes [
10].
In this work, the EDXRF technique was applied to distinguish the main sediment sources, which were selected from the combination of two criteria: first, the identification of the different GUs of the region and second, the different land uses in these units. The characterization of the GUs present in the area was carried out taking into account their particular morphographic, morphogenetic, morphodynamic and lithological characteristics [
12]. After this first selection of GUs, 13 geomorphological subunits were recognized from the combination of the GUs and the LU present in them. These subunits are our sedimentary sources.
For the subsequent validation of the proposed methodology, two artificial mixtures were elaborated in the laboratory combining different proportions of soil samples obtained in the identified sediment sources. In the process of reconstruction of the proportion of sources, the MixSIAR unmixing model [
13] was used. In both cases, a very good approximation was obtained.
In this way, in a heterogeneous region from the geomorphological point of view, with alterations in the surface soil introduced by new agricultural practices that, in the last decades, have dramatically changed the landscape, this research is focused on the following objectives: (i) to individualize a set of geochemical suitable tracers to describe the sedimentary transport along the hydrological network of the catchment, (ii) to approach the proportional contribution of sediments from the identified sediment sources at the accumulation points at the end of the explored catchment and (iii) to obtain reliable information about the impact on the state of conservation of the soil generated by the new uses, located in different geomorphological sectors.
2. Materials and Methods
This work integrates two stages, on the one hand, the identification of the different geomorphological units and its hierarchies and, on the other hand, the sampling of areas that combine these units with different LU to trace the origin of the sediments. The first corresponds to the identification, analysis and recognition of the spatial distribution of the units involved in the catchment area. The second stage includes fieldwork (sampling), sampling preparation, laboratory measurement, data analysis and interpretation.
2.1. Study Area
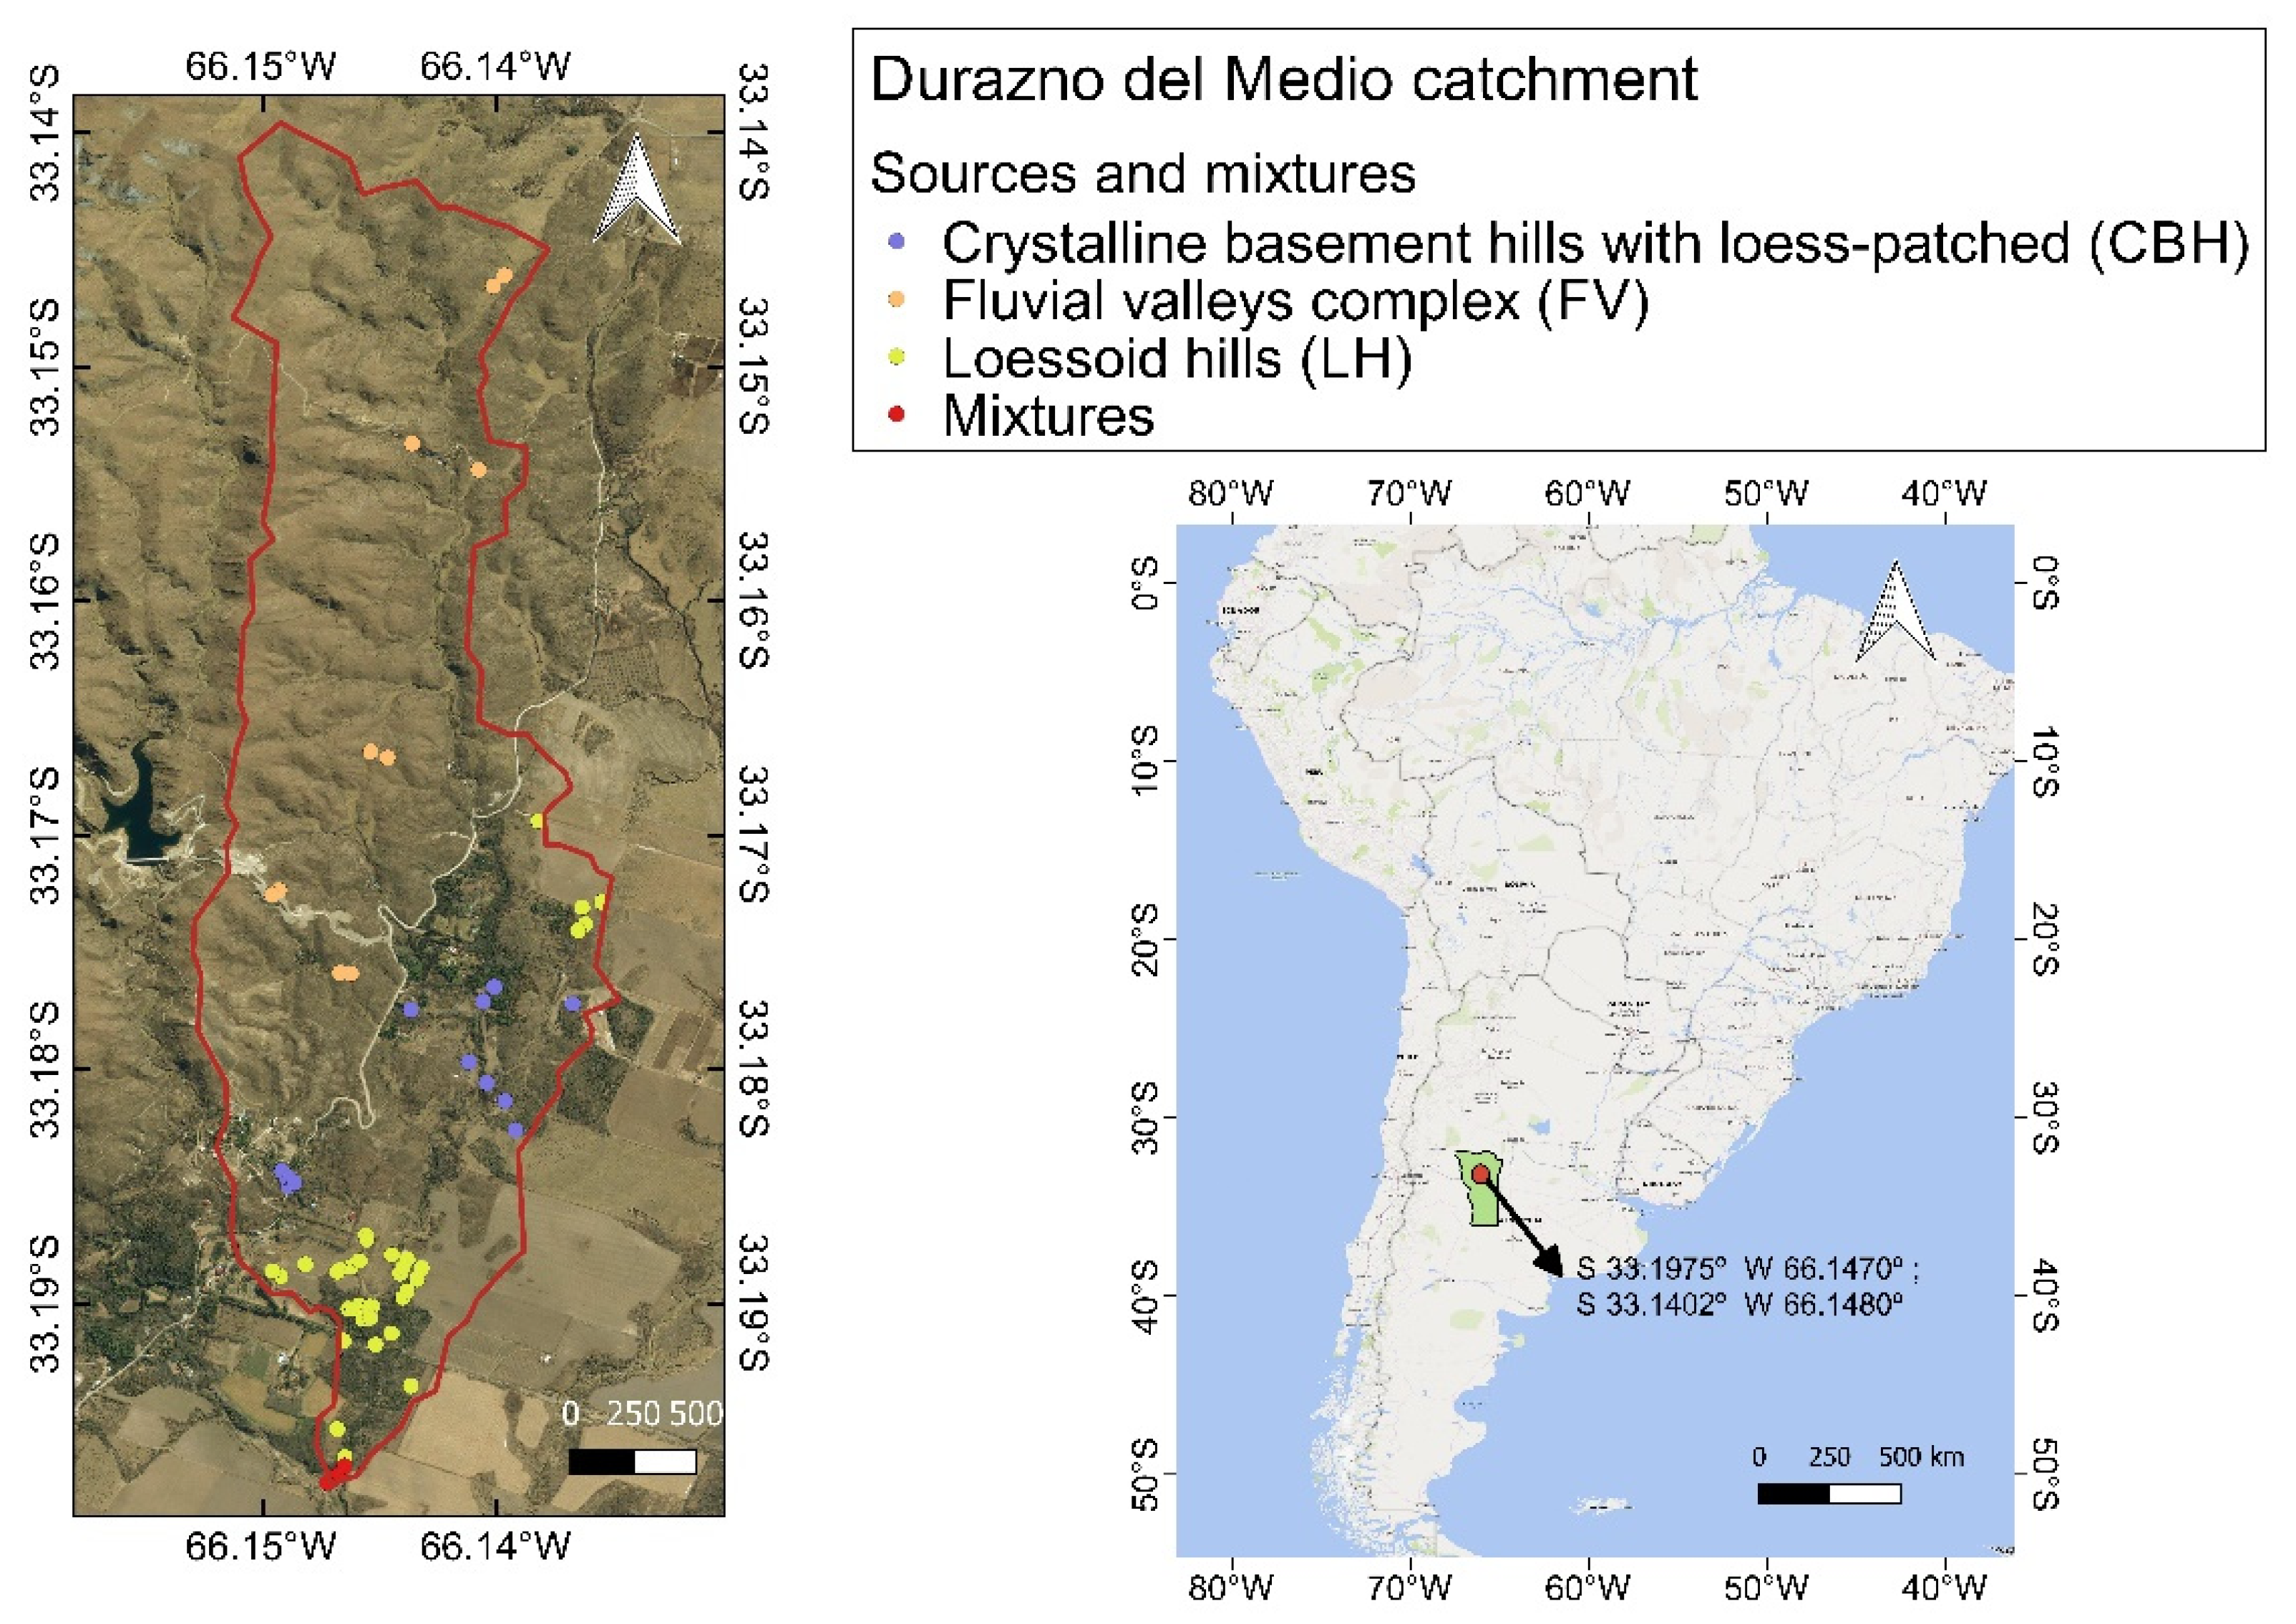
The study was carried out in El Durazno del Medio sub-catchment (6.4 km
2) located at 21 km northeast of San Luis City (S 33.1975°–W 66.1470°; S 33.1402°–W 66.1480°), in the northern part of the Volcán river catchment, in the central region of Argentina (
Figure 1).
In the last 16 years, the mean annual precipitation was around 700 mm [
14], with a wet season, from November to April, during which most of the rain events take place and a dry season, from May to October, when almost no rain is expected. The hydrological regime is characterized by permanent rivers.
The LU include exotic tree plantations, native vegetation, scrubland, roads (dirt and paved), agricultural fields, channel banks and rangelands. Exotic tree plantations are made up of pines, acacias, blackberries, privets, willows, poplars, mozqueta roses, among others, and they are restricted to the margins of the river course. They were planted to prevent erosion processes in the existing gulleys of these areas. Corn, soybeans, walnuts, almonds and vineyards are the crops of agricultural areas. Direct seeding has been adopted as the main practice for the growing area, with more than 10 years of implementation in the agriculture lands. Horticulture crops have a recent history in the area, the oldest plants are 10 years old. Rangeland is represented mostly by native vegetation, which in certain areas is used for grazing, and includes patches of exotic tree plantations.
2.2. Geomorphological Setting
Previous investigations have characterized and analyzed the geomorphological features of the province of San Luis. Some of these studies are based on the division of the territory according to the characterization of mountains and plains; others focus on geomorphological evolution and take as a reference geomorphological maps [
15,
16,
17]. Recent studies have characterized the area of the Sierra de San Luis geomorphologically, distinguishing between different geomorphological hierarchies: [
18,
19,
20,
21,
22].
The area explored in this work belongs to the southern sector of the Geomorphological Province of Sierras Pampeanas, which, as expressed by [
12], coincides with the homonymous Geological Province defined by [
23]. It extends throughout the central-western sector of Argentina with a general NE-SW trend. It is approximately 160 km long and 80 km wide. It is composed of a plutonic-metamorphic basement composed of Precambrian gneisses and migmatites, later intruded by granite batholiths [
24]. The geomorphological features of the province respond to the structural control known as “block structures and longitudinal depressions” [
15]. Within the Geomorphological Province of the Sierras Pampeanas, it is possible to differentiate several regions (GRs), associations (GAs) and GUs.
Among the GRs, and considering the study area, the following stand out:
- GR1.
Sierra de San Luis, a rocky massif of 8000 km
2, elongated in a NE-SW direction and composed of blocks differentially displaced in a vertical direction [
15,
25]; reaches heights of 2200 m a.s.l. in the central part, it is characterized by igneous-metamorphic rocks of the crystalline basement. The catchment involves the southeastern sector of this unit; therefore it includes the GAs, the South-eastern slope of the Sierra de San Luis.
- GR2.
The Eastern Depression, is classified as a structural depression, filled by accumulations of loessic quaternary deposits and mantiform loessoids that cover fluvial paleoforms developed in neogenic rocks and / or crystalline basement [
15], in a gently undulating plain. The catchment comprises the southwestern sector of this unit, which involves Loessoide Plain GAs.
Taking into consideration the GAs, the GUs recognized by [
18] in the study area are:
- GU1.
Fluvial Valleys Complex (FVC), located within the South-easterm slope of the Sierra de San Luis GAs; they present interfluvial amplitudes between 500 and 600 m and extend longitudinally, rectilinearly, with predominant N-S and NNO-SSE directions. The slopes present variable inclinations between 14° and 50°. In valleys with steep slopes, the action of laminar erosion prevents the development of soils and produces the exposure of the rocky surface, composed mainly of gneiss and migmatites. In areas with moderate slopes, there are shallow soils less than 25 cm deep, classified by [
26] as entisols (typical and lithic torsions according to [
27]) or leptosols (according to the classification of [
28]). On the lower slopes, stony soils develop with a dark upper layer and a diagnostic cambic horizon classified as mollisols (lithic haplustoles according to [
26]).
- GU2.
Loessoid Hills (LH), located within the Loessoid Plain GAs; they present wide mountain ranges (0.5 to 2 km approx.) that extend longitudinally between 5 and 10 km. The slopes are generally very gentle, with mean values between 1° 30′± 30′ and maximum values of 11° in localized sectors. This unit commonly develops in loessic and loessoid sediments. According to the [
28] classification, the reference soil groups present in the LH correspond mainly to Kastanozems and to a lesser extent to Leptosols.
2.3. Identification of Geomorphological Hierarchies
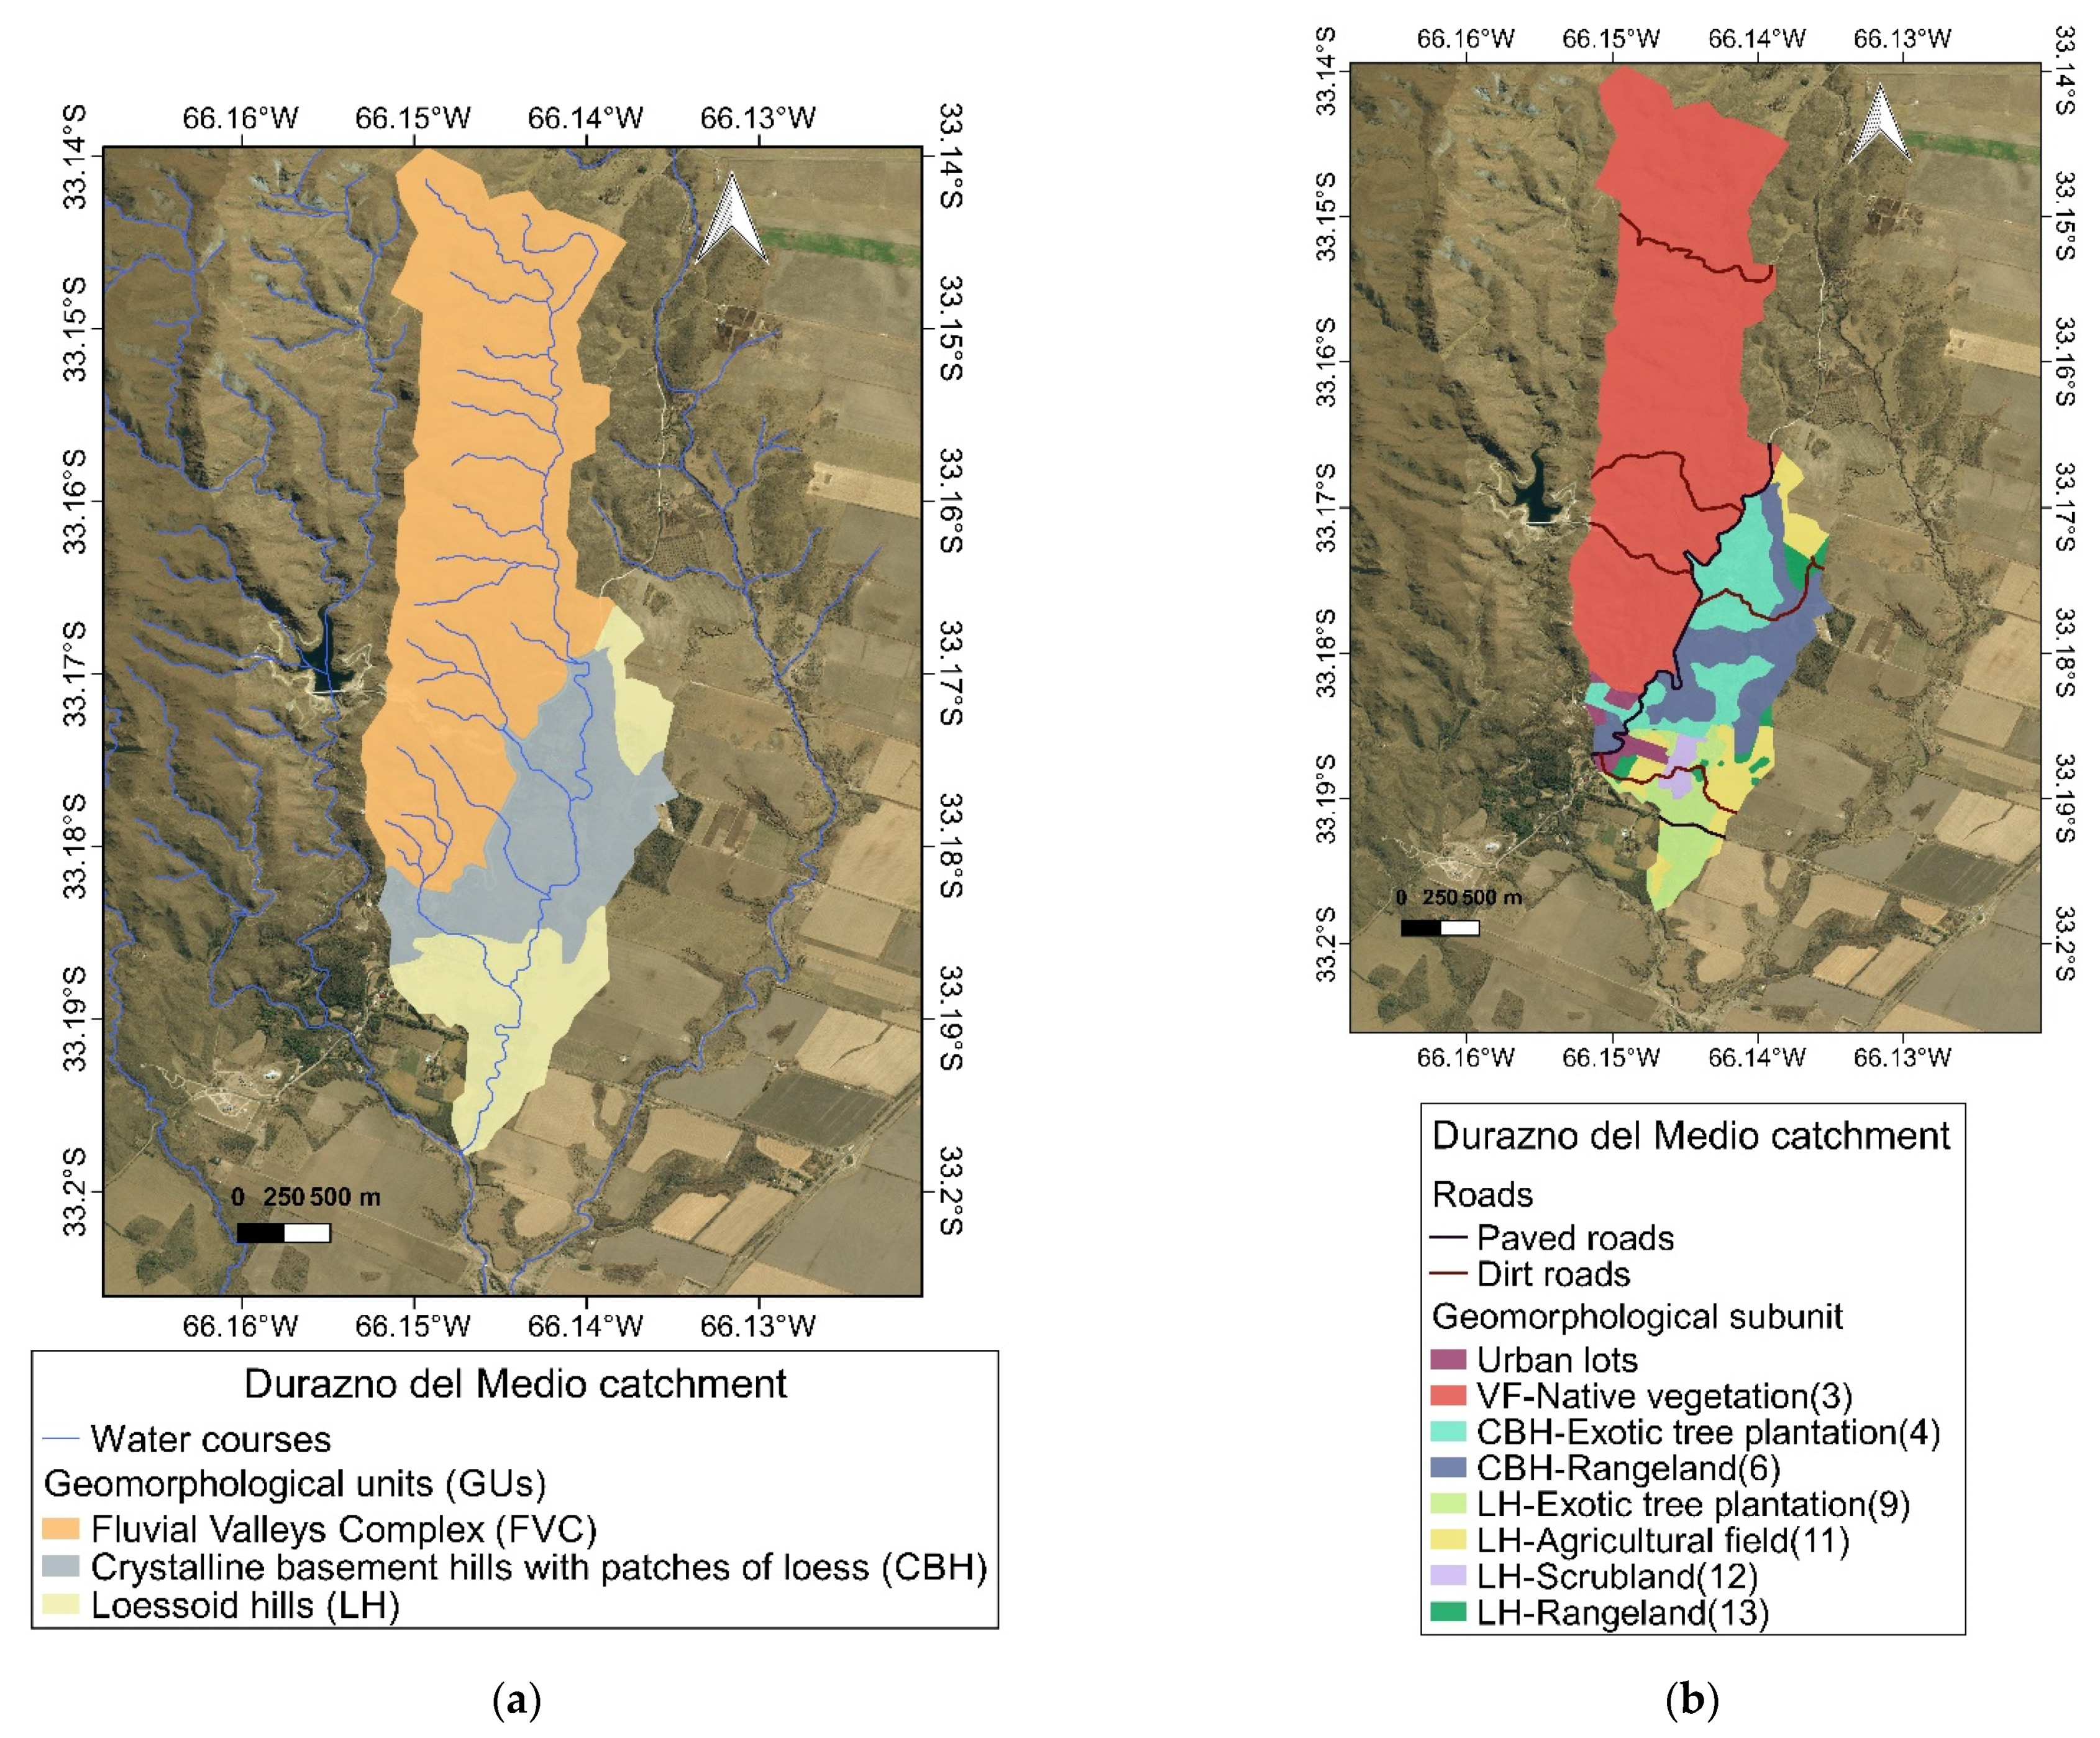
The morphological characteristics of the catchment are a key element in the classification of GUs. This work involves three GUs (
Figure 2a): FVC, LH and Crystalline basement hills with patches of loess (CBH). The first two were described by [
18] and were developed in
Section 2.2. The third unit (CBH) is the one that is proposed to be included in this work.
Then, these units were merged with the LU present in them (
Figure 2b).
The delimitation of the smaller units and LU was supported through the use of a 30 m The Advanced Land Observing Satellite (ALOS) digital elevation model (DEM) from the website of the National Geographic Institute [
29] for digital analysis of relief and morphometry. The QGis 2.18.7 software tool was used to obtain thematic map layers, such as slope, channel network and LU. These layer maps were used as a database for the interpretation and elaboration of the main map at scale 1:25,000.
For the general characterization of the area of interest, it was decided to take as a basis the classification system proposed by [
12], which in turn is based on works by [
30]. The system is based on the recognition of homogeneous units. However, due to the objectives of this work and the level of detail required, it was decided to add a lower hierarchy (subunit) to the classification. These geomorphological subunits are nothing more than the division of the GUs based on the different LU present in them and represent the sampling sedimentary sources.
2.4. Sampling Collection
Surface soil samples were taken in the first 2 cm depth. First any plant material was removed from the soil surface (leaves and branches) and then, 6 cm diameter cylindrical cores and stainless-steel spatulas were used for soil sampling. At each sampling, multiple subsamples of an area of approximately 100 m
2 were collected, which were then in situ homogenized in a plastic bucket. In this way a representative composite sample of that source is obtained. A total of 59 source samples (
Figure 1) were collected during the rainy season (late February).
The set of sediment mixtures downstream samples collected at the end of the main channel comprise sediments collected at the margins of the channel where natural sediment traps were observed. Four replicas were collected for the same point, in the same way as in the source samples (composite samples).
2.5. Laboratory Analyses
The sediment sources and mixtures samples were dried at 60 °C, later disaggregated with agate mortar and sieved through a 63 μm in the GEA-IMASL Laboratory (Argentina).
In order to determine the elemental geochemistry, the EDXRF was used [
31,
32,
33], the Rigaku model NEX CG (Applied Rigaku Technologies, Inc., Austin, TX, USA) spectrometer uses an X-ray tube with Pd anode, with a maximum power of 50W, maximum voltage of 50kV and four secondary targets of Al, Cu, Mo and RX9, coupled in Cartesian geometry. A Si-Li Flash
® Drift detector was used, with a resolution <150 eV for Mn Kα. All samples were analyzed in triplicate in a vacuum atmosphere. The elemental concentration was obtained by the Fundamental Parameters method applying the FPR-SQX FP
® software [
34,
35]. There were 25 elements identified with measurements above the detection limit (Na, Mg, Al, Si, P, S, Cl, K, Ca, Ti, V, Cr, Mn, Fe, Ni, Cu, Zn, Ga, As, Rb, Sr, Y, Ba, Pb and Th). The mass concentration is expressed as mg/kg.
2.6. Fingerprinting Procedure
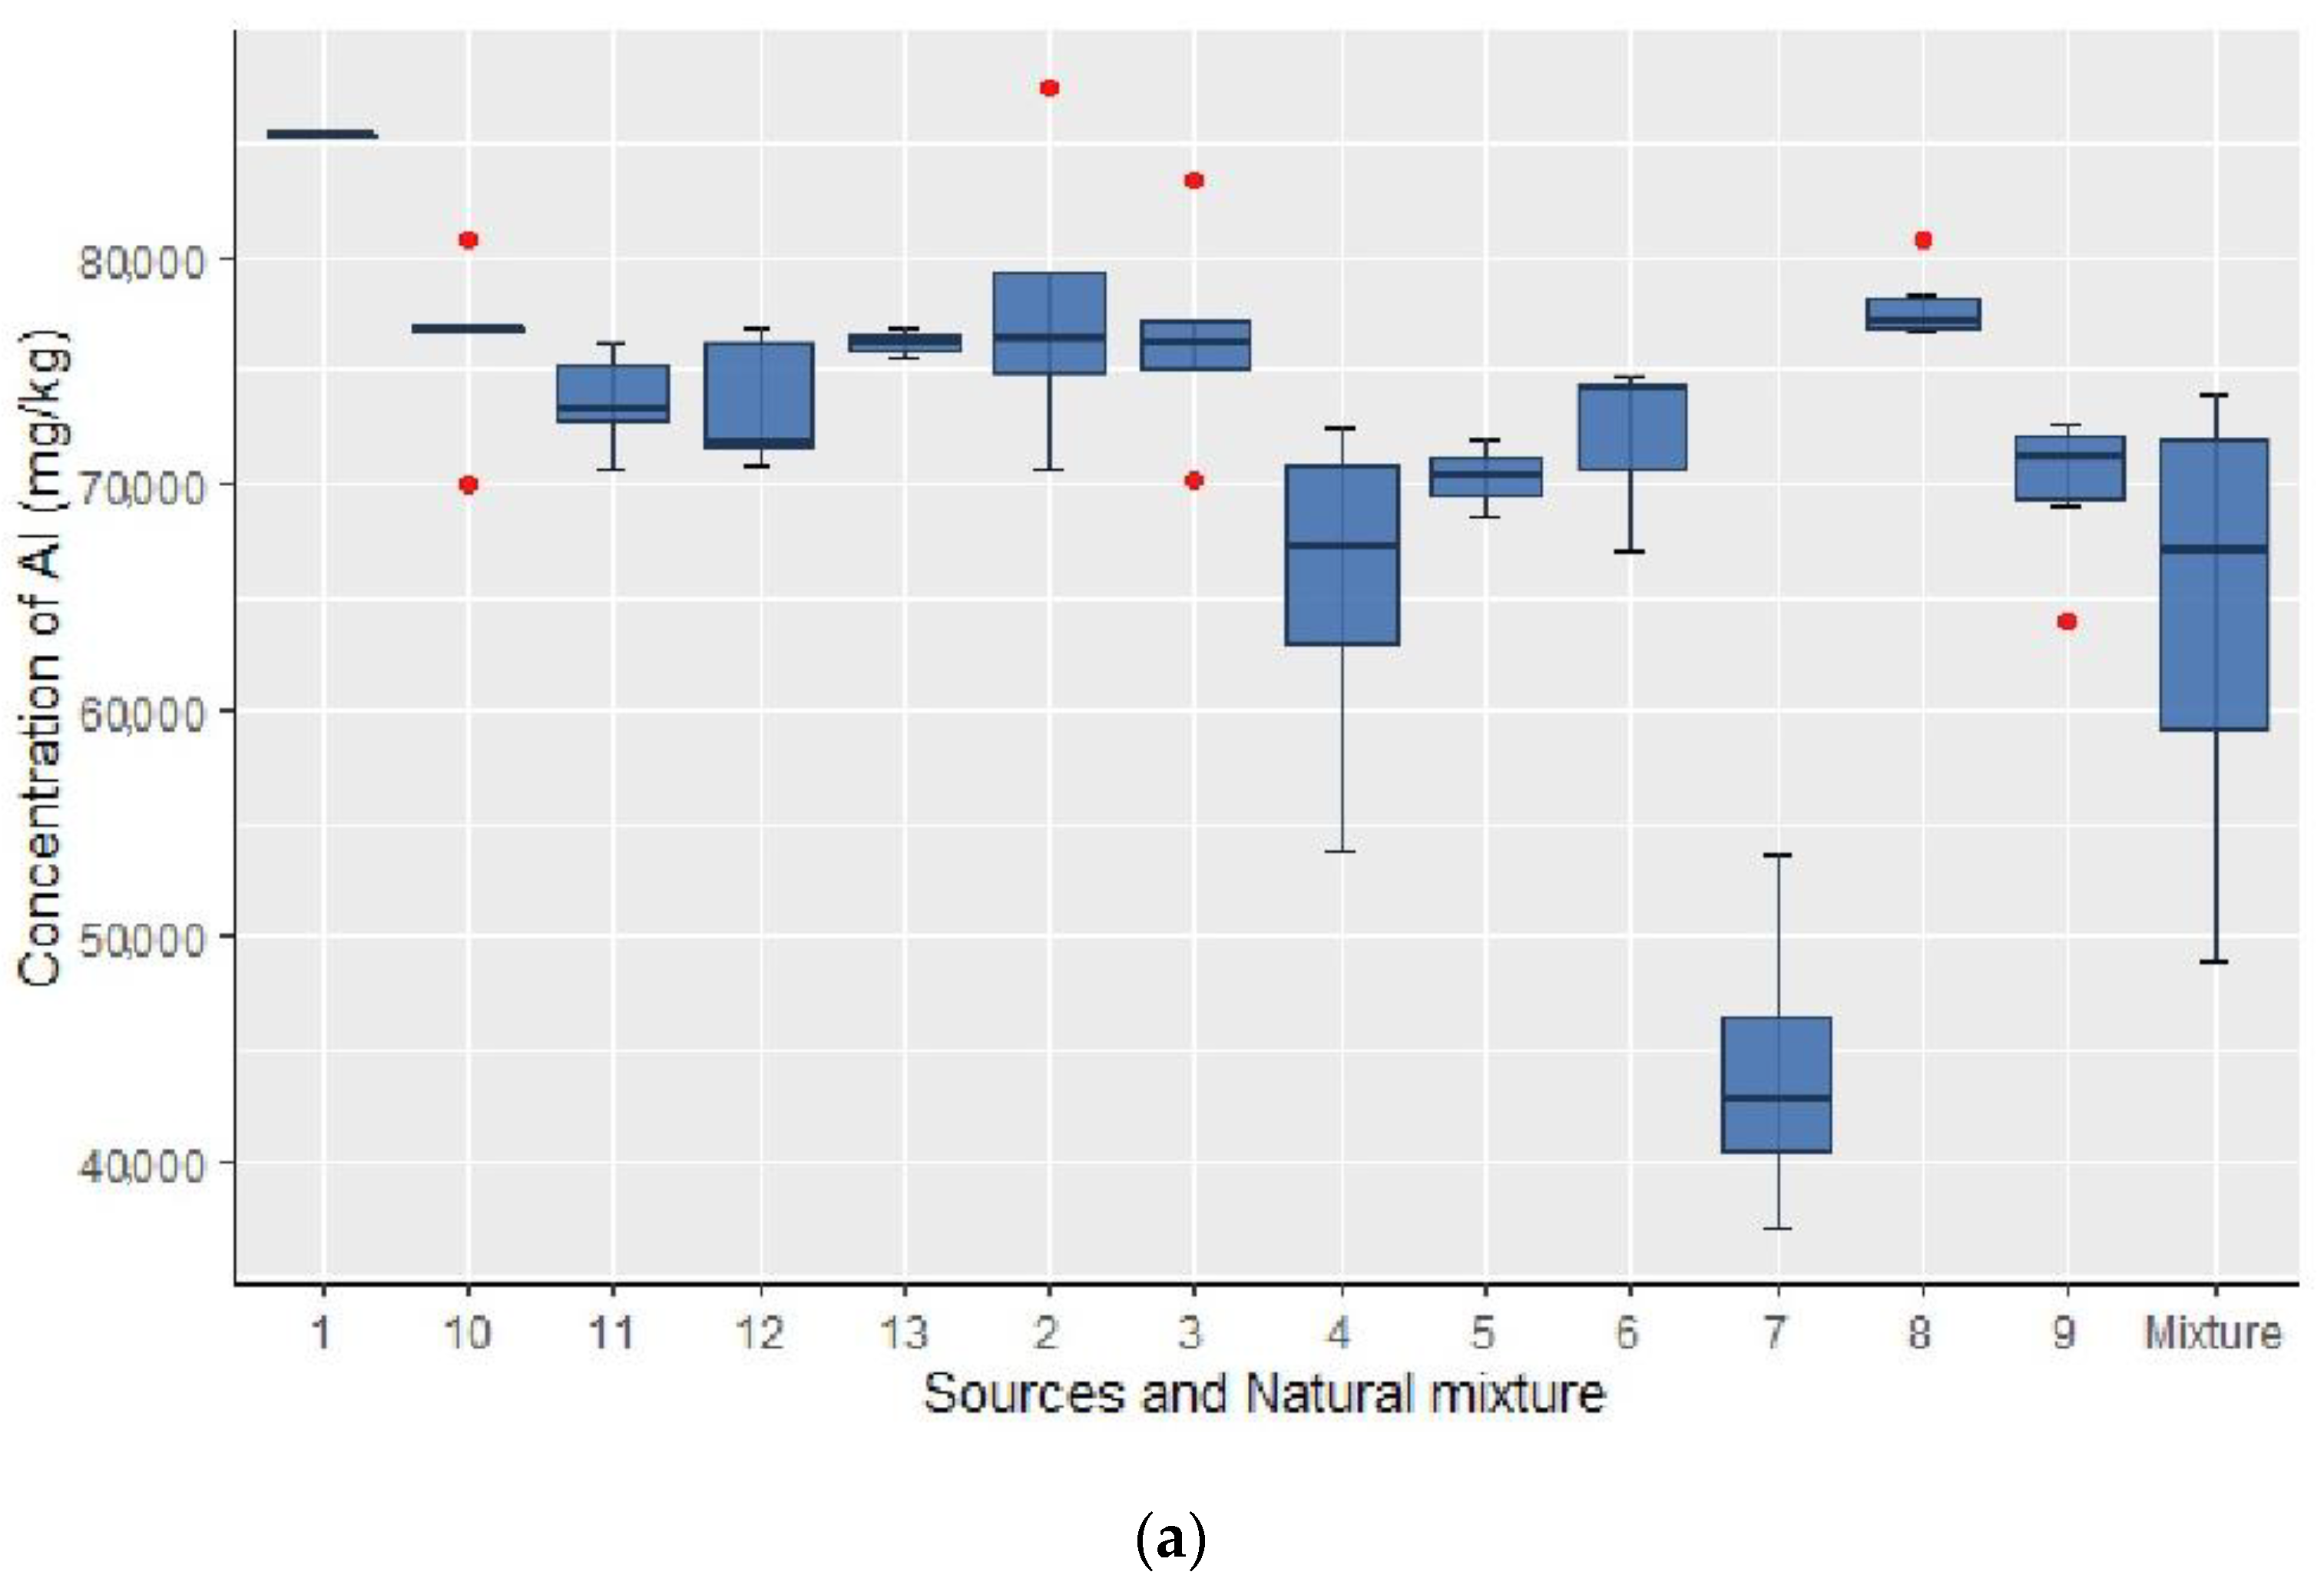
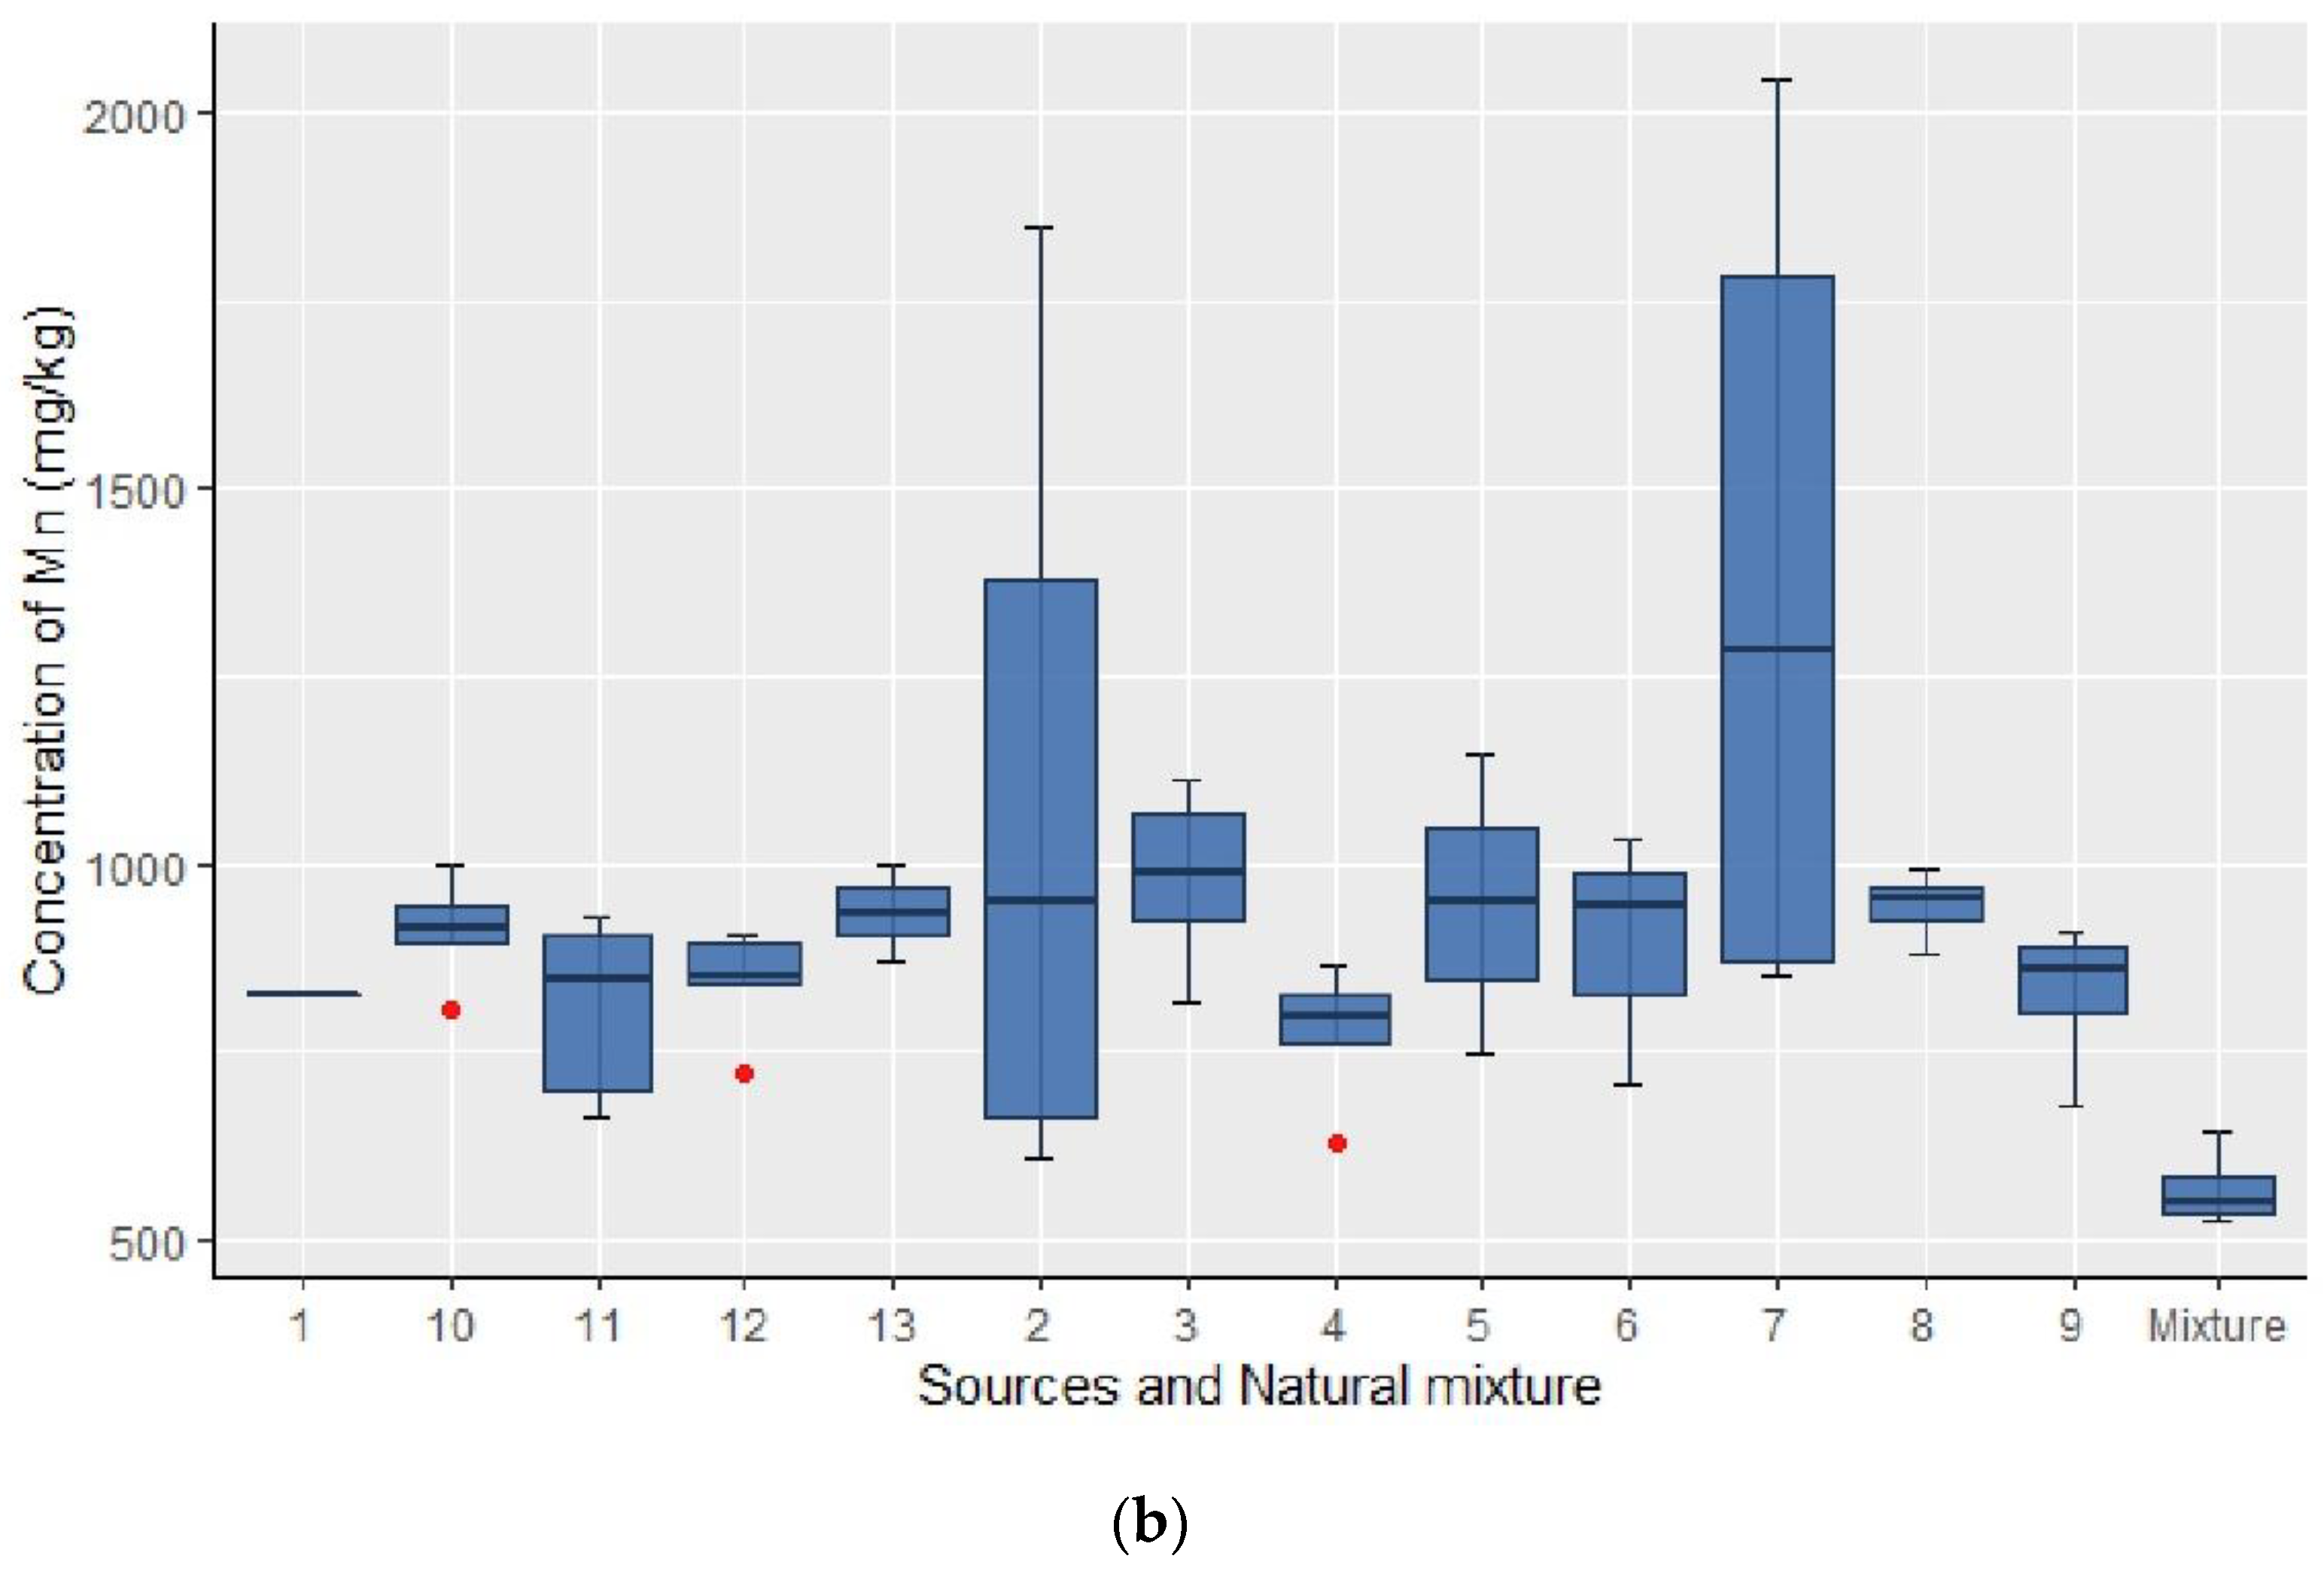
A two-step procedure was applied for the selection of fingerprints: (1) Box diagrams were used to visually inspect the tracers and eliminate non-conservatives, the selected elements were those that explained the mean value of the mixture, through the mean minimum and maximum values of the sources (
Figure 3), and (2) The Kruskal–Wallis test was performed to rule out redundant fingerprint properties. This test is a non-parametric procedure equivalent to analysis of variance (ANOVA).
The fingerprints selection process was tested using the two artificial mixtures using the MixSIAR un-mixing model package [
13] for RStudio 4.0.5 software, since it has been proven that the selection of suitable fingerprints is an essential stage in the analysis.
After the validation of the methodology, MixSIAR was applied to identify the contributing sources using the geochemical elements selected from the natural mixtures.
2.7. Fingerprinting Procedure
A set of samples was used to create artificial mixtures to validate the fingerprints selection method. They were composed using samples from known sources following the following proportions:
where S1, S2, S3 and S5 were samples collected in LH with agricultural fields (source 11), scrubland (source 12), exotic tree plantation (source 9) and channel bank (source 8), respectively. S4 represents CBH with exotic tree plantations (source 4). S6 and S7 were collected in FVC with channel bank (source 1) and native vegetation (source 3), respectively.
Each of these sources are made up of the combination of all the samples belonging to it; for example, S1 is made up of the same proportion of the 10 samples collected in LH with agricultural fields (source 11) and the same for all sources.
The proportions were chosen to represent possible distributions of the origins of the sediments and, at the same time, to ensure that the mixing model produces results outside the margins of uncertainty.
3. Results
3.1. Geomorphological Hierarchies
In Durazno del Medio catchment, three GUs were identified; two of them, as expressed in
Section 2.2, were described by [
18]. The third GU described in the catchment is CBH, which is a transition zone between the FVC and LH.
This unit interdigitates both lithologies, presenting smooth and rounded ridges of crystalline basement, among which there are patches of loessoid sediments. The presence of rocky outcrops hinders the development of the soil, which favors the erosion processes, but in the areas of the loess patches there are forests and bushes. As for the type of soil, it presents a combination of the two types described in both GUs (Leptosols and Kastanozems). Heights of 1100 to 1150 m dominate the area.
In addition, 13 geomorphological subunits resulting from the combination of geological characteristics and LU were recognized (
Figure 2b,
Table 1). These subunits were sampled as sediment sources.
One of the sources, mixed uses (source 7), was collected in one of the river’s tributaries. This sample covers an area of the catchment that is difficult to access, however, although it is located in geomorphological subunit 4, it could receive (to a lesser extent) sediments that come from subunit 3. Nevertheless, when observing their behavior according to the different elements that make up the different sources, for most elements their mass concentration is far from the mean of other sources (
Figure 3 a y b). Therefore, by presenting a particular composition that does not overlap with the sources that would compose it (3 and 4), it can be considered as an independent source.
3.2. Validation of the Methodology: Artificial Mixtures
The 25 geochemical identified elements were analyzed by boxplot and the Kruskal–Wallis test for both artificial mixtures. Through this methodology, 12 elements were selected for Mix1 (Na, Al, Si, S, K, Ga, As, Rb, Sr, Y, Ba and Th) and 14 elements for Mix2 (Al, Si, S, K, Ti, Mn, Fe, Ga, As, Rb, Sr, Y, Ba and Th).
The concentrations of these elements for each of the artificial mixtures were used in the MixSIAR package, in order to reconstruct them in their soil sources. The MixSIAR results are the proportions of the source and the uncertainties of these proportions (given by the standard deviation). The proportions calculated by MixSIAR can be found in
Table 2, for both mixtures. The model found a realistic solution when using the set of elements selected with the mentioned methodology. With these estimated proportions and the actual ones, given by Equations (1) and (2), a mean absolute error (MAE) of 5.8% and 4.7% was calculated for each respective mixture (Mix1 and Mix2).
For the Mix1 artificial mixture, the calculated decomposition is accurate as it identifies the main contributor and the source with the lowest proportion in the mixture. On the other hand, for Mix2, the group of selected elements correctly identifies the majority sources, but two of the sources with the lowest contribution are overestimated (S6 and S1).
3.3. Contributions of Sources to Natural Mixtures
The geochemical elements selected for the natural mixture, following the validated methodology, were: Mg, Al, Si, P, S, Cl, K, Ca, Ti, V, Ga, As, Rb, Sr, Y, Ba, Pb and Th (
Table 3). The contents of As, Th, Pb, Ga and Y were below 40 mg/kg.
Most of the sediment sources had similar ranges in most of the elements, although some sources presented values that were far from the average. For P, sources 1 and 2 contain below-average concentrations (1000 mg/kg), 584 and 642, respectively. For S, it shows great variation in the range of concentrations, with values below 576 mg/kg in sources 1, 2, 8 and 10. The other sources present values that reach up to 16,023 mg/kg.
Source 7 is a particular case that presents enrichment in Ca and S, with values of 77,400 and 2979, respectively. It also has low Al, K, Ti and Ba values.
The mentioned 18 elements were used to unmix the Natural Mixture 1, located at the outlet of the catchment. The model estimated that source 7 was the main contributor, with a proportion around 17% (
Table 4). Secondly, it found that source 4 contributes to the mixture with 12%. The dispersion of the source contributions varied from low SD values (4.2%) up to 9.8%.
4. Discussion
The fingerprints selected to unmix the natural mixture of the channel were Mg, Al, Si, P, S, Cl, K, Ca, Ti, V, Ga, As, Rb, Sr, Y, Ba, Pb and Th. Five of them (Mg, Al, Si, K and Ca) are important elements of the earth’s crust [
36,
37]. Taking into account the lithology present in the GUs of the catchment, in the FVC units the presence of gneiss and migmatites justifies the presence of silicates such as quartz and feldspars, as well as the presence of mica, sillimanite and garnet, among others. Therefore, the presence of elements such as Si, K, Ca, Al, Ba, Cl and Y is to be expected. On the other hand, in LH it is also common to find silicates and feldspars. When the geochemical elements present in each source are analyzed, the values of the elemental concentration do not show great variations. Therefore, there are no elements that can be directly related to one source or another, except for the S that presents great variations and some sources present enrichment and other values below the average. This is because the geochemical composition of the lithologies involved is quite similar. Therefore, the use of a complementary technique such as X-ray diffractometry is recommended to identify the different minerals present in the sources and clarify the data obtained with EDXRF.
Using these fingerprints in MixSIAR, it was found that the main source of sediments in the Durazno del Medio catchment is source 7, followed by source 4 as the second contributor. This may be due to the proximity of both sources to the channel and, in the particular case of source 4, to its location in gulleys. However, when we analyze the estimated values for the other sources, if we consider their SD, they are practically equal to each other; contributing with an average value of 6.5% +/− 5.6%. Therefore, for the rest of the sources, although the proportion with which they contribute to the natural mixture is known (with some uncertainty), we cannot establish the preponderance of one type of font over another. This may be due to: 1- as explained above, the similar elemental composition; 2- the selection of sources depending on the uses, which puts the vegetation cover at stake, which is beyond the scope of the applied technique. Therefore, to quantify the influence of vegetation cover on sediment production, the implementation of complementary techniques such as Compound-Specific Stable Isotopes (CSSIs) [
38] is required.
Taking into account that the estimates of the two main sources of sediments are far from the estimates of the others, it could be said that the GUs that make the greatest contribution to the mouth of the catchment are Crystalline basement hills with patches of loess.
In contrast, when comparing the data obtained in this catchment with those obtained by [
9,
10], in a neighboring sector, it can be seen that in said study area the sources that contribute the most come from the LH. That could be due to, in this sector of the catchment, LH is the predominant GU, which is why the analyzed sector can be interpreted as having a homogeneous lithological composition, low slope and greater disturbances caused by agriculture. In our case, although the agricultural area does not cover large dimensions, the areas of greatest disturbance are located in the CBH. In both cases, the technique used manages to distinguish between the sedimentary sources that are the greatest contributors to the final mixtures in both sectors of study.
5. Conclusions
In the Durazno del Medio catchment, source 7 is the main source of sediment with a contribution of 17% +/− 8%, followed by source 4 as the second contributor with a contribution of 12% +/− 10%. Considering the area of the catchment, these sources present an area of influence of 7% and 10%, respectively. The contribution of these sources is considerable compared to the other sources that occupy a greater area, as is the case, for example of source 3 that represents 62.5% of the catchment but contributes 6.3% +/− 5.7%.
Although the application of EDFRX techniques yielded information of interest, it cannot identify with greater precision the contributing sources beyond the two main ones, since as previously expressed, the SD in the estimate is for some of the sources practically the same as the estimated value. In addition, the use of geomorphological subunits, which highlight LU, as sources exceeds the purposes of the technique, which are the geochemical elements. Therefore, due to the great variety of uses with a plant component, the use of complementary techniques such as CSSIs is recommended, which help to interpret what is happening in the catchment.
Author Contributions
Conceptualization, Y.G.; methodology, Y.G, R.T.A., G.O. and S.T.; modeling, Y.G., R.T.A. and S.d.l.S.V.; validation, Y.G., R.T.A., S.d.l.S.V. and H.V.; investigation, Y.G., R.T.A. and H.V.; writing—original draft preparation, Y.G.; writing—review and editing, all authors participated; visualization, Y.G.; supervision, H.V.; project administration, H.V.; funding acquisition, H.V. All authors have read and agreed to the published version of the manuscript.
Funding
This research was funded by: CONICET (Consejo Nacional de Investigaciones Científicas y Técnicas, PIP 112 201501 00334), Argentina; UNSL (Universidad Nacional de San Luis, PROICO 22/F41), Argentina; IAEA: Regional Latin American Technical Cooperation Projects, ARCAL RLA 5076.
Data Availability Statement
Not applicable.
Acknowledgments
We thank Gisela Borgatello, GEA Laboratory Support Personnel (CPA), and Matias Almonacid, graduate student; for their assistance with field and laboratory tasks.
Conflicts of Interest
The authors declare no conflict of interest.
References
- Wuepper, D.; Borrelli, P.; Finger, R. Countries and the global rate of soil erosion. Nat. Sustain. 2020, 3, 51–55. [Google Scholar] [CrossRef]
- le Polain de Waroux, Y.; Garrett, R.D.; Heilmayr, R.; Lambin, E.F. Land-use policies and corporate investments in agriculture in the Gran Chaco and Chiquitano. Proc. Natl. Acad. Sci. USA 2016, 113, 4021–4026. [Google Scholar] [CrossRef] [Green Version]
- Navas, A.; Machín, J.; Beguería, S.; López-Vicente, M.; Gaspar, L. Soil properties and physiographic factors controlling the natural vegetation re-growth in a disturbed catchment of the Central Spanish Pyrenees. Agrofor. Syst. 2007, 72, 173–185. [Google Scholar] [CrossRef] [Green Version]
- Walling, D. Tracing suspended sediment sources in catchments and river systems. Sci. Total Environ. 2005, 344, 159–184. [Google Scholar] [CrossRef] [PubMed]
- Mabit, L.; Bernard, C.; Yi, A.L.Z.; Fulajtar, E.; Dercon, G.; Zaman, M.; Toloza, A.; Heng, L. Promoting the use of isotopic techniques to combat soil erosion: An overview of the key role played by the SWMCN Subprogramme of the Joint FAO/IAEA Division over the last 20 years. Land Degrad. Dev. 2018, 29, 3077–3091. [Google Scholar] [CrossRef]
- Bravo-Linares, C.; Schuller, P.; Castillo, A.; Salinas-Curinao, A.; Ovando-Fuentealba, L.; Muñoz-Arcos, E.; Swales, A.; Gibbs, M.; Dercon, G. Combining isotopic techniques to assess historical sediment delivery in a forest catchment in central Chile. J. Soil Sci. Plant Nutr. 2019, 20, 83–94. [Google Scholar] [CrossRef]
- Schuller, P.; Walling, D.E.; Iroumé, A.; Quilodrán, C.; Castillo, A. Quantifying the temporal variation of the contribution of fine sediment sources to sediment yields from Chilean forested catchments during harvesting operations. Bosque 2021, 42, 231–244. [Google Scholar] [CrossRef]
- IAEA. Guidelines for Using Fallout Radionuclides to Assess Erosion and Effectiveness of Soil Conservation Strategies. Available online: https://www.iaea.org/publications/10501/guidelines-for-using-fallout-radionuclides-to-assess-erosion-and-effectiveness-of-soil-conservation-strategies (accessed on 8 November 2021).
- Astorga, R.T.; Villalobos, S.D.L.S.; Velasco, H.; Domínguez-Quintero, O.; Cardoso, R.P.; Dos Anjos, R.M.; Diawara, Y.; Dercon, G.; Mabit, L. Exploring innovative techniques for identifying geochemical elements as fingerprints of sediment sources in an agricultural catchment of Argentina affected by soil erosion. Environ. Sci. Pollut. Res. 2018, 25, 20868–20879. [Google Scholar] [CrossRef] [PubMed]
- Astorga, R.T.; Garcias, Y.; Borgatello, G.; Velasco, H.; Padilla, R.; Dercon, G.; Mabit, L. Use of geochemical fingerprints to trace sediment sources in an agricultural catchment of Argentina. Int. Soil Water Conserv. Res. 2020, 8, 410–417. [Google Scholar] [CrossRef]
- Blake, W.H.; Ficken, K.J.; Taylor, P.; Russell, M.A.; Walling, D.E. Tracing crop-specific sediment sources in agricultural catchments. Geomorphology 2012, 139–140, 322–329. [Google Scholar] [CrossRef]
- Sayago, J.M. Las unidades geomorfológicas como base para la evaluación integrada del paisaje natural. Acta Geol. Lilloana 1982, 1, 169–180. [Google Scholar]
- Stock, B.C.; Jackson, A.L.; Ward, E.J.; Parnell, A.C.; Phillios, D.L.; Semmens, B.X. Analyzing Mixing Systems Using a New Generation of Bayesian Tracer Mixing Models. Available online: https://peerj.com/articles/5096/ (accessed on 8 November 2021).
- REM. Available online: http://www.clima.edu.ar/Index.aspx (accessed on 10 November 2021).
- González Díaz, E.F. Geomorfologia. In Proceedings of the Geología y Recursos Naturales de la Provincia de San Luis: Relatorio del VIII Congreso Geológico Argentino, San Luis, Argentina, 20–26 September 1981; Buenos Aires La Asociación, 1981; pp. 193–236. [Google Scholar]
- Capitanelli, R.G.; Zamorano, M. Geografía Regional de La Provincia de San Luis. Boletín Estud. Geogr. 1972, XIX, 5–320. [Google Scholar]
- Costa, C.H.; Giaccardi, A.D.; Díaz, E.F.G. Palaeolandsurfaces and neotectonic analysis in the southern Sierras Pampeanas, Argentina. Geol. Soc. Lond. Spéc. Publ. 1999, 162, 229–238. [Google Scholar] [CrossRef]
- Ojeda, G. Estudio Geológico-Geomorfológico del Sector Pedemontano Austral de la Sierra de San Luis y su Aplicación a la Determinación del Riesgo Erosivo. Ph.D. Thesis, Universidad Nacional de San Luis, San Luis, Argentina, 2005. [Google Scholar]
- Aranda, J.; Ojeda, G.; Suvires, G. Caracterización Geomorfológica de La Depresión Longitudinal Central, San Luis, Argentina. In Proceedings of the Geología y Recursos Naturales de la Provincia del Neuquén, 18 Congreso Geológico Argentino, Neuquén, Argentina, 2–6 May 2011; Asociación Geológica Argentina: Neuquén, Argentina, 2011. [Google Scholar]
- Ojeda, G.; Aranda, J.; Gómez, D. Cartografía Digital Geomorfológica Mediante Aproximaciones Jerárquicas Para La Provincia de San Luis, Argentina. In Proceedings of the 1 Seminario Taller de Cartografía Digital, Merlo, San Luis, Argentina; 2011. [Google Scholar]
- Aranda, J.; Ojeda, G.; Suvires, G. Unidades Geomorfológicas Aluviales del piedemonte suroccidental de la Sierra de San Luis. San Luis, Argentina. In Proceedings of the VI Congreso Argentino de Cuaternario y Geomorfología, Ushuaia, Tierra del Fuego, Argentina, 8–10 April 2015; Utupias: Tierra del Fuego, Argentina, 2015; pp. 205–207. [Google Scholar]
- Aranda, J. Geomorfología Cuaternaria Del Piedemonte Suroccidental de La Sierra de San Luis. San Luis, Argentina. Ph.D. Thesis, Universidad Nacional de San Luis, San Luis, Argentina, 2020. [Google Scholar]
- Caminos, R. Sierras Pampeanas Noroccidentales. Salta, Tucumán, Catamarca, La Rioja y San Juan. In Proceedings of the II Simposio de Geología Regional Argentina, Academia Nacional de Ciencias de Córdoba, Córdoba, Argentina, 8–11 September 1979. [Google Scholar]
- Gordillo, C.E.; Lencinas, A.M. Sierras Pampeanas de Córdoba y San Luis. In Proceedings of the IISimposio de Geología Regional Argentina, Cordiba, Argentina, 8–11 September 1979; Academia Nacional de Ciencias: Córdoba, Argentina, 1979; pp. 577–650. [Google Scholar]
- Costa, C.H. Geotectónica Del Sur de La Sierra de San Luis. Ph.D. Thesis, Universidad Nacional de San Luis, San Luis, Argentina, 1992. [Google Scholar]
- INTA. Carta de Suelos y Vegetación de la Provincia de San Luis; INTA-EEA: San Luis, Argentina, 1998. [Google Scholar]
- USDA. Soil Survey Staff Soil Taxonomy. A Basic System of Soil Classification for Making and Interpreting Soil Surveys; Government Printing Office: Washington, DC, USA, 1975.
- FAO; ISRIC; ISSS. World Reference Base for Soil Resources; FAO: Rome, Italy, 1998; ISBN 9251041415. [Google Scholar]
- IGN. Mapa. Instituto Geográfico Nacional. Available online: https://www.ign.gob.ar/NuestrasActividades/Geodesia/ModeloDigitalElevaciones/Mapa (accessed on 10 November 2021).
- Laut, P.; Heyliger, P.; Keig, G.; Loffler, E.; Margules, C.; Scott, R. Environments of South Australia Handbook; CSIRO: Canberra, Australia, 1977. [Google Scholar]
- Ávila-Pérez, P.; Balcázar, M.; Zarazúa-Ortega, G.; Barceló-Quintal, I.; Díaz-Delgado, C. Science of The Total Environment. Sci. Total Environ. 1999, 234, 185–196. [Google Scholar] [PubMed]
- Tejeda, S. Distribución Espacial y Temporal de Los Metales Ti, Mn, Fe, Cu, Zn y Pb En El Sedimento Del Curso Alto Del Río Lerma. Master’s Thesis, Universidad Autónoma del Estado de México, Toluca, México, 2006. [Google Scholar]
- Zarazúa, G.; Tejeda, S.; Ávila-Pérez, P.; Carapia, L.; Carreño, C.; Balcázar, M. Metal content and elemental composition of particles in cohesive sediments of the Lerma River, México. Rev. Int. Contam. Ambie. 2011, 27, 181–190. [Google Scholar]
- Rigaku. Energy Dispersive X-ray Fluorescence Spectrometer: NEX CG. ME65-12 20120301; Rigaku Corporation: Tokyo, Japan, 2012. [Google Scholar]
- Lara Almazán, N.; Zarazúa Ortega, G. Determinación de Elementos Químicos Por Espectrometría de Fluorescencia de Rayos X Dispersiva En Energía; Laboratorio Nacional de Investigaciones Forense Nuclear (ININ): Ocoyoacac, México, 2019. [Google Scholar]
- Poldervaart, A. Crust of the Earth; Geological Society of America: Boulder, CO, USA, 1955. [Google Scholar]
- Ranov, A.B.; Yaroshevsky, A.A. A New Model for the Chemical Structure of the Earth’s Crust. Geochem. Int. 1976, 12, 1763–1795. [Google Scholar]
- Gibbs, M.M. Identifying source soils in contemporary estuarine sediments: A new compound-specific isotope method. Chesap. Sci. 2007, 31, 344–359. [Google Scholar] [CrossRef]
| Publisher’s Note: MDPI stays neutral with regard to jurisdictional claims in published maps and institutional affiliations. |
© 2021 by the authors. Licensee MDPI, Basel, Switzerland. This article is an open access article distributed under the terms and conditions of the Creative Commons Attribution (CC BY) license (https://creativecommons.org/licenses/by/4.0/).


 ,
, 


