Article

Hybrid Approach for Excess Stormwater Management: Combining Decentralized and Centralized Strategies for the Enhancement of Urban Flooding Resilience

by
Roberta D’Ambrosio
1,*,
Antonia Longobardi
1,
Alessandro Balbo
2 and
Anacleto Rizzo
3
1
Department of Civil Engineering, University of Salerno, 84084 Fisciano, Italy
2
WISE Engineering S.r.l., 20017 Rho, Italy
3
IRIDRA S.r.l., 50121 Firenze, Italy
*
Author to whom correspondence should be addressed.
Water 2021, 13(24), 3635; https://doi.org/10.3390/w13243635
Submission received: 11 November 2021 / Revised: 9 December 2021 / Accepted: 10 December 2021 / Published: 17 December 2021
(This article belongs to the Special Issue Nature Based Solutions as Urban Blue-Green-Brown Infrastructures)

Abstract

:
Urban sprawl and soil sealing has gradually led to an impervious surface increase with consequences on the enhancement of flooding risk. During the last decades, a hybrid approach involving both traditional storm water detention tanks (SWDTs) and low-impact development (LID) has resulted in the best solution to manage urban flooding and to improve city resilience. This research aimed at a modeling comparison between drainage scenarios involving the mentioned hybrid approach (H-SM), with (de)centralized LID supporting SWDTs, and a scenario representative of the centralized approach only involving SWDTs (C-SM). Results highlighted that the implementation of H-SM approaches could be a great opportunity to reduce SWDTs volumes. However, the performances varied according to the typology of implemented LID, their parameterization with specific reference to the draining time, and the rainfall severity. Overall, with the increase of rainfall severity and the decrease of draining time, a decrease of retention performances can be observed with SWDTs volume reductions moving from 100% to 28%. In addition, without expecting to implement multicriteria techniques, a preliminary cost analysis pointed out that the larger investment effort of the (de)centralized LID could be, in specific cases, overtaken by the cost advantages resulting from the reduction of the SWDTs volumes.

1. Introduction

In the last decades, urban sprawl and soil sealing have led to an impervious surface increase and, consequently, to the enhancement of urban flooding risk [1,2,3]. Additionally, drainage networks actually seem undersized, and critical rainfall events make them responsible for natural disasters and widespread water pollution [4,5]. Structural measures such as drainage facilities systems, including pump stations and detention reservoirs, are usually adopted to prevent and mitigate urban stormwater runoff excess [6]. When stormwater overflows reduction finally became a concern, several international strategies on environmental pollution with specific reference to urban stormwater discharges were established [7,8,9,10]. Throughout Europe and North America, stormwater detention tanks (SWDTs) are of particular importance in controlling the negative impact of stormwater discharges. In Italy, for example, several studies were conducted to understand the hydraulic and environmental behavior of SWDTs [11,12]. However, design configurations and operating conditions significantly affect the extent of the ecological benefit, investment and maintenance costs, and functionality of the urban drainage system and the wastewater treatment plant. In particular, during the last years, major projects focused on constructing the right-sized tank in the right location. Several studies focused on the identification of SWDTs volumes distribution, mainly aiming at cost-effective solutions able to minimize flood, pollutant load, and storage cost [13,14,15]. According to [16,17], private/residential allotment SWDTs, directly connected with roofs, can also potentially reduce runoff peaks to downstream stormwater drainage systems during rare, long-duration storms, especially if implemented using smart systems approaches that enable rainwater tanks to be emptied, maximizing available retention storage.
However, because of restrictions in the availability of spaces in urban areas and due to the environmental impact, suitable storage sites may be difficult to find [13].
Traditional stormwater management that relies on central infrastructures cannot face, on its own, the upcoming challenges related to climate change and the rapid city growth. Water infrastructure needs to be more flexible, adaptable, and sustainable [18,19]. For this reason, during the last decades, many countries began to implement nature-based solutions (NBS), inspired and supported by nature-based design concepts, able to manage sustainably stormwater, making the cities more resilient towards climate change and hydrological risks [20,21,22]. Such technological solutions are known in different parts of the world by different acronyms (sustainable drainage systems, low-impact development, best management practices, and water-sensitive urban design) [23]. In the following, reference is made to low-impact development (LID). LID infrastructures, able to retain, delay, and filter stormwater, cannot completely manage the problem of urban runoff on their own [24,25,26,27,28]. Nevertheless, if used in combination with traditional drainage systems, they are able to support the preexisting drainage network and contribute to the generation of numerous additional benefits for human beings and the environment [29,30,31,32]. For these reasons, a hybrid approach (SWDTs + LID) could be the best solution to manage urban flooding in large urban areas and to improve city resilience [33]. Scientific literature agrees that both traditional (grey/hard technology) and sustainable (green/LID) infrastructures could improve urban resilience, but green ones are characterized by a higher adaptability to deal with an uncertain future [12,15,33]. In fact, climate change seems to have potential effects on the design and performance of sewer storage tanks. Research conducted in 2007 on a case study in London registered a 35% increase in the number of storm events that caused filling of the tank and a 57% increase in the average volume of storage required [34]. Recent studies focused on the identification of the most suitable blending of traditional drainage infrastructures and LID [35,36,37,38].
The common feature of these hybrid approaches is the idea of moving from a central to a decentralized urban water management. Scenario-based analysis carried out so far, and focusing on the efficiency assessment of decentralized technologies, revealed that the adoption of an integrated approach could increase city resilience to urban flooding [39]. Moreover, complex studies such as [40], using a blend of scenario-based modeling analysis and multicriteria techniques, aimed to quantify the effects of decentralized strategies, both nature-based and hard technology, on the existing sewer network. However, these findings only rely on single case studies, and their results can hardly be generalized.
An alternative approach was presented and applied by [18], based on the stochastic generation of virtual case studies with the aim of assessing the transition from central to decentralized urban water systems. Unfortunately, this approach, while interesting for a preliminary and general assessment of decentralized stormwater management, is not able to substitute for in-depth studies aware of the peculiarities of the urban context.
Consequently, although research conducted so far has proved the ability of decentralized approaches in reducing flooding risk and increasing city resilience, there are still several doubts. For example, according to runoff volume discharging limits required by local regulations, if any, it could be interesting to investigate if the implementation of a hybrid and decentralized approach could somehow reduce excess stormwater and therefore minimize the need for invasive and unsustainable SWDTs.
Decentralized solutions, especially those involving nature-based infrastructures, are also able to redevelop the context in which they exist, bringing numerous benefits of a different nature. However, in order to be effective, their implementation should be widespread, and, for this reason, such projects usually involve a significant financial investment by local and regional authorities.
It is therefore necessary to carry out, together with design assumptions, an economic analysis that can allow quantifying and comparing the costs for the realization of decentralized and centralized solutions. Moreover, with a view to a broader evaluation of the multiple benefits of widespread sustainable drainage infrastructures, several studies have carried out multicriteria approaches for the evaluation and quantification of the technical, socioeconomic, ecological, and political benefits of LIDs [38,41].
The rich existing literature on hybrid solutions for excess stormwater management enables us to understand that this topic is of great relevance. However, the absence of generally valid methodologies and results, together with the strong influence of structural characteristics of the case study areas in the scenario-based analyses, ensure that the research in this field is still particularly stimulating and there a still a wide range of questions to be answered. Which are the hydrological benefits of hybrid solutions in the management of excess stormwater runoff? Are these approaches also able to reduce the volume needed for SWDTs? What about their cost-effectiveness with specific reference to hydraulic and hydrological aspects?
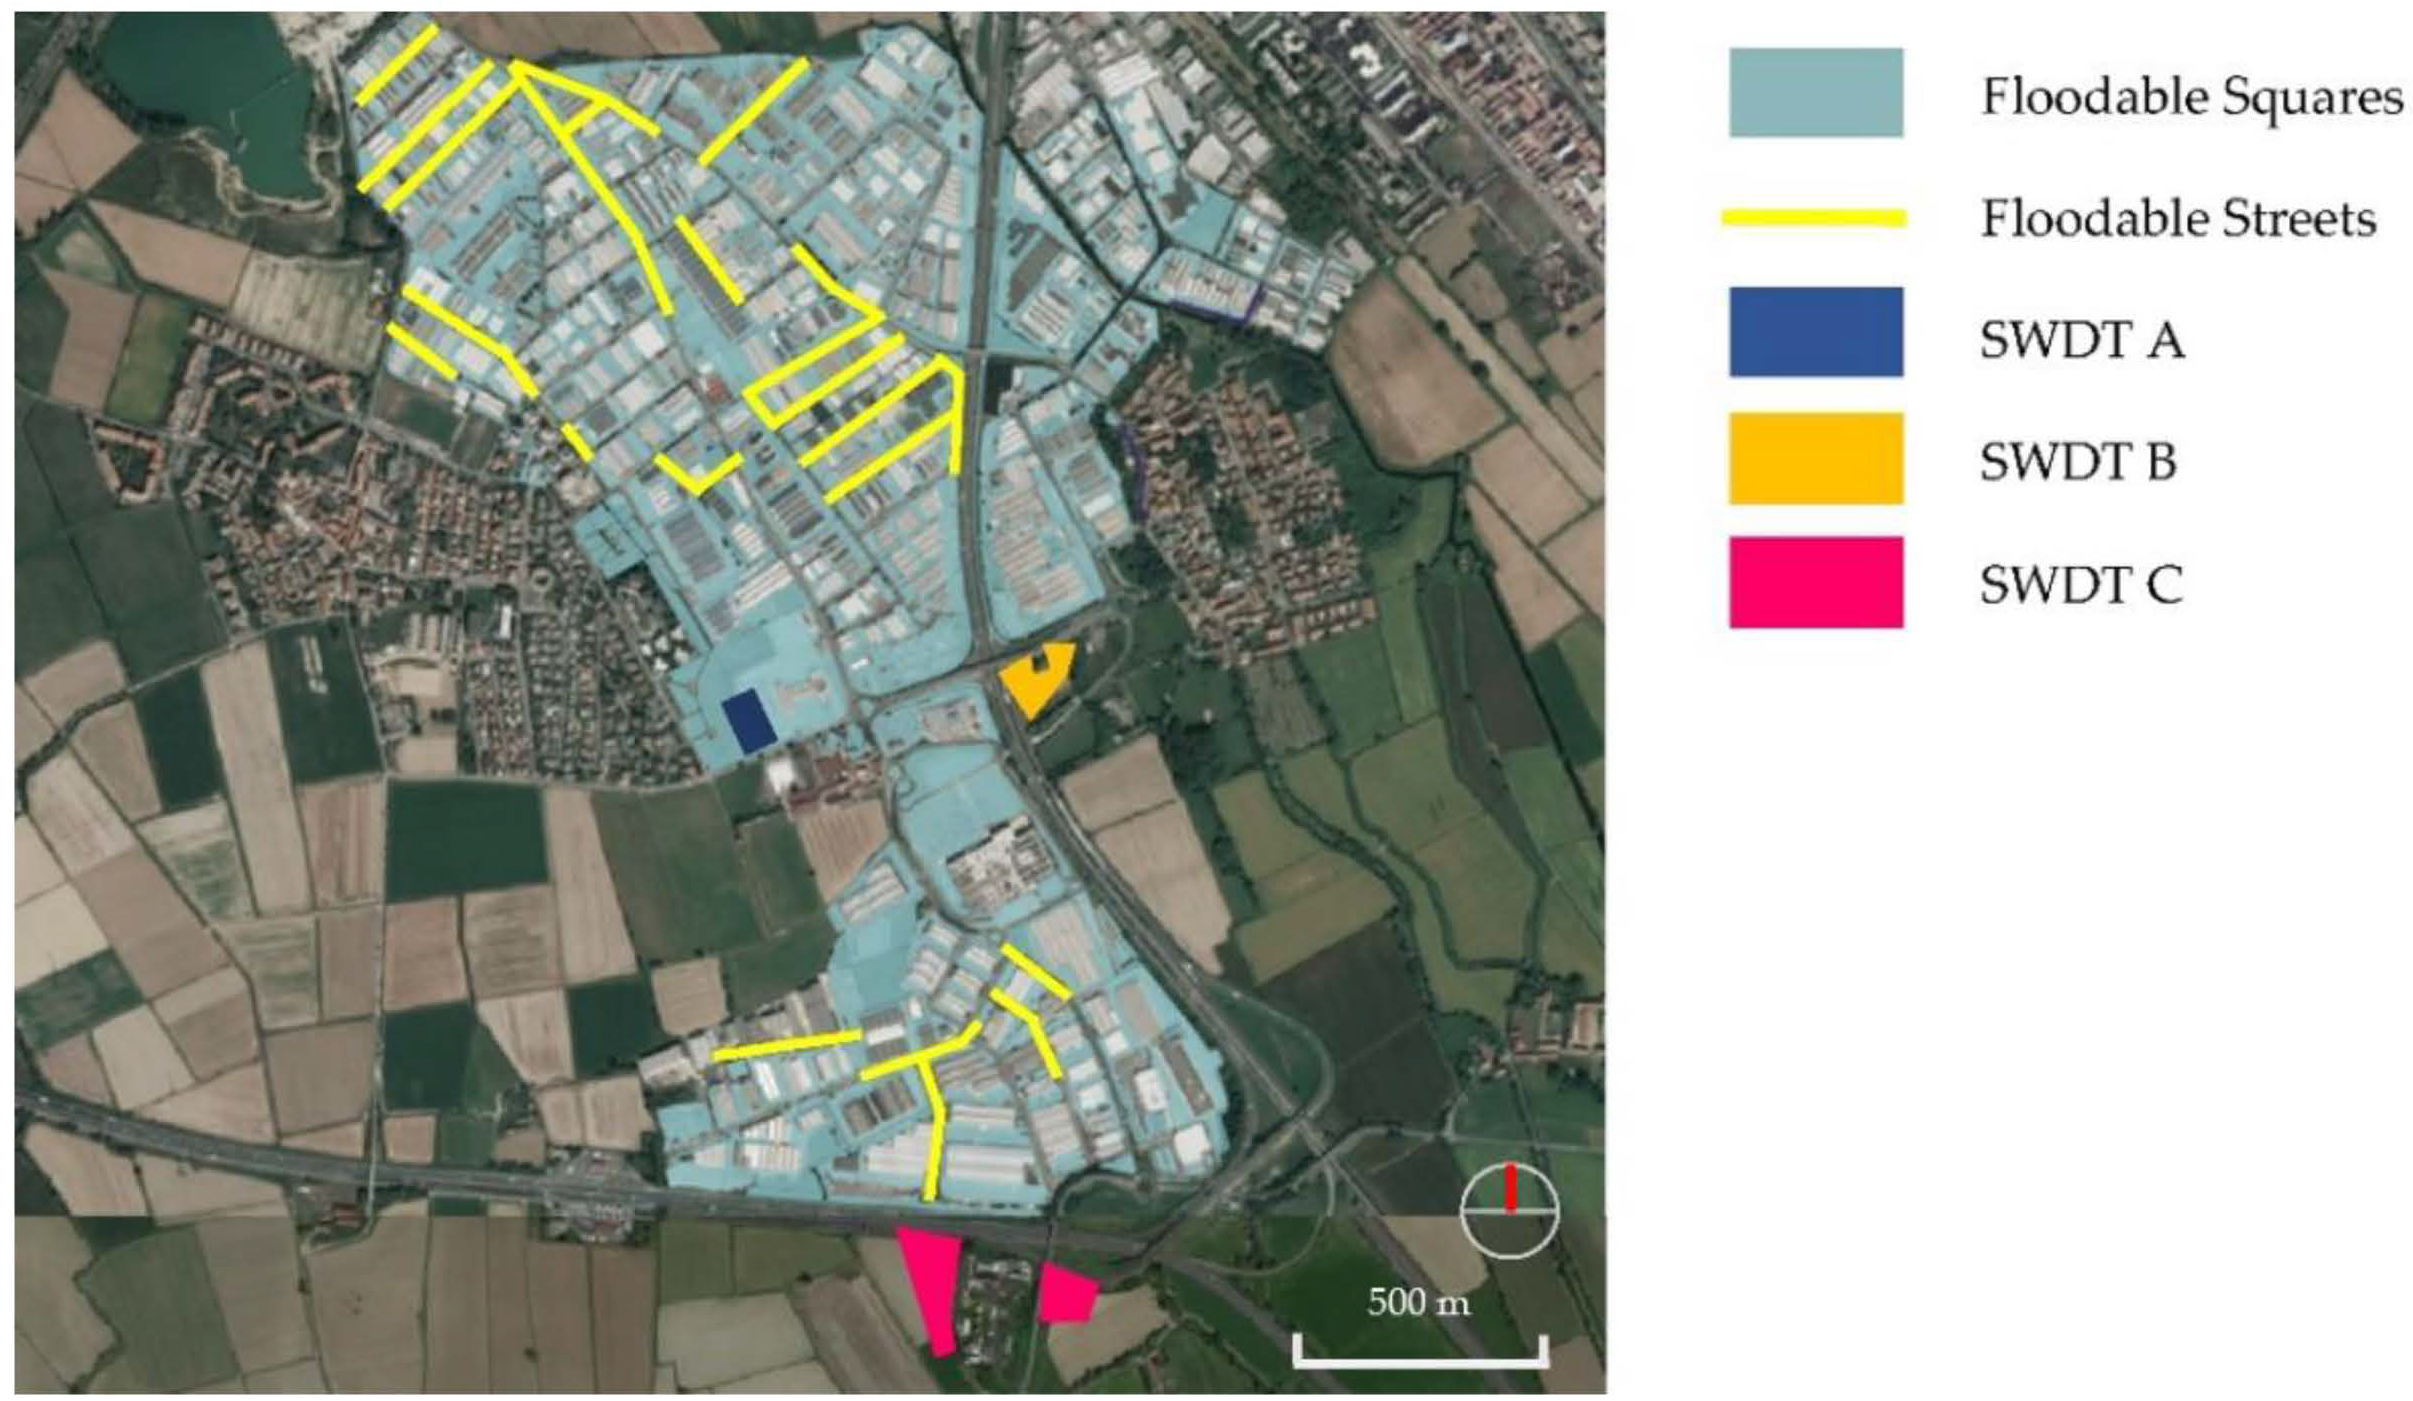
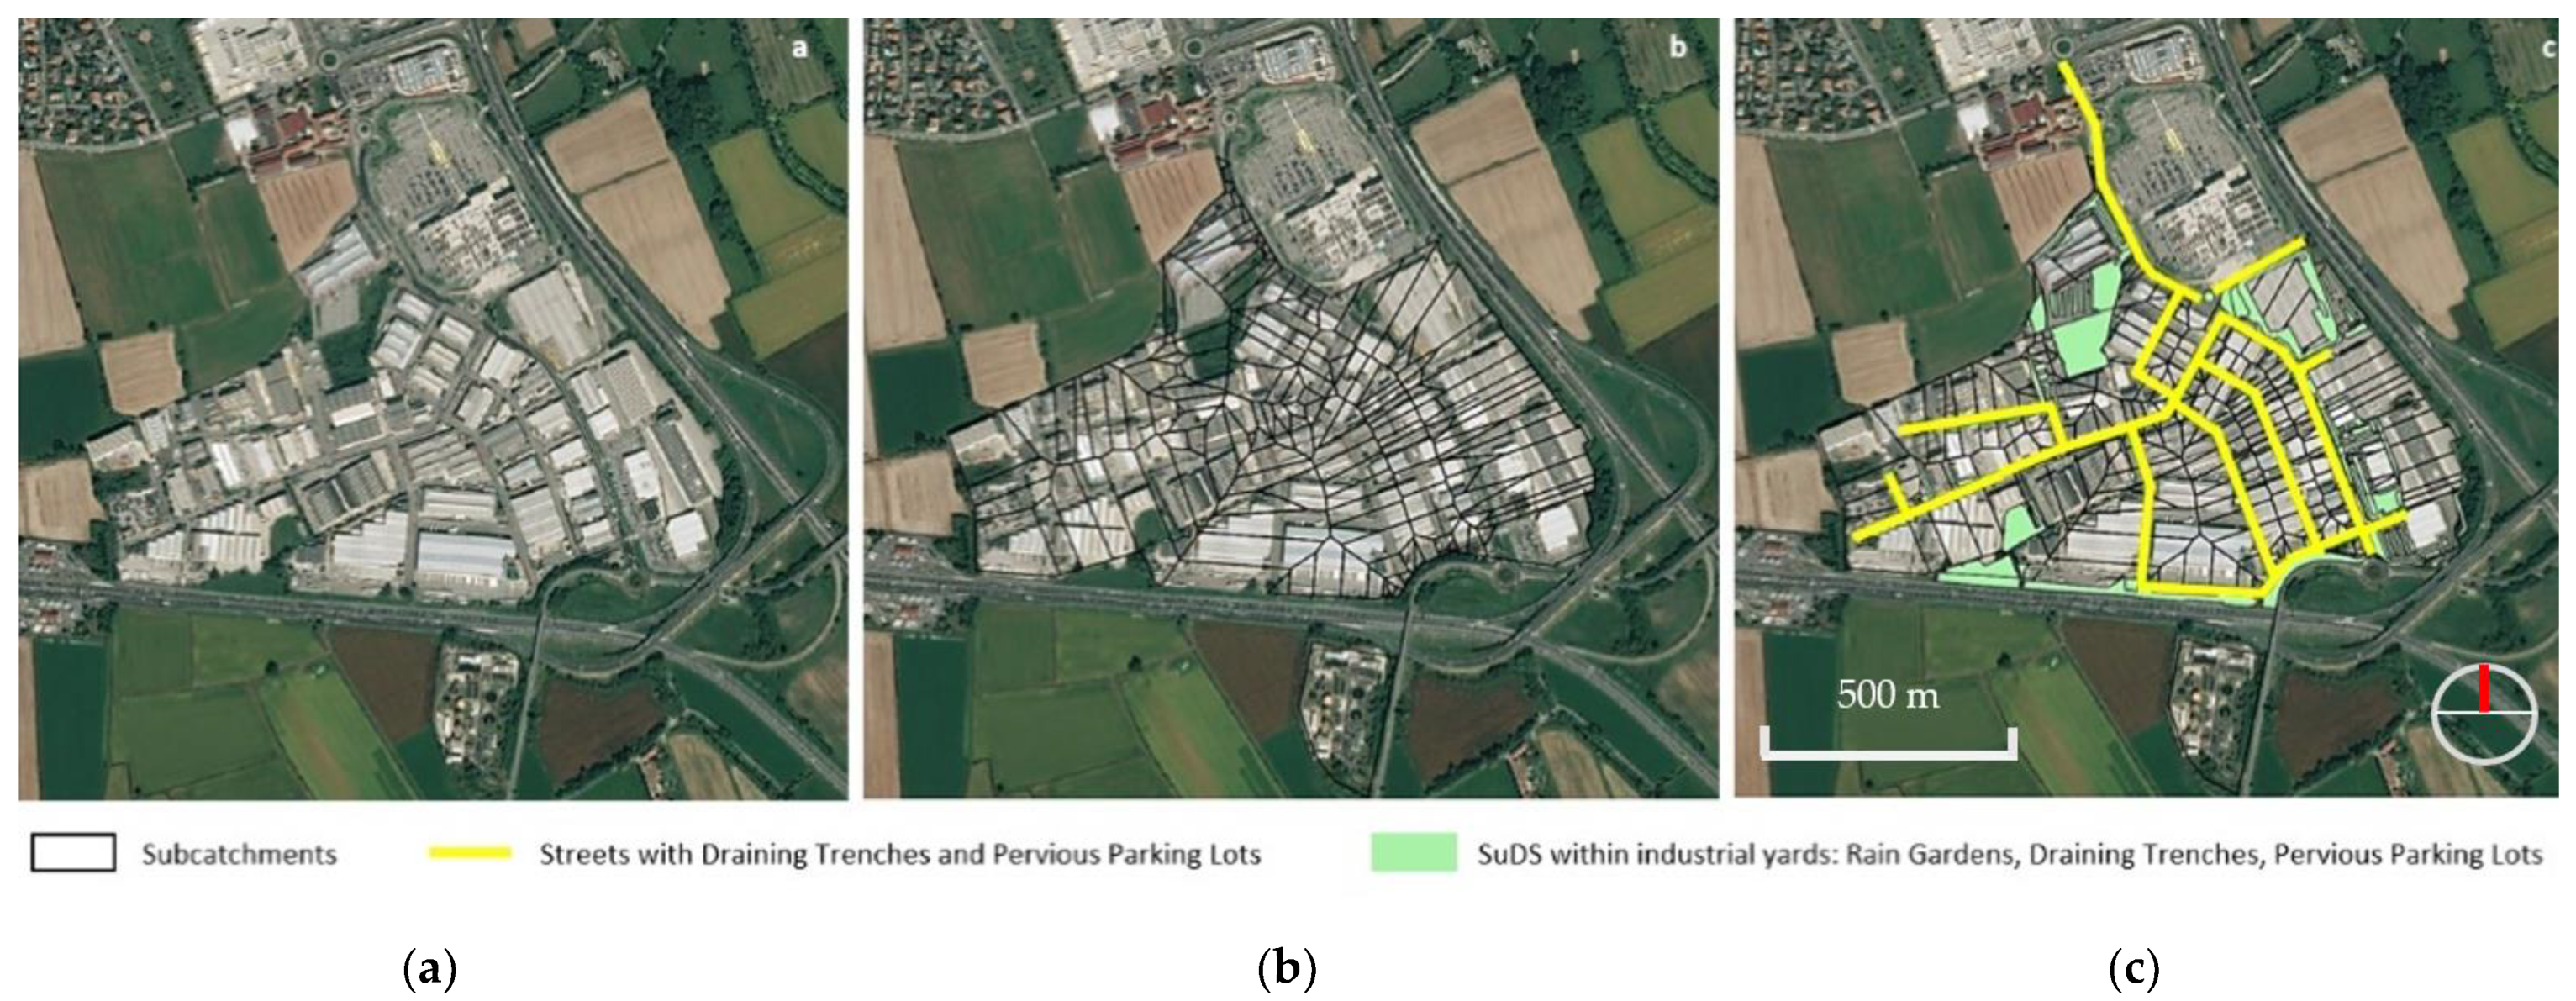
In particular, this research strove to assess the effectiveness of hybrid approaches (H-SM) as solutions for a sustainable mitigation of excess stormwater runoff, supporting the research in this field with a new case study implementation. Specifically, due to the absence of runoff measurements, this study was conceived as a model-based experimentation in which several H-SM scenarios were compared with a centralized scenario (C-SM), involving just SWDTs and chosen as the benchmark scenario. This scenario-based analysis involved two different H-SM approaches: FLOODurb, mainly seeking to improve stormwater detention, and GREENurb, aimed also at increasing the retention processes. The reported research, without any intention of estimating the economic feasibility of the investment in detail or implementing complex and exhaustive multicriteria techniques, further aims at providing a quantitative and comparative assessment of the various cost items of each scenario.
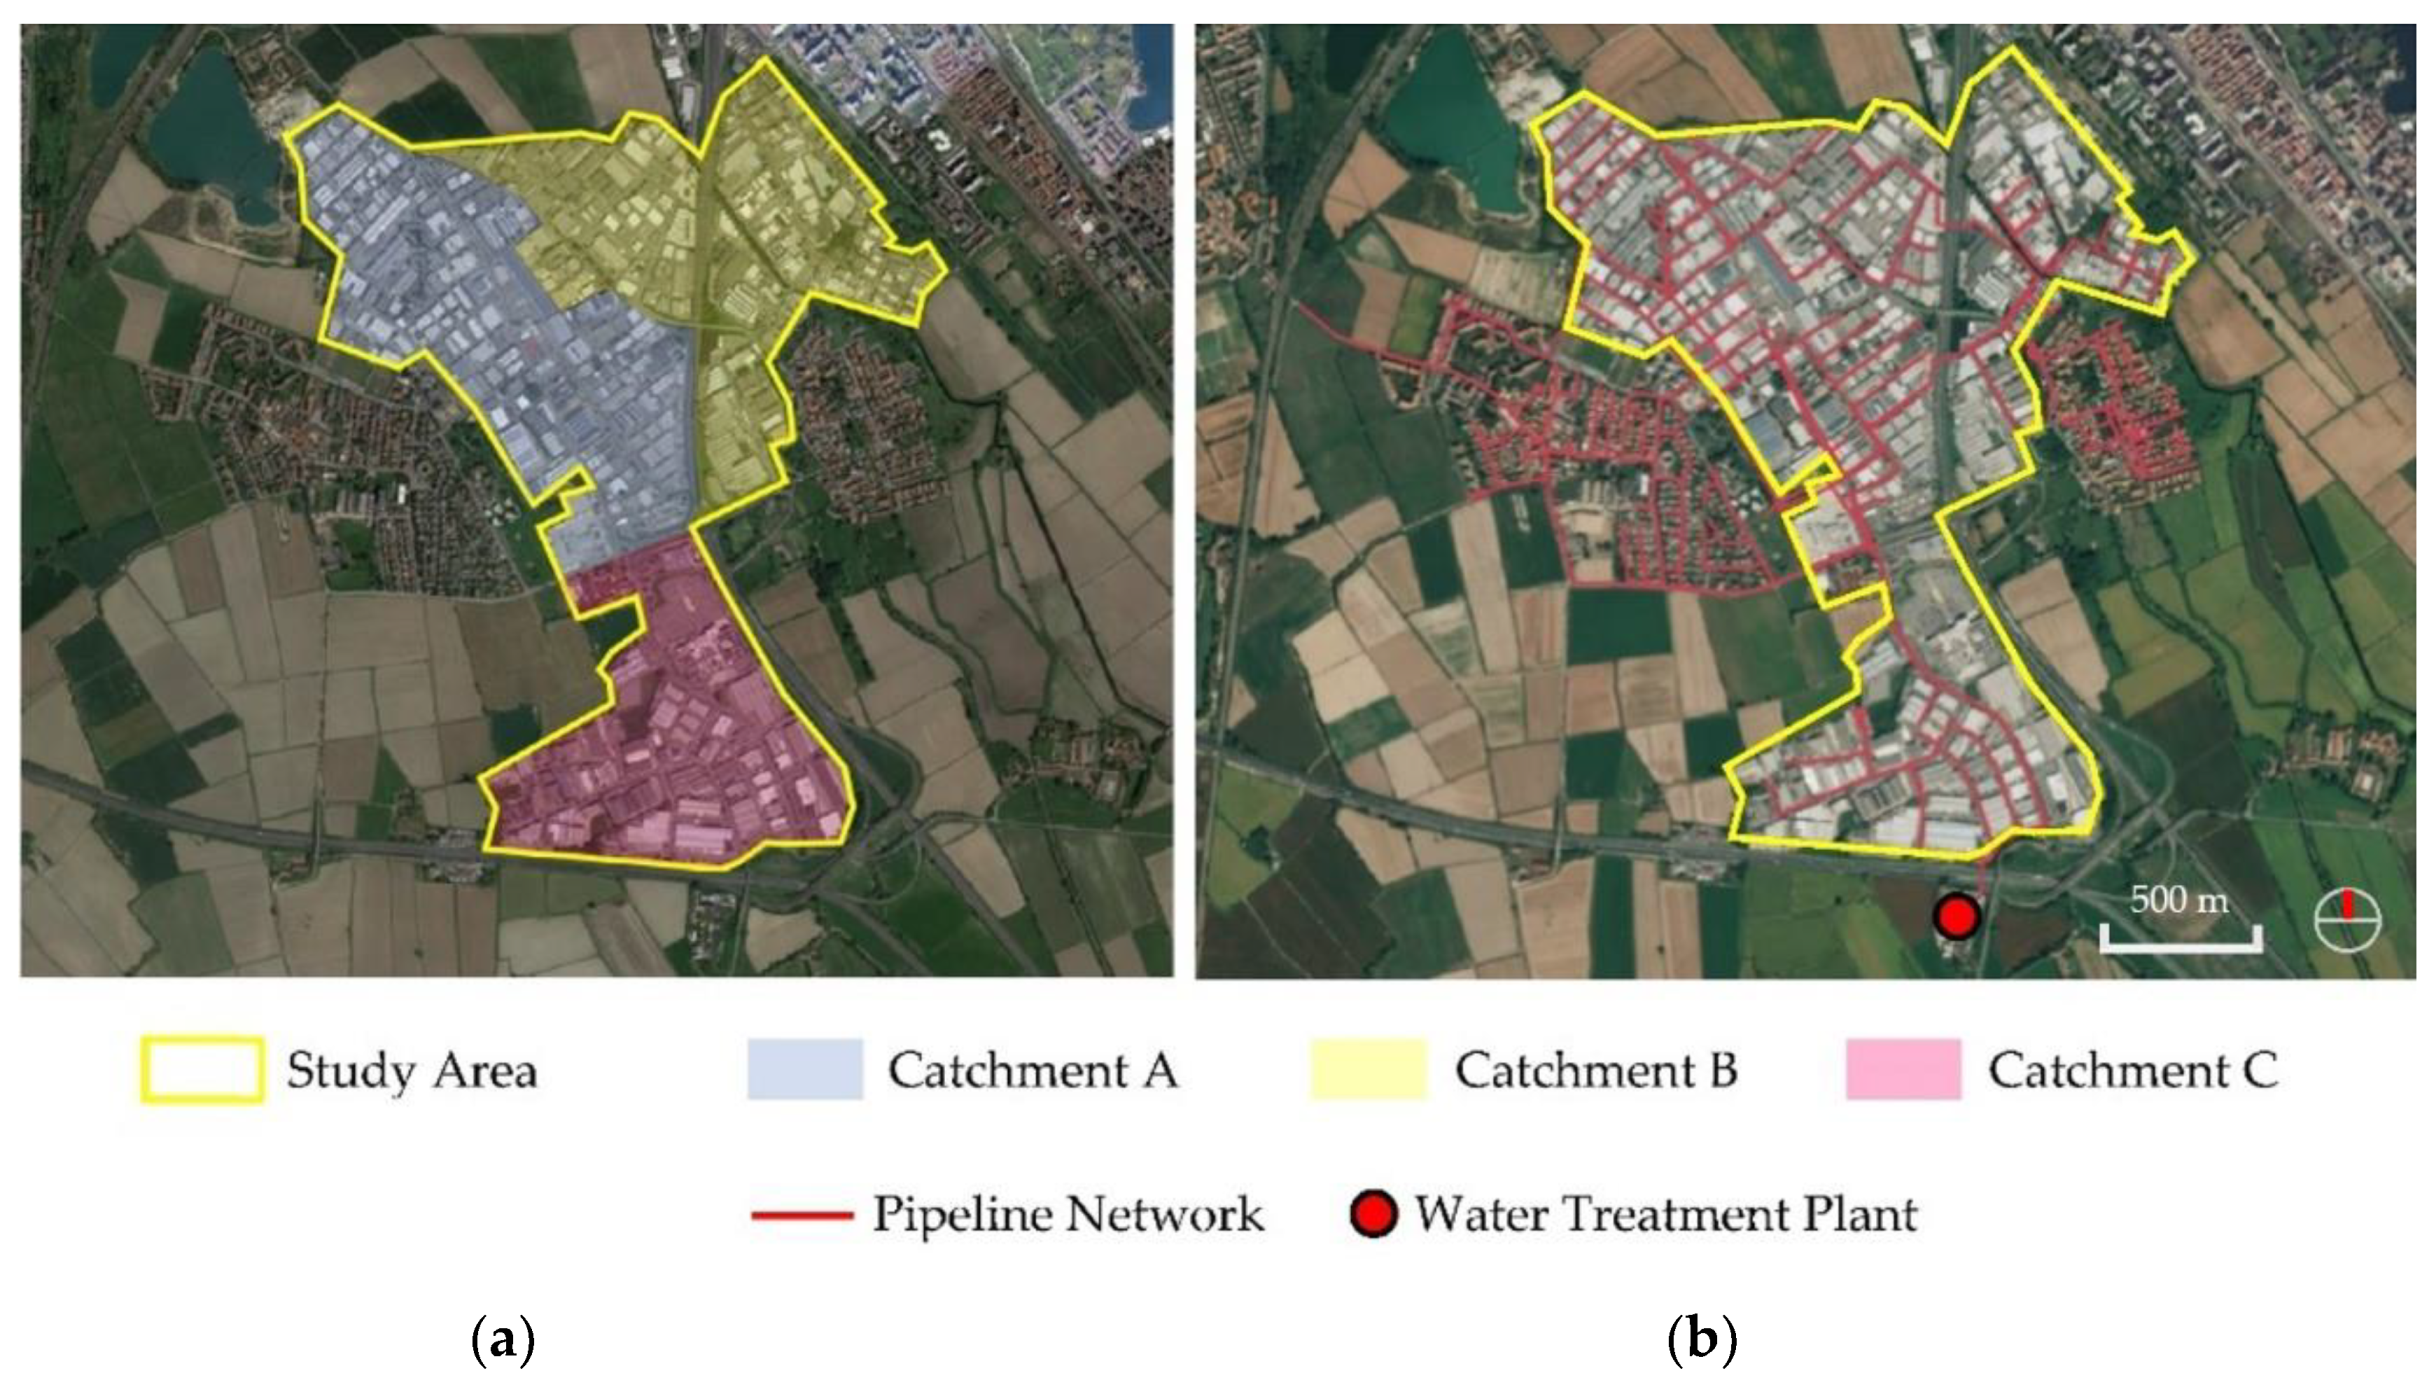
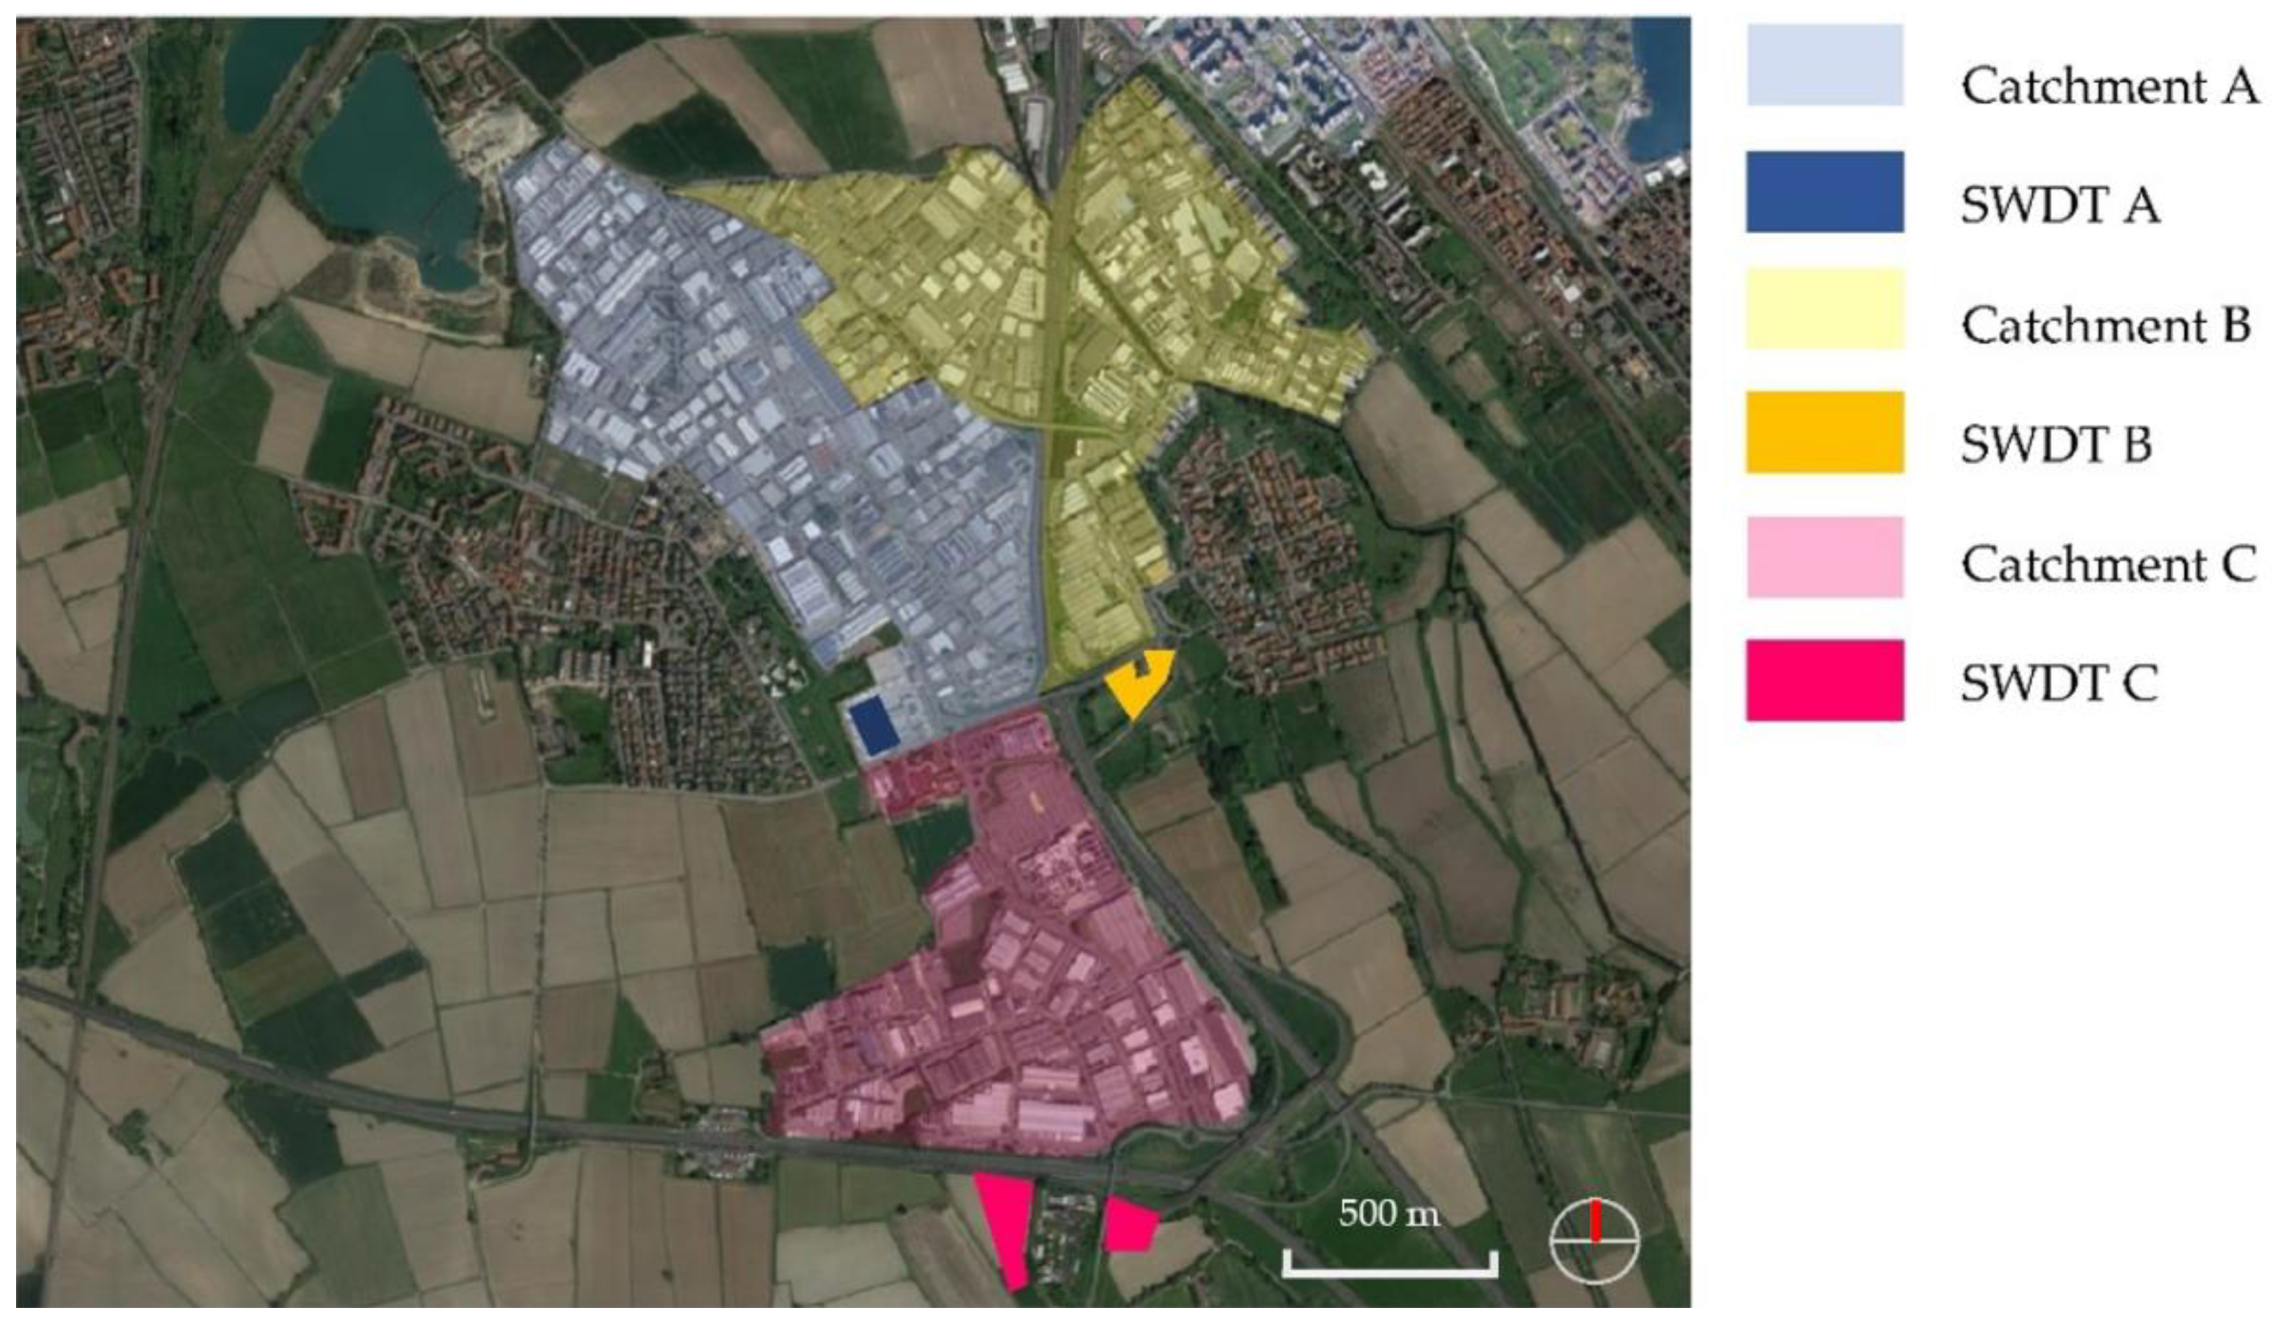
The study started from an analysis of the critical issues related to the stormwater quantitative management arising in the Sesto Ulteriano urban catchment, located in the suburbs of Milan, Northern Italy, that experiences flooding events also under less-severe rainfalls (2-year return period) [37]. A drainage network model with traditional storage tanks downstream was developed for the urban catchment by several Italian firms, funded by PoliS-Lombardia, a regional institute for policy purpose. A detailed design and localization of low-impact development (LID) in the case study area was developed with the aim of implementing a hybrid approach for excess stormwater management (H-SM).

2. Materials and Methods

2.1. The Case Study

Sesto Ulteriano (45°23′45″ N 9°15′13″ E) is a small village of about 1100 ha and 3500 inhabitants in the municipality of San Giuliano Milanese, belonging to the Metropolitan Borough of Milan, Lombardy Region (Italy). The study area covers only a part of it, about 227.28 ha, characterized mainly by industrial settlements and subdivided for study purposes into three different macro-catchments: A, B, and C (Figure 1a).
The study area experienced a remarkable impervious surfaces increase (+15% from 2000 to 2015) from the second half of the twentieth century, which significantly increased the vulnerability of the territory and gave way to the ongoing stormwater-related criticalities which also occur under less-severe rainfall (2-year return period) [37].
The drainage network of Sesto Ulteriano is mainly a combined network, delivering both stormwater and wastewater. The sewer system proceeds roughly from the north to the south of the catchment, reaching the wastewater treatment plant of “San Giuliano Milanese Ovest” (Figure 1b). Specifically, it is a continuous-cycle wastewater treatment plant, biological and active sludge type, with simultaneous oxidation/nitrification and anaerobic digestion of sludge.
Stormwater is discharged into irrigation ditches through several combined sewer overflows (CSOs) placed along the network. For this reason, together with the impervious surface increase, the limited capacity of the artificial channels and the strong interconnection between the hydrographic network and the sewer system are the causes of water quantity and quality issues.

2.2. Centralized Approach for the Management of Excess Stormwater (C-SM)

The centralized approach for the excess stormwater management simply consists of SWDTs located downstream each of the subcatchments (A, B, and C), as shown in Figure 2. Each one of them collects runoff discharged from one or more CSOs. In total, the case study network involves eight CSOs. One of them discharges excess stormwater directly into SWDT A, five into SWDT B, and two into SWDT C.
Local legislative regulations were taken into account in order to assess the volume of the SWDTs. In particular, the Regional Regulation n.7 of 23 November 2017 of Lombardia [42] identified 40 L/s per hectare of impervious surface as the maximum flow rate to be discharged into the receiver by SWDTs.
The U.S. Environmental Protection Agency software Storm Water Management Model (SWMM5) was used to understand the performance of the drainage network of the case study area. EPA SWMM5 is an open-source hydrological model developed for urban runoff management purposes and is very popular among scientists for its greatest acceptance and highest suitability in research studies. Once the drainage system and a certain rainfall condition is given as input, the model is able to predict the stormwater runoff generated according to hydrological and hydraulic characteristics of the investigated scenarios. In this work, SWMM5 simulations were carried out to assess the maximum flows (Qmax) and total volumes (Vtot) discharged from each CSOs under 2 years, 5 years, and 10 years rainfall events with 9 h duration. In particular, this value represents the critical duration of the urban catchment, identified as the duration able to maximize the CSOs peak flow [37].

2.3. Hybrid Approach for the Management of Excess Stormwater (H-SM)

The hybrid approach (H-SM) also implements, along with the SWDTs expected in the C-SM approach, (de)centralized infrastructures for the stormwater management (LID). Two different scenarios were investigated: FLOODurb and GREENurb.

2.3.1. FLOODurb Hybrid Approach

The idea behind the FLOODurb hybrid approach is to implement controlled flooding areas with a maximum floodable height of 10 cm. Specifically, industrial yards and back roads were selected within the case study catchment according to a detailed feasibility project (Figure 3), covering altogether about 35% of the study area (74 ha).
With the ambitious objective of temporarily detaining stormwater and reducing volumes discharged into SWDTs, the identified surfaces were modeled in SWMM5 with the rain barrel LID control module.
Conceptually, a rain barrel is modeled in SWMM5 as just an empty storage layer able to collect stormwater runoff with a drain valve placed above an impermeable bottom. The barrel height characterizes the storage layer, while the flow coefficient and flow exponent define the drain [43].
SWMM5 uses a simple empirical power law to model underdrain outflow (q3), described as follows:
q3 = C3D ∙ (h3)η3D [mm/h],
where
  • h3 represents the hydraulic head seen by underdrain (mm);
  • C3D represents the underdrain discharge coefficient (mm−(η3D−1)/h);
  • η3D represents the underdrain discharge exponent.
The flow rate computed with Equation (1) should be considered a maximum potential value. There is no underdrain flow until the depth of water in the storage layer reaches the drain-offset height. Choosing a value of 0.5 for η3D makes the drain flow formula equivalent to the standard orifice equation, where C3D incorporates both the normal orifice discharge coefficient and available flow area. If the goal is to drain a fully saturated unit in a specific amount of time, SWMM5 suggests setting the drain exponent to 0.5 (to represent the orifice flow) and to calculate C3D as follows:
C3D = (2 ∙ D0.5)/T [mm/h],
where
  • D represents the distance from the drain to the surface plus any berm height (mm);
  • T represents the draining time (h).
Specifically, with the increase of the barrel height (reduction of flow coefficient), a significant reduction of the peak flow and total volume is usually observed, as well as an increase of the delay time. In this study, the barrel height was set equal to 100 mm. It should be noted that this value is not representative of a technological limit of the system, but it was chosen as a compromise between the effectiveness of stormwater management performance and the maintenance of the road network functioning. Greater heights would lead to an alteration of the traffic patterns, causing inconvenience to the people who live and work in the districts concerned, making it necessary to provide alternative routes. Moreover, a barrel height of 100 mm would enable taking advantage of the actual configuration of the other road elements, both for confinement needs and to allow the circulation of pedestrians (sidewalks, for example, are usually 10 cm higher than the roadway).
Considering that, with the increase of the draining time, both a peak flow and a total volume reduction is achieved (enhanced flood lamination), 10 h and 50 h draining times were investigated. These values, again, do not have policy relevance in Italy and are not representative of the drainage system’s technological limit, but of a choice able to balance performance and functionality. Particularly, values lower than 10 h were discarded because they were considered unrealistic if compared with the critical duration of the case study catchment. A maximum draining time of 50 h was set to reestablish the condition of street and squares before flooding occurrence in a reasonable time interval of about two days.
Specifically, the FLOODurb hybrid approach includes two different scenarios: “RB_10” and “RB_50” scenarios, in which floodable street and squares were modeled using rain barrels LID control module with, respectively, 10 h and 50 h draining time. Table 1 collects SWMM5 parameters chosen for the rain barrel LID control in the mentioned hybrid scenarios. All parameters were selected according to the mentioned design choices.

2.3.2. GREENurb Hybrid Approach

The GREENurb scenario is the result of a detailed study undertaken in the framework of the PoliS-Lombardia study, designed by a number of professionals with different expertise. Engineers from Majone & Partners designed and tested the model of the actual drainage network of Sesto Ulteriano, demonstrating its hydraulic and hydrological criticalities. Moreover, engineers from IRIDRA chose and designed sustainable drainage systems, and the architects from Studio Gioia Gibelli studied the urban context and identified the areas suitable for retrofitting. Researchers from the Environmental and Maritime Hydraulics Laboratory of the University of Salerno started working on this project in 2018, focusing on the modeling implementation and assessment of the proposed sustainable drainage systems in the case study area [37].
It was considered appropriate to act on a series of public green areas with multisize rain gardens. Where possible, draining trenches (vegetated or not) or permeable parking lots were inserted at the edges of the roadway. The scenario provided for about 9.2 ha of SuDS retrofitting surface for catchment A (8.8% of the catchment area), 7.6 ha for catchment B (11.94% of the catchment area), and 6.8 ha for catchment C (11.62% of the catchment area) for an overall retrofitting percentage of about 10.41% (Table 2).
The key strength of this scenario is that it derives from the study of the characteristics of the urban context, aiming at a detailed identification of impervious areas suitable for SuDS retrofitting. Therefore, the proper location for each of the selected SuDS typologies are identified. Differently to the infrastructure implemented in the FLOODurb scenario, these are able to mime the drainage pattern of natural soils, favoring the stormwater runoff detention and infiltration.
The SuDS were modeled in SWMM5 using two main objects (bioretention cells and permeable pavements) and varying parameters related to surface, soil and drainage layers, and drain (Table 3). Parameters of each infrastructure were chosen according to the project, literature review, and EPA SWMM5 user’s manual ranges [29,43,44,45,46,47,48]. Moreover, bioretention cell conductivity, which is known to gradually reduce in time, was defined considering an operating value (about 100 mm/h) instead of an initial one.
SWMM5 allows implementing sustainable drainage infrastructure as a fraction of impervious or pervious surfaces in each subcatchment modeled. Therefore, since the software is not able to consider the effective localization of sustainable drainage systems, a wide range of subcatchments (almost one for each node of the network) was designed within each macro-catchment considered (Figure 4), so that the localization of the SuDS could be, with a good approximation, representative of the reality.
Moreover, other assumptions of the SWMM5 hydrological model concern the percentages of subcatchment area treated by each SuDS and the runoff rerouting options. The sustainable drainage infrastructures implemented in the GREENurb model are conceived as systems directly connected with the urban context. For this reason, they are able to treat the runoff generated by the surrounding impervious and pervious areas, along with the rainfall directly falling on them. As a hypothesis, in the case study model, the SuDS are meant to treat the entire runoff generated by the pervious and impervious areas of the subcatchment in which they are located. Only afterword is the excess runoff rerouted to the pervious areas and then to the sewer system.

2.4. Output Assessment

2.4.1. Centralized Approach Output Analysis

According to the maximum threshold of 40 L/s per hectare of impervious surface [10], the maximum allowed discharge was calculated (Qlaw) by multiplying the mentioned value by the impervious surface treated (Aimp) by each CSO, as follows:
Qlawx, T = 40 ∙ Aimpx [L/s],
where
  • x represents the specific CSO.
  • T represents the return period of the specific rainfall input (2, 5, 10 years).
  • Qlawx, T represents the eligible flow by law for the specific CSO under varying return period events (T = 2, 5, 10 years) (L/s).
  • Aimpx represents the impervious surface treated by the specific CSO (ha).
Once the threshold was identified, the maximum allowed runoff volume and, consequently, the volume to be detained by SWDTs (Vlamx, T) were identified for each CSO from the difference between Qmax and Qlaw, as follows:
Vlamx, T = (Qmaxx, T − Qlawx, T) ∙ t [m3],
where
  • x represents the specific CSO.
  • T represents the return period of the specific rainfall input (2, 5, 10 years).
  • Vlamx, T represents the volume to be treated by SWDTs for the specific CSO under varying return period events (T = 2, 5, 10 years) (m3).
  • Qmaxx, T represents the maximum flow discharged by the specific CSO under varying return period events (T = 2, 5, 10 years) (m3/s).
  • Qlawx, T represents the eligible flow by law for the specific CSO under varying return period events (T = 2, 5, 10 years) (m3/s).
  • t represents the runoff observation time (s).

2.4.2. Hybrid Approach Output Analysis

Once Equations (3) and (4) were applied to assess the volume of the SWDTs in both the FLOODurb and GREENurb hybrid scenarios, these results were compared with those obtained in the C-SM reference scenario. The reduction in terms of total volumes discharged into SWDTs (Dn(x, T)) was evaluated as in the following for each CSO (x) and under varying rainfall events (T = 2, 5, 10):
Dn(x, T) = {[(Vlamx, T)c − (Vlamx, T)n]/(Vlamx, T)c} ∙ 100 [%],
where
  • n represents the typology of H-SM scenario (FLOODurb or GREENurb).
  • (Vlamx, T)c represents the total volume discharged from the specific CSO (x) into SWDTs under varying return period rainfall events (T = 2, 5, 10 years) in the C-SM (c) scenario (m3).
  • (Vlamx, T)n represents the total volume discharged from the specific CSO (x) into SWDTs under varying return period rainfall events (T = 2, 5, 10 years) in the selected H-SM scenario (m3).

2.5. The Economic Feasibility of the Designed Scenarios: A Preliminary Cost Analysis

The Lombardia Regional Price List of Public Works was used to compute the rate of the cost of SWDTs and LID interventions in each investigated scenario under varying precipitation inputs. In particular, to obtain the cost of SWDTs intervention (CTSWDT(S, T)), varying according to the drainage scenario and the rainfall input, the following equations were implemented:
CTSWDT(S, T) = VSWDT(S, T) ∙ CSWDT [€],
where
  • VSWDT(S, T) represents the total volume of the SWDTs in the specific scenario (S) and under varying return period (T = 2, 5, 10 years). It was calculated by summing the volumes discharged in the three macro-catchments (A, B and C) (m3).
  • CSWDT is the realization cost of SWDTs [EUR/m3], assumed equal to 850 EUR/m3 according to Lombardia Regional Price List of Public Works.
The cost of LID interventions, both independent from the precipitation input, was then computed for the rain barrel (CTRB) in the FLOODurb scenarios and bioretention cells plus permeable parking lots (CTGu) in the GREENurb scenario, as follows:
CTRB= (PRB ∙ CB) + (SRB ∙ CD) [EUR],
CTGu = (SBC ∙ CBC) + (SPPL ∙ CPPL) [EUR],
where
  • PRB represents the total perimeter of rain barrels (m).
  • SRB represents the total surface occupied by the rain barrels (m2).
  • SBC represents the total surface occupied by the bioretention cells (m2).
  • SPPL represents the total surface occupied by the permeable parking lots (m2).
  • CD is the cost of roadway drainage (EUR/m2), assumed equal to 8.3 EUR/m2 *.
  • CB is the cost of retention berm (EUR/m), assumed equal to 20.23 EUR/m *.
  • CBC is the cost of the bioretention cells (EUR/m2), assumed equal to 160.14 EUR/m2 *.
  • CPPL is the cost of the permeable parking lots (EUR/m2), assumed equal to 78.88 EUR/m2..
* All the costs were identified according to Lombardia Regional Price List of Public Works.
The cost of floodable streets and square (FLOODurb scenario) was computed as the sum of the realization cost of a 10 cm concrete Berm and that of the roadway drainage, due to the absence of a specific cost item.
Subsequently, by adding the LID costs to those of SWDTs, the total costs of the H-SM scenarios were computed. The latter were then compared with those obtained in the C-SM scenario.

3. Results

V
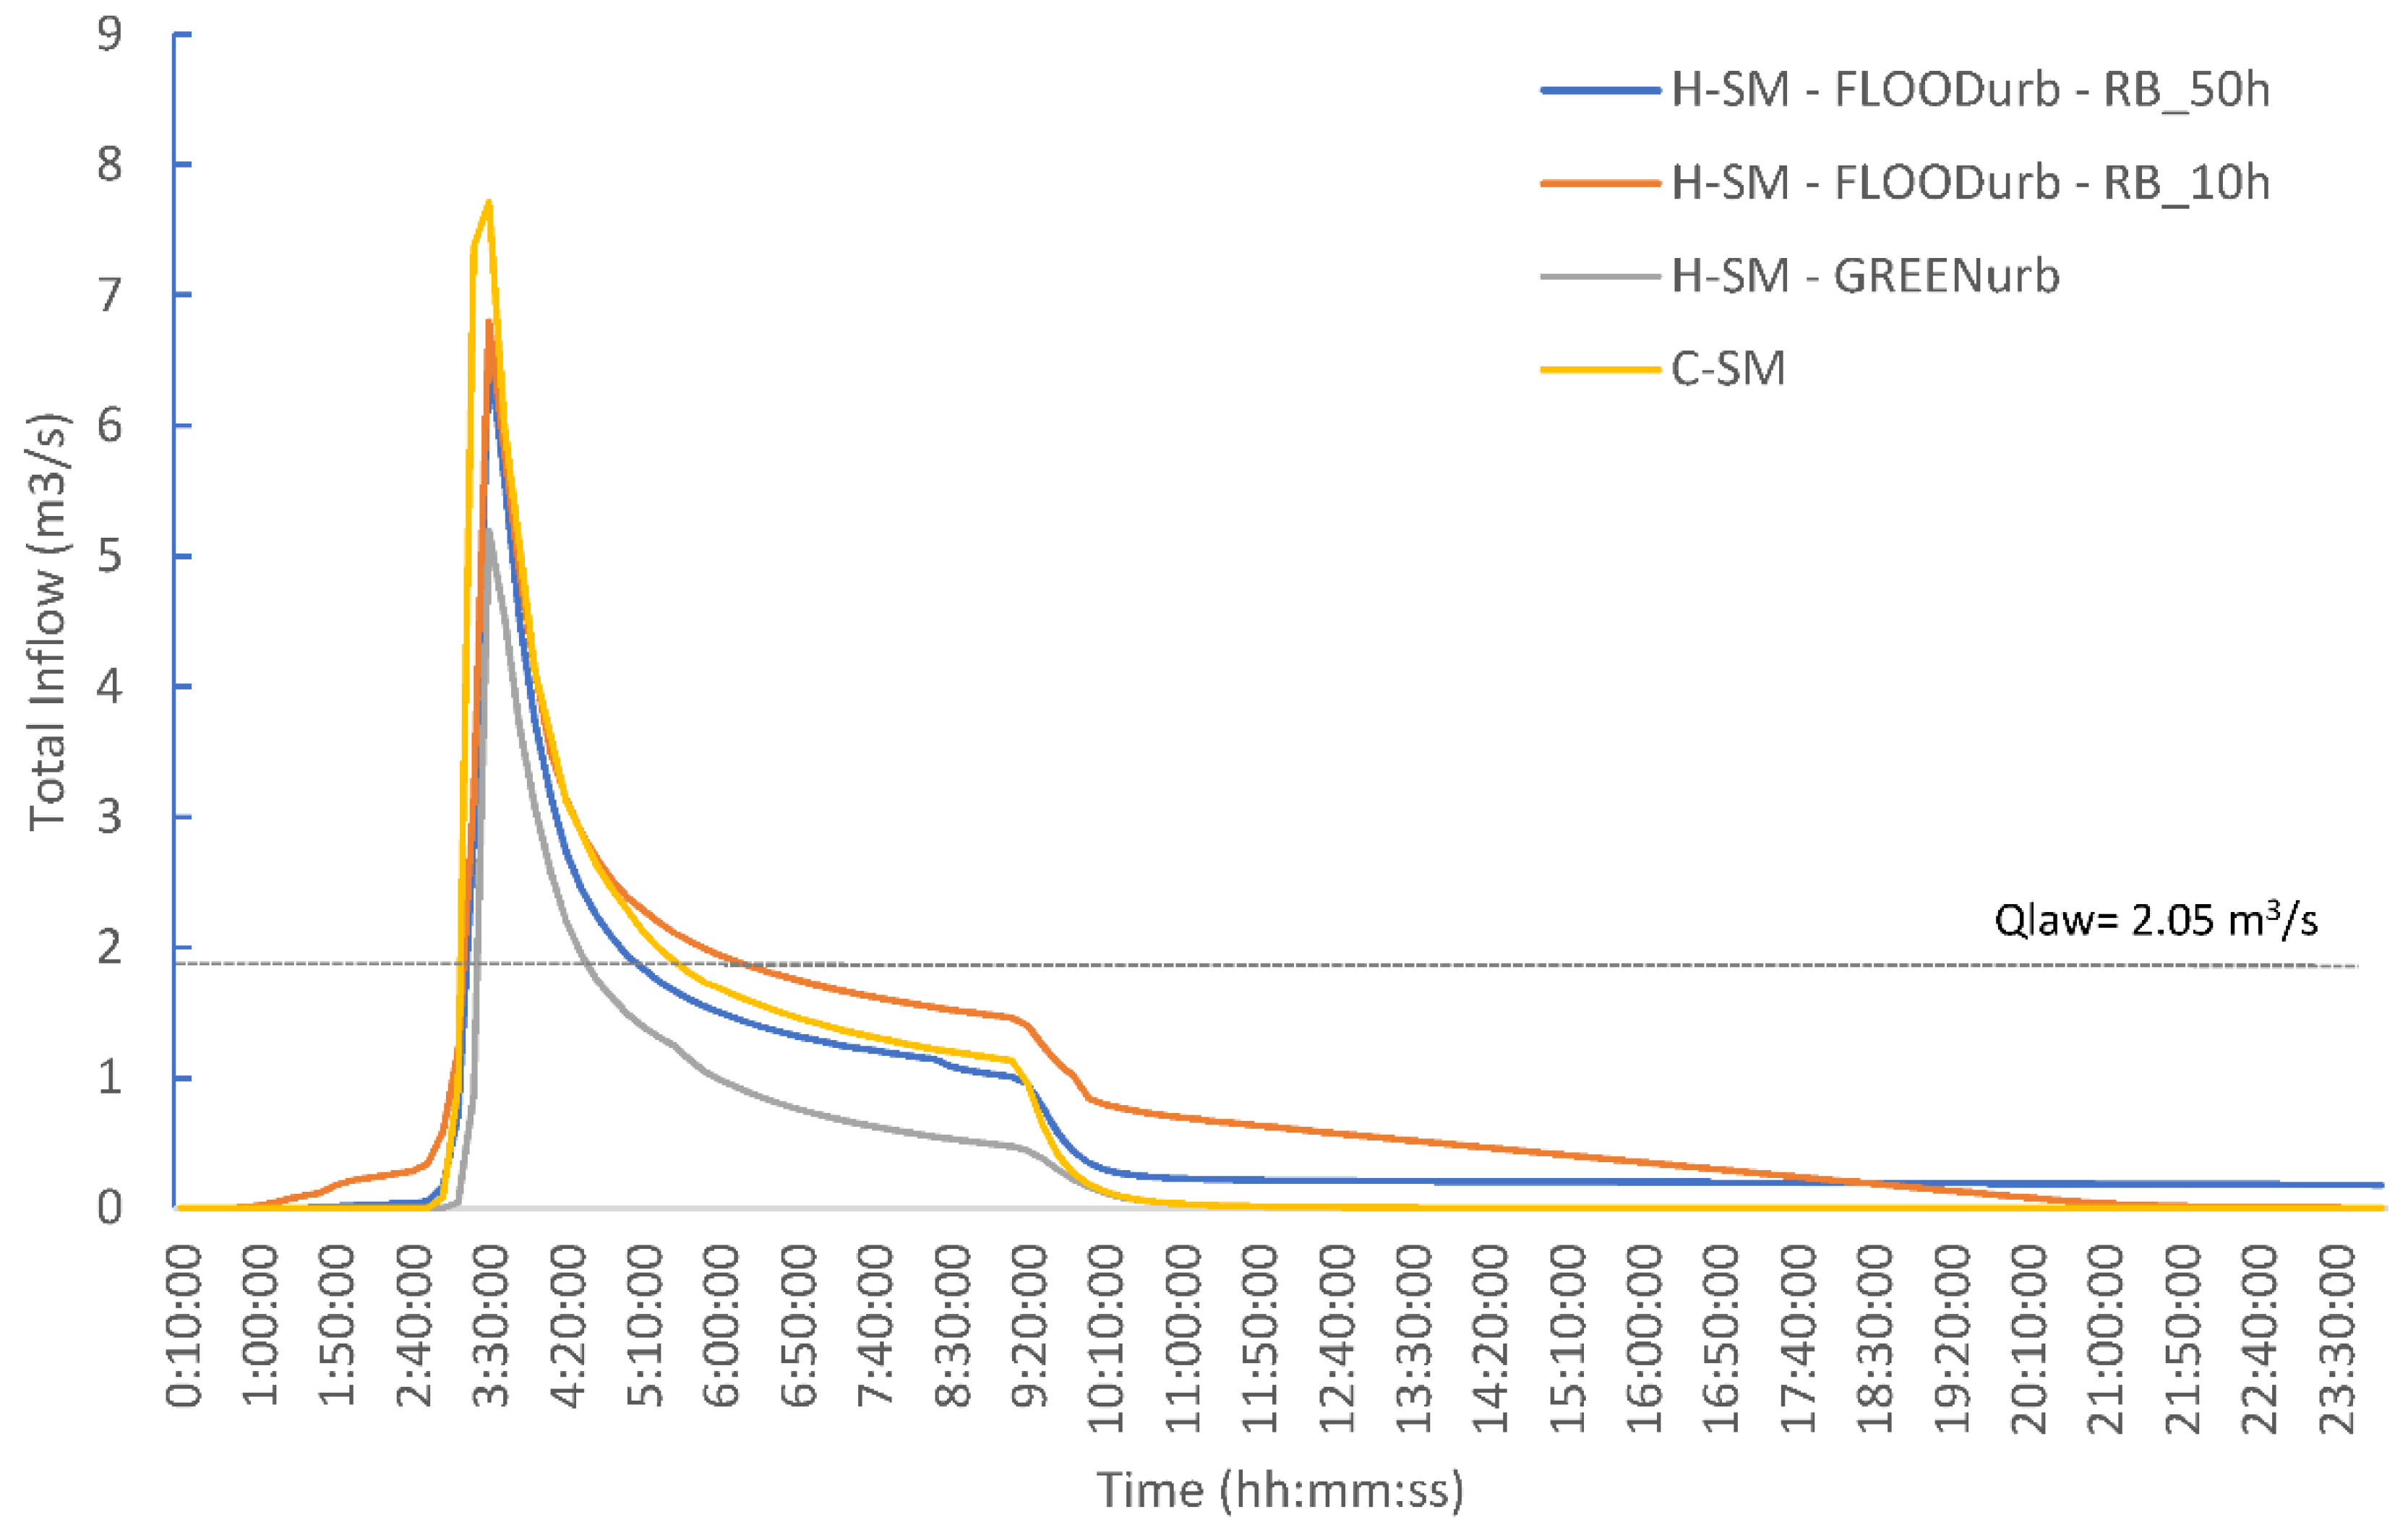
lam results were quantified for each CSOs whose outflow discharge into SWDT A, B, and C under varying rainfall inputs (2-year, 5-year, and 10-year return periods). As an example, Figure 5 collects the hydrographs of CSO 1019 (Catchment A), the one characterized by the larger impervious area treated, for all the investigated scenarios under 10-year return-period rainfall event. In the same plot, the specific Qlaw (m
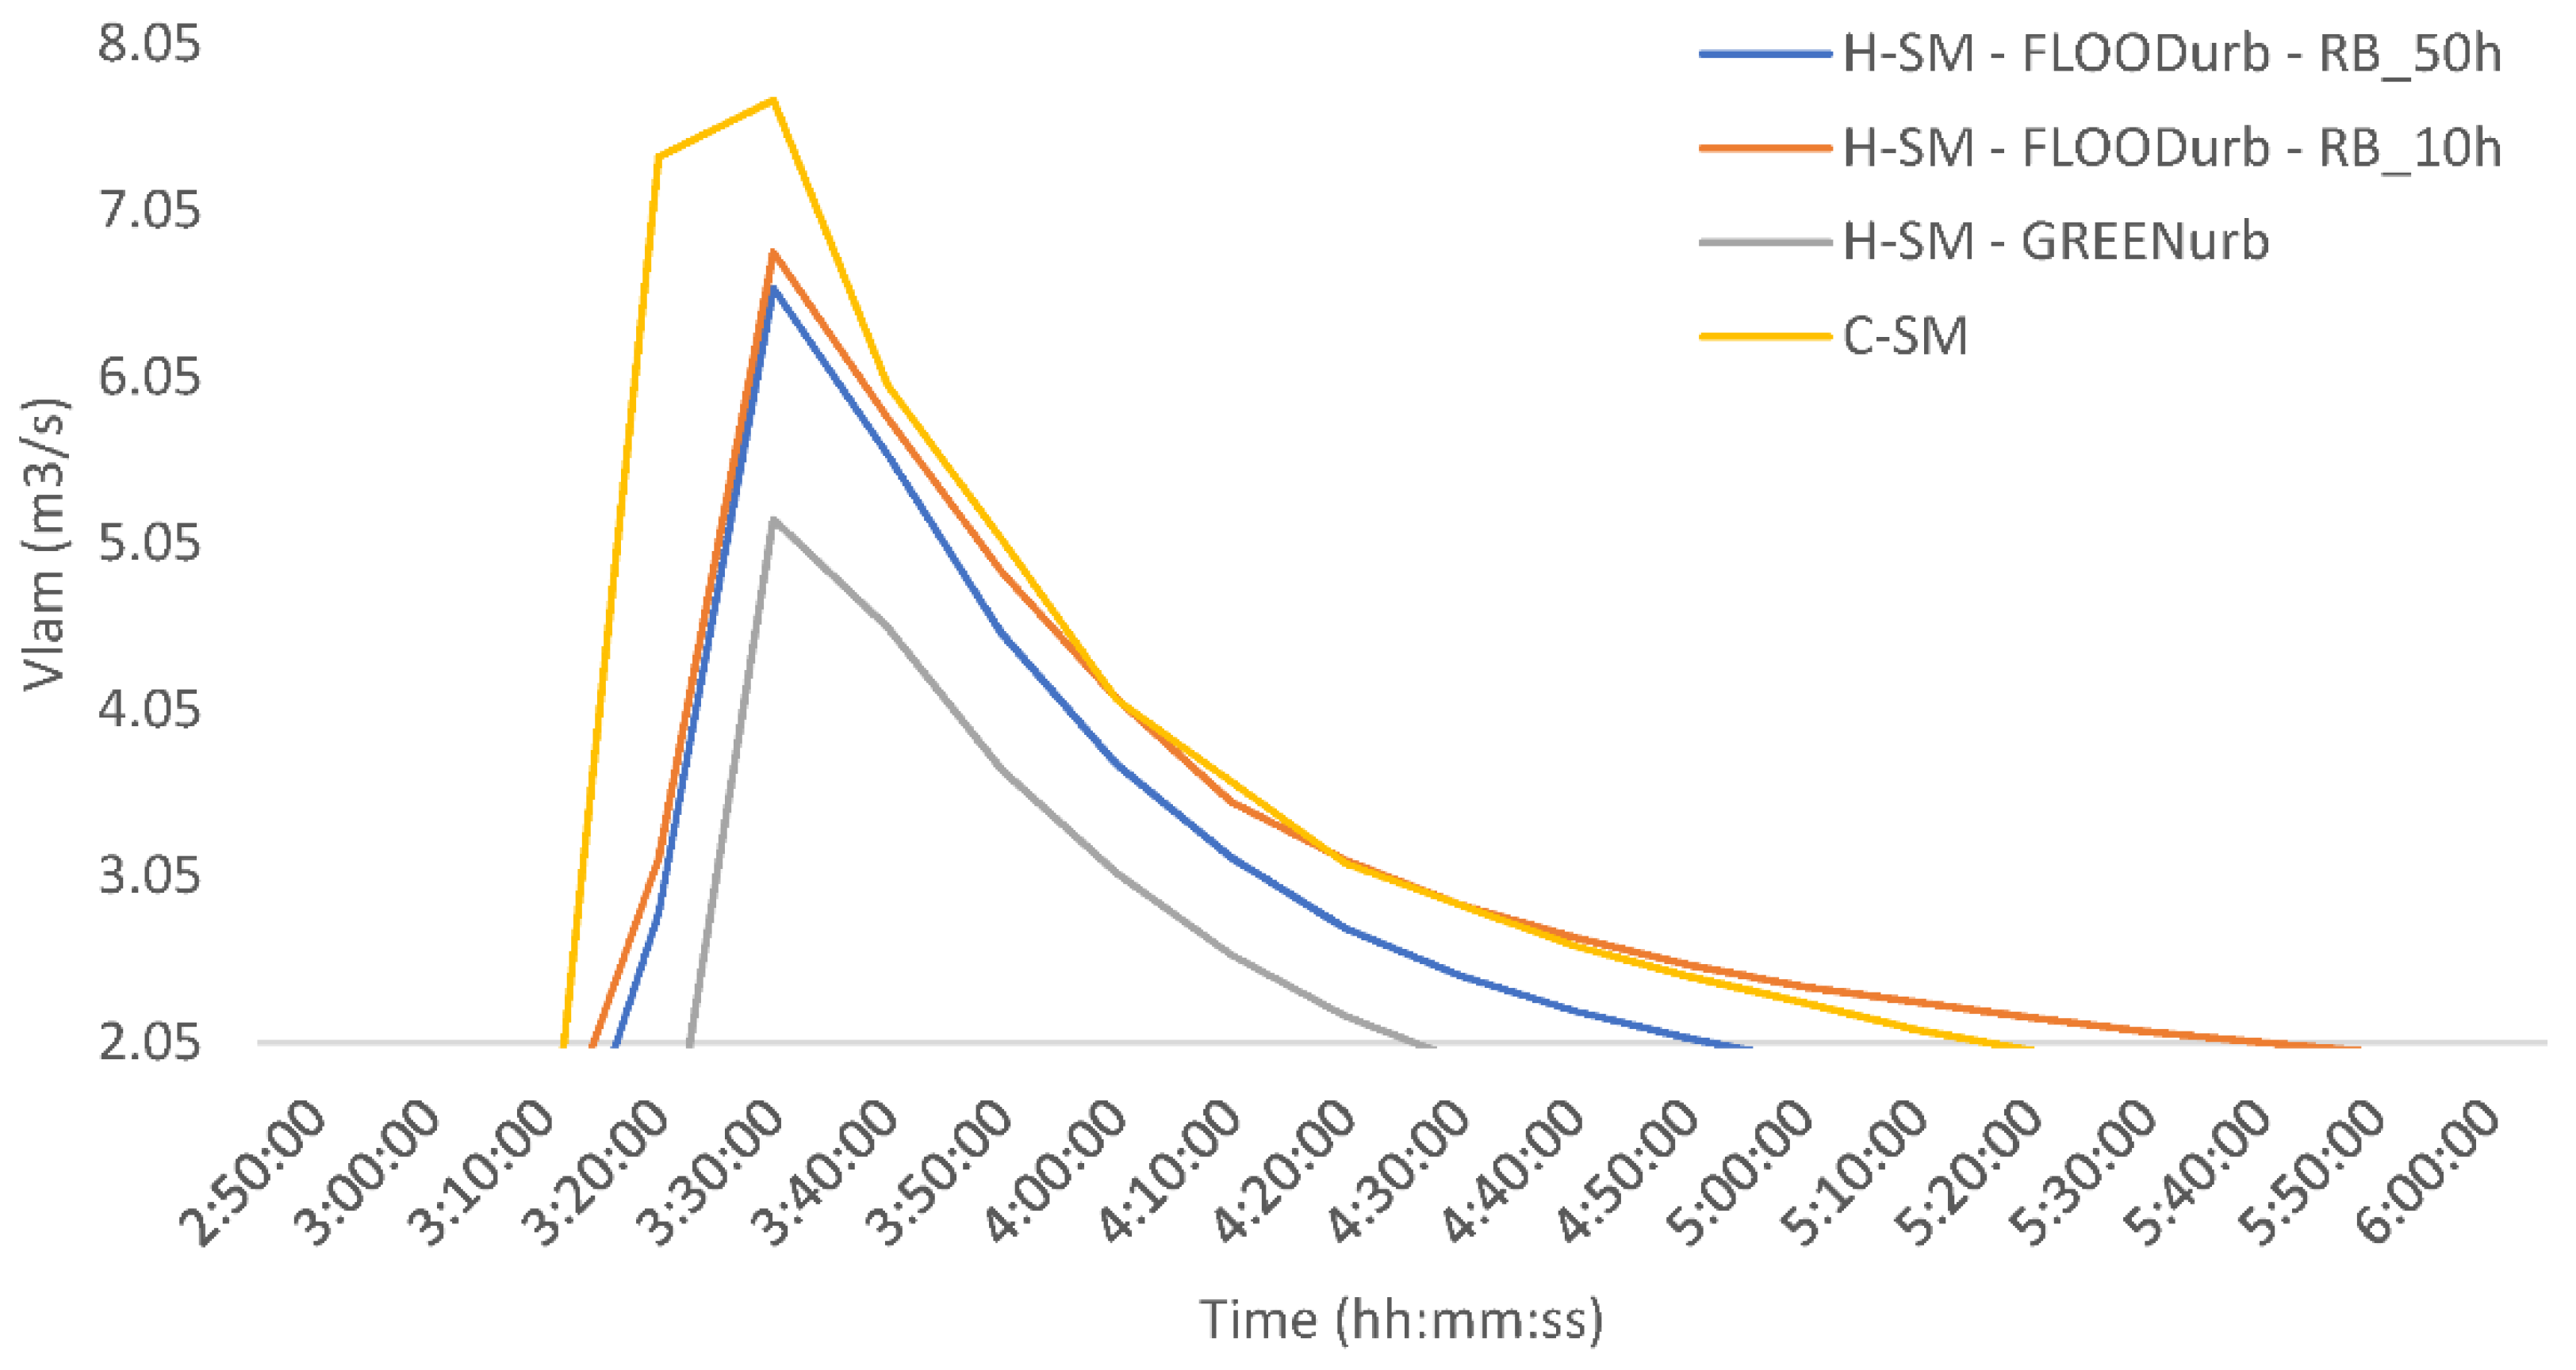
3/s) threshold value, essential for the identification of Vlam, was represented. Focusing on the over threshold volumes (Vlam) in Figure 6, it is possible to understand that a higher Vlam characterizes the C-SM scenario, followed by the two hybrid FLOODurb scenarios. The hybrid GREENurb scenario shows the best performance, sensibly reducing Vlam. Observing the hydrographs as a whole, the FLOODurb scenario with lower discharging time (RB_10h), if compared with the C-SM scenario, while reducing, as observed, the peak volumes, overall releases a larger amount of excess runoff over time. The GREENurb scenario, on the contrary, reduces both over threshold and total volumes.
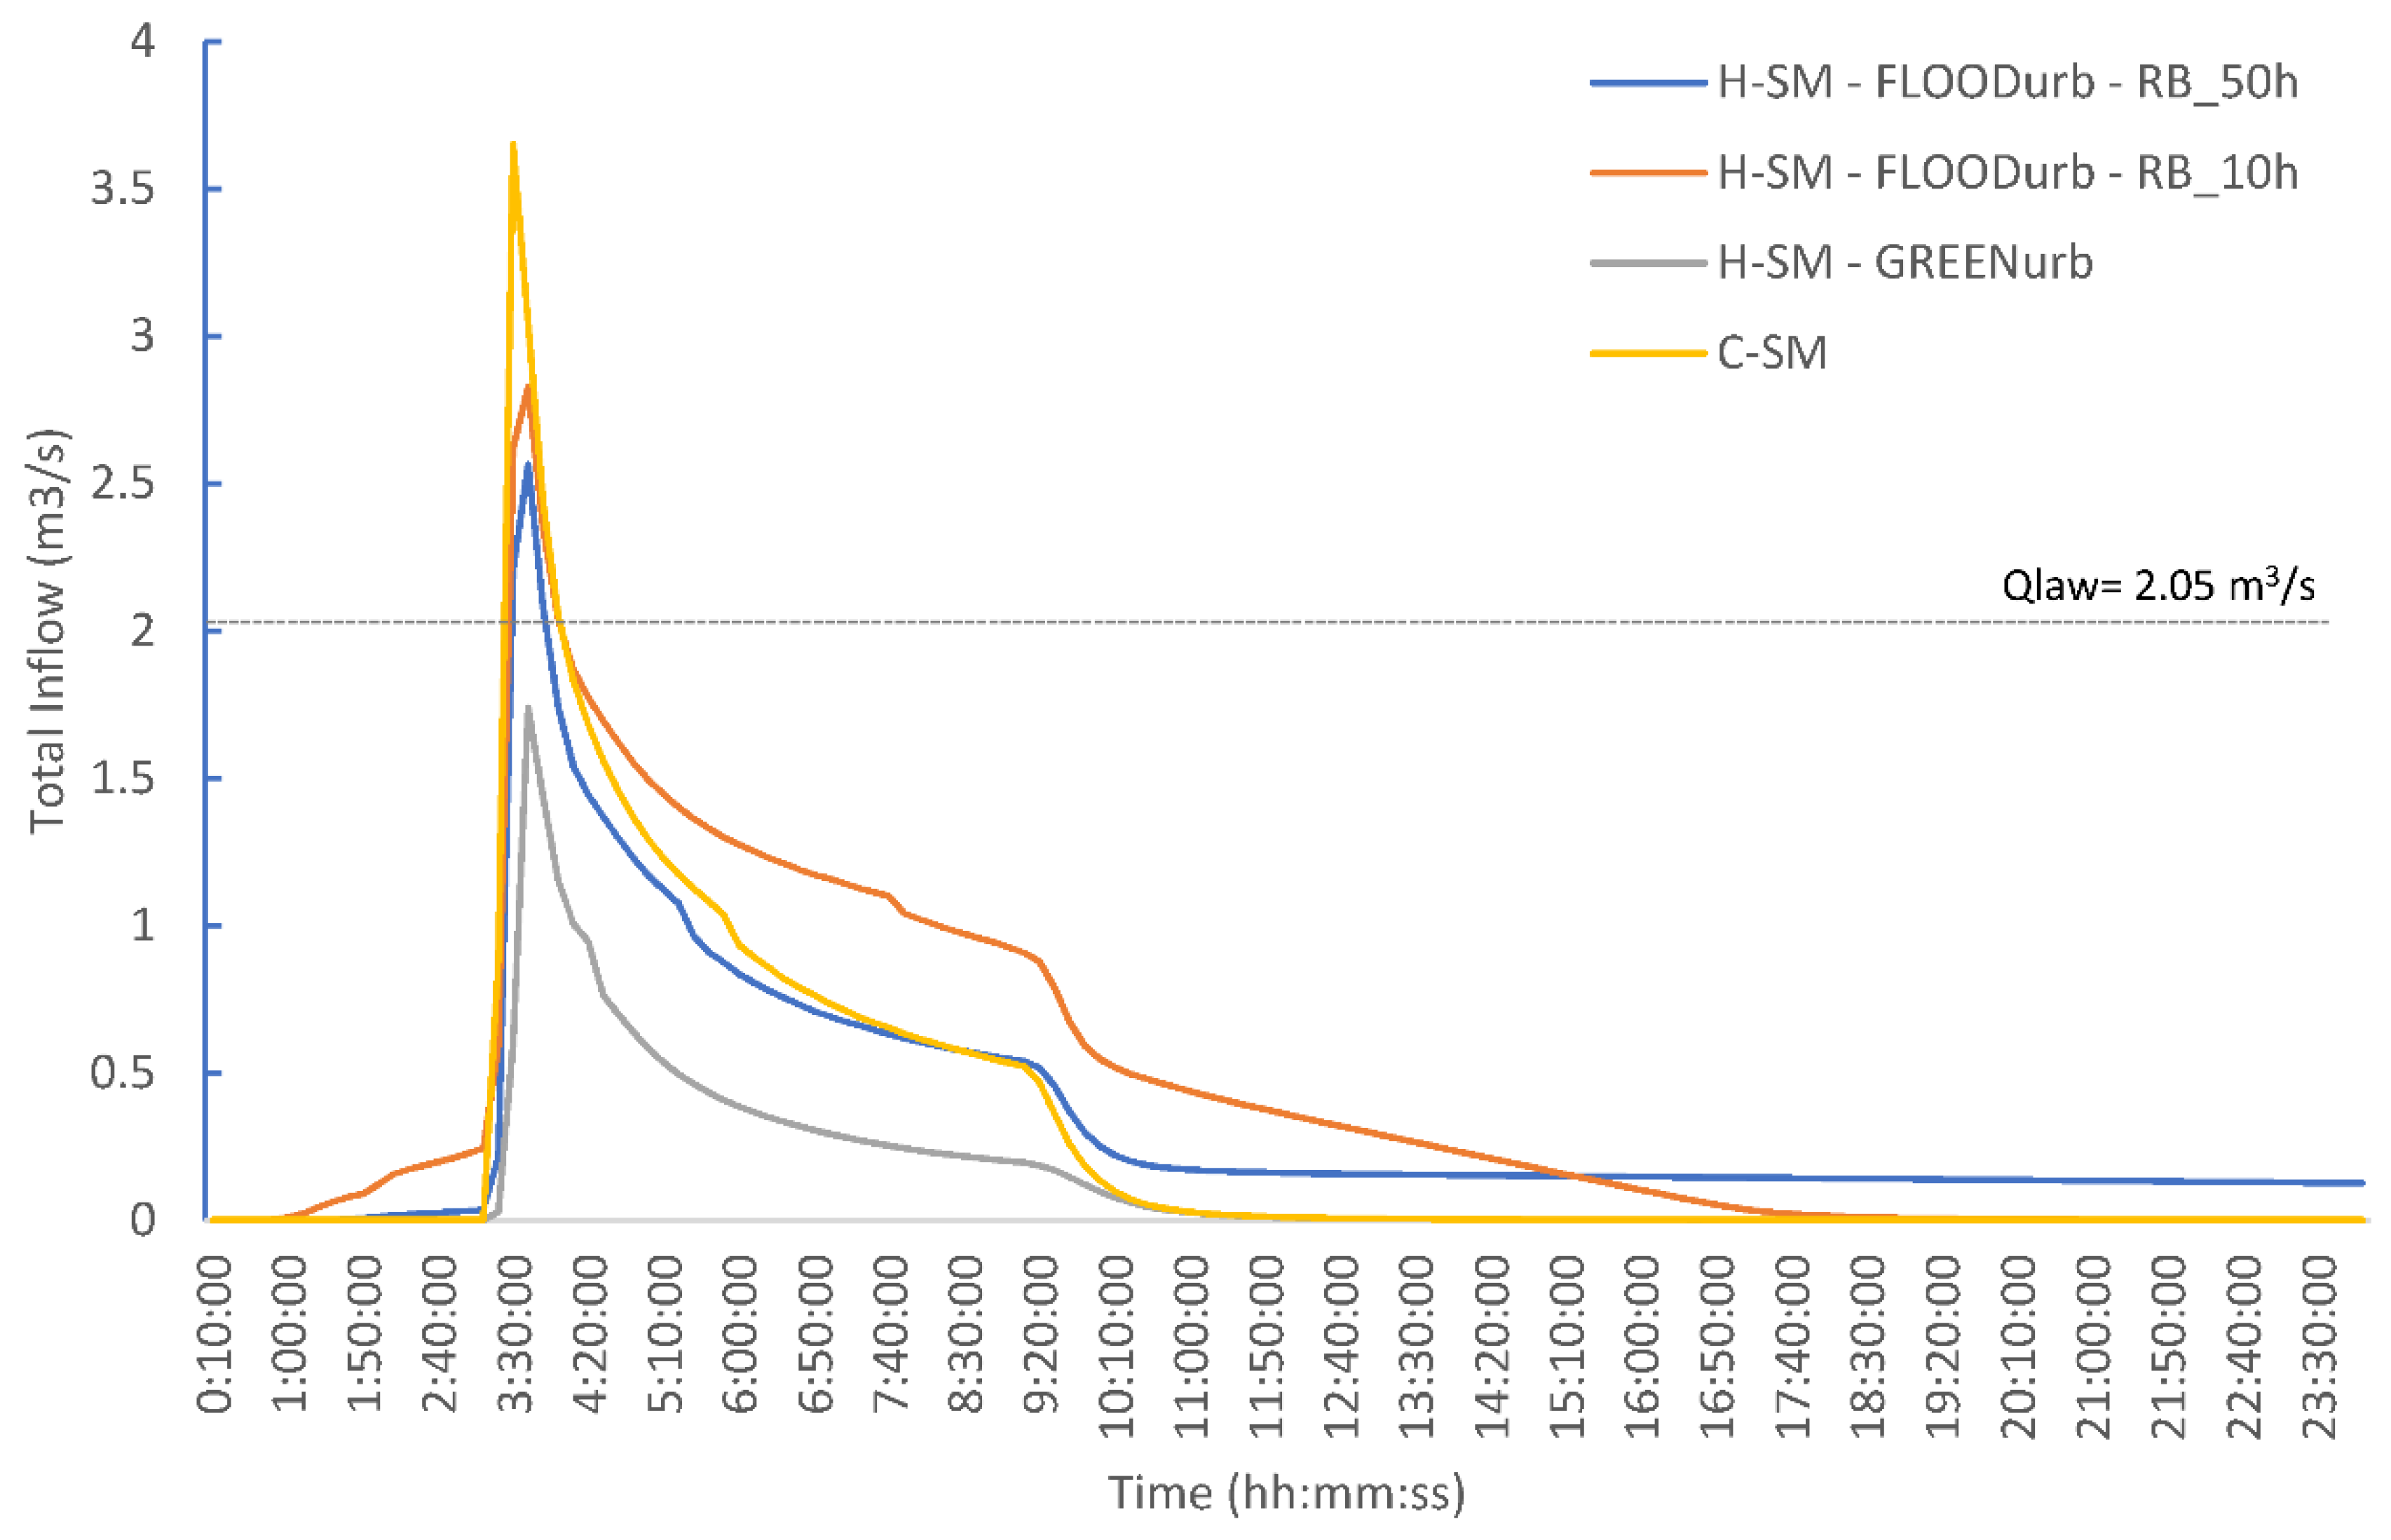
The same considerations also apply for the other CSOs under varying rainfall severity, with the only difference being that under 2-year return-period rainfall, the implementation of the GREENurb hybrid scenario completely avoids the need for stormwater detention tanks (Vlam = 0) (Figure 7).
The overall SWDTs volumes in the C-SM scenario, given by the sum of the Vlam calculated in each CSO, are collected in Table 4.
Overall, observing the results, it is possible to highlight that SWDTs are actually also required under moderate precipitations (2-year return period), which suggests and validates the idea that the flooding risk is a serious concern for the case study area. As expected, total volumes increase as the rainfall severity increases, with a total difference of about 12,000 m3 between the investigated precipitation inputs.
Table 5 collects Vlam identified for each CSOs discharging into SWDT A, B, and C under 2-year rainfall input and for all the investigated H-SM scenarios. The overall SWDTs volumes in the H-SM scenarios and under the mentioned precipitation is also given in the same table. From the results, it is clear that the GREENurb scenario is able to avoid the construction of SWDTs, completely retaining excess stormwater under 2-year return-period precipitation. FLOODurb scenarios also succeed in reducing Vlam. However, the drainage times seem to affect the behavior of floodable streets and squares, experiencing an almost 50% volume reduction, moving from a 10,h draining time to a 50 h draining time.
Table 6 and Table 7 show Vlam in the H-SM scenarios, respectively, under 5-year and 10-year return-period rainfall. With the increase of precipitation severity, higher Vlam values in all the scenarios were registered. Again, the GREENurb scenario showed the best performance, while the FLOODurb scenario with 10 h draining time was the worst.
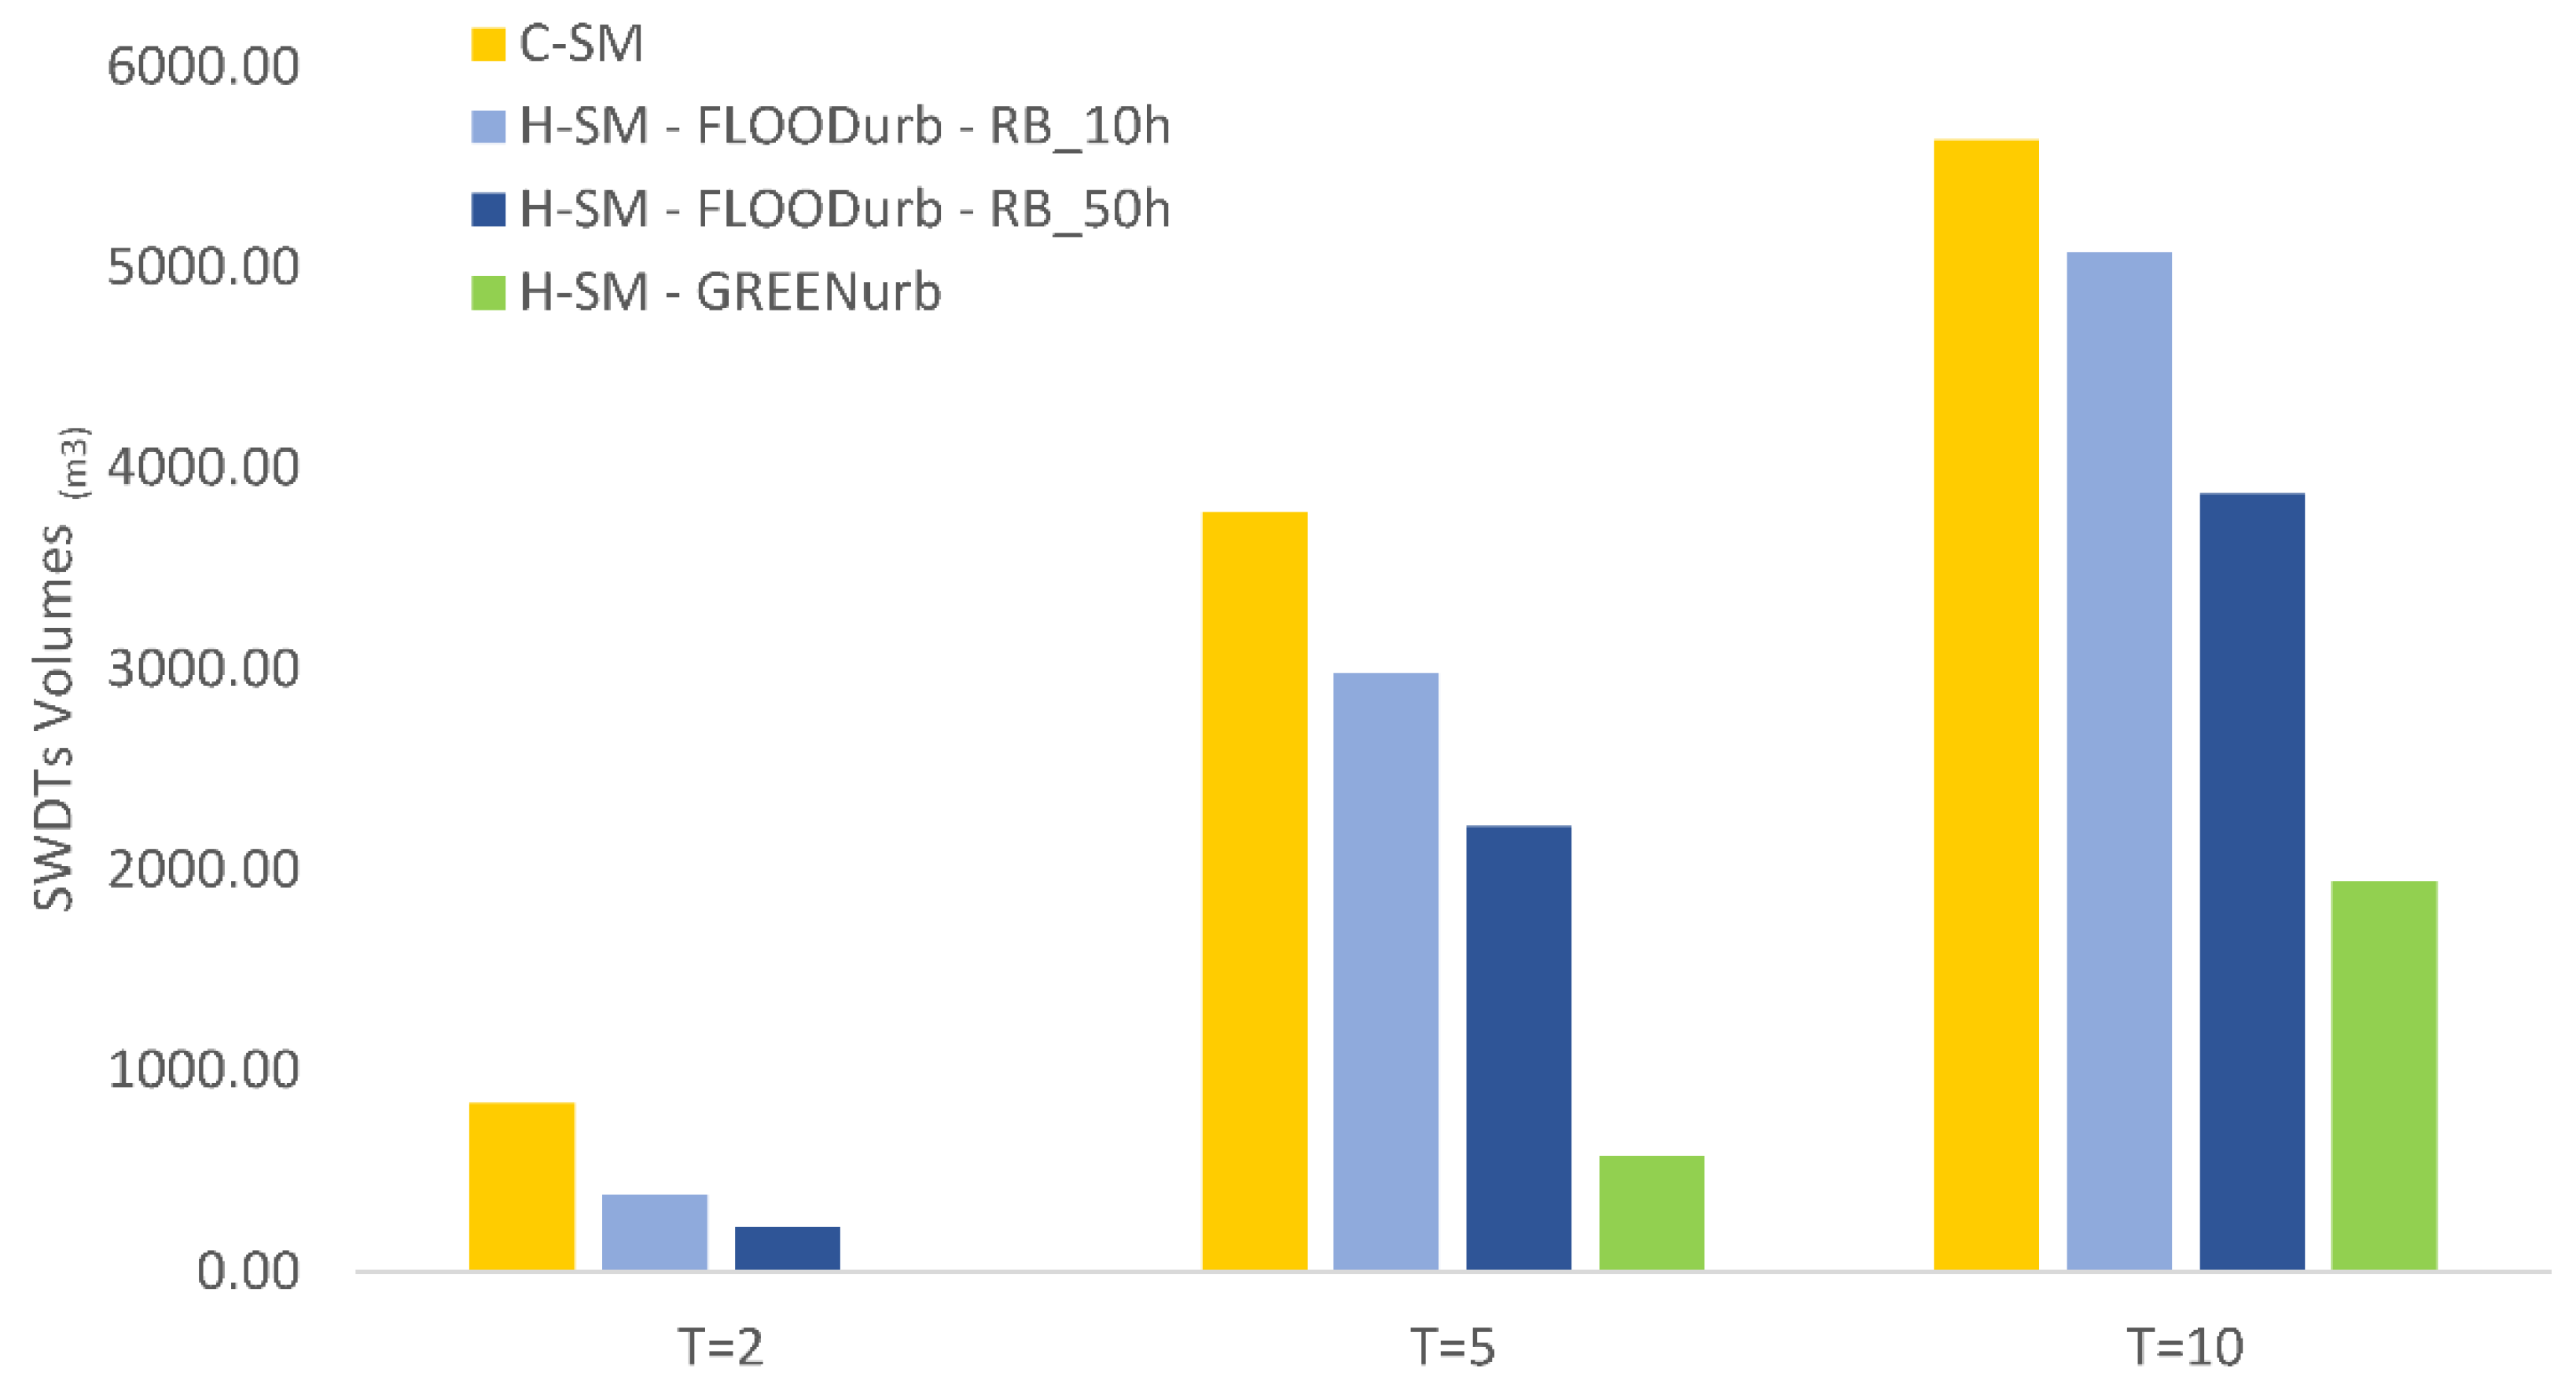
The sum of the Vlam obtained from the CSOs is illustrated in Figure 8 and is useful to enhance differences between the investigated C-SM and H-SM approach. Results, represented with a column chart, are grouped in function of the rainfall input (T = 2, 5, 10).
Observing Figure 8, both FLOODurb and GREENurb hybrid scenarios are able to reduce the Vlam of the C-SM scenario. However, it is again evident that the GREENurb scenario is able to substantially reduce the discharged volumes and even bring them to the halt in the occasion of 2-year return-period rainfalls. As mentioned before, the reason behind this is the presence of LID systems able to convey part of the stormwater runoff into the native soil, significantly decreasing the volume needed for SWDTs. FLOODurb scenarios with 50 h draining time showed better performances when compared with those with 10 h draining time.
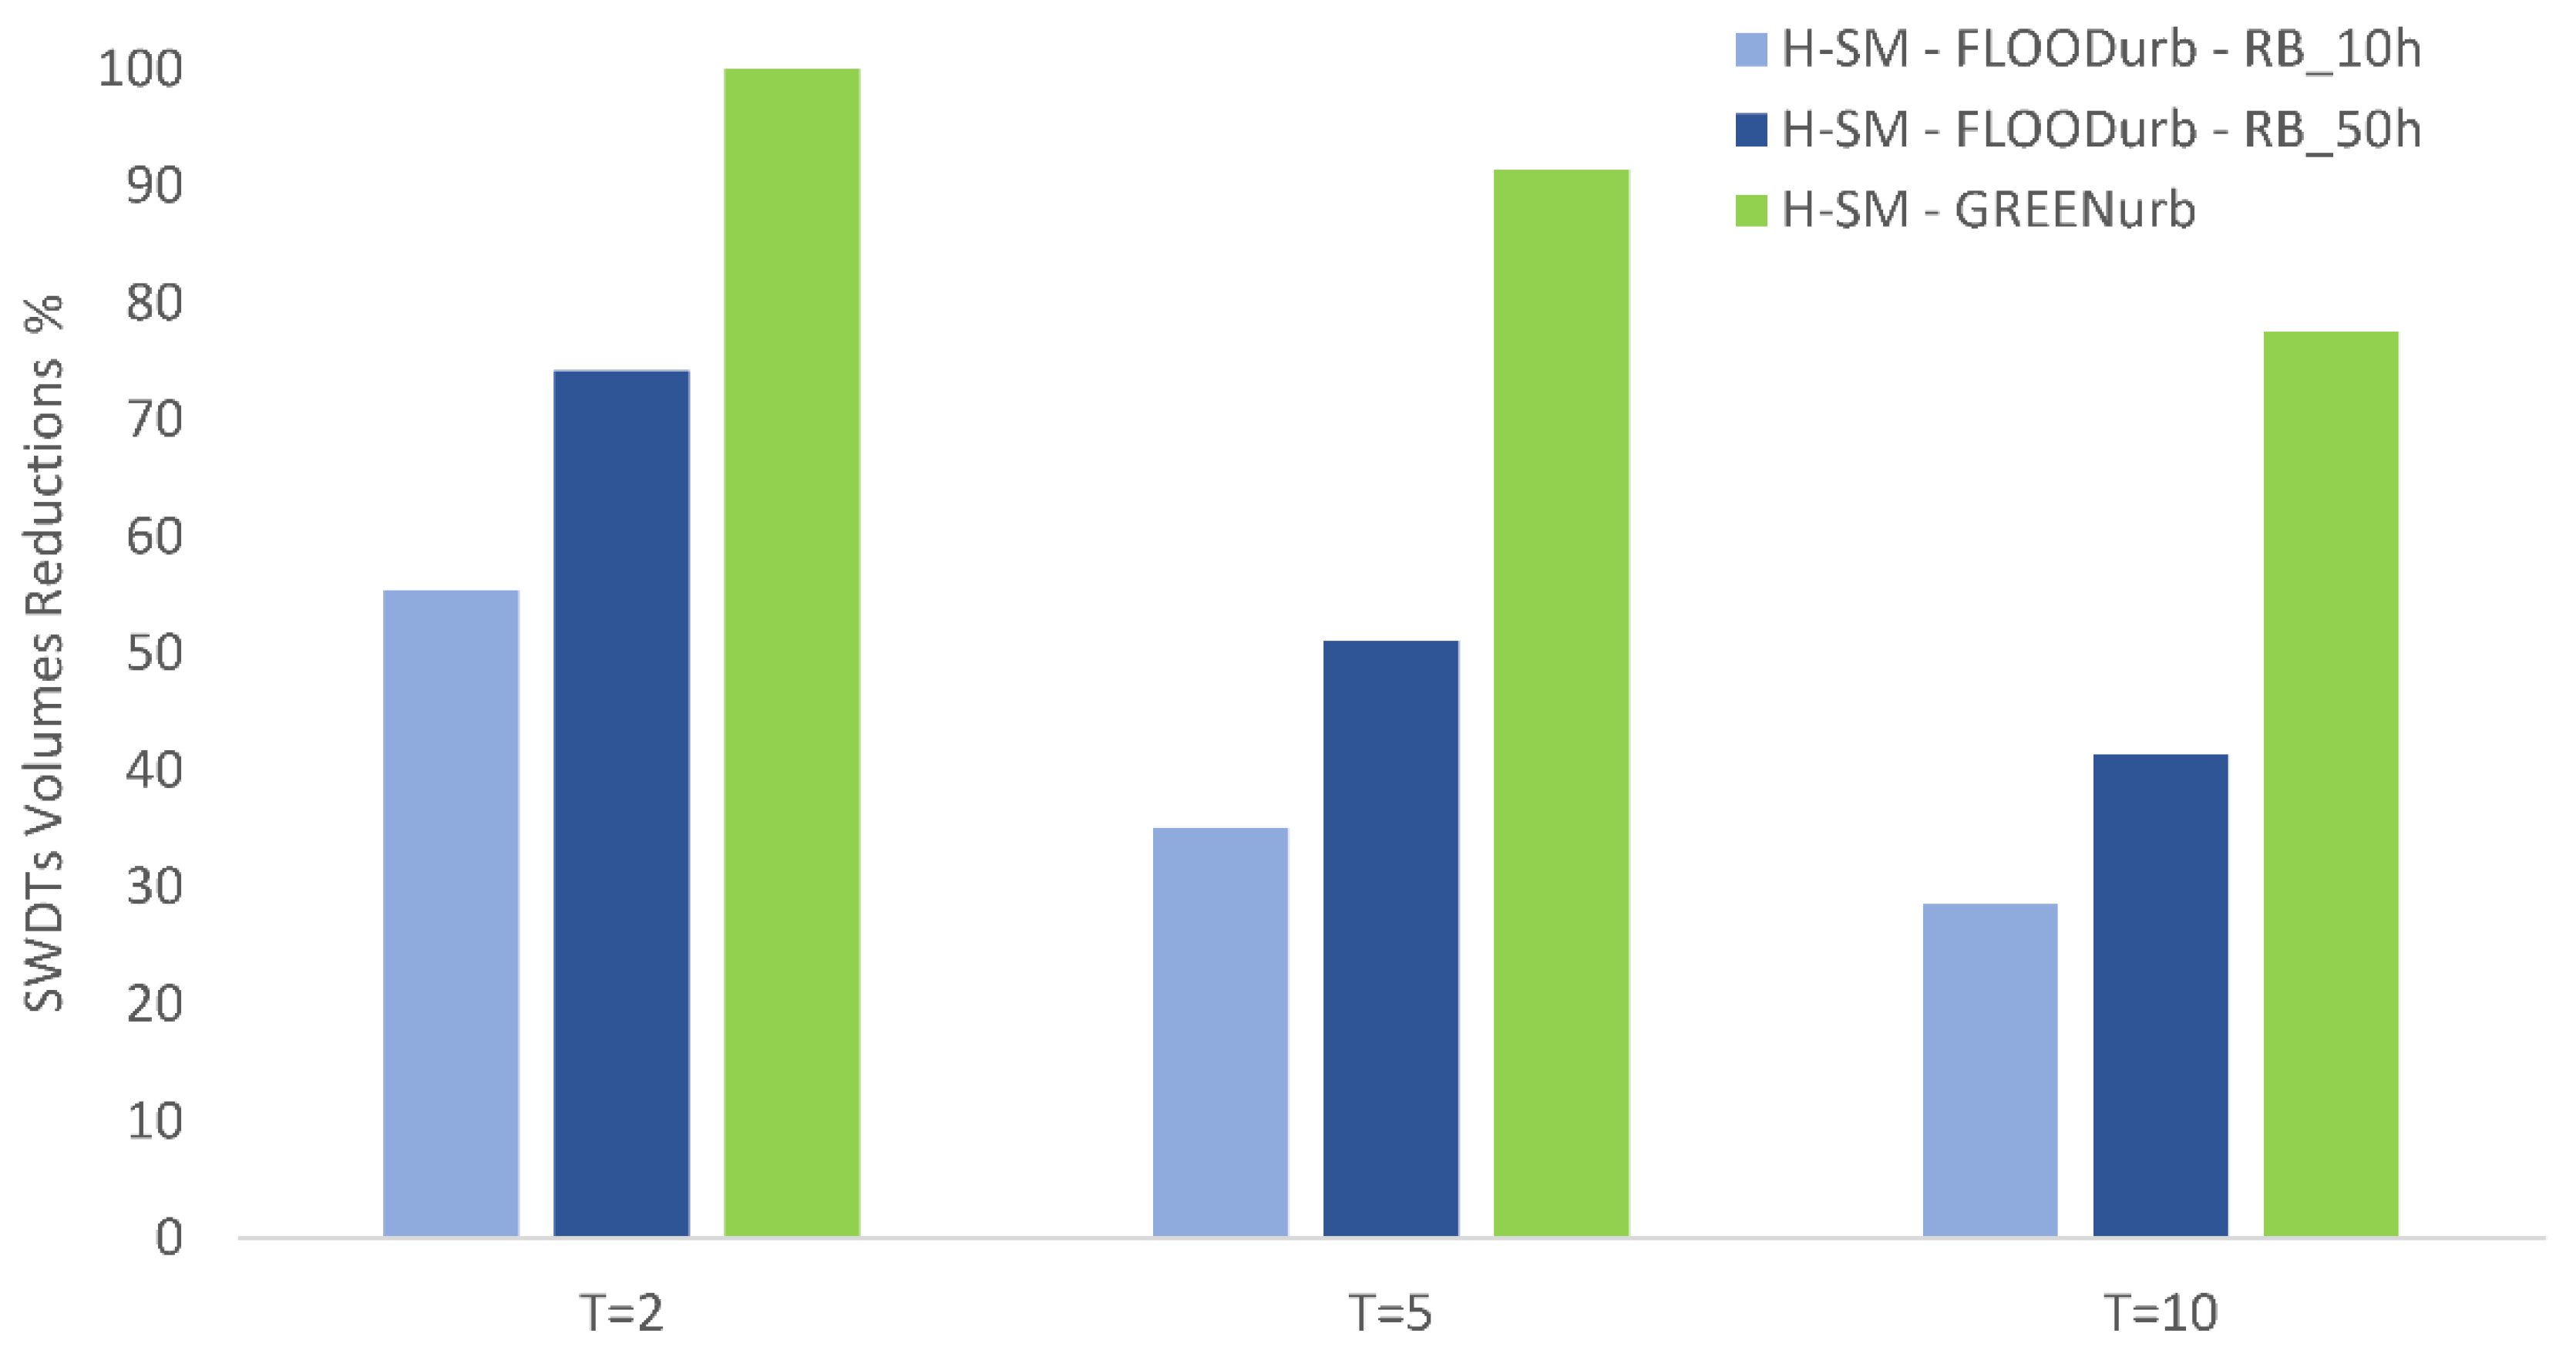
Moreover, the reduction in terms of total SWDTs volumes (Dn(x, T)) was evaluated for each CSO under varying rainfall events, comparing SWDTs volumes in the H-SM scenarios with those obtained in the C-SM reference scenario. The assessment of the reductions helped visualize, even more strongly, the comments mentioned so far. Figure 9 collects average CSOs volumes retentions for each investigated scenario. In summary, GREENurb is confirmed to be the best solution for the reduction of SWDTs volumes, followed by the FLOODurb scenarios, implementing floodable streets and squares with 50 h of draining time. With the increase of rainfall severity, an overall decrease of retention performances can be observed.
Along with hydraulic and hydrological aspects, the performance assessment of sustainable urban drainage scenarios usually involves additional criteria, such as those linked to the economic feasibility of the investment. In this context, multicriteria analyses are essential for the decision-making of urban sustainable development. Therefore, this study foresaw a quantitative and comparative economic assessment of the investigated scenarios, aiming at answering the following question: To what extent can the cost-saving from the SWDTs realization cover the additional expenses of the latter?
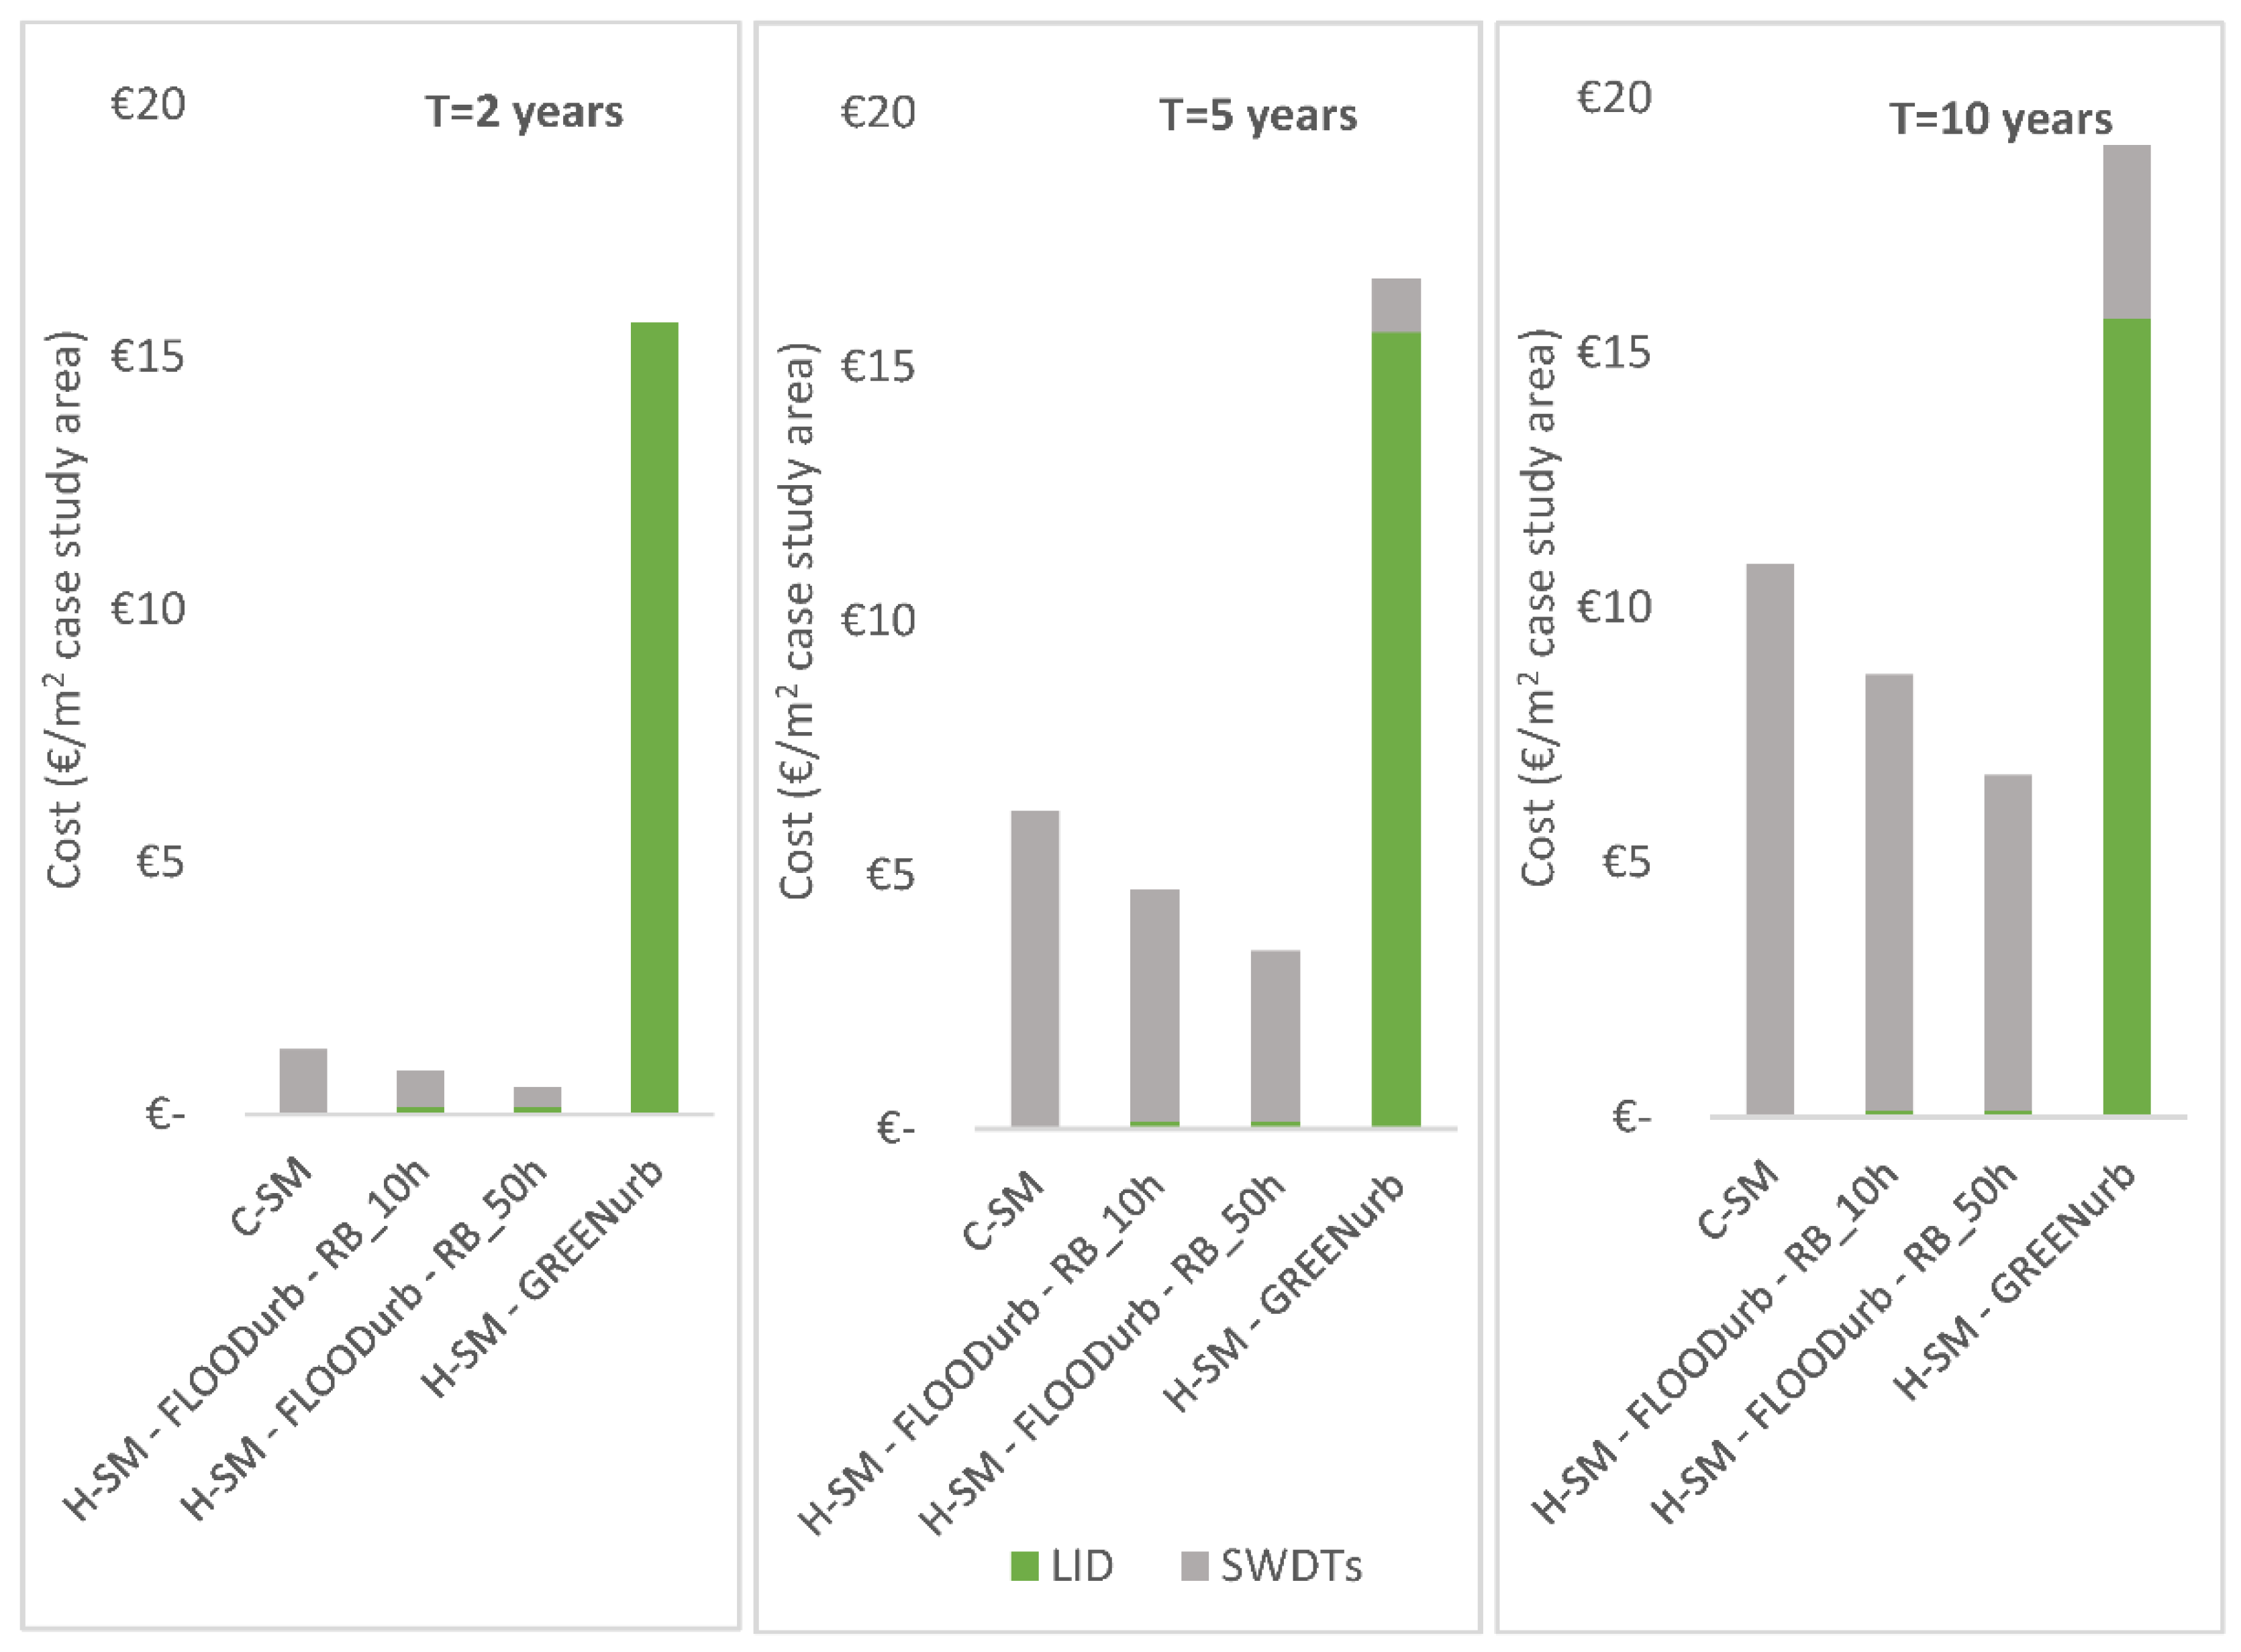
Observing Figure 10, it is possible to note that the costs of each investigated scenario increase with the increase of rainfall severity. GREENurb is always the most expensive scenario, while FLOODurb is the cheapest, independently from the rainfall input.
Moreover, both the FLOODurb H-SM scenarios (RB_10h, RB_50), with a little investment to implement diffuse drainage intervention (colored green in the picture), are able to significantly reduce the volume, and therefore the cost, of SWDTs (colored grey in the picture). On the contrary, the GREENurb scenario seems to increase the overall investment effort due to a higher cost of the LID chosen. However, the plots highlight that implementing this scenario SWDTs can be completely avoided under 2-year return-period rainfalls and significantly reduced under severe precipitations.
More specifically, cost-savings range from a minimum of 20% to a maximum of 59%, obtained under less-severe rainfall and highest draining time. However, it should be noted that the implementation of this scenario should inevitably foresee the participation of stakeholders and citizens in the decisional process to make them aware of the idea of an adaptable and floodable city. The GREENurb approach may also be worth considering, especially under heavy rainfalls. In fact, tackling an investment increase of about 76%, SWDTs volumes will be more than halved and urban context will gain green spaces with their ecosystem services and wide-ranging benefits.

4. Discussion and Conclusions

This research aimed to investigate the effectiveness of hybrid solutions (H-SM) for the management of excess stormwater in a catchment with a combined sewer system and in compliance with local regulations [42]. Specifically, the objective of this analysis was to assess the ability of H-SM approaches to reduce the excess stormwater volumes and, consequently, the storage volumes required. Therefore, a new case study and a scenario-based methodology were proposed, providing an adequate decision-support tool in contexts where there is no availability of real measurements for the calibration of the current drainage network models. According to previous studies [33], findings obtained so far consider the hybrid approach to be the optimal solution for the management of excess rainwater at the urban catchment scale. While considering that LIDs cannot completely solve the problem of urban flooding phenomena on their own, the hybrid and diffuse approach allows reducing the excess stormwater volumes discharged into SWDTs. Several studies focused on the assessment of the most suitable location of SWDTs as a traditional and cost-effective solution to improve the overall performance of the urban drainage system [14,15]. These studies highlighted that a widespread distribution of SWDTs within urban contexts, if compared with their traditional centralized localization, is able to minimize flooding risk, pollutant load, and costs. In this context, this research aimed at understanding what happens if, with specific reference to hydraulic risk mitigation, the same diffuse approach is reached through the implementation of sustainable drainage systems, and which are the effects on the reduction of the volume needed for the SWDTs placed downstream. To this end, as proposed in other studies [35,36], modeling scenarios representative of three hybrid proposals were implemented to identify, by comparison with a benchmark scenario without LID, the best solution for managing the excess stormwater in the urban context of Sesto Ulteriano. Overall, the performances of the proposed scenarios varied according to the typology of LID implemented, their technical properties, and rainfall characteristics. Specifically, the FLOODurb hybrid scenarios (RB_10h, RB_50h), characterized by floodable street and squares with a 10 cm water depth and, respectively, 10 h and 50 h of draining time, are able to significantly reduce excess stormwater volumes to be discharged into SWDTs. However, with the increase of rainfall severity and the decrease of draining time, a decrease in retention performances could be observed. In particular, mean reduction ranged from a maximum of 74%, obtained from the scenario with the highest draining time under the less-severe rainfall, to a minimum of 28%, obtained from the scenario with the lowest draining time under the most severe rainfall. Nevertheless, the GREENurb hybrid scenario obtained the best performances. Even if characterized by a lower retrofitting (8.3% against the 35% of the FLOODurb scenarios), this scenario involves LID able to mime the drainage pattern of natural soils and improve the stormwater runoff infiltration. Again, rainfall characteristics affected the performance of this scenario that reached mean lamination volume reductions ranging from 100% under a 2-year rainfall to 77% under a 10-year rainfall. The modeling approach, however, usually has limitations because it always implies a need to synthesize a large amount of information in a simpler representation of the case study. In this context, model validation procedures are certainly the most effective techniques to ensure that the model faithfully simulates the behavior of reality. In the absence of datasets useful for validating the C-SM model, the one representative of the reality and used as a benchmark, a different approach was undertaken. It was considered interesting carrying out a scenario-based analysis with the objective of assessing the difference between several modeling scenarios representative of an H-SM approach with a C-SM scenario, representative of reality, but which does not essentially have to faithfully reproduce its behavior. Moreover, a sensitivity analysis would be essential in further studies for a better definition of characteristics and behavior of SuDS implemented in the H-SM approaches.
In addition, the preliminary and basic cost-effectiveness analysis also led to interesting results. The latter, solely focusing on economic and hydrological aspects, pointed out that the larger investment effort of the (de)centralized LID could be, in specific cases, overtaken by the cost advantages resulting from the reduction of the SWDTs volumes. In particular, cost-savings, comprehensive of the additional investment cost of LID implementation, ranged from a minimum of 20% to a maximum of 59%, obtained under less-severe rainfall and highest draining time of the FLOODurb scenario. Moreover, even if an investment increase is needed (about 76%, if considering a 10-year rainfall event), the GREENurb approach may also lead to significant reduction of SWDTs volumes, also bringing numerous additional and widely known benefits to the urban context: water quality, urban development, amenity and biodiversity, groundwater supplies recharge, water storage and reuse, and community and recreational benefits [29,49]. In order to quantify these additional benefits, several studies have recently focused on the implementation of multicriteria techniques able to take into account several determinants representative of LID technical, socioeconomic, ecological, and political performance for an integrated assessment of sustainable drainage design in urban catchments [38,41]. Moreover, the UK Environment Agency worked in partnership with the Construction Industry Research and Information Association (CIRIA) to develop a free tool to evaluate the benefits of sustainable urban drainage systems: BeST. This tool aims at supporting the quantification of the value of LID benefits and scenario planning and can also be used to assess longer-term benefits towards future uncertainty [50,51]. The results obtained so far, essentially highlighting the fundamental role of H-SM approaches in the mitigation of excess stormwater discharged, can only be enhanced if included in the context of broader analyses, such as the multicriteria ones. The use of specific tools for the assessment and monetization of the costs of LID, as well as the setup of comprehensive multicriteria assessment, are worth considering for the future analysis on this subject, providing decision-makers with substantial evidence of the effects of H-SM approaches on an urban scale.

Author Contributions

Conceptualization, A.L. and A.R.; methodology, R.D., A.L., A.B. and A.R.; software, R.D.; formal analysis, R.D.; investigation, R.D., A.L. and A.R.; resources, R.D., A.L., A.B. and A.R.; data curation, R.D.; writing—original draft preparation, R.D.; writing—review and editing, R.D. and A.L.; visualization, R.D.; supervision, A.L. and A.R.; project administration, A.L. and A.R. All authors have read and agreed to the published version of the manuscript.

Funding

This research received no external funding.

Conflicts of Interest

The authors declare no conflict of interest.

References

  1. McDaniel, R.; O’Donnell, F.C. Assessment of Hydrologic Alteration Metrics for Detecting Urbanization Impacts. Water 2019, 11, 1017. [Google Scholar] [CrossRef] [Green Version]
  2. Brandolini, P.; Cevasco, A.; Firpo, M.; Robbiano, A.; Sacchini, A. Geo-hydrological risk management for civil protection purposes in the urban area of Genoa (Liguria, NW Italy). Nat. Hazards Earth Syst. Sci. 2012, 12, 943–959. [Google Scholar] [CrossRef] [Green Version]
  3. Pistocchi, A.; Calzolari, C.; Malucelli, F.; Ungaro, F. Soil sealing and flood risks in the plains of Emilia-Romagna, Italy. J. Hydrol. Reg. Stud. 2015, 4, 398–409. [Google Scholar] [CrossRef]
  4. Luino, F.; Turconi, L.; Petrea, C.; Nigrelli, G. Uncorrected land-use planning highlighted by flooding: The Alba case study (Piedmont, Italy). Nat. Hazards Earth Syst. Sci. 2012, 12, 2329–2346. [Google Scholar] [CrossRef] [Green Version]
  5. Apollonio, C.; Balacco, G.; Novelli, A.; Tarantino, E.; Piccinni, A.F. Land Use Change Impact on Flooding Areas: The Case Study of Cervaro Basin (Italy). Sustainability 2016, 8, 996. [Google Scholar] [CrossRef] [Green Version]
  6. Lee, E.H.; Lee, Y.S.; Joo, J.G.; Jung, D.; Kim, J.H. Flood Reduction in Urban Drainage Systems: Cooperative Operation of Centralized and Decentralized Reservoirs. Water 2016, 8, 469. [Google Scholar] [CrossRef]
  7. EU Water Framework Directive. Directive 2000/60/EC 2000. Eur. Parliam. Council. Off. J. L 2000, 327, 1–73. [Google Scholar]
  8. Clean Water Act Action Plan, 33 U.S.C §§ 1251 et seq. U.S. Environmental Protection Agency Office of Enforcement and Compliance Assurance (OECA). 2009. Available online: https://www.epa.gov/compliance/clean-water-act-cwa-action-plan. (accessed on 15 October 2009).
  9. Ehrlich, A. Risk Assessment Guidelines Update 1988. U.S. Environmental Protection Agency, Washington, DC, EPA/600/D-88/264 (NTIS PB89133417). Available online: https://cfpub.epa.gov/ncea/risk/recordisplay.cfm?deid=29777 (accessed on 9 December 2021).
  10. Lombardia Regional Law 12 December 2003 n. 26. Available online: http://normelombardia.consiglio.regione.lombardia.it/normelombardia/Accessibile/main.aspx?iddoc=lr002003121200026&view=showdoc (accessed on 9 December 2021).
  11. Calabrò, P.S.; Viviani, G. Simulation of the operation of detention tanks. Water Res. 2006, 40, 83–90. [Google Scholar] [CrossRef]
  12. Todeschini, S.; Papiri, S.; Ciaponi, C. Performance of stormwater detention tanks for urban drainage systems in northern Italy. J. Environ. Manag. 2012, 101, 33–45. [Google Scholar] [CrossRef]
  13. Li, F.; Duan, H.F.; Yan, H.; Tao, T. Multi-Objective Optimal Design of Detention Tanks in the Urban Stormwater Drainage System: Framework Development and Case Study. Water Resour. Manag. 2015, 29, 2125–2137. [Google Scholar] [CrossRef]
  14. Wang, M.; Sun, Y.; Sweetapple, C. Optimization of storage tank locations in an urban stormwater drainage system using a two-stage approach. J. Environ. Manag. 2017, 204, 31–38. [Google Scholar] [CrossRef] [PubMed]
  15. Fu, G.; Khu, S.; Butler, D. Optimal Distribution and Control of Storage Tank to Mitigate the Impact of New Developments on Receiving Water Quality. J. Environ. Eng. 2010, 136, 335–342. [Google Scholar] [CrossRef]
  16. Di Matteo, M.; Liang, R.; Maier, H.R.; Thyer, M.A.; Simpson, A.R.; Dandy, G.C.; Ernst, B. Controlling rainwater storage as a system: An opportunity to reduce urban flood peaks for rare, long duration storms. Environ. Model. Softw. 2019, 111, 34–41. [Google Scholar] [CrossRef]
  17. Liang, R.; Di Matteo, M.; Maier, H.R.; Thyer, M.A. Real-Time, Smart Rainwater Storage Systems: Potential Solution to Mitigate Urban Flooding. Water 2019, 11, 2428. [Google Scholar] [CrossRef] [Green Version]
  18. Sitzenfrei, R.; Möderl, M.; Rauch, W. Assessing the impact of transitions from centralized to decentralized water solutions on existing infrastructures—Integrated city-scale analysis with VIBe. Water Res. 2013, 47, 7251–7263. [Google Scholar] [CrossRef] [Green Version]
  19. Sharma, A.; Burn, S.; Gardner, T.; Gregory, A. Role of decentralized systems in the transition of urban water systems. Water Supply 2010, 10, 577–583. [Google Scholar] [CrossRef]
  20. La Loggia, G.; Fontanazza, C.M.; Freni, G.; Notaro, V.; Olivieri, E.; Puleo, V. Urban drainage and sustainable cities: How to achieve flood resilient societies? WIT Trans. Built Environ. 2012, 122, 203–214. [Google Scholar] [CrossRef] [Green Version]
  21. Larsen, T.A.; Hoffman, S.; Luthi, C.; Truffer, B.; Maurer, M. Emerging solutions to the water challenges of an urbanizing world. Science 2016, 352, 928–933. [Google Scholar] [CrossRef]
  22. Versini, P.A.; Kotelnikova, N.; Poulhes, A.; Tchiguirinskaia, I.; Schertzer, D.; Leurent, F. A distributed modelling approach to assess the use of Blue and Green Infrastructures to fulfil stormwater management requirements. Landsc. Urban Plan. 2018, 173, 60–63. [Google Scholar] [CrossRef] [Green Version]
  23. Fletcher, T.D.; Shuster, W.; Hunt, W.F.; Ashley, R.; Butler, D.; Arthur, S.; Trowsdale, S.; Barraud, S.; Semadeni-Davies, A.; Bertrand-Krajewski, J.L.; et al. SUDS, LID, BMPs, WSUD and more—The evolution and application of terminology surrounding urban drainage. Urban Water J. 2015, 12, 525–542. [Google Scholar] [CrossRef]
  24. Johannessen, B.G.; Muthanna, T.M.; Braskerud, B.C. Detention and Retention Behavior of Four Extensive Green Roofs in Three Nordic Climate Zones. Water 2018, 10, 671. [Google Scholar] [CrossRef] [Green Version]
  25. Ghofrani, Z.; Sposito, V.; Faggian, R. Modelling the impacts of blue-green infrastructure on rainfall runoff: A case study of Eastern Victoria, Australia. Int. J. Water 2019, 13, 151. [Google Scholar] [CrossRef]
  26. Longobardi, A.; D’Ambrosio, R.; Mobilia, M. Predicting Stormwater Retention Capacity of Green Roofs: An Experimental Study of the Roles of Climate, Substrate Soil Moisture, and Drainage Layer Properties. Sustainability 2019, 11, 6956. [Google Scholar] [CrossRef] [Green Version]
  27. Mobilia, M.; D’Ambrosio, R.; Longobardi, A.; Claverie, R. Substrate soil moisture impact on green roof performance for an experimental site in Tomblaine, France. In Proceedings of the Computational Science and Its Applications—ICCSA 2021, Cagliari, Italy, 13–16 September 2021; Volume 12950, pp. 564–570. [Google Scholar] [CrossRef]
  28. D’Ambrosio, R.; Mobilia, M.; Khamidullin, F.I.; Longobardi, A.; Elizaryev, A.N. How substrate and drainage layer materials affect the hydrological performance of Green Roofs: CHEMFLO-2000 numerical investigation. In Proceedings of the Computational Science and Its Applications—ICCSA 2021, Cagliari, Italy, 13–16 September 2021; Volume 12956, pp. 254–263. [Google Scholar] [CrossRef]
  29. Woods Ballard, B.; Wilson, S.; Udale-Clarke, H.; Illman, S.; Scott, T.; Ashley, R.; Kellagher, R. The SuDS Manual; Construction Industry Research & Information Association (CIRIA): London, UK, 2015. [Google Scholar]
  30. Scholz, M. Sustainable Drainage Systems. Water 2015, 7, 2272–2274. [Google Scholar] [CrossRef] [Green Version]
  31. D’Ambrosio, R.; Longobardi, A.; Mobilia, M.; Sassone, P. Sustainable strategies for flood risk management in urban areas. Enhancing city resilience with Green Roofs. UPLanD J. Urban Plan. Landsc. Environ. Des. 2020, 5, 87–98. [Google Scholar]
  32. Bell, S. Urban Water Sustainability. Constructing Infrastructure for Cities and Nature; Routledge: London, UK, 2018. [Google Scholar]
  33. Dong, X.; Guo, H.; Zeng, S. Enhancing future resilience in urban drainage system: Green versus grey infrastructure. Water Res. 2017, 124, 280–289. [Google Scholar] [CrossRef]
  34. Butler, D.; McEntee, B.; Onof, C.; Hagger, A. Sewer storage tank performance under climate change. Water Sci. Technol. 2007, 56, 29–35. [Google Scholar] [CrossRef] [PubMed]
  35. Zhang, K.; Chui, T.F.M. A comprehensive review of spatial allocation of LID-BMP-GI practices: Strategies and optimization tools. Sci. Total Environ. 2018, 621, 915–929. [Google Scholar] [CrossRef] [PubMed]
  36. Kapetas, L.; Fenner, R. Integrating blue-green and grey infrastructure through an adaptation pathways approach to surface water flooding. Phil. Trans. R. Soc. A 2020, 378, 20190204. [Google Scholar] [CrossRef] [Green Version]
  37. D’Ambrosio, R.; Rizzo, A.; Longobardi, A.; Balbo, A. Re-think urban drainage following a SuDS retrofitting approach against urban flooding: A modelling investigation for an Italian case study. Urban For. Urban Green. under review.
  38. Yang, W.; Zhang, J. Assessing the performance of gray and green strategies for sustainable urban drainage system development: A multi-criteria decision making analysis. J. Clean. Prod. 2021, 293, 126191. [Google Scholar] [CrossRef]
  39. Dada, A.; Urich, C.; Berteni, F.; Pezzagno, M.; Piro, P.; Grossi, G. Water Sensitive Cities: An Integrated Approach to Enhance Urban Flood Resilience in Parma (Northern Italy). Climate 2021, 9, 152. [Google Scholar] [CrossRef]
  40. Bakhshipour, A.E.; Dittmer, U.; Haghighi, A.; Nowak, W. Toward Sustainable Urban Drainage Infrastructure Planning: A Combined Multiobjective Optimization and Multicriteria Decision-Making Platform. J. Water Res. Plan. Manag. 2021, 147, 04021049. [Google Scholar] [CrossRef]
  41. Radinja, M.; Comas, J.; Corominas, L.; Atanasova, N. Assessing stormwater control measures using modelling and a multi-criteria approach. J. Environ. Manag. 2019, 243, 257–268. [Google Scholar] [CrossRef]
  42. Regulation Containing Criteria and Methods for Compliance with the Principle of Hydraulic and Hydrological Invariance According to Regional law n.12 of 11 March 2005, Lombardia Region Regional Regulation n.7 of the 23 November 2017. Available online: http://normelombardia.consiglio.regione.lombardia.it/normelombardia/Accessibile/main.aspx?view=showsum&iddoc=rr002017112300007 (accessed on 9 December 2021).
  43. Rossman, L.; Huber, W. Storm Water Management Model Reference Manual Volume III—Water Quality; U.S. EPA Office of Research and Development: Washington, DC, USA, 2016.
  44. Zhang, L.; Lu, Q.; Ding, Y.; Peng, P. Design and Performance Simulation of Road Bioretention Media for Sponge Cities. J. Perform. Constr. Facil. 2018, 32, 04018061. [Google Scholar] [CrossRef]
  45. Yang, Y.; Chui, T.F.M. Rapid Assessment of Hydrologic Performance of Low Impact Development Practices under Design Storms. J. Am. Water Resour. Assoc. 2018, 54, 613–630. [Google Scholar] [CrossRef]
  46. Palla, A.; Gnecco, I. Hydrologic modeling of Low Impact Development systems at the urban catchment scale. J. Hydrol. 2015, 528, 361–368. [Google Scholar] [CrossRef]
  47. Wu, J.; Yang, R.; Song, J. Effectiveness of low-impact development for urban inundation risk mitigation under different scenarios: A case study in Shenzhen, China. Nat. Hazards Earth Syst. Sci. 2018, 18, 2525–2536. [Google Scholar] [CrossRef] [Green Version]
  48. Liao, X.; Zheng, J.; Huang, C.; Huang, J. Approach for Evaluating LID Measure Layout Scenarios Based on Random Forest: Case of Guangzhou—China. Water 2018, 10, 894. [Google Scholar] [CrossRef] [Green Version]
  49. Huber, J. Low Impact Development: A Design Manual for Urban Areas; University of Arkansas Community Design Center, University of Arkansas Press: Fayetteville, AR, USA, 2010. [Google Scholar]
  50. Ashley, R.M.; Digman, J.D.; Horton, B.; Gersonius, B.; Smith, B.; Shaffer, P.; Baylis, A. Evaluating the longer term benefits of sustainable drainage. Proc. Inst. Civ. Eng. Water Manag. 2018, 171, 57–66. [Google Scholar] [CrossRef]
  51. Rizzo, A.; Conte, G.; Masi, F. Adjusted Unit Value Transfer as a Tool for Raising Awareness on Ecosystem Services Provided by Constructed Wetlands for Water Pollution Control: An Italian Case Study. Int. J. Environ. Res. Public Health 2021, 18, 1531. [Google Scholar] [CrossRef] [PubMed]
Figure 1. Identification of the case study area with its subdivision into three macro-catchments (a) and drainage network (b).
Water 13 03635 g001
Figure 2. Localization of SWDTs.
Water 13 03635 g002
Figure 3. Localization of floodable streets and squares in the diffuse-storage approach.
Water 13 03635 g003
Figure 4. Catchment C (a), subdivision into subcatchments (b), and SuDS distribution within the subcatchments (c).
Water 13 03635 g004
Figure 5. Hydrographs CSO 1019 (Catchment A) under 10-year rainfall event.
Water 13 03635 g005
Figure 6. Over threshold volumes (Vlam) CSO 1019 (Catchment A) under 10-year rainfall event.
Water 13 03635 g006
Figure 7. Hydrographs CSO 1019 under 2-year rainfall event.
Water 13 03635 g007
Figure 8. Stormwater detention tanks total volumes: a comparison between the investigated C-SM and H-SM scenarios.
Water 13 03635 g008
Figure 9. Mean reductions of stormwater volumes to be discharged into SWDTs (D).
Water 13 03635 g009
Figure 10. Cost of implementation of each investigated scenario under 2-year, 5-year, and 10-year return-period rainfalls and standardized as a function of the whole case study area (m2).
Water 13 03635 g010
Table 1. Floodable streets and industrial squares simulated as rain barrel LID control: input parameters.
Storage LAYER ParametersRB_10RB_50
Barrel height (mm)100100
Drain Parameters
Flow coefficient10.2
Flow exponent0.50.5
Table 2. SuDS percentages and distribution.
Catch.Area (ha)Area (m2)SuDS TypeSuDS (m2)SuDS (%) *
A104.821,048,200Bior. Cells15,179.171.448118069
Perv. Pavements25,469.482.429829838
Rain Gardens51,601.944.922909794
Total92,250.598.80
Catch.Area (ha)Area (m2)SuDS TypeSuDS (m2)SuDS (%) *
B63.62636,200Bior. Cells8250.111.296779315
Perv. Pavements16,980.012.668973593
Rain Gardens50,754.787.977802578
Total75,984.9011.94
Catch.Area (ha)Area (m2)SuDS TypeSuDS (m2)SuDS (%) *
C58.84588,400Bior. Cells5473.440.930224337
Perv. Pavements23,210.293.944644799
Rain Gardens39,672.326.742406526
Total68,356.0511.62
Total Area (ha)Total Area (m2) SuDS (m2)SuDS (%) **
A + B + C227.282,272,800-236,591.5410.41
Note(s): * SuDS percentages were computed as the ratio between SuDS area and the catchment area (Catch. = catchments; Bior. Cells = bioretention cells; Perv. Pavements = permeable pavements). ** Total SuDS percentages were computed as the ratio between total SuDS area and the total area.
Table 3. Bioretention cell and permeable pavement LID control input parameters.
Bioretention CellPerm. Pavement
Surface LAYER parameters
Berm height (mm)100–700 *0
Vegetation volume fraction0.2
Surface roughness (Manning’s n) 0.011
Surface slope (%) 1
Pavement LAYER parameters
Thickness (mm) 30
Void ratio (voids/solids) 0.25
Permeability (mm/h) 1968.5
Soil LAYER parameters
Thickness (mm)250–45040
Porosity (volume fraction)0.350.3
Field capacity (volume fraction)0.110.2
Wilting point (volume fraction)0.10.08
Conductivity (mm/h)108444.5
Conductivity Slope--
Suction Head (mm)5076.2
Storage LAYER parameters
Thickness (mm)250–450100
Void Ratio (voids/solids)0.350.25
Seepage Rate (mm/h)3220
Clogging Factor --
Note(s): * Higher berm heights were used to simulate lamination effects of the larger rain gardens.
Table 4. Stormwater detention tanks volumes in the centralized scenario.
C-SMT = 2T = 5 (Years)T = 10
CatchmentCSO IDAimp (ha)Qlaw (L/s)Qlaw (m3/s)Vlam (m3)
A101951.22048.002.051776.508309.7114,716.63
B28624.8192.000.190.0085.411148.10
28525.9237.200.2410.43542.161287.50
J719.3772.000.77577.642685.573857.20
31550.312.000.0118.7078.23112.96
28611.144.000.040.00111.66307.12
C286312.3492.000.490.000.000.00
352014.7588.000.59835.193781.625632.84
Total3218.4615,594.3627,062.36
Table 5. Stormwater detention tanks volumes in the hybrid scenario for a 2-year return-period rainfall.
T = 2 YearsFLOODurb Vlam (m3)GREENurb Vlam (m3)
CatchmentCSO IDRB_10RB_50Gu
A1019988.68421.160.00
B28620.000.000.00
28520.000.000.00
J7426.38305.630.00
31559.024.980.00
28610.000.000.00
C28630.000.000.00
3520381.46217.120.00
Total1805.54948.890.00
Table 6. Stormwater detention tanks volumes in the hybrid scenario for a 5-year return-period rainfall.
T = 5 YearsFLOODurb Vlam (m3)GREENurb Vlam (m3)
CatchmentCSO IDRB_10RB_50Gu
A10196335.844507.611997.04
B286221.926.930.00
2852228.49161.220.00
J71671.521334.190.00
315563.3555.2414.10
286198.6079.824.02
C28630.000.000.00
35202979.682215.33570.00
Total11,399.418360.352585.16
Table 7. Stormwater detention tanks volumes in the hybrid scenario for a 10-year return-period rainfall.
T = 10 YearsFLOODurb Vlam (m3)GREENurb Vlam (m3)
CatchmentCSO IDRB_10RB_50Gu
A101911,972.118951.155393.76
B2862429.68324.350.00
2852655.69547.500.00
J72800.642375.741020.30
315597.8085.4842.78
2861250.76225.7268.52
C28630.000.000.00
35205073.703873.841941.90
Total21,280.3916,383.788467.26
Publisher’s Note: MDPI stays neutral with regard to jurisdictional claims in published maps and institutional affiliations.

