
Light or Dark Greywater for Water Reuse? Economic Assessment of On-Site Greywater Treatment Systems in Rural Areas


1
Departamento de Química Inorgánica, Facultad de Química y de Farmacia, Pontificia Universidad Católica de Chile, Avenida Vicuña Mackenna 4860, Macul, Santiago 7820436, Chile
2
Departamento de Ingeniería Hidráulica y Ambiental, Pontificia Universidad Católica de Chile, Avenida Vicuña Mackenna 4860, Macul, Santiago 7820436, Chile
3
Instituto de Geografía, Pontificia Universidad Católica de Chile, Avenida Vicuña Mackenna 4860, Santiago 7820436, Chile
4
Escuela de Biotecnología, Universidad Mayor, Camino La Pirámide 5750, Huechuraba, Santiago 8580745, Chile
*
Author to whom correspondence should be addressed.
Water 2021, 13(24), 3637; https://doi.org/10.3390/w13243637
Submission received: 15 November 2021
/
Revised: 10 December 2021
/
Accepted: 13 December 2021
/
Published: 17 December 2021
(This article belongs to the Special Issue Urban Wastewater Reuse – Challenges, Risks and Opportunities)
Abstract
:Water scarcity is causing a great impact on the population. Rural areas are most affected by often lacking a stable water supply, being more susceptible to the impact of drought events, and with greater risk of contamination due to the lack of appropriate water treatment systems. Decentralized greywater treatment systems for water reuse in rural areas can be a powerful alternative to alleviate these impacts. However, the economic feasibility of these systems must be thoroughly evaluated. This study reports an economic analysis carried out on the viability of greywater reuse considering scenarios with light greywater or dark greywater to be treated. For this, data obtained from the assembly and monitoring of greywater treatment systems located in the north-central zone of Chile, supplemented with data obtained from the literature were used. The results showed that both scenarios are not economically viable, since the investment and operating costs are not amortized by the savings in water. In both evaluated cases (public schools), the economic indicators were less negative when treating light greywater compared with the sum of light greywater and dark greywater as the inlet water to be treated. The investment and operating costs restrict the implementation of these water reuse systems, since in the evaluation period (20 years) a return on the initial investment is not achieved. Even so, our results suggest that the best alternative to reuse greywater in small-scale decentralized systems is to treat light greywater, but it is necessary to consider a state subsidy that not only supports capital costs but also reduces operating and maintenance costs. These findings support the idea that the type of water to be treated is a factor to consider in the implementation of decentralized greywater treatment systems for the reuse of water in rural areas and can help decision-making on the design and configuration of these systems.
1. Introduction
Water scarcity is a global problem that has intensified in recent years. A decrease in water availability affects more and more cities around the world [1]. Rural areas are more exposed to pressures on water resources and require measures to reduce water demand [2]. As water resources become scarcer and it becomes more difficult to meet global demand, efforts are being made to improve efficiency in water management. Among the approaches developed to address this problem, the reuse of water and the search for alternative sources have emerged as options [3,4]. Recently, an alternative that that has been explored is the reuse of greywater [5]. Indeed, several successful greywater reuse projects have been developed in countries such as Australia, Japan, Canada, Spain, and China. In addition, it has been shown that the reuse of water can present an opportunity to improve the availability of water resources in urban and rural areas [5,6]. Despite this, the economic and technological sustainability of these systems must be adequately evaluated to determine if the greywater reuse systems can be sustainable in the long term.
Greywater is broadly defined as wastewater generated by domestic uses that includes water from showers, sinks, washing machines, dishwashers, and kitchen sinks. These waters are distinguished from the ‘black waters’ coming from toilets [7]. One of the advantages of the reuse of greywater is the better water quality compared to black water, and therefore the level of complexity of the treatment systems is lower. In addition, the volumes of greywater generated in homes can reach up to 60–70% of the water in a house. The quality standards of greywater are quite high and the reuse of greywater can considerably reduce the pressures on better quality water resources, such as drinking water. In addition, the reuse of greywater can reduce the treatment costs of cities, such as the use of sewers or the necessary energy requirements for more complex treatment processes in sewage treatment plants (e.g., activated sludge, aeration) [5,8,9,10]. Treated greywater has multiple potential uses, such as garden irrigation or toilet recharging [5,11], but its final application will depend on the quality standards and regulations imposed by each country for the reuse of greywater [12]. Despite the benefits of greywater reuse, its potential will depend on the characteristics of the treatment systems and the local conditions of each site or locality where these systems are implemented.
The types of greywaters differ according to the source they come from, which can determine different scenarios and treatment alternatives. Greywaters that include waters from bathroom sinks, baths and showers are called ‘light greywater’, while greywaters that also include waters from laundry facilities, dishwashers and kitchen sinks are more polluted and are called ‘dark greywater’ [11,13]. This differentiation has marked impacts on the complexity of treatment systems and the potentially reusable volume of greywater. Several authors suggest that the reuse of light greywater is preferable due to there being fewer complexities involved in its treatment and the reduction in the costs of the treatment systems.
Our recent works have shown that one of the crucial aspects and one of the great barriers for the reuse of greywater through decentralized systems is economic feasibility [6]. The economic factor and poverty, as well as the technological differences of location, are aspects that can restrict the implementation of reuse systems in rural communities. For example, rural communities are more sensitive to water scarcity than urban areas due to the inherent complexities of their location and the difficult access to technological treatment systems. Rodríguez et al. [14], showed that the implementation of pilot systems for greywater treatment in rural public schools in the Coquimbo Region are not economically feasible in a 10-year projection. This is mainly because capital costs and operating costs are not amortized by water savings in the long term. On the other hand, Friedler [15] showed that the production of drained greywater is much greater than the potential uses that can be given to the treated water. Thus, they propose that the reuse of greywater should be oriented to ‘light’ greywater, since the costs of treatment and technological complexity would be lower. However, most of the research has been focused on the performance of treatment systems and their technical characteristics (i.e., [5,16,17,18,19,20]), while economic aspects that are critical for long-term sustainability have been approached considering particular case studies in different countries of the world [21,22,23,24,25,26,27]. Furthermore, there are no experiments that have addressed the economic viability of ‘light greywater’ treatment systems, compared to ‘dark greywater’ treatment systems. Defining these aspects can be key to the design and implementation of reuse systems at the urban and rural levels.
In this work, greywater reuse pilot systems were economically and socially analyzed considering treatment scenarios using ‘light greywater’ and ‘dark greywater’. For the analysis, pilot systems installed in rural public schools in Chile were considered. For the economic evaluation, capital costs, operating and maintenance costs, as well as environmental costs are considered, while the environmental benefits are quantified from the saving of water and the greater availability of green areas. The base system was supplemented according to the technological complexity necessary to treat dark greywater and achieve required quality standards. These results will allow the definition of an appropriate design of low-scale greywater treatment systems and thus determine the best approach and configuration of decentralized systems.
2. Materials and Methods
2.1. Study Cases
For the economic analysis, greywater treatment systems installed in two public schools located in the Coquimbo Region, Chile, were chosen as the base model. The evaluation was made considering two scenarios: (i) only light greywater to be treated, and (ii) light greywater and dark greywater to be treated.
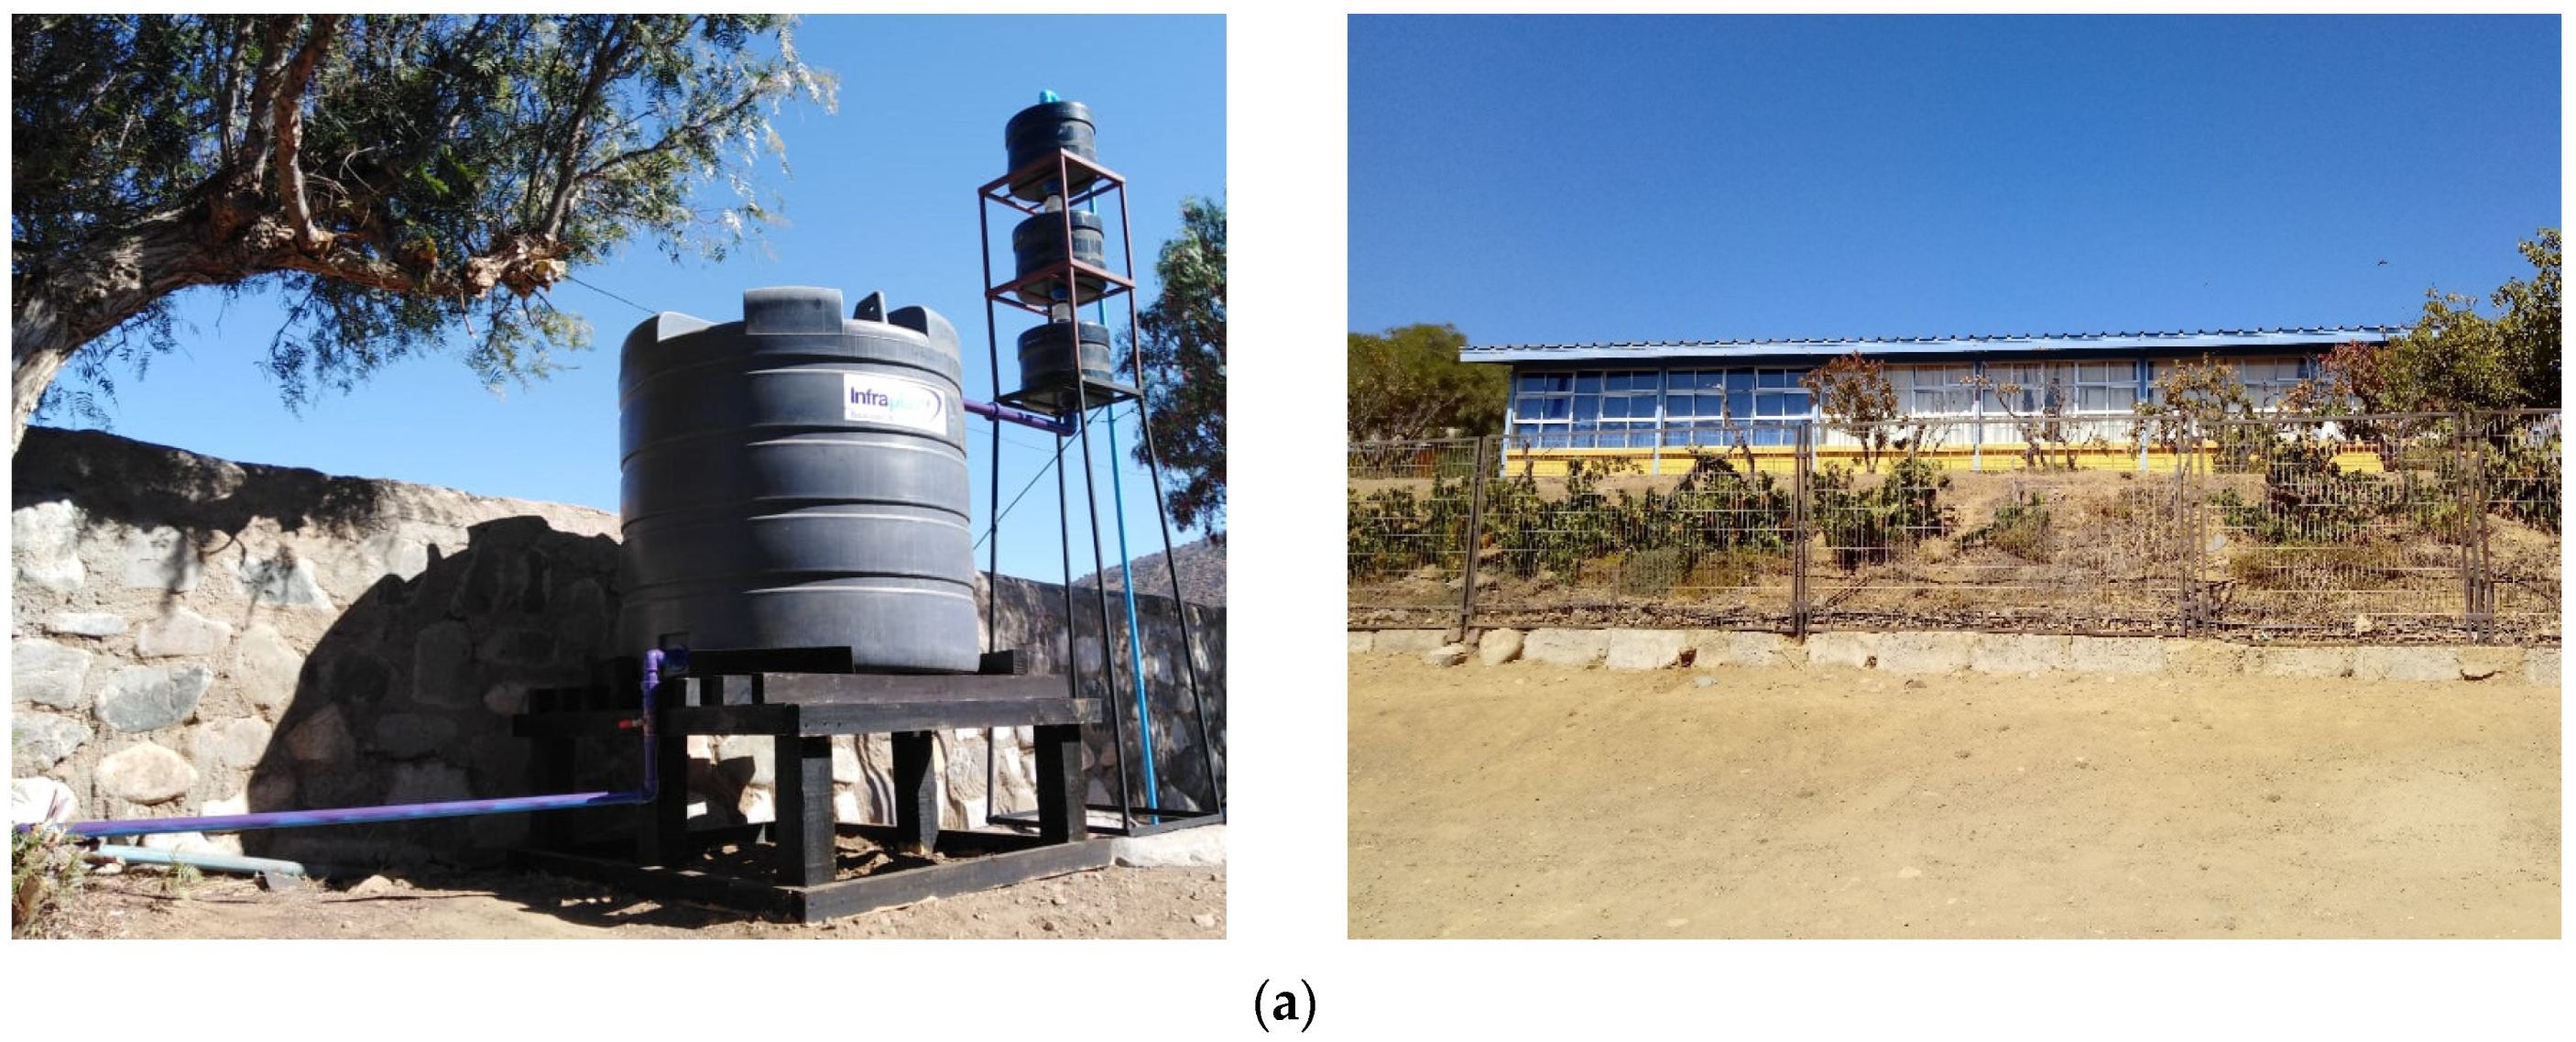
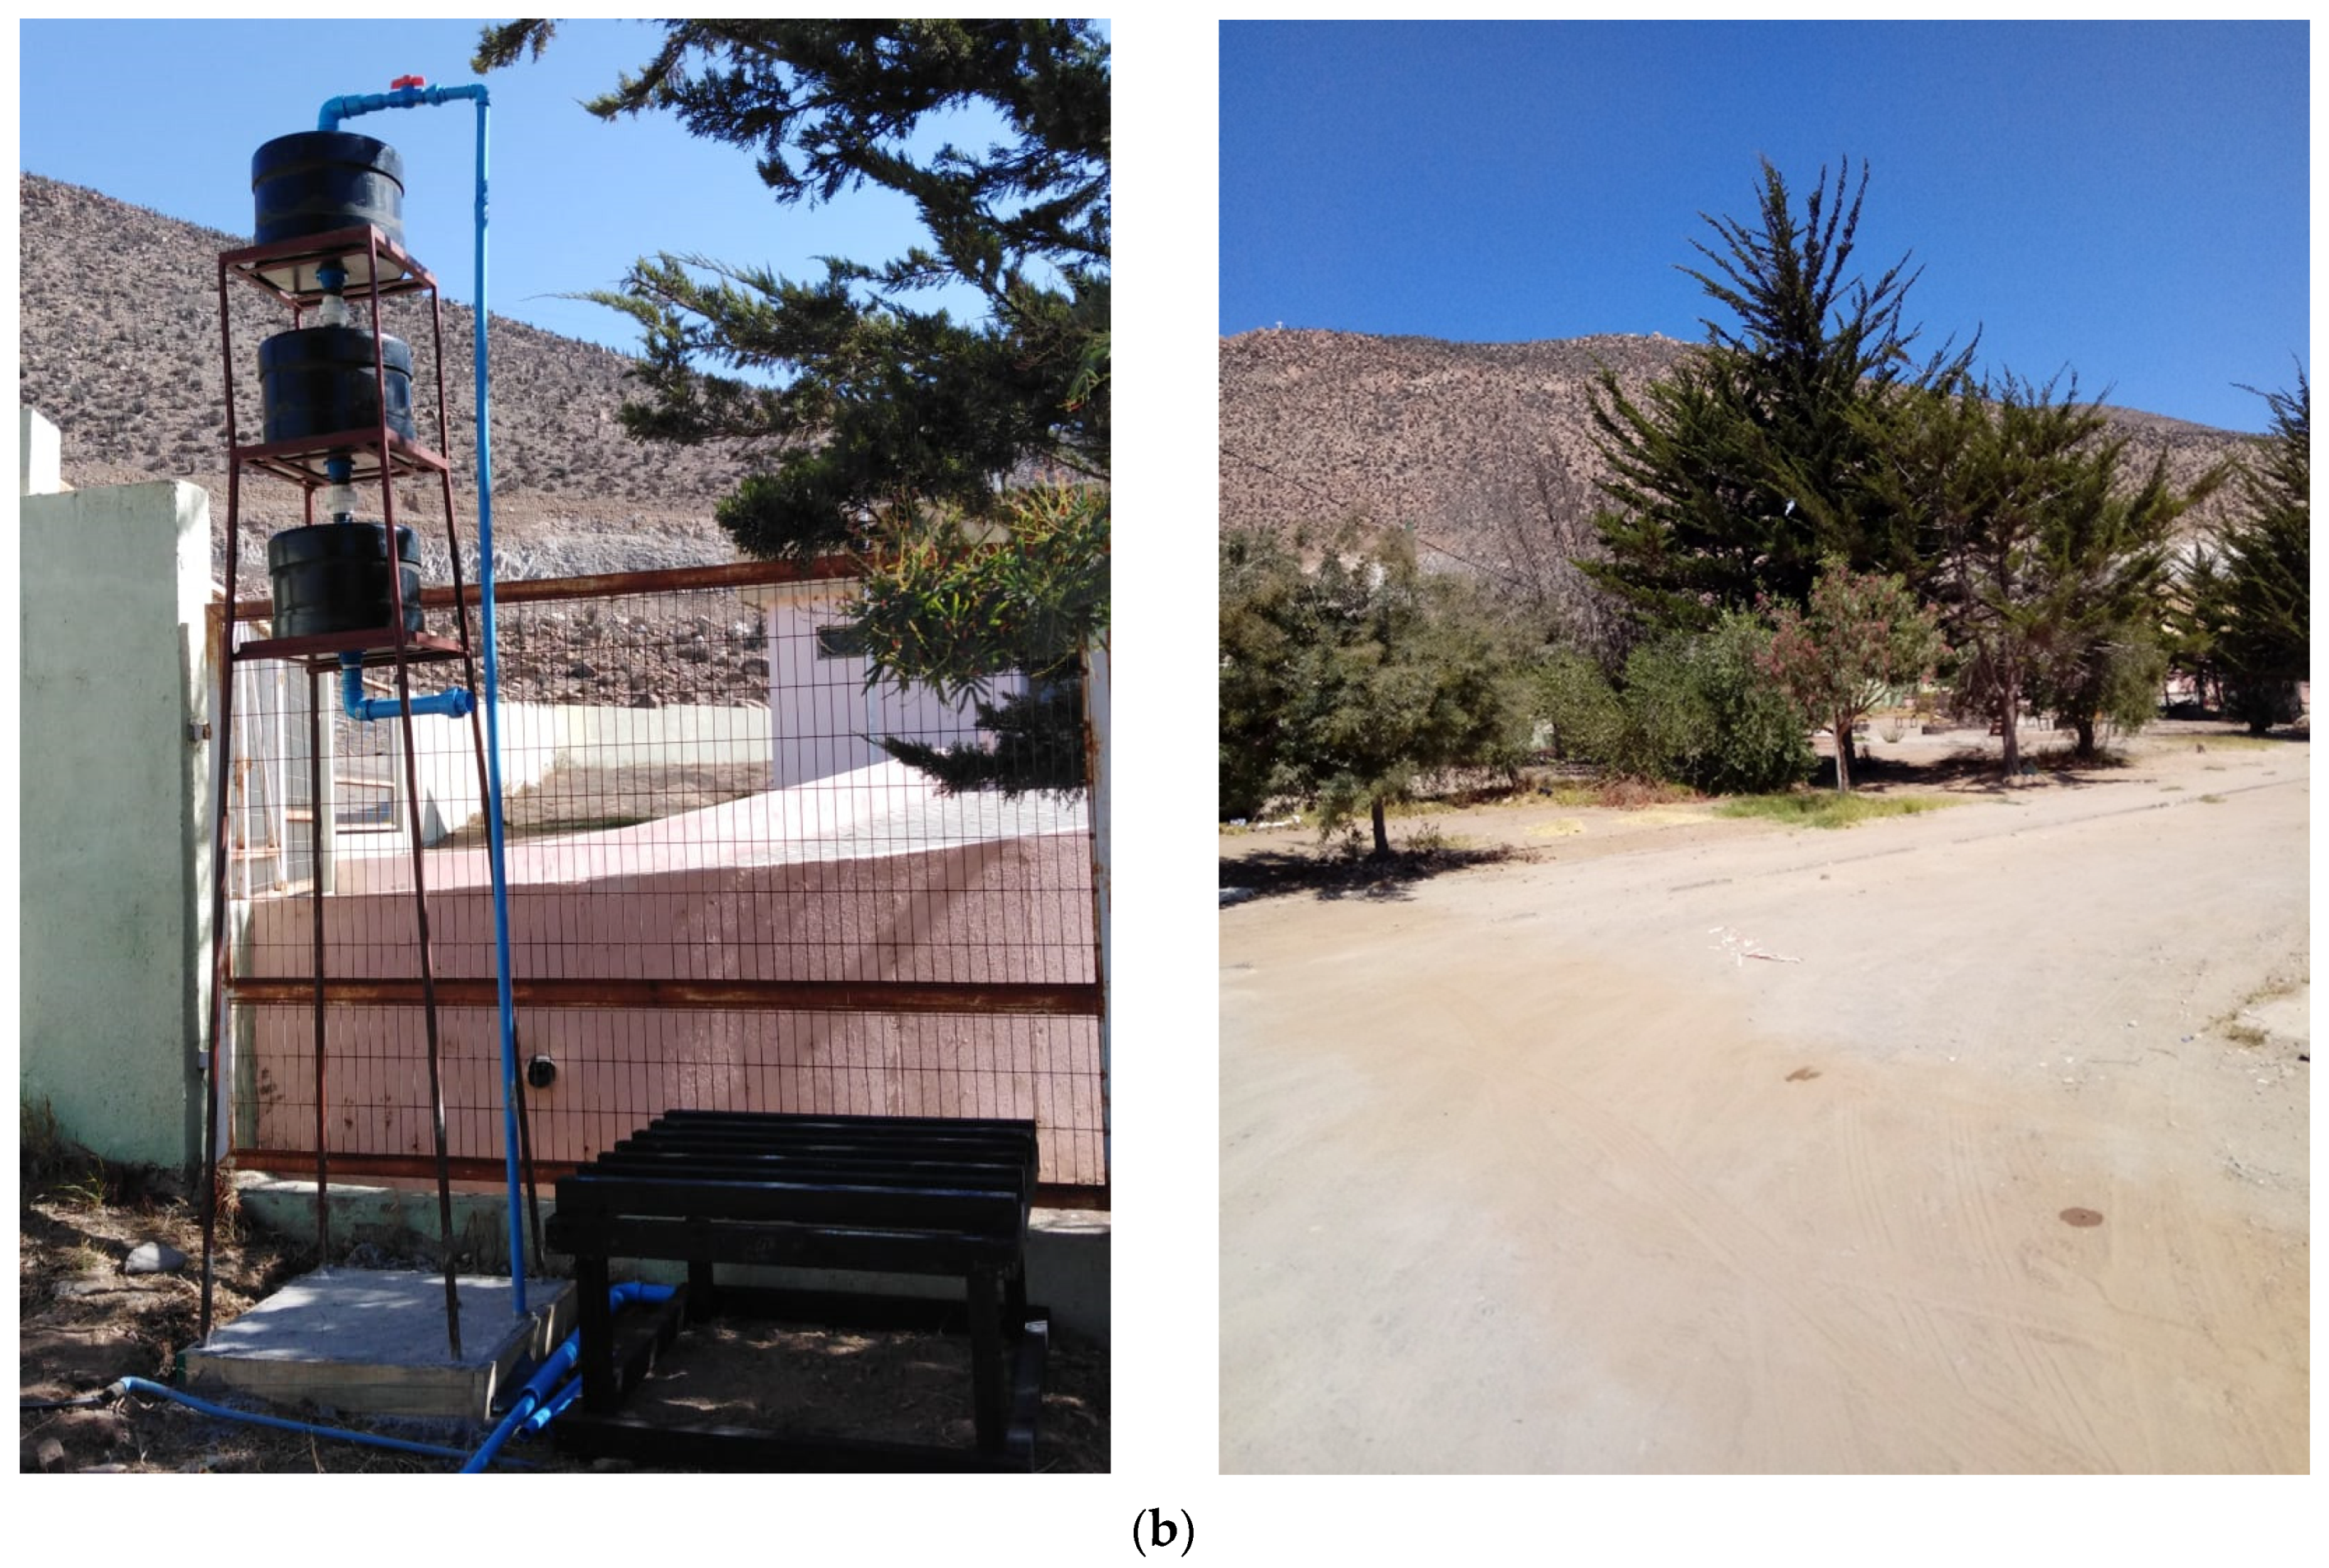
The selected schools were: Los Pozos school and José Santos Ossa school. Los Pozos school (31.21° S 71.15° W) has 23 students, while José Santos Ossa school (30.63° S 71.33° W) has 120 students. Drinking water for both schools is supplied by self-managed rural potable water systems (APR). For the economic evaluation, water reuse systems based on filtration processes that were previously installed in both schools are considered. Figure 1 shows the greywater treatment systems and the area irrigated with treated greywater of each school.
2.2. Economic Analysis
An economic analysis was carried out to determine which type of greywater (light or dark greywater) is more suitable to treat in decentralized greywater reuse systems. The annual discount rate (r) used for the analysis was 8.16% with an evaluation period of 20 years. The discount rate was determined following the same procedure described by Rodríguez et al. [14]. For this, financial indices and capital asset pricing model (CAPM) from waste and environmental services industry [28] were used.
The operation period for the schools was 10 months per year (school year) and only during business days. For this reason, both the costs and the economic benefits were evaluated during 200 days per year. For the economic analysis, not only financial factors were taken into account, but also environmental costs and benefits, due to the social and environmental character of this project.
2.2.1. Economic Costs
The economic costs used for the analysis include capital (initial investment), operation and maintenance, and environmental costs.
- (a)
- Capital costs
Capital costs (Cc) include the costs associated with the purchase of the installation of filtration systems and/or biological treatment modules (if applicable), pumps, pipes, fittings and storage tanks. Following the analysis developed by Rodríguez et al. [14], Equation (1) was used to determine the associated capital costs.
where Cm, Cq, Cw and Ct correspond to materials, equipment, workforce, and operator training costs. These costs were estimated from data obtained from pilot treatment systems for light greywater. For the case that includes dark greywater treatment, data from the literature were used.
- (b)
- Operation and maintenance costs
The operation costs (Co) and maintenance costs (Cm) include the costs associated with the use of reagents for disinfection, the costs of electrical energy, costs associated with the replacement of filter materials and maintenance of biological modules and costs associated with the monitoring of treated greywater. These costs were calculated using Equations (2)–(4).
where Ce, Cf, Cd and Cb corresponds to the costs of electrical energy (for pumps), the costs of consumables for disinfection, the cost of the replacement of filter materials (every 100,000 L of greywater treated), and the costs of maintenance of the biological module (monthly), respectively, while CQ is the cost of water quality control. Water quality monitoring of treated greywater includes the costs of water analysis (Ca) and water samples transport (Ct), and is performed quarterly as required by current Chilean regulations. Disinfection costs consider the use of liquid chlorine (sodium hypochlorite 15%) as a disinfectant and the estimated cost is associated with the use of 0.014 kg/m3 of treated greywater (US$1.54/kg sodium hypochlorite 15%) [29,30]. These costs were estimated according to our own data from the monitoring of light greywater treatment systems and the technical capabilities of the equipment used (theoretical and empirical). These costs are variable and are associated with the amount of greywater to be treated.
- (c)
- Environmental costs
Following the procedure of Rodriguez et al. [14], the environmental cost (Cn) included in the economic analysis corresponds to the noise pollution caused by electric pumps during the operation of the greywater reuse systems. Since the pumps are used close to the source of the greywater, their location in a place further from the school facilities is not feasible since it would require a greater investment in other items, such as plumbing. Given the negative effects that noise pollution has on the health and quality of life of the population, its economic cost is quantified through analysis and studies of the willingness to pay for noise reduction [31]. Although this cost may be marginal for the current level of treatment, it must be considered because it could increase as the volume of water to be treated increases, which could imply higher noise levels. The environmental cost was calculated using Equation (5).
where CdB corresponds to the annual cost of reducing one decibel and dB corresponds to the perceived decibels in the surrounding area. This cost is estimated according to a literature approximation and corresponds to US$2.34/year for the reduction of 1 dB [32,33]. Although this is a significant cost, the decibels emitted by the pumps during the operation of the greywater reuse systems are under the limits determined by Chilean regulations in public spaces or green areas (55 decibels) [34]. Even so, depending on the proximity of the pumps to the receiver, the operation of the pumps may have a relevant impact and must necessarily be considered.
2.2.2. Economic Benefits
The economic benefits used for analysis consider the benefits associated with water savings and the environmental benefits. Economic benefits were calculated using Equation (6).
where BE(ws) are the economic benefits associated with water savings and BN are the environmental benefits.
- (a)
- Benefits for water savings
The economic benefits (BE) of the greywater reuse systems were estimated based on the savings in drinking water generated by the reuse of treated greywater. In this way, the economic benefits were calculated using Equation (7).
where Rw, Cw and ∆ are the reclaimed water [m3], the current unit cost of water [US$], and the annual increase in the price of water, respectively. The parameter ∆ was estimated according to the procedure indicated by Rodríguez et al. [14] and corresponds to 5.15% per year. The prices of water used correspond to the price of water at each site where the schools used as a case study are located and correspond to US$0.86/m3 for Los Pozos school and José Santos Ossa school.
- (b)
- Environmental benefits
The environmental benefits (BN) of the project were estimated based on the willingness to pay for additional green areas. According to the World Health Organization (WHO), the minimum surface of green areas recommended per person is 9 m2 [35]. Green areas have many social, ecological and economic benefits that are relevant factors in the social evaluation of an investment project [36]. Particularly, in the study region, the green areas per person are around 4.9 m2 [37], being a transition zone between desert and Mediterranean climates [38]. In this context, green areas have a positive impact on local biodiversity, and people’s physical and mental health [39,40]. For this reason, larger green areas are transformed into a tangible environmental benefit for the recycling systems implemented, and must be quantified in this type of project. Considering the study by Martínez et al. [41] regarding the availability to pay for additional green areas in Chile, an estimated value of US$1.32 per month per person was included as an environmental benefit. For the calculation of environmental benefits, Equation (8) is used
where CG, A and N are the willingness to pay for an additional hectare of green area per year per person [US$], the surface of green areas expressed in units of hectares [Ha] and the number of students in each school, respectively.
2.3. Evaluation Scenarios
The study cases include two analysis scenarios: (i) Scenario 1: Light greywater inlet, and (ii) Scenario 2: Light + dark greywater to be treated.
- i.
- Scenario 1: Light greywater inlet
In this scenario, only greywater coming from the sinks is considered to be treated. For the treatment system, a filtration process (due to the low organic load) and a chlorine disinfection process are considered. Table 1 summarizes the modeling conditions determined by the inlet greywater quality.
- ii.
- Scenario 2: Light + dark greywater inlet
In this scenario, greywater coming from the sinks and kitchen are considered to be treated. The dark greywater amount was estimated at around 20% of the light greywater amount. In this case, the treatment system includes a filtration process, an aerobic biological treatment module (due to the high organic load) and a chlorine disinfection process. In addition, some investment costs increase when considering dark greywater. For this, a 30% increase in capital costs associated with plumbing, perimeter closure and labor was estimated. The use of an additional electric pump was also considered. Table 2 summarizes the modeling conditions determined by the inlet greywater quality.
2.4. Economic Indicators of Viability of the Project Investment
For the economic viability analysis, the benefit/cost ratio (RB/C), the net present value (NPV), the internal rate of return (IRR) and the payback period (PBP) were calculated.
2.4.1. Ratio of Benefits to Costs
The ratio of benefits to costs (RB/C) was calculated using the Equation (9) [42]. A RB/C > 1 indicate that the project is economically feasible, while a RB/C < 1 indicate that the project is not economically feasible.
2.4.2. Net Present Value
The net present value (NPV) consists of the sums of initial costs and the sum and the future cash flow of each case in each scenario. This was calculated using Equation (10).
where Rt is the net cash flow during a period t (US$), r is the discount rate used for the analysis (8.16%), t is the time of cash flow, (years), and n is the project lifetime (20 years).
2.4.3. Internal Return Rate
The internal return rate (IRR) consists of the rate where the NPV of the project is equal to zero. This was calculated by using Equation (11).
where IRR is internal return rate and I0 is the initial investment cost (US$).
2.4.4. Payback Period and Discounted Payback Period
The payback period (PBP) is the amount of time required to recover the cost of an investment of the project. This was calculated by using Equation (12).
The discounted payback period (DPP) is the amount of time it takes for the initial cost of a project to equal the discounted value of the expected cash flows. To calculate it, Equation (13) was used.
2.5. Sensitivity Analysis
The sensitivity analysis was carried out by modifying variables that significantly affect the viability of the project. This sensitivity was evaluated using the analysis of tornado. Of the variables evaluated, those that have a greater impact on the viability of the project and that have the possibility of being varied were considered. Thus, the variables analyzed were the project lifetime, the amount of greywater to be treated and the discount rate, as shown in Table 3.
3. Results and Discussion
3.1. Economic Analysis
Table 4 presents the results of the economic analysis considering an evaluation period of 20 years and a discount rate of 8.16%. The design of the systems is equal for both cases, with a maximum greywater treatment capacity of 1000 L per day, which allows a potential expansion for both schools, mainly for Los Pozos, for which the current level of greywater treatment is around 26% of the total capacity. The capital cost is higher for the case that considers light and dark greywater, which has a membrane bioreactor (MBR) that allows for treating the most polluted greywater. The operating cost is related to electrical consumption for the electric pumps and the MBR, and the chlorination step. These operational costs are directly related to the amount of greywater. Therefore, a higher cost can be seen in cases associated with greater generation and treatment of greywater. The data used for this calculation correspond to own data monitored from the treatment systems and the energy consumption of the MBR was estimated from literature data [43]. In the same way, maintenance costs, mainly associated with the change of filtration materials, were estimated from our own data and other studies [43]. The frequency and analysis of the quality control process were determined according to the greywater legislation in Chile [44,45]. The main environmental cost was the noise from the pumps and the bioreactor. The benefits of the project were quantified based on the economic saving of water and the benefit of green areas irrigated with treated greywater. In the latter case, it was considered that the irrigation was carried out in recreational or ornamental areas, since current Chilean legislation does not allow the use of treated greywater for the irrigation of crops for edible purposes [44]. However, the benefits of these systems could be greater when considering the current scenario of water scarcity that exists in the area [46,47,48,49]. In addition, green areas could bring many other benefits not quantified in this study, such as the effect of thermal regulation [50,51,52,53,54,55], benefits in mental health [40], and academic benefits manifested as the greater comfort and well-being of students and teachers in schools [56,57,58].
The calculation of the economic indicators based on the costs and benefits for each scenario was carried out with and without considering a state subsidy for capital costs of US$3685 (Table 5). Although the subsidy improves the NPV determined for all scenarios, it is negative in all cases, being the case of the José Santos Ossa school with a subsidy and treatment of only light greywater the best scenario with an NPV of US$−1246.01. This scenario is also the only one that allowed the determination of all of the economic indicators, with a ratio of benefit to costs of 0.82, an internal return rate of 0.006%, a simple payback period (PBP) of 153.5 years, and a discount payback period (DPP) of 51.2 years. In this case, the DPP was lower than the PBP since the projected increase in the price of water was considered for the modeling, based on the increase perceived during the previous 20 years. In this way, the saving in water consumption is increasing over time, which means that the return period is shorter when calculating the DPP than the PBP. However, both periods are quite high and show that the initial investment takes a long time to be recovered. For the other scenarios, it was not possible to determine the economic indicators since the variable costs (without considering the capital costs) are greater than the benefits. On the other hand, it is possible to observe that the scenario that contemplates the treatment of light and dark greywater, the NPV, is very similar between the different schools, and therefore the difference between the amount of greywater generated by each school does not make a significant difference in the final evaluation of the project. Therefore, in all scenarios, light and dark greywater treatment is more unfavorable.
The costs per m3 of treated greywater associated with maintenance and operating costs for only light greywater treatment are US$0.06/m3 and US$2.06/m3 for José Santos Ossa and Los Pozos, respectively. In the case of light and dark greywater, the costs increase to US$2.53/m3 and US$3.45/m3. Comparatively, other studies have reported similar costs. Samal et al. [59] reported a cost of US$0.36/m3 for a filtration system with gravel, sand filter and granular activated carbon. On the other hand, Lazarova et al. [8] indicate that the annualized capital and operational cost for an MBR treatment with a capacity below 75 m3/d are around US$3.45/m3. López Zavala et al. [60] studied the economic feasibility of collecting rainwater and treating greywater as a measure to reduce water consumption. According to their calculations, the amortization of the investments is achieved after six years, for a system with a treatment level of around 90,000 m3 per year. Similarly, Rosa and Ghisi [21] studied a combined system of greywater and rainwater, obtaining a payback period of a little more than 10 years. In this sense, the main barrier to economic feasibility associated with the cases in our study is related to the low levels of greywater produced, due, among other things, to the limited number of students in the schools, the characteristic of isolated rural areas, and the infeasibility of recovering rainwater to increase the volume of water due to the climatic characteristics of the study area. This poses a major challenge in the implementation of water collection and treatment systems in populated rural areas that face severe water scarcity problems.
3.2. Sensitivity Analysis
3.2.1. Without a State Subsidy
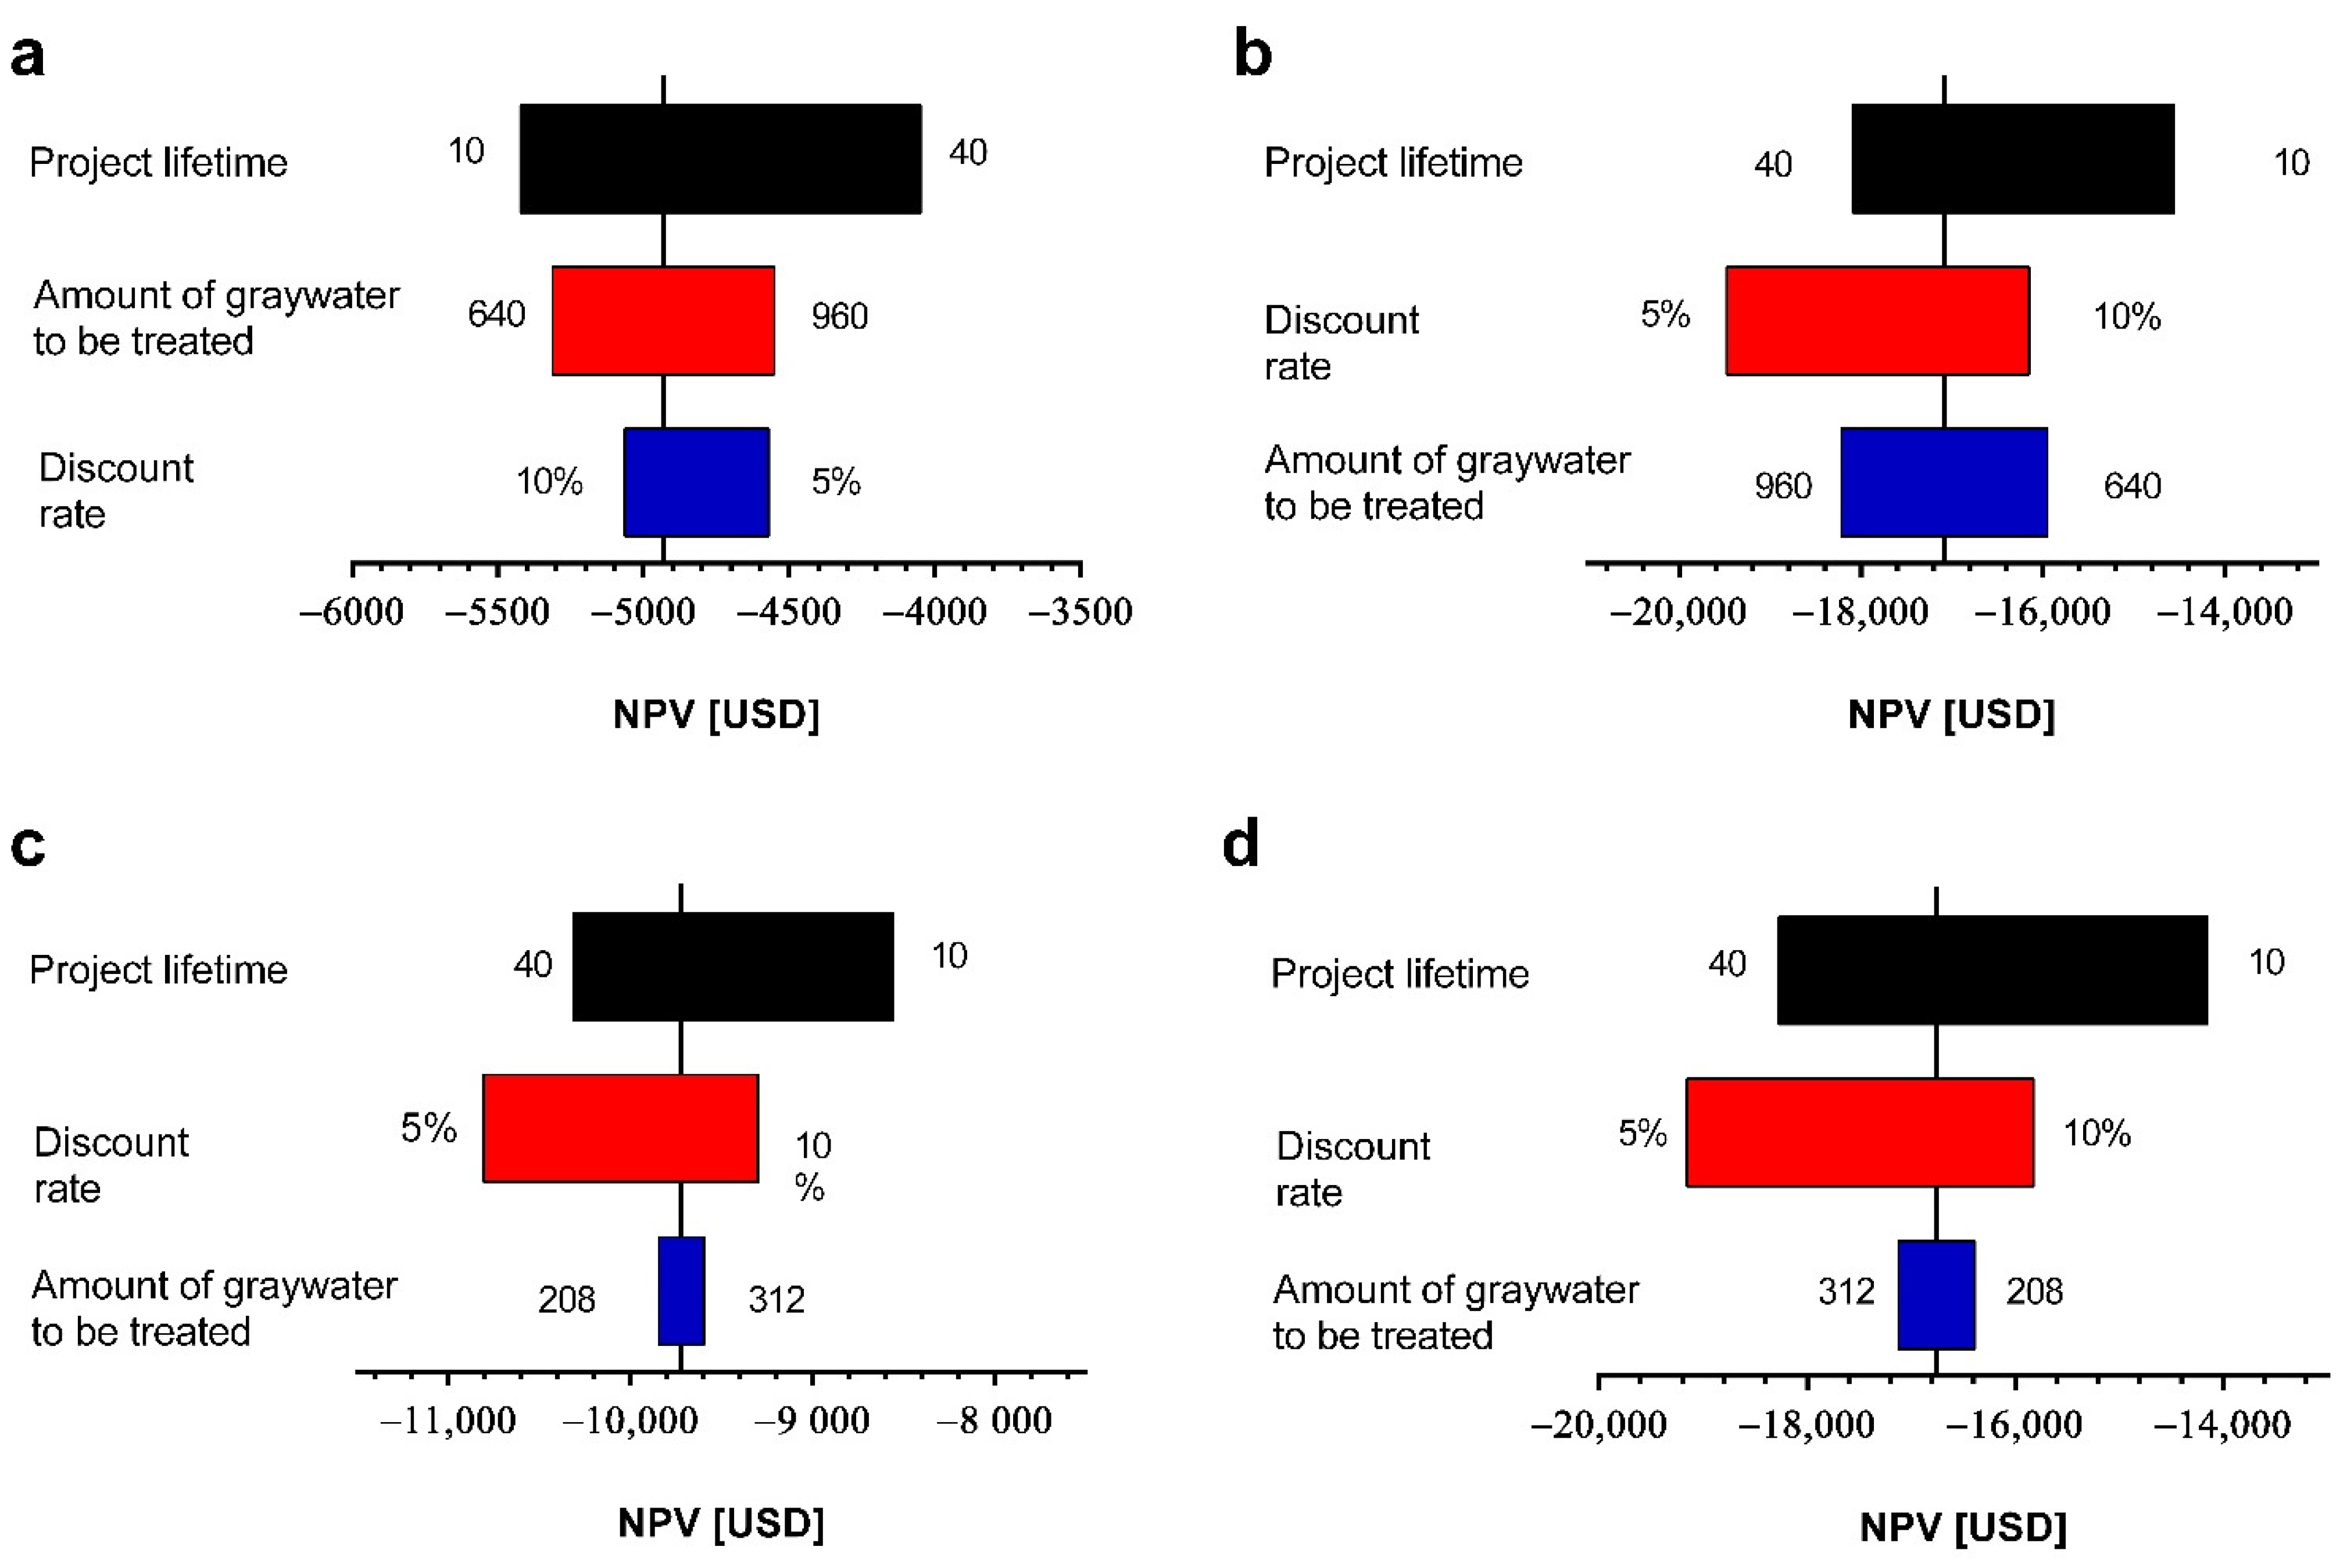
To identify which variables have a greater impact on the economic feasibility of greywater reuse systems, a sensitivity analysis modifying key variables was performed. Figure 2 shows the economic impact of the variation of project lifetime (years), discount rate (%), and amount of greywater to be treated (m3). The variation of other variables such as workforce costs, maintenance frequency, costs of perimeter closure, number of electric pumps, plumbing costs, and willingness to pay for green areas did not produce significant changes in the economic feasibility of the greywater reuse systems of both schools evaluated. The results of the sensitivity analysis show that the most relevant variable is the project lifetime, producing a less negative NPV when the project has a longer lifetime considering scenario 1 (light greywater) for the José Santos Ossa school. On the contrary, for Los Pozos school, an inverse behavior was observed, where a longer project lifetime generates a more negative NPV, which is influenced by the lower volume of greywater to be treated. When analyzing the second scenario (light and dark greywater) both schools showed a more negative NPV with a longer project lifetime, which is explained because the operating and maintenance costs are higher in this scenario.
In both schools, it is observed that the impact of the amount of greywater to be treated generates a less negative NPV value, even though the variations made in the projects are not economically feasible. Changes in this variable impact the Jose Santos Ossa school more than Los Pozos school, which is explained by the difference in the amount of greywater treated in each school. The result is the inverse in both schools when the second scenario (light +and dark greywater) is considered. This occurs because the lower quality of dark greywater generates higher capital, operating, and maintenance costs. On the other hand, in Los Pozos school the impact of the discount rate was greater than for the José Santos Ossa school, however, in both scenarios no variation generates positive NPV. In the case of the José Santos Ossa school, this variable has a greater impact than the amount of greywater to be treated (in scenario 1), because the levels of greywater in this school were higher compared with Los Pozos school. For Los Pozos school, the variation in the greywater to be treated causes a lesser impact on the variation of the NPV, which is supported by the smaller number of students of this school and, therefore, the smallest quantity of greywater to be treated. Interestingly, in both scenarios for both schools, it is observed that the assessment remains economically unfavorable, and only becomes less negative with the most favorable variations. These results are similar to those previously reported by Rodríguez et al. [9] and support the idea of the need to consider some subsidy from the state that reduces the capital costs of these small-scale water reuse projects.
3.2.2. With a State Subsidy
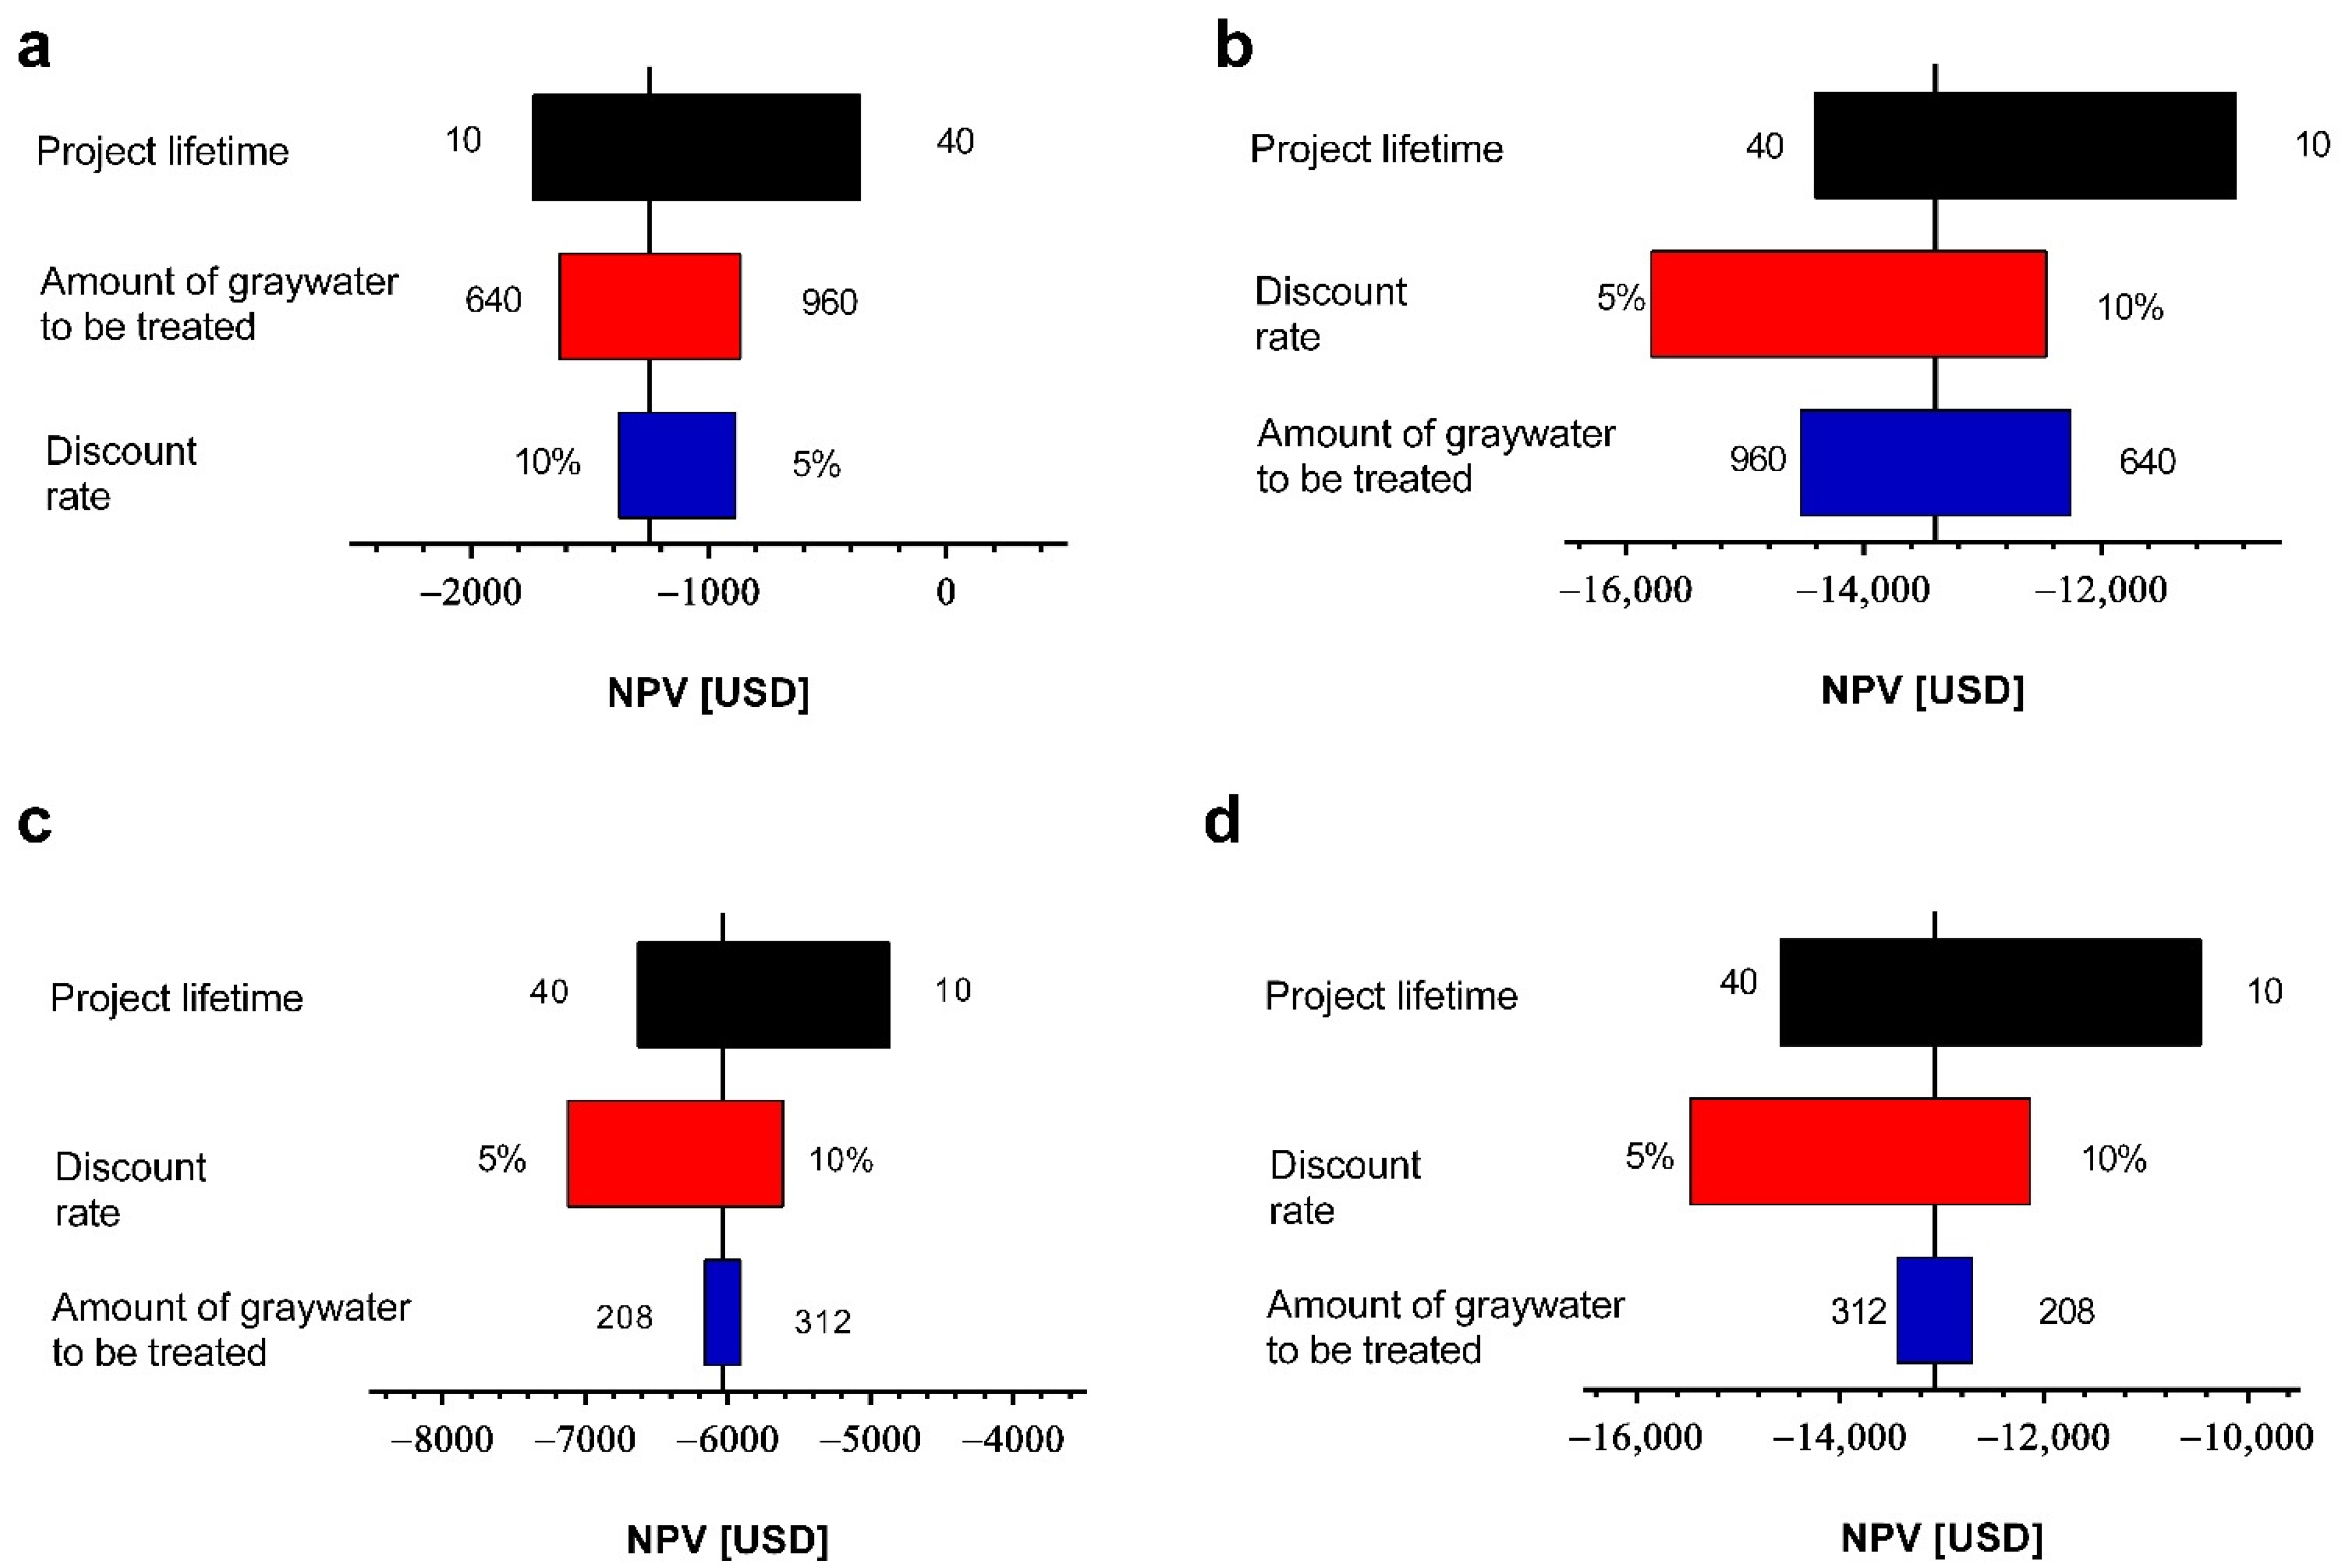
From the analysis shown in Figure 2, it is observed that the modification of the analyzed variables does not generate economic feasibility scenarios (NPV > 0). This is explained because the costs of each project are very high and are not amortized by the economic benefits of each project. For this reason, it is necessary to consider a state subsidy that favors an improvement in the cost-benefit ratio of the projects. To evaluate this, a sensitivity analysis was carried out considering the state subsidy previously used in Section 3.1 (3685 USD) and as a contribution to the capital costs of each project. With this potential state subsidy, it is observed that again the project lifetime was the most relevant variable for both scenarios and both schools. It is observed that with this subsidy the Jose Santos Ossa school in scenario 1 (light greywater) reaches an NPV close to 0 when it was evaluated at 40 years (Figure 3a). However, again an inverse behavior is observed for scenario 2 (light and dark greywater) (Figure 3b), which occurs because when treating dark greywater the operation and maintenance costs are higher. This is also observed for Los Pozos school in both scenarios (light and light and dark greywater) (Figure 3c,d).
The amount of greywater to be treated shows improvements in the economic feasibility for both schools in scenario 1 (light greywater). The opposite occurs in scenario 2 (light and dark greywater), where the greater amount of greywater to be treated produces a more negative NPV. The discount rate shows a relevant impact for the Jose Santos Ossa school in scenario 2 (light and dark greywater) and for the Los Pozos school in both scenarios. Meanwhile, for the Jose Santos Ossa school in scenario 1 (light greywater) it is less significant than the other variables analyzed.
Despite the subsidy, both projects are not economically feasible. This supports the idea that small-scale public water reuse projects, such as those evaluated in this study, will not be economically viable in the long term unless they have a state subsidy that, in addition to supporting the initial investment, also supports the operation and maintenance costs. Similarly, it is observed that the economic feasibility scenarios are less negative (NPV less negative) in scenario 1 (light greywater). Therefore, it is more appropriate to design small-scale systems to treat light greywater than to generate more complex systems to treat light and dark greywater. Larger-scale projects require a new economic analysis that will account for potential economies of scale. These results are consistent with those previously reported by our group [9].
Alternatively, other nature-based technologies have been implemented for greywater treatment whose operating and maintenance costs can be minimal, such as constructed wetlands [61]. The constructed wetlands are systems that use natural processes associated to wetland vegetation, soil and microbial activity to treat wastewater [62]. The investment costs of a constructed wetland reported by different studies are highly variable [63]. The study of Gkika et al. [64] proposes an expression as a function of population equivalent (PE) to determine investment costs for vertical flow constructed wetlands (C = 2827(PE)0.738 [103€]), while other studies calculated investment costs for low-scale systems between 295 and 577 €/PE [65]. The main disadvantages in using this type of treatment are the large space required for its construction, around 5–10 m2/PE for horizontal subsurface flow (HSF) and 2 m2/PE for VFCW [66], and the low control in the operating parameters of the system. These disadvantages make the use of these systems complex in continuous operating conditions and make it difficult to address problems that may occur in treatment processes. Particularly in this study, due to the need for monitoring and compliance with quality standards, it is complex to incorporate this type of systems, so the analysis is based on previously built systems that are optimized in a modular way according to the complexities of the water to be treated, and the addition of CW makes a differential evaluation of the two types of greywaters impossible. Even so, its future optimization can bring significant improvements in the economic feasibility of decentralized greywater treatment systems.
4. Conclusions
The economic assessment of greywater treatment in two public schools using filtration pilot systems proved to be unfavorable for an evaluation period of 20 years due to high initial investment and high operating and maintenance costs concerning the economic benefits obtained due to saving water. In José Santos Ossa school, the results were less unfavorable than in Los Pozos because the generation of daily greywater is higher. The treatment design that contemplates the reuse of light and dark greywater was more unfavorable than that which only considers the treatment of light greywater. This is mainly because the capital, operation and maintenance costs of a biological treatment are not rewarded by the increase in the potential amount of water to be treated. On the other hand, when considering the application of a subsidy or other type of financial aid to cover investment costs, the project could be feasible if it is used for a treatment level close to the maximum design capacity, as is the case in José Santos Ossa school. In the case of the Jose Santos Ossa school, a project with a longer lifetime (40 years) can make the water reuse system slightly economically feasible, but only if light greywater treatment is considered.
Our findings suggest that the use of light greywater is more economically feasible than treating light and dark greywater simultaneously because, in the second scenario, the treatment processes are more costly and operationally intensive. This means that in this scenario (light and dark greywater) the benefits are less than the costs, not allowing economic viability. However, for larger-scale systems it is necessary to consider a new evaluation since potential economies of scale could reduce costs and favor the reuse of greywater. Even so, for small-scale decentralized greywater reuse systems, it is imperative to provide state subsidies that not only reduce initial investment but also amortize operating and maintenance costs.
Author Contributions
The manuscript was written by C.R. and E.L., but all the authors contributed to its preparation and review. Conceptualization and data analyses were carried out by C.R. in discussion with E.L.; validation of results was performed by E.L.; the manuscript was edited and reviewed by C.R., R.S., J.S. and E.L. All authors have read and agreed to the published version of the manuscript.
Funding
This research received funding from FIC-R Fondo de Innovación para la Competitividad Gore Coquimbo BIP nos. 30485965-0, CORFO-L2 L2 ISV93456 and FONDECYT Iniciación 11191154 (2019–2022) grants.
Institutional Review Board Statement
Not applicable.
Informed Consent Statement
Not applicable.
Data Availability Statement
The data presented in this study are available on request from the corresponding author.
Acknowledgments
We thank Natalia Rebolledo and Nicolás Schneider for their logistical and territorial support associated with the implementation of the greywater reuse systems. Also, we thank Daniel Rojas, Hernán Toro, Marcos Florio, Hernán Flores, Hugo Guzmán, Jaime Esquivel, Arnulfo Santibáñez for their assistance in the construction of pilots in schools. Thanks are also extended to the reviewers for their corrections and suggestions, who contributed significantly to improving the quality of this manuscript.
Conflicts of Interest
The authors declare no conflict of interest.
References
- Mekonnen, M.M.; Hoekstra, A.Y. Sustainability: Four billion people facing severe water scarcity. Sci. Adv. 2016, 2, e1500323. [Google Scholar] [CrossRef] [PubMed] [Green Version]
- Rezaei, A.; Salmani, M.; Razaghi, F.; Keshavarz, M. An empirical analysis of effective factors on farmers adaptation behavior in water scarcity conditions in rural communities. Int. Soil Water Conserv. Res. 2017, 5, 265–272. [Google Scholar] [CrossRef]
- Gude, V.G. Desalination and water reuse to address global water scarcity. Rev. Environ. Sci. Biotechnol. 2017, 16, 591–609. [Google Scholar] [CrossRef]
- Voulvoulis, N. Water reuse from a circular economy perspective and potential risks from an unregulated approach. Curr. Opin. Environ. Sci. Health 2018, 2, 32–45. [Google Scholar] [CrossRef]
- Vuppaladadiyam, A.K.; Merayo, N.; Prinsen, P.; Luque, R.; Blanco, A.; Zhao, M. A review on greywater reuse: Quality, risks, barriers and global scenarios. Rev. Environ. Sci. Biotechnol. 2019, 18, 77–99. [Google Scholar] [CrossRef]
- Muthukumaran, S.; Baskaran, K.; Sexton, N. Quantification of potable water savings by residential water conservation and reuse—A case study. Resour. Conserv. Recycl. 2011, 55, 945–952. [Google Scholar] [CrossRef]
- Al-Jayyousi, O.R. Greywater reuse: Towards sustainable water management. Desalination 2003, 156, 181–192. [Google Scholar] [CrossRef]
- Lazarova, V.; Hills, S.; Birks, R. Using recycled water for non-potable, urban uses: A review with particular reference to toilet flushing. Water Sci. Technol. Water Supply 2003, 3, 69–77. [Google Scholar] [CrossRef]
- Friedler, E.; Hadari, M. Economic feasibility of on-site greywater reuse in multi-storey buildings. Desalination 2006, 190, 221–234. [Google Scholar] [CrossRef]
- Albalawneh, A.; Chang, T.-K. Review of the greywater and proposed greywater recycling scheme for agricultural irrigation reuses. Int. J. Res. 2015, 3, 16–35. [Google Scholar] [CrossRef]
- Birks, R.; Hills, S. Characterisation of indicator organisms and pathogens in domestic greywater for Recyclin. Environ. Monit. Assess. 2007, 129, 61–69. [Google Scholar] [CrossRef]
- Shaikh, I.N.; Ahammed, M.M. Quantity and quality characteristics of greywater: A review. J. Environ. Manag. 2020, 261, 110266. [Google Scholar] [CrossRef]
- Sushmitha, M.B.; Chanakya, H.N.; Khuntia, H.K. Efficient Grey Water Treatment and Reuse Options for India—A Review. In Waste Water Recycing and Management; Springer: Singapore, 2019; pp. 143–149. [Google Scholar]
- Rodríguez, C.; Sánchez, R.; Rebolledo, N.; Schneider, N.; Serrano, J.; Leiva, E. Cost–Benefit Evaluation of Decentralized Greywater Reuse Systems in Rural Public Schools in Chile. Water 2020, 12, 3468. [Google Scholar] [CrossRef]
- Friedler, E. Quality of individual domestic greywater streams and its implication for on-site treatment and reuse possibilities. Environ. Technol. 2004, 25, 997–1008. [Google Scholar] [CrossRef]
- Cecconet, D.; Callegari, A.; Hlavínek, P.; Capodaglio, A.G. Membrane bioreactors for sustainable, fit-for-purpose greywater treatment: A critical review. Clean Technol. Environ. Policy 2019, 21, 745–762. [Google Scholar] [CrossRef]
- Alsulaili, A.D.; Hamoda, M.F.; Al-Jarallah, R.; Alrukaibi, D. Treatment and potential reuse of greywater from schools: A pilot study. Water Sci. Technol. 2017, 75, 2119–2129. [Google Scholar] [CrossRef] [PubMed] [Green Version]
- Friedler, E.; Kovalio, R.; Galil, N.I. On-site greywater treatment and reuse in multi-storey buildings. Water Sci. Technol. 2005, 51, 187–194. [Google Scholar] [CrossRef] [Green Version]
- Leong, J.Y.C.; Chong, M.N.; Poh, P.E. Assessment of greywater quality and performance of a pilot-scale decentralised hybrid rainwater-greywater system. J. Clean. Prod. 2018, 172, 81–91. [Google Scholar] [CrossRef]
- Ogoshi, M.; Suzuki, Y.; Asano, T. Water reuse in Japan. Water Sci. Technol. 2001, 43, 17–23. [Google Scholar] [CrossRef]
- Rosa, G.; Ghisi, E. Water Quality and Financial Analysis of a System Combining Rainwater and Greywater in a House. Water 2021, 13, 930. [Google Scholar] [CrossRef]
- Byrne, J.; Dallas, S.; Anda, M.; Ho, G. Quantifying the Benefits of Residential Greywater Reuse. Water 2020, 12, 2310. [Google Scholar] [CrossRef]
- Thaher, R.A.; Mahmoud, N.; Al-Khatib, I.A.; Hung, Y.T. Reasons of Acceptance and Barriers of House Onsite Greywater Treatment and Reuse in Palestinian Rural Areas. Water 2020, 12, 1679. [Google Scholar] [CrossRef]
- Porob, S.; Craddock, H.A.; Motro, Y.; Sagi, O.; Gdalevich, M.; Ezery, Z.; Davidovitch, N.; Ronen, Z.; Moran-Gilad, J. Quantification and Characterization of Antimicrobial Resistance in Greywater Discharged to the Environment. Water 2020, 12, 1460. [Google Scholar] [CrossRef]
- Cureau, R.J.; Ghisi, E. Reduction of Potable Water Consumption and Sewage Generation on a City Scale: A Case Study in Brazil. Water 2019, 11, 2351. [Google Scholar] [CrossRef] [Green Version]
- Domínguez, I.; Ward, S.; Mendoza, J.G.; Rincón, C.I.; Oviedo-Ocaña, E.R. End-User Cost-Benefit Prioritization for Selecting Rainwater Harvesting and Greywater Reuse in Social Housing. Water 2017, 9, 516. [Google Scholar] [CrossRef] [Green Version]
- Juan, Y.K.; Chen, Y.; Lin, J.M. Greywater Reuse System Design and Economic Analysis for Residential Buildings in Taiwan. Water 2016, 8, 546. [Google Scholar] [CrossRef]
- Lilford, E.; Maybee, B.; Packey, D. Cost of capital and discount rates in cash flow valuations for resources projects. Resour. Policy 2018, 59, 525–531. [Google Scholar] [CrossRef]
- March, J.G.; Gual, M. Studies on chlorination of greywater. Desalination 2009, 249, 317–322. [Google Scholar] [CrossRef]
- Ziemba, C.; Sharma, P.; Ahrens, T.; Reynaert, E.; Morgenroth, E. Disruptions in loading and aeration impact effluent chlorine demand during biological greywater recycling. Water Res. X 2021, 11, 100087. [Google Scholar] [CrossRef] [PubMed]
- Sánchez, M.; López-Mosquera, N.; Lera-López, F.; Faulin, J. An Extended Planned Behavior Model to Explain the Willingness to Pay to Reduce Noise Pollution in Road Transportation. J. Clean. Prod. 2018, 177, 144–154. [Google Scholar] [CrossRef]
- Santhosh, C.; Velmurugan, V.; Jacob, G.; Jeong, S.K.; Grace, A.N.; Bhatnagar, A. Role of nanomaterials in water treatment applications: A review. Chem. Eng. J. 2016, 306, 1116–1137. [Google Scholar] [CrossRef]
- Bjørner, T.B. Combining socio-acoustic and contingent valuation surveys to value noise reduction. Transp. Res. Part D Transp. Environ. 2004, 9, 341–356. [Google Scholar] [CrossRef]
- Ministerio del Medio Ambiente (MMA). Decreto Supremo 38/11 “Norma de Emisión de Ruidos Generados por Fuentes que Indica” [Supreme Decree 38/11 Norm of Emission of Noise Generated by Sources That Indicates, Authors Translation]; MMA: Santiago, Chile, 2011.
- World Health Organization. Urban Planning, Environment and Health: From Evidence to Policy Action. 2010. Available online: https://www.euro.who.int/__data/assets/pdf_file/0004/114448/E93987.pdf (accessed on 20 October 2021).
- Xiao, Y.; Lu, Y.; Guo, Y.; Yuan, Y. Estimating the willingness to pay for green space services in Shanghai: Implications for social equity in urban China. Urban For. Urban Green. 2017, 26, 95–103. [Google Scholar] [CrossRef]
- (SIEDU), Sistema de Indicadores y Estándares del Desarrollo Urbano. Indicadores Urbanos [Urban Indicators, Authors Translation]. Available online: http://siedu.ine.cl/descargar/descarga.html (accessed on 19 October 2020).
- Montecinos, S.; Gutiérrez, J.R.; López-Cortés, F.; López, D. Climatic characteristics of the semi-arid Coquimbo Region in Chile. J. Arid Environ. 2016, 126, 7–11. [Google Scholar] [CrossRef]
- Carrus, G.; Scopelliti, M.; Lafortezza, R.; Colangelo, G.; Ferrini, F.; Salbitano, F.; Agrimi, M.; Portoghesi, L.; Semenzato, P.; Sanesi, G. Go greener, feel better? The positive effects of biodiversity on the well-being of individuals visiting urban and peri-urban green areas. Landsc. Urban Plan. 2015, 134, 221–228. [Google Scholar] [CrossRef]
- Nielsen, T.S.; Hansen, K.B. Do green areas affect health? Results from a Danish survey on the use of green areas and health indicators. Health Place 2007, 13, 839–850. [Google Scholar] [CrossRef]
- Martínez, C. Valoración Económica de Áreas verdes Urbanas de uso Público en la Comuna de La Reina [Economic Valuation of Urban Green Areas for Public Use in the Commune of La Reina]. Master’s Thesis, University of Chile, Santiago, Chile, 2004. [Google Scholar]
- Liang, X.; van Dijk, M.P. Financial and economic feasibility of decentralized wastewater reuse systems in Beijing. Water Sci. Technol. 2010, 61, 1965–1973. [Google Scholar] [CrossRef] [PubMed] [Green Version]
- Cashman, S.; Ma, X.; Mosley, J.; Garland, J.; Crone, B.; Xue, X. Energy and greenhouse gas life cycle assessment and cost analysis of aerobic and anaerobic membrane bioreactor systems: Influence of scale, population density, climate, and methane recovery. Bioresour. Technol. 2018, 254, 56–66. [Google Scholar] [CrossRef]
- Diario Oficial de la República de Chile. Ley N° 21.075: Regula la Recolección, Reutilización y Disposición de Aguas Grises [Law N° 21.075: Regulates the Collection, Reuse and Disposal of Greywater, Authors Translation]; Biblioteca del Congreso Nacional de Chile: Santiago, Chile, 2018. [Google Scholar]
- Ministerio de Salud. Proyecto de Reglamento Sobre Condiciones Sanitarias Básicas Para la Reutilización de Aguas Grises [Draft Regulation on Basic Sanitary Conditions for the Reuse of Graywater, Authors Translation]; Departamento de Salud Ambiental: Santiago, Chile, 2018.
- Salinas, C.X.; Gironás, J.; Pinto, M. Water security as a challenge for the sustainability of La Serena-Coquimbo conurbation in northern Chile: Global perspectives and adaptation. Mitig. Adapt. Strateg. Glob. Chang. 2016, 21, 1235–1246. [Google Scholar] [CrossRef]
- Rodríguez, C.; Sánchez, R.; Lozano-Parra, J.; Rebolledo, N.; Schneider, N.; Serrano, J.; Leiva, E. Water Balance Assessment in Schools and Households of Rural Areas of Coquimbo Region, North-Central Chile: Potential for Greywater Reuse. Water 2020, 12, 2915. [Google Scholar] [CrossRef]
- Aitken, D.; Rivera, D.; Godoy-Faúndez, A.; Holzapfel, E. Water Scarcity and the Impact of the Mining and Agricultural Sectors in Chile. Sustainability 2016, 8, 128. [Google Scholar] [CrossRef] [Green Version]
- Hurlbert, M.A. Case Study Coquimbo, Chile. In Adaptive Governance of Disaster. Water Governance—Concepts, Methods, and Practice; Springer: Cham, Switzerland, 2018; pp. 143–167. [Google Scholar]
- Gómez, F.; Montero, L.; De Vicente, V.; Sequi, A.; Castilla, N. Vegetation influences on the human thermal comfort in outdoor spaces: Criteria for urban planning. WIT Trans. Ecol. Environ. 2008, 117, 151–163. [Google Scholar]
- Sodoudi, S.; Zhang, H.; Chi, X.; Müller, F.; Li, H. The influence of spatial configuration of green areas on microclimate and thermal comfort. Urban For. Urban Green. 2018, 34, 85–96. [Google Scholar] [CrossRef]
- Zölch, T.; Rahman, M.A.; Pfleiderer, E.; Wagner, G.; Pauleit, S. Designing public squares with green infrastructure to optimize human thermal comfort. Build. Environ. 2019, 149, 640–654. [Google Scholar] [CrossRef]
- Morakinyo, T.E.; Adegun, O.B.; Balogun, A.A. The effect of vegetation on indoor and outdoor thermal comfort conditions: Evidence from a microscale study of two similar urban buildings in Akure, Nigeria. Indoor Built Environ. 2016, 25, 603–617. [Google Scholar] [CrossRef]
- Teli, D.; Jentsch, M.F.; James, P.A.B. Naturally ventilated classrooms: An assessment of existing comfort models for predicting the thermal sensation and preference of primary school children. Energy Build. 2012, 53, 166–182. [Google Scholar] [CrossRef]
- Zhang, A.; Bokel, R.; van den Dobbelsteen, A.; Sun, Y.; Huang, Q.; Zhang, Q. An integrated school and schoolyard design method for summer thermal comfort and energy efficiency in Northern China. Build. Environ. 2017, 124, 369–387. [Google Scholar] [CrossRef]
- Meron, N.; Meir, I.A. Building green schools in Israel. Costs, economic benefits and teacher satisfaction. Energy Build. 2017, 154, 12–18. [Google Scholar] [CrossRef]
- Vakalis, D.; Lepine, C.; MacLean, H.L.; Siegel, J.A. Can green schools influence academic performance? Crit. Rev. Environ. Sci. Technol. 2021, 51, 1354–1396. [Google Scholar] [CrossRef]
- Scott, J.T.; Kilmer, R.P.; Wang, C.; Cook, J.R.; Haber, M.G. Natural Environments Near Schools: Potential Benefits for Socio-Emotional and Behavioral Development in Early Childhood. Am. J. Community Psychol. 2018, 62, 419–432. [Google Scholar] [CrossRef]
- Samal, M.; Lama, S.L.; Luitel, S.; Ghimire, A. A pilot scale study of greywater treatment using gravel sand followed by granular activated carbon. Kathmandu Univ. J. Sci. Eng. Technol. 2020, 14, 1–7. [Google Scholar]
- López Zavala, M.Á.; Vega, R.C.; Miranda, R.A.L. Potential of Rainwater Harvesting and Greywater Reuse for Water Consumption Reduction and Wastewater Minimization. Water 2016, 8, 264. [Google Scholar] [CrossRef] [Green Version]
- Boano, F.; Caruso, A.; Costamagna, E.; Ridolfi, L.; Fiore, S.; Demichelis, F.; Galvão, A.; Pisoeiro, J.; Rizzo, A.; Masi, F. A review of nature-based solutions for greywater treatment: Applications, hydraulic design, and environmental benefits. Sci. Total Environ. 2020, 711, 134731. [Google Scholar] [CrossRef] [PubMed]
- Vymazal, J. Constructed Wetlands for Wastewater Treatment. Water 2010, 2, 530–549. [Google Scholar] [CrossRef] [Green Version]
- Tsihrintzis, V.A. The use of Vertical Flow Constructed Wetlands in Wastewater Treatment. Water Resour. Manag. 2017, 31, 3245–3270. [Google Scholar] [CrossRef]
- Gkika, D.; Gikas, G.D.; Tsihrintzis, V.A. Environmental footprint of constructed wetlands treating wastewater. J. Environ. Sci. Health A Tox. Hazard. Subst. Environ. Eng. 2015, 50, 631–638. [Google Scholar] [PubMed]
- Stefanakis, A.; Akratos, C.S.; Tsihrintzis, V.A. Chapter 13—Techno-Economic Aspects of Vertical Flow Constructed Wetlands. In Vertical Flow Constructed Wetlands: Eco-engineering Systems for Wastewater and Sludge Treatment; Elsevier: Amsterdam, The Netherlands, 2014; pp. 293–313. ISBN 978-0-12-404612-2. [Google Scholar]
- Stefanakis, A.I. The Role of Constructed Wetlands as Green Infrastructure for Sustainable Urban Water Management. Sustainability 2019, 11, 6981. [Google Scholar] [CrossRef] [Green Version]
Figure 1.
Greywater reuse system and irrigation area of Los Pozos (a) and José Santos Ossa school (b). The photographs on the right correspond to the area irrigated with treated greywater.
Figure 1.
Greywater reuse system and irrigation area of Los Pozos (a) and José Santos Ossa school (b). The photographs on the right correspond to the area irrigated with treated greywater.


Figure 2.
Sensitivity analysis of the variation of project lifetime, discount rate, and amount of greywater to be treated considering at (a) José Santos Ossa light greywater, (b) José Santos Ossa light and dark greywater, (c) Los Pozos Light greywater, and (d) Los Pozos light and dark greywater.
Figure 2.
Sensitivity analysis of the variation of project lifetime, discount rate, and amount of greywater to be treated considering at (a) José Santos Ossa light greywater, (b) José Santos Ossa light and dark greywater, (c) Los Pozos Light greywater, and (d) Los Pozos light and dark greywater.

Figure 3.
Sensitivity analysis of the variation of project lifetime, discount rate, and amount of greywater to be treated considering a state subsidy at (a) José Santos Ossa Light greywater, (b) José Santos Ossa light and dark greywater, (c) Los Pozos light greywater and, (d) Los Pozos light and dark greywater.


Table 1.
Modeling conditions of scenario 1 (Light greywater inlet).
| Modeling Conditions | Specifications | |
|---|---|---|
| José Santos Ossa | Los Pozos | |
| Inlet greywater | Light greywater | |
| Water quality of inlet greywater | ||
| sCOD [mg/L]: | 17.7 | 35.1 |
| TDS [mg/L]: | 989 | 329 |
| Fecal coliforms [MPN/1000 mL]: | 24 | 19 |
| Turbidity [NTU]: | 84.2 | 23.7 |
| Free chlorine residual [mg/L]: | 0.43 | 0.32 |
| Volume of greywater to be treated | 800 L/d | 260 L/d |
| Treatment system configuration | Filtration with activated Carbon and Zeolite + disinfection with chlorine | |
| Volume of treated greywater | 760 L/d | 247 L/d |
Table 2.
Modeling conditions of scenario 2 (light + dark greywater inlet).
| Modeling Conditions | Specifications | |
|---|---|---|
| José Santos Ossa | Los Pozos | |
| Inlet greywater | Light + dark greywater | |
| Water quality of inlet greywater * | ||
| sCOD [mg/L]: | 730 | |
| TDS [mg/L]: | 1610 | |
| Fecal coliforms [MPN/1000 mL]: | 8500 | |
| Turbidity [NTU]: | 230 | |
| Free chlorine residual [mg/L]: | 0.4 | |
| Volume of greywater to be treated | 960 L/d | 312 L/d |
| Treatment system configuration | Filtration with activated Carbon and Zeolite + + aerobic biological treatment module + disinfection with chlorine | |
| Volume of treated greywater | 912 L/d | 296 L/d |
* Average general range obtained from Vuppaladadiyam et al. [2].
Table 3.
Sensitivity analysis parameters.
| Variable | Range of Variation |
|---|---|
| Project lifetime (years) | 10 to 40 |
| Amount of greywater to be treated | −20% to +20% |
| Discount rate | 5% to 10% |
Table 4.
Economic costs and benefits of the projects evaluated at 20 years (US$).
| José Santos Ossa | Los Pozos | ||||
|---|---|---|---|---|---|
| Light | Light + Dark | Light | Ligh + Dark | ||
| Economic Cost | Capital Cost | ||||
| Collecting tanks | 211.3 | 211.3 | 211.3 | 211.3 | |
| Perimeter closure | 1105.7 | 1437.3 | 1105.7 | 1437.3 | |
| Plumbing | 614.3 | 798.5 | 614.3 | 798.5 | |
| Filter material | 175.1 | 175.1 | 175.1 | 175.1 | |
| Electric pumps | 60.2 | 120.4 | 60.2 | 120.4 | |
| Water meter | 35.0 | 35.0 | 35.0 | 35.0 | |
| Workforce | 3071.3 | 3992.6 | 3071.3 | 3992.6 | |
| Operator training | 491.4 | 638.8 | 491.4 | 638.8 | |
| Operating Cost | |||||
| Electricity, Chlorination | 68.24 | 144.99 | 22.18 | 47.12 | |
| Maintenance Cost | |||||
| Filter material, replacement materials | 1699.14 | 9588.37 | 1699.14 | 4263.14 | |
| Quality Control Cost | 2610 | 2610 | 2610 | 2610 | |
| Environmental Cost | Noise | 439.08 | 2634.48 | 439.08 | 2634.48 |
| Economic Benefit | Water savings | 1969.46 | 2363.35 | 640.07 | 768.09 |
| Environmental Benefit | Willingness to pay for green areas | 3679.69 | 3679.69 | 176.32 | 176.32 |
Table 5.
Economic indicators of viability.
| NPV [US$] | RB/C | IRR | PBP [Years] | DPP [Years] | ||
|---|---|---|---|---|---|---|
| With Subsidy | José Santos Ossa (Light) | −1246.01 | 0.82 | 0.006 | 153.5 | 51.2 |
| José Santos Ossa (Light + Dark) | −13,395.56 | 0.31 | - | - | - | |
| Los Pozos (Light) | −6032.71 | 0.12 | - | - | - | |
| Los Pozos (Light + Dark) | −13,071.10 | 0.07 | - | - | - | |
| Without Subsidy | José Santos Ossa (Light) | −4931.52 | 0.53 | - | - | - |
| José Santos Ossa (Light + Dark) | −17,081.06 | 0.26 | - | - | - | |
| Los Pozos (Light) | −9718.21 | 0.08 | - | - | - | |
| Los Pozos (Light + Dark) | −16,756.60 | 0.05 | - | - | - |
Publisher’s Note: MDPI stays neutral with regard to jurisdictional claims in published maps and institutional affiliations. |
© 2021 by the authors. Licensee MDPI, Basel, Switzerland. This article is an open access article distributed under the terms and conditions of the Creative Commons Attribution (CC BY) license (https://creativecommons.org/licenses/by/4.0/).
Share and Cite
MDPI and ACS Style
Leiva, E.; Rodríguez, C.; Sánchez, R.; Serrano, J. Light or Dark Greywater for Water Reuse? Economic Assessment of On-Site Greywater Treatment Systems in Rural Areas. Water 2021, 13, 3637. https://doi.org/10.3390/w13243637
AMA Style
Leiva E, Rodríguez C, Sánchez R, Serrano J. Light or Dark Greywater for Water Reuse? Economic Assessment of On-Site Greywater Treatment Systems in Rural Areas. Water. 2021; 13(24):3637. https://doi.org/10.3390/w13243637
Chicago/Turabian StyleLeiva, Eduardo, Carolina Rodríguez, Rafael Sánchez, and Jennyfer Serrano. 2021. "Light or Dark Greywater for Water Reuse? Economic Assessment of On-Site Greywater Treatment Systems in Rural Areas" Water 13, no. 24: 3637. https://doi.org/10.3390/w13243637
Note that from the first issue of 2016, this journal uses article numbers instead of page numbers. See further details here.