Communication

Features of the Distribution of Chlorophyll-a Concentration along the Western Coast of the Novaya Zemlya Archipelago in Spring

by
Pavel R. Makarevich
,
Veronika V. Vodopianova
*,
Aleksandra S. Bulavina
,
Pavel S. Vashchenko
and
Tatiana G. Ishkulova
Murmansk Marine Biological Institute (MMBI), 183010 Murmansk, Russia
*
Author to whom correspondence should be addressed.
Water 2021, 13(24), 3648; https://doi.org/10.3390/w13243648
Submission received: 12 November 2021 / Revised: 14 December 2021 / Accepted: 16 December 2021 / Published: 18 December 2021
(This article belongs to the Special Issue Plankton Ecology in Shallow Coastal Waters)

Abstract

:
In spring 2016, the thermohaline characteristics of water masses and the distribution of chlorophyll-a concentration in the pelagic zone of the eastern part of the Barents Sea were studied. For the first time, in the conditions of an abnormally warm year and the absence of ice cover, a complex of hydrobiological works was carried out on a section crossing the Barents Sea from south to north along the western coast of the Novaya Zemlya archipelago. High concentrations of chlorophyll-a > 1 ˂ 6 mg/m3 at all stations of the transect indicate a stage of spring bloom in the successional cycle of microalgae. Significant differences in the content of chlorophyll-a in waters of various origins were revealed. The highest concentrations of chlorophyll-a corresponded to Arctic surface water (5.56 mg/m3). Slightly lower values were observed in the transformed Atlantic waters of the Novozemelskoe and Kolguevo–Pechorskoe currents (3.53 ± 0.97–3.71 ± 1.04 mg/m3), and the lowest was in the Barents waters (1.24 ± 0.84–1.45 ± 1.13 mg/m3).

1. Introduction

In recent decades, there has been an acute problem of the natural impact of climatic factors on the marine ecosystems of the Arctic. This also applies to changes in the climatic and hydrological parameters of the Barents Sea under the influence of global warming [1,2]. Driven by an increase in the volume and temperature of incoming Atlantic water [3] since the 1980s, the Barents Sea is experiencing a rapidly warming trend [4].
Global climate change is fundamentally changing the dynamics of phytoplankton in the Arctic Ocean [5,6]. Climate change has and, according to a number of forecasts, will further have significant implications for Arctic marine ecosystems including all trophic levels: pelagic, benthic, and sympagic (sea-ice related). These changes will alter the distribution and properties of Arctic marine habitats, with associated implications for species composition, production, and ecosystem structure and function [7]. First of all, this concerns the taxonomic composition of the community, its production characteristics, and its phenology. At the same time, the levels of production characteristics of pelagic algocenoses strongly depend on significant interannual fluctuations, the seasonality of the development of the microplankton community, the timing of the onset of ice melting, as well as annual and interseasonal fluctuations in the hydrological characteristics of water masses [6,7,8,9,10,11]. The taxonomic, ecological, and phytogeographic characteristics of the microalgal community in the Barents Sea change depending on the biological season: in spring and summer, it is a complex of Arctic diatoms of neritic origin, while in autumn and winter, it is a complex of oceanic boreal Peridinium. The range of quantitative values (biomass and abundance) of the pelagic algae community development is quite wide and varies depending on the stage of seasonal succession and hydrological conditions of the year [11,12,13].
In the Barents Sea, the spring development of phytoplankton begins in late April–early May. This event is preceded by the formation of a light regime favorable for microalgae throughout the entire thickness of the shallow Barents Sea shelf and the lowest water temperature values for the entire annual hydrological cycle (down to −1.5 °C), as well as the presence in the pelagic zone, with maximum annual concentrations of biogenic elements mineral forms. The vertical profiles of temperature and salinity indicate the complete homogeneity of the distribution of these characteristics in the water column [11,14]. The beginning of phytoplankton vegetation is primarily associated with the coastal zones of the eastern shallow water and ice-edge areas [12]. The timing of the onset of phytoplankton vegetation and the intensity of its spring development are greatly influenced by the influx of warm Atlantic waters [5]. Areas with different levels of quantitative development of phytocenosis are localized in the Barents Sea water area in certain water masses of different genesis (coastal, the Barents waters, and waters of Atlantic origin) [11], which is a distinctive feature of the spatial distribution of productivity levels of the phytoplankton community in the Barents Sea.
The least studied marine coastal ecosystems and their most important component—the pelagic microalgae communities of the Arctic hard-to-reach archipelagos (including the Novaya Zemlya archipelago)—are of great interest to researchers. The inaccessibility and ice conditions along the western coast of the Novaya Zemlya archipelago in winter and spring impede early spring phytoplankton studies. Phytoplankton surveys known to us in the coastal area of Novaya Zemlya or the Barents Sea eastern part refer to the summer-autumn period [15,16]. Studies of the spring period of the phytoplankton community development in the Barents Sea are mainly associated with its central and northern parts [2,17,18,19,20,21] and do not cover the coastal areas of the polar archipelagos.
In the winter season of 2015–2016, the ice cover in the eastern part of the Barents Sea was poorly developed; small areas of young ice were observed along the Novaya Zemlya coast from January to March. Since the beginning of April 2016, there has been no ice in the study area [22]. The ice regime, as well as the thermohaline characteristics of the waters in the study area, indicated a continuing warming trend in the Barents Sea basin [23,24,25], which allowed attributing 2016 to abnormally warm years.
The main feature of the Novaya Zemlya archipelago coastal areas is the presence of a seasonal ice cover (fast ice type), which is present here most of the year and actually completely determines the seasonal dynamics of coastal pelagic systems. Interannual fluctuations in the ice cover can be quite significant. For example, in abnormally cold years, the Novaya Zemlya western coast is completely cleared of ice only in July–August, and on the eastern coast, drifting ice can persist throughout the summer. In abnormally warm years, the western coast of Novaya Zemlya is cleared of ice already in April–May, and its Kara Sea coast in May–June [15]. As a result, the length of the phytoplankton growing season varies from year to year, depending on the ice conditions of the Barents and Kara Seas.
Our work aimed to study the distribution of chlorophyll-a concentration in the coastal area of the Novaya Zemlya archipelago, as an indicator of the productivity and the level of quantitative development of the phytoplankton community during the spring stage of the successional cycle. Ice conditions in the spring of 2016 allowed us to carry out full-scale and never-before-conducted surveys along the entire western coast of the Novaya Zemlya archipelago.

2. Materials and Methods

The studies of the hydrological parameters of water masses and the concentration of chlorophyll-a in the pelagic zone of the Barents Sea along the western coast of the Novaya Zemlya archipelago were carried out from 10 to 14 May 2016 during the cruise of the R/V “Dalnie Zelentsy” (Figure 1). Studies were carried out at 13 stations. The enumeration of stations is shown according to expedition reports.
Seawater sampling, for further chlorophyll-a determination, was carried out in the photic layer of the pelagic zone at the horizons of 0, 10, 25, 50 m. The phytoplankton bloom was visually determined during sampling. The Carousel Water Sampler and “Hydrobios” bathometers (Kiel, Germany) were used. In total, 52 samples were taken and processed. We used methodological recommendations [26,27], based on the classical method for the determination of chlorophyll-a by UNESCO [28]. No deviations from the method were allowed. Water samples with a volume of 5 L for each horizon were filtered immediately in the ship’s laboratory on a vacuum filtration unit. Membrane filters with a diameter of 47 mm and a pore size of 0.6 μm were used. After filtration, the filters, folded in half with the sediment inward, were stored in a silica gel desiccator in a freezer at −20 °C. Further processing of samples was carried out in a stationary hydrochemical laboratory. In addition, 90% acetone was used. After homogenizing the filters, the precipitate was centrifuged at 8000 rpm. The concentration of chlorophyll-a in the extract was determined spectrophotometrically on a UV–Visible spectrophotometer Nicolet Evolution 500 (Spectronic Unicam, Cambridge, UK).
The temperature and salinity of the water were determined using an SBE 19 plus CTD profiler (Sea-Bird Electronics, Bellevue, WA, USA). The accuracies of the temperature and conductivity measurements were ±0.005 °C and ± 0.0005 S/m, respectively. The sampling rate was 32 Hz, and after data quality and filtering processes, the vertical resolution was 1 m. Based on the obtained data, contours of temperature and salinity in both horizontal and vertical directions along the transect were constructed for the analysis. Furthermore, the classical TS analysis [29] was used to distinguish the individual water masses within the transect.
For hydrochemical studies, seawater samples were taken at the same stations from the surface to the bottom in 0, 10, 25, 50, 75, and 100 m of the bottom layer. Nitrates, phosphates, and silicates were measured using a PE-5300VI spectrophotometer. Inorganic dissolved phosphorus (Р-PO4) was determined by the Murphy–Riley method, dissolved silicon (Si-SiO3) by the Korolev method, nitrate–nitrogen (N-NO3) by the Bendschneider and Robinson methods [30,31,32,33].

3. Results

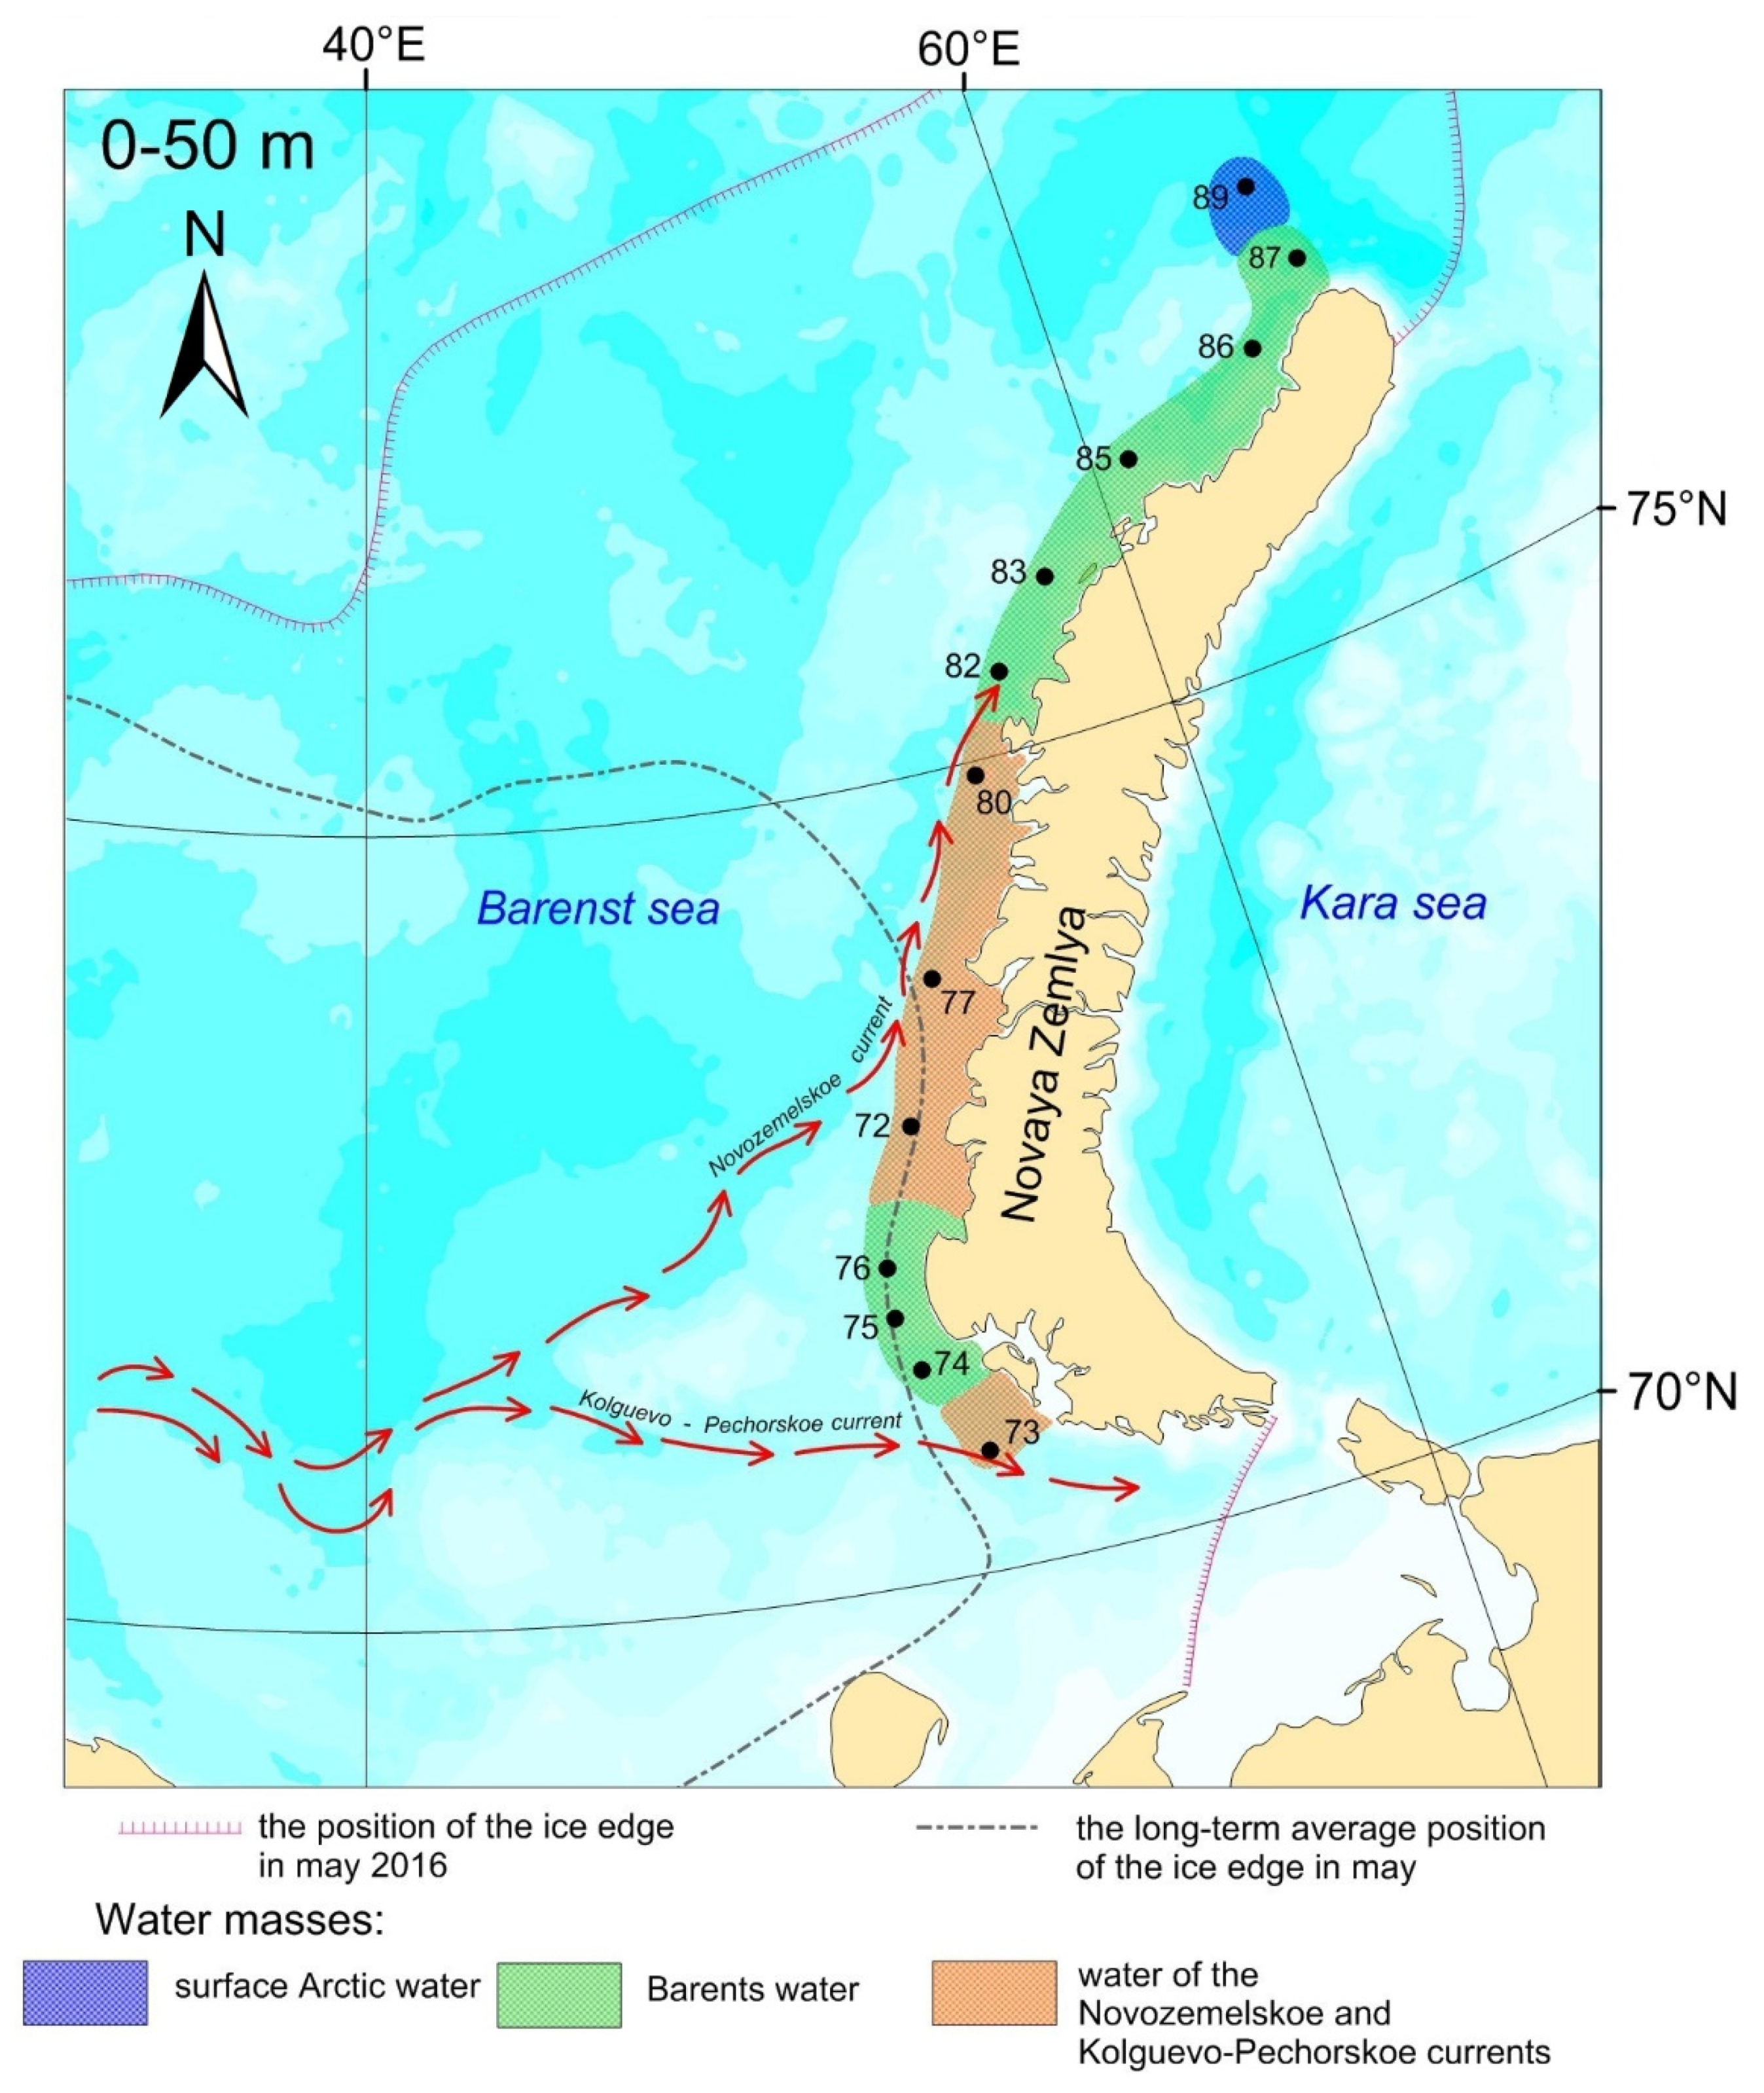
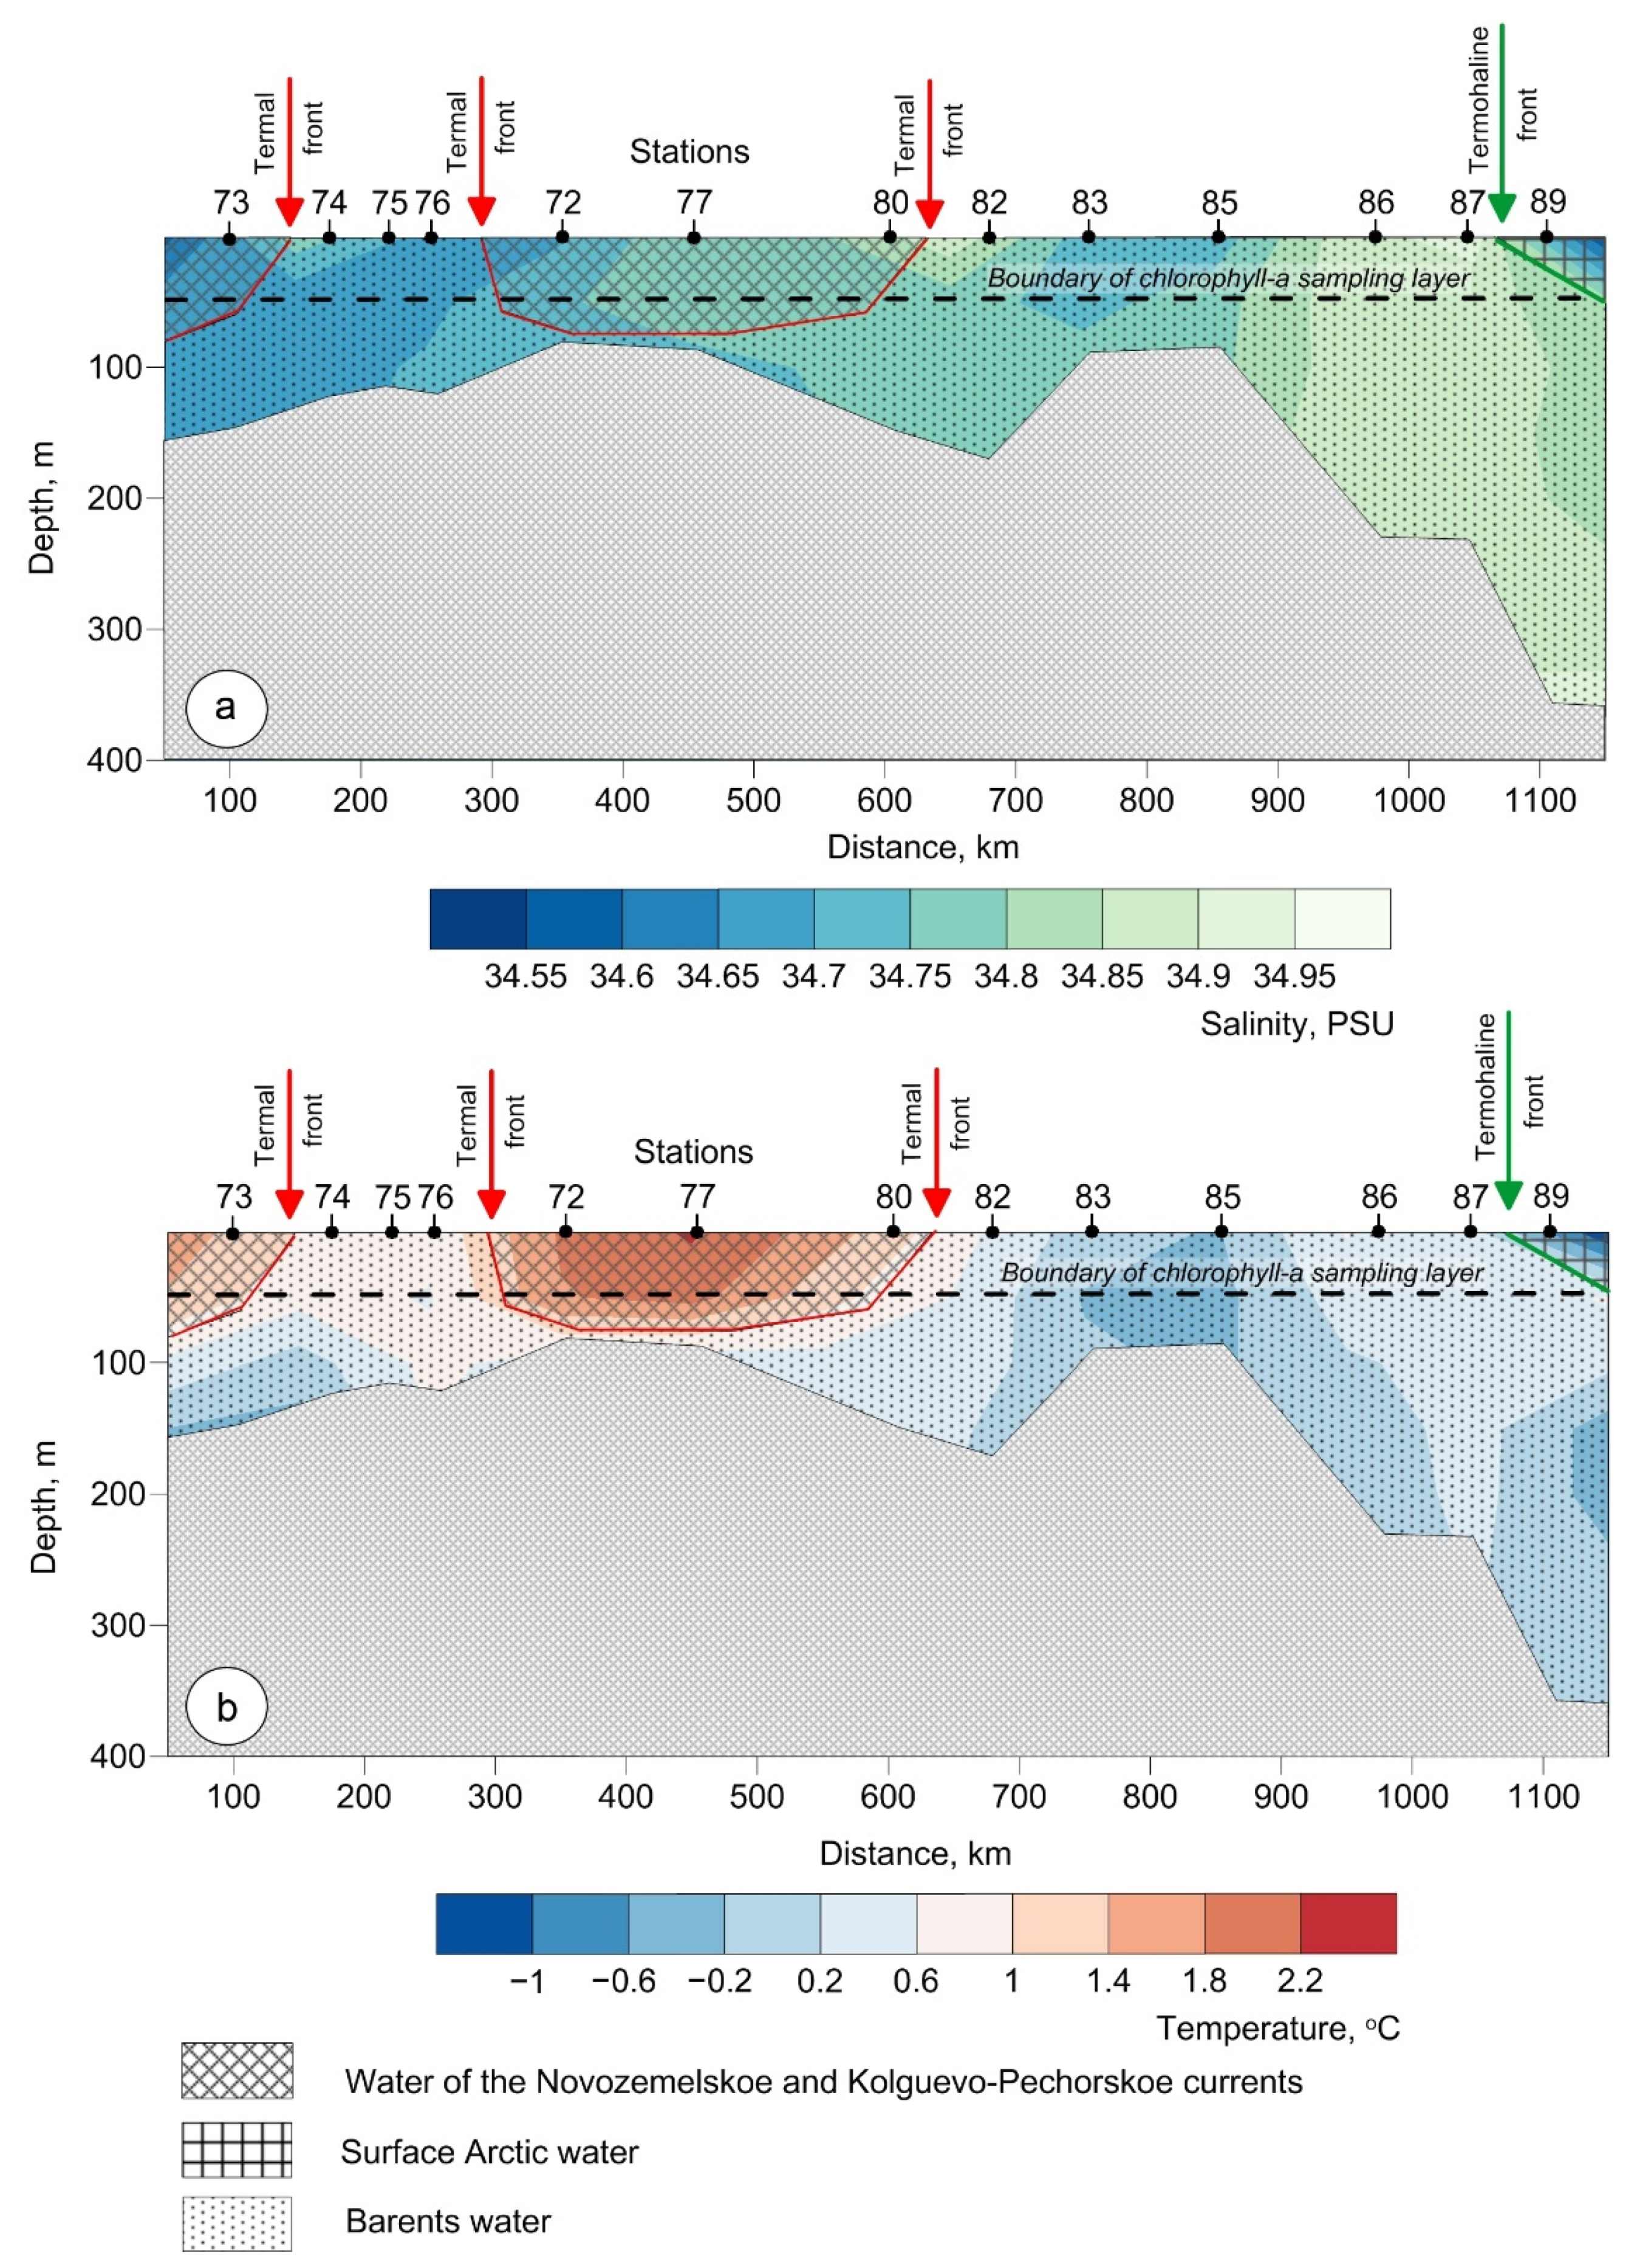
3.1. Water Masses at the Transect

The Barents Sea is located on the path of ocean currents that transfer heat from the Atlantic to the Arctic Ocean. Atlantic waters enter the Barents Sea with the North Cape Current from the west, as well as through deep trenches from the north after passing through the Arctic basin [34,35,36]. In the Arctic basin, in the process of interaction with the atmosphere and ice cover, the part of the Atlantic water in contact with the surface is rapidly cooled and freshened. The upper part of the Atlantic waters transforms into an Arctic surface-water mass with negative temperatures and reduced salinity [37]. The stream of Atlantic waters that pass through the Barents Sea transforms more slowly and can be identified even at the eastern border of the sea [38]. The transformed Atlantic waters approach the Novaya Zemlya archipelago from the southwest with Novozemelskoe and Kolguevo–Pechorskoe surface currents, and the northeast along the St. Anna Trough and the Western Trench on depths of about 100 m.

3.1.1. Water of the Novozemelskoe and Kolguevo–Pechorskoe Currents

Stations 72, 73, 77, and 80 were located in the area of influence of warm Atlantic currents. At these stations, a well-defined thermocline lay at depths of 60–90 m, separating the surface warm waters of the Atlantic currents (1.3 … 2.2 °C) from the Barents waters, with temperatures close to 0 °C (Figure 2).

3.1.2. Barents Water

The Novaya Zemlya archipelago is a large land area. In spring, freshened coastal waters are formed near the Novaya Zemlya coast. The influence of runoff from Novaya Zemlya can be traced at a distance of up to 50 km during the warm season [39]. In winter, the rivers of the archipelago freeze to the bottom, so the coastal water mass is not expressed. In winter and early spring, the Barents waters, well mixed during autumn convection, prevail on the western coast of Novaya Zemlya.
According to the “Malye Karmakuly” meteorological station [40,41], at the beginning of May 2016, a negative air temperature remained over the archipelago. At the time of research, the spring flood in the archipelago had not yet begun. At stations 74–76 and 82–87, the water column was homogeneous from the surface to the bottom. Temperatures varied from −0.3 °C to 0.7 °C, while salinity ranged from 34.64 PSU to 34.90 PSU, which corresponded to Barents water mass.

3.1.3. Arctic Surface Water

At station 89, to a depth of 30 m, there was a layer of Arctic surface waters with negative temperatures (−1.3 °C) and low salinity (34.56 PSU). At depths of 30–70 m, there was a thin layer of Atlantic waters that passed through the Arctic basin, while deeper layers were the Barents waters.

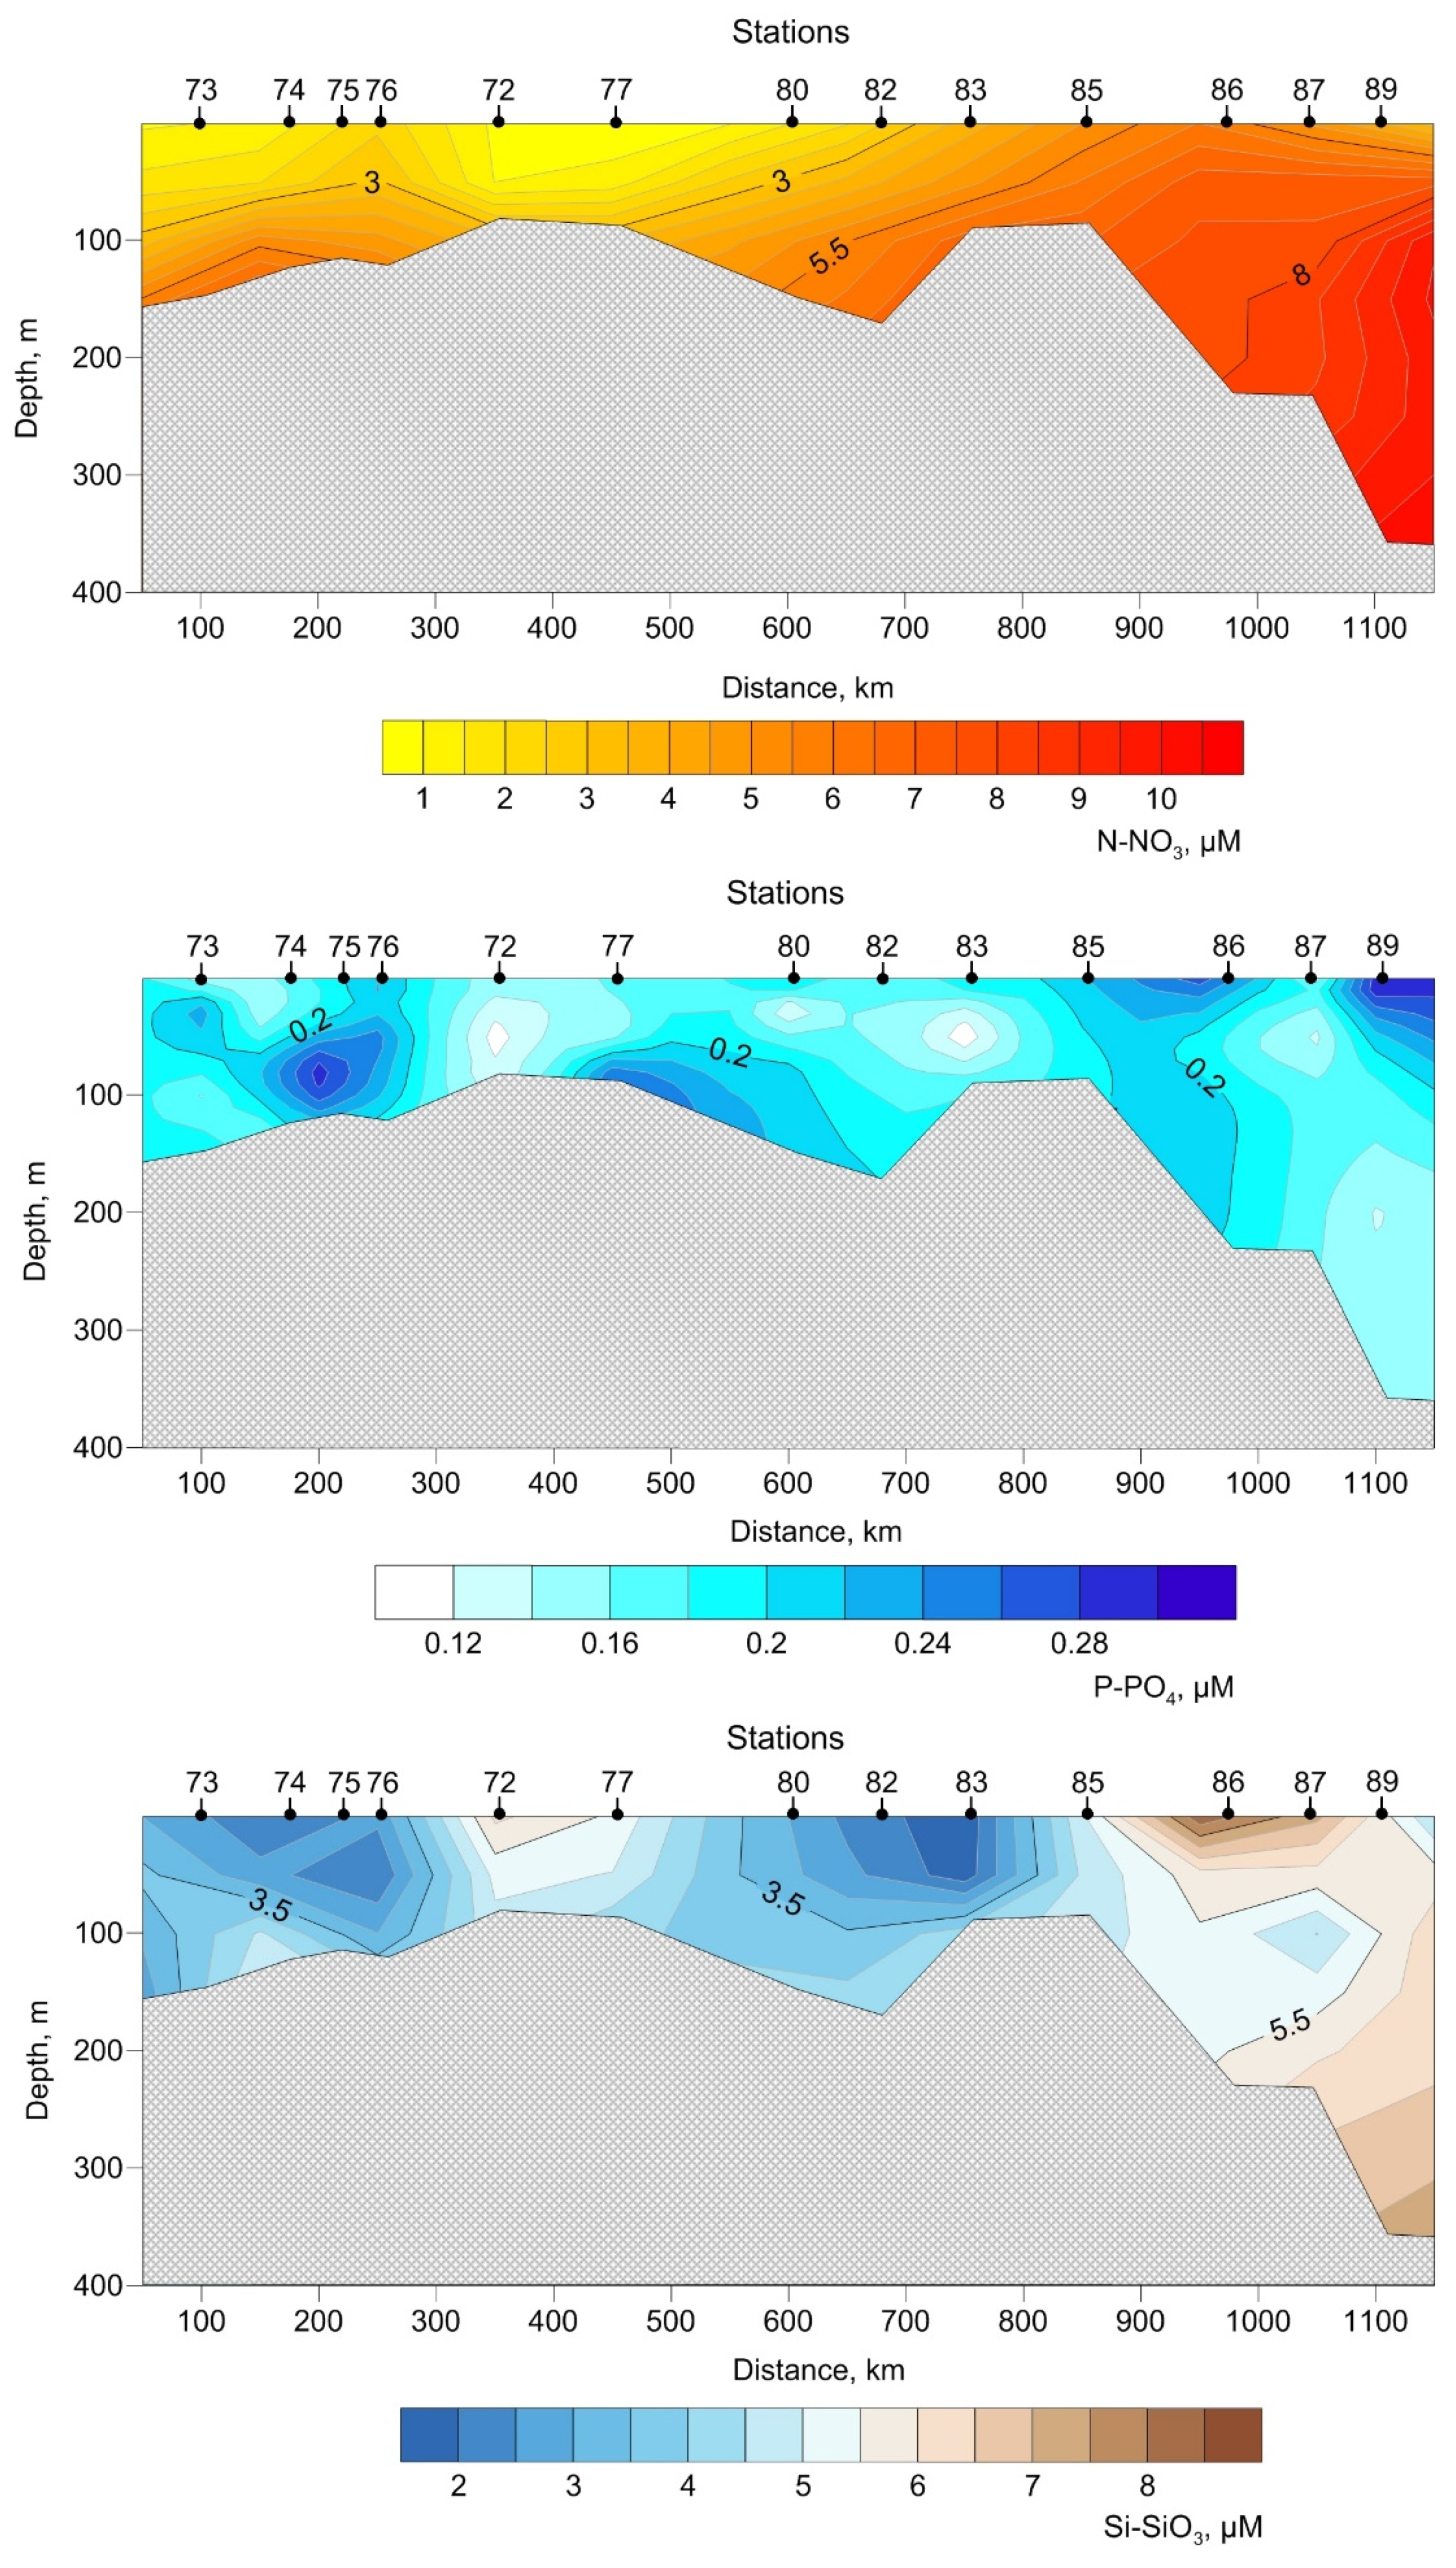
3.2. Biogeochemistry of the Transect
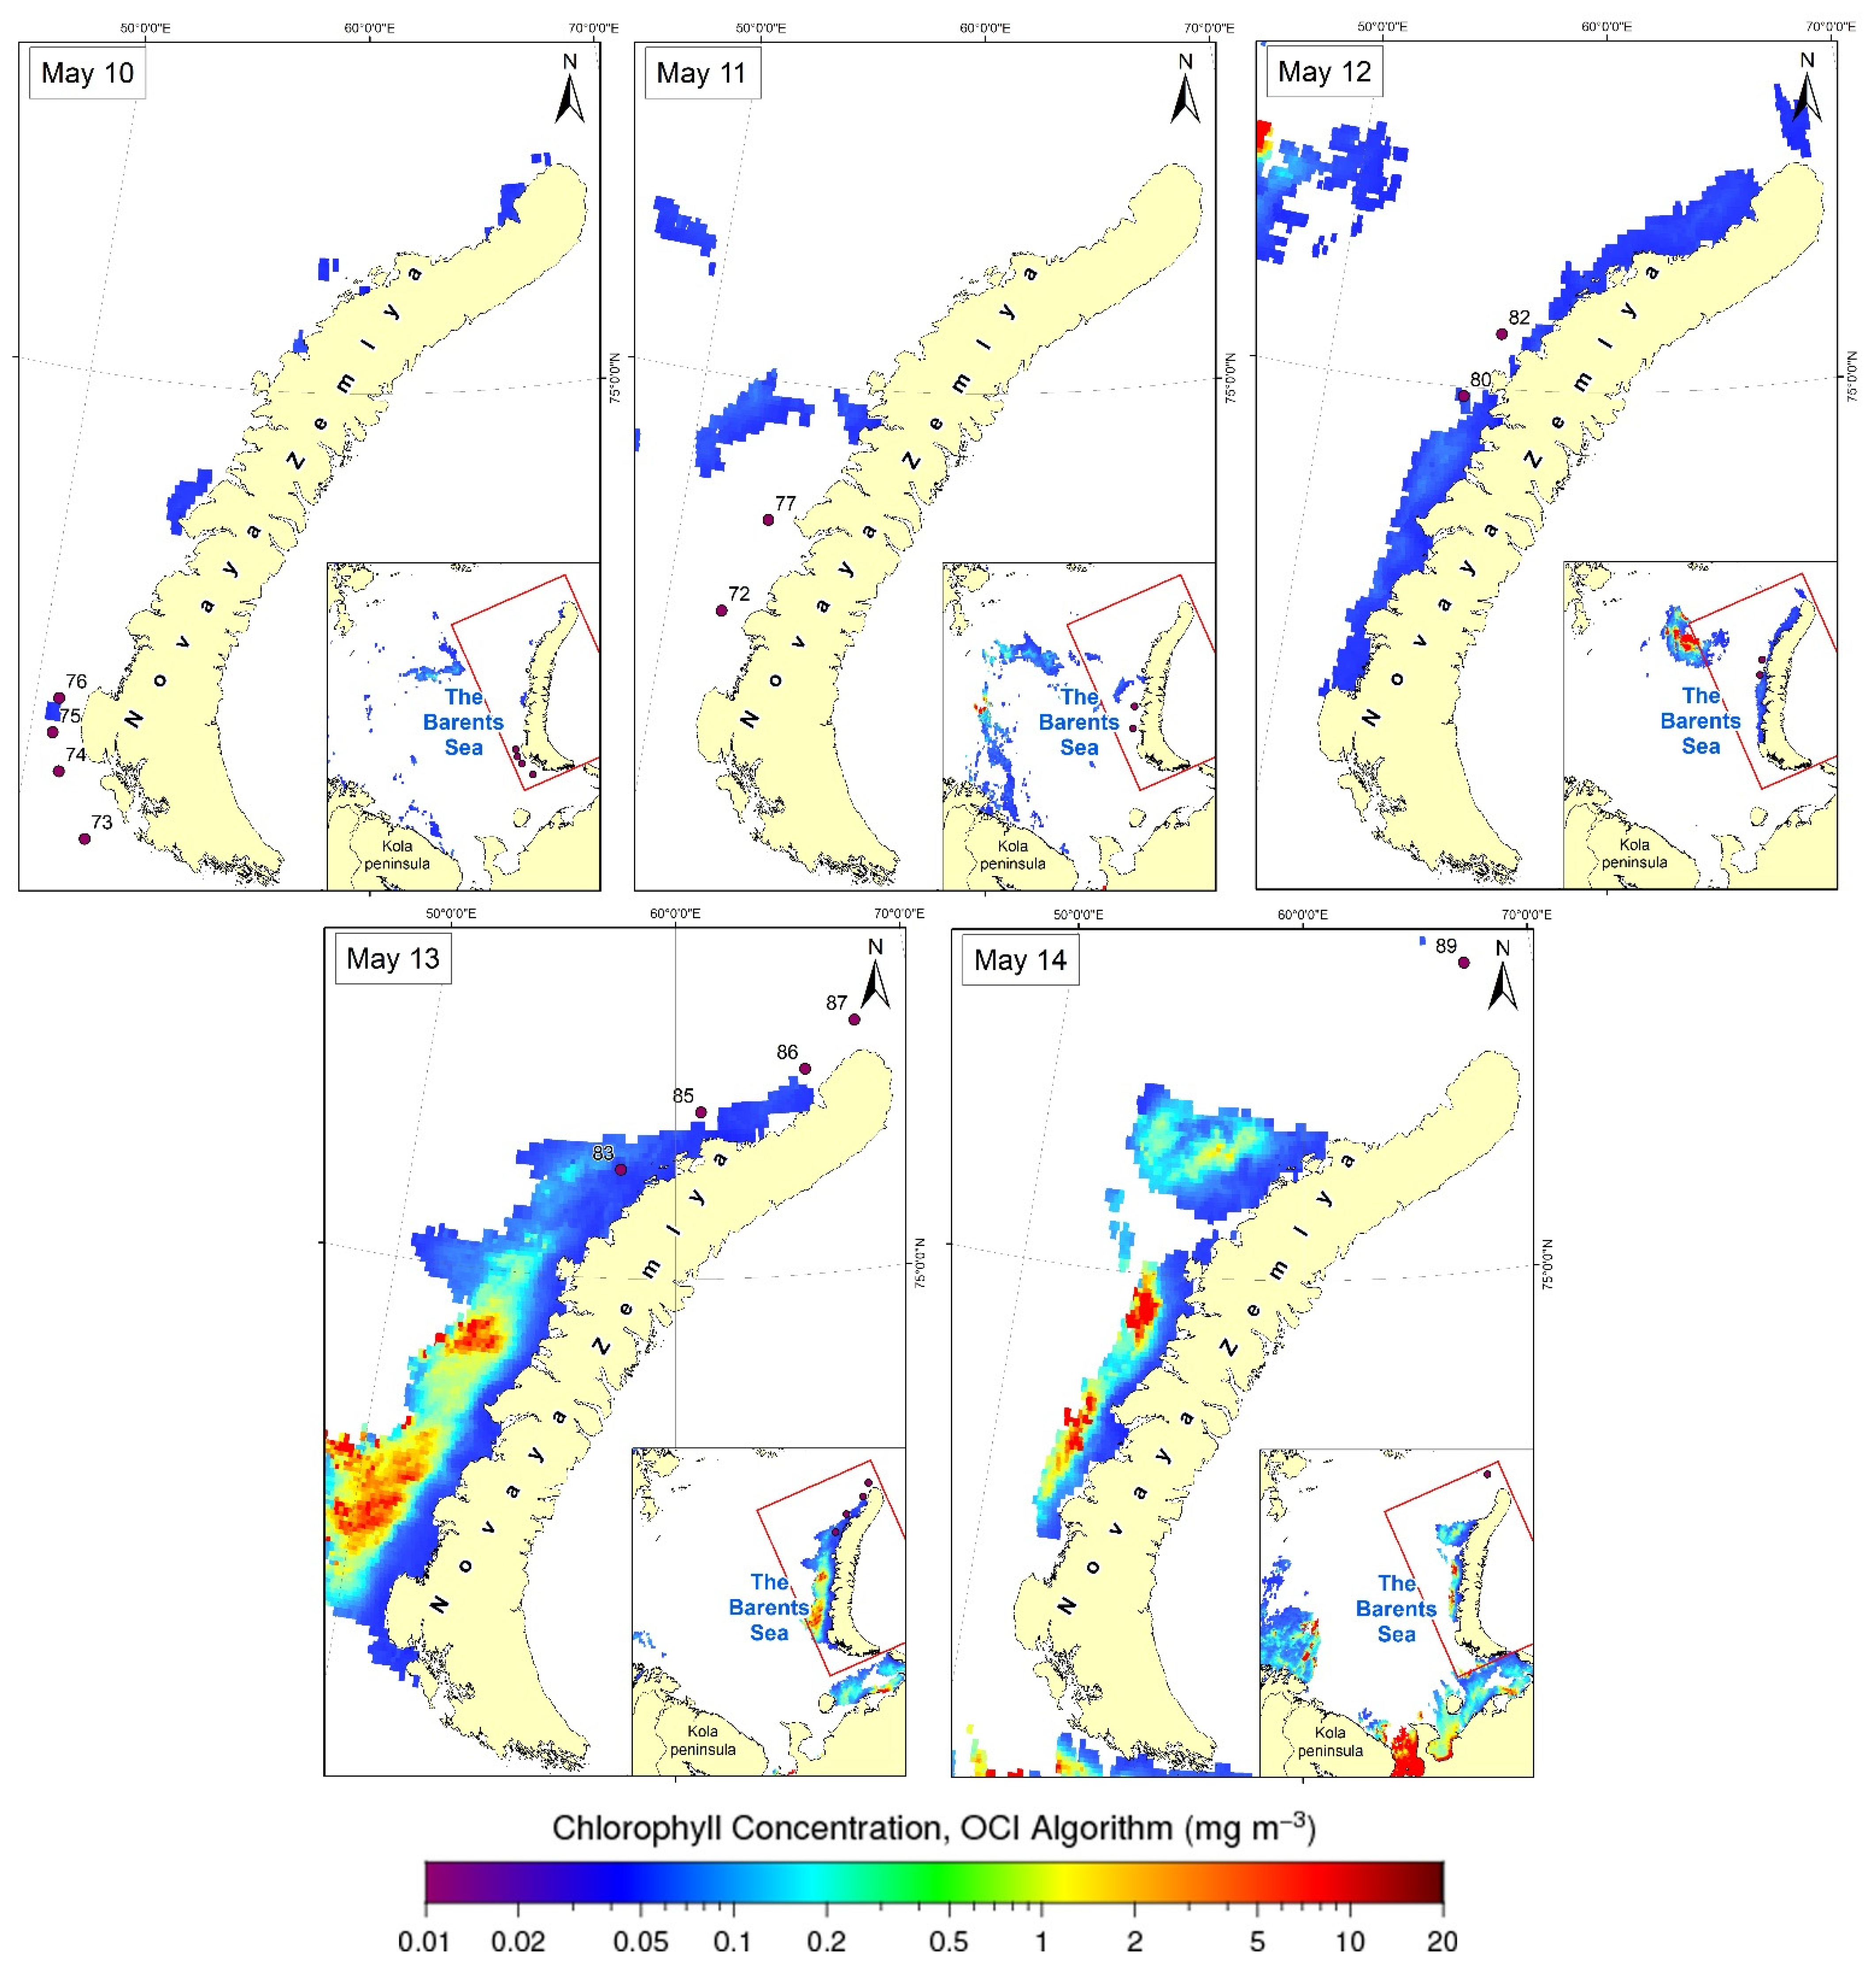
The transect had a complex hydrochemical structure due to the mixing of waters of various origins. In the transformed Atlantic waters of the Kolguevo–Pechorskoe and Novozemelskoe currents, the range of phosphate concentrations (P-PO4) varied in the range of 0.11–0.23 µM, nitrates (N-NO3) in the range of 0.54–2.18 µM, and silicates (Si-SiO3) in the range of 2.04–6.49 µM; in the Barents Sea waters, their concentrations were 0.09–0.31 µM, 1.25–11.34 µM, and 0.37–10.61 µM; in Arctic waters, their concentrations were 0.27–0.30 µM, 1.34–3.81 µM, and 3.24–5.28 µM, respectively (Figure 3).
At stations 72, 73, 77, and 80, located in the waters of Novozemelskoe and Kolguevo–Pechorskoe currents, the concentration of chlorophyll-a varied in the 0–50 m layer in the range from 3.53 ± 0.97 mg/m3 to 3.71 ± 1.04 mg/m3 (Figure 4; Appendix A, Table A1). Concentrations did not fall below 2.37 mg/m3 (st. 80). At a depth of 50 m (located on station 77), a local maximum chlorophyll-a concentration of 5.08 mg/m3 was recorded.
The lower chlorophyll-a concentrations corresponded to the Barents waters (Figure 4; Appendix A, Table A1), varying in the 0–50 m layer in a range of 1.24 ± 0.84–1.45 ± 1.13 mg/m3. The minimum chlorophyll-a concentrations of 0.02 mg/m3 (10 m) were observed at station 87, while the maximum was recorded as 3.91 mg/m3 at station 85 (50 m).
The highest pigment concentration was recorded in waters of Arctic origin at the northernmost station 89 (Figure 4; Appendix A, Table A1). Here, in the surface layer, the concentration of chlorophyll-a was 5.56 mg/m3, and in the 10 m layer, 5.14 mg/m3. With depth, the chlorophyll-a concentration significantly decreased, down to 0.46 mg/m3 at a horizon of 50 m, which corresponded to an interlayer of Atlantic waters.
The highest concentrations of chlorophyll-a corresponded to both the area with the lowest temperature, −1.3 °C (station 89, Arctic water) and the area of the studied water area where the water temperature was the highest, i.e., 1.3–2.2 °C (Novozemelskoe and Kolguevo–Pechorskoe currents of transformed Atlantic waters). The waters of the Kolguevo–Pechorskoe and Novozemelskoe currents were separated from the Barents waters (−0.4–0.8 °C) by a well-pronounced temperature front but practically did not differ from them in salinity. At the same time, the concentration of chlorophyll-a was lower in the Barents waters than in the currents. There was no linear relationship between changes in chlorophyll-a concentration and water temperature or salinity. However, the concentration of chlorophyll-a changed rapidly when crossing the lines of hydrological fronts. Thus, the dynamics of chlorophyll-a are probably associated not with the thermohaline characteristics of water masses but with their origin and migration routes.

3.3. Satellite Data

Modern satellite methods, in comparison with more labor-intensive methods of direct sampling from a vessel and their subsequent processing in the laboratory, provide more extensive opportunities for assessing the concentration of chlorophyll-a in a wide range of spatial and temporal scales with regular intervals [42,43,44].
Comparison of our data (Appendix A, Table A1) with the results of remote sensing (Figure 5) showed that most of the results of field observations are not covered with data of remote sensing of the earth (ERS), which is generally natural for high latitudes. For example, in [45], it was shown that studies of chlorophyll-a concentrations at high latitudes above 75° N are very limited.
Simultaneously, the results of remote sensing and our field measurements are available only for stations 80 (May 12) and 83 (May 13). The values of chlorophyll-a concentration, according to the remote sensing, for station 80 turned out to be higher, and for station 82, they were lower than we registered through field observations (Appendix A, Table A1). This can be explained by the fact that the estimates made using remote sensing data are not always comparable in terms of accuracy with the results of direct measurements. Therefore, particularly for the Barents Sea, the currently existing standard processing algorithm based on the MODIS-Aqua scanner data significantly distorts the chlorophyll-a concentrations in comparison with the direct measurement data, and it requires the use of regional algorithms [43,44].

4. Discussion

Despite the quite long absence of ice along the entire western coast of the Novaya Zemlya archipelago and the absence of spring floods in the archipelago, high concentrations of chlorophyll-a (>1 ˂6 mg/m3) during observations indicate a stage of spring bloom in the successional cycle of the phytoplankton community.
In the Barents Sea, the spring development of phytoplankton, according to the literature data, begins in late April-early May, primarily in the coastal zones of eastern shallow water and near ice-edge regions (chlorophyll concentrations, in this case, reach 6 mg/m3) [12,46,47,48]. These areas are characterized by the intense blooming of arctoboreal neritic diatoms in the early spring period. The spring peak of phytoplankton development can be represented as a series of successive outbreaks of the proliferation of microalgae individual populations during the spring phase of the successional cycle of pelagic algocenoses [11]. The initial phase of the phytoplankton spring bloom is traditionally associated with ice melting, the onset of floods, and a good supply of nutrients. The initiation of the development of phytoplankton by the process of ice melting is associated with the ingress of planktonic algae from the ice into the water column, an increase in insolation, the formation of a freshened layer near melting ice, and the supply of nutrients with meltwater. It is known that in the period preceding bloom, the chlorophyll-a concentration reaches about 0.5 mg/m3 and then undergoes a sharp rise in its values [15]. According to satellite data, the active bloom phase at each specific point lasts no more than 5–6 days [18]. According to the literature, in May 1999, in the surface layer at a distance of only a few kilometers, the chlorophyll concentration differed by an order of magnitude, and the phytoplankton community was at different stages of the successional cycle [19]. However, long-term observations (1998–2014) in the regions of the Barents Sea covered with seasonal ice allowed the authors of [2] to conclude that an earlier ice retreat does not necessarily mean an earlier phytoplankton bloom. Specifically, they found that whenever sea ice recedes between late March and mid-May, phytoplankton will typically peak around mid-May, similar to open water conditions. This finding suggests that factors other than sea ice are inhibiting blooming before this time. Our studies in the ice-edge zone in the north of the Barents Sea in April 2016 and 2019 did not record the spring bloom of the phytoplankton community. Only in May 2018 did we observe the phytoplankton spring bloom in the ice-edge zone [49].
It can be concluded that there is no complete clarity in understanding the process of the spring development of phytoplankton in the Barents Sea (time, initiating factors), and further studies of this phenomenon under conditions of climate warming in the Arctic should be continued.
In our studies, the mosaic distribution of chlorophyll-a concentrations along the western coast of Novaya Zemlya is undoubtedly due to the influence of various water masses. The highest concentrations of chlorophyll-a during the period of our research corresponded to the surface Arctic water (5.56 mg/m3). Slightly lower values were determined in the transformed Atlantic waters of the Novozemelskoe and Kolguevo–Pechorskoe currents (3.53 ± 0.97–3.71 ± 1.04 mg/m3), with the lowest in the Barents waters (1.24 ± 0.84–1.45 ± 1.13 mg/m3). Our long-term (2016, 2018, 2019) studies of the chlorophyll concentrations in various types of waters in the open part of the Barents Sea confirm this pattern [49,50].
Therefore, in May 2018 [50], in the western part of the Barents Sea, in the area of influence of the Polar Front, the average concentration of chlorophyll-a in the Arctic water mass in the 0–50 m layer was 2.67 ± 0.29 mg/m3, while in the Atlantic water mass, it was 0.52 ± 0.04 mg/m3.
It is known that the phytoplankton community is influenced by the availability of basic nutrients, on the one hand, and the press of zooplankton, on the other. Accordingly, a change in one factor or another will be followed by a change in the production characteristics of phytoplankton—in the aspect of our study, chlorophyll-a. During the study period, at stations located in the transformed Atlantic waters of the Novozemelskoe and Kolguevo–Pechorskoe currents, the total zooplankton abundance was 513 ind./m3, and the total zooplankton biomass was 4.5 mg of wet mass/m³. At stations located in the Barents waters, these indicators were 2.7 times (1376 ind./m3) and 4.7 times (21.2 mg of wet mass/m³) higher, respectively [51]. The massive development of zooplankton in the Barents waters, which are colder (−0.3–0.7 °C) than the transformed Atlantic waters of the Novozemelskoe and Kolguevo–Pechorskoe currents (1.3–2.2 °C), indicates a powerful hydrological influence on zooplankton and, indirectly, on the content of chlorophyll-a. Differences in the chlorophyll-a concentrations in these two types of water masses most likely were the result of the grazing of phytoplankton organisms by zooplankton. According to the literature data [52], due to the warming trend in the Barents Sea basin, the total biomass and production of zooplankton communities increase with decreasing water temperature and salinity.
Hydrological factors, as well as the development of zooplankton and phytoplankton, indirectly affect the hydrochemical composition of seawater and nutrient content in the pelagic zone of the Barents Sea. Key nutrients control phytoplankton abundance. For the western coast of the Novaya Zemlya archipelago, the nutrient concentration is well studied only in summer [15]. In summer, the concentration of phosphates (P-PO4) in surface waters varies from analytical zero to 0.2–0.5 µM, while in the deep and bottom layers, it increases to 0.9–1.0 µM. Nitrites (N-NO2) are found in trace amounts, and outside the euphotic zone, their concentrations rise to 8–10 µM.
The dynamics of phosphorus, nitrogen, and silicon concentrations in the surface layer of the Barents Sea are clearly seasonal in nature. Intensive consumption of phosphates begins in March–April, as they are included in production processes. According to the literature data [47], in January–February, the concentration of phosphates in the surface layer of the Barents Sea is 0.6–0.9 µM, and it is decreased from west to east and from north to south. At the bottom, mean annual phosphate concentrations range from 0.7 µM to 1.05 µM. During the peak of spring bloom, it can drop to almost zero. In winter, Atlantic waters entering the Barents Sea contain 6–7 µM of nitrate–nitrogen in the surface layer, and in the bottom layer, 8–9 µM. Spring development of phytoplankton leads to a noticeable decrease in nitrate concentrations, down to 4 µM, in the surface layer. The waters of the Barents Sea are far from being saturated with silicon. Its content ranges from 3.7 µM to 7.5 µM in the surface layer and from 4 µM to 9 µM in the bottom layer, to almost complete assimilation in summer. According to the data [50] of the western part of the Barents Sea, in the zone of influence of the Polar Front in May, the average content of phosphates in the 0–50 m layer of the Arctic waters was 0.31 ± 0.01 µM, while nitrates were found at a concentration of 3.05 ± 0.06 µM, and silicates, 5.93 ± 0.23 µM. In Atlantic waters, these values were 0.25 ± 0.01 µM, 2.32 ± 0.13 µM, and 4.54 ± 0.65 µM, respectively.
During the period of our research, phosphates concentrations (P-PO4) in the 0–50 m layer varied in a small range of 0.09–0.31 µM; no significant differences were observed between stations located in different water masses. The reason for the low concentrations of phosphates and nitrates is usually their consumption by phytoplankton [53]. Phosphates concentrations in the studied water area did not drop to analytical zero, although the studied area had low levels in the 0–50 m layer. A much greater contrast between different types of water was observed for nitrates (N-NO3)—their concentrations in the 0–50 m layer varied in the transformed Atlantic waters of the Novozemelskoe and Kolguevo–Pechorskoe currents within 0.54–2.18 µM (which is low), indicating the active consumption of nutrients by phytoplankton. At stations located in the Barents waters, nitrate concentrations in the 0–50 m layer were somewhat higher and amounted to 3.20–7.42 (station 83–87) and 1.25–3.20 µM (station 74–76). At station 89 (Arctic water), this value increased up to 3.84 µM; it is worth noting that indicators of about 4 µM should be considered as characteristic of the spring phytoplankton bloom [47]. Silicon (Si-SiO3) concentrations ranged from 0.37 µM to 10.61 µM, reaching a maximum in the northern part of the transect.
An attempt to confirm our in situ data with the results of satellite observations showed that high cloudiness in the region prevents obtaining reliable results, which confirms the importance of field observations in the study of the Barents Sea. This proves that the Global Ocean Observing System only provides partial coverage in extreme areas such as the Arctic region [54]. However, it is difficult to disagree that there is a need for continuous monitoring of the Arctic ecosystem, which is fundamental to gain a greater understanding of the impact of changes on the natural environment, and access to user-friendly, low-cost instrumentation remains a limiting factor in coastal ocean observations [55]. In addition, in situ data such as those presented in this article are among the essential factors for the further development of new, more efficient observation methods and instruments.

5. Conclusions

Since the beginning of April 2016, there has been no ice in the area of the Novaya Zemlya archipelago western coast, which, together with the thermohaline characteristics of the waters, characterized 2016 as anomalously warm. Favorable conditions made it possible to conduct a large-scale study of the distribution of chlorophyll-a concentration as an indicator of productivity and as a quantitative measure of the level of phytoplankton community development in the Novaya Zemlya archipelago coastal area. High, overall chlorophyll-а concentrations (>1˂6 mg/m3) level testified to a stage of active vegetation (spring bloom) in the successional cycle of the Novaya Zemlya coast microalgae.
In May 2016, three types of waters were identified along the western coast of Novaya Zemlya—Arctic, transformed Atlantic, and the Barents waters. The distribution of chlorophyll-a concentrations corresponded to these types of waters. The highest concentrations of chlorophyll-a corresponded to surface Arctic water. Slightly lower values were determined in the transformed Atlantic waters of Novozemelskoe and Kolguevo–Pechorskoe currents, while the lowest were found in the Barents waters.
This work contains unique data on the chlorophyll-a concentration in the pelagic zone of the coastal area of the Novaya Zemlya archipelago in an abnormally warm year. Together with data on the hydrological and hydrochemical state of waters, it is of interest for further research in the Arctic. The results of this study can serve as a base for comparison the production parameters of the pelagic zone in abnormally warm years and years with other ice conditions. It is important that, in the framework of monitoring activities in the Arctic, biological communities and ecosystem processes are characterized together with physicochemical observations.

Author Contributions

Conceptualization, P.R.M.; methodology, P.R.M.; formal analysis, V.V.V., A.S.B. and T.G.I., investigation, V.V.V. and A.S.B.; data curation, V.V.V.; visualization, A.S.B. and P.S.V.; writing—original draft preparation, P.R.M., V.V.V., A.S.B. and P.S.V. All authors have read and agreed to the published version of the manuscript.

Funding

This study was funded by the Ministry of Science and Higher Education of the Russian Federation. State assignment number MMBI 121091600105-4, theme “Planktonic communities of the Arctic seas under the conditions of modern climatic changes and anthropogenic impact”.

Institutional Review Board Statement

Not applicable.

Informed Consent Statement

Not applicable.

Data Availability Statement

The data are available on request from the corresponding author.

Acknowledgments

We thank the personnel of the Plankton Laboratory at the Murmansk Marine Biological Institute for assistance with collecting and processing water samples.

Conflicts of Interest

The authors declare no conflict of interest.

Appendix A

Table A1. Concentrations of chlorophyll-a (Chl-a) in situ and satellite data.
Water MassesStDateCoordinatesTotal Depth (m)Chl-a (mg/m3) at Depth (m)Satellite Data
0102550Chl-a (mg/m3)
Water of the
Novozemelskoe and Kolguevo–
Pechorskoe
currents
7211 May72°40′ N, 51°33′ E854.594.974.434.27no data
7310 May70°45′ N, 52°00′ E1563.183.603.152.56no data
7711 May73°44′ N, 52°50′ E893.983.834.235.08no data
8012 May74°55′ N, 54°54′ E1542.372.442.572.530.63
Mean ± std 3.53 ± 0.973.71 ± 1.043.60 ± 0.883.61 ± 1.27
Barents water7410 May71°20′ N,
51°01′ E
1302.581.371.681.80no data
7510 May71°41′ N,
50°39′ E
1141.121.261.511.41no data
7610 May71°60′ N,
50°39′ E
1221.892.082.531.60no data
8212 May75°30′ N,
56°07′ E
1680.521.830.881.00no data
8313 May76°00′ N,
57°55′ E
930.210.440.311.190.53
8513 May76°32′ N,
61°01′ E
850.621.570.523.91no data
8613 May76°53′ N,
65°16′ E
2240.951.631.540.26no data
8713 May77°17′ N,
67°30′ E
2292.050.021.640.39no data
Mean ± std 1.24 ± 0.841.28 ± 0.701.33 ± 0.721.45 ± 1.13
Surface Arctic water8914 May77°50′ N,
67°03′ E
3655.565.142.590.46no data

References

  1. Comiso, J.C.; Hall, D.K. Climate trends in the Arctic as observed from space. WIREs Clim. Chang. 2014, 5, 389–409. [Google Scholar] [CrossRef] [PubMed]
  2. Dong, K.; Kvile, Ø.K.; Stenseth, N.C.; Stige, L.C. Associations among temperature, sea ice and phytoplankton bloom dynamics in the Barents Sea. Mar. Ecol. Prog. Ser. 2020, 635, 25–36. [Google Scholar] [CrossRef]
  3. Neukermans, G.; Oziel, L.; Babin, M. Increased intrusion of warming Atlantic water leads to rapid expansion of temperate phytoplankton in the Arctic. Glob. Chang. Biol. 2018, 24, 2545–2553. [Google Scholar] [CrossRef]
  4. Ingvaldsen, R.; Loeng, H. Physical oceanography. In Ecosystem Barents Sea; Sakshaug, E., Johnsen, G., Kovacs, K.M., Eds.; Tapir Academic Press: Trondheim, Norway, 2009; pp. 33–64. [Google Scholar]
  5. Ardyna, M.; Arrigo, K.R. Phytoplankton dynamics in a changing Arctic Ocean. Nat. Clim. Chang. 2020, 10, 892–903. [Google Scholar] [CrossRef]
  6. Ardyna, M.; Mundy, C.J.; Mayot, N.; Matthes, L.C.; Oziel, L.; Horvat, C.; Leu, E.; Assmy, P.; Hill, V.; Matrai, P.A.; et al. Under-Ice Phytoplankton Blooms: Shedding Light on the “Invisible” Part of Arctic Primary Production. Front. Mar. Sci. 2020, 7, 608032. [Google Scholar] [CrossRef]
  7. IPCC. 2019: IPCC Special Report on the Ocean and Cryosphere in a Changing Climate. Available online: https://www.ipcc.ch/srocc/ (accessed on 26 November 2021).
  8. Wang, Y.; Xiang, P.; Kang, J.H.; Ye, Y.Y.; Lin, G.M.; Yang, Q.L.; Lin, M. Microphytoplankton community structure in the western Arctic Ocean: Surface layer variability of geographic and temporal considerations in summer. Hydrobiologia 2018, 811, 295–312. [Google Scholar] [CrossRef]
  9. Fujiwara, A.; Hirawake, T.; Suzuki, K.; Imai, I.; Saitoh, S.I. Timing of sea ice retreat can alter phytoplankton community structure in the western Arctic Ocean. Biogeosciences 2014, 11, 1705–1716. [Google Scholar] [CrossRef] [Green Version]
  10. Park, J.; Kug, J.; Bader, J. Amplified Arctic warming by phytoplankton under greenhouse warming. Proc. Natl. Acad. Sci. USA 2015, 112, 5921–5926. [Google Scholar] [CrossRef] [Green Version]
  11. Makarevich, P.R.; Druzhkova, E.I. Seasonal Cyclic Processes in Coastal Planktonic Algocenoses of Northern Seas; Rostov-on Don Publ.: Rostov-on-Don, Russia, 2010. (In Russian) [Google Scholar]
  12. Biological Atlas of the Arctic Seas 2000: Plankton of the Barents and Kara Seas. Available online: https://www.nodc.noaa.gov/OC5/BARPLANK/start.html (accessed on 6 November 2021).
  13. Korneev, O.; Titov, O.; van der Meeren, G.I.; Arneberg, P.; Tchernova, J.; Jørgensen, M.N. Final Report 2012–2015 Joint Russian-Norwegian Monitoring Project—Ocean 3. Available online: https://www.academia.edu/28647014/Final_Report_2012_2015_Joint_Russian_Norwegian_Monitoring_Project_Ocean_3 (accessed on 5 December 2021).
  14. Signorini, S.R.; McClain, C.R. Environmental factors controlling the Barents Sea spring-summer phytoplankton blooms. Geophys. Res. 2009, 36, 1–5. [Google Scholar] [CrossRef]
  15. Politova, N.V.; Shevchenko, V.P.; Zernova, V.V. Environment and Ecosystems of Novaya Zemlya. In The Archipelago and Scelf; KSC RAS Press: Apatity, Russia, 1995. (In Russian) [Google Scholar]
  16. Sergeeva, V.M.; Mosharov, S.A.; Nedospasov, A.A.; Polukhin, A.A. Phytoplankton community structure in the polar front of the Eastern Barents Sea at the end of the growth season. Oceanology 2018, 58, 700–709. [Google Scholar] [CrossRef]
  17. Wassmann, P.; Ratkova, T.; Andreassen, I.; Vernet, M.; Pedersen, G.; Rey, F. Spring bloom development in the marginal ice zone and the central Barents Sea. Mar. Ecol. 1999, 20, 321–346. [Google Scholar] [CrossRef] [Green Version]
  18. Perrette, M.; Yool, A.; Quartly, G.; Popova, E. Near-ubiquity of ice-edge blooms in the Arctic. Biogeosciences 2011, 8, 515–524. [Google Scholar] [CrossRef] [Green Version]
  19. Engelsen, O.; Hegseth, E.; Hop, H.; Hansen, E.; Falk-Petersen, S. Spatial variability of chlorophyll-a in the marginal ice zone of the Barents Sea, with relations to sea ice and oceanographic conditions. J. Mar. Syst. 2002, 35, 79–97. [Google Scholar] [CrossRef]
  20. Hodal, H.; Kristiansen, S. The importance of small-celled phytoplankton in spring blooms at the marginal ice zone in the northern Barents Sea. Deep-Sea Res. 2008, 55, 2176–2185. [Google Scholar] [CrossRef] [Green Version]
  21. Sturluson, M.; Nielsen, T.; Wassmann, P. Bacterial abundance, biomass and production during spring blooms in the northern Barents Sea. Deep-Sea Res. 2008, 55, 2186–2198. [Google Scholar] [CrossRef]
  22. Unified State System on the Situation in the World Ocean. Available online: http://data.oceaninfo.ru (accessed on 6 November 2021).
  23. Boitsov, V.D.; Karsakov, A.L.; Trofimov, A.G. Atlantic water temperature and climate in the Barents Sea, 2000–2009. ICES J. Mar. Sci. 2012, 69, 833–840. [Google Scholar] [CrossRef]
  24. Alekseev, G.V. Development and amplification of global warming in the Arctic. Fundam. Appl. Climatol. 2015, 1, 11–26. (In Russian) [Google Scholar]
  25. Zhichkin, A.P. Peculiarities of interannual and seasonal variations of the Barents Sea ice coverage anomalies. Russ. Meteorol. Hydrol. 2015, 40, 319–326. [Google Scholar] [CrossRef]
  26. Water. Spectrophotometric Determination of Chlorophyll-А; (State Standard: 17.1.4.02-90); Standards: Moscow, Russia, 2001. (In Russian) [Google Scholar]
  27. Aminot, A.; Rey, F. Standard Procedure for the Determination of Chlorophyll A by Spectroscopic Methods; International Council for the Exploration of the Sea: Copenhagen, Denmark, 2000. [Google Scholar]
  28. Determination of Photosynthetic Pigments in Sea-Water, Monographs on Oceanographic Methodology; UNESCO: Paris, France, 1966; Available online: https://unesdoc.unesco.org/ark:/48223/pf0000071612 (accessed on 16 November 2021).
  29. Mamaev, O.I. Thermohaline Analysis of the World Ocean Waters; Hydrometeoizdat: Leningrad, Russia, 1987. (In Russian) [Google Scholar]
  30. Wood, E.D.; Armstrong, F.A.J.; Richards, F.A. Determination of nitrate is sea water by cadmium-copper reduction to nitrite. J. Mar. Biol. Ass. UK 1967, 47, 23–31. [Google Scholar] [CrossRef] [Green Version]
  31. Grasshoff, K.; Kremling, K.; Ehrhardt, M. (Eds.) Methods of Seawater Analysis; Verlag Chemie: Weinheim, Germany, 1983; pp. 125–187. [Google Scholar]
  32. Intergovernmental Oceanographic Commission. Chemical methods for the use in marine environmental monitoring. In IOC, Manuals and Guides; UNESCO: Paris, France, 1983. [Google Scholar]
  33. Vuorinen, I.; Hänninen, J.; Rajasilta, M.; Laine, P.; Eklund, J.; Montesino-Pouzols, F.; Corona, F.; Junker, K.; Meier, H.M.; Dippner, J.W. Guidelines for Chemical Analysis of Marine and Fresh Water in Environmental Monitoring of Fishery Waters and Fishery Prospective Areas of the World Ocean; VNIRO Press: Moscow, Russia, 2003. (In Russian) [Google Scholar]
  34. Mahotin, M.; Ivanov, V. Distribution of Atlantic water masses in the Barents Sea according to observations and numerical modeling. Proc. Hydrometeorol. Res. Cent. Russ. Fed. 2016, 361, 169–191. (In Russian) [Google Scholar]
  35. Ivanov, V.V.; Shapiro, G.I. Formation of a dense water cascade in the marginal ice zone in the Barents Sea. Deep Sea Res. 2005, 52, 1699–1717. [Google Scholar] [CrossRef]
  36. Lien, V.S.; Trofimov, A.G. Formation of Barents Sea Branch Water in the north-eastern Barents Sea. Polar Res. 2013, 32, 1–14. [Google Scholar] [CrossRef] [Green Version]
  37. Rudels, B.; Anderson, L.G.; Jones, E.P. Formation and evolution of the surface mixed layer and halocline of the Arctic Ocean. J. Geophys. Res. 1996, 101, 8807–8821. [Google Scholar] [CrossRef]
  38. Averkiev, А;.S. Transformation of Atlantic water masses in the Barents, Kara and Laptev Sea by observation data in september 2014 year. Int. Res. J. 2017, 7, 37–41. (In Russian) [Google Scholar] [CrossRef]
  39. Earth Observing System Data and Information System (EOSDIS) Worldview. Available online: https://worldview.earthdata.nasa.gov/ (accessed on 6 November 2021).
  40. All-Russian Research Institute of Hydrometeorological Information—World Data Center (RRIHI-WDC). Available online: http://aisori-m.meteo.ru/waisori/index.xhtml?idata=5 (accessed on 6 November 2021).
  41. Bulygina, O.N.; Razuvaev, V.N.; Aleksandrova, T.M. Opisanie Massiva Dannykh Sutochnoy Temperatury Vozdukha i Kolichestva Osadkov na Meteorologicheskikh Stantsiyakh ROSSII i Byvshego SSSR (TTTR). [Description of the Data Array of Daily Air Temperature and Precipitation at Meteorological Stations in Russia and the Former USSR (TTTR)]. Certificate of Registration of the Database No.2014620942. Available online: http://meteo.ru/data/162-temperature-precipitation#oписание-массива-данных (accessed on 29 October 2021).
  42. Doerffer, R.; Fiseher, J. Concentration of chlorophyll, suspended matter, and gelbstoff case II water derived from satellite coastal zone color scanner data with inverse modeling methods. J. Geophys. Res. 1994, 99, 7457–7466. [Google Scholar] [CrossRef]
  43. Kuznetsova, О.А;.; Kopelevich, О.V.; Shebestov, S.V.; Burenkov, V.I.; Mosharov, S.A.; Demidov, A.B. Estimation of Chlorophyll Concentration in the Kara Sea from Data of MODIS_Aqua Satellite Scanner. Earth Observ. Remote Sens. 2013, 5, 21–31. (In Russian) [Google Scholar] [CrossRef]
  44. Kopelevich, O.V.; Sahling, I.V.; Vazyulya, S.V.; Glukhovets, D.I.; Sheberstov, S.V.; Burenkov, V.I.; Karalli, P.G.; Yushmanova, A.V. Bio-Optical Characteristics of the Seas, Surrounding the Western Part of Russia, from Data of the Satellite Ocean Color Scanners of 1998–2017; OOO VASh FORMAT Press: Moscow, Russia, 2018. (In Russian) [Google Scholar]
  45. Young-Sun, S.; Hyun-cheol, K. Empirical ocean color algorithms and bio-optical properties of the western coastal waters of Svalbard, Arctic. ISPRS J. Photogramm. Remote Sens. 2018, 139, 272–283. [Google Scholar] [CrossRef]
  46. Grebmeier, J.M.; Rodger Harvey, H. Plankton of the Sea of the Western Arctic; KSC RAS press: Apatity, Russia, 1997. (In Russian) [Google Scholar]
  47. Kuznetsov, L.L.; Shoshina, E.V. Phytocenoses of the Barents Sea (Physiological and Structural Characteristics); SSC RAS Publ: Rostov-on-Don, Russia, 2003. (In Russian) [Google Scholar]
  48. Wassmann, P.; Reigstad, M.; Haug, T.; Rudels, B.; Carroll, M.L.; Hop, H.; Gabrielsen, G.W.; Falk-Petersen, S.; Denisenko, S.G.; Arashkevich, E.; et al. Food webs and carbon flux in the Barents Sea. Prog. Oceanogr. 2006, 71, 232–287. [Google Scholar] [CrossRef]
  49. Makarevich, P.; Vodopianova, V.; Bulavina, A.; Kalinka, O. Influence of the Barents Sea Frontal zones on сhlorophyll сoncentration in Spring. KnE Life Sci. 2020, 5, 536–546. [Google Scholar] [CrossRef] [Green Version]
  50. Makarevich, P.R.; Larionov, V.V.; Vodopyanova, V.V.; Bulavina, A.S.; Ishkulova, T.G.; Venger, M.P.; Pastukhov, I.A.; Vashchenko, A.V. Phytoplankton of the Barents Sea at the Polar Front in Spring. Okeanology 2021, 61, 930–934, in press. [Google Scholar] [CrossRef]
  51. Dvoretsky., V.G.; Dvoretsky, A.G. (Murmansk Marine Biological Institute, Murmansk, Russia). Personal communication, 2021. [Google Scholar]
  52. Dvoretsky, V.G. Zooplankton production in the Barents Sea in Summer. Izvestya TINRO 2012, 168, 169–183. (In Russian) [Google Scholar]
  53. Raymont, J.E.G. Plankton and Productivity in the Oceans; Pergamon Press Ltd.: Oxford, UK, 1963; p. 660. Available online: https://archive.org/details/planktonproducti0000raym/page/n7/mode/2up (accessed on 26 November 2021).
  54. Pasculli, L.; Piermattei, V.; Madonia, A.; Bruzzone, G.; Caccia, M.; Ferretti, R.; Odetti, A.; Marcelli, M. New Cost-Effective Technologies Applied to the Study of the Glacier Melting Influence on Physical and Biological Processes in Kongsfjorden Area (Svalbard). J. Mar. Sci. Eng. 2020, 8, 593. [Google Scholar] [CrossRef]
  55. Marcelli, M.; Piermattei, V.; Gerin, R.; Brunetti, F.; Pietrosemoli, E.; Addo, S.; Boudaya, L.; Coleman, R.; Nubi, O.A.; Jojannes, R.; et al. Toward the widespread application of low-cost technologies in coastal ocean observing (Internet of Things for the Ocean). Mediterr. Mar. Sci. 2021, 22, 255–269. [Google Scholar] [CrossRef]
Figure 1. Location of stations and water masses along the western coast of the Novaya Zemlya archipelago, May 2016.
Water 13 03648 g001
Figure 2. Thermohaline characteristics, as well as water masses and fronts in the study area. (a)—Salinity (PSU); (b)—Temperature (°C).
Water 13 03648 g002
Figure 3. Concentrations of nitrates (N-NO3), phosphates (P-PO4), and silicates (Si-SiO3) (µM).
Water 13 03648 g003
Figure 4. Concentrations of chlorophyll-а (mg/m3), and T (°C) and S (PSU) of water masses in the study area: I—water of the Novozemelskoe and Kolguevo–Pechorskoe currents; II—Barents waters; III—Arctic surface water.
Water 13 03648 g004
Figure 5. Concentrations of chlorophyll-а in the surface layer according to remote sensing data (NASA, MODIS-Aqua https://oceancolor.gsfc.nasa.gov (accessed on 11 November 2021)) during 10–14 May 2016.
Water 13 03648 g005
Publisher’s Note: MDPI stays neutral with regard to jurisdictional claims in published maps and institutional affiliations.

