1. Introduction
Sustainable water use has become a critical issue for the future of the planet in face of highly probable climate change. Current hydroclimatic data support the hypothesis of the occurrence of climate change (prolonged periods of drought and severe flooding in different parts of the world) [
1], which causes alterations in the availability of water resources. The large number of factors involved in water management makes it difficult to take decisions to minimize the adverse effects of future water use scenarios and ensure the long-term sustainable use of water resources [
2].
The drinking water supply sector in Spain has made significant progress over the last 20 years by renovating hydraulic infrastructure near the end of its useful life [
3]. However, these modernizations are insufficient to confront the current challenges related to the efficient use of water resources [
4]. To accomplish these challenges, it is necessary to implement smart management of water facilities, especially those devoted to urban water supply, due to their social repercussion. Although urban water consumption accounts for 14% of total consumption in Spain, it is the most prominent water supply sector as it groups together a larger number of customers and a high turnover (approximately 6500 million EUR). The Spanish urban water sector is a combination of public, private, and mixed water companies. This makes it difficult to standardize the measures to be implemented in the sector, as infrastructure funding comes from different sources.
The main objective of decision support systems (DSS) applied to water transmission (WTS) and water distribution systems (WDS) is the efficient management of these infrastructures. The achievement of this objective entails making efficient use of available resources (water, technology, labor, and funding). Current technological advances at affordable prices [
5], including communication systems [
6,
7], data cloud storage [
8], data analysis tools, and hydraulic network modeling [
9,
10], facilitate the attainment of this objective.
DSSs applied to territorial systems are constructed from geographic information systems (GIS), which combine digital cartographic information and alphanumeric information. Current cartographic analysis tools [
11], both online and offline, facilitate the transformation of traditional cartography into digital and collaborative cartography [
12,
13] and allow the updating and consultation of information for GIS users (e.g., water service departments) [
14].
Thus, water supply companies need a detailed knowledge of the infrastructures that make up their WTS/WDS to know their actual state and set improvement plans [
15]. Water companies are concerned by the aging of the hydraulic infrastructure as many pipelines, valves, or pumps are beyond or near to the end of their lifetime and should be renovated. The system improvements will allow sustainable use of water and energy resources, especially in the current scenario of a continuous increase in energy prices and a reduction in greenhouse gases emissions [
16].
The digitization process of the water supply sector has been accelerated in recent years. The adoption of disruptive technologies is changing the business models that have prevailed for decades. The digitization process is completed by integrating all available information about the system into a hydraulic model to estimate hydraulic variables (flow rate, pressure, tanks levels, etc.) at any point of the system [
17]. Hydraulic models simulate the behavior of WTS/WDS systems in multiple operating scenarios, facilitating decision making [
18].
To reap the full benefits of digitization, it is essential to provide the company with tools to obtain all the advantages of this approach. Currently, there are applications for mobile devices applied to water resource management (e.g., drought prediction [
19], water quality analysis [
20], flood warnings [
21,
22], and sanitation system monitoring [
23]), but their implementation is not generalized.
With the use of this technology, the management of hydraulic infrastructures is improved and cost reductions can consequently be achieved. The widespread use of mobile phones and tablets is based on information and communications technology (ICT) tools to send and receive information (text messages, photographs, videos, geolocation, etc. [
24]) anywhere. In short, applications for smartphones applied to water supply companies benefit both end-users and managers, responding to current market challenges. In many cases, the correct operation of water supply systems (WSS) is based on the experience of the field workers. However, many times, this knowledge is not captured in a digital structured database, and, over time, this valuable information may be lost. This entails a risk due to the generational change occurring in a high number of water supply companies. Recording information in a structured way reduces the adaptation process of new workers by providing, in a simple way, a complete overview of the different tasks to be performed. A structured digital database with the main hydraulic infrastructure and its management and operation rules is critical for the success of these companies.
Today, there are different types of DSSs used in WSS management [
25]. Most of them are based on only one of the factors involved in the management process (demands, pressures, flow rates, leaks, etc.). To achieve optimal management of a WSS, it is necessary to develop DSSs based on the joint analysis of involved factors [
26]. Therefore, the ideal DSS should be built on the georeferenced hydraulic model and the WSS operating rules, fed with the information stored in the linked GIS.
As the implementation cost of new technologies is one of the most restrictive factors in medium- and small-sized water supply companies, the main goal of this research is to develop a methodology based on open-source software [
27], which brings together a hydraulic model and a GIS, linked by a mobile application (APP) to support the digitization process of water supply networks. The developed system, named Integrated Tool for Water System Management (ITWSM), stores and uses categorized information of WSS, including the workers’ know-how, to improve the operation and management of these facilities. It can be used to manage either WDS or WTS regardless of size. The implementation of this methodology provides an easy-to-use decision support tool, whose main benefits are the reduction in both failure repair costs and supply interruptions to end-users, due to better planning of the resources needed to fix breakdowns. ITWSM has been applied to a provincial WTS in Spain, managed by a public water company, as the starting point for the digitalization process needed in the management of urban water supply companies.
2. Methodology
The development of a DSS requires a previous digitization process of the WSS. This procedure starts georeferencing all the elements that comprise these systems, as well as their characterization [
28]. For this purpose, all available information (cartography, hydraulic installation plans, hydraulic device location and features, operation rules, etc.) is gathered and revised. These initial data are completed with in situ inspections of the WSS to verify, complete, and update them before their storage in a GIS. In this work, the free GIS software “Qgis” was used [
29].
From this information, the hydraulic model of the WSS was created using the open-source software “Epanet” [
30]. Operation rules should also be introduced into the model. To validate the results, it is necessary to calibrate the hydraulic model with real flow and/or pressure data. The hydraulic model (HM) provides the distribution of flows and pressures at any point in the network. These variables are required to analyze the behavior of the WSS under different operation and water demand scenarios.
The HM was generated in a quasi-automated manner with the GIS data using the Qgis plugin “QWater” [
31]. The link between the GIS and the hydraulic model is a dynamic database [
32] that is updated automatically when new information is introduced.
In order to facilitate communication between field workers and managers, the open-source and general-purpose app linked to a cloud-based cartographic representation platform, Google My Maps [
33,
34], was adapted to support operation and maintenance tasks of WSSs [
35]. This app allows the field workers to consult the GIS of the system and send information in real time about operations carried out in the WSS (e.g., pipe replacement, valve opening/closing, and leak repair) to the system managers.
2.1. ITWSM as Decision Support System for Urban Water Management
The proposed system, ITWSM, facilitates low-cost digitization of any water supply network. ITWSM is based on the three pillars present in all digitization processes: a geographic information system, a hydraulic model, and an app for data consultation. The system is characterized by the use of free software in all its stages. It also offers versatility and facility to progress without making frequent mistakes in the digitization process.
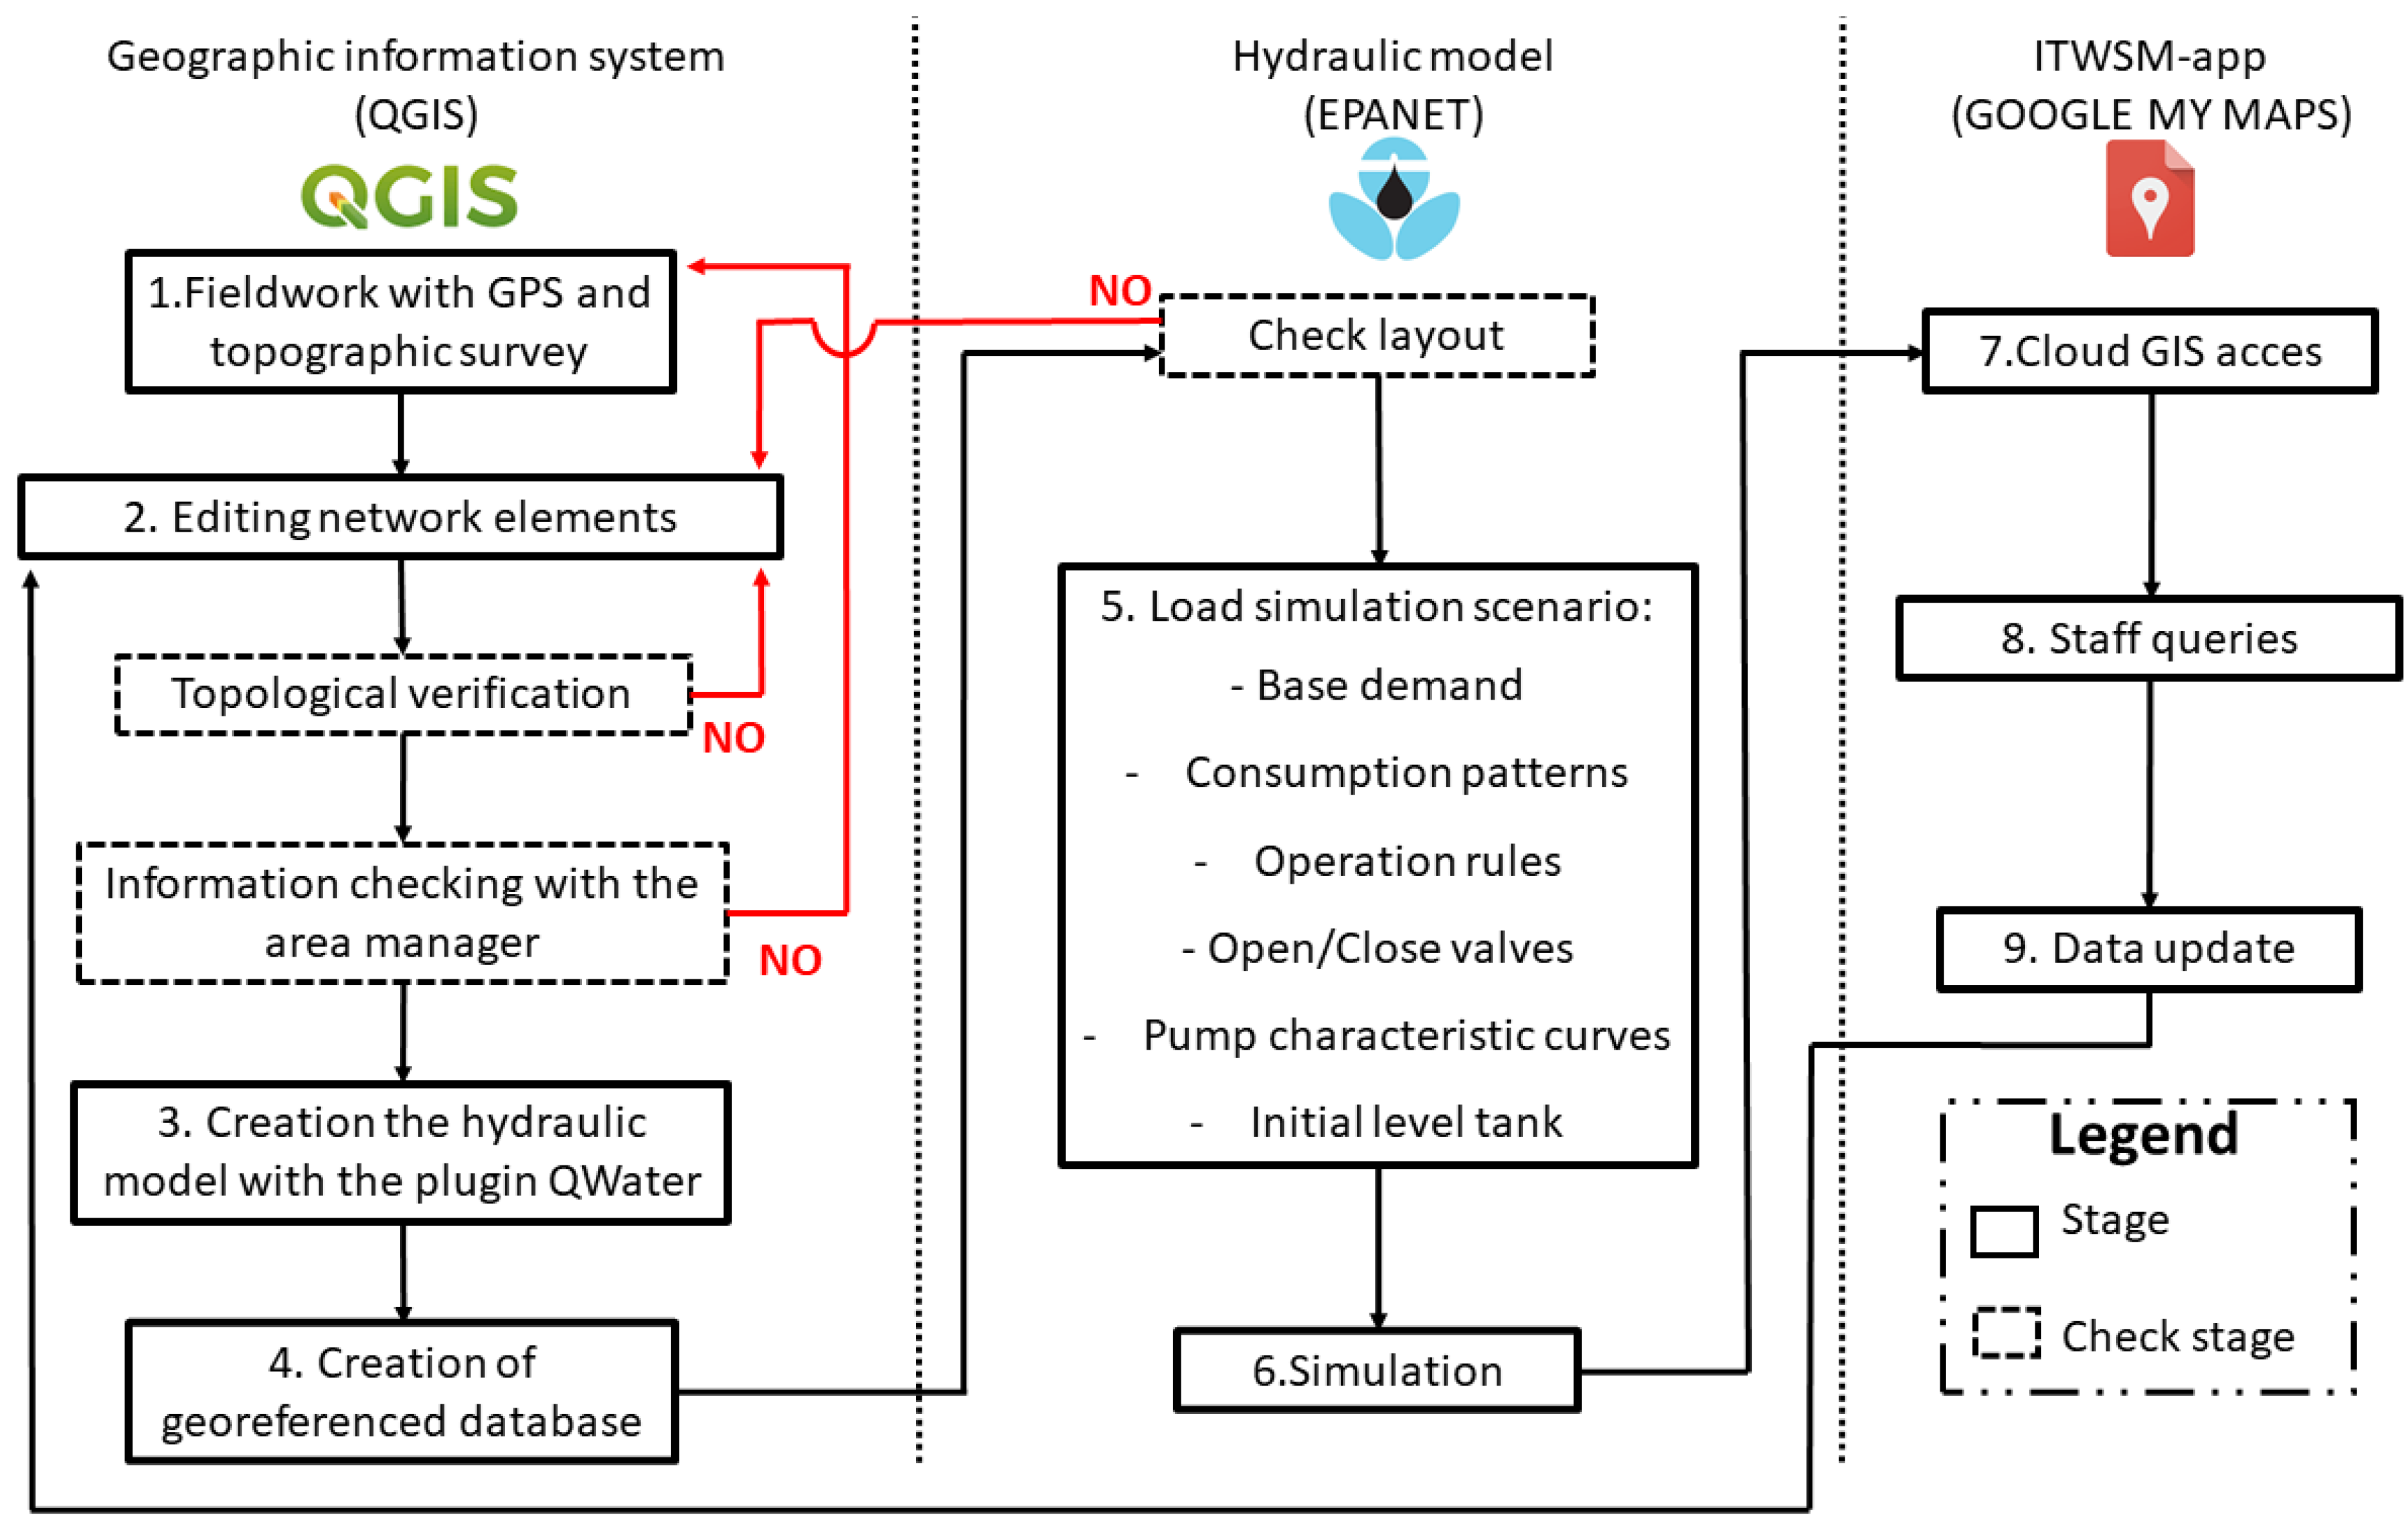
ITWSM operational stages are shown in
Figure 1. Information can either flow between consecutives stages or flow back to previous stages. There are several stages of control to check the quality of the information input. In case of error, it will be necessary to restart the process from previous stages. This diagram identifies the DSS modules with their main objectives: the creation of a reliable georeferenced database, the creation of a reliable hydraulic model, and the use of a mobile application to facilitate the data transfer and the communication between workers to keep the GIS information updated.
Figure 1 shows the flow chart of ITSWM.
The proposed DSS, Integrated Tool for Water Supply Systems Management (ITWSM), consists of three interrelated modules: geographic information system, hydraulic model, and mobile application. All of them use free software: Qgis, Epanet, and Google My Maps. The functions and contributions of each module in the system are detailed below.
2.2. GIS Database
The territorial aspect (spatial location) of the components of a WSS is recorded in its GIS. For this reason, the dynamic database was developed within the GIS, which allows consulting data associated with georeferenced elements stored by thematic layers [
36]. This facilitates the creation of statistics and reports on the status of the hydraulic devices and the operation of the hydraulic network. In addition, this type of software shows the data classified, facilitating its understanding by both field workers and decision-makers [
37].
Qgis is an open-source software in the field of GIS that has been commonly used in recent years [
38]. This is due to the existence of an active community that continuously improves the program and develops plugins that complete the software with specific functions, such as the possibility of spatial analysis with GRASS [
39] and the availability of various topological editing tools [
40]. For this reason, Qgis was considered suitable for the development of ITWSM.
First of all, available data were assessed and supplemented with data recorded in the field using a GPS device with a spatial resolution of centimeters [
41]. Then, the information was exported in shapefile format to Qgis, creating an easily manageable point cloud. The next step was to assign an element to each GPS-marked point (drains, inlets, pipes, valves, pumps, tanks, or water meters). Next, each element was assigned hydraulic characteristics collected from project documents and field trips. In this process, additional GIS layers were included with information about the location of the municipalities (to identify their supply pipes), high-resolution orthophoto (to identify WSS elements), and a digital elevation model (to know the elevation of WSS elements).
In this way, each element is georeferenced by its coordinates and defined by its hydraulic characteristics. This information is the key element for the development of the HM, as well as the operation and maintenance of the WSS. A dated photograph completes the information of each element, as a reference of its current state. Once the network elements are identified, the piping layout is digitized. In order to minimize errors during the HM generation, it is necessary to carry out a topological correction of all the network elements, eliminating duplicated elements and incorrect layouts, using the Qgis topology tester. It is important to perform this process thoroughly due to the large number of elements to be analyzed. The WSS characterization process ends with the verification of the information stored in the GIS by its managers, to minimize the occurrence of errors in the next stages due to the large volume of data handled.
It is important to store both hydraulic and geographic data in an orderly format in the geodatabase. Knowing the relationships between the geodatabase and the future hydraulic model will minimize the risk of making mistakes during the time-consuming process of creating the GIS.
Table 1 shows the components of the WSS, the geometry of each element in both the hydraulic model and the GIS, and the alphanumeric attributes associated with each element. Each hydraulic element is stored in a separate vector layer. Therefore, the GIS geometry of the elements corresponds to polylines or points.
The geometry of the elements in the hydraulic model suffers substantial changes due to the line-node topology (all nodes must be connected by linear elements). Some elements that are represented with a point geometry in the GIS correspond to a linear geometry in the hydraulic model. It should be noted that some elements identified in the GIS (drain valve, suction cup, and water meter) are not included in the hydraulic model. For this reason, the column “HM geometry” has some unfilled gaps.
The attributes considered to characterize the WSS elements are divided into data with a numerical format and data with a text format. The attributes marked in red are required to run the hydraulic model. The remaining attributes provide complementary information of the network studied. Some of the attributes not marked in red, which are considered important, can be introduced in the hydraulic model in the “label” section (e.g., the material of the pipes and the name of the tanks).
2.3. Hydraulic Model
The distribution of pressures and flows in WSS depends on the loading conditions of the system that change during the day and throughout the year. Previous knowledge of the evolution of both nodal pressures and pipe flows allows making opportune decisions to avoid service failure for users. Consequently, a permanently updated mathematical model of the WSS is needed to faithfully reproduce its actual operating conditions.
The geometry of the hydraulic model (layout) is obtained from the previously created GIS using intrinsic functions of the system (e.g., pipe direction tester, pipe connection repairer, selection by location, dimension assignment, and topology tester). Such functions can be programmed to automatically update the system layout when an element of the system is introduced, removed, or relocated.
The data required to generate the HM of a WSS are geometric (network layout, length and diameter of pipes, location of valves and pumps, nodes elevations, etc.) and hydraulic (material, roughness, coefficient of pressure loss in valves, etc.).
The open-source hydraulic simulator Epanet [
30] was used to create the model of the WSS. The QWater plugin of Qgis was applied to export the WSS geometry to the inp format, readable by Epanet. QWater automatically creates fictitious nodes in the HM to convert GIS point elements into HM linear elements. This process mainly affects valves and pumps. In addition to this important task, this plugin has a set of tools to facilitate the creation of the hydraulic model. These tools allow automatically obtaining the elevations of the elements from the digital elevation model, generating the identifiers of the elements of the hydraulic model, and locating errors due to duplicity of the identifiers. It is an intermediate step to obtain the mathematical model in Epanet from Qgis data.
To complete the HM generation process, it is necessary to introduce base demands and demand patterns of each consumption node, the operating rules of the pumps and tanks, the state of the valves (open/closed), and the characteristic curves of each pump installed in the WSS. These data are specific to each simulation scenario. Finally, Epanet is run to simulate the operation of the WSS under different operating scenarios and to detect possible failures before continuing with the digitization process.
In order for the hydraulic model faithfully reproduce the real behavior of the network, calibration of the model is necessary. Each modification of the GIS database requires the creation of a new hydraulic model. Consequently, it is necessary to calibrate each of the new models that are generated. The data for calibration can be provided from either telemetry systems or from periodically collected manual data, depending on the circumstances of each network and technique selected for calibration [
42,
43].
Epanet is a free tool created by the United States Environmental Protection Agency (USEPA) to perform hydraulic simulations. It is characterized by calculating the pressure at the nodes and the flow in the pipes by solving the mass conservation equation for each node (Equation (1)) and the energy conservation equation for each pipe (Equation (2)) and for each pump (Equation (3)) [
42,
44]. To solve the equations simultaneously, Epanet uses the gradient algorithm [
45]. To complete the linear equations that make up this system, Epanet uses the water demand assigned to each node (multiplying this by the hourly coefficient). To provide an accurate result, this software also needs the characteristic curve of the existing pumps.
where
qij is the flow rate in the pipe between node
i and
j,
Di is the demand at node
i,
hij is the head losses in the pipe between nodes
j and
i,
hi and
hj are the head at nodes
i and
j,
r is a resistance coefficient,
m is a minor loss coefficient,
w is the relative speed of the pump,
h0 is the pump head when the pump is not operating, and
t and
n are coefficients of the pump characteristic curve.
Epanet allows simulating the operation of a WSS under different loading conditions both in stationary (permanent regime) and in nonstationary mode (extended period). Permanent regime simulations are used to know the flow and pressure at a concrete moment in time. This can be useful to understand the loading conditions at a particular point prior to any management and control work. Extended period simulations, on the other hand, provide insight into the operation of the network over a period of time. This can be useful to understand the evolution of the tank level over the hours of the day. With this tool, it is possible to study future situations by creating simulation scenarios that are close to reality. In this way, the situation is evaluated, and the best possible solution for each problem is studied.
The MRT is calculated using the hydraulic model. This requires georeferencing the failure and studying the municipalities affected by the failure. Each municipality affected will have an MRT, i.e., the MRT of the failure the minimum of the municipalities involved. To calculate the MRT, an extended period simulation is carried out and the time is determined from the start of the simulation (equivalent to the time the failure occurs) until each of the regulation tanks in the affected municipalities is empty (and, therefore, the end-users are affected by the failure). In order to carry out this process with guarantees of obtaining correct results, the rapid response of the operators in all the links, the correct georeferencing of the fault, and the availability of a calibrated hydraulic model are essential.
2.4. Mobile Application
The WSS database in GIS format is updated when the system is modified (new pipes, pipe relining, pipe rehabilitation, new valve, changes in operating rules, etc.).
In this work, the free mobile application “Google My Maps” was adapted to provide detailed information about the network elements to field workers and system operators within ITWSM. This app is a free Google service that allows the customized creation and edition of maps [
46]. It is linked to Google Drive [
47] to store data in the cloud and share information between different users. The customized app, ITWSM-app, allows field workers to consult the characteristics of the system elements and send to the manager of the system an online warning about changes in the WSS (leaks, breakdowns, repairs, etc.) to update the information in the database. The manager will analyze the information received before updating the database.
This tool is aimed at the following:
Being a consulting tool of the network elements (pipes, valves, drains, tanks, catchments, pumps, flow meters, etc.), facilitating maintenance tasks.
Recording system changes before updating the GIS database. Field workers will be able to report georeferenced changes in the system, through the app, filling in new questionnaires for new elements, and updating failure repairs in existing questionnaires. The app will create historical records of incidents for future studies and analysis.
ITWSM-app has been adapted to the management of a standard water supply company. Coordination between the field work teams and system managers requires smooth communication between both parties. A key aspect of this information is its spatial character that can be easily analyzed with ITWSM-app.
Its specific functions are as follows:
Access from any mobile device with internet connection to the WSS database.
Hierarchy of permissions to access information (query and/or permission to edit).
Selection of the base map that best suits the query made (political map, relief map, or satellite map).
Activation or deactivation of layers to improve the visibility of the map. Each layer collects the location and information of the same type elements. In other words, there will be as many layers as types of elements in the system. Each of these layers can be represented with a different icon and color, improving the readability of the map.
Online/offline operation. Workers have access to the characteristics of the elements even if the mobile device is in an area without internet connection.
Access to photographs stored in Google Drive (or the cloud) through the GIS attribute table to visualize each element.
GPS guidance to locate any element with Google Maps [
48].
The aim of the app is to facilitate the database update with the knowledge of field workers, who best know the location and state of the hydraulic infrastructures, as well as to detect the errors or changes in the database information. In this procedure, it is essential to have a GIS-HM operator to verify and filter the information before entering it into the system. Periodically, the contents of the GIS are revised to rectify the errors detected and are transmitted through the app to improve the database over time.
3. Results
3.1. Study WTS
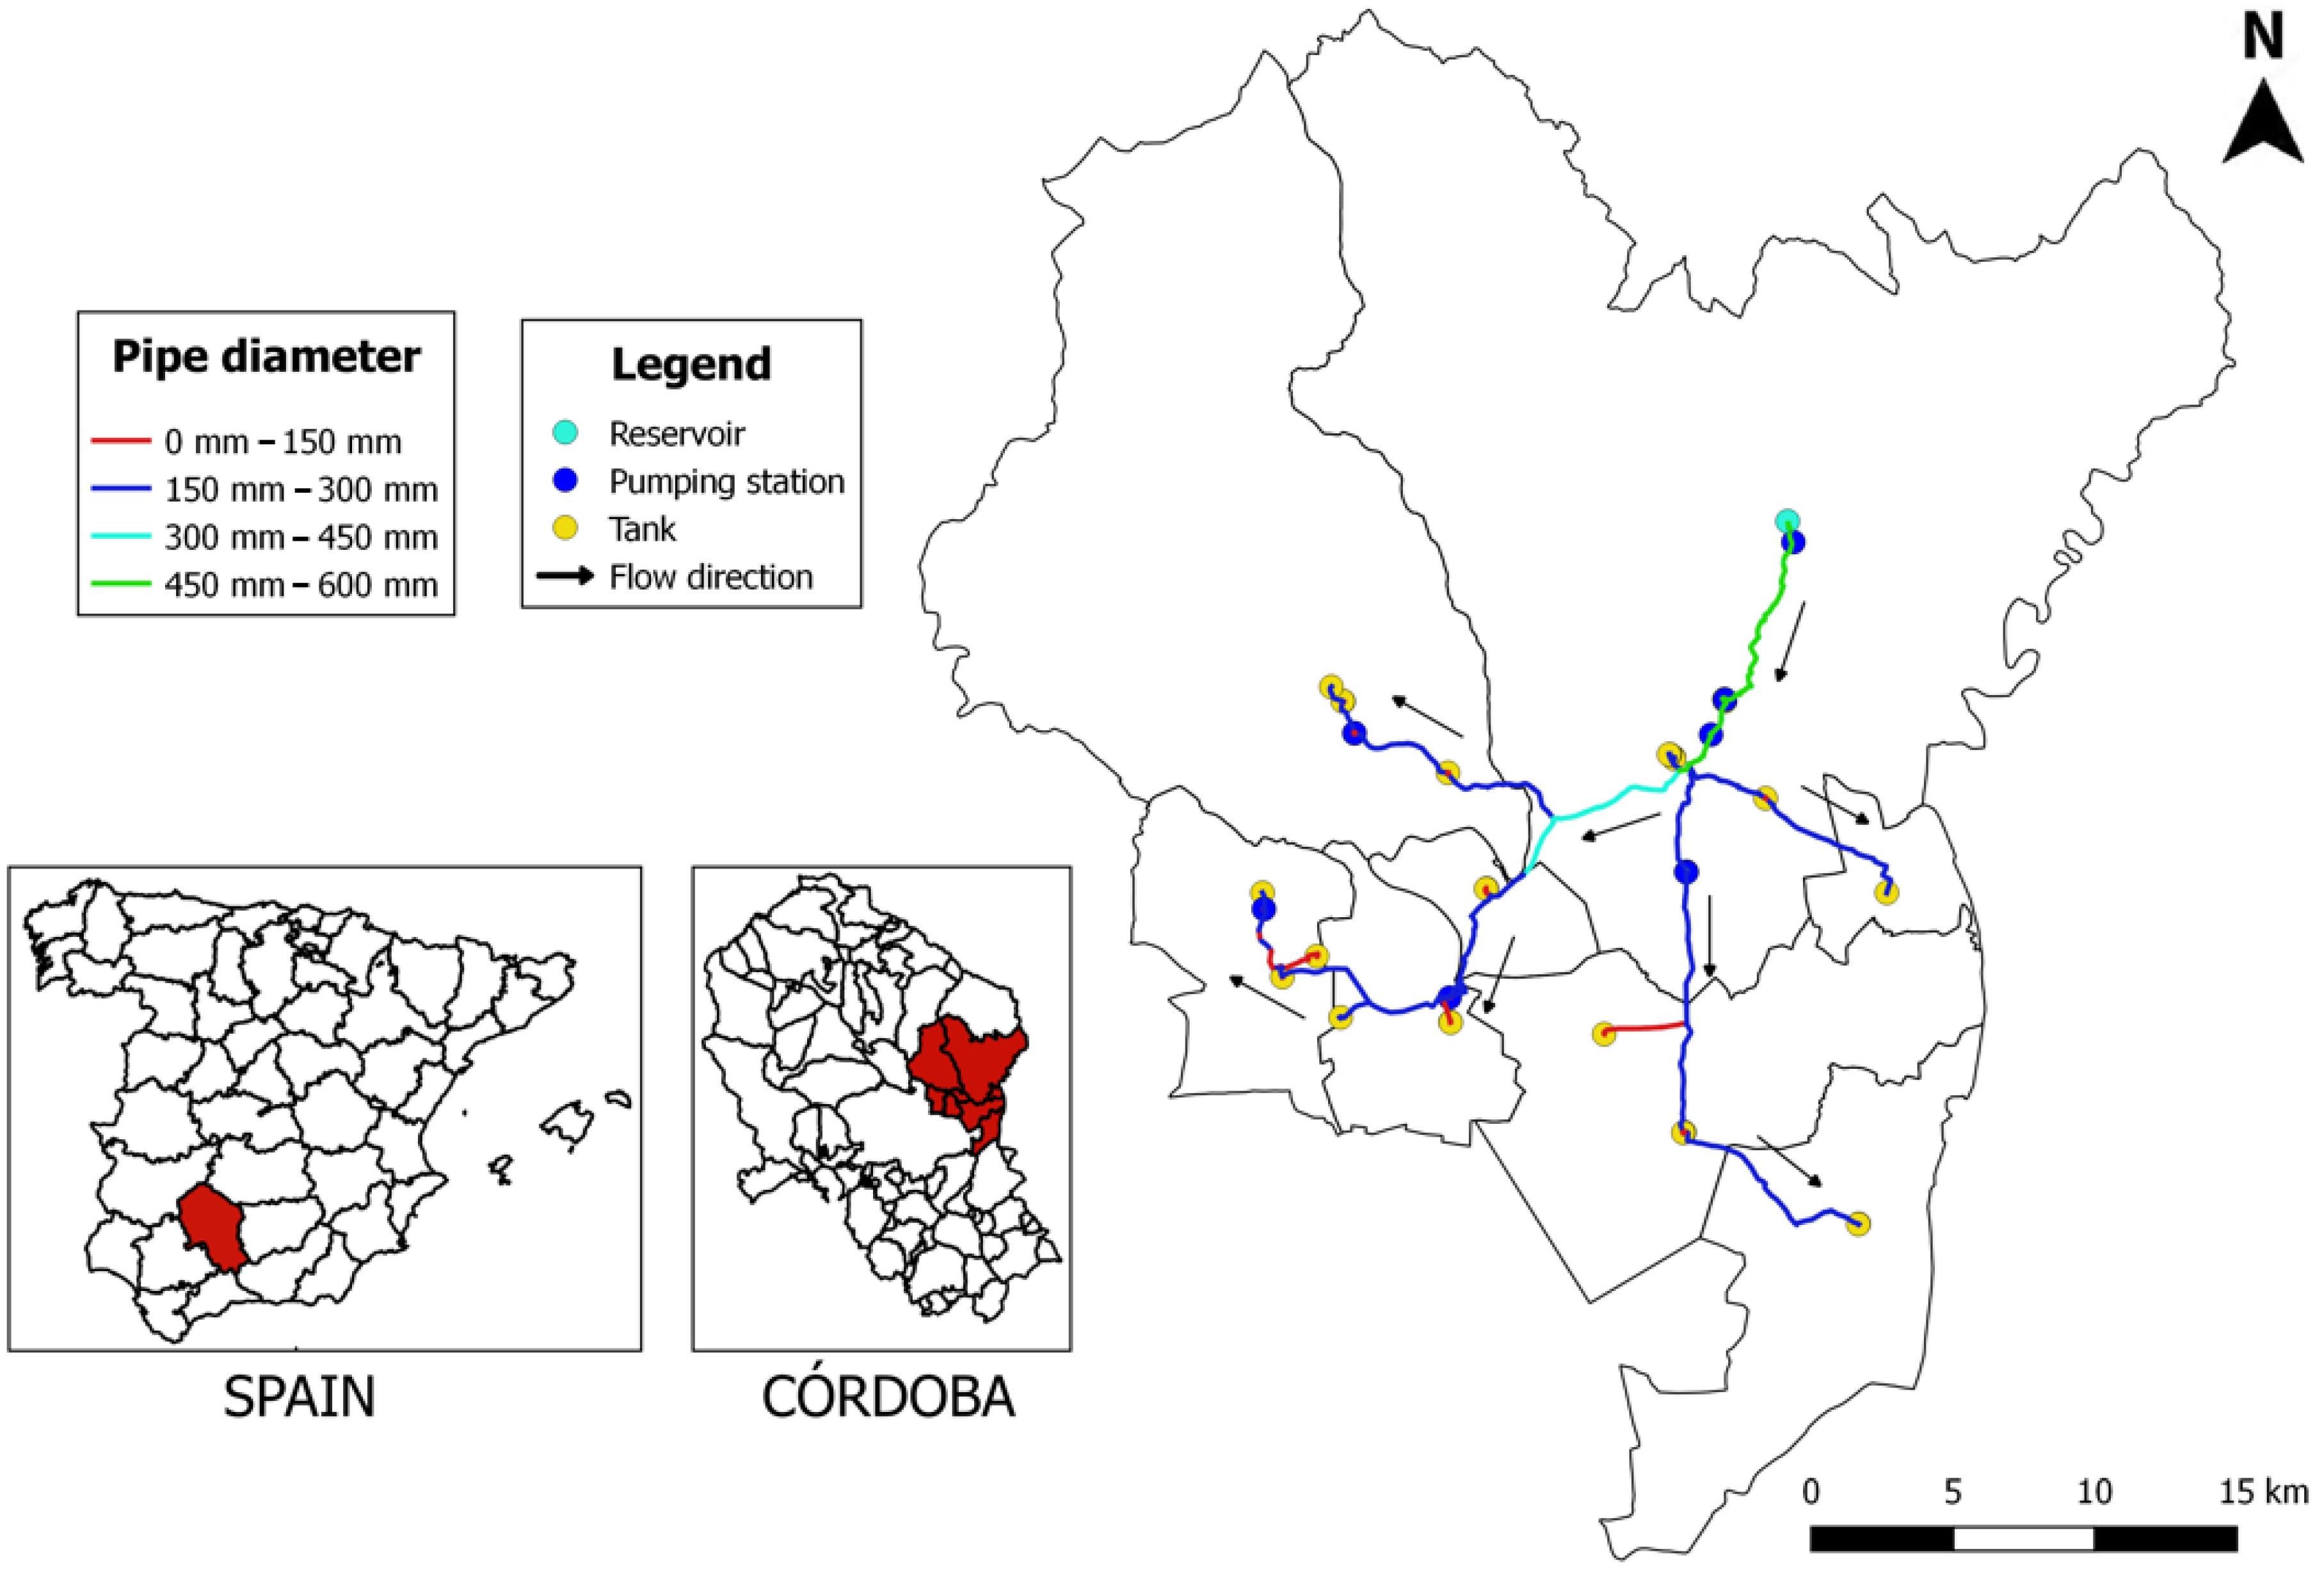
The case study WSS is a WTS operated by the Córdoba’s provincial water supply company (EMPROACSA), located in Southern Spain. This system is composed of three independent systems. The proposed methodology was implemented in the Eastern System, ES, covering an area of about 600 km
2 (
Figure 2).
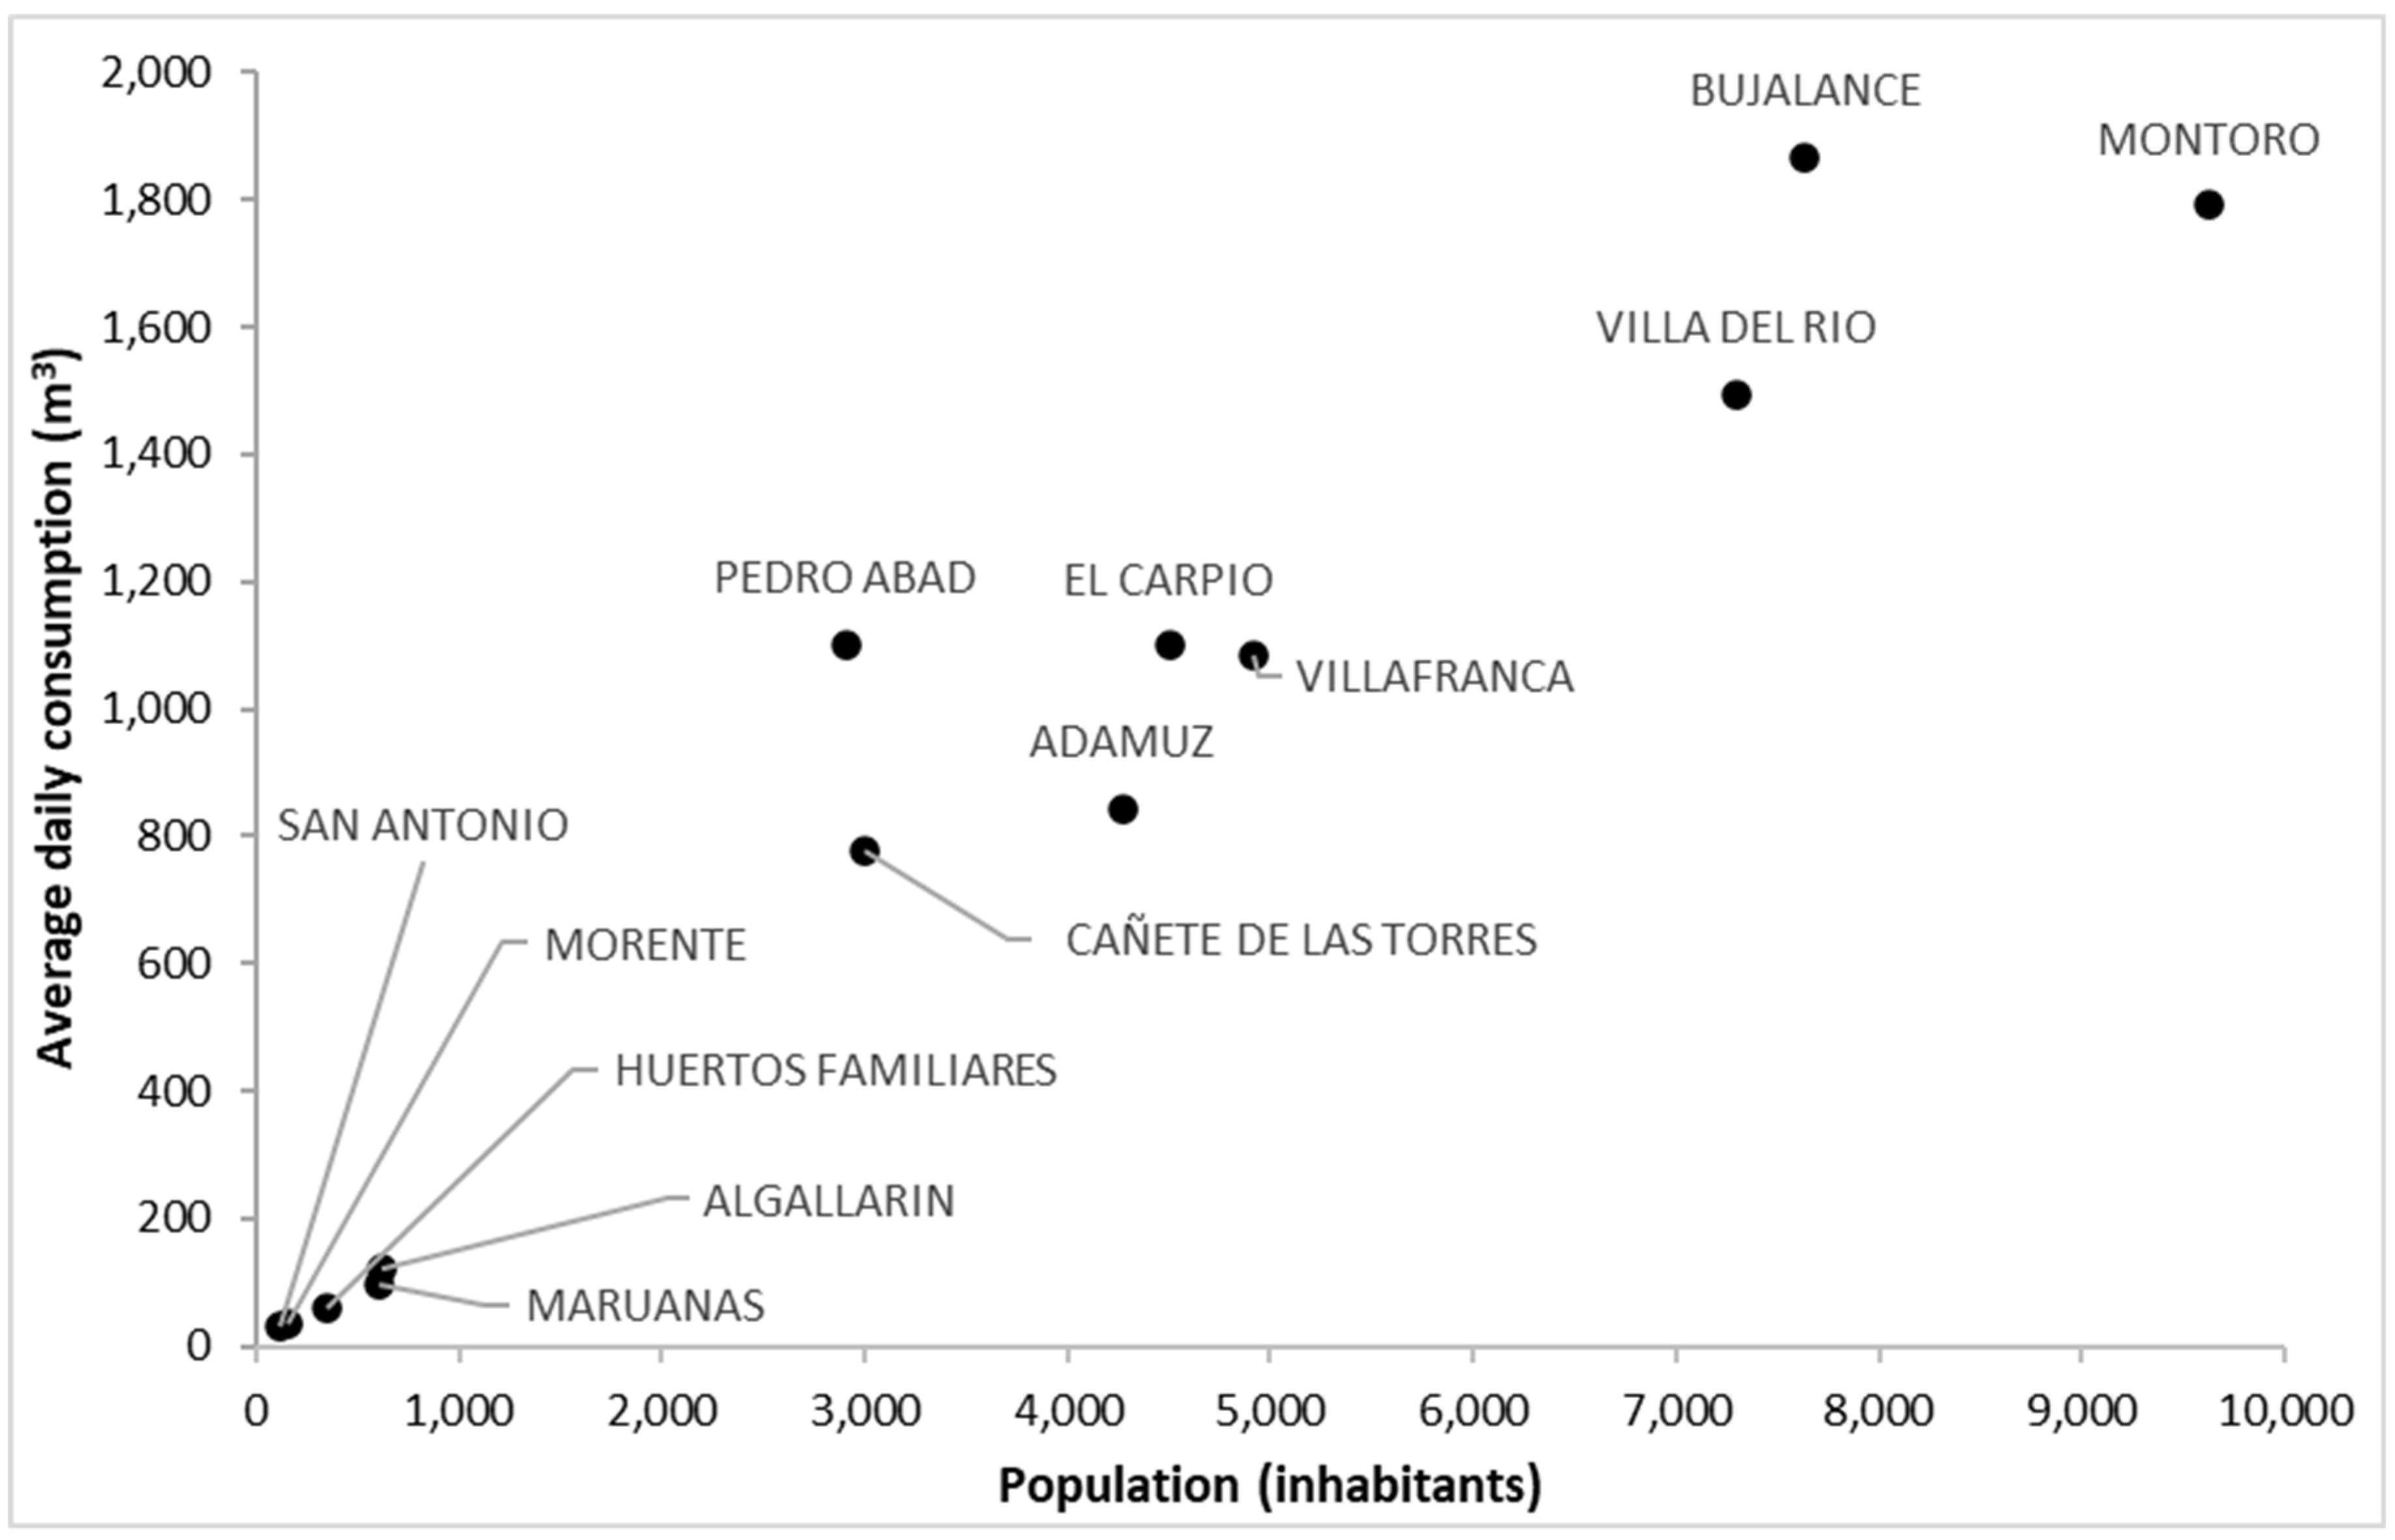
The number of inhabitants within the 10 municipalities in the ES area varies between 140 and 9635, with 60% of the population being concentrated in three municipalities.
The Martín Gonzalo reservoir (280 m above mean sea level) is the water supply source for this WTS, which is purified in a drinking water plant with a capacity of 25,920 m
3/day to supply water to 44,200 inhabitants (
Figure 3). The population varies seasonally, due to the recreational use of many houses in the area. The main industrial activity of the zone is the extraction of olive oil, whose maximum water demand occurs during the harvest period of olives (November to February), although it only represents 3% of the total consumption [
49].
Initially, the HM module was applied to estimate the pressure distribution in the 1219 nodes of the ES. When the consumption in the demand nodes is the daily average demand, the simulated pressure of 36% of the nodes is above 75 m, while 10% of them exceed 120 m. This high percentage of nodes with high pressure is due to the topography of the terrain. In this WTS, the most used material for pipes is ductile iron (67%), although 30% of the pipes are made of fiber–cement. The age of the pipes using this disused material favors the risk of failures.
The average daily water demand is 250 L/hab/day. The annual mean consumption per municipality ranges from 12,733 m3/year to 681,572 m3/year, with the peak water consumption occurring during summer (from July to September).
The topology of the ES is branched, consisting of a main pipeline, with three secondary and several tertiary pipes. The network is made up of a total of 88.79 km of pipelines with different materials and diameters. In the ES, there are four pumping stations with horizontal centrifugal pumps that pump water between 69 mamsl and 180 mamsl to supply water to different municipalities. The ES also has 18 tanks with capacities between 80 m3 and 7500 m3.
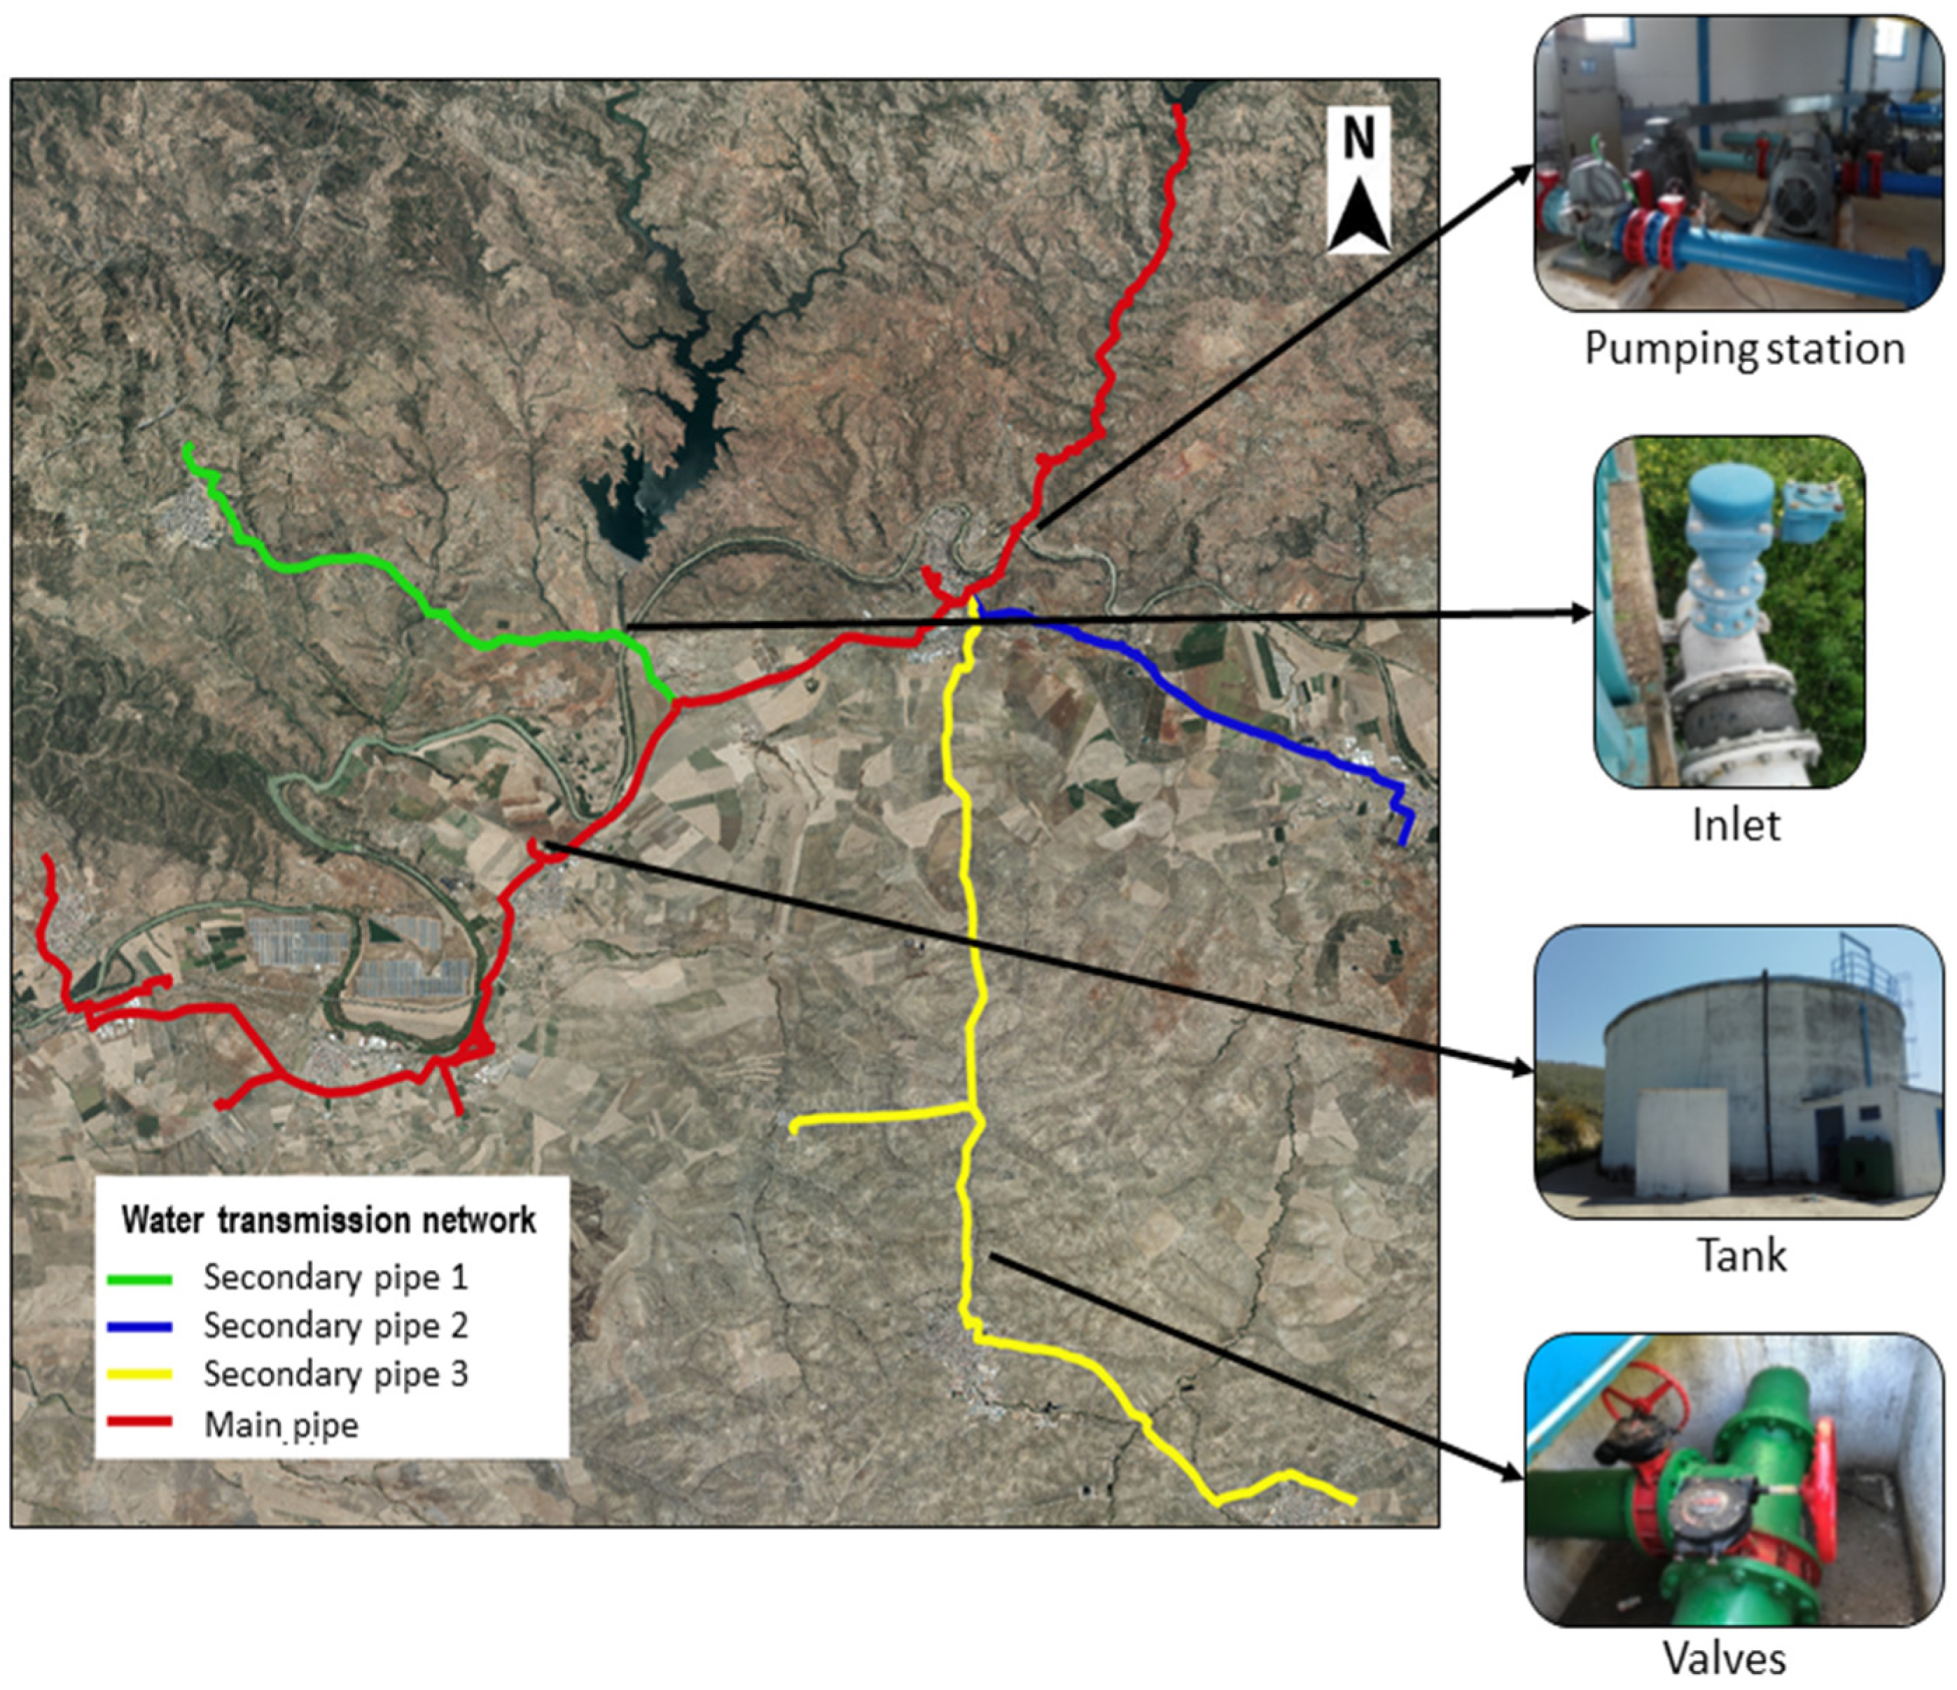
3.2. Georeferenced Database
Each component of the system is located geographically and introduced to the database by storing its characteristics in an attribute table. Several site visits were carried out to inventory and characterize the hydraulic facilities in the ES. During the fieldwork, supported by EMPROACSA’s staff, the most relevant elements were photographed, and their technical characteristics and current state were recorded. All this information was introduced into Qgis (
Figure 4). Therefore, this tool allows joining dispersed information in a single database. The GIS facilitates the integral management of the ES. The accuracy of this procedure is critical to create a reliable hydraulic model.
3.3. Hydraulic Model
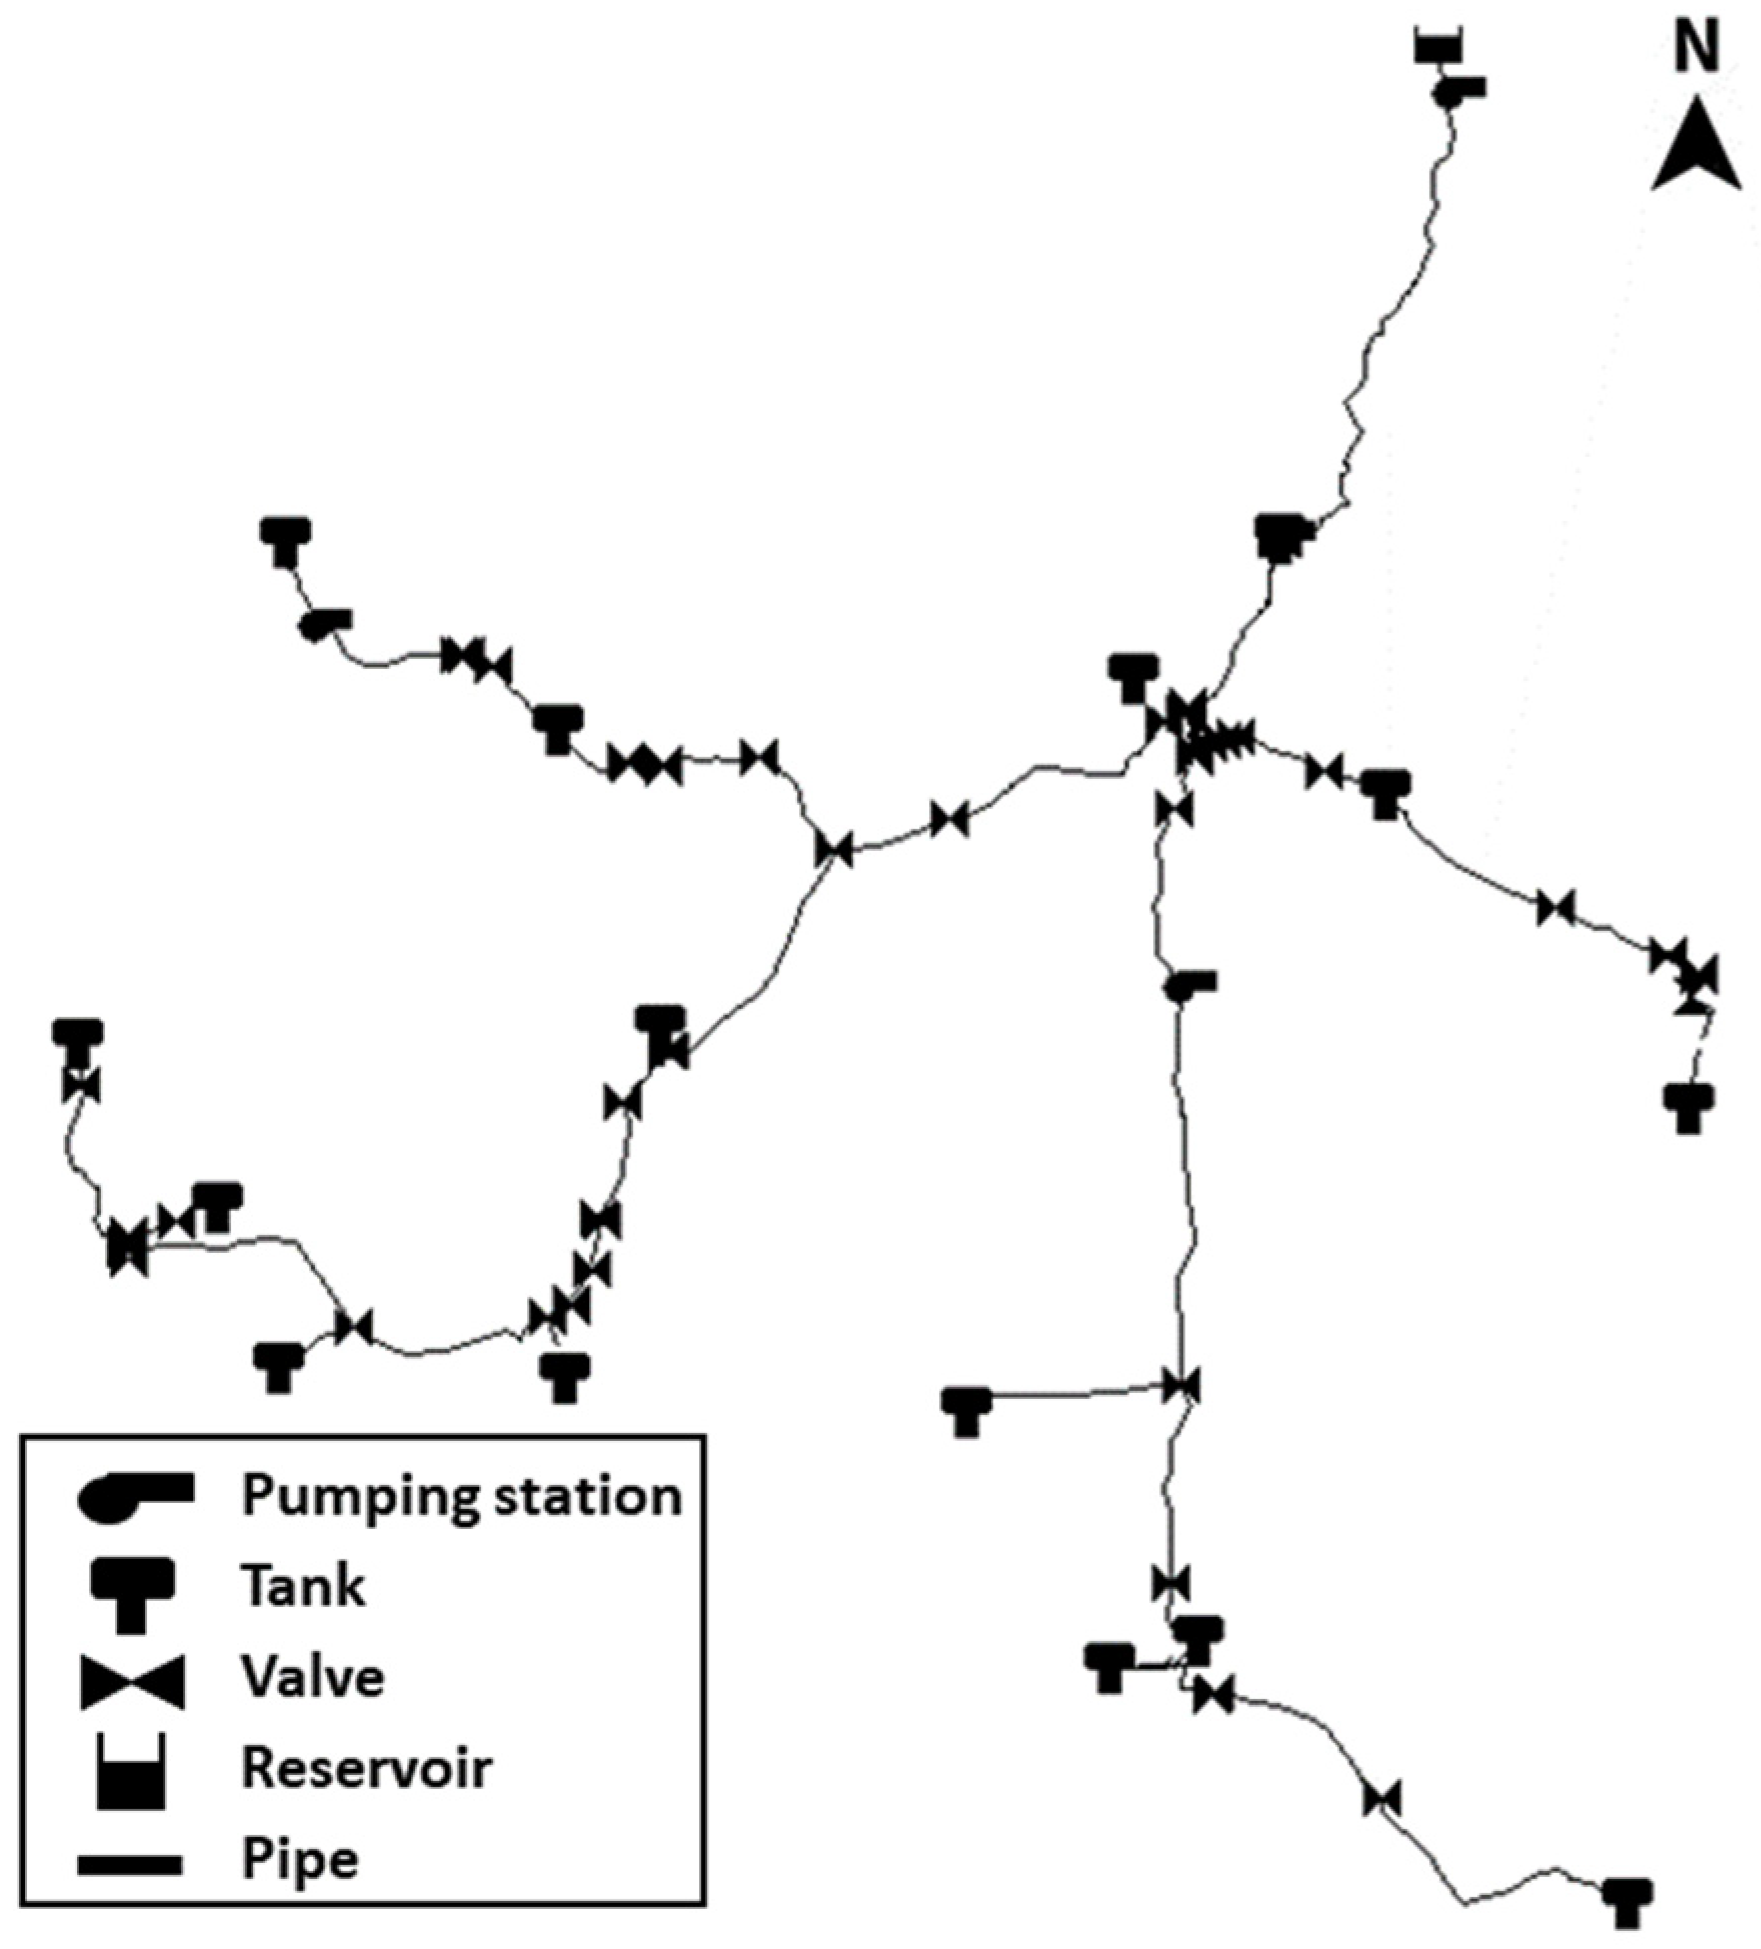
The hydraulic model, generated by Epanet, reproduces the working conditions of the network under different operating scenarios. The model’s correct operation requires the inclusion in the model of all its components (
Figure 5) such as pumping stations, tanks, reservoirs, valves, and pipes, as well as the operating rules of the system. The use of the QWater plugin allows generating the detailed hydraulic model of a real drinking water supply network in a simple way. This plugin serves to automate many tasks in this process, which would be difficult to perform manually.
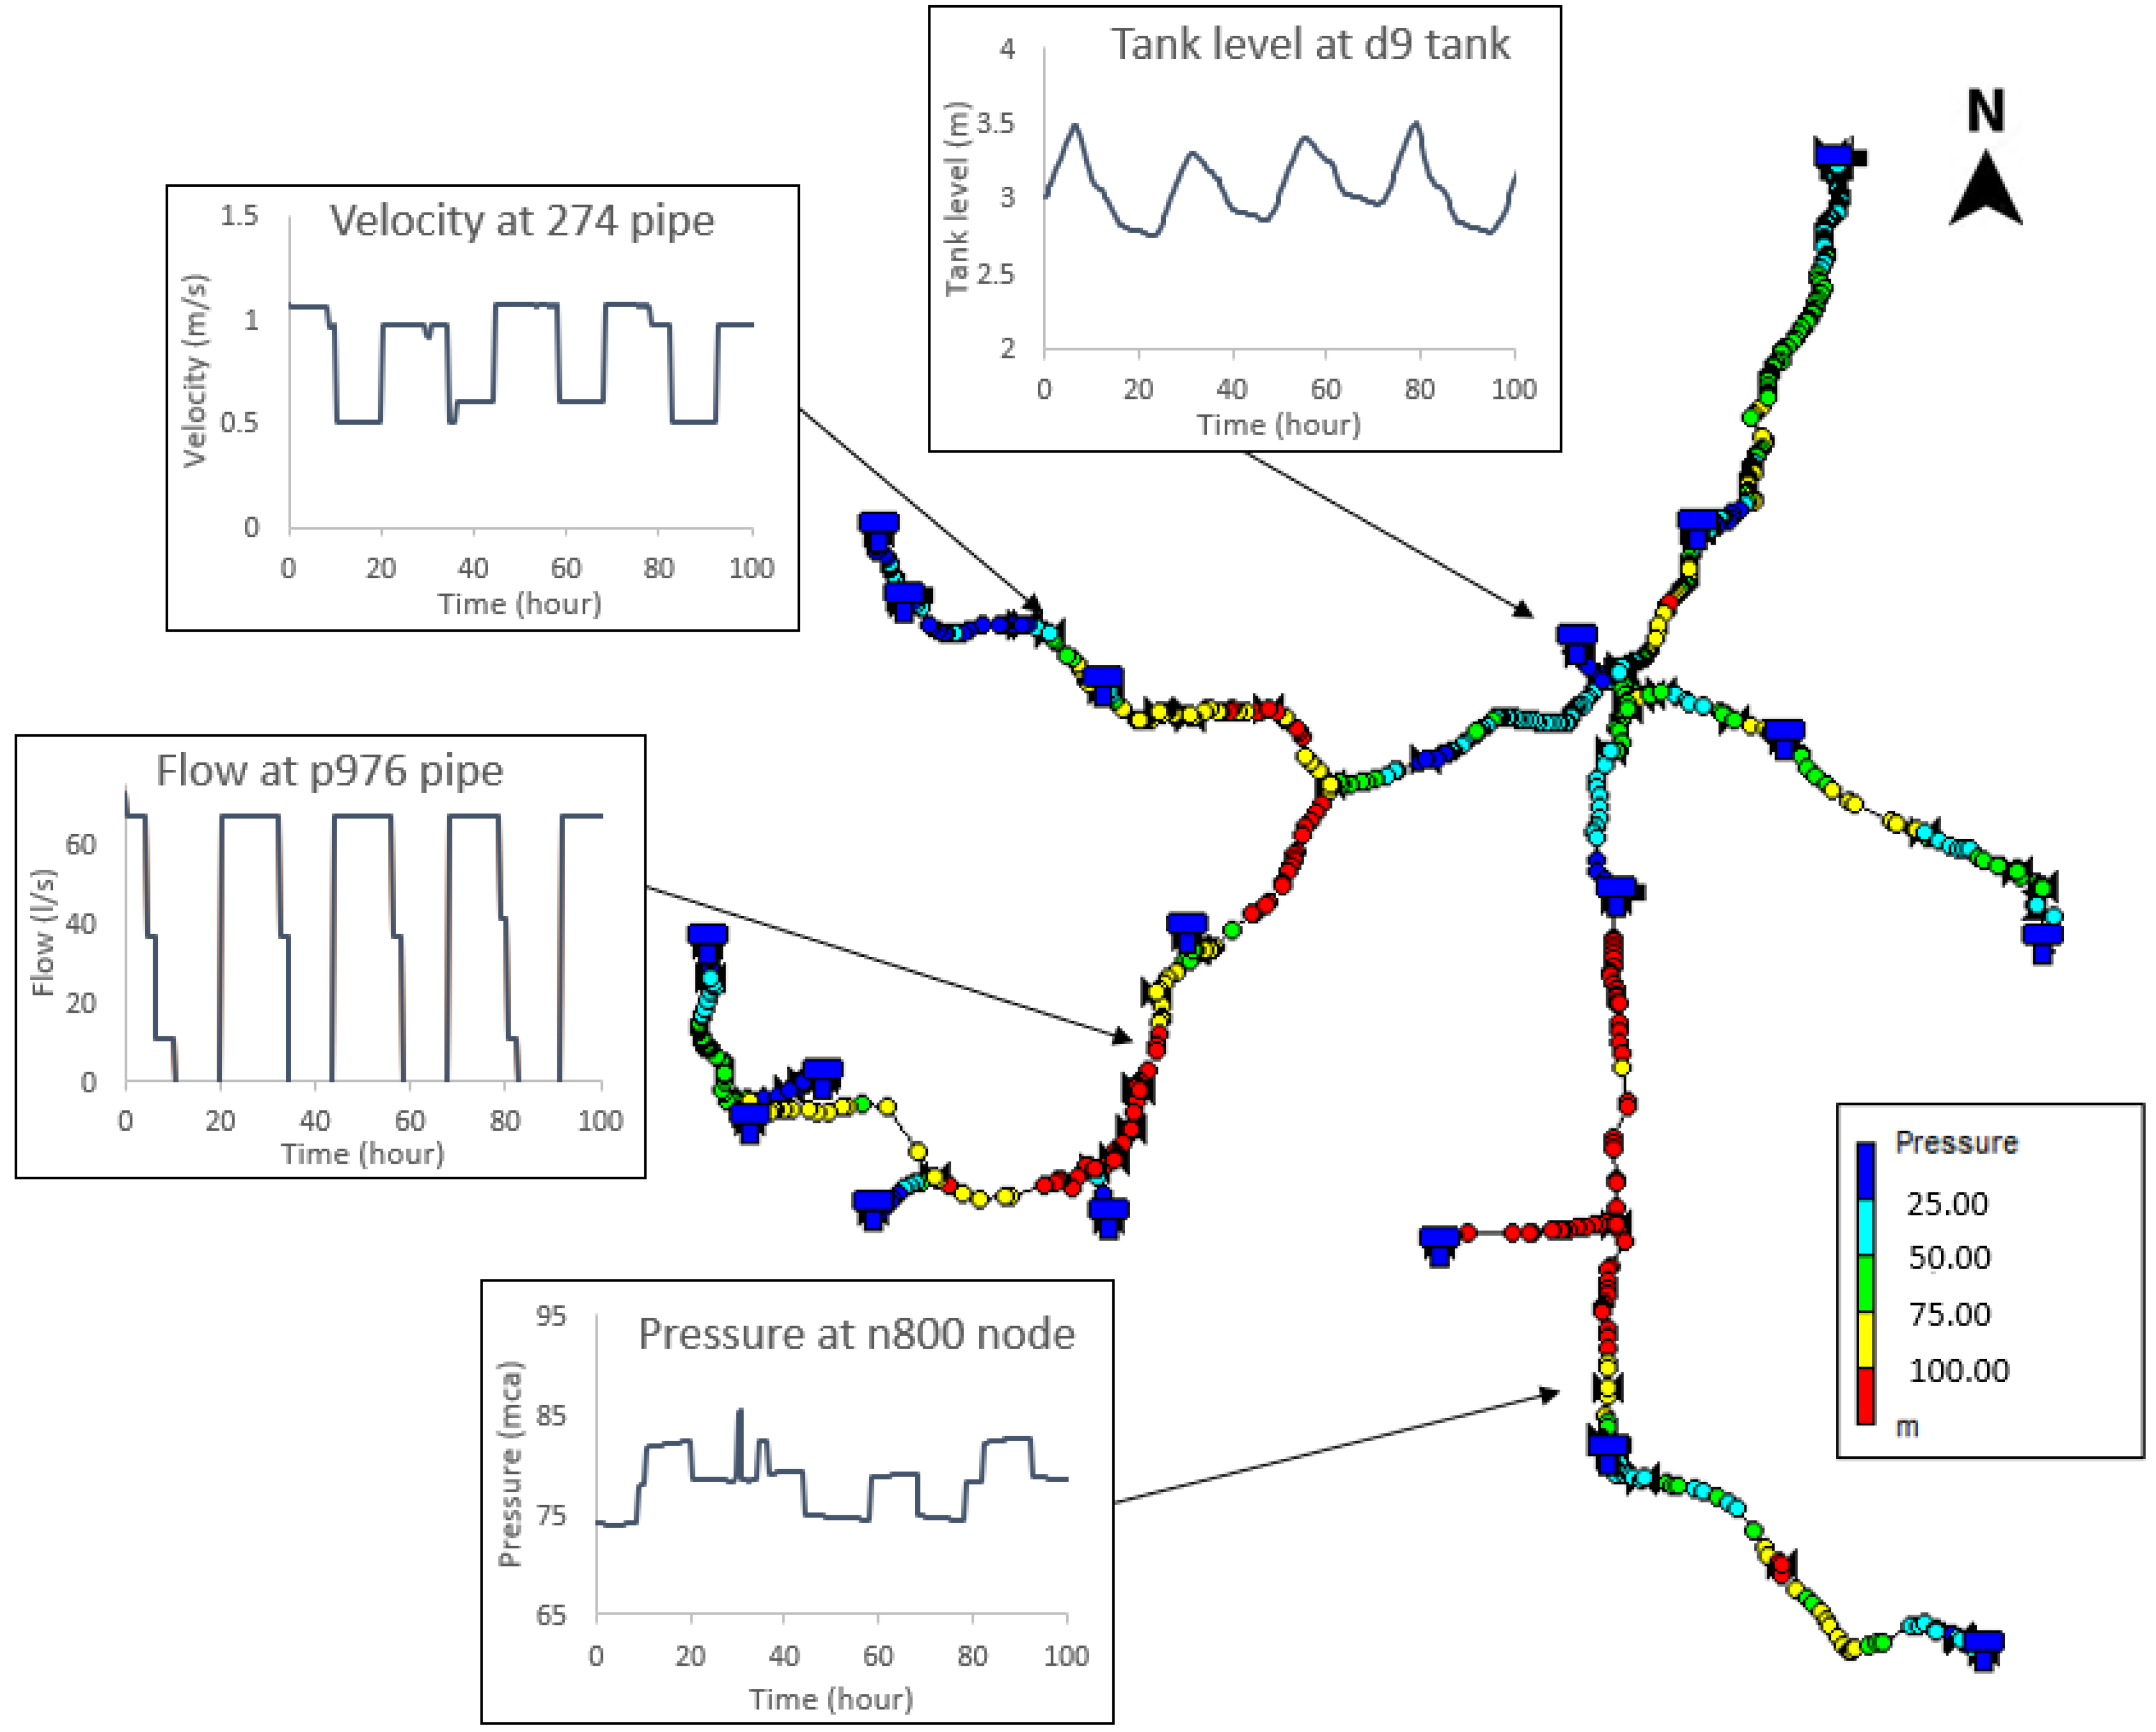
The simulation of the hydraulic model provides the value of the main hydraulic variables in steady state or the evolution of these values over time at any point in the network when the nonstationary operation option is selected (
Figure 6). This information must be processed by a qualified operator who analyzes pressure and flowrate distributions to take the appropriate decisions for each situation.
3.4. Mobile Application
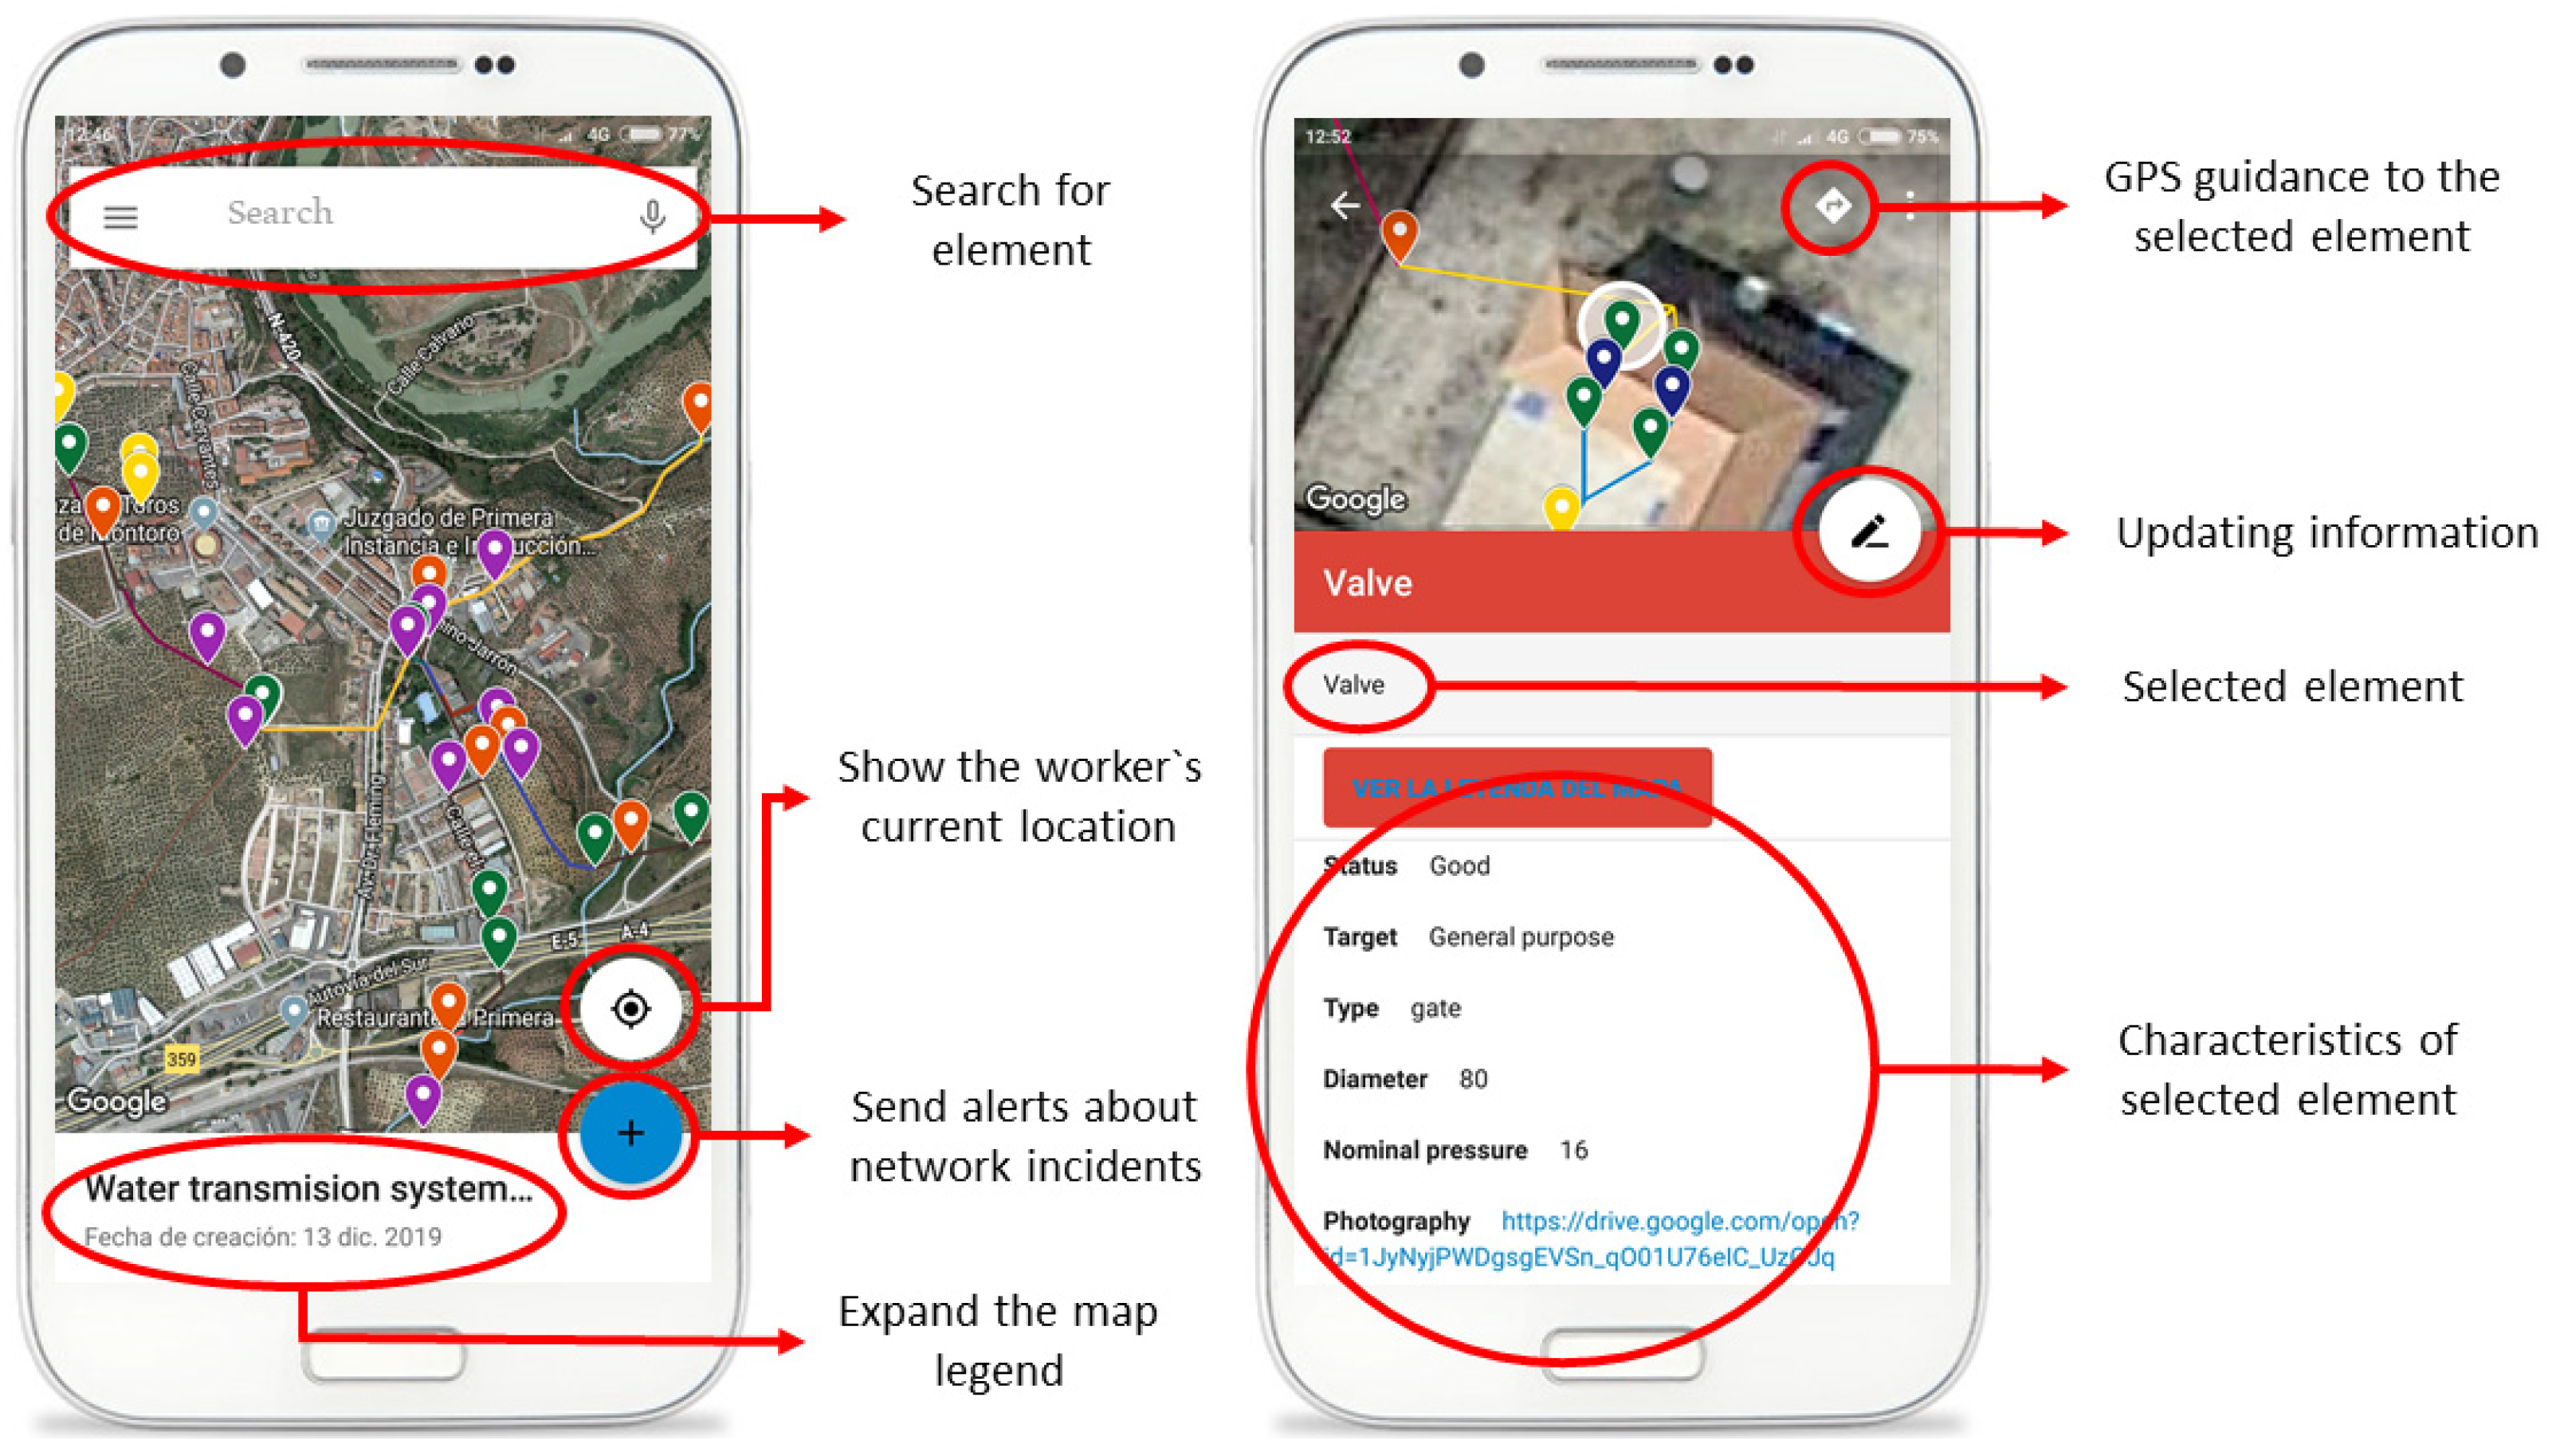
ITWSM-app is a customized application of Google My Maps for WSS management. It has been applied to facilitate access of field workers of the ES to its GIS database with a user-friendly interface (
Figure 7). This app allows maintaining the GIS updated with worker contributions, a highly valuable information source. The quality of GIS updates is critical for correct hydraulic model simulations. Users can update existing information and send warnings about network incidents, GPS guidance, etc.
3.5. ITWSM Application
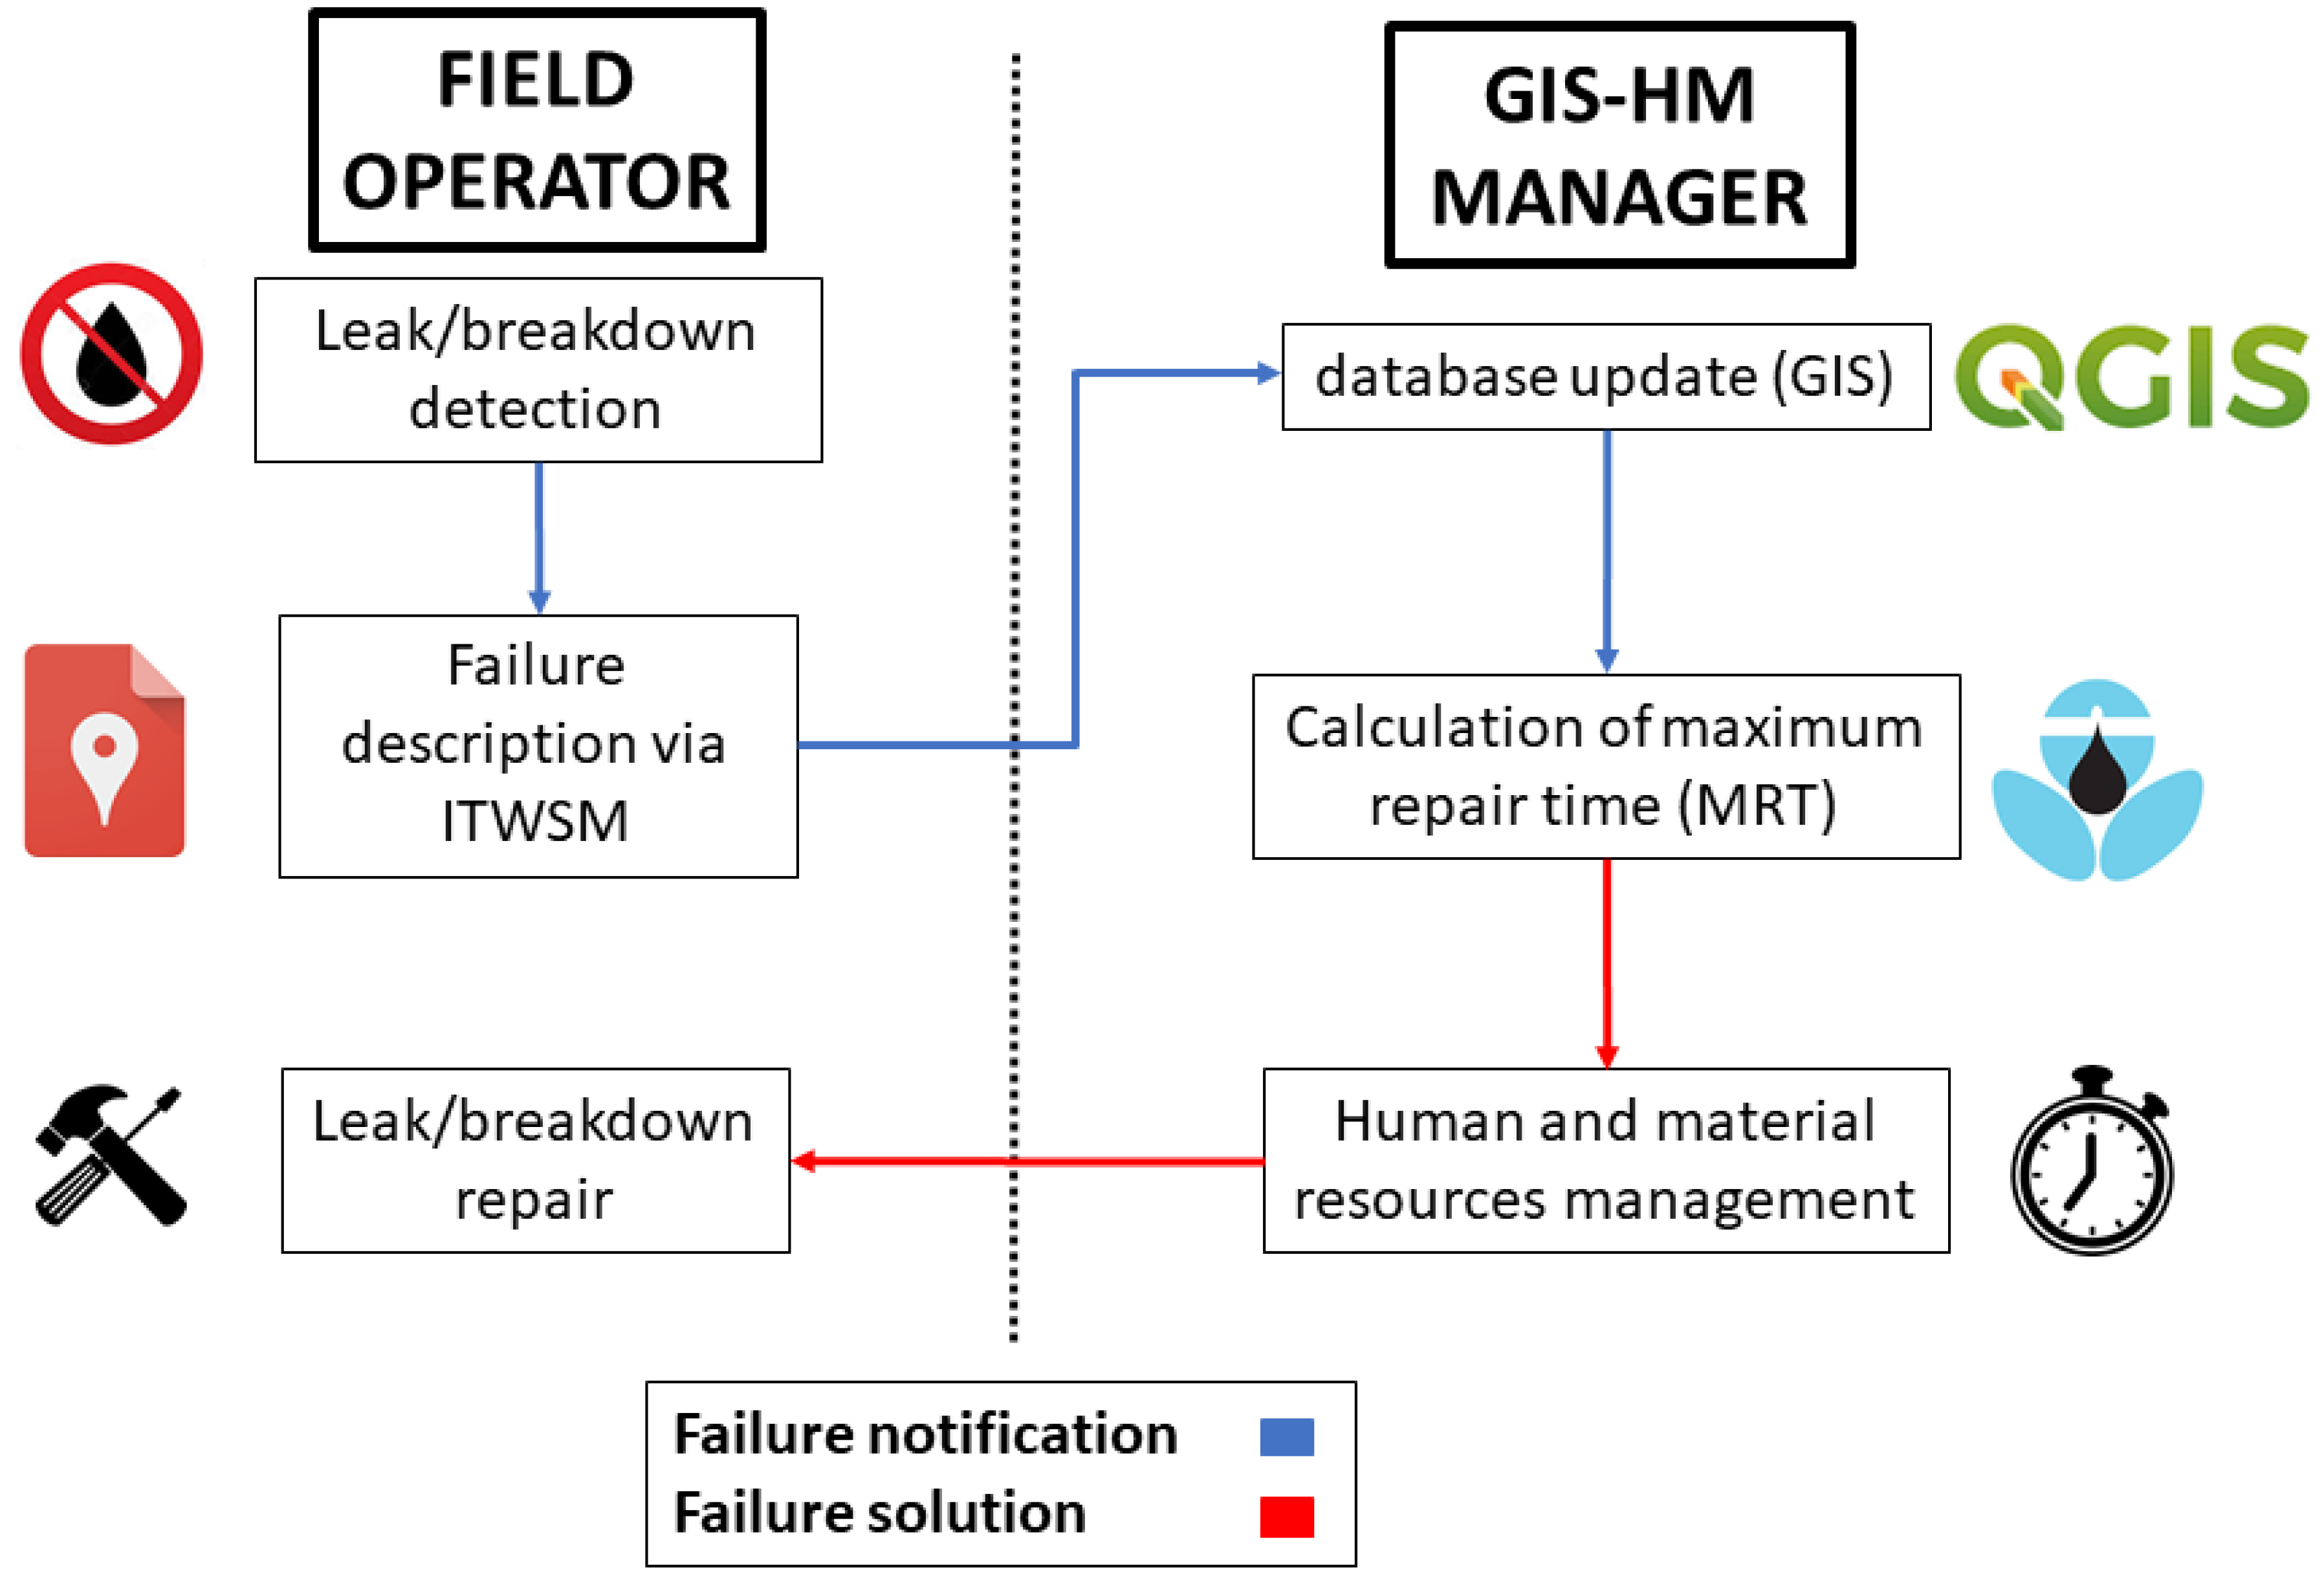
ITWSM has been applied to manage the breakdown repairs occurred in the study WTS. During 2019, 23 severe failures that required water supply interruptions were recorded. ITWSM is aimed at facilitating decision making when any failure occurs in the WTN as soon as the technical staff is informed of the incident. Then, the operation protocol (
Figure 8) is followed.
The field operator detects the problem, performs an initial evaluation of it on site, and then, using ITSWSM-app, sends a description (including photographs) of the incident to the GIS-HM manager. The location of the incident is also recorded, using the GPS function of the operator’s smartphone. The GIS-HM manager receives this information and identifies the elements and users affected in the GIS. After that, the HM is then updated to simulate the georeferenced failure in extended period mode to calculate the MRT as described previously. According to these results, the GIS-HM manager plans the repair of the failure. The database is continuously updated with the introduction/modification of elements after fixing the failure.
The main objective of this methodology is to conduct an optimal management of human and material resources to minimize the repair time to avoid that any municipality could be affected by the failure.
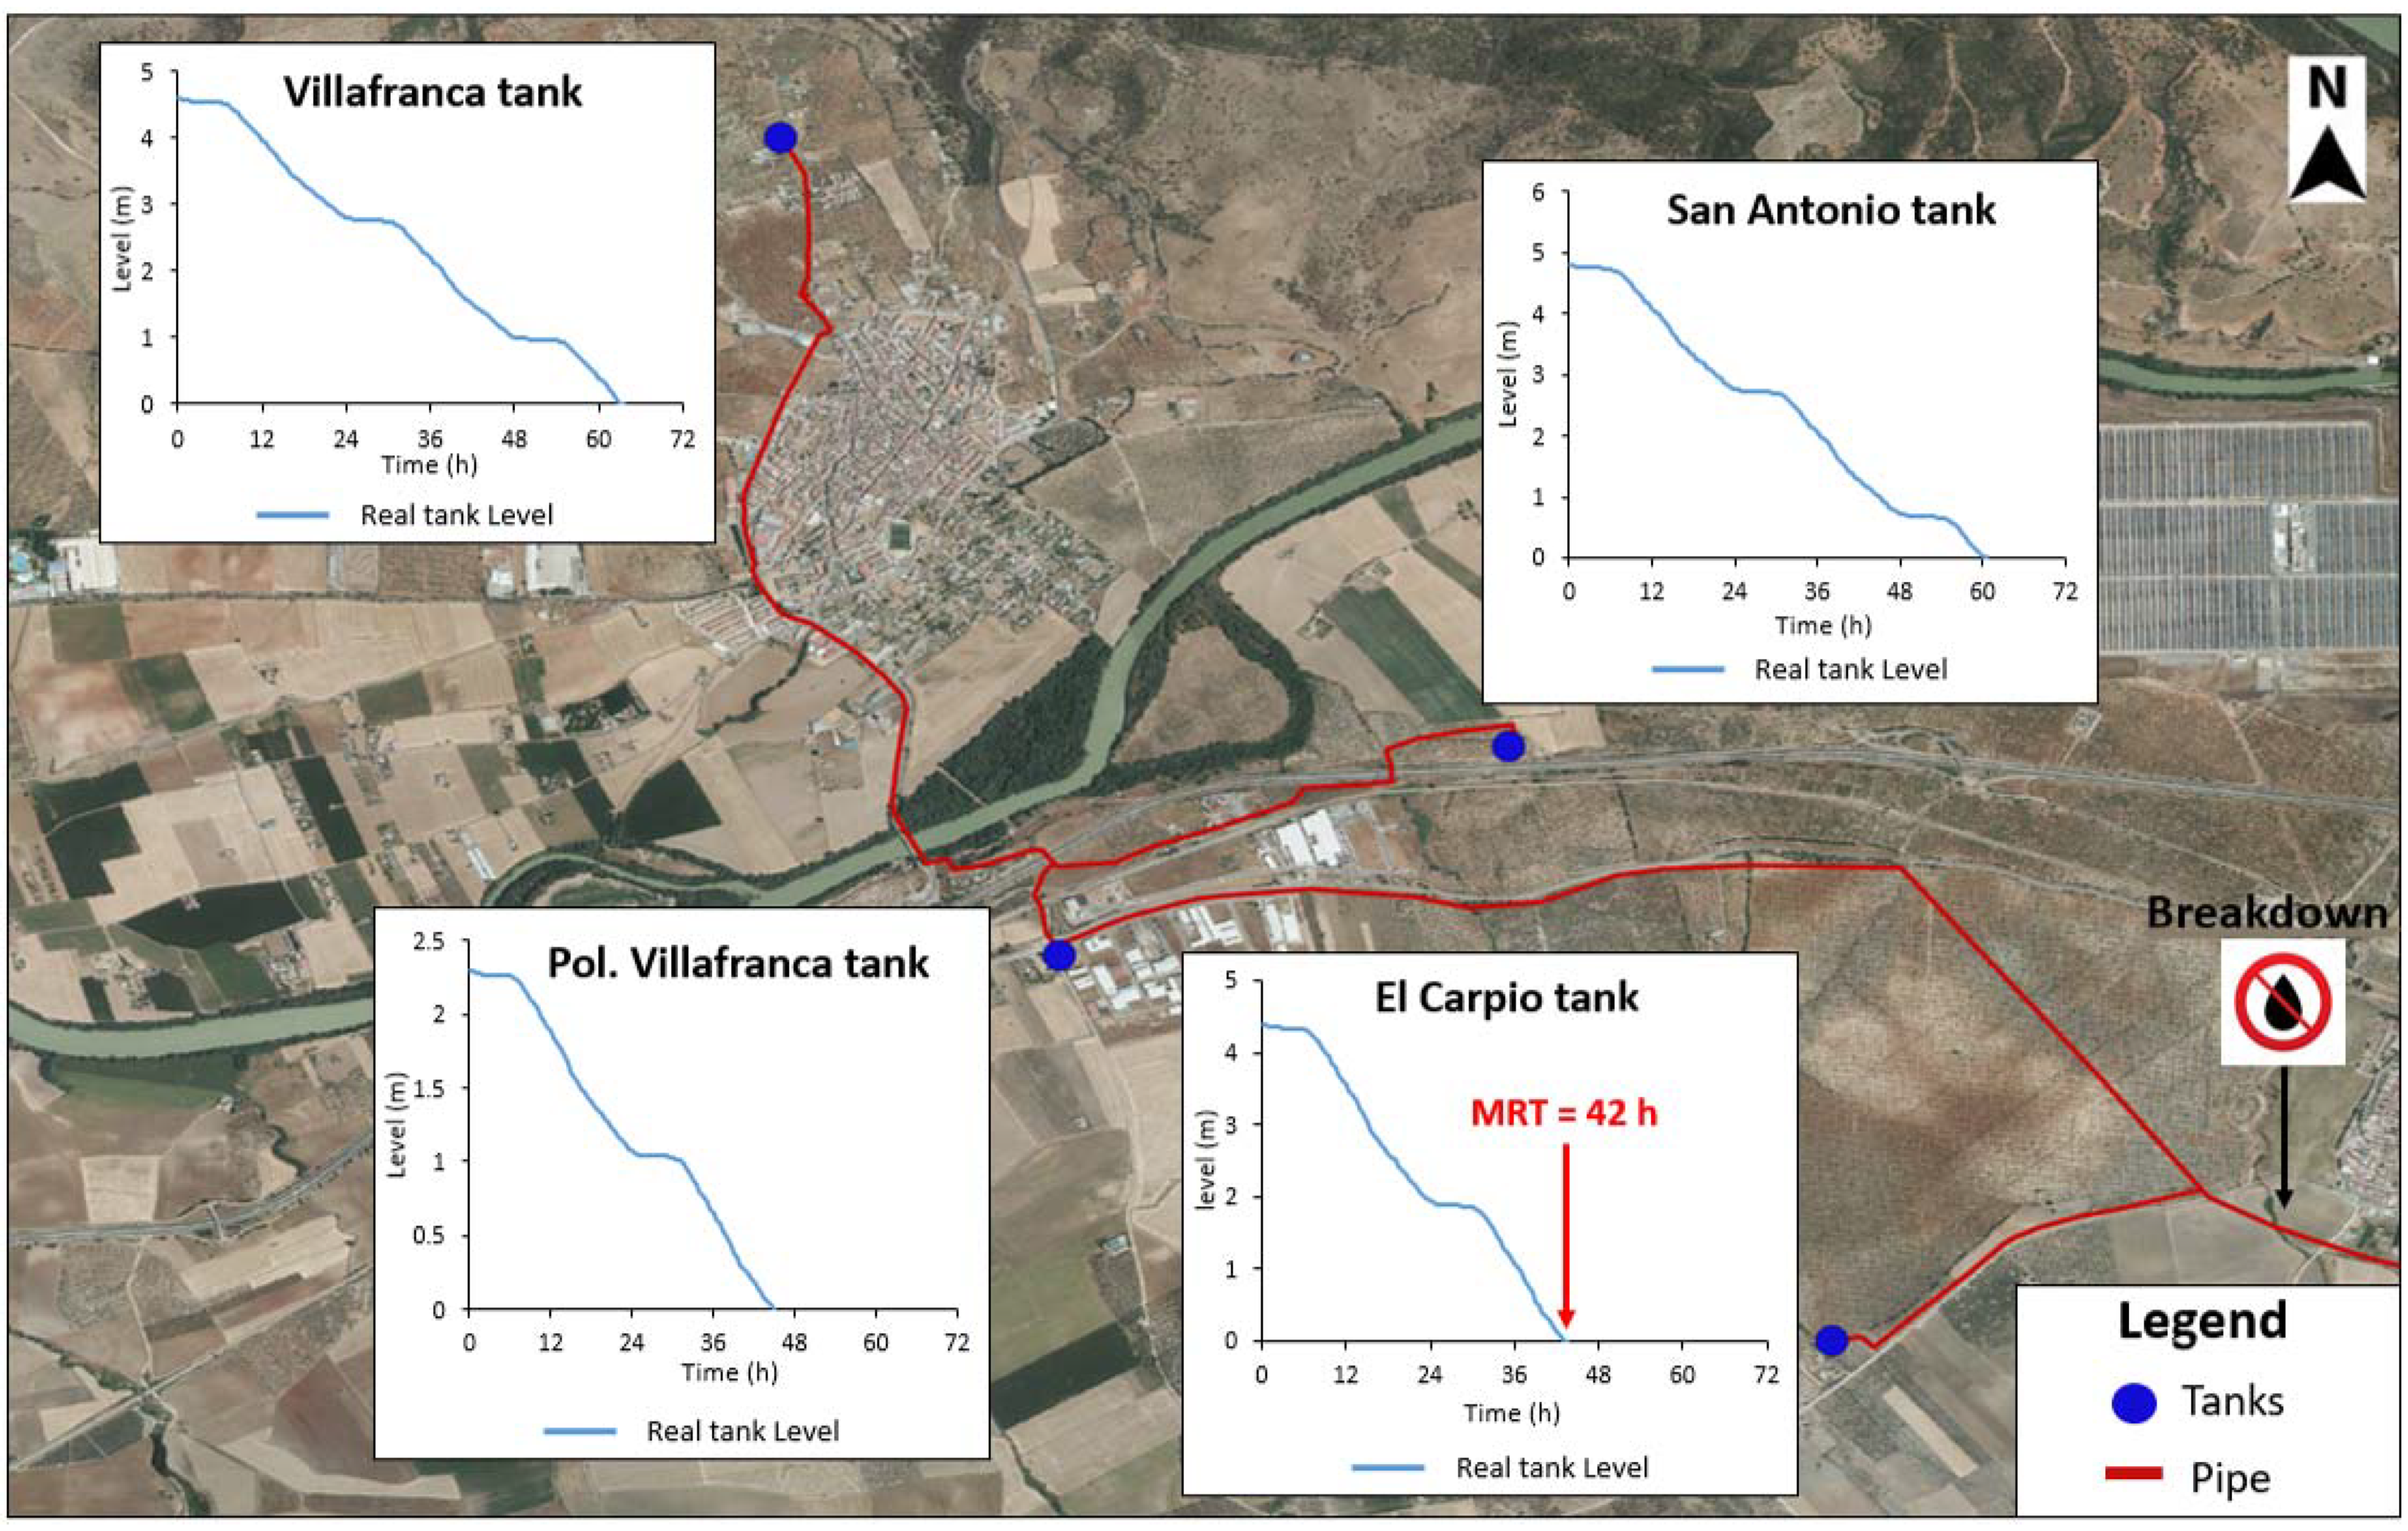
ITWSM was applied to manage repair tasks of a breakdown occurrence in the main pipe of the WTS on 10 February 2020 (
Figure 9). This breakdown affected four tanks when failure occurred. Firstly, once the leak was detected, the water supply was interrupted downstream of the failure point in the main pipe by field works and communicated through ITWSM-app to the system managers. Then, the hydraulic model was run to calculate the MRT.
The water level in the affected tanks at the failure time must be known to identify which tank is more restrictive. The most restrictive tank is determined according to different criteria aimed at minimizing the impact of failures on the end users. Thus, the MRT could be the shortest time for emptying the reservoirs of the affected municipalities or the emptying time of the tank of the municipality with the largest population, as examples of criteria for defining the MRT. In this case, the emptying of the El Carpio tank was considered the most restrictive; therefore, it determined the MRT of the studied failure.
Figure 9 shows the location of the tanks and the hourly evolution of the tank levels after the water supply was cut.
ITWSM facilitates the communication of incidents between personnel involved in decision making and breakdown repair workers and speeds up the repair process reducing reaction time.
3.6. Assessment of the ITWSM DSS
To demonstrate the effectiveness of the proposed DSS,
Table 2 shows a comparison of the failure records for the years 2019 and 2020. The difference between the 2 years was the implementation of ITWSM. In 2019, there was no management system available, whereas, in 2020, the ITWSM was implemented.
In order to objectively evaluate the advantages/disadvantages of ITWSM, the following parameters were compared: number of failures (leaks or breakages that implied supply interruptions), the average repair time (time elapsed since the failure was detected until the supply is restored), the average cost of part replacement (pipes, valves, pumps, etc.), the average machinery costs (backhoe, truck, trailer, etc.), and the average labor cost, which depends on the number of workers (own or external) involved in the repair and their working time.
The number of failures in both years was similar. These data justify the objective comparison between the two periods. The average repair time was much higher in 2020 compared to 2019. The main explanation for this difference is the correct time management. Whereas, in 2019, all failures were repaired as quickly as possible, in 2020, once a breakdown was detected and the water supply was interrupted from the affected pipe, the situation was assessed and the MRT was calculated by ITWSM. Then the repair tasks were planned to use the available resources in an effective way. The increase in the average repair time did not imply a shortage of water for end users, as the repair times were smaller than the MRT of each failure. The increase in the average repair time did not lead to an increase in water losses. As soon as the breakdown were detected, the affected pipe was closed, and water losses were avoided.
This correct time management due to the implementation of ITWSM allowed a reduction in the machinery and labor costs (59.0% and 28.2%, respectively). The element replacement cost was very similar in both years. To achieve these results, the repair of leaks/breaks was planned in such a way that the repairs were carried out during the normal working hours of the workers (avoiding cost overruns due to overtime hours). A longer observation period is needed to validate these good rates. It is also necessary to implement the same methodology in other types of hydraulic networks (distribution water networks, meshed water network, large- and medium-sized companies, etc.).
4. Conclusions
ITWSM helps to reduce repair costs and water supply interruptions for end users. Through easy and quick communication between field workers and decision-makers, it is possible to improve decisions about where and how to act on each failure. The GIS and the hydraulic model integrated in ITWSM provide a source of knowledge for managers that can help to save water by an efficient failure management. An effective planning of available resources (human and material) can be carried out to fix failures before MRT is reached to avoid water outages. Efficient use of resources entails cost savings.
ITWSM allowed cost reductions in the presented case study. Average breakdown repair costs were reduced in the year that the proposed tool (ITWSM) was used. Mainly, machinery costs (59.0%) and labor costs (28.2%) were reduced due to better resource planning once the maximum repair time (MRT) was known. ITWSM allows improving the management of repair processes and, consequently, reducing water supply interruptions to end-users, thanks to the information provided by the hydraulic model on which it is based.
The ITWSM-app user can log failure data (e.g., breakdowns) in digital format. Information about location, staff, machinery, and material used in each repair is stored. The economic analysis of repair costs of the network elements that have undergone frequent repairs can be used to estimate the timing of their replacement by new elements.
The developed DSS and its app facilitate sharing information among different departments of the water service. The user-friendly interface of ITWSM-app facilitates the visualization of complex data, reducing the adaptation time of new workers who can make informative queries (location, hydraulic features, etc.) about any system element. The availability of ITWSM-app allows the continuous update of the database of all the network elements. The participation of the company’s staff in the implementation of ITWSM is essential for the optimal management of the WSS.
The high costs of implementing new technologies increase the digital divide between large and small companies. The proposed DSS, based only on open-source software, allows the digitization of companies with limited financial resources. ITWSM provides users independence from commercial DSSs for water. A key feature of ITWSM is its modular nature as it is made up of separate open-source modules that can be replaced at any time by a new, more advantageous alternative.
The costs related to the implementation of this digitization methodology are low. This methodology does not have any costs associated with software (only free software is used: Qgis, Epanet, and Google My Maps) or material. The only resource required is personnel with the necessary knowledge to carry out these tasks. Currently, the need for knowledge related to open-source software is compensated for by the large amount of information available on the internet. In addition, the use of free software allows the company to have the control over the digitization process. Once the system has been implemented, there should be one or more people (depending on the number of hydraulic networks to be managed) in charge of updating the GIS/hydraulic model.
ITWSM has been successfully implemented in a real public water supply company to manage its WTS. A breakdown repair in this WTS was analyzed as a case study. ITWSM provides WTS managers with the parameter MRT, i.e., the time available to fix the failure to avoid water outages on end users. The comparison of the repair costs in 2019 and 2020 showed that the average repair cost was reduced by 13.6% in 2020 mainly due to the optimal planning of personnel and machinery involved in the repair works. This methodology is currently being implemented in other water networks of Córdoba’s provincial water supply company in order to verify these values.
The WTS management approach described herein should be introduced progressively according to the staff characteristics of each water service. Younger staff can easily adopt technological tools, unlike workers close to retirement age that are often reluctant to use new technologies. This drawback could be minimized by offering training courses to show the advantages of mobile apps in daily work.


