
Optimization of Magnetic Nanoparticles Draw Solution for High Water Flux in Forward Osmosis


1
Department of Civil and Architectural Engineering, College of Engineering, Qatar University, Doha P.O. Box 2713, Qatar
2
Gas Processing Center, College of Engineering, Qatar University, Doha P.O. Box 2713, Qatar
*
Author to whom correspondence should be addressed.
Water 2021, 13(24), 3653; https://doi.org/10.3390/w13243653
Submission received: 18 November 2021
/
Revised: 11 December 2021
/
Accepted: 13 December 2021
/
Published: 20 December 2021
(This article belongs to the Special Issue Application of Membrane Processes in Purification and Power Generation Systems)
Abstract
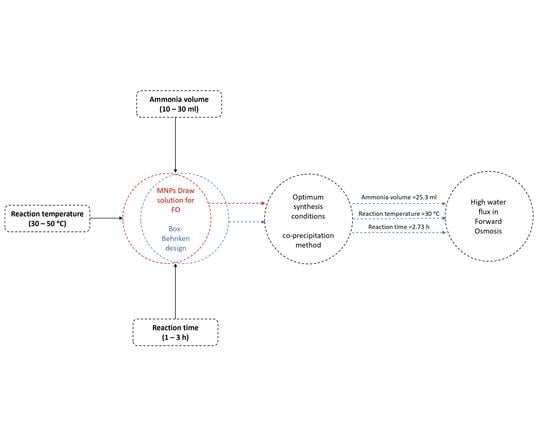
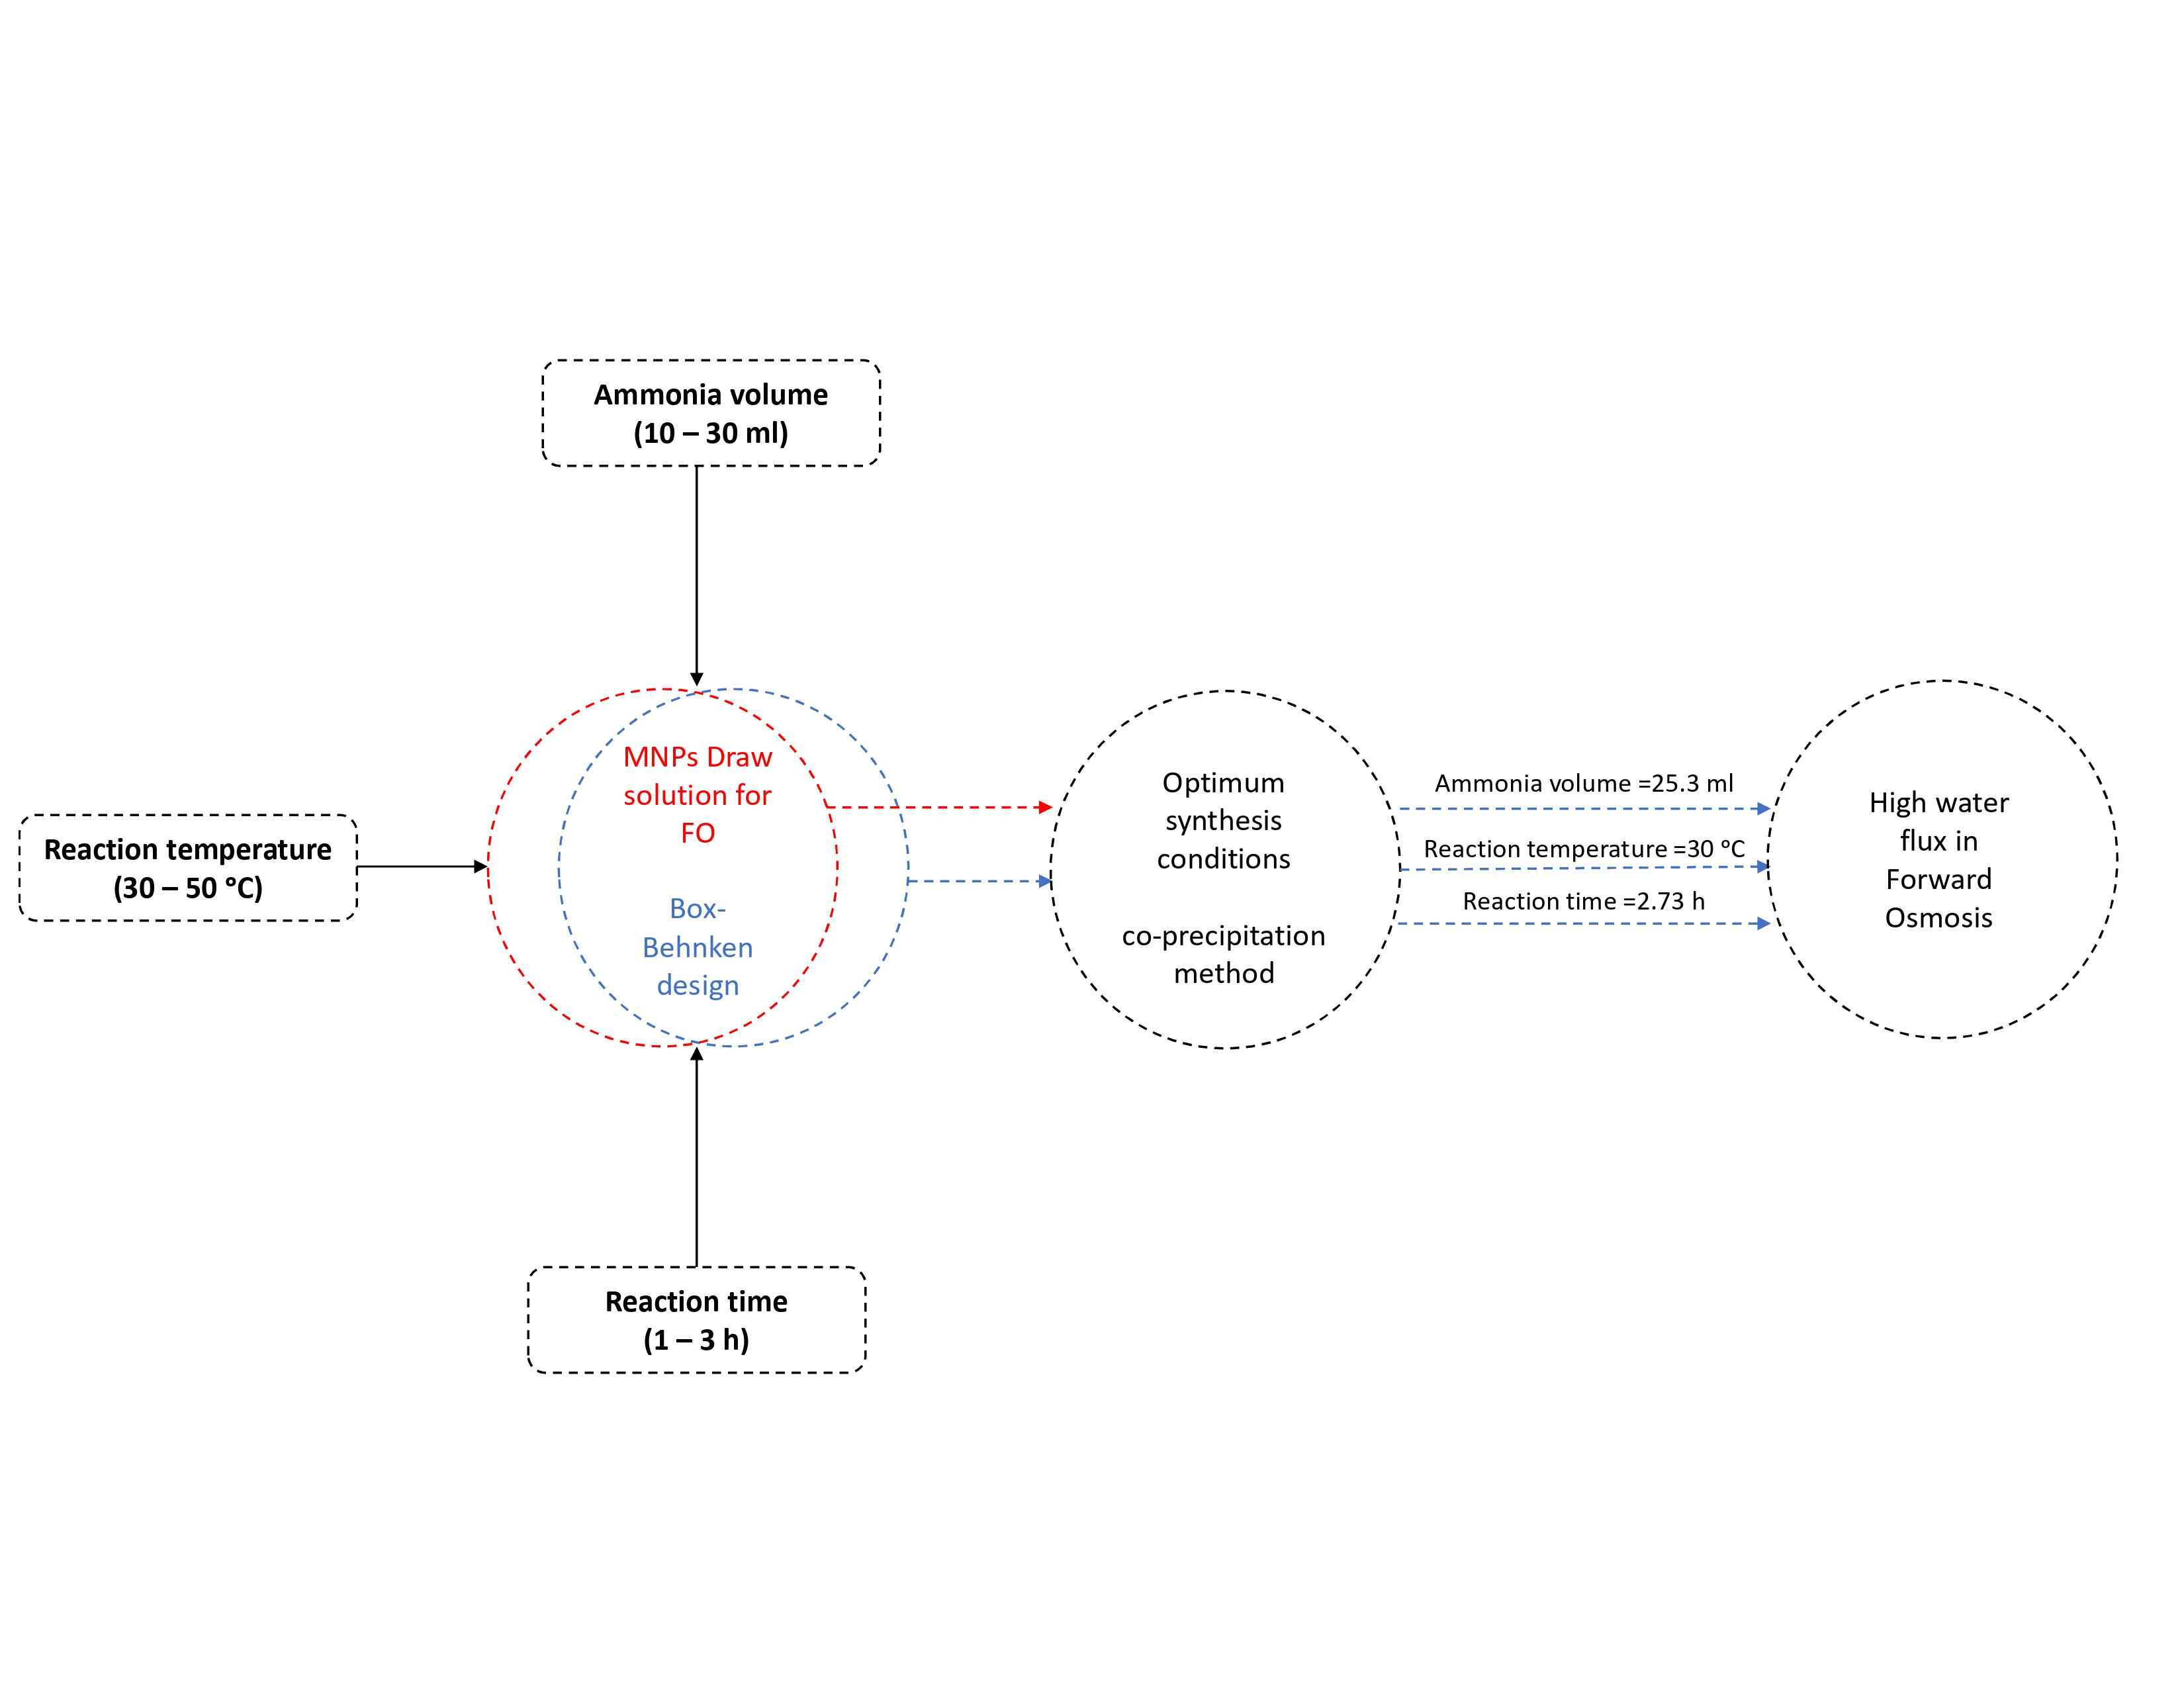
:In this study, bare iron oxide nanoparticles were synthesized using a co-precipitation method and used as a draw solute in forward osmosis. The synthesis conditions of the nanoparticles were optimized using the Box-Behnken method to increase the water flux of the forward osmosis process. The studied parameters were volume of ammonia solution, reaction temperature, and reaction time. The optimum reaction conditions were obtained at reaction temperature of 30 °C, reaction time of 2.73 h and 25.3 mL of ammonia solution. The water flux from the prediction model was found to be 2.06 LMH which is close to the experimental value of 1.98 LMH. The prediction model had high correlation factors (R2 = 98.82%) and (R2adj = 96.69%). This study is expected to be the base for future studies aiming at developing magnetic nanoparticles draw solution using co-precipitation method.
1. Introduction
Membrane separation processes are the most promising technology for desalination and wastewater treatment [1,2,3,4]. Reverse osmosis, nanofiltration, and ultrafiltration processes are the most commonly used membrane processes but suffers from high energy consumption and irreversible membrane fouling [5,6,7,8]. Forward osmosis (FO) has the least energy consumption and minimal membrane fouling because it operates based on the osmotic pressure gradient between the feed solution (FS) and draw solution (DS) [9,10,11]. However, forward osmosis suffers from the high cost of the DS regeneration process.
Magnetic Nanoparticles (MNPs) draw solutes could be a promising DS due to the easy regeneration, low reverse solute flux and long lifespan [12,13]. The magnetic nanoparticles can be regenerated using low-cost magnet unlike other draw solutes which requires energy intensive processes [14,15]. Guizani et al. (2020) evaluated the performance of iron oxide (Fe3O4) nanoparticles coated with polyethene glycol as a draw solute for the concentration of urine using FO process [16]. The magnetic nanoparticles were synthesized with various coating ratio of polyethene glycol with a molecular weight of 4000 using co-precipitation method. The maximum water flux was almost 1 LMH. The low water flux can be attributed to the low osmotic pressure gradient between the urine and the used DS, to concentrate urine by 5 folds it is expected to use a DS with an osmotic pressure of 115 atm [17]. The experiment was repeated for several times to check the recyclability of the MNPs, the water flux decreased by 7% after 3 cycles. Attallah et al. (2018) synthesized magnetite nanoparticles coated with pectin to be used as DS for the FO process [18]. The water flux of pectin coated MNPs was higher than the water flux obtained using uncoated MNPs. The highest water flux was 0.4 LMH using well water as FS and 2 wt% of MNPs as DS. Shabani et al. (2016) evaluated the performance of chitosan and dehydroascorbic acid-coated Fe3O4 nanoparticles to be used in the FO process [19]. The water flux obtained using dehydroascorbic acid coated MNPs was higher than chitosan coated MNPs due to the higher hydrophilicity of the synthesized MNPs. While using pure water as FS and a DS concentration of 0.06 g/L, the maximum water flux obtained using dehydroascorbic acid coated NPs was 6.2 LMH and the water flux obtained using chitosan was 5.3 LMH. Azadi et al. (2020) developed a gelatin coated MNPs for the desalination of brackish water using FO process [20]. The highest water flux was 1.54 LMH using a MNPs coated with gelatin as DS and deionized water as FS. The initial water flux decreased to 0.365 LMH after repeating the process for nine cycles. Rivas et al. (2018) evaluated the performance of sodium polyacrylate coated MNPs draw solution synthesized using green chemistry routes [21]. It was observed that the coating agent affected the texture of the MNPs and decreased the particle size. The osmotic pressure increased when using the coated MNPs due to the high stability of the dispersion.
To the best of the authors knowledge, there are no studies on optimizing the synthesis condition of magnetic nanoparticles draw solution using co-precipitation method to increase the water flux in the FO process. The objective of this study is to optimize the bare iron oxide nanoparticles draw solution synthesis conditions to increase the water flux in the FO process. The synthesis conditions were optimized using Box-Behnken designs of experiment and water flux as the response. The synthesis parameters were reaction temperature, reaction time, and volume of ammonia solution. The optimization process using the response surface methodology includes selection of the appropriate experimental runs, approximation of the model coefficients, and validation of the final model [22]. This study is expected to provide the most suitable conditions for synthesizing bare MNPs to be used as draw solute in the FO process. The results are expected to be the base for future studies aiming at developing magnetic nanoparticles draw solution using the co-precipitation method.
2. Materials and Methods
2.1. Materials
Ferrous chloride (tetrahydrate) (FeCl2.4H2O) and Ferric Chloride (Hexahydrate) (FeCl3.6H2O) (99%, purity) were used as a source for iron (II) and iron (III) ions, respectively. Ammonia solution 25% (NH4OH) was used as the base solution and Ethanol (99%, purity) was used for washing of the NPs. All chemicals were purchased from (Alpha Chemika) (Mumbai, India) and used without further purification.
2.2. Nanoparticles Preparation and Characterization
Iron oxide nanoparticles were synthesized using co-precipitation method as reported by Ewis et al. (2020) and elsewhere [23]. Then, 1.8 g of FeCl2 was dissolved in 100 mL of distilled water and 4.8 g of FeCl3 in 70 mL of distilled water. Both solutions were mixed together for 30 min using a magnetic starrier at 800 rpm to form an orange color solution. The temperature was adjusted carefully before proceeding to the next step. NH4OH was added to the solution dropwise using a transfer pipet. The solution was mixed at 800 rpm using the designed reaction time and temperature. A magnet was used to assist the precipitation process and separate the magnetic nanoparticles from the reaction supernatant. The iron oxide nanoparticles were washed three times with distilled water then two times using ethanol to remove the excess amine and other impurities from the surface of the particles. The nanoparticles were dried overnight using oven at a temperature of 75 °C. In the last stage, the particles were grinded manually and kept in a closed dark container. The nanoparticles were characterized using Transmission Electron Microscope (TEM), X-ray diffraction (XRD), and Zeta Potential Analyzer. XRD measurement was carried using diffractometer (Rigaku MiniFlex-600°) in the range of 2θ diffraction angles between 20° and 80.0° by a step of 0.02°. Transmission Electron Microscope (TEM) measurements were completed using ThermoFisher (TECNAI G2 TEM, TF20) produced by (Thermo Fisher Scientific) (Waltham, Massachusetts, United States). Zeta potential of the nanoparticles was measured using a Zeta Potential Analyzer (Malvern-ZEN3600) produced by (Malvern Panalytical Ltd.) (Malvern, United Kingdom) after dispersing the particles in distilled water.
2.3. Membrane Filtration Setup
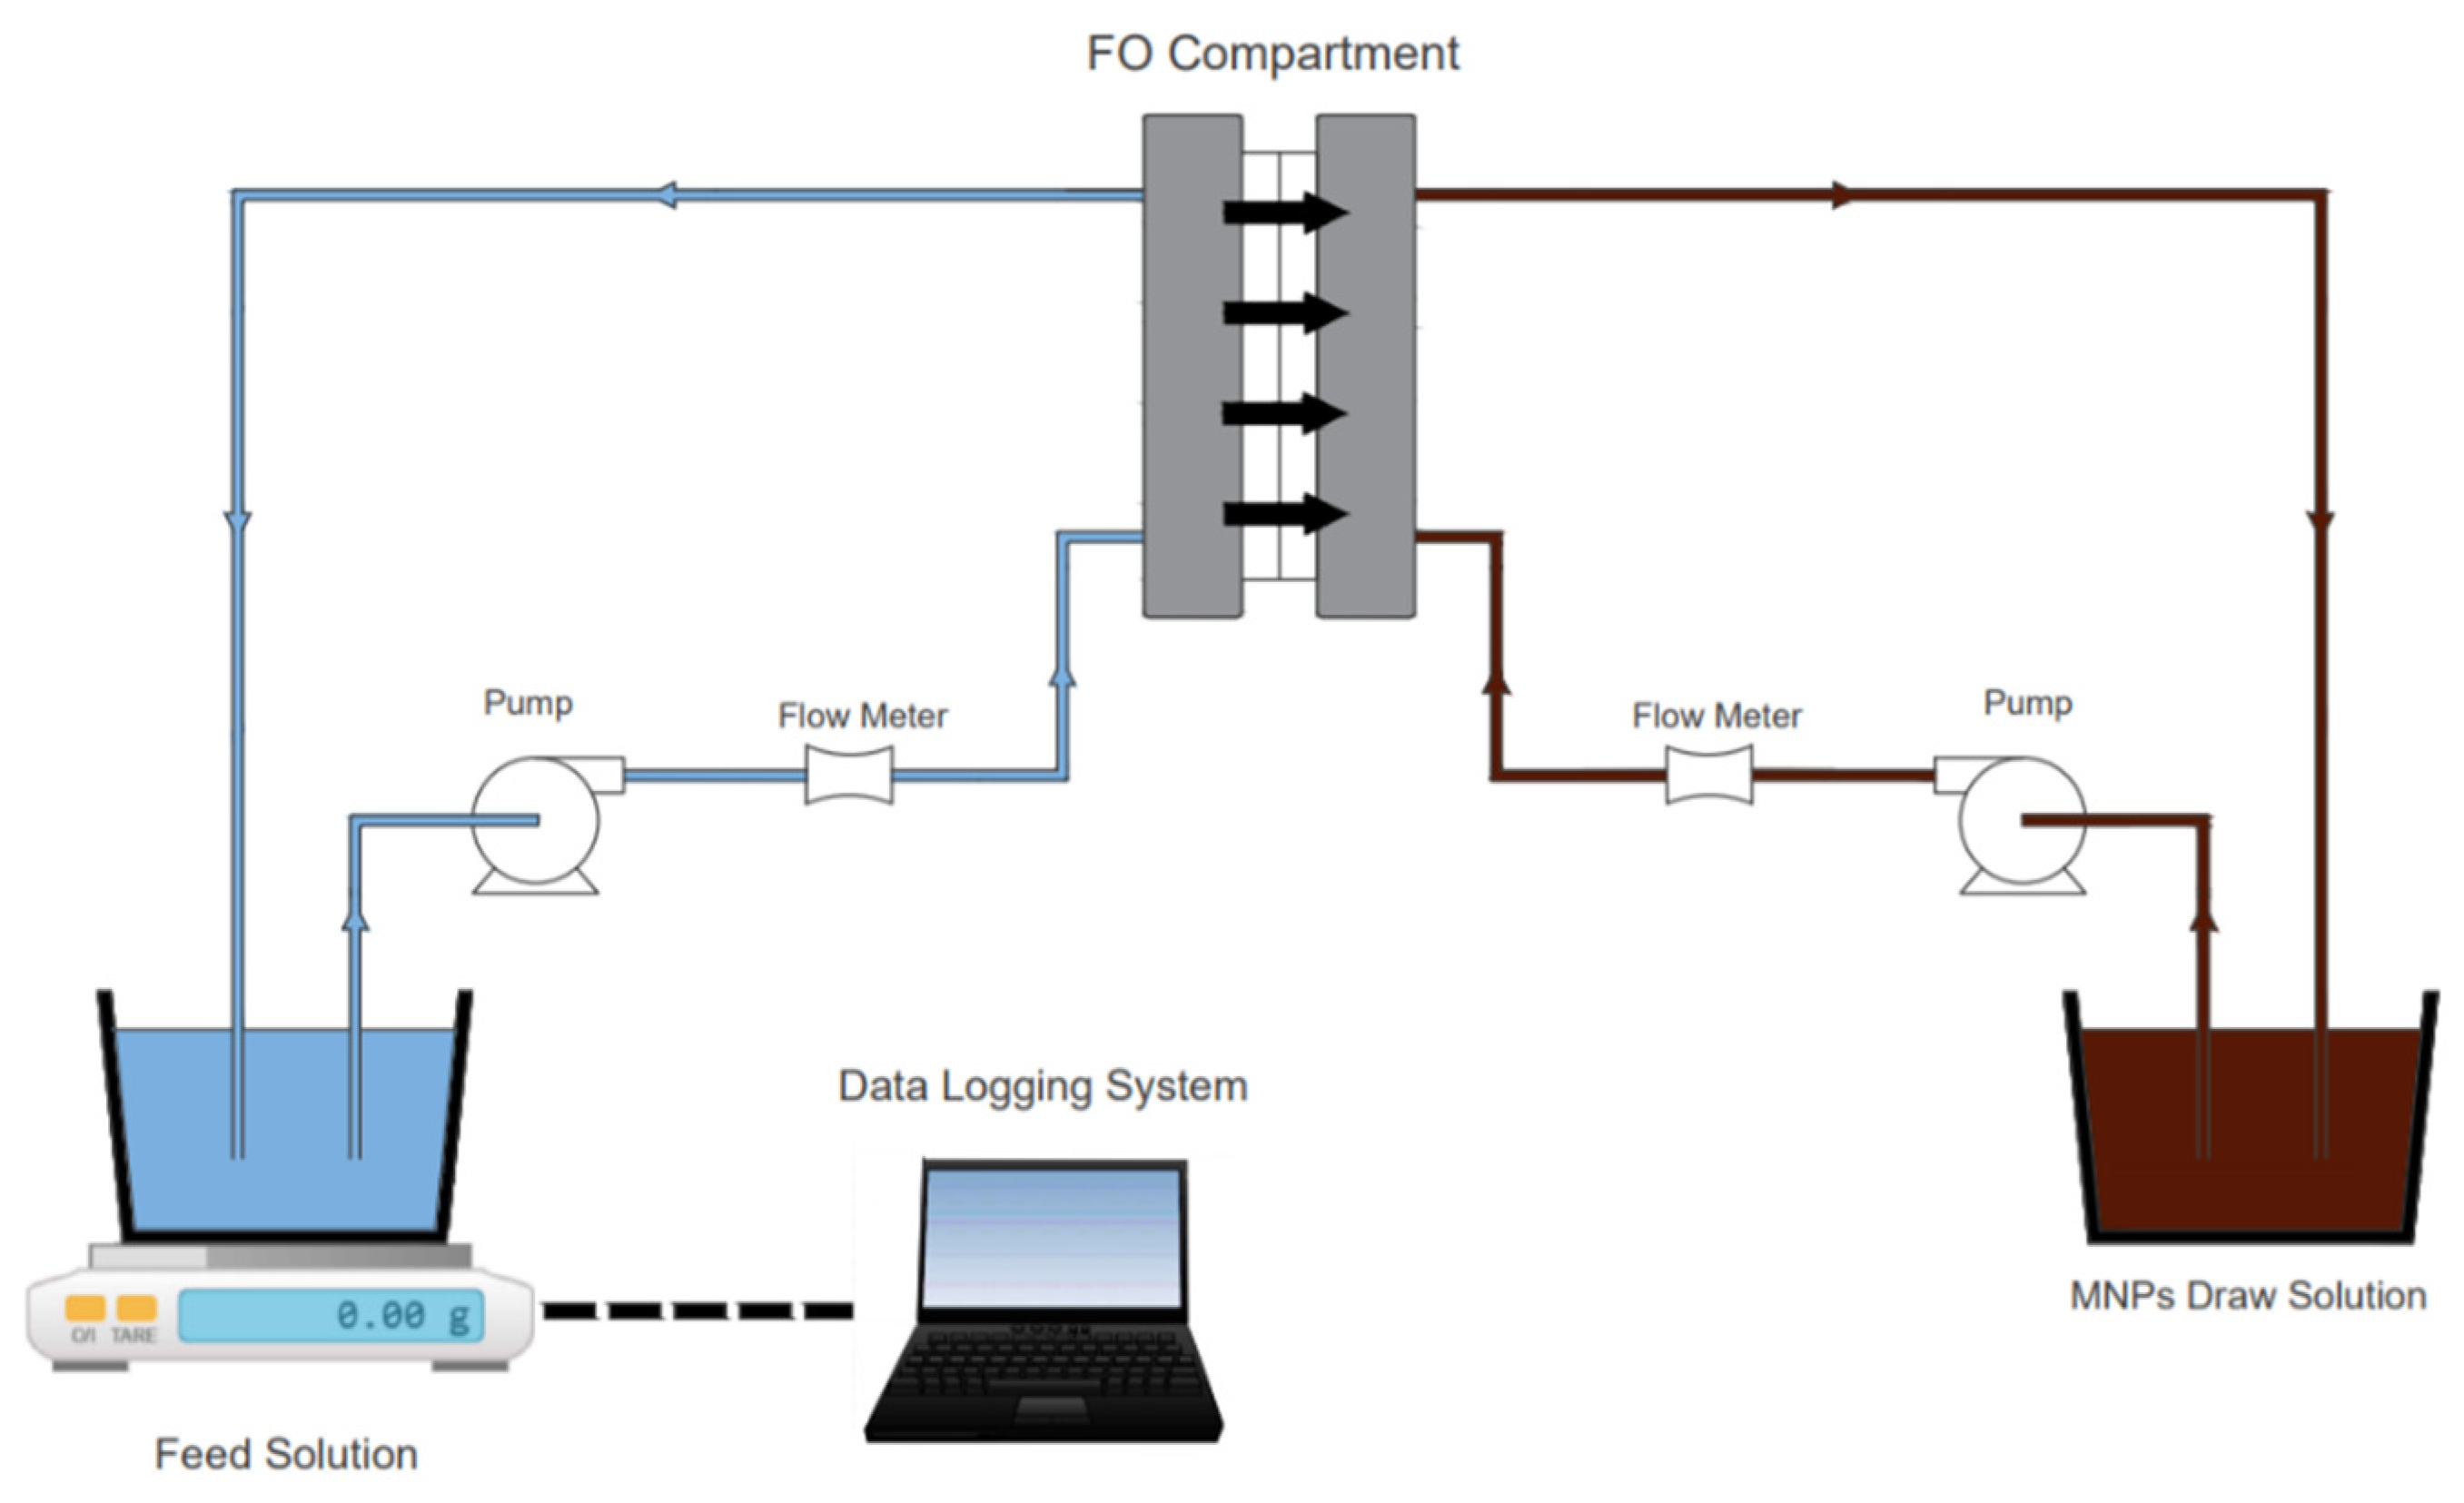
A schematic drawing for the FO setup used in the experiments is shown in Figure 1.
The FO cell was purchased from (Sterlitech Corporation) (Auburn, Washington, United States) and has outer dimensions of (5 × 4 × 3.25 in). The inner active slot has dimensions of (3.62 × 1.8 × 0.09 in). The FO membrane was reshaped so it can fit into the membrane cell and placed between the FS and DS. The circulation of solutions throughout the FO system was completed using a pair of gear pumps (Cole-Parmer-30 VAC, 0.07 hp). The crossflow velocity of both the feed and draw solutions were determined using two vertical mount flow meters produced by (Sterlitech Corporation) (Auburn, Washington, USA). The water flux was estimated by monitoring the weight of the DS using Metler Toledo balance (ICS241) produced by (Mettler Toledo) (Columbus, Ohio, United States). TFC FO membrane, (FTSH2O (USA)) produced by (Porifera) (San Leandro, California, United States) was used in this study. The duration of each run was 60 min. A new membrane was used for each experiment. The membrane was soaked in distilled water for 30 min for conditioning purposes.
2.4. Box-Behnken Design
There are two main design types of the response surface methodology: Central Composite design and Box-Behnken design. Central Composite design is useful in sequential experiments because it can be built on previous factorial experiments [24]. The main advantages of the Box-Behnken design compared to the Central Composite design are reduction in the required experimental runs, high efficiency of estimating the first order and the second order coefficients, and the absence of axial points to make sure that all the required experimental points are safe and within the lower/upper range of the experimental factors. Box-Behnken is a three-factorial design performed using three or more selected points. In this design method, the three factors graph can be represented using two different forms: (a) one point in the center of a cube and middle points on each edge of all 6 square faces and (b) three interlocking 22 design with a center point as shown in Figure 2.
The three synthesis factors studied for the optimization of iron oxide nanoparticles were volume of ammonia solution, reaction time, and reaction temperature. These factors can be distributed on three levels such as +1 (maximum-level), 0 (middle-level), −1 (minimum-level) as illustrated in Table 1.
The required number of experiments can be estimated using N = 2k (k − 1) + C, where k is the number of parameters and C is the number of middle points. Box-Behnken design was implemented in this study using an Experiment Design module that can be found in the Minitab statistical analysis software to optimize the aforementioned parameters by Equation (1).
where Y is the predicted value, βi is the linear term coefficient, βii is the square term coefficient, βij is the interaction term coefficient, X is the independent variable, and ε is the random error.
3. Results
3.1. ANOVA Analysis and Adequacy of the Regression Model
The effect of the three main synthesis factors namely, reaction temperature, reaction time, and volume of ammonia solution was investigated to produce high water flux in the FO process. The prediction model built based on the Box-Behnken method is presented using a second order polynomial equation as shown in Equation (2).
where X1 is the volume of ammonia solution (ml), X2 is the reaction time (h), X3 is the reaction temperature (°C), and Y is the water flux (LMH). Table 2 shows a comparison between the predicted values obtained using the polynomial and the actual values obtained from the experiment.
It can be noticed that the predicted values are close to the actual values. ANOVA statistical analysis was completed to check the significance and fitness of the prediction model. It can be noticed from Table 3 that the overall p-value is less than the level of significance (p = 0.05).
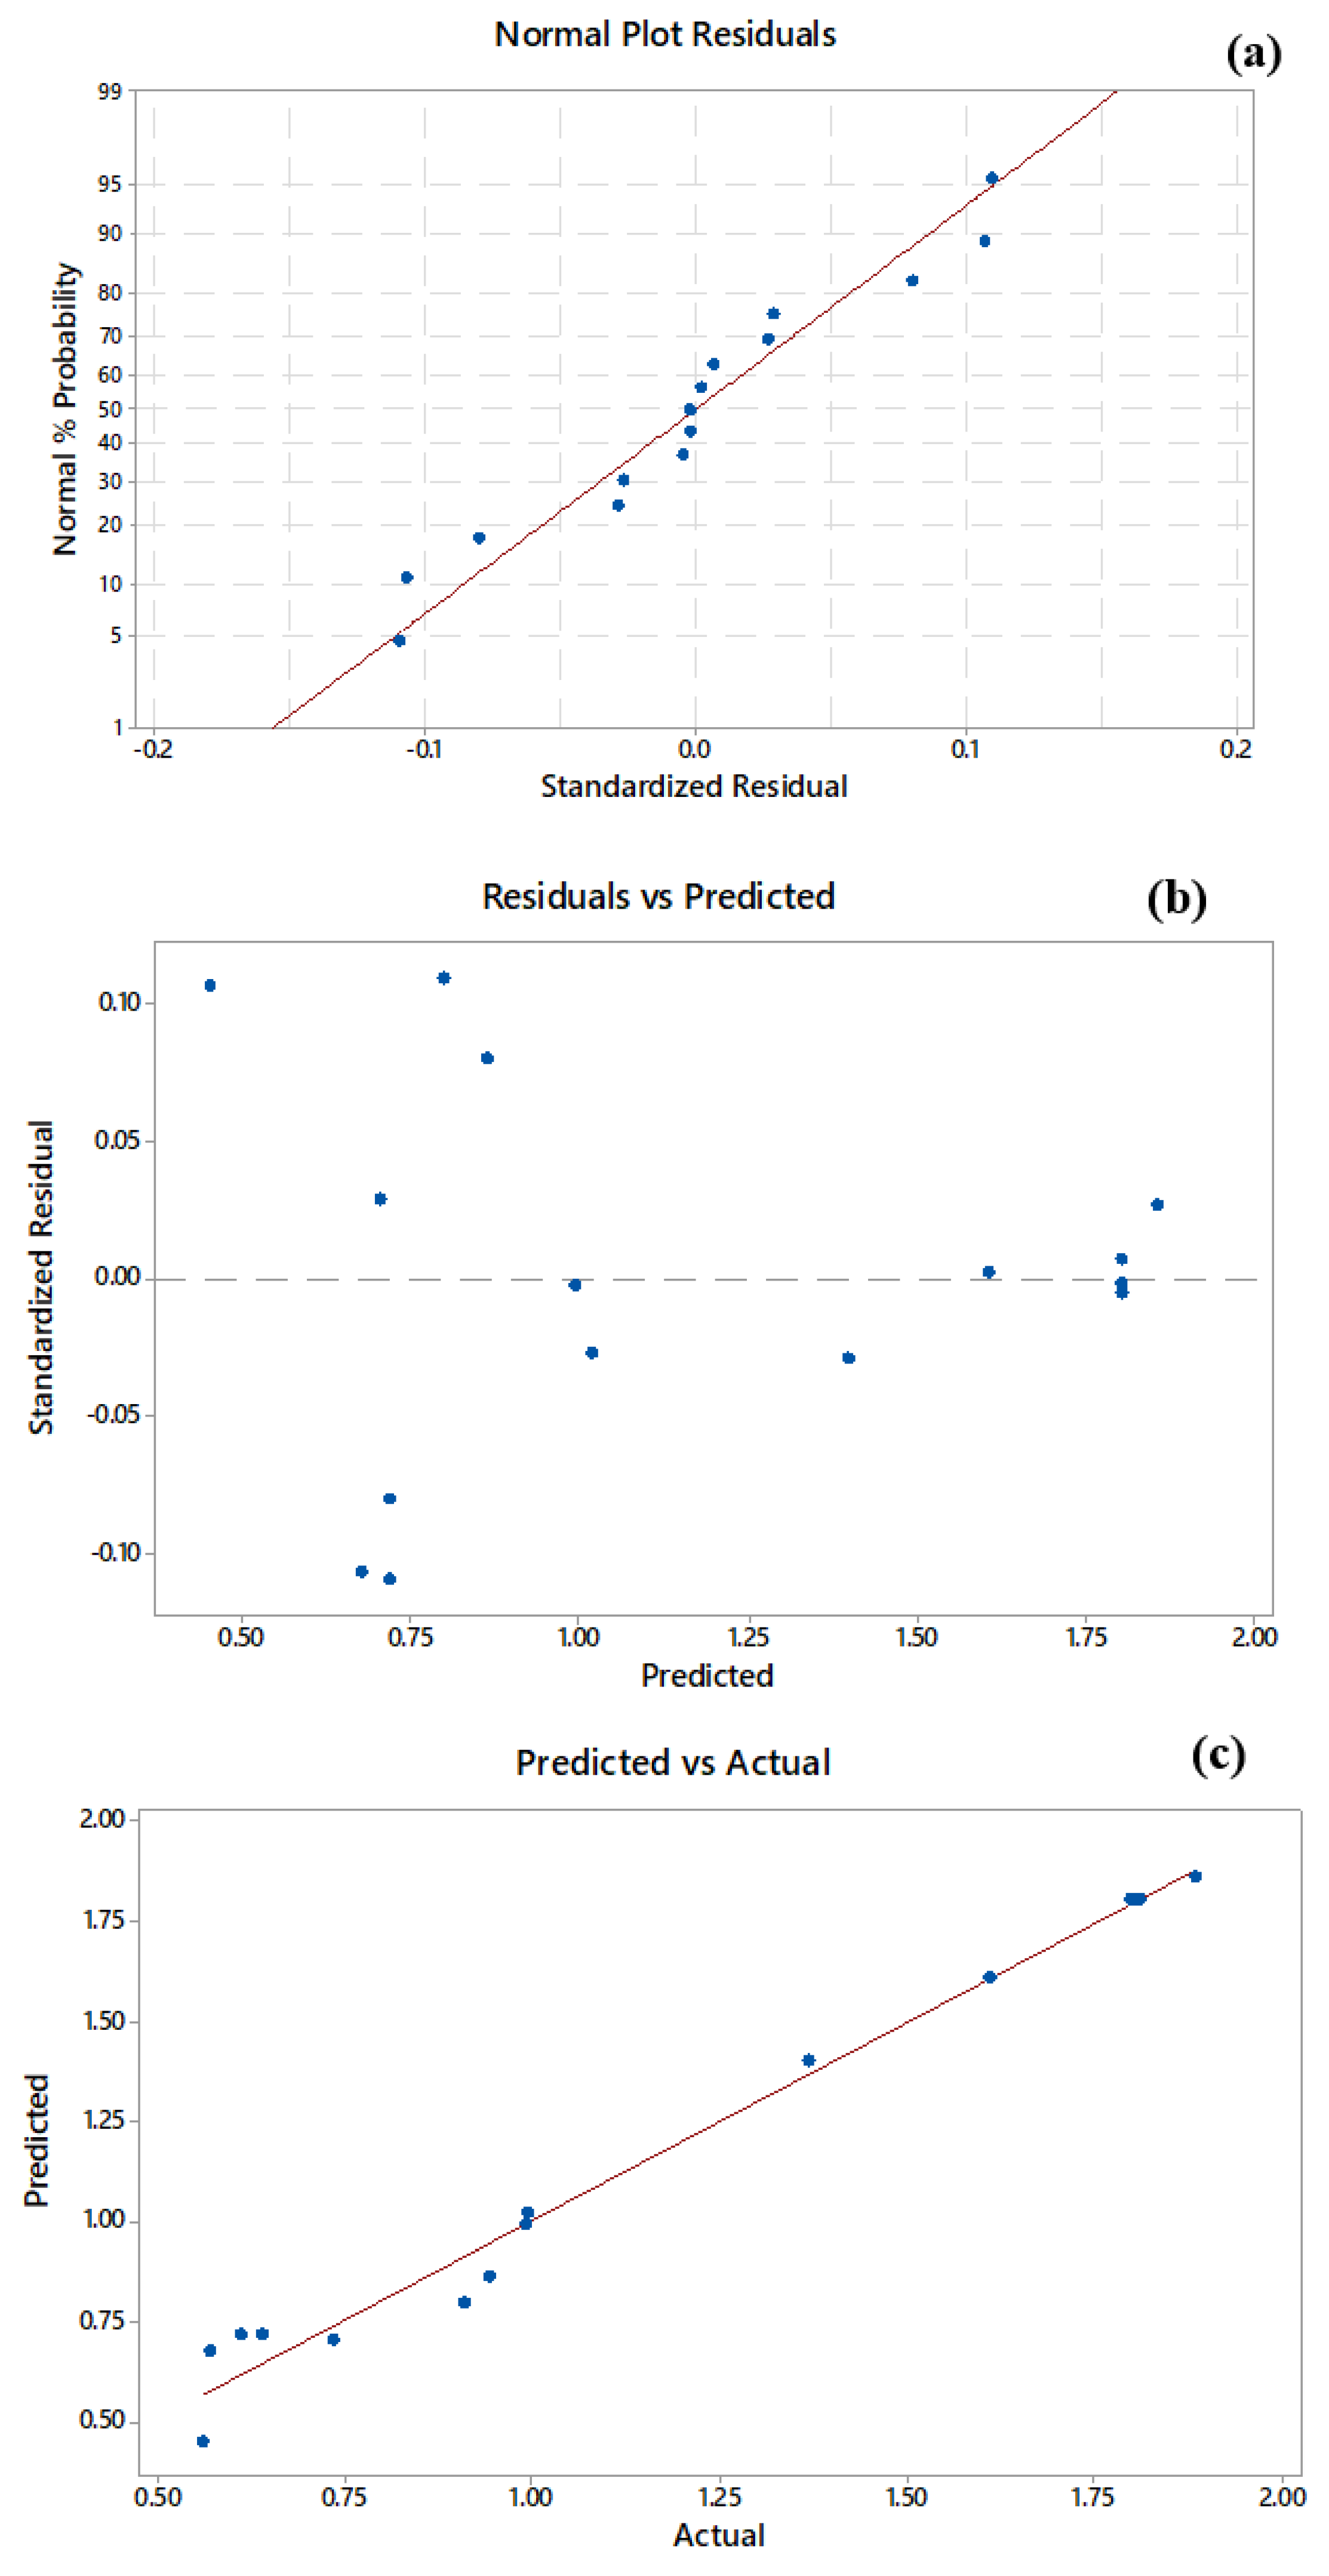
Hence, we reject the null hypothesis (Ho: no relationship between the dependent and independent variables). The independent variables (reaction time, reaction temperature, and volume of ammonia) significantly affect the dependent variable (water flux). The p-values for the linear terms are less than the significance level, hence, the linear terms affect the water flux. In addition, the p-values for the square terms are less than the significance level, hence, the square terms significantly affect the water flux. By checking the 2-way interaction, it can be observed that the interaction between the independent variables is insignificant. The model has no significant lack-of-fit, where the p-value is higher than the level of significance. Non-significant lack of fit means that the model is suitable for predicting the responses. As an indication for the practical significance, the R2 coefficient was found to be 98.82% and the adjusted R2 coefficient was 96.69%. This indicates that the independent variables explain the variation of the dependent variable very well. The normal probability was plotted against studentized residuals (estimated from standard deviation) to check the normality of results as shown in Figure 3a.
The studentized residuals follow a straight line which indicates normal distributions for the residuals. The standardized residuals were plotted against the predicted values as shown in Figure 3b. The pattern of this plot was a random scatter rather than a funnel shaped or U-shaped pattern, which indicated that the model fits the data. The predicted values were plotted against the experimental values as shown in Figure 3c. The predicted and experimental points are in a good agreement since most of the points are arranged closely to the diagonal line.
3.2. Effect of Iron Oxide Nanoparticles Synthesis Conditions on the Water Flux
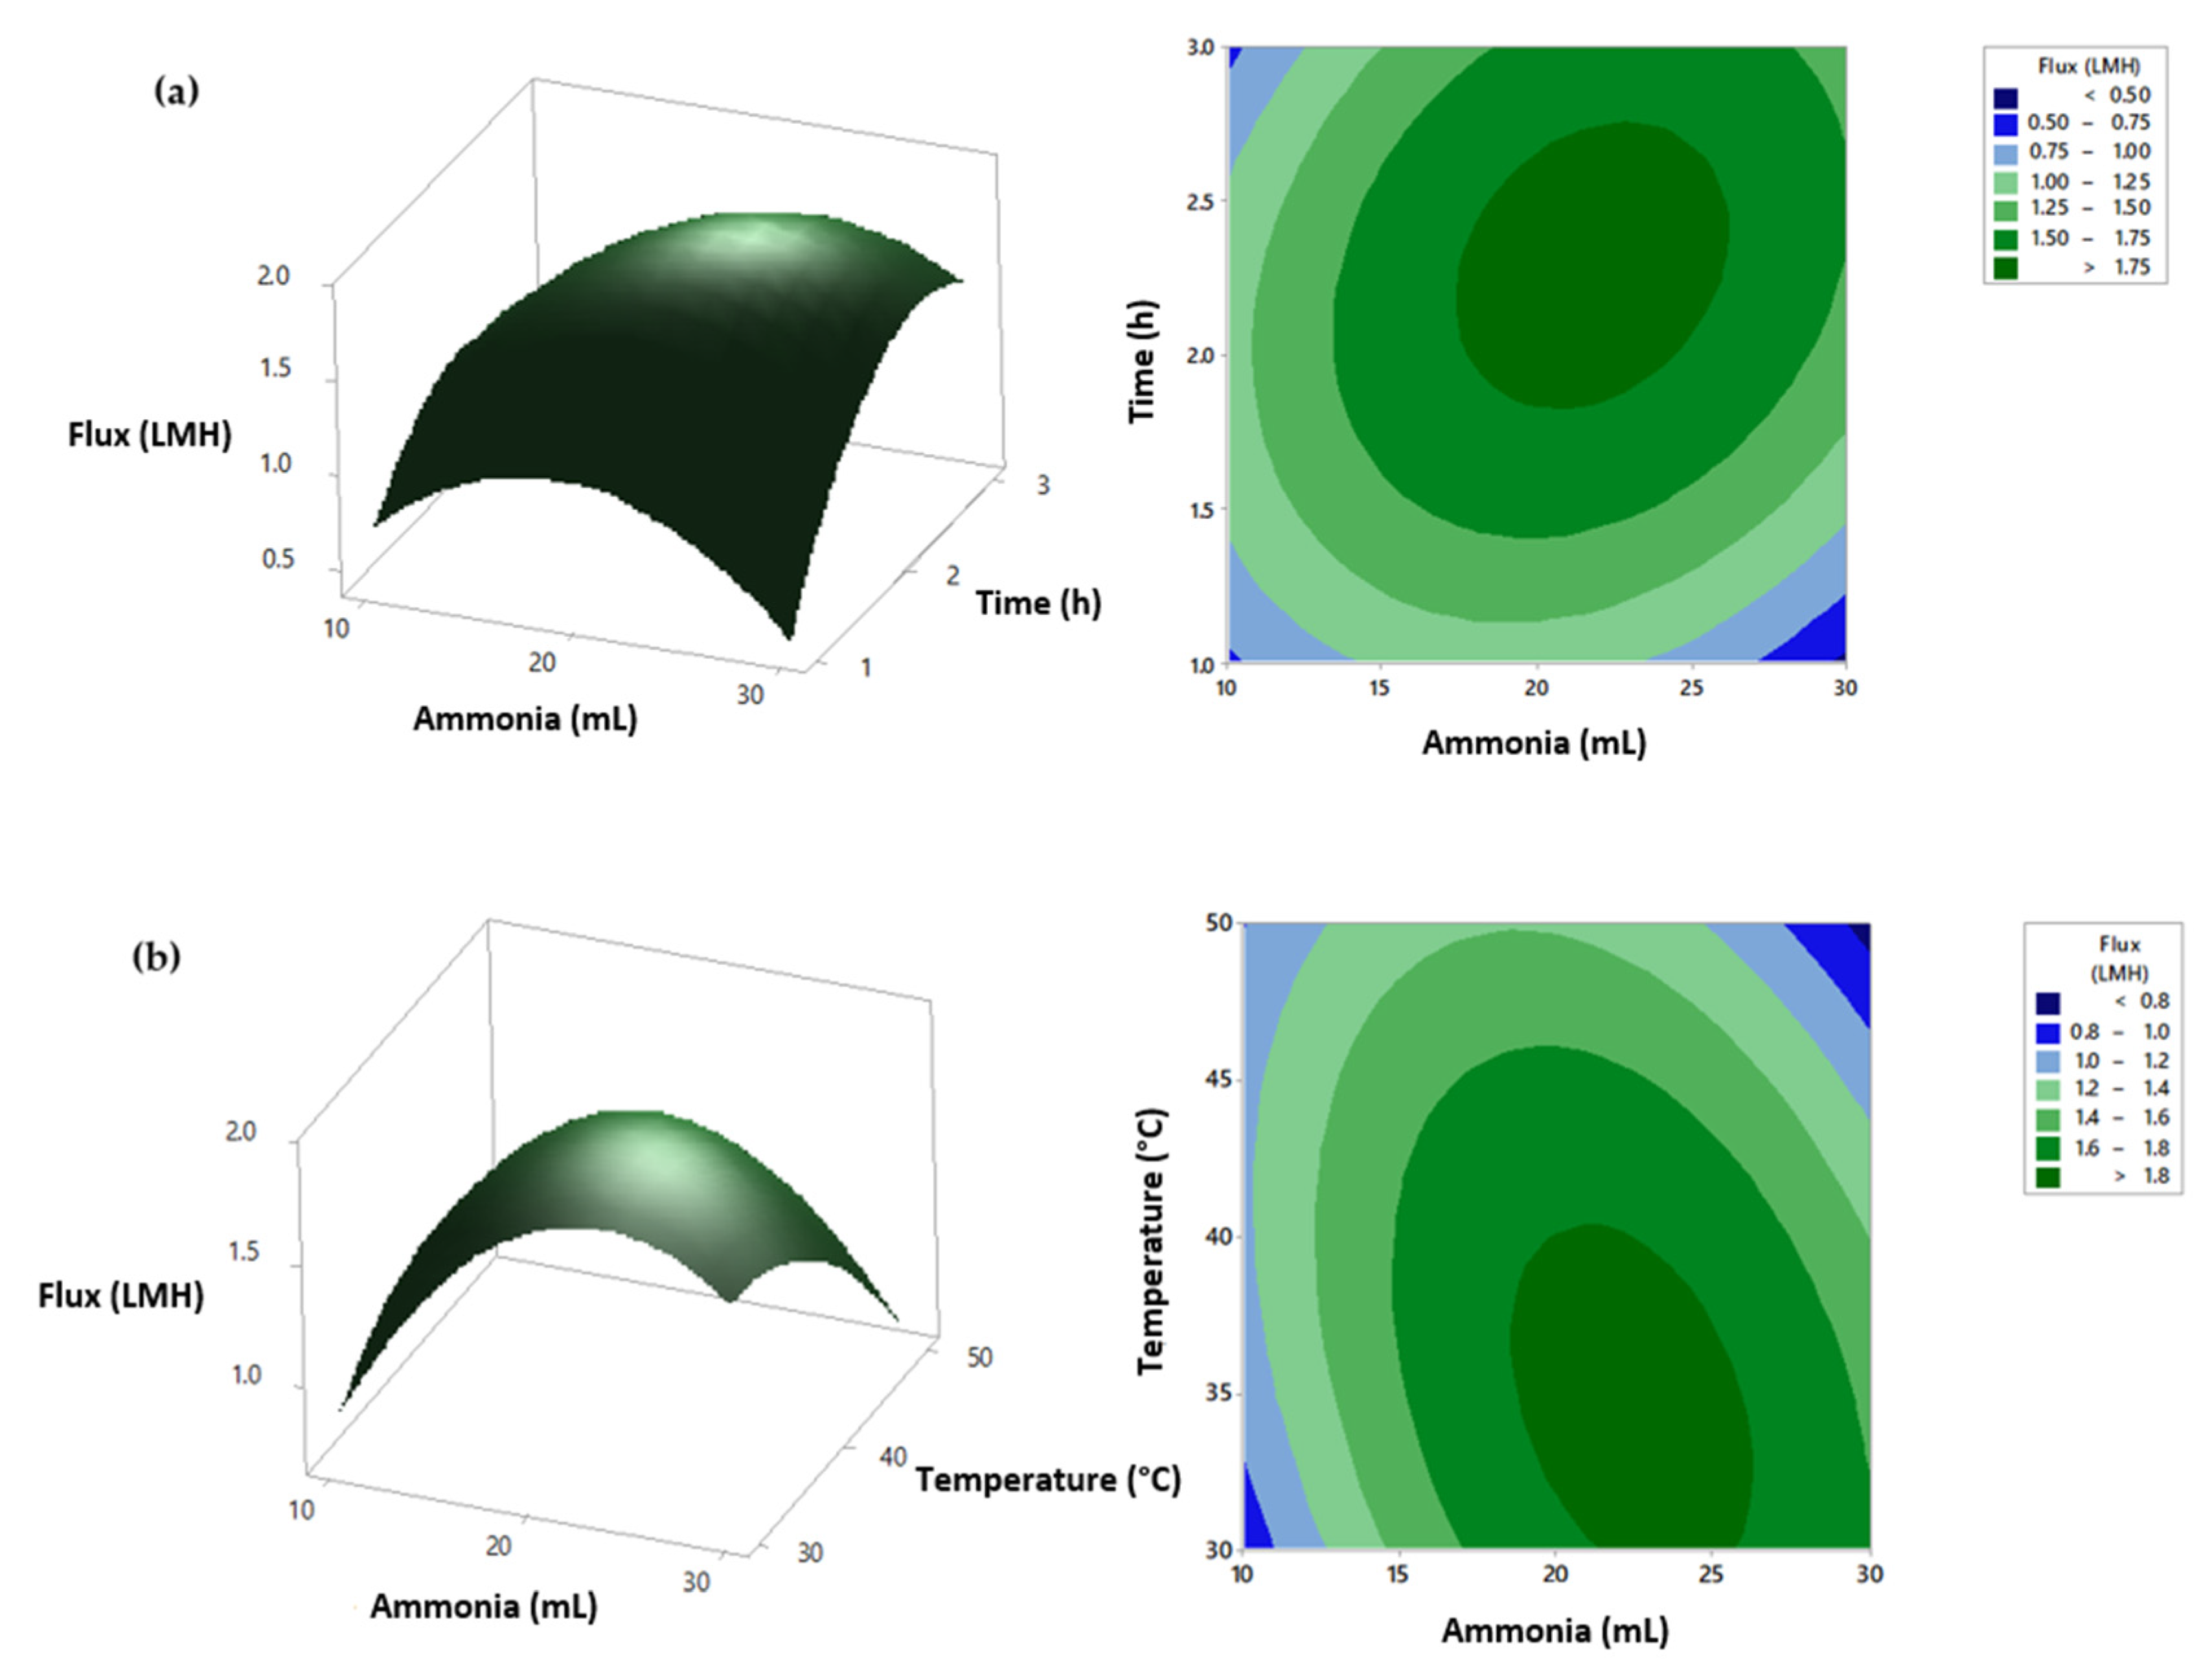
The effect of reaction time, reaction temperature, and volume of ammonia on the water flux of the MNPs draw solution was studied using 2D contour graphs and 3D response surface generated based on the second order polynomial. As shown in Figure 4a, the water flux increases with increasing reaction time and volume of ammonia solution.
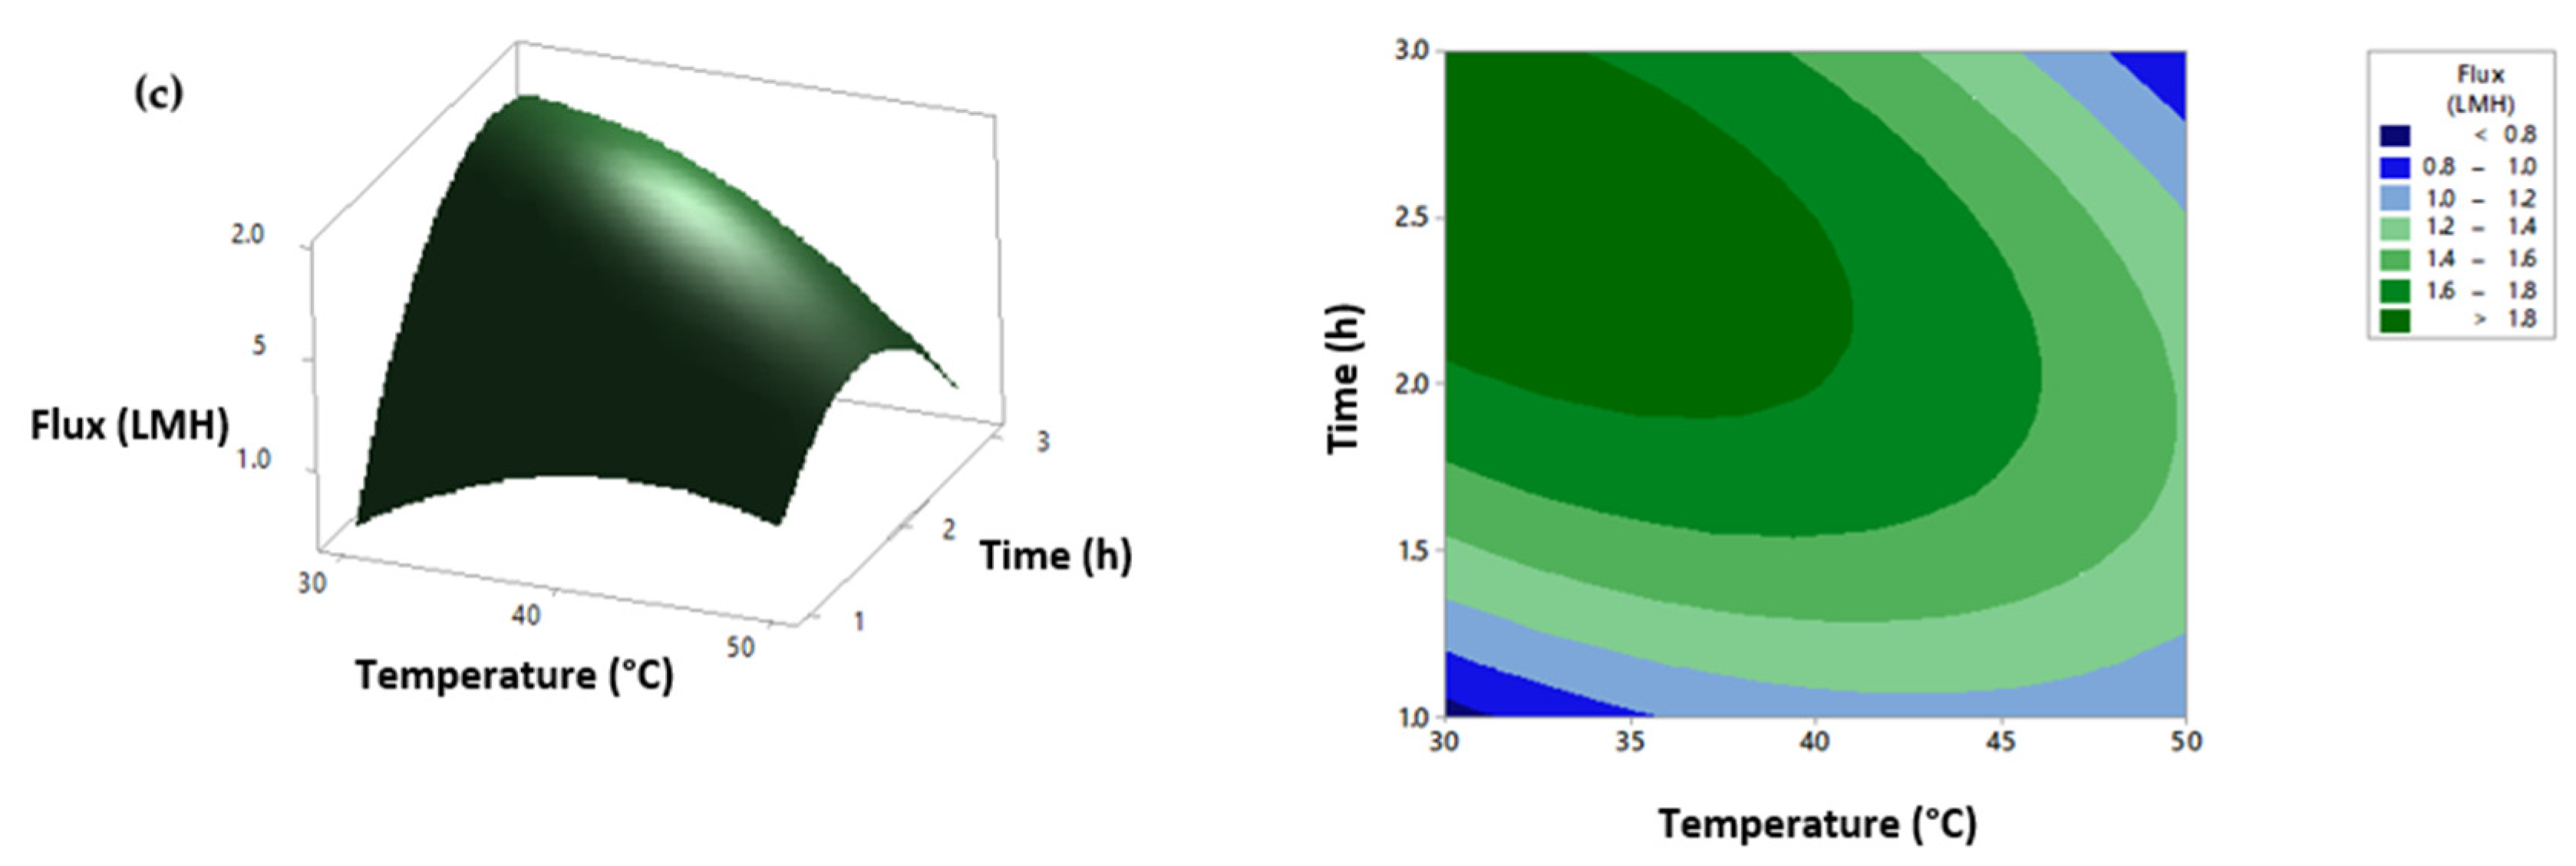
However, the water flux decreases after adding excess amount of ammonia solution. The maximum water flux was almost 1.8 LMH obtained using a reaction time of 3 h and 25 mL of ammonia solution. As shown in Figure 4b, the water flux increased as the reaction temperature decreased. The maximum water flux was obtained at a reaction temperature of 30 °C and an ammonia solution of almost 25 mL. As shown in Figure 4c, the water flux increased as the reaction temperature decreased and reaction time increased. The maximum water flux was almost 1.8 LMH at a reaction temperature of 30 °C and reaction time of 3.
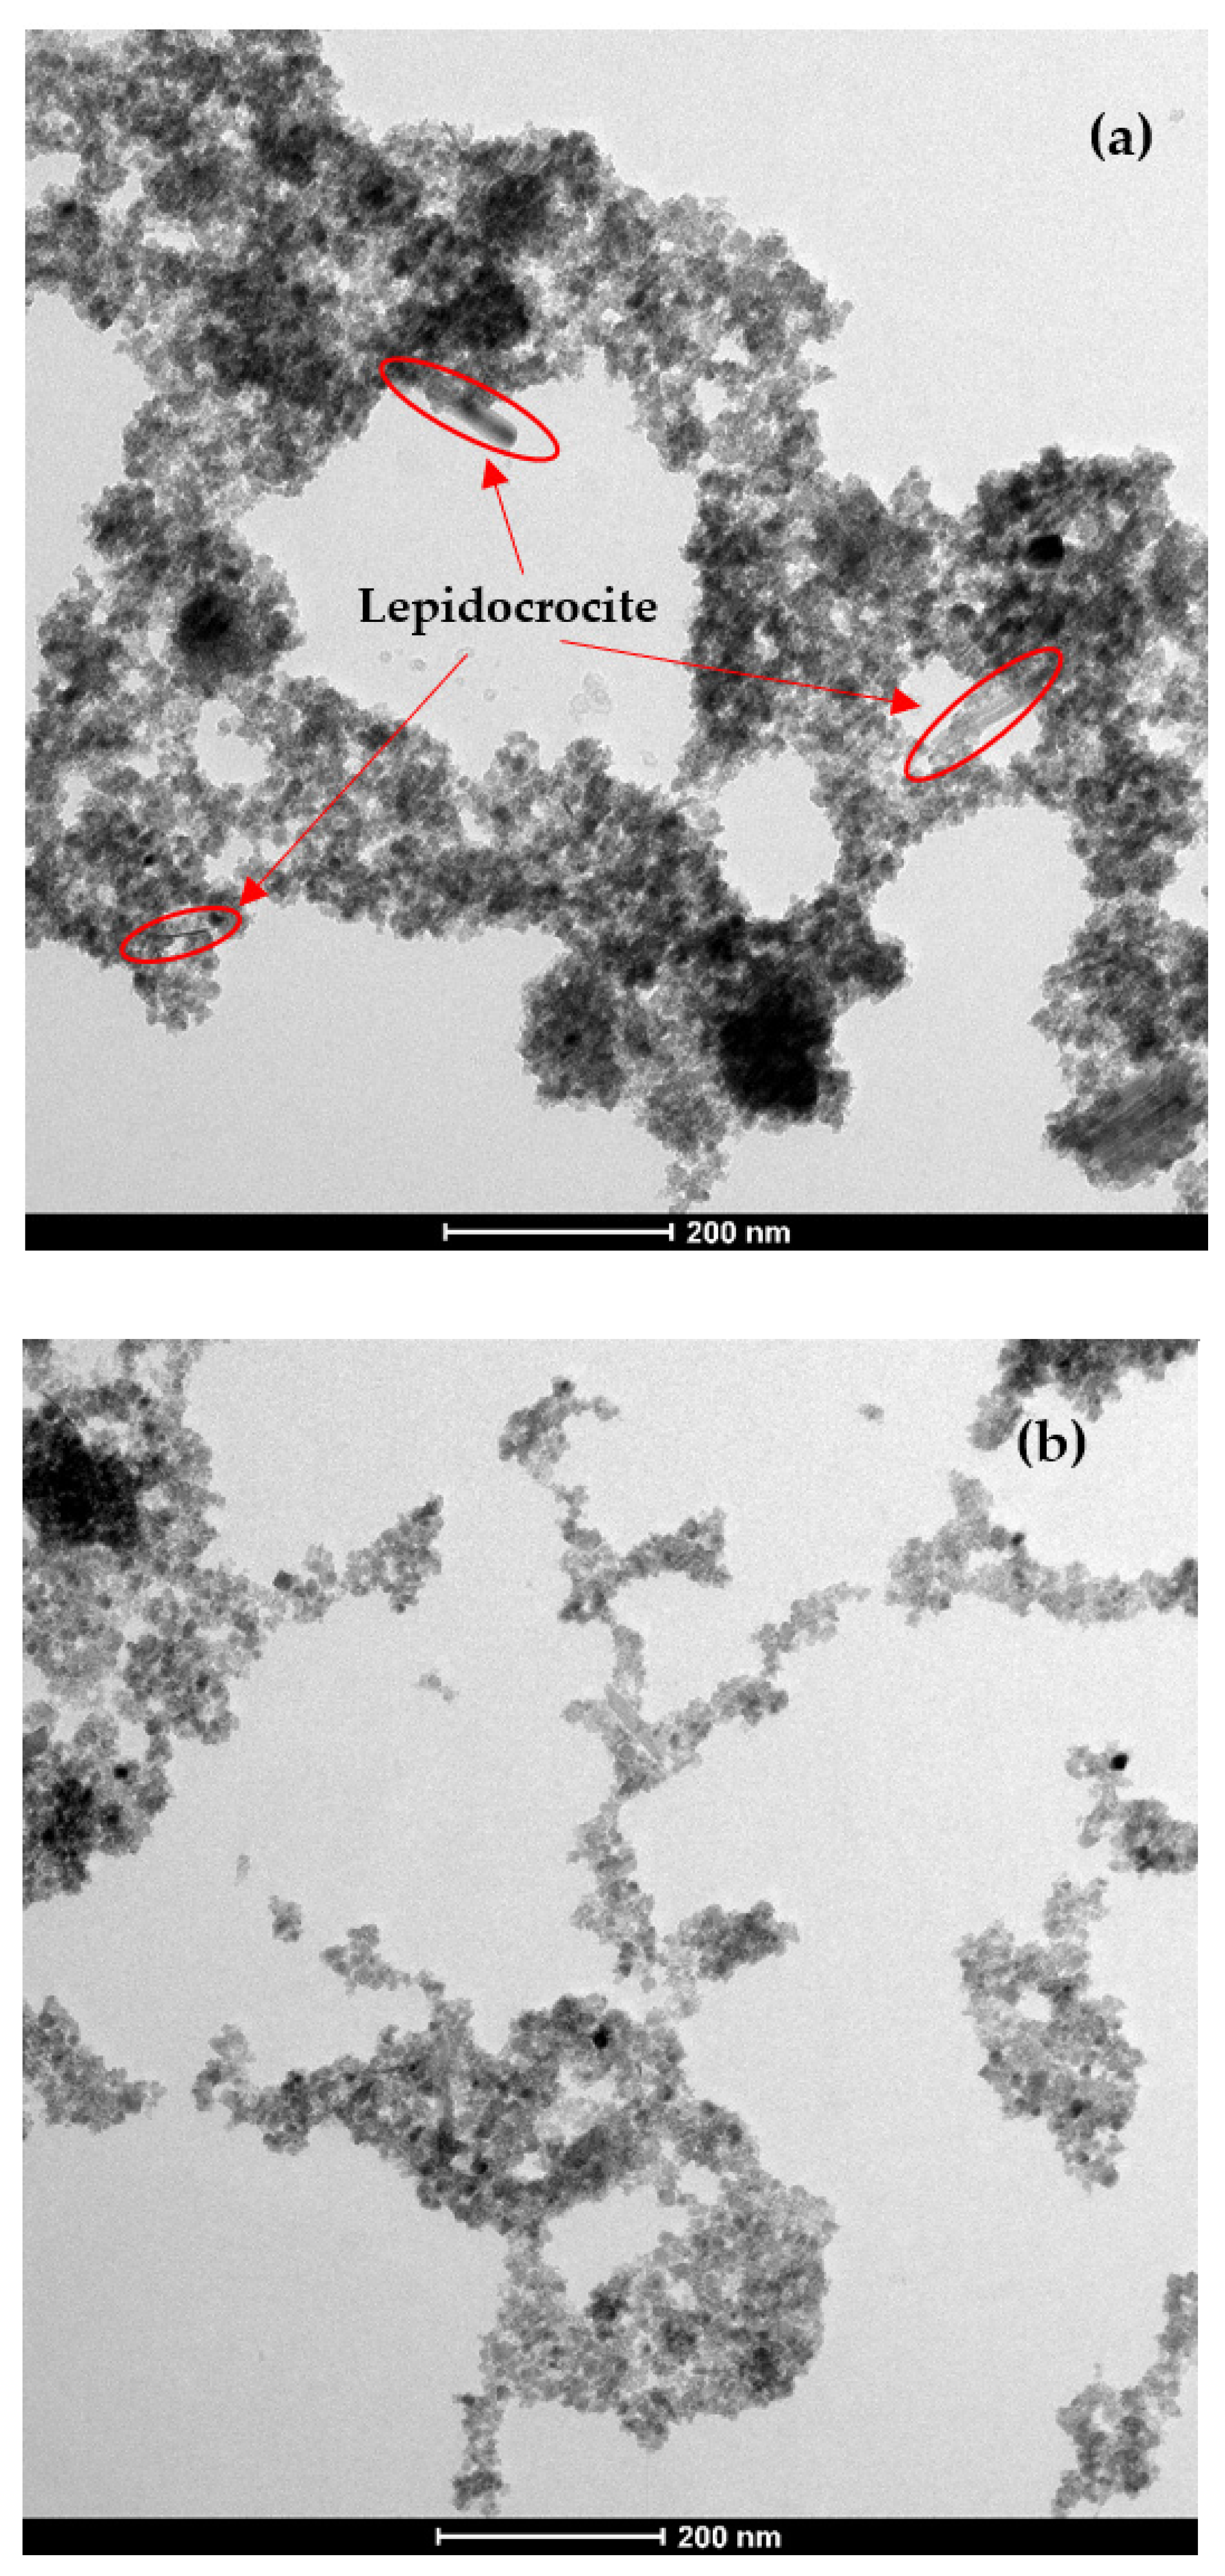
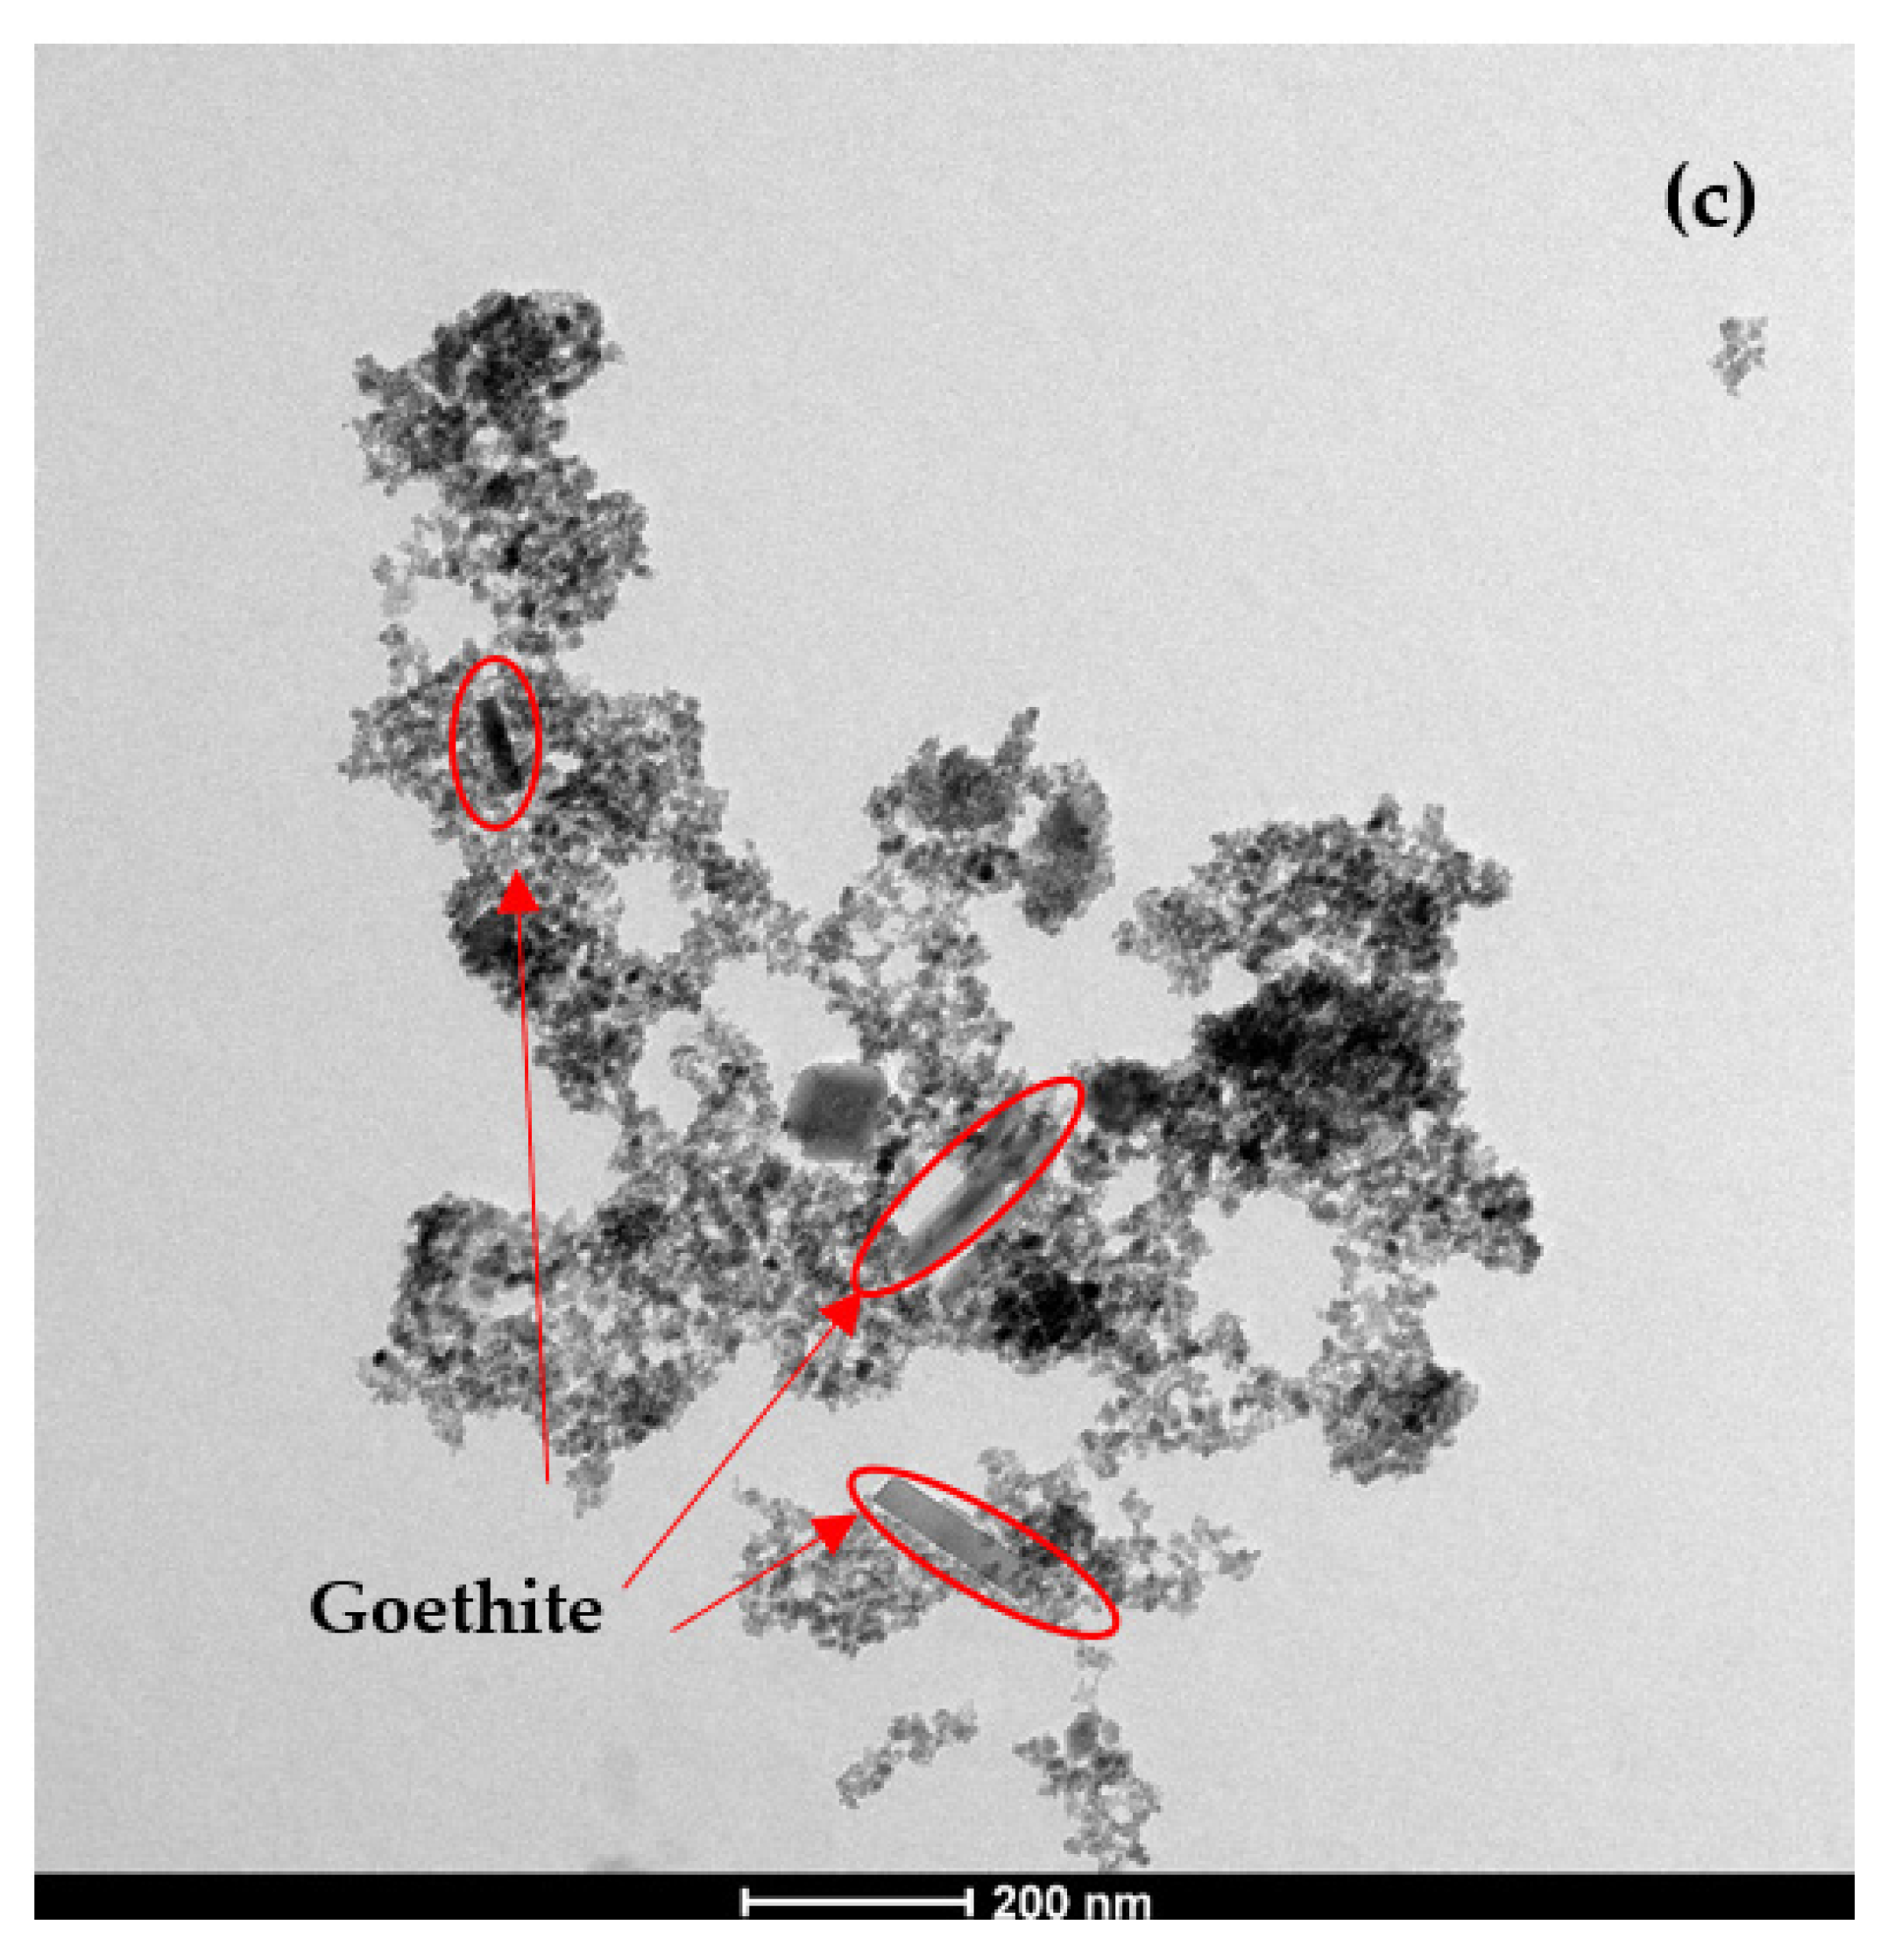
The water flux increased as the volume of ammonia solution increased due to the increase in the reaction pH. At high pH, the co-precipitation process begins in the supercritical phase which will produce more seeds and lead to smaller crystals [25]. Smaller MNPs are expected to produce higher water flux compared to larger particles due to higher surface area to volume ratio [26]. At low pH, the seeding process will be slow and the growth of crystals will stop when the pH of the reaction decreases below the required condition for the co-precipitation process [26,27]. The volume of ammonia can also affect the formation process of the different forms of MNPs. The formation of magnetite nanoparticles begins when the pH of the reaction is above 8 and by-products are formed when the reaction pH drops below 8. At the end of the reaction, the pH value drops below 8 if insufficient ammonia solution was provided. Therefore, the reaction pathway of magnetite shifts to the formation of lepidocrocite [28]. On the other hand, excessive amount of ammonia could result in the formation of goethite which is another form of iron oxide nanoparticle [29]. This is observed in the TEM images shown in Figure 5, where lepidocrocite was visible when using insufficient amount of ammonia and goethite was visible when using excessive amount of ammonia solution.
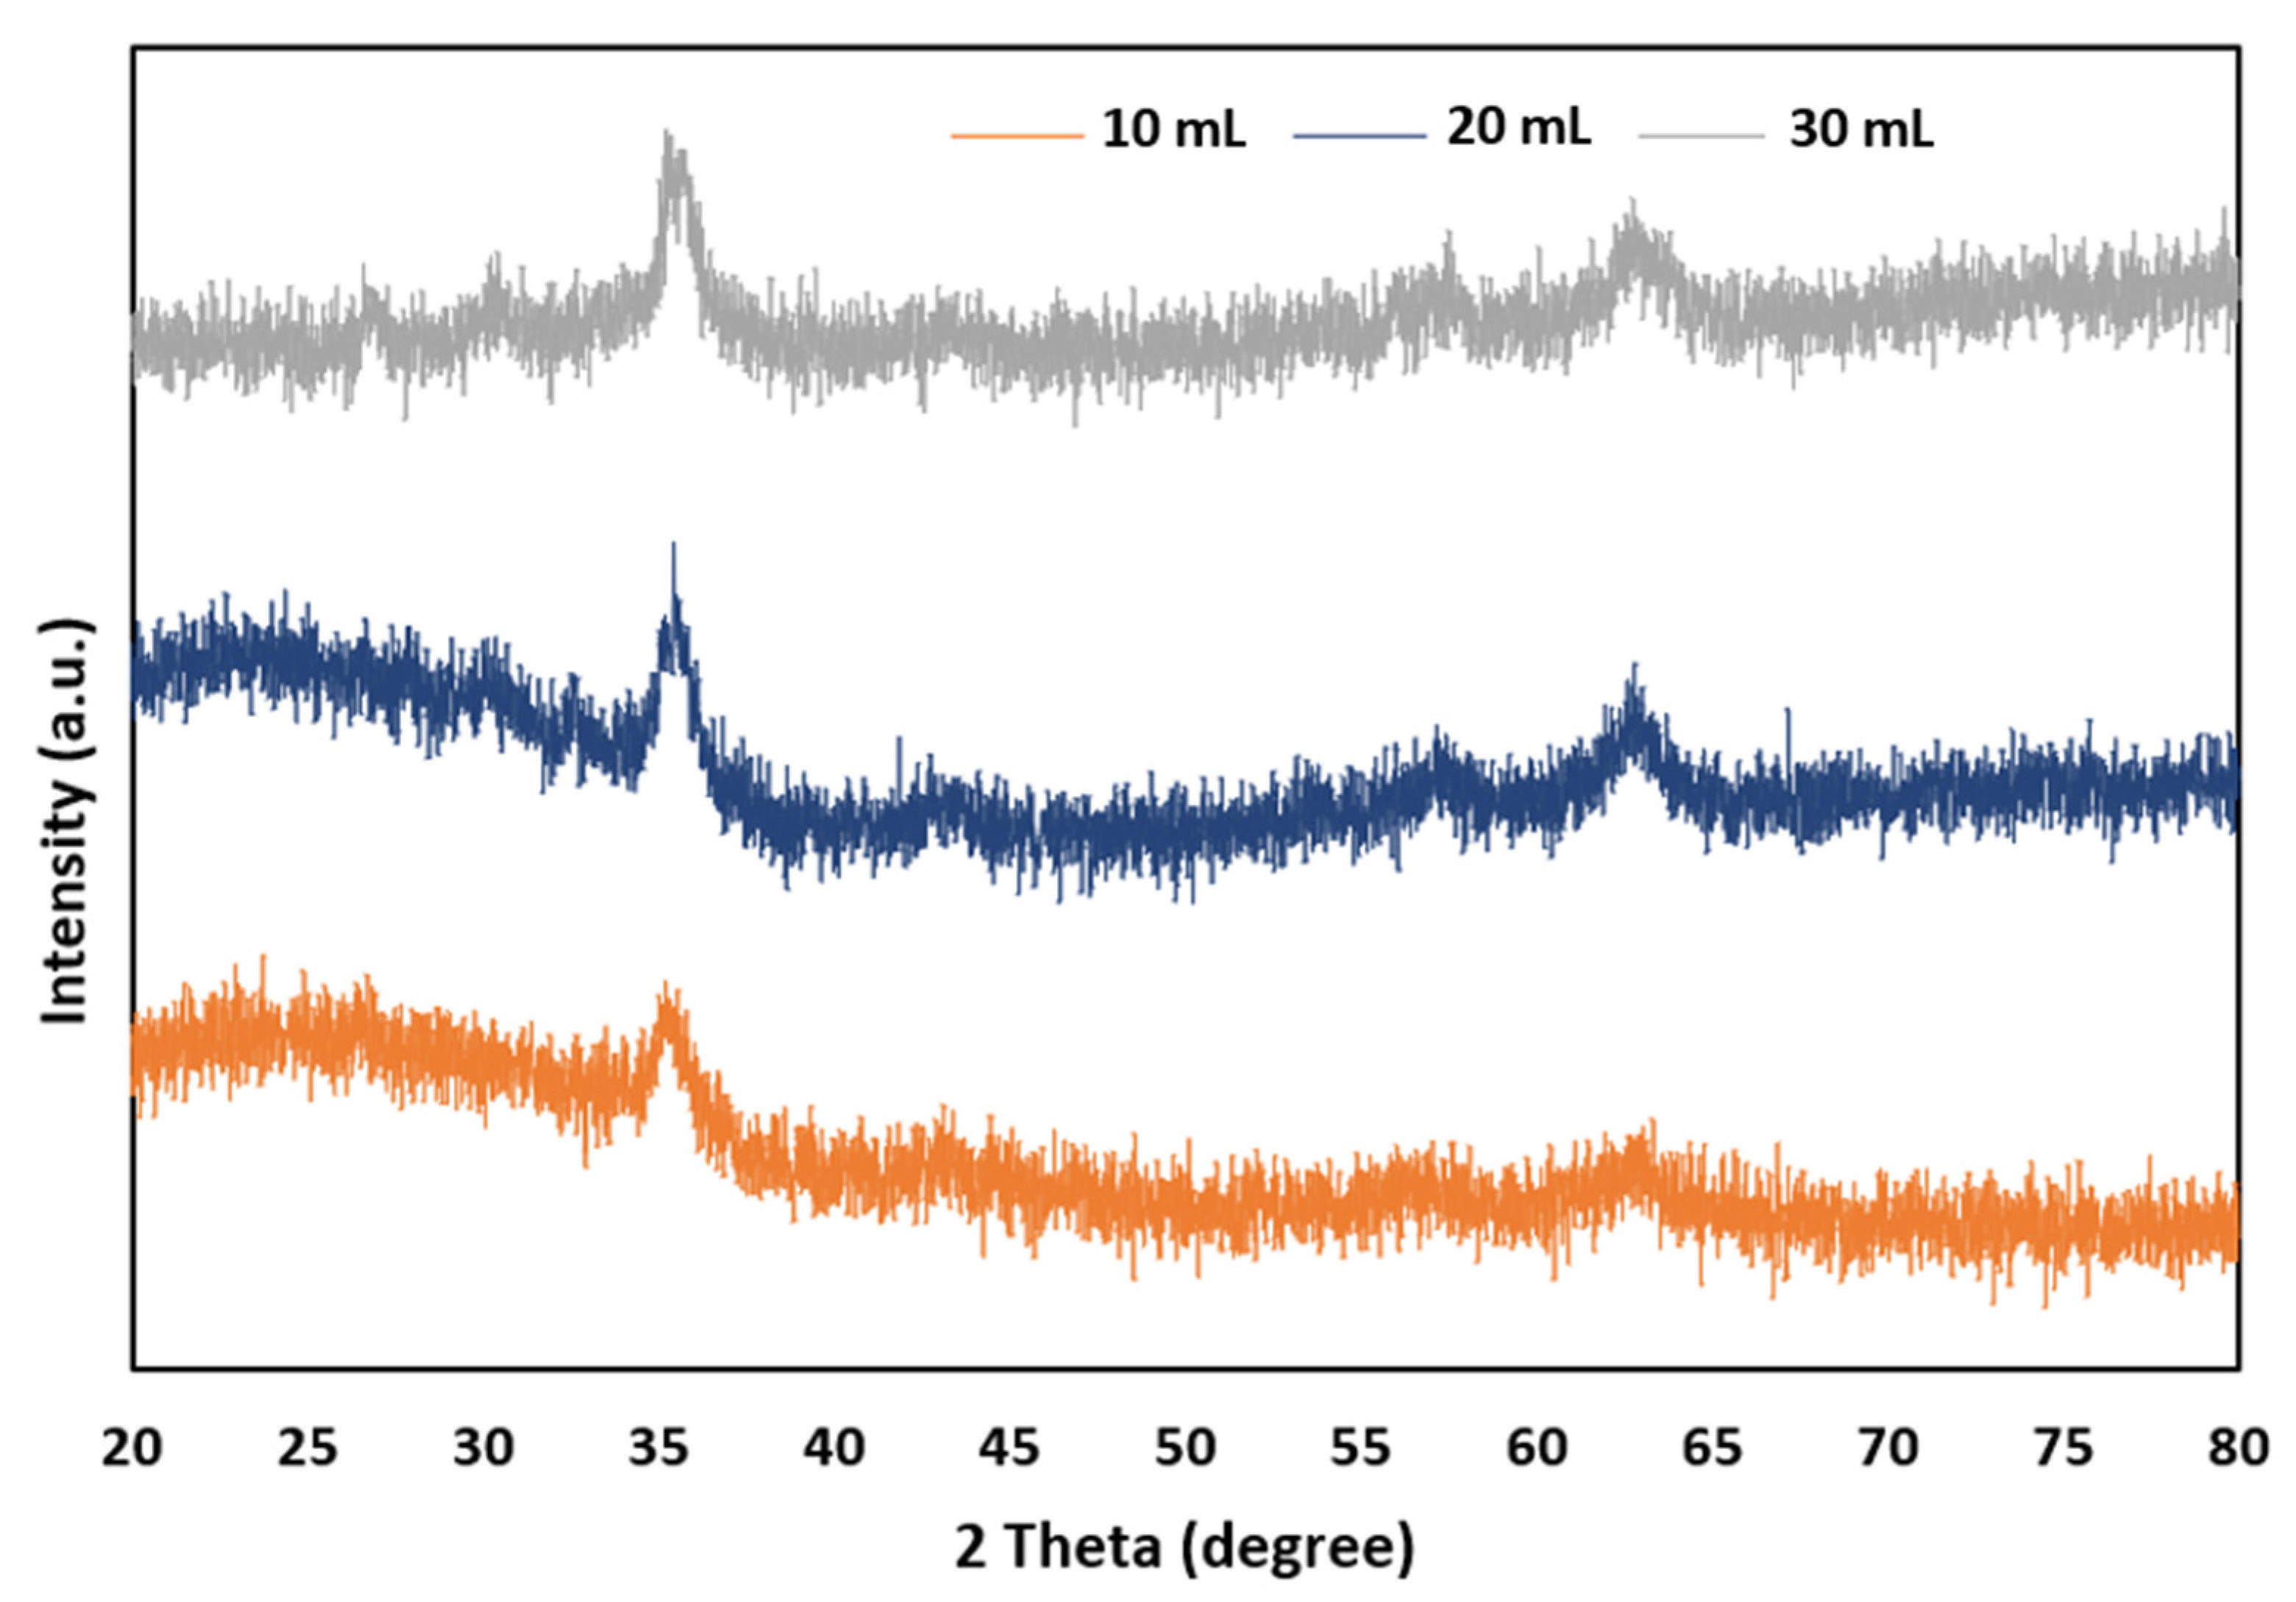
As observed from the TEM images, the average particles size is approximately between 10 nm and 20 nm. Figure 6 shows the XRD pattern for MNPs synthesized using different volume of ammonia solution.
The XRD peaks of the magnetite nanoparticles must be observed on 2θ of 35°, 58° and 63° [30]. At 2θ of 35°, the peaks observed was low when using an ammonia solution volume of 10 mL compared to 20 and 30 mL. In addition, no peak was observed at 2θ of 58° and 63° when using an ammonia volume of 10 mL. However, clear peaks were observed at the same 2θ when using ammonia volume of 20 and 30 mL indicating the presence of magnetite nanoparticles. The presence of the peaks at the aforementioned 2θ is also related to the formation of goethite and lepidocrocite nanoparticles.
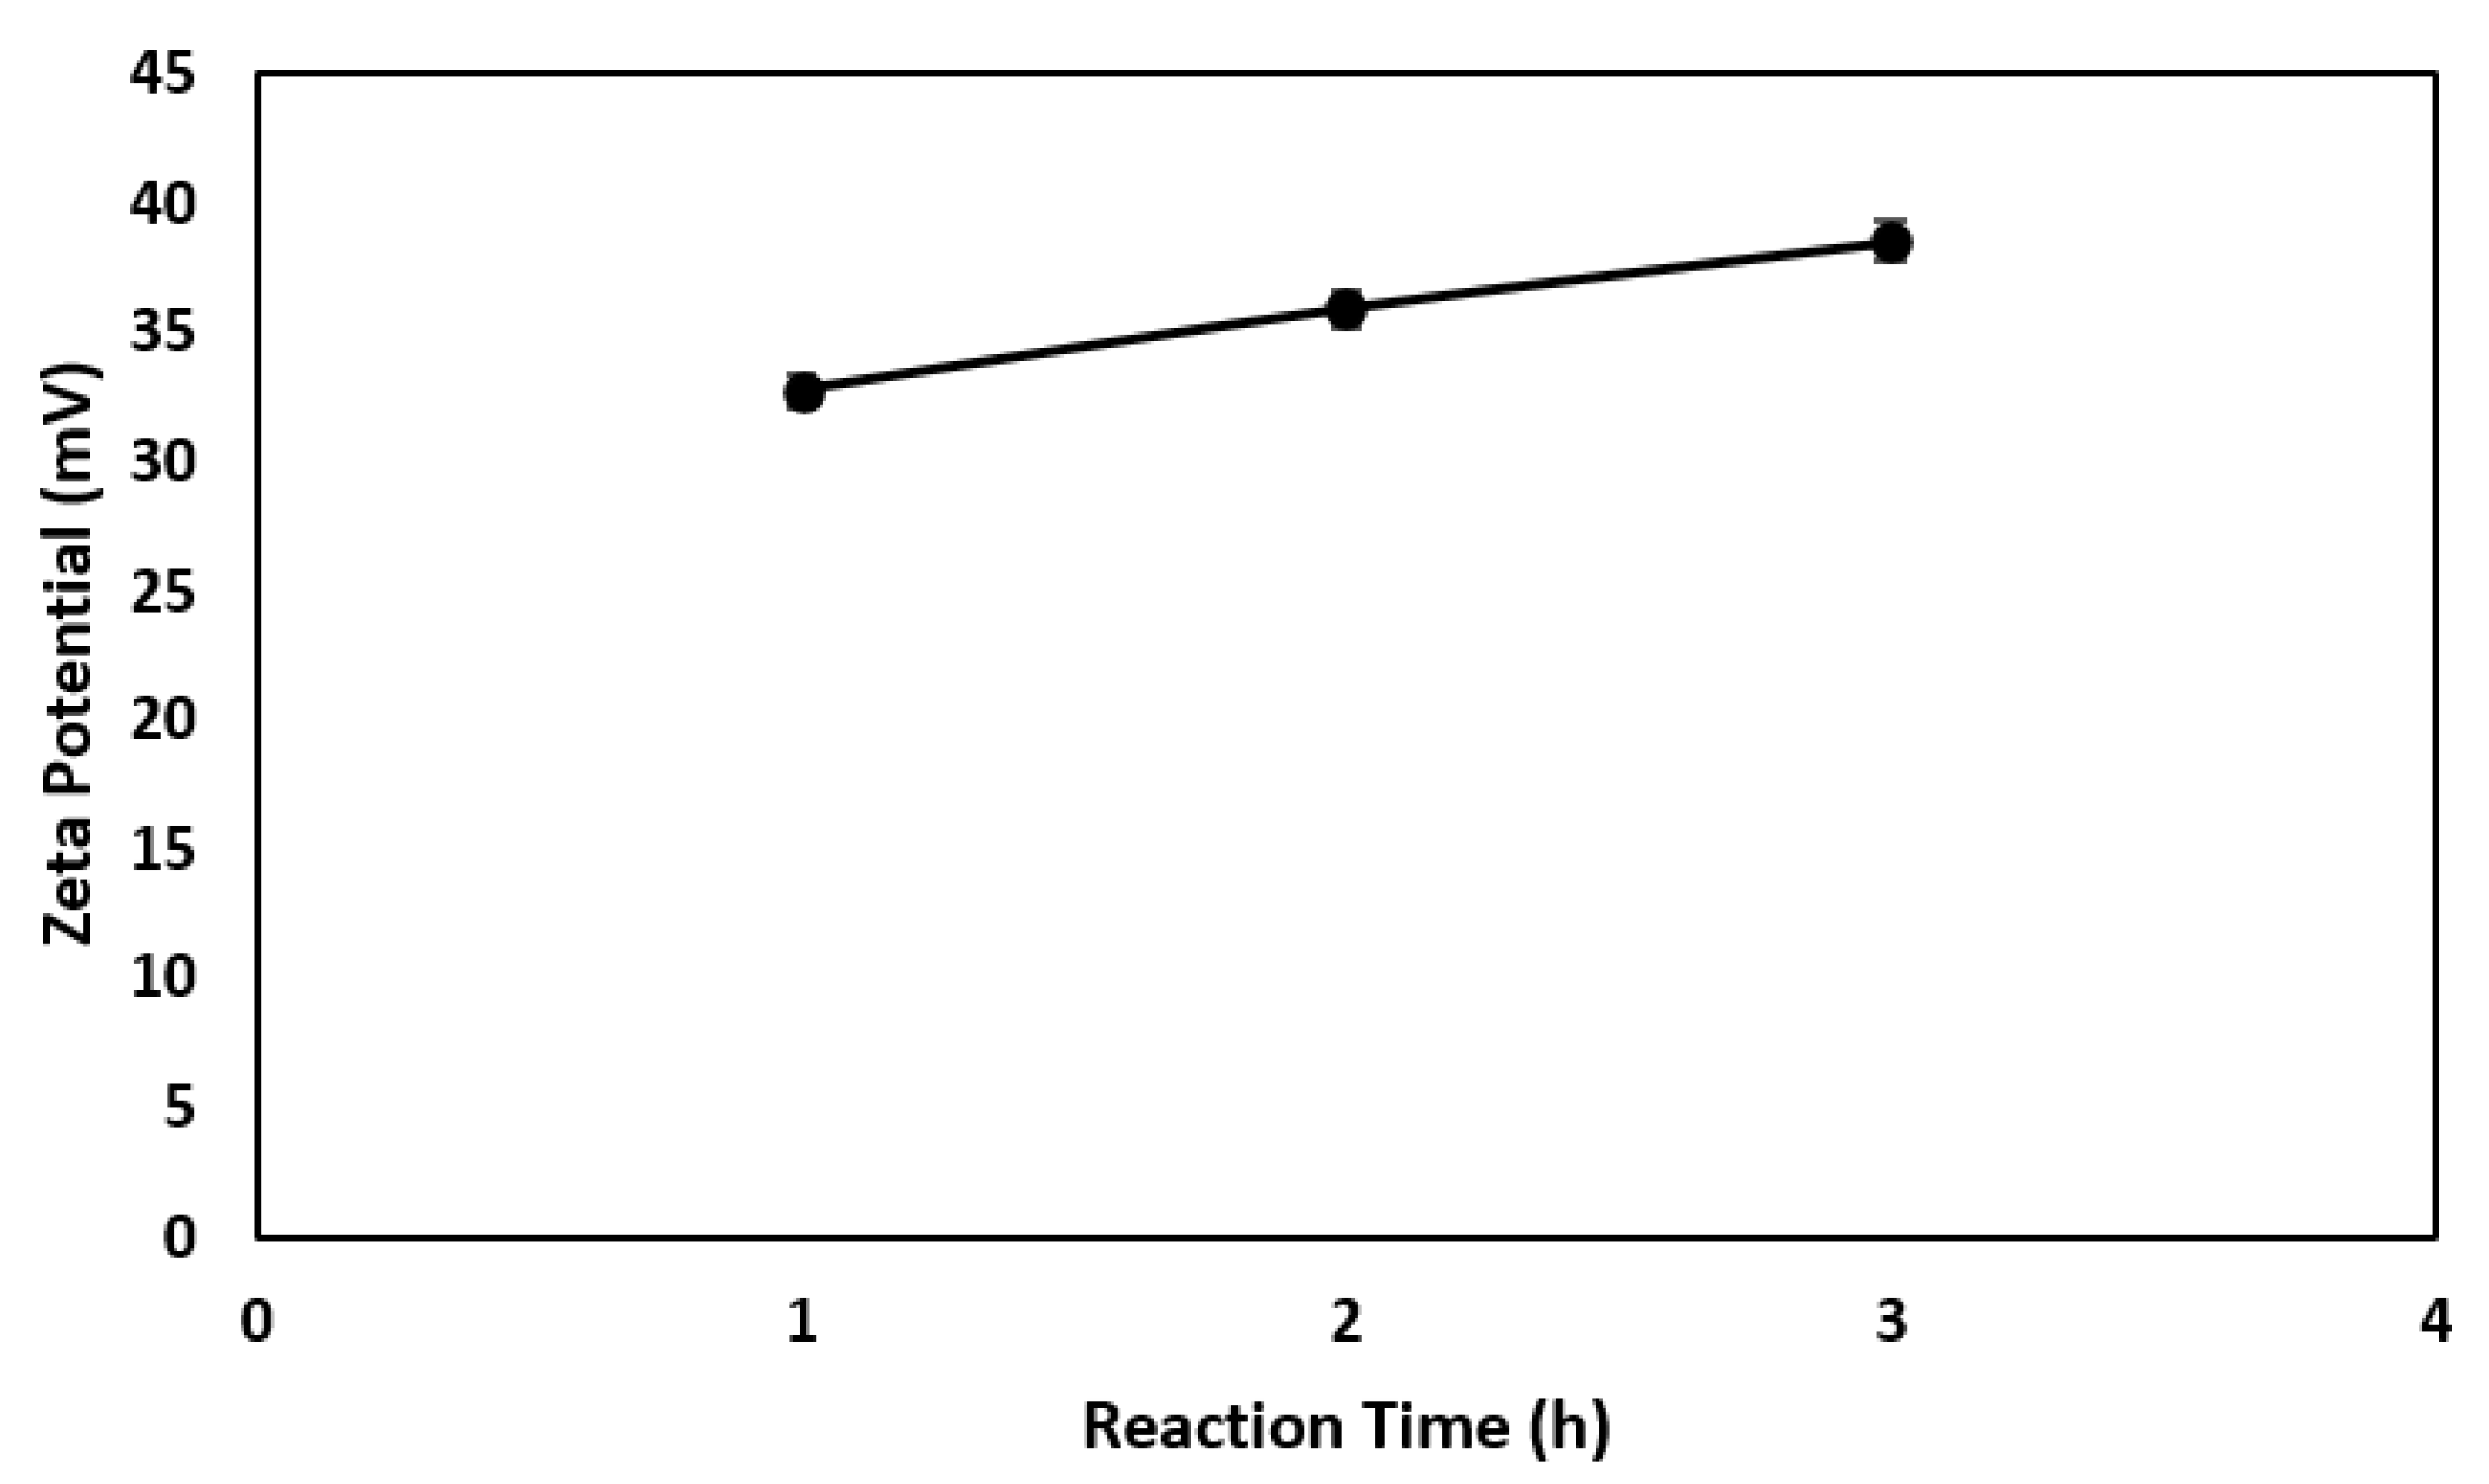
The water flux increased as the reaction time increased due to the increased surface charge [31]. As shown in Figure 7, the zeta potential of the synthesized iron oxide nanoparticles increased from 32.7 to 38.5 mV as the reaction time increased from 1 to 3 h.
Highly charged nanoparticles are expected to be more evenly distributed in the solution which generates higher osmotic pressure (i.e., higher water flux). Additionally, the reaction time affects the seeding process and growth of crystals. Adequate reaction time may produce higher content of magnetite in the synthesized iron oxide nanoparticles [27].
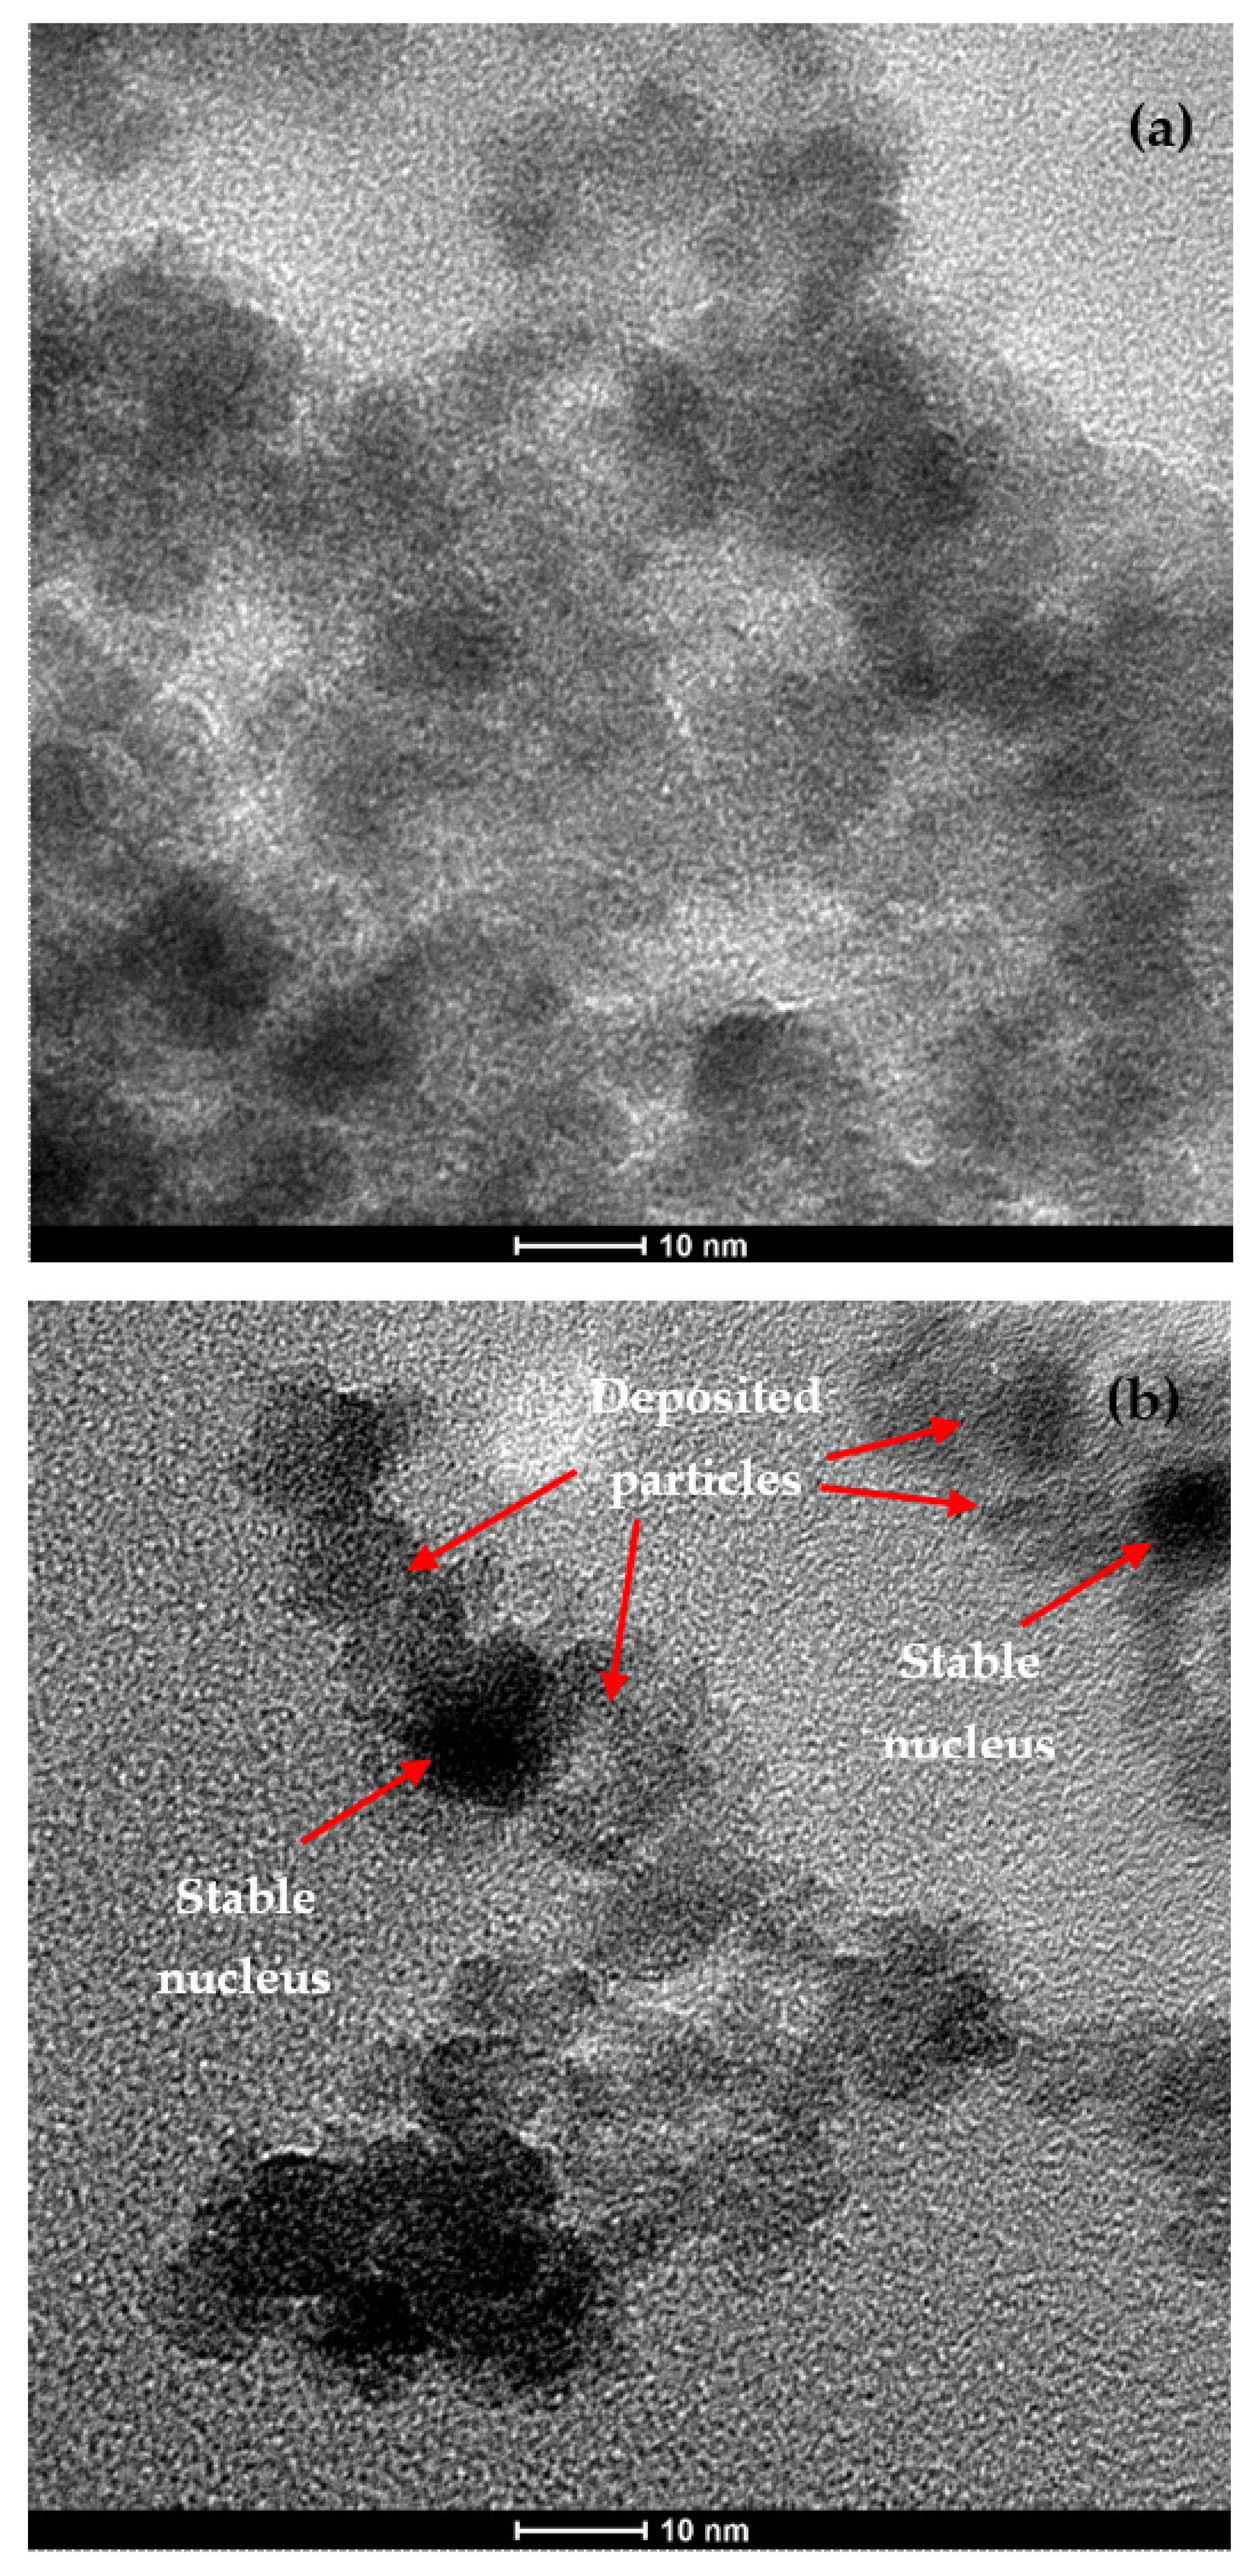
The water flux decreased as the temperature of the reaction increased due to the larger particle size. The particle size increases at high temperature due to Ostwald ripening phenomenon, where the normal particles growth mechanism is distorted and particles are redeposited on a stable nuclei [27]. Figure 8 shows that the particles are redeposited onto the stable nuclei when using a reaction temperature of 50 °C compared to a reaction temperature of 30 °C.
3.3. Optimization and Model Validation
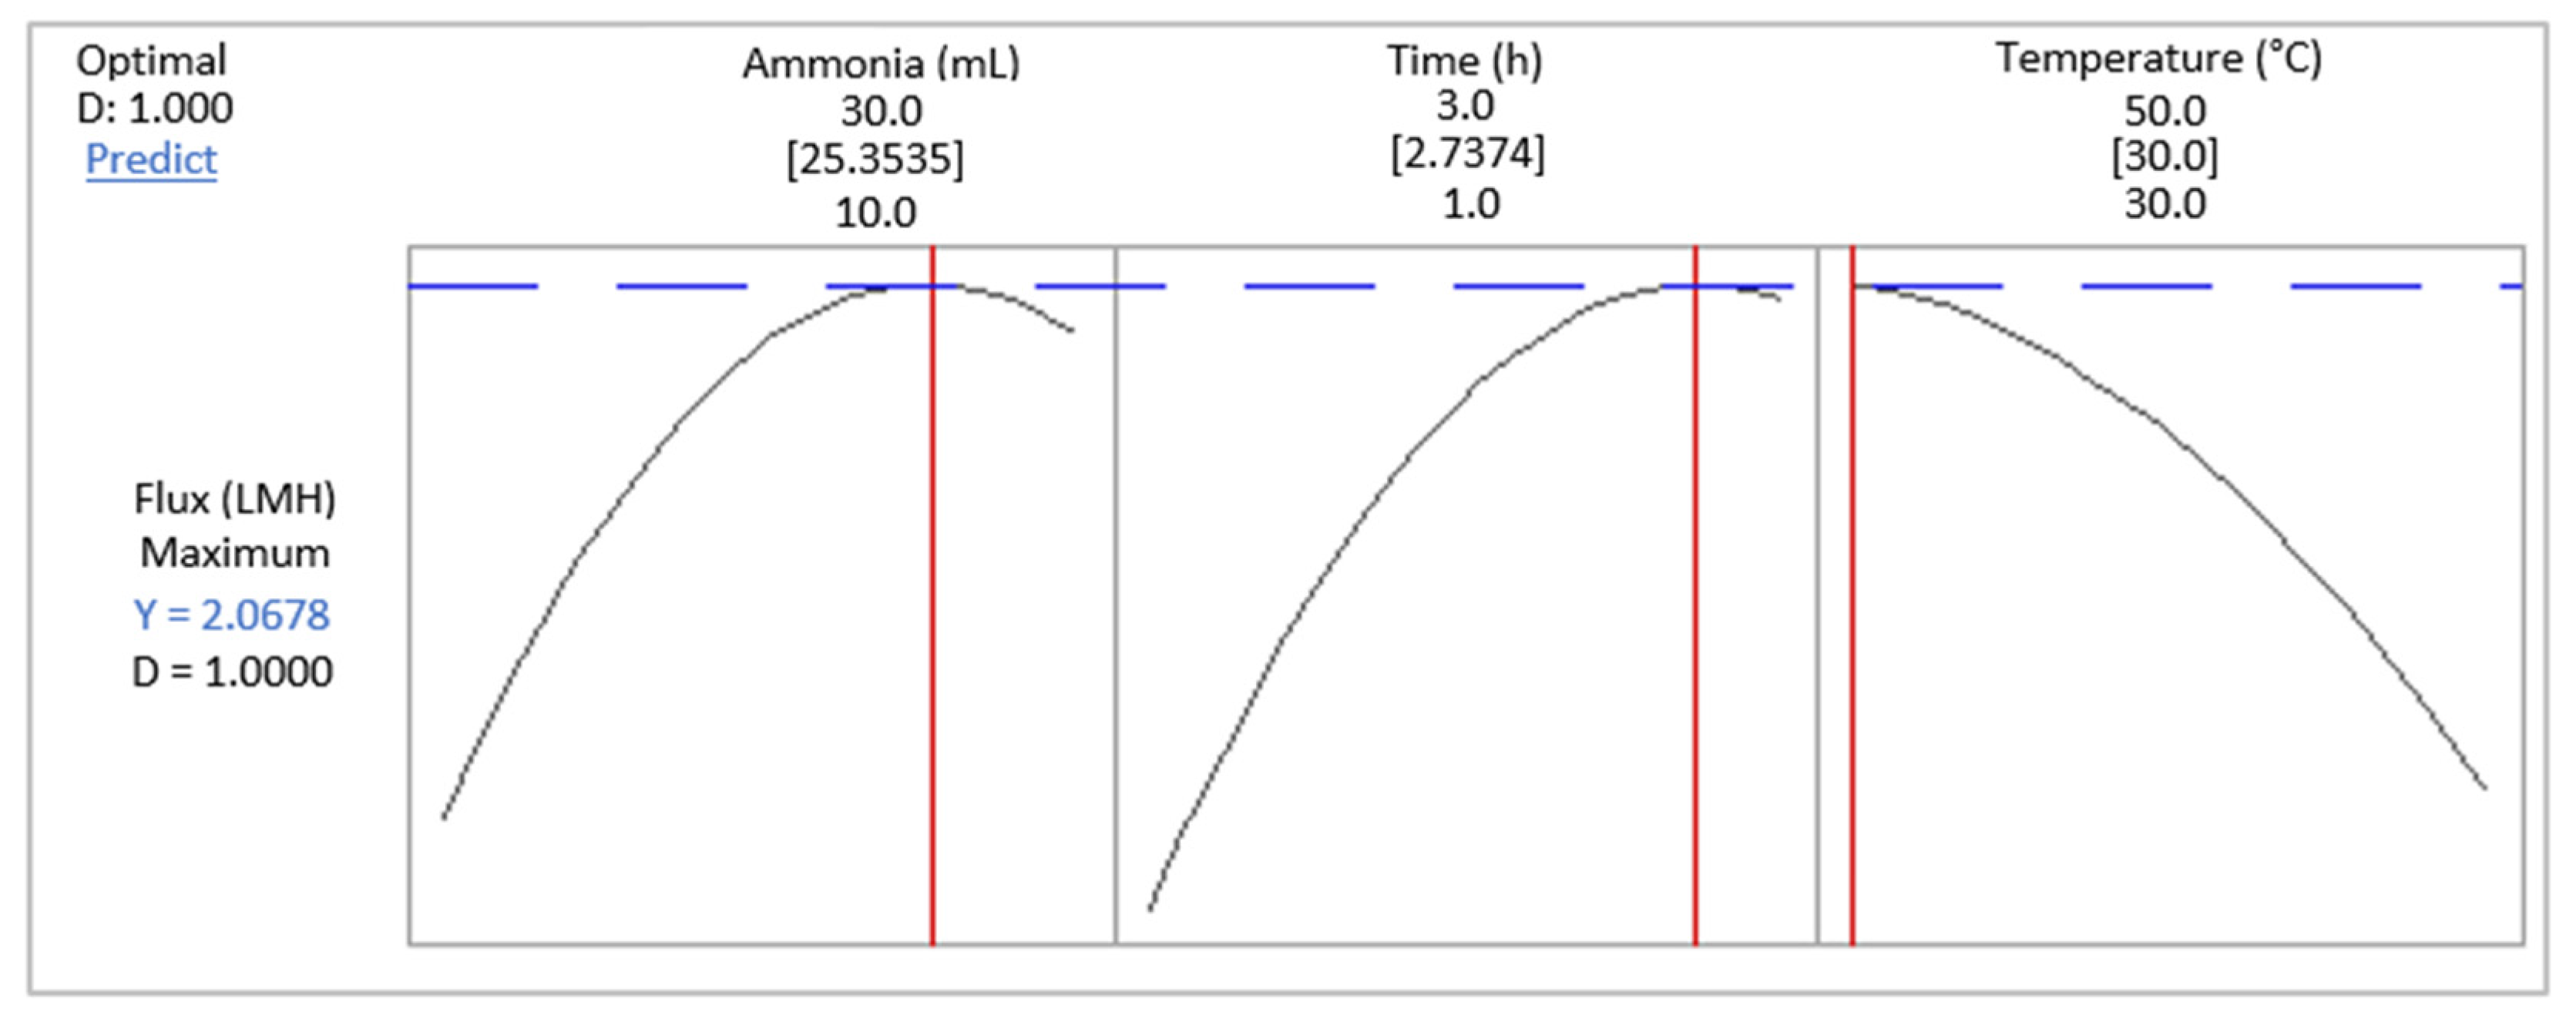
A numerical optimization using Minitab software was selected to find the maximum water flux when using bare iron oxide nanoparticles as draw solution. As shown in Figure 9, the optimum synthesis conditions were ammonia volume of 25.35 mL, reaction time of 2.7 h and reaction temperature of 30 °C. The selected lower and upper limits for all factors were appropriate since the vertex of the graph for each factor was visible in the selected range. The optimized nanoparticles were used as draw solution and tested using a bench scale FO experimental setup. The water flux measured in the experiment was 1.98 LMH which is close to the predicted value of 2.06 LMH. The water flux of the synthesized bare iron oxide nanoparticles was low compared to the water flux obtained when using stabilized iron oxide nanoparticles [33,34,35]. Therefore, it is expected to obtain high water flux when stabilizing the optimized bare iron oxide nanoparticles that were synthesized in this study.
4. Conclusions
In this paper, bare iron oxide nanoparticles were prepared using co-precipitation method and used as draw solute in the forward osmosis process. The synthesis conditions of the nanoparticles were optimized using Box-Behnken method to increase the water flux of the forward osmosis process. The process parameters were volume of ammonia solution, reaction temperature and reaction time. The water flux increased as the reaction time and volume of ammonia solution increased. However, the water flux decreased after adding excess amount of ammonia solution. The water flux decreased as the reaction temperature increased. The optimum predicted conditions were obtained at reaction temperature of 30 °C, reaction time of 2.73 h and 25.35 mL of ammonia solution. The water flux from the prediction model was found to be 2.06 LMH which is close to the actual value of 1.98 LMH. The prediction model had high correlation factors (R2 = 98.82%) and (R2adj = 96.69%).
This study is expected to be the base for future studies aiming at developing magnetic nanoparticles draw solution using co-precipitation method.
Author Contributions
Conceptualization, M.H. and M.M.B.-A.; methodology, M.H. and A.H.H.; software, M.H.; validation, A.H.H. and M.M.B.-A.; formal analysis, M.T. and M.H.; data curation, M.H. and M.T.; writing—original draft preparation, M.H.; writing—review and editing, A.H.H. and M.M.B.-A.; visualization, M.H.; supervision, A.H.H.; project administration, A.H.H.; funding acquisition, M.H. All authors have read and agreed to the published version of the manuscript.
Funding
This research was funded by Qatar National Research Fund (QNRF), grant number GSRA6-1-0509-19021.
Institutional Review Board Statement
Not applicable.
Informed Consent Statement
Not applicable.
Data Availability Statement
All data generated or analyzed during this study are included in this published article.
Acknowledgments
This research is made possible by graduate sponsorship research award (GSRA6-1-0509-19021) from Qatar National Research Fund (QNRF). Also, the authors would like to thank Qatar University for funding this project through Collaborative Grant (CG)—Cycle 05—ID492. The statements made herein are solely the responsibility of the authors. The authors would like to thank Central Laboratories Unit (CLU) at Qatar University for generating TEM images.
Conflicts of Interest
The authors declare no conflict of interest. The funders had no role in the design of the study; in the collection, analyses, or interpretation of data; in the writing of the manuscript, or in the decision to publish the results.
References
- Parlar, I.; Hacıfazlıoğlu, M.; Kabay, N.; Pek, T.; Yüksel, M. Performance comparison of reverse osmosis (RO) with integrated nanofiltration (NF) and reverse osmosis process for desalination of MBR effluent. J. Water Process. Eng. 2019, 29, 100640. [Google Scholar] [CrossRef]
- Altaee, A.; Zaragoza, G.; van Tonningen, H.R. Comparison between Forward Osmosis-Reverse Osmosis and Reverse Osmosis processes for seawater desalination. Desalination 2014, 336, 50–57. [Google Scholar] [CrossRef]
- Giagnorio, M.; Ricceri, F.; Tiraferri, A. Desalination of brackish groundwater and reuse of wastewater by forward osmosis coupled with nanofiltration for draw solution recovery. Water Res. 2019, 153, 134–143. [Google Scholar] [CrossRef] [PubMed]
- Alkhouzaam, A.; Qiblawey, H. Functional GO-based membranes for water treatment and desalination: Fabrication methods, performance and advantages. A review. Chemosphere 2021, 274, 129853. [Google Scholar] [CrossRef] [PubMed]
- Matin, A.; Rahman, F.; Shafi, H.Z.; Zubair, S.M. Scaling of reverse osmosis membranes used in water desalination: Phenomena, impact, and control; future directions. Desalination 2019, 455, 135–157. [Google Scholar] [CrossRef]
- Matin, A.; Laoui, T.; Falath, W.; Farooque, A.M. Fouling control in reverse osmosis for water desalination & reuse: Current practices & emerging environment-friendly technologies. Sci. Total Environ. 2021, 765, 142721. [Google Scholar] [CrossRef]
- Hafiz, M.; Hawari, A.H.; Alfahel, R.; Hassan, M.K.; Altaee, A. Comparison of Nanofiltration with Reverse Osmosis in Reclaiming Tertiary Treated Municipal Wastewater for Irrigation Purposes. Membranes 2021, 11, 32. [Google Scholar] [CrossRef]
- Hafiz, M.; Hawari, A.H.; Alfahel, R. Treatment of Wastewater Using Reverse Osmosis for Irrigation Purposes. In International Conference on Civil Infrastructure and Construction (CIC 2020); Qatar University Press: Doha, Qatar, 2020; pp. 724–728. [Google Scholar]
- Li, L.; Liu, X.-P.; Li, H.-Q. A review of forward osmosis membrane fouling: Types, research methods and future prospects. Environ. Technol. Rev. 2017, 6, 26–46. [Google Scholar] [CrossRef]
- Hafiz, M.A.; Hawari, A.H.; Das, P.; Khan, S.; Altaee, A. Comparison of dual stage ultrafiltration and hybrid ultrafiltration-forward osmosis process for harvesting microalgae (Tetraselmis sp.) biomass. Chem. Eng. Process. Process. Intensif. 2020, 157, 108112. [Google Scholar] [CrossRef]
- Alkhouzaam, A.; Qiblawey, H. Synergetic effects of dodecylamine-functionalized graphene oxide nanoparticles on antifouling and antibacterial properties of polysulfone ultrafiltration membranes. J. Water Process. Eng. 2021, 42, 102120. [Google Scholar] [CrossRef]
- Ge, Q.; Yang, L.; Cai, J.; Xu, W.; Chen, Q.; Liu, M. Hydroacid magnetic nanoparticles in forward osmosis for seawater desalination and efficient regeneration via integrated magnetic and membrane separations. J. Membr. Sci. 2016, 520, 550–559. [Google Scholar] [CrossRef]
- Na, Y.; Yang, S.; Lee, S. Evaluation of citrate-coated magnetic nanoparticles as draw solute for forward osmosis. Desalination 2014, 347, 34–42. [Google Scholar] [CrossRef]
- Wang, J.; Liu, X. Forward osmosis technology for water treatment: Recent advances and future perspectives. J. Clean. Prod. 2021, 280, 124354. [Google Scholar] [CrossRef]
- Zhao, S.; Zou, L.; Tang, C.Y.; Mulcahy, D. Recent developments in forward osmosis: Opportunities and challenges. J. Membr. Sci. 2012, 396, 1–21. [Google Scholar] [CrossRef]
- Guizani, M.; Endo, T.; Ito, R.; Funamizu, N. Polyethylene Glycol-Coated Magnetic Nanoparticles-Based Draw Solution for Forward Osmosis. Sanit. Value Chain. 2020, 4, 27–37. [Google Scholar]
- Nikiema, B.C.W.-Y.; Ito, R.; Guizani, M.; Funamizu, N. Estimation of Water Flux and Solute Movement during the Concentration Process of Hydrolysed Urine by Forward Osmosis. J. Water Environ. Technol. 2017, 15, 163–173. [Google Scholar] [CrossRef] [Green Version]
- Attallah, O.A.; Al-Ghobashy, M.; Nebsen, M.; El-Kholy, R.; Salem, M.Y. Assessment of pectin-coated magnetite nanoparticles in low-energy water desalination applications. Environ. Sci. Pollut. Res. 2018, 25, 18476–18483. [Google Scholar] [CrossRef] [PubMed]
- Shabani, Z.; Rahimpour, A. Chitosan- and dehydroascorbic acid-coated Fe3O4 nanoparticles: Preparation, characterization and their potential as draw solute in forward osmosis process. Iran. Polym. J. 2016, 25, 887–895. [Google Scholar] [CrossRef]
- Azadi, F.; Karimi-Jashni, A.; Zerafat, M.M. Desalination of brackish water by gelatin-coated magnetite nanoparticles as a novel draw solute in forward osmosis process. Environ. Technol. 2020, 42, 2885–2895. [Google Scholar] [CrossRef] [PubMed]
- Zufia-Rivas, J.; Morales, P.; Veintemillas-Verdaguer, S. Effect of the Sodium Polyacrylate on the Magnetite Nanoparticles Produced by Green Chemistry Routes: Applicability in Forward Osmosis. Nanomaterials 2018, 8, 470. [Google Scholar] [CrossRef] [Green Version]
- Ba-Abbad, M.M.; Chai, P.V.; Takriff, M.S.; Benamor, A.; Mohammad, A.W. Optimization of nickel oxide nanoparticle synthesis through the sol–gel method using Box-Behnken design. Mater. Des. 2015, 86, 948–956. [Google Scholar] [CrossRef]
- Ewis, D.; Benamor, A.; Ba-Abbad, M.M.; Nasser, M.; El-Naas, M.; Qiblawey, H. Removal of Oil Content from Oil-Water Emulsions Using Iron Oxide/Bentonite Nano Adsorbents. J. Water Process. Eng. 2020, 38, 101583. [Google Scholar] [CrossRef]
- Ngan, C.L.; Basri, M.; Lye, F.F.; Masoumi, H.R.F.; Tripathy, M.; Karjiban, R.A.; Abdul-Malek, E. Comparison of Box-Behnken and central composite designs in optimization of fullerene loaded palm-based nano-emulsions for cosmeceutical application. Ind. Crops Prod. 2014, 59, 309–317. [Google Scholar] [CrossRef]
- Ge, Q.; Su, J.; Chung, T.-S.; Amy, G. Hydrophilic Superparamagnetic Nanoparticles: Synthesis, Characterization, and Performance in Forward Osmosis Processes. Ind. Eng. Chem. Res. 2010, 50, 382–388. [Google Scholar] [CrossRef]
- Fang, M.; Ström, V.; Olsson, R.T.; Belova, L.; Rao, K.V. Particle size and magnetic properties dependence on growth temperature for rapid mixed co-precipitated magnetite nanoparticles. Nanotechnology 2012, 23, 145601. [Google Scholar] [CrossRef]
- Schwaminger, S.; Syhr, C.; Berensmeier, S. Controlled Synthesis of Magnetic Iron Oxide Nanoparticles: Magnetite or Maghemite? Crystals 2020, 10, 214. [Google Scholar] [CrossRef] [Green Version]
- Roth, H.-C.; Schwaminger, S.; Schindler, M.; Wagner, F.E.; Berensmeier, S. Influencing factors in the CO-precipitation process of superparamagnetic iron oxide nano particles: A model based study. J. Magn. Magn. Mater. 2015, 377, 81–89. [Google Scholar] [CrossRef]
- Gnanaprakash, G.; Mahadevan, S.; Jayakumar, T.; Kalyanasundaram, P.; Philip, J.; Raj, B. Effect of initial pH and temperature of iron salt solutions on formation of magnetite nanoparticles. Mater. Chem. Phys. 2007, 103, 168–175. [Google Scholar] [CrossRef]
- Rashid, H.; Mansoor, M.A.; Haider, B.; Nasir, R.; Hamid, S.B.A.; Abdulrahman, A. Synthesis and characterization of magnetite nano particles with high selectivity using in-situ precipitation method. Sep. Sci. Technol. 2019, 55, 1207–1215. [Google Scholar] [CrossRef] [Green Version]
- Samrot, A.V.; Sahithya, C.S.; Selvarani, J.; Purayil, S.K.; Ponnaiah, P. A review on synthesis, characterization and potential biological applications of superparamagnetic iron oxide nanoparticles. Curr. Res. Green Sustain. Chem. 2021, 4, 100042. [Google Scholar] [CrossRef]
- Vayssieres, L.; Chanéac, C.; Tronc, E.; Jolivet, J.P. Size Tailoring of Magnetite Particles Formed by Aqueous Precipitation: An Example of Thermodynamic Stability of Nanometric Oxide Particles. J. Colloid Interface Sci. 1998, 205, 205–212. [Google Scholar] [CrossRef] [PubMed]
- Guizani, M.; Maeda, T.; Ito, R.; Funamizu, N. Synthesis and Characterization of Magnetic Nanoparticles as a Candidate Draw Solution for Forward Osmosis. J. Water Environ. Technol. 2018, 16, 63–71. [Google Scholar] [CrossRef] [Green Version]
- Petrinic, I.; Stergar, J.; Bukšek, H.; Drofenik, M.; Gyergyek, S.; Hélix-Nielsen, C.; Ban, I. Superparamagnetic Fe3O4@Ca Nanoparticles and Their Potential as Draw Solution Agents in Forward Osmosis. Nanomaterials 2021, 11, 2965. [Google Scholar] [CrossRef] [PubMed]
- Ling, M.M.; Chung, T.-S. Desalination process using super hydrophilic nanoparticles via forward osmosis integrated with ultrafiltration regeneration. Desalination 2011, 278, 194–202. [Google Scholar] [CrossRef]
Figure 1.
An illustration for the lab-scale forward osmosis experimental setup used in this study.

Figure 2.
Box-Behnken design forms (a) cube and (b) three interlocking 22 factorials.

Figure 3.
Diagnostic plots for the optimization process using Box-Behnken design (a) normality test, (b) studentized residuals, (c) predicted and actual water flux of the FO process.
Figure 3.
Diagnostic plots for the optimization process using Box-Behnken design (a) normality test, (b) studentized residuals, (c) predicted and actual water flux of the FO process.

Figure 4.
Effect of interaction between the reaction temperature, reaction time, and volume of ammonia solution on the water flux of the FO process (a) effect of ammonia and time on flux, (b) effect of ammonia and temperature on the flux, (c) temperature and time on flux.
Figure 4.
Effect of interaction between the reaction temperature, reaction time, and volume of ammonia solution on the water flux of the FO process (a) effect of ammonia and time on flux, (b) effect of ammonia and temperature on the flux, (c) temperature and time on flux.


Figure 5.
TEM images showing the effect of ammonia solution volume on the formation of magnetite particles and other forms of iron oxide nanoparticles (a) 10 mL, (b) 20 mL, and (c) 30 mL.
Figure 5.
TEM images showing the effect of ammonia solution volume on the formation of magnetite particles and other forms of iron oxide nanoparticles (a) 10 mL, (b) 20 mL, and (c) 30 mL.


Figure 6.
XRD of MNPs synthesized using various volumes of ammonia solution: 10 mL, 20 mL, and 30 mL.
Figure 6.
XRD of MNPs synthesized using various volumes of ammonia solution: 10 mL, 20 mL, and 30 mL.

Figure 7.
The effect of the reaction time on the zeta potential of the iron oxide nanoparticles.

Figure 8.
TEM images showing the effect of Ostwald ripening phenomenon where particles are redeposited on a stable nucleus when using high reaction temperature (a) 30 °C and (b) 50 °C.
Figure 8.
TEM images showing the effect of Ostwald ripening phenomenon where particles are redeposited on a stable nucleus when using high reaction temperature (a) 30 °C and (b) 50 °C.

Figure 9.
Predicted conditions to produce MNPs with highest water flux using Box-Behnken design.


Table 1.
The factors and associated levels for MNPs synthesis.
| Factors | Levels | |||
|---|---|---|---|---|
| −1 | 0 | +1 | ||
| Ammonia (mL) | ×1 | 10 | 20 | 30 |
| Time (h) | ×2 | 1 | 2 | 3 |
| Temperature (C) | ×3 | 30 | 40 | 50 |
Table 2.
Summary of Box-Behnken optimization with comparison between predicted and actual water flux of the FO process.
Table 2.
Summary of Box-Behnken optimization with comparison between predicted and actual water flux of the FO process.
| StdOrder | X1 | X2 | X3 | YActual | YPredicted |
|---|---|---|---|---|---|
| 1 | 10 | 1 | 40 | 0.733 | 0.740 |
| 2 | 30 | 1 | 40 | 0.559 | 0.488 |
| 3 | 10 | 3 | 40 | 0.569 | 0.639 |
| 4 | 30 | 3 | 40 | 1.369 | 1.361 |
| 5 | 10 | 2 | 30 | 0.942 | 0.897 |
| 6 | 30 | 2 | 30 | 1.609 | 1.642 |
| 7 | 10 | 2 | 50 | 0.99 | 0.956 |
| 8 | 30 | 2 | 50 | 0.637 | 0.681 |
| 9 | 20 | 1 | 30 | 0.898 | 0.935 |
| 10 | 20 | 3 | 30 | 1.884 | 1.857 |
| 11 | 20 | 1 | 50 | 0.992 | 1.018 |
| 12 | 20 | 3 | 50 | 0.907 | 0.870 |
| 13 | 20 | 2 | 40 | 1.81 | 1.803 |
| 14 | 20 | 2 | 40 | 1.7 | 1.803 |
| 15 | 20 | 2 | 40 | 1.9 | 1.803 |
Y: Water flux of the FO process.
Table 3.
A summary for the ANOVA results of the quadratic model.
| Source | DF | Adj SS | Adj MS | F-Value | p-Value * |
|---|---|---|---|---|---|
| Model | 9 | 3.39357 | 0.37706 | 46.47 | 0.000 |
| Linear | 3 | 0.81776 | 0.27259 | 33.59 | 0.001 |
| X1 | 1 | 0.11045 | 0.11045 | 13.61 | 0.014 |
| X2 | 1 | 0.29915 | 0.29915 | 36.87 | 0.002 |
| X3 | 1 | 0.40816 | 0.40816 | 50.30 | 0.001 |
| Square | 3 | 1.79179 | 0.59726 | 73.60 | 0.000 |
| X1 X1 | 1 | 1.16118 | 1.16118 | 143.10 | 0.000 |
| X2 X2 | 1 | 0.69881 | 0.69881 | 86.12 | 0.000 |
| X3 X3 | 1 | 0.14481 | 0.14481 | 17.85 | 0.008 |
| 2-Way Interaction | 3 | 0.78403 | 0.26134 | 32.21 | 0.001 |
| X1 X2 | 1 | 0.23717 | 0.23717 | 29.23 | 0.003 |
| X1 X3 | 1 | 0.26010 | 0.26010 | 32.05 | 0.002 |
| X2 X3 | 1 | 0.28676 | 0.28676 | 35.34 | 0.002 |
| Error | 5 | 0.04057 | 0.00811 | ||
| Lack-of-Fit | 3 | 0.02051 | 0.00684 | 0.68 | 0.641 |
| Total | 14 | 3.43415 |
* Significant when (p < 0.05); R2 = 98.82%; R2adj = 96.69%; S = 0.0900810.
Publisher’s Note: MDPI stays neutral with regard to jurisdictional claims in published maps and institutional affiliations. |
© 2021 by the authors. Licensee MDPI, Basel, Switzerland. This article is an open access article distributed under the terms and conditions of the Creative Commons Attribution (CC BY) license (https://creativecommons.org/licenses/by/4.0/).
Share and Cite
MDPI and ACS Style
Hafiz, M.; Talhami, M.; Ba-Abbad, M.M.; Hawari, A.H. Optimization of Magnetic Nanoparticles Draw Solution for High Water Flux in Forward Osmosis. Water 2021, 13, 3653. https://doi.org/10.3390/w13243653
AMA Style
Hafiz M, Talhami M, Ba-Abbad MM, Hawari AH. Optimization of Magnetic Nanoparticles Draw Solution for High Water Flux in Forward Osmosis. Water. 2021; 13(24):3653. https://doi.org/10.3390/w13243653
Chicago/Turabian StyleHafiz, MhdAmmar, Mohammed Talhami, Muneer M. Ba-Abbad, and Alaa H. Hawari. 2021. "Optimization of Magnetic Nanoparticles Draw Solution for High Water Flux in Forward Osmosis" Water 13, no. 24: 3653. https://doi.org/10.3390/w13243653
Note that from the first issue of 2016, this journal uses article numbers instead of page numbers. See further details here.