Article

Not All Disasters Are Created Equal: An Evaluation of Water Issues in Fire and Hurricane Media Coverage in the United States

Sandia National Laboratories, Albuquerque, NM 87123, USA
*
Author to whom correspondence should be addressed.
Water 2021, 13(24), 3655; https://doi.org/10.3390/w13243655
Submission received: 5 November 2021 / Revised: 4 December 2021 / Accepted: 13 December 2021 / Published: 20 December 2021
(This article belongs to the Section Water Resources Management, Policy and Governance)

Abstract

:
Water resources are greatly impacted by natural disasters, but very little is known about how these issues are portrayed in the media across different types of disasters. Using a corpus of over 600 thousand local newspaper articles, this research evaluates whether the amount of coverage of water-related concerns of fires and hurricanes reflects news values associated with magnitude and proximity. A more detailed analysis focused on wildfires, which occur on undeveloped land and have the potential to spread rapidly, was also conducted to further evaluate spatial patterns in disaster-related water coverage. Our results indicate that the newspaper coverage patterns for water issues are not equally connected to magnitude and proximity values for fires and hurricanes. In our sample, coverage of water issues in relation to fires and wildfires consistently had an inverse relationship with overall event magnitudes, whereas the coverage of water issues in relation to hurricanes demonstrated a positive correlation. Although wildfires are more likely to be clustered in the western part of the country, there was a lack of positive correlations with wildfire magnitudes in this region. Possible influences for these patterns (e.g., limited impacts to humans and lack of shock-value) are discussed. Given the media’s role in facilitating disaster management and recovery, these nuances in coverage variations provide insight into opportunities for informing water security, which is especially important given the increasing frequency of natural disasters.

1. Introduction

Water security is defined by the United Nations as the ability to safeguard adequate quantities of clean water to sustain the livelihoods and the health of a population [1]. Without access to adequate quantities of clean water, societal risks include reduced agricultural productivity, reduced nutritional value of food, water scarcity, and higher exposure to pathogens [2]. One of the greatest threats to water security comes in the form of natural disasters, which have been increasing in frequency and severity over the last few decades [3,4,5,6]. Defined as “a potentially traumatic event that is collectively experienced, has an acute onset, and is time-delimited”, natural disasters include events, such as hurricanes, severe weather and storms, earthquakes, tornadoes, floods, and fires [7,8]. Human and economic impacts related to water comprise a majority of natural disasters [9]. This is not surprising given that almost all natural disasters involve water security in some way, whether it be from over-abundance (e.g., flooding during hurricanes causing property damage [10]), scarcity (e.g., freshwater availability in wildfire-prone regions [11]), or water quality impacts (e.g., contamination from rapid mobilization of chemicals into our water sources [12]).
Given the significant impact of natural disasters on human well-being, it is unsurprising that many use news media to stay informed during these catastrophic events [13]. In fact, many individuals do not have direct experience with natural disasters but rather learn about natural disasters and natural disaster preparedness from the media [13,14,15]. In addition to sharing relevant information during a disaster, news media plays a critical role in facilitating recovery [16,17,18] and affecting positive behavioral changes in the wake of a disaster [19]. Studies have shown, for example, the influence of media coverage on the public’s perception and engagement with policy-making activities [20,21]. By fostering public awareness and concern for important issues, news media effectively serves an agenda-setting function that guides how topics are perceived and spoken about [22].
Research has shown that media coverage tends to focus on the current impact of disasters on people, the economy, structures, and the natural environment [13]. Studies assessing natural disaster media coverage typically treat natural disasters as a conglomerate of events with no unique variations in coverage [13,23,24,25,26]. Alternatively, one type of disaster (e.g., hurricanes or fires) is extracted for a case study media analysis [27,28,29,30,31,32]. News coverage of droughts, for example, has been linked to changes in water consumption patterns [19,33]. However, very little is known about how water issues are portrayed in the media across different types of disasters [34]. In particular, fires and hurricanes, which have been a leading cause of damages and impact within the country, have been largely overlooked in current water-related media analyses. In 2018 alone, 58,083 wildfires burned 8.8 million acres in the United States [35]. These fires caused 18 billion USD in damages and claimed the lives of almost 100 people [35,36]. This year, 2018, was also marked by two major hurricanes, Hurricane Michael and Hurricane Florence. These hurricanes caused an astonishing 17.5 billion United States Dollars (USD) in damages and killed 38 people [37,38]. Fires and hurricanes have been shown to contaminate and/or deplete potable water sources, as well as destroy infrastructure that supports water systems [2]. An evaluation of water narratives and discourse during these events, however, has been missing within the current literature.
This study addresses both technical and public knowledge gaps concerning water-related newspaper coverage of fire and hurricane natural disasters. Evaluation of associations between newspaper coverage and associated disaster events in this study is guided by consideration of "news values", a set of metrics used by news organizations to assess and/or increase a story’s value to their readership [39]. Specifically, this analysis focuses on the news values of proximity and magnitude due to their established role in predicting natural disaster coverage [25,40]. Using a corpus of 600K+ articles from local newspapers, we extend the evaluation of the relationship between media coverage and event magnitude/proximity to include a comparative analysis of how these relationships may vary between fires and hurricanes, which has not been conducted to date [13] and remains a technical gap in the field of disaster and media coverage research. Local newspapers were selected for these analyses since they have received less attention than national media sources, and they contain community-level variations in coverage that may be missing from national newspaper coverage [13]. The findings from these analyses help improve understanding of media coverage of water issues during natural disasters, which can help illuminate variations in the public’s awareness of these issues. By identifying gaps in the public’s awareness, possible opportunities to inform and increase public engagement on critical water security issues within communities, especially during natural disasters, can be identified.

2. Methods

This analysis was guided by a large corpus of local newspaper articles downloaded from LexisNexis (Figure 1). After filtering this corpus to identify relevant content, correlation analyses were conducted to evaluate relationships between media coverage and the magnitude and proximity of natural disasters at an annual time scale and a state-level spatial scale. Due to data availability, a more detailed analysis for wildfires was also conducted to further evaluate spatial patterns in fire-related water coverage (Figure 1). More details about the specific indicators used and associated data sources are provided in the following subsections.

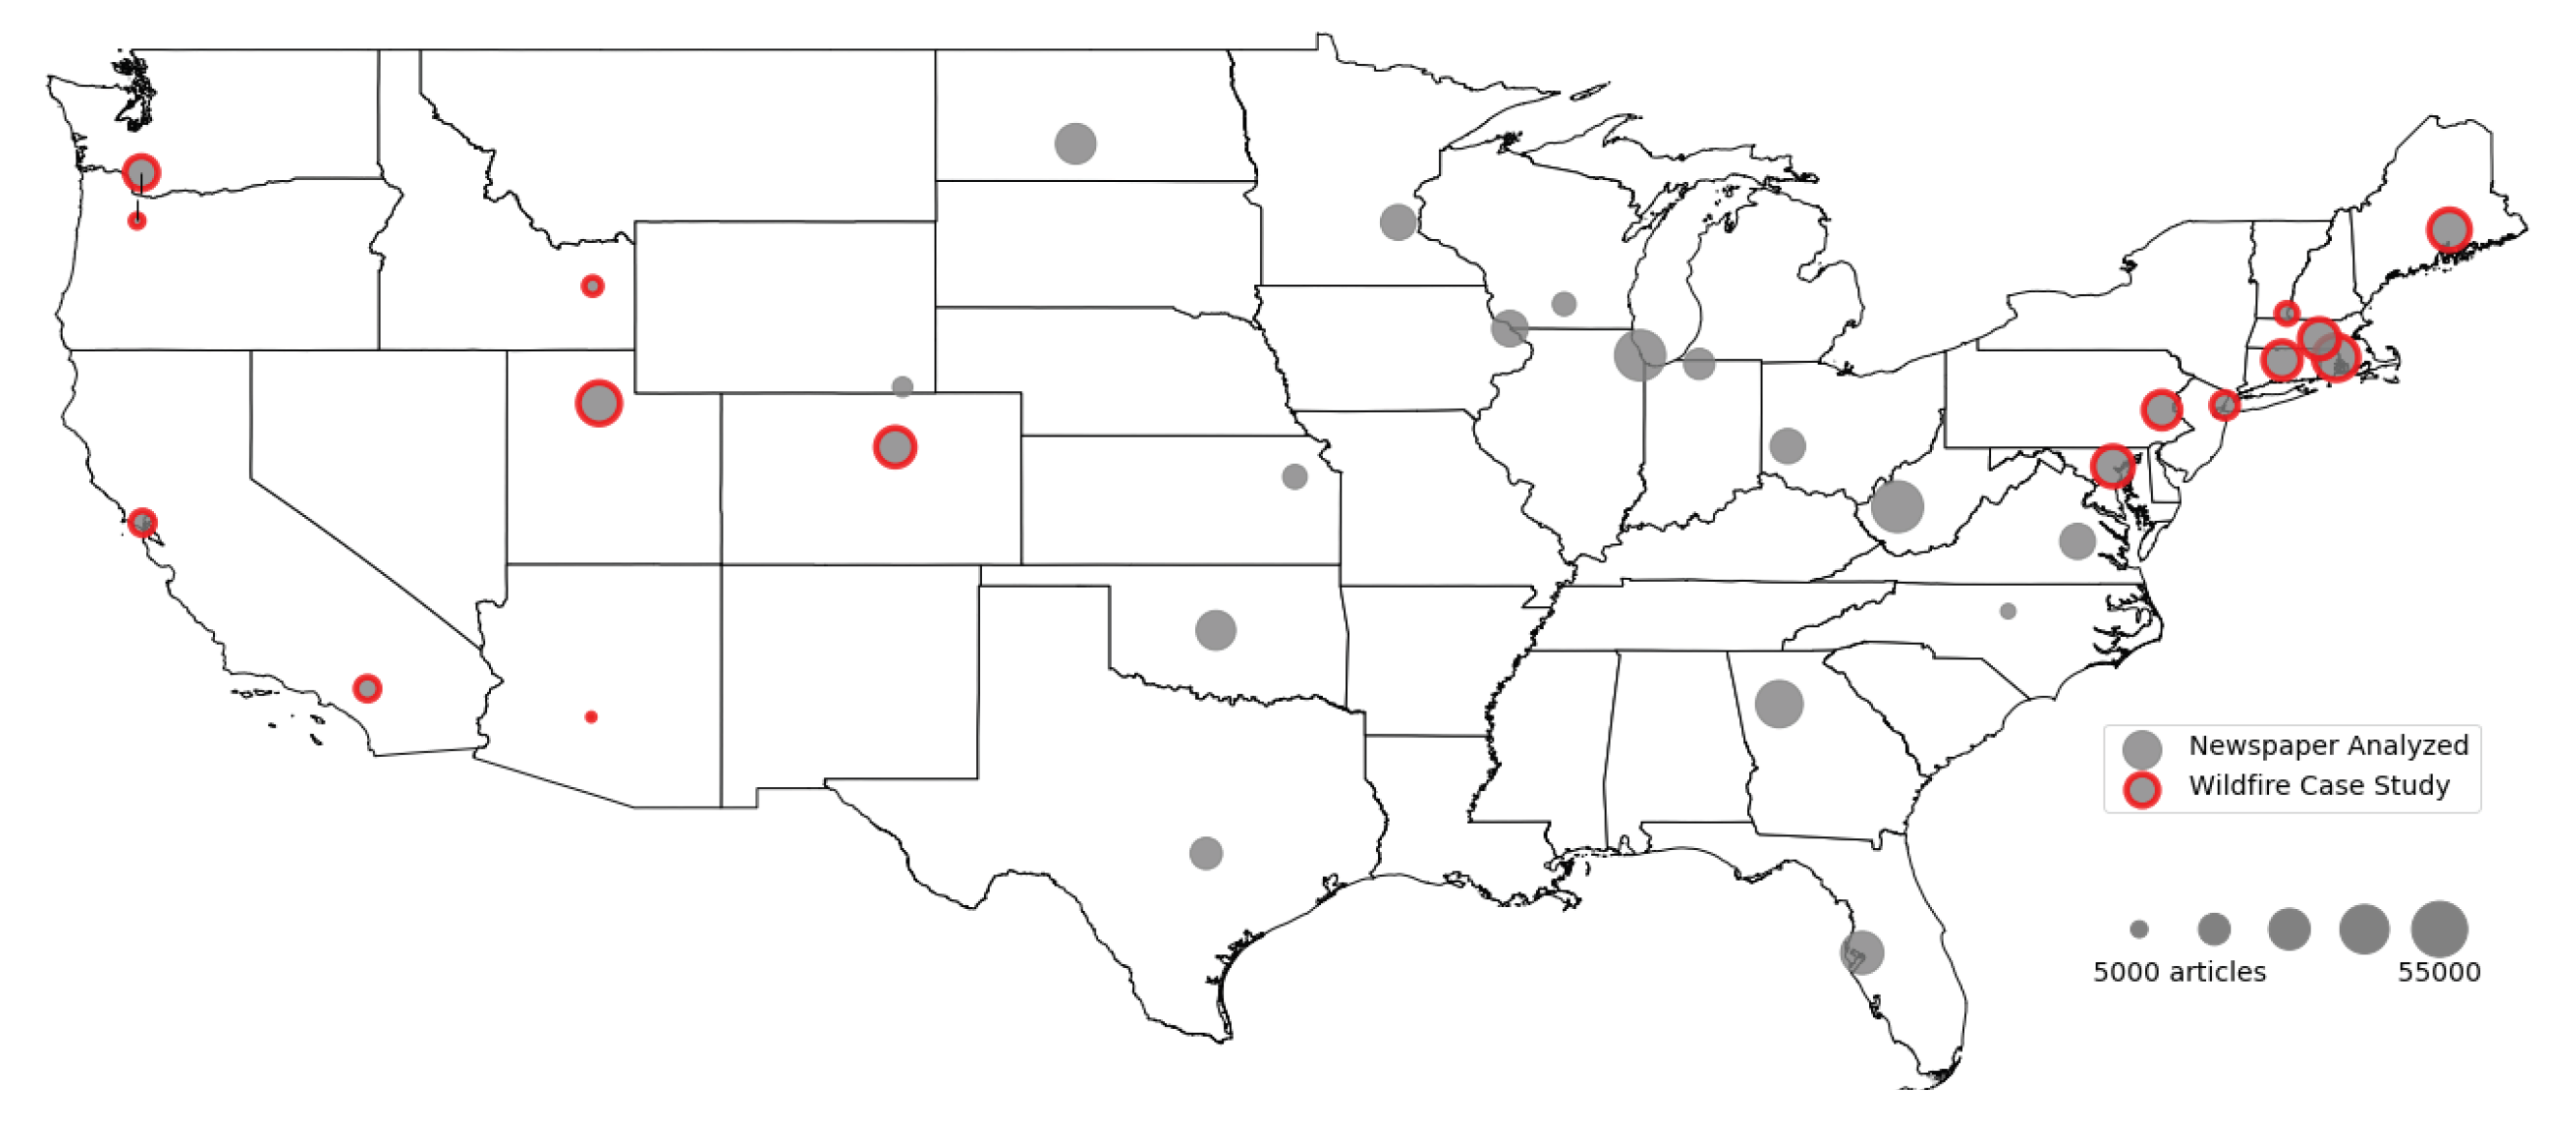
2.1. Newspaper Articles

Dataset. A corpus of water-related newspaper articles from local publications was downloaded using LexisNexis [41]. Initial explorations revealed the presence of articles not directly related to water resource issues of supply, quality, or management (e.g., “body found in water”), so topic modeling was used to filter the corpus to relevant articles [42], leaving a total of 676,354 articles for this analysis. These articles were distributed across 32 local U.S. newspapers across 31 U.S. states (Figure 2) and generally span between December 1997 and December 2017 (Table A1).
Processing and Analysis. The articles were evaluated for the terms "fire" and "hurricane" to create a disaster-specific corpus using key term identification (KTI), a powerful technique for filtering unstructured data into those of interest [43]. Using Boolean logic, KTI evaluates whether a newspaper article contains one or more words of interest. The filtered corpus of “fire” articles was further tagged to capture those that were specifically relevant to wildfires (using “wildfire” and “wild fire” terms) for the detailed case study. The filtered corpus of disaster articles was evaluated for patterns in space and time by counting the number of articles for a given time period or spatial region (Figure 1). Content analysis was also conducted using bigrams to understand the specific context in which water is discussed for these disasters [44].

2.2. Fires and Hurricanes

Event Magnitude and Proximity Datasets. Proximity and magnitude "news values" were used to guide the selection of specific indicators to quantify disasters, which are often challenging to identify [45]. Proximity specifies that readers are more interested in events that occur in close physical proximity to them, while magnitude is an umbrella term that refers to the physical size and impact of an event [25,39,40,46]. Data from the Federal Emergency Management Agency (FEMA) and the Insurance Information Institute (III) were compiled to generate national and state-level information about disaster magnitudes. The FEMA dataset included state-level disaster declarations for both hurricanes and fires [47], as well as national-level fire metrics, including the number of fire events and fire-related deaths and property losses (latter adjusted to 2017 dollars), from incidents reported by fire departments [48]. The fire dataset includes structural fires, outside brush fires (which mostly occur on private land or agricultural settings, typically controlled), and wildfires (which occur on undeveloped land and have the potential to spread rapidly) [48]. National-level hurricane metrics, including the number of hurricanes that made landfall in the U.S. and associated deaths, were compiled from the III [49]. Damage losses (adjusted to 2018 dollars) from hurricanes were collected from ICAT, an insurance agency that deals with catastrophic losses [50].
Correlation and Comparative Analyses. Temporal patterns in aggregate newspaper coverage were correlated to associated event magnitude datasets using the non-parametric Kendall correlation coefficient [51]; p-values were used as a general (rather than a binary) indicator of significance [52]. Due to data limitations, proximity considerations were primarily evaluated at the state level when available (Figure 1). To enable a one-to-one comparison, disaster declaration data was a subset to corresponding states (smallest resolution available) that coincided with newspaper coverage [47]. The remaining parameters (i.e., number of events, losses, and deaths) for fires and hurricanes were compared at an aggregate national scale due to data limitations [48,49]. Due to limited resolution within the data, comparative analysis of fires and hurricanes was restricted to an annual basis (Figure 1).

2.3. Wildfire Case Study

Wildfire Dataset. Information about wildfires was obtained from the Integrated Reporting of Wildland-Fire Information (IRWIN) service, an interagency database providing fire incident data on any fire occurring on federal land or using federal resources for suppression [53]. Detailed wildfire information was available starting in May 2014. Since newspaper information available until December 2017 was collected, an overlapping period of three and a half years was available for the wildfire case study. Locations of wildfire incidents across the nation along with associated data (fire discovery date, fire containment date, total fatalities, and fire size in acres) were accessed from the IRWIN geoplatform. Geospatial characteristics, such as the proximity to the wildland–urban interface (WUI), defined as the area where structures and infrastructure meet or intermingle with undeveloped wildland, were also pulled [54]. Both intermix and interface categories within WUI were used in this analysis; intermix is defined as areas with less than 6.18 houses per square kilometer with greater than 50% cover of wildland vegetation, while the interface is defined as areas with greater than 6.18 houses per square kilometer with less than 50% vegetation cover located within 2.4 km of an area of land that is 75% vegetated for at least five square kilometers [54]. A 200-mile radius was used to identify fires proximate to newspapers based on their headquarter city. In addition to IRWIN data, state-level wildfire risk potentials (i.e., number and percentage of properties at risk) were also compiled from the III.
Correlation and Comparative Analyses. In addition to the annual patterns and bigram analysis described above, the IRWIN dataset enabled a more detailed, spatiotemporal evaluation of associations between wildfire-related articles and wildfire events, including variations in different regions of the country. Specifically, sixteen newspapers (eight each) from two regions of the country (west and the northeast) were analyzed in greater detail (Figure 2; Table A1). Geospatial variations in newspaper coverage were compared to wildfire events by extending correlation analysis methods (to also consider sentiment and spatial autocorrelation), as well as incorporating geographic metadata within newspapers.
For the correlation analysis, the coverage metrics were compared to associated summary statistics for wildfire data (e.g., presence of wildfires near the headquarter city, tge average duration of fires, acreage of fires, and percentage of fires that occurred within WUI) using Kendall’s rank correlation [51] to evaluate regional-level variations in newspaper coverage. The duration of the fire was inferred from the difference in days between the discovery and containment dates. Determination of whether a wildfire occurred in the WUI was calculated by spatially joining the WUI and fire datasets and extracting the percentage of the area corresponding to WUI from the fire centroids. In addition to the number of articles, the daily scale of analysis enabled the inclusion of article length and article sentiment to the amount and type of attention paid to an issue. Specifically, the way that events are constructed with words can influence the meaning derived by a reader [55,56]. Therefore, understanding what is covered in the media is equally as important as understanding how it is covered. Article length was quantified using character counts, while sentiment was quantified using a weighted average of tagged positive–negative–neutral words found within the article using the Bing lexicon. Words within each article were tagged as +1 (for “positive”), −1 (for “negative”) content, or 0 (for “neutral”) for words not captured in the Bing lexicon [57].
The finer resolution of wildfire event data also enabled spatial autocorrelation analysis at a county level to determine if there is an identifiable spatial pattern within the fire metrics (i.e., hotspots) that could help explain some of the regional variability regarding proximity considerations. The local Moran’s I (i.e., local indicator of spatial association (LISA)) was used to determine spatial clustering; a high value surrounded by other high values indicates a hotspot while a low value surrounded by other low values indicates a coldspot [58]. A negative value for a local Moran’s I indicates spatial outliers, where the value is very different from its surrounding neighbors. Finally, geospatial variations were further examined by the regions discussed within each article [59]. Captured within the metadata of the newspaper articles, city names were geocoded to determine latitude and longitude coordinates using Open Street Map [60] and compared to the relative location of the newspaper city headquarters.

3. Results

3.1. Newspaper Articles

Approximately 24% of the water-related articles from local newspapers discussed fires and hurricanes. Fires generally received more coverage than hurricanes, with coverage decreasing almost steadily since 2000 (Figure 3). In contrast, hurricane coverage exhibits a cyclical patternm with peak coverage occurring in 2005 and again in 2017 (Figure 3). An analysis of bigrams indicates water supplies, drinking water, and water damage are a top concern for both fires and hurricanes (Figure 4). Water quality and water mains are more prominent for fire-related coverage, while hurricane coverage is more concerned with food and rising water issues (Figure 4).

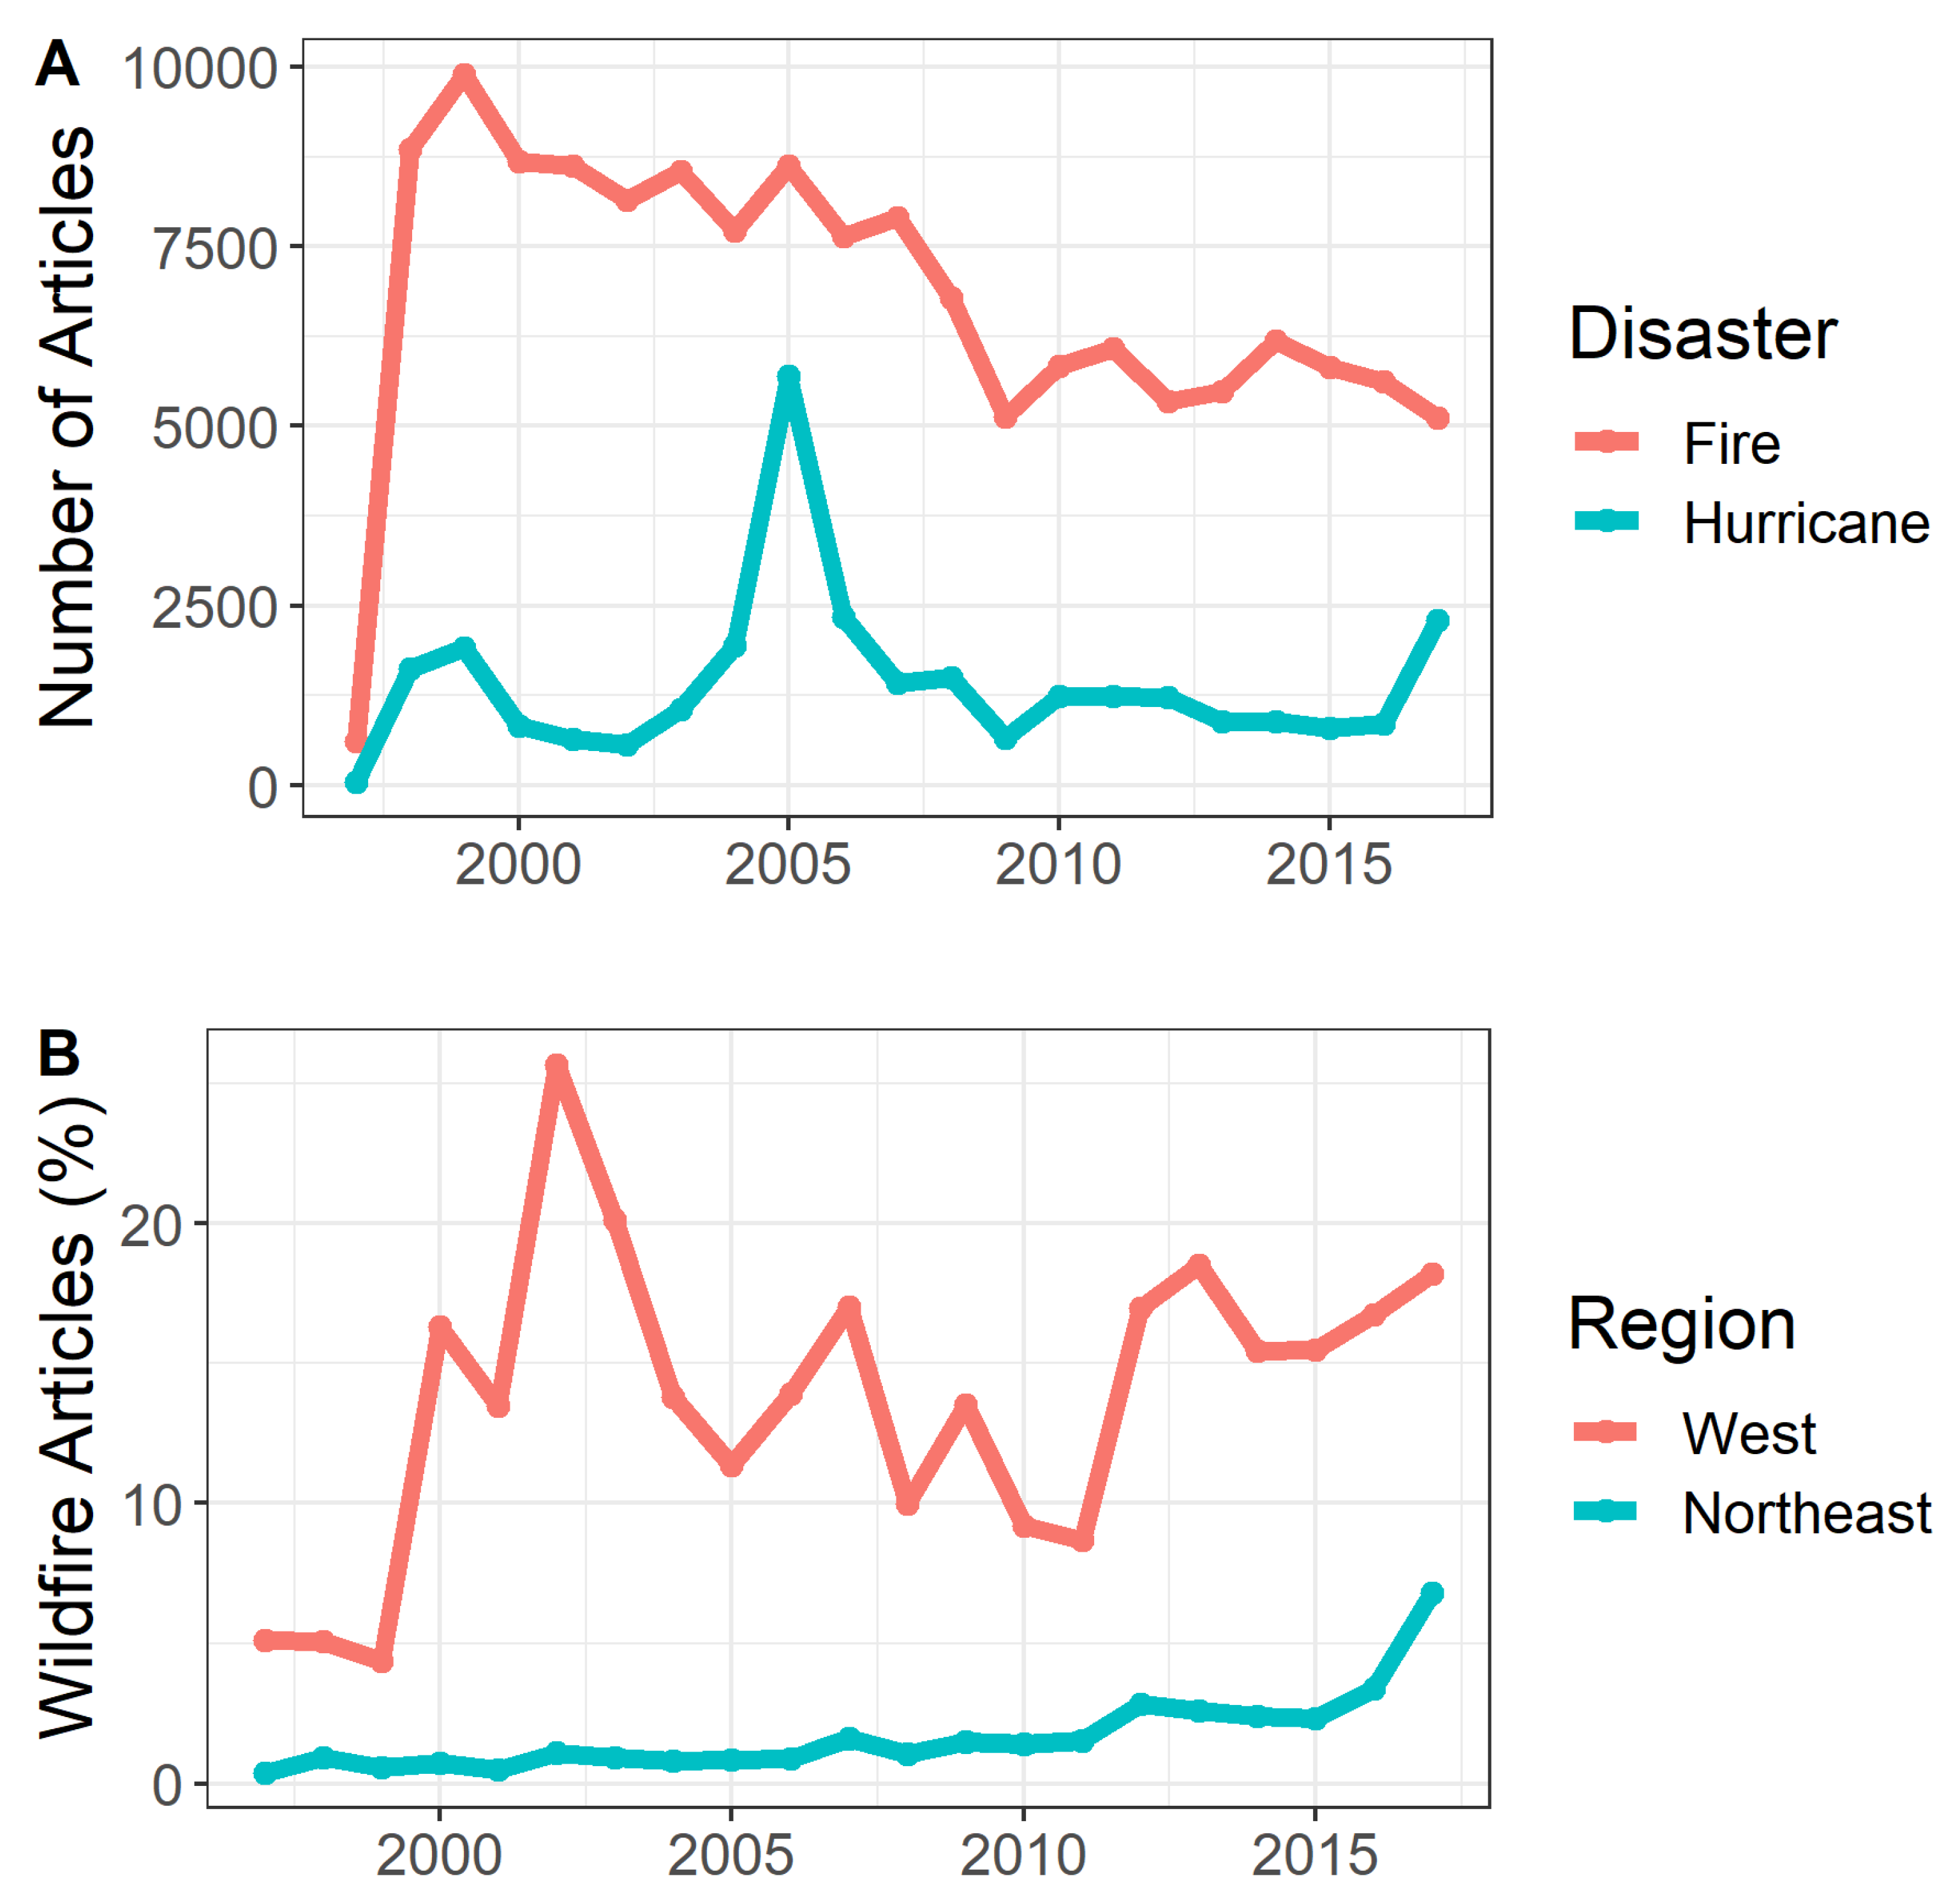
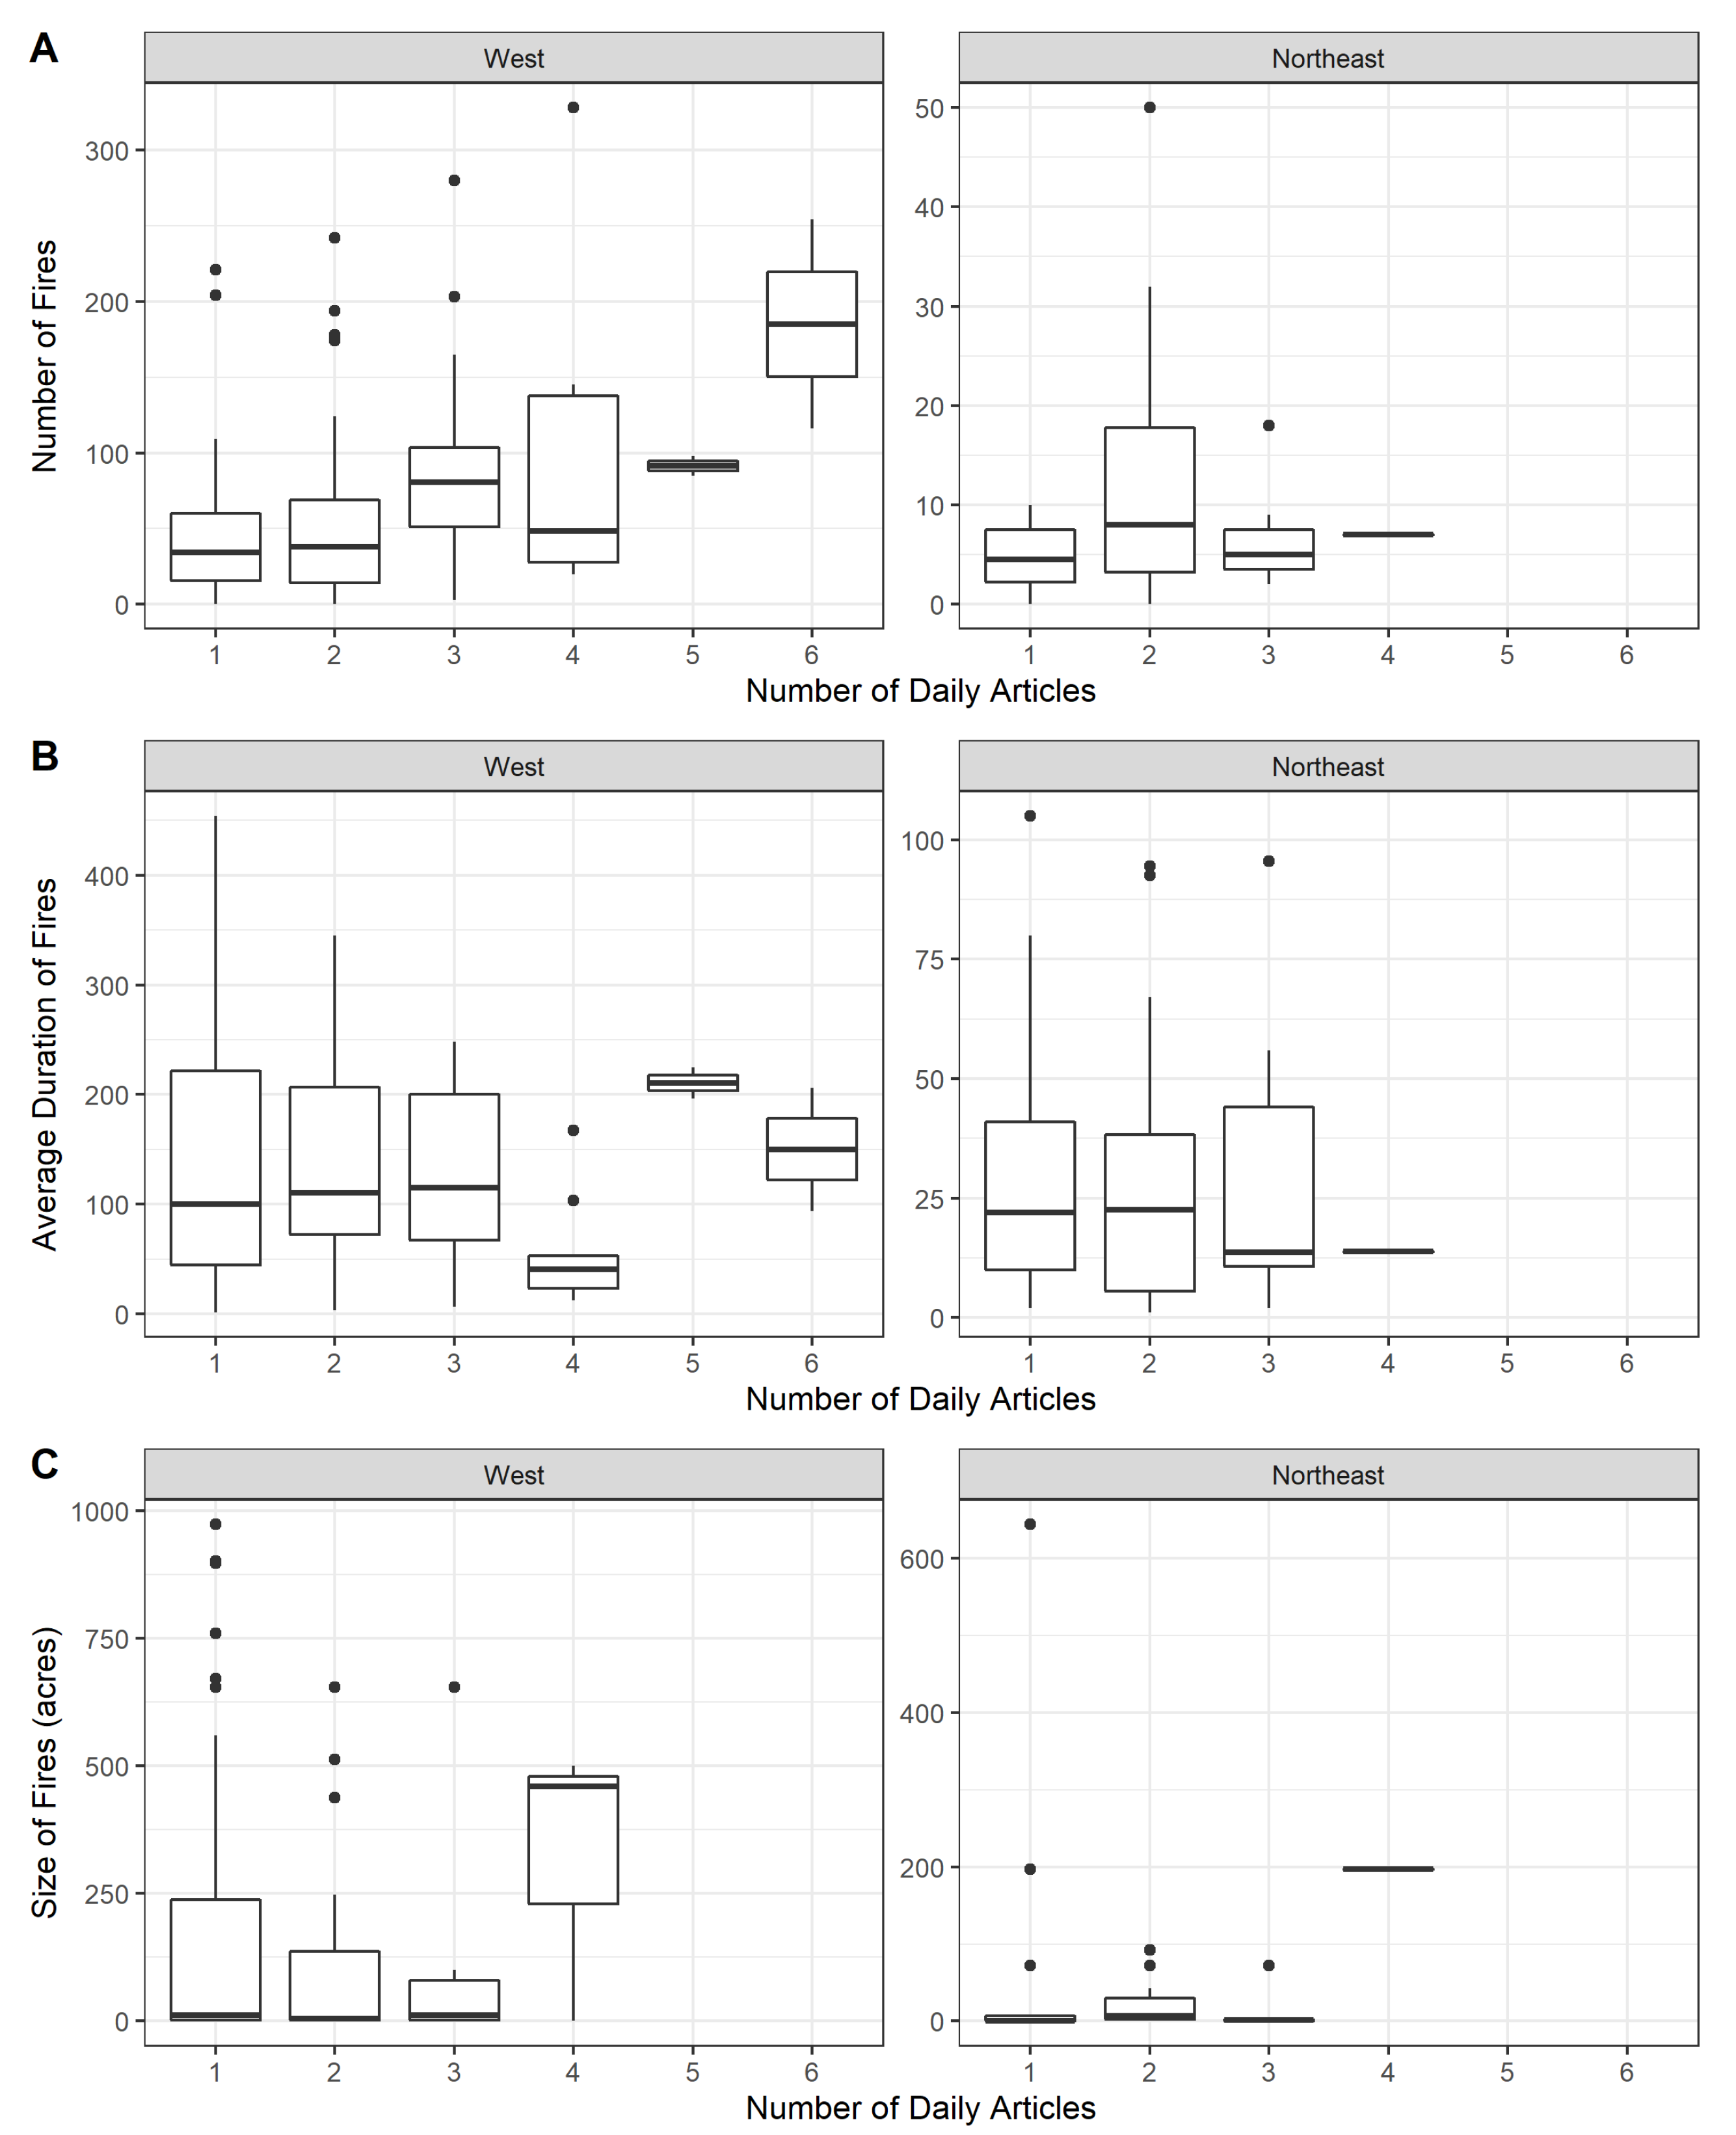
3.2. Fires and Hurricanes

A comparison of coverage with associated event metrics reveals different associations between fires and hurricanes (Table 1). The number of articles that discuss water issues during hurricanes correlates positively (more strongly and significantly) with all associated magnitude metrics, from disaster declarations to total events and event-related deaths and loss (Table 1). However, associations between fires and associated coverage show a weaker positive correlation with the number of events and total events and a weak negative correlation for event-related deaths and losses (Table 1). An evaluation of proximity relationships conducted at the state level shows that the weaker association for fires vs. hurricanes is also persistent at this spatial scale (Figure 5). The correlations between hurricane-related disaster declarations and hurricane coverage is generally higher (0.3 τ , 0.04 p-value), with states in the southeastern part of the country dominating both. Correlations for fire-related declarations and coverage are weaker (0.01 τ , 0.9 p-value), with disaster declarations dominating in Texas and California (Figure 5).

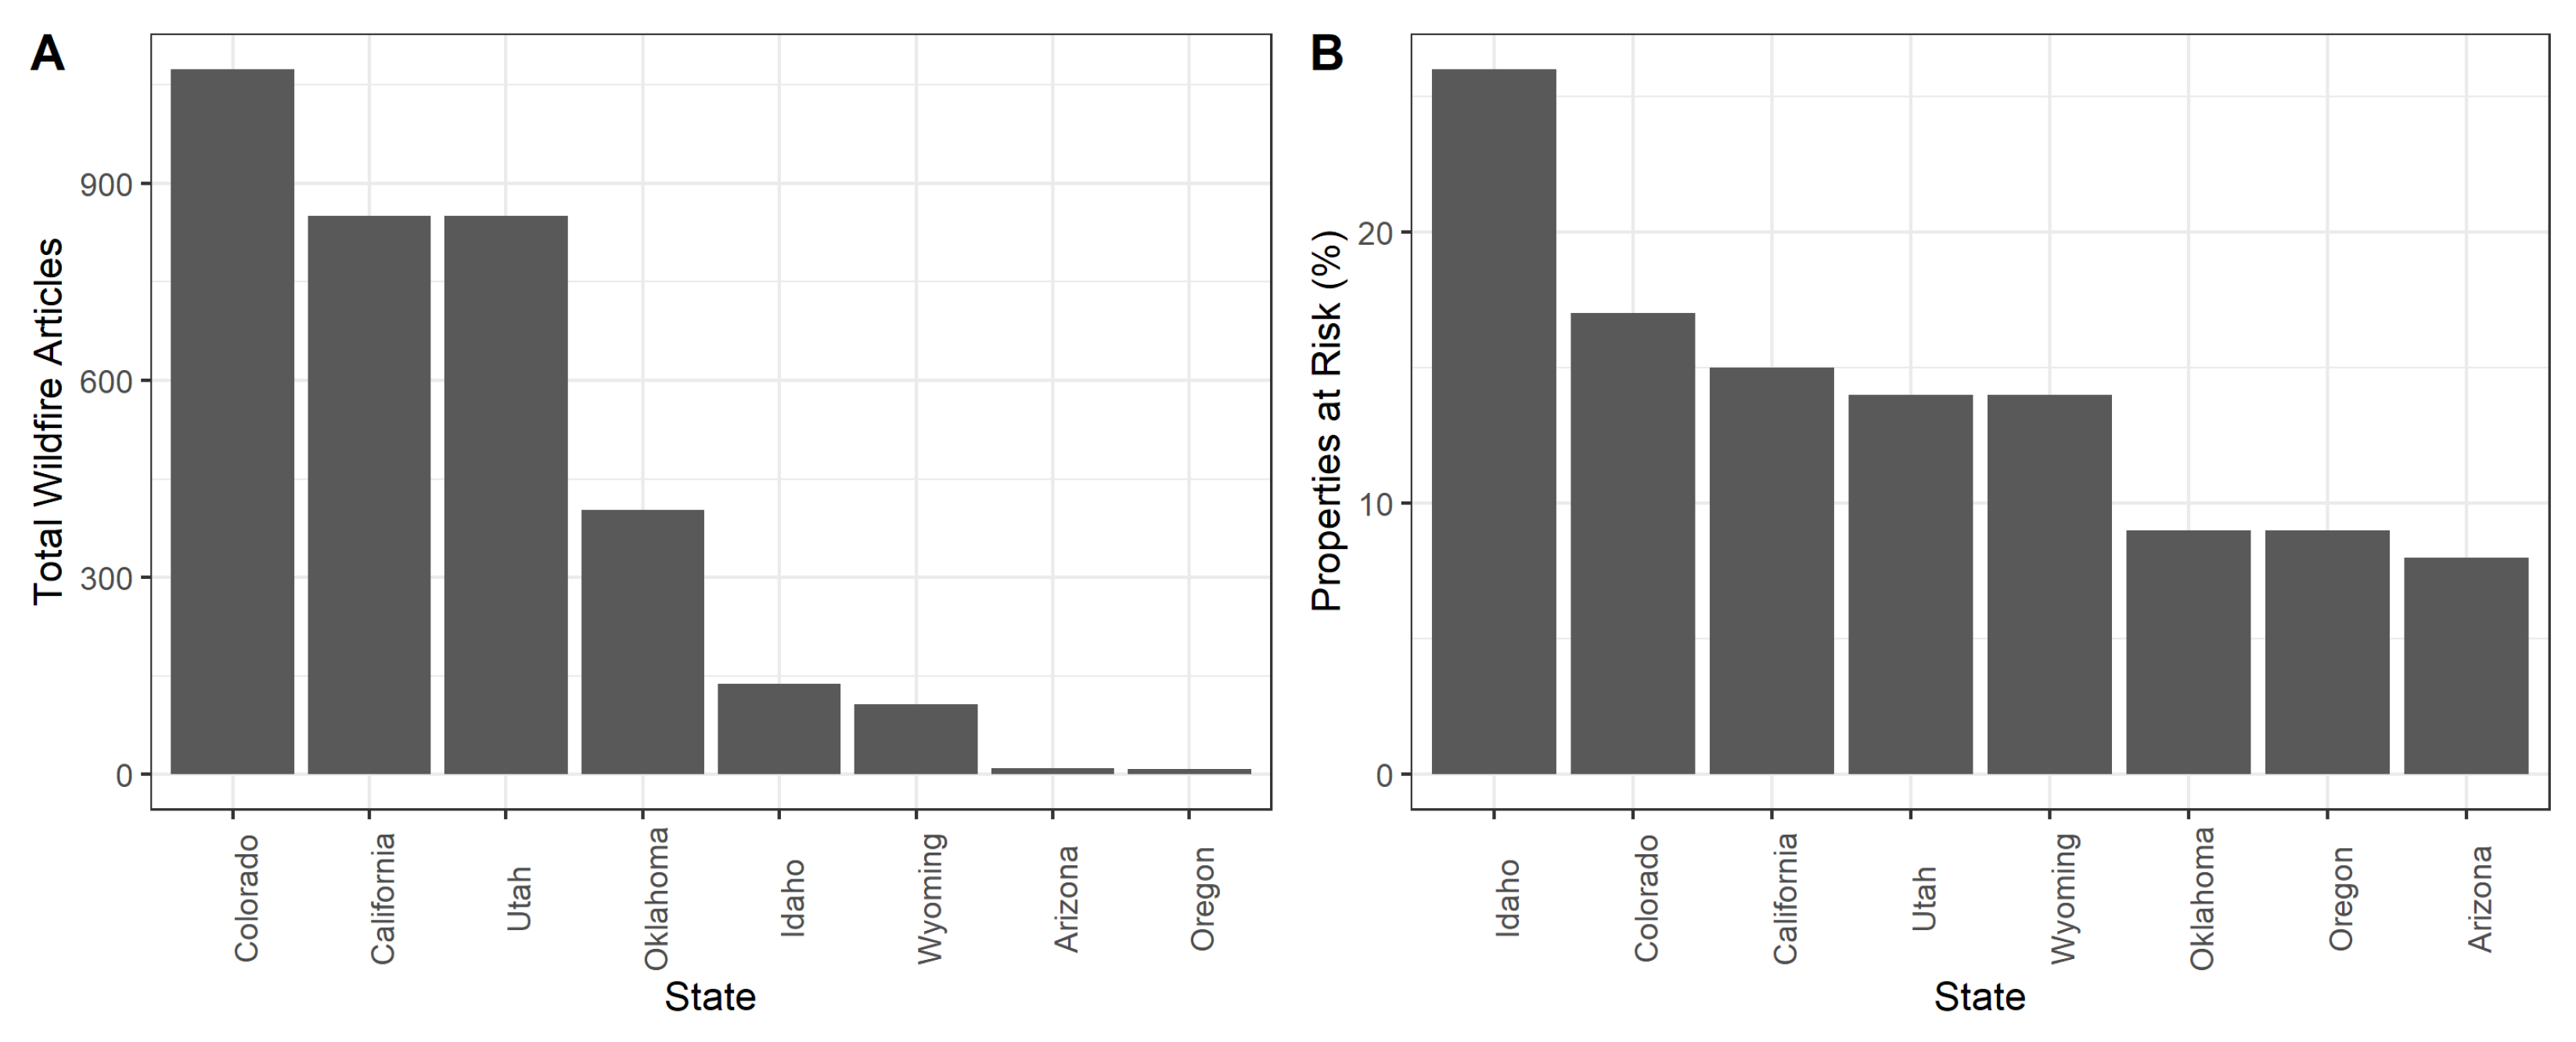
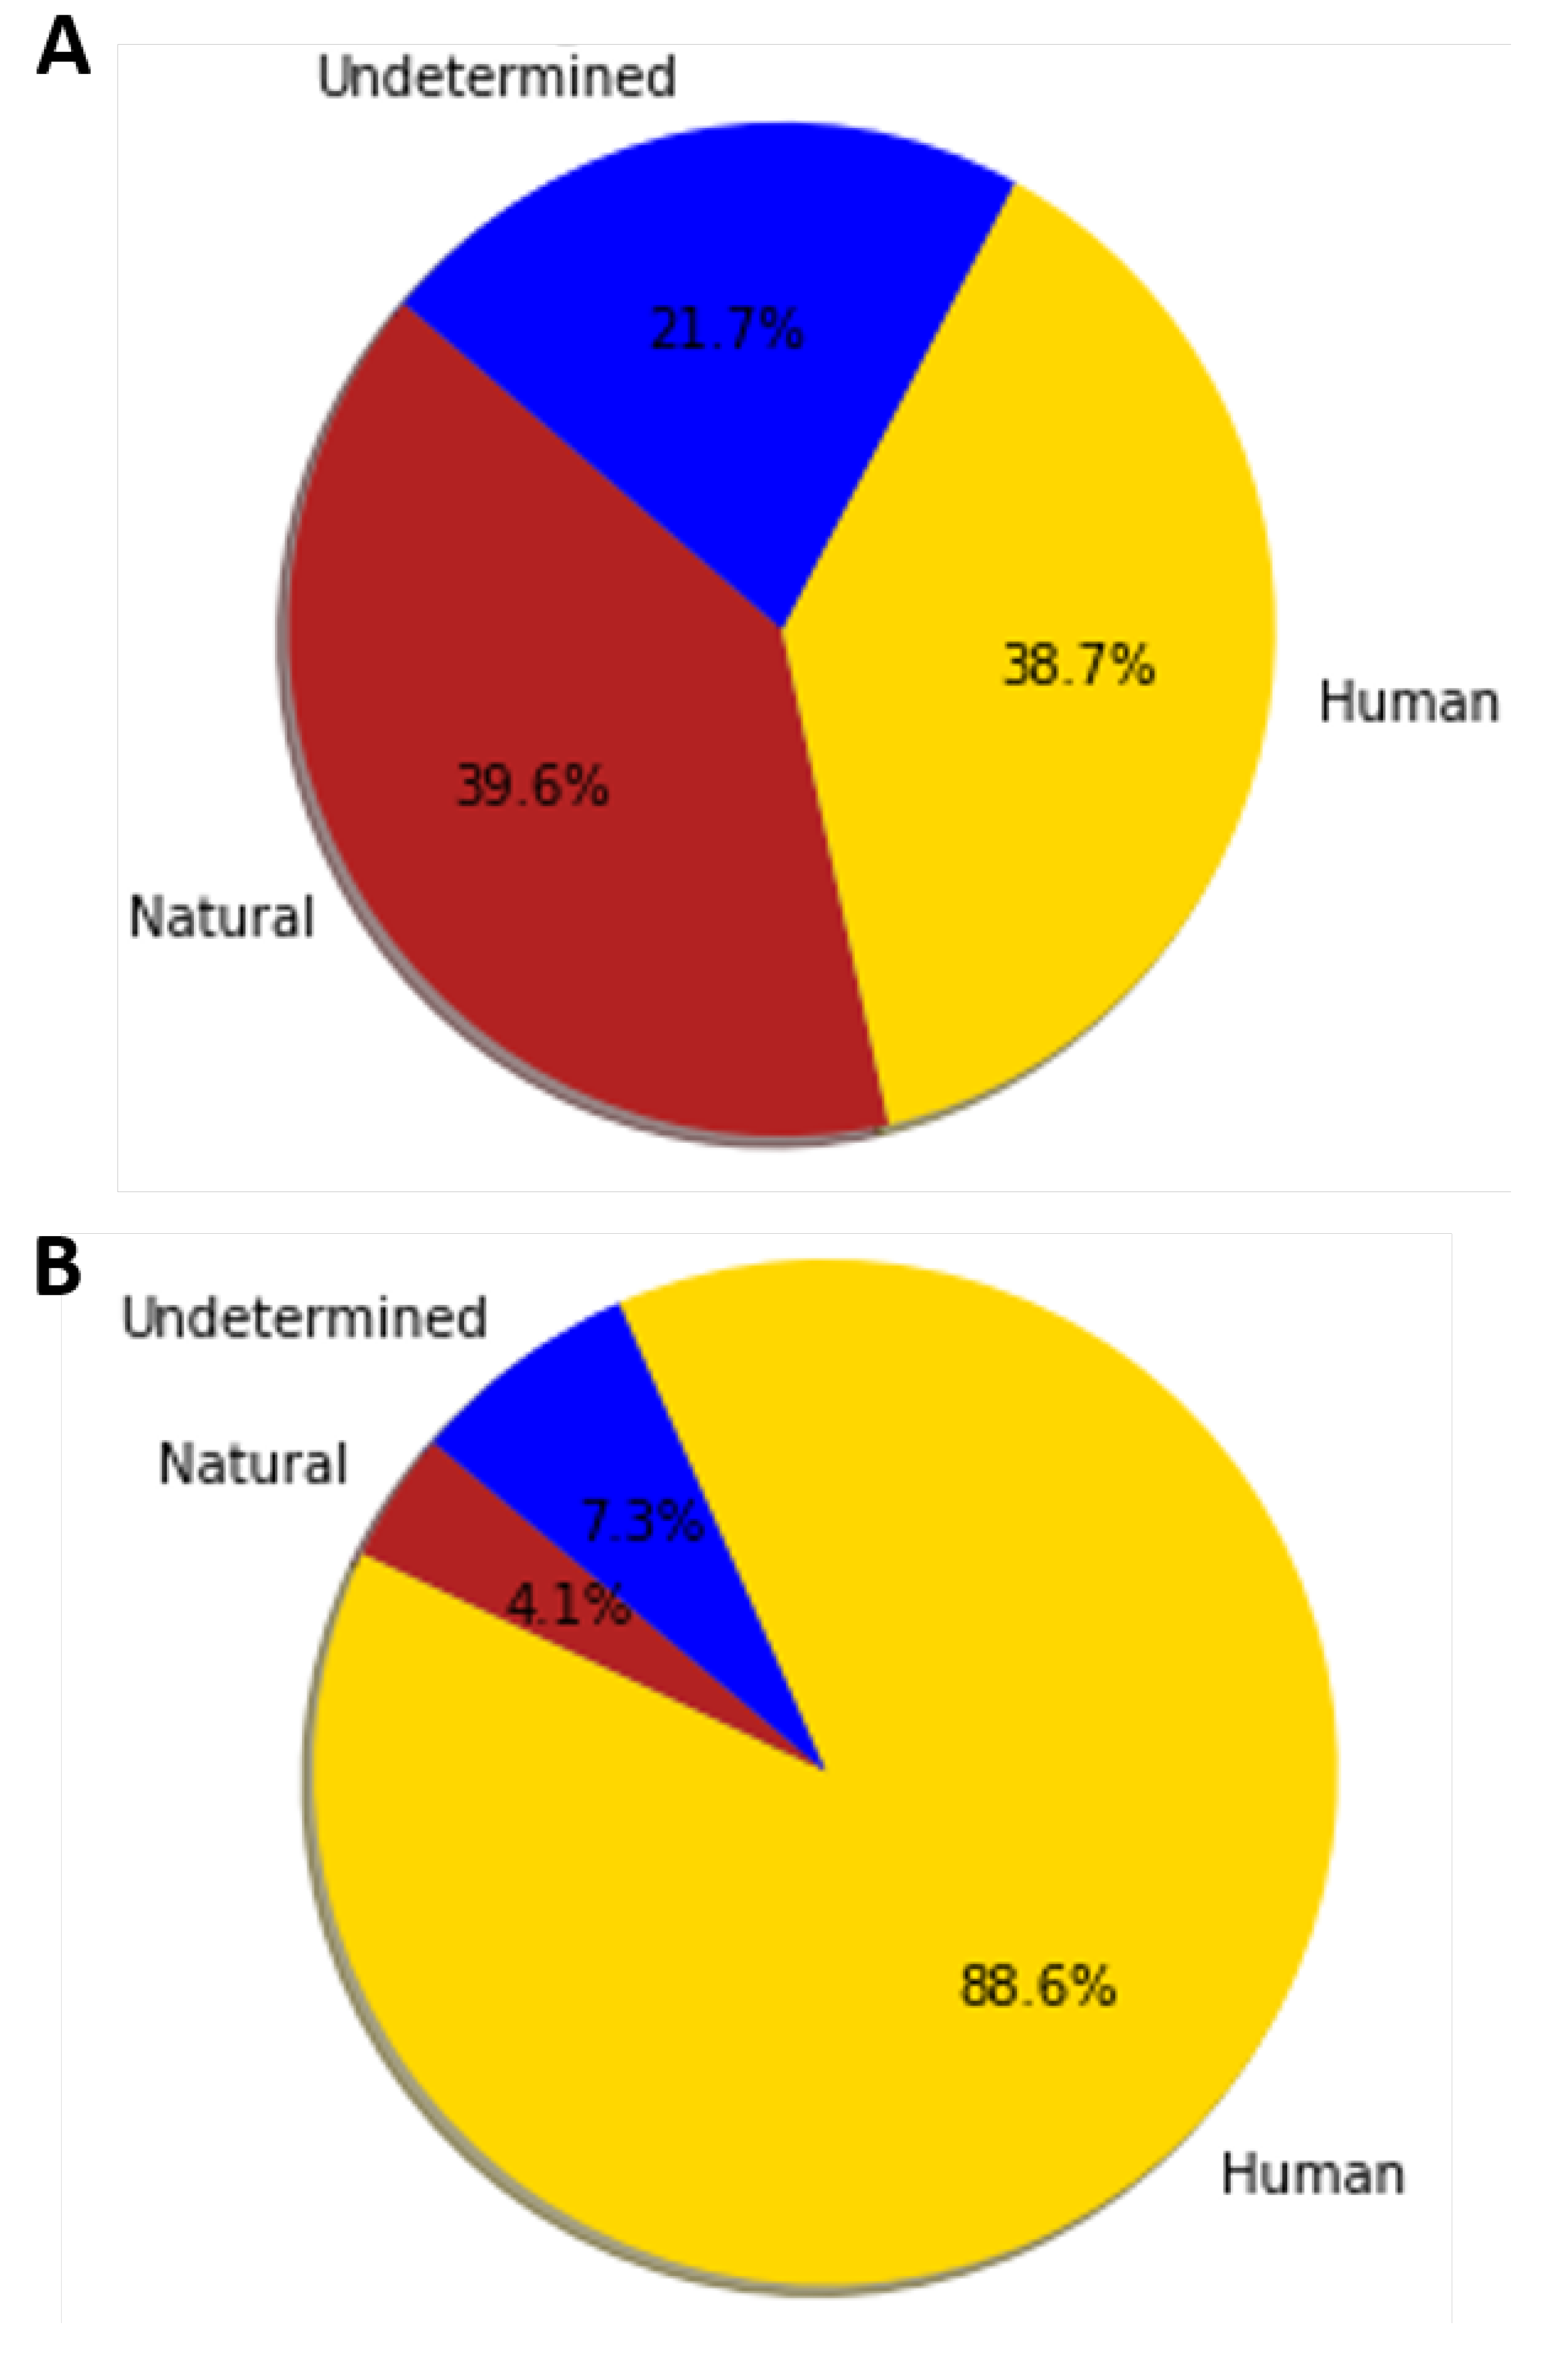
3.3. Wildfire Case Study

An evaluation of wildfire-related coverage and events in greater detail reveals significant regional variations. Generally, fires in the west are more frequent, occupy larger areas, last longer, are less prevalent in WUI, and are more likely to be declared as disasters (Table A2). Accordingly, the number of articles published increased with the number and average duration of wildfires in the west, more so than the northeast, while the size of the fires seemed to have more of a threshold effect in both regions (Figure A4). However, comparing wildfire coverage on a daily scale, as measured by article length, reveals a different picture. Daily coverage is negatively correlated with the number of wildfire events in the west, while it is positively correlated in the northeast (Table 2). Similarly, the number of wildfire events correlates positively with sentiment in the northeast (i.e., more wildfire articles are spoken about positively in this region) than in the west. Finally, in both regions, there is a tendency towards more positive sentiment for longer fires and in longer articles (Table 2).
Significant spatial clustering of fires is observed in some of the western counties; for example, there are hotspots in Arizona, southern California, and central Oregon for fire frequency (Figure 6 and Figure A7), while Ventura County in California and north-central Oregon emerge as hotspots for fire sizes (Figure A8). Another distinction between the regions is the underlying causes of the fires; more fires have human causes in the northeast than in the west (Figure A5). Spearman correlations at the state-level indicate that more properties are at risk for wildfires in the west (Figure A3); these states correlate strongly with the number of wildfire-related articles present ( ρ = 0.60, p-values: 0.17).
The coverage of wildfires in the west also encompasses a larger proportion of all fire-related coverage and follows a cyclical pattern (Figure 3 and Figure A1), with more concerns about water management (e.g., water districts and water rights) in the west (Figure A2). In contrast, the northeast has a lower proportion of wildfire-related coverage, but this has been increasing over time, especially over the last decade (Figure 3). Mapping the locations discussed in newspaper articles enables the evaluation of the global and regional areas of interest of each individual newspaper. Western papers tended to be very local in their focus on wildfires, with articles frequently discussing nearby areas (e.g., the Denver Post most frequently discusses fires in Denver, Colorado Springs, and Fort Collins; Figure 7A). Northeastern newspapers, on the other hand, discussed fire activities occurring across the nation (e.g., California; Figure 7B) as well as the world (e.g., in northern Africa and central Asia; Figure A6).

4. Discussion

By evaluating 32 newspapers from across 31 states, this study is one of the first large-scale, data-driven comparisons of media coverage for water-related natural disasters. A significant amount of the overall newspaper corpus, 24% of analyzed documents, indicates that water issues are often discussed in a disaster context in the media. This is unsurprising given that crises often prompt discussions about water resources in the United States (e.g., lead pollution in Flint, MI [61]). This study is one of the first to examine how the media portrays and examines water resource issues across fire and hurricane news coverage.
Magnitude and proximity are two known prominent “news values” that influence media coverage of natural disasters [25,40,62,63,64,65]—with prior research indicating a positive correlation between proximity and the amount of news coverage on an event (i.e., closer events garnering more coverage) [40,63,64] and magnitude (i.e., extremely deadly and damaging events and/or large scale events) getting more attention in the media [25,65]. Our analysis reveals, however, coverage patterns for water issues during fires and hurricanes are not equally connected to magnitude and proximity values. Although fires are discussed relatively more frequently (Figure 3), there is a consistent inverse relationship between fire event magnitudes and coverage (Table 1 and Figure 5). Coverage of water issues in relation to hurricanes, on the other hand, demonstrated a positive correlation with all associated event metrics (Table 1 and Figure 5). The economic impact appears to be a significant factor in influencing hurricane coverage; peak coverage occurred in 2005, coinciding with Hurricane Katrina (most damaging event in history), followed by 2017 (coinciding with Hurricanes Maria, Irma, and Harvey; all of which had high economic losses) [49].
The lack of significant positive correlations with national fire magnitude metrics could be attributed to multiple reasons, including fundamental differences in fire and hurricane risk perceptions stemming from varying personal experiences [66]. Namely, if not enough (individual) fires had a direct impact on people’s lives, this could render these events uninteresting to news agencies. The geospatial pattern exploration enabled by the wildfire case study indicates that this is likely the case. Although fires were more likely to be clustered together in the west and are often larger (Figure 6 and Figure A7), they could burn for thousands of acres without impacting a single structure or household; therefore, holding less interest to news organizations. In contrast, a majority of the fires in the northeast occurred in the WUI, which is consistent with land use in the area where it is rural land but still has structures on it. Readers care about events that occur close to them and have an impact on their lives or that of their community [39,46]. With less impact on human societies, fires in the west may not meet this social criterion. Furthermore, regions that experience high fire frequency may be accustomed to wildfire as part of the landscape and ingrained into the fabric of their daily lives. Therefore, shock-value and newness—two additional news values [39,46]—of a newspaper story may be lower, thus explaining why there is less attention paid to the fire issues in the west (at least based on article lengths, Table 2).
In addition to differences in exposures, underlying causal mechanisms of the natural disasters may also contribute to differences in media portrayals. Unlike hurricanes, fires can be attributed to both natural and human causes (Figure A5). The latter often leads to fires as being seen as a preventable tragedy in which there is often someone (or something) to blame [67,68,69,70,71]. This narrative extends to wildfires, which are often cast as a villain to be conquered while firefighters serve as valiant protagonists [67,68,69,70,71]. Although inconsistent with the general perceptions of the scientific community that fires support the sustainability of western wildlands [72], this "fire as a villain" perspective, coupled with the infrequent, yet the higher-impact nature of fires in the northeast could explain some of the regional and broader patterns observed in media coverage of this natural disaster (Table 2). Hurricane narratives, on the other hand, are more centered around “there is nothing we can do about it”, so discussion tends to be focused on survival, banding together, and recovery [73].
Although data availability constrained the analysis to only 10 years of data, non-parametric evaluation and consideration of multiple magnitude-related metrics indicate the robustness in our findings. Furthermore, these water-related coverage findings are consistent with general studies on fundamental differences in fire and hurricane risk perceptions [66], and tendencies of fire and wildfire media coverage to overlook sites of greatest loss [74]. For example, studies indicate that the media often fails to recognize that the frequency of wildfires is increasing [75,76,77,78]. Variations in drivers contributing to wildfires in the eastern and western have also been observed in biophysical analyses of the United States [79]. Additional datasets (across physical, social impacts, and newspaper content) would enable deeper exploration into narratives and associated drivers across platforms (newspapers vs. social media), as well as across scale (local vs. national newspapers), including entity interactions [80]. Logistical constraints delayed the analysis of the dataset after it was downloaded, so refreshing the dates of newspaper coverage is required in future work. In particular, additional analyses are warranted to understand nuances in coverage differences, for framing specific disaster events (e.g., 2018 California wildfires or COVID-19 impacts on resource management for natural disasters [81,82]), through spatial normalizations for understanding temporal patterns more clearly [50] and incorporation of social factors that could be influencing media coverage [59]. Updating the methods for sentiment analysis to include sentence-level details could also improve insights into how the construction of events with words is influencing meaning derived by a reader [55,56]. This study was also limited by reliance on a secondary database to collect newspaper content. Future research could expand the datasets considered by looking at additional news services (e.g., through web scraping of online news sources [83]) and including TV and social media platforms to evaluate public awareness of important water security topics [84].
Our comparative evaluation of water resources during fires and hurricanes is one of the first studies of its kind and contributes to growing social understanding of natural disaster responses [31,72,85]. Both fires and hurricanes are expected to grow worse under climate change, but this analysis indicates important implications for unequal media attention to fires vs. hurricanes. This is particularly problematic given the critical role that media coverage often focuses on disaster preparation and recovery [13,31,72,86]. Therefore, continued attention of the media coverage is warranted to understand the narratives surrounding natural disasters. These insights can inform emergency response and conservation behaviors, and ultimately, create safer communities in this changing climate [31].

5. Conclusions

Natural disasters are expected to increase in frequency and severity under climate change. Our study is one of the first to perform a large-scale, data-driven comparative analysis of how water resources are discussed during fires and hurricanes. Our findings reveal that while hurricanes follow media norms of increased coverage based on magnitude and proximity, fires (and wildfires) demonstrate weak and even negative associations between these events and associated coverage metrics. These patterns could be due to the relatively low exposure of population-dense areas, as well as the complex causal mechanisms of fires, which often give rise to the “fire as a villain” narrative. These findings highlight that media coverage of water issues during natural disasters are nuanced and requires ongoing research, especially across additional media platforms. Identifying primary drivers of coverage of these important issues will be important for advancing the understanding of coverage gaps and identifying opportunities for increasing public awareness and attention to these critical water security issues.

Supplementary Materials

Author Contributions

All authors were engaged in research conceptualization, assisted with the original draft writing, and reviewed/edited the draft. D.S. and L.T.J. led the literature review. H.E. and B.A. conducted the investigation and created visualizations. T.G. acquired funds and supervised the work. All authors have read and agreed to the published version of the manuscript.

Funding

This work was funded by the Laboratory Directed Research and Development program.

Institutional Review Board Statement

Not applicable.

Informed Consent Statement

Not applicable.

Data Availability Statement

Event magnitude data was procured from open source publications (see citations), while raw newspaper data is protected under a LexisNexis license. The processed datasets generated for this study analysis can be found within the article and Supplementary Information.

Acknowledgments

The authors would also like to thank Jonathan Gilligan, Heather Clark, Matthew Sweitzer, and Armida Carbajal for their assistance with this analysis. Sandia National Laboratories is a multimission laboratory managed and operated by National Technology and Engineering Solutions of Sandia LLC, a wholly-owned subsidiary of Honeywell International Inc. for the U.S. Department of Energy’s National Nuclear Security Administration under contract DE-NA0003525. The views expressed in the article do not necessarily represent the views of the U.S. Department of Energy or the United States Government.

Conflicts of Interest

The authors declare no conflict of interest.

Appendix A

Figure A1. Percent of relevant articles per source. An article was deemed relevant if it contained a key term—respectively, "fire", "hurricane", or "wildfire/wild fire".
Water 13 03655 g0a1
Figure A2. Bigrams of Wildfire Coverage. Issues regarding water management and districts are more prevalent in the western newspapers than the northeastern newspapers.
Water 13 03655 g0a2
Figure A3. Top States for Wildfire Coverage (A) vs. Wildfire Risk based on the percentage of properties at risk (B).
Water 13 03655 g0a3
Figure A4. Associations between coverage and number (A), duration (B), and size (C) of fires. More articles are generally published in the west (than the northeast) when there are more fires or the fires last longer while the size of fires seems to have a threshold effect, with a lot more articles being published in both regions when the fires are at least 200 acres.
Water 13 03655 g0a4
Figure A5. Causes of Wildfires between 2000 and 2018 for (A) the west and (B) northeast. More fires are due to natural causes in the eight cities analyzed for the west (A), while most fires are due to human causes in the eight cities analyzed for the northeast (B).
Water 13 03655 g0a5
Figure A6. Cities discussed in wildfire articles within Western (A) and Northeastern (B) Newspapers. Coverage in western newspapers is mostly concentrated in the west, while coverage in northeastern newspapers spans more across the U.S. and the globe.
Water 13 03655 g0a6
Figure A7. Spatial Autocorrelation of Fires by County. Spatial autocorrelation map for fire size (acres) indicated. Ventura County, CA, and counties in north-central Oregon have large fires and are surrounded by other counties that also have large fires.
Water 13 03655 g0a7
Figure A8. Plot of local Moran’s I, showing the fire frequency plotted against the spatial lag of fire frequency (the average value of fire frequency in areas considered neighbors (using queen’s weighting, the spatial lag value adjusts for observations being neighbors to one another, and thus, will influence each other such that the observed values are not independent, violating the assumption of uncorrelated error terms in ordinary least square regression). Overall, the trend is positive, indicating a geographic pattern of autocorrelation where high values are surrounded by other high values. Numbers indicate location IDs of counties.
Water 13 03655 g0a8
Table A1. Period of coverage available by newspaper; most sources overlapped from 1997 to 2017, which was the period of analysis for the natural disasters. Note: * indicates sources included in the wildfire case study.
SourceCoverage Start DateCoverage End Date
Arizona Capitol Times *2003-05-082017-12-15
Bangor Daily News *1994-06-292017-12-15
Brattleboro Reformer *2004-09-162017-12-15
Chapel Hill Herald1994-12-052017-04-25
Chicago Daily Herald1997-06-022017-12-15
Daily Journal of Commerce *2001-01-242017-12-15
Daily News *1995-02-022017-12-15
Dayton Daily News1993-12-032017-12-15
Deseret Morning News *1995-12-032017-12-15
Idaho Falls Post Register *1992-12-032017-12-15
Lincoln Journal Star1996-05-042011-07-28
Marin Independent Journal *2002-07-232017-12-15
Providence Journal *1982-12-022017-12-15
Richmond Times Dispatch1995-03-242017-12-15
San Bernardino Sun *2001-08-172017-12-15
South Bend Tribune1993-12-032017-12-15
Star Tribune1991-08-032017-12-15
Telegram & Gazette *1994-03-022017-12-15
Telegraph Herald1995-07-302017-12-15
The Atlanta Journal-Constitution1990-12-032017-12-15
The Augusta Chronicle1992-05-142017-12-15
The Austin American-Statesman1993-12-032017-12-15
The Baltimore Sun *1990-08-132017-12-15
The Bismarck Tribune1992-12-052017-12-15
The Capital Times1991-02-222017-12-15
The Charleston Gazette-Mail1993-12-042017-12-15
The Columbian *1994-04-272017-12-15
The Daily Oklahoman1982-07-012017-12-15
The Denver Post *1993-12-022017-12-15
The Hartford Courant *1991-05-042017-12-15
The Journal of Jefferson Parish2005-10-062008-06-15
The Morning Call *1983-12-082017-12-15
The Salt Lake Tribune1993-12-032017-08-28
The Santa Fe New Mexican1993-12-052013-05-24
The Tampa Tribune1990-09-132016-07-31
The Wyoming Tribune-Eagle1997-05-282017-10-14
Topeka Capital-Journal1997-12-042016-12-05
Table A2. Summary statistics of wildfire coverage and events. Generally, the west has more wildfire events and more media coverage than the northeast.
Annual AveragesNortheastWest
Disaster Declarations335
Number of Articles4.426.9
Article Length (1000 characters)22.311.4
Article Sentiment−0.03−0.03
Number of Wildfires138876
Fire Size (Acres)8.5211.9
Fire Duration (Days)4.28.1
Fire within WUI (%)43.413.1

References

  1. UN-Water. Water Security & the Global Water Agenda: A UN-Water Analytical Brief; UN-Water: Geneva, Switzerland, 2013. [Google Scholar]
  2. Baste, I.A.; Watson, R.T.; Brauman, K.I.; Samper, C.; Walzer, C. Making Peace with Nature: A Scientific Blueprint to Tackle the Climate, Biodiversity and Pollution Emergencies; United Nations Environment Programme: Nairobi, Kenya, 2021. [Google Scholar]
  3. Van Aalst, M.K. The impacts of climate change on the risk of natural disasters. Disasters 2006, 30, 5–18. [Google Scholar] [CrossRef] [PubMed]
  4. Mackay, A. Climate change 2007: Impacts, adaptation and vulnerability. Contribution of Working Group II to the fourth assessment report of the Intergovernmental Panel on Climate Change. J. Environ. Qual. 2008, 37, 2407. [Google Scholar] [CrossRef]
  5. The Intergovernmental Panel on Climate Change. Managing the Risks of Extreme Events and Disasters to Advance Climate Change Adaptation; Technical Report; IPCC: Geneva, Switzerland, 2012. [Google Scholar]
  6. Coronese, M.; Lamperti, F.; Keller, K.; Chiaromonte, F.; Roventini, A. Evidence for sharp increase in the economic damages of extreme natural disasters. Proc. Natl. Acad. Sci. USA 2019, 116, 21450–21455. [Google Scholar] [CrossRef] [Green Version]
  7. Norris, F.H. Methods for Disaster Mental Health Research; Guilford Press: New York, NY, USA, 2006. [Google Scholar]
  8. Jenicek, E.M.; Garfinkle, N.W.; Heath, V.E.; Miller, L.; Mithaiwala, M.; Rodriguez, A.T.; Takov, D. Water security scenarios: Planning for installation water disruptions. Environ. Sci. 2020. [Google Scholar] [CrossRef]
  9. Gopalakrishnan, C. Water and disasters: A review and analysis of policy aspects. Int. J. Water Resour. Dev. 2013, 29, 250–271. [Google Scholar] [CrossRef]
  10. Bin, O.; Polasky, S. Effects of flood hazards on property values: Evidence before and after Hurricane Floyd. Land Econ. 2004, 80, 490–500. [Google Scholar] [CrossRef]
  11. Hallema, D.W.; Robinne, F.N.; Bladon, K.D. Reframing the challenge of global wildfire threats to water supplies. Earth’s Future 2018, 6, 772–776. [Google Scholar] [CrossRef]
  12. Loecke, T.D.; Burgin, A.J.; Riveros-Iregui, D.A.; Ward, A.S.; Thomas, S.A.; Davis, C.A.; Clair, M.A.S. Weather whiplash in agricultural regions drives deterioration of water quality. Biogeochemistry 2017, 133, 7–15. [Google Scholar] [CrossRef] [Green Version]
  13. Houston, J.B.; Pfefferbaum, B.; Rosenholtz, C. Disaster News. J. Mass Commun. Q. 2012, 89, 606–623. [Google Scholar] [CrossRef]
  14. Quarantelli, E.L. Lessons from Research: Findings on Mass Communication System Behavior in the Pre, Trans, and Postimpact Periods of Disasters; Technical Report; Disaster Research Center: Newark, DE, USA, 1991. [Google Scholar]
  15. Pantti, M.; Wahl-Jorgensen, K.; Cottle, S. Disasters and the Media; Peter Lang: Bern, Switzerland, 2012. [Google Scholar]
  16. Norris, F.H.; Stevens, S.P.; Pfefferbaum, B.; Wyche, K.F.; Pfefferbaum, R.L. Community resilience as a metaphor, theory, set of capacities, and strategy for disaster readiness. Am. J. Community Psychol. 2008, 41, 127–150. [Google Scholar] [CrossRef]
  17. Houston, J.B. Bouncing forward: Assessing advances in community resilience assessment, intervention, and theory to guide future work. Am. J. Public Health 2015, 103, 1181–1189. [Google Scholar] [CrossRef]
  18. Houston, J.B. Public disaster mental/behavioral health communication: Intervention across disaster phases. J. Emerg. Manag. 2012, 10, 283–292. [Google Scholar] [CrossRef]
  19. Quesnel, K.J.; Ajami, N.K. Changes in water consumption linked to heavy news media coverage of extreme climatic events. Sci. Adv. 2017, 3, e1700784. [Google Scholar] [CrossRef] [Green Version]
  20. Bernacchi, L.A.; Fernandez-Bou, A.; Viers, J.H.; Valero, J.; Medellín-Azuara, J. A glass half empty: Limited voices, limited groundwater security for California. Sci. Total Environ. 2020, 738, 139529. [Google Scholar] [CrossRef]
  21. Crow, D.A.; Berggren, J.; Lawhon, L.A.; Koebele, E.A.; Kroepsch, A.; Huda, J. Local media coverage of wildfire disasters: An analysis of problems and solutions in policy narratives. Environ. Plan. C Politics Space 2017, 35, 849–871. [Google Scholar] [CrossRef]
  22. Ader, C.R. A longitudinal study of agenda setting for the issue of environmental pollution. J. Mass Commun. Q. 1995, 72, 300–311. [Google Scholar] [CrossRef]
  23. Joye, S. The hierarchy of global suffering: A critical discourse analysis of television news reporting on foreign natural disasters. J. Int. Commun. 2009, 15, 45–61. [Google Scholar] [CrossRef]
  24. Goltz, J.D. Are the news media responsible for the disaster myths? A content analysis of emergency response imagery. Int. J. Mass Emergencies Disasters 1984, 2, 345–368. [Google Scholar]
  25. Adams, W.C. TV coverage of natural disasters. Telev. Crit. Concepts Media Cult. Stud. 2003, 2, 153. [Google Scholar]
  26. Yell, S. Natural disaster news and communities of feeling: The affective interpellation of local and global publics. Soc. Semiot. 2012, 22, 409–428. [Google Scholar] [CrossRef]
  27. Murthy, D. New media and natural disasters: Blogs and the 2004 Indian Ocean tsunami. Inf. Commun. Soc. 2013, 16, 1176–1192. [Google Scholar] [CrossRef]
  28. Fu, K.W.; Zhou, L.; Zhang, Q.; Chan, Y.Y.; Burkhart, F. Newspaper coverage of emergency response and government responsibility in domestic natural disasters: China-US and within-China comparisons. Health Risk Soc. 2012, 14, 71–85. [Google Scholar] [CrossRef]
  29. Sommers, S.R.; Apfelbaum, E.P.; Dukes, K.N.; Toosi, N.; Wang, E.J. Race and media coverage of Hurricane Katrina: Analysis, implications, and future research questions. Anal. Soc. Issues Public Policy 2006, 6, 39–55. [Google Scholar] [CrossRef]
  30. Fahmy, S.; Kelly, J.D.; Kim, Y.S. What Katrina revealed: A visual analysis of the hurricane coverage by news wires and US newspapers. J. Mass Commun. Q. 2007, 84, 546–561. [Google Scholar] [CrossRef]
  31. Paveglio, T.; Norton, T.; Carroll, M.S. Fanning the flames? Media coverage during wildfire events and its relation to broader societal understandings of the hazard. Hum. Ecol. Rev. 2011, 18, 41–52. [Google Scholar]
  32. Mercer, D.; Prisbrey, D. Vigilant geography: Newspaper coverage of a wildfire at the Hanford Nuclear Site. Environ. Pract. 2004, 6, 247–256. [Google Scholar] [CrossRef]
  33. Garcia, M.; Koebele, E.; Deslatte, A.; Ernst, K.; Manago, K.F.; Treuer, G. Towards urban water sustainability: Analyzing management transitions in Miami, Las Vegas, and Los Angeles. Glob. Environ. Chang. 2019, 58, 101967. [Google Scholar] [CrossRef]
  34. Martin, D.A. At the nexus of fire, water and society. Philos. Trans. R. Soc. B Biol. Sci. 2016, 371, 20150172. [Google Scholar] [CrossRef] [Green Version]
  35. Insurance Information Institute. Facts + Statistics: Wildfires. 2020. Available online: https://www.iii.org/fact-statistic/facts-statistics-wildfires (accessed on 30 June 2020).
  36. Cal Fire. Top 20 Deadliest California Wild-Fires; Fact Sheet; CAL Fire: British Columbia, CA, USA, 2019. [Google Scholar]
  37. Payne, E. 2018 Atlantic Hurricane Season: The year of Florence and Michael. 2018. Available online: https://www.noaa.gov/media-release/destructive-2018-atlantic-hurricane-season-draws-to-end (accessed on 28 November 2018).
  38. Insurance Information Institute. Facts + Statistics: Hurricanes. 2020. Available online: https://www.iii.org/fact-statistic/facts-statistics-hurricanes (accessed on 30 June 2020).
  39. Caple, H.; Bednarek, M. Delving into the Discourse: Approaches to News Values in Journalism Studies and Beyond; Technical Report; 2013; Available online: https://ora.ox.ac.uk/objects/uuid:1f5c6d91-bb1f-4278-a160-66149ecfb36b (accessed on 12 December 2021).
  40. Yan, Y.; Bissell, K. The sky is falling: Predictors of news coverage of natural disasters worldwide. Commun. Res. 2018, 45, 862–886. [Google Scholar] [CrossRef]
  41. Gunda, T.; Sweitzer, M.D.; Comer, K.T.; Finn, C.; Murillo-Sandoval, S.; Huff, J. Evolution of Water Narratives in Local US Newspapers: A Case Study of Utah and Georgia; Technical Report; Sandia National Lab. (SNL-NM): Albuquerque, NM, USA, 2018. [Google Scholar]
  42. Gao, Y.; Xu, Y.; Li, Y. Pattern-based topic models for information filtering. In Proceedings of the 2013 IEEE 13th International Conference on Data Mining Workshops, Dallas, TX, USA, 7–10 December 2013; pp. 921–928. [Google Scholar]
  43. Jackson, N.D.; Gunda, T. Evaluation of extreme weather impacts on utility-scale photovoltaic plant performance in the United States. Appl. Energy 2021, 302, 117508. [Google Scholar] [CrossRef]
  44. Silge, J.; Robinson, D. tidytext: Text mining and analysis using tidy data principles in R. J. Open Source Softw. 2016, 1, 37. [Google Scholar] [CrossRef] [Green Version]
  45. Pielke, R.A., Jr.; Landsea, C.W. Normalized hurricane damages in the United States: 1925–95. Weather. Forecast. 1998, 13, 621–631. [Google Scholar] [CrossRef]
  46. Galtung, J.; Ruge, M.H. The structure of foreign news: The presentation of the Congo, Cuba and Cyprus crises in four Norwegian newspapers. J. Peace Res. 1965, 2, 64–90. [Google Scholar] [CrossRef]
  47. FEMA. OpenFEMA Dataset: Disaster Declarations Summaries-V1. 2020. Available online: https://www.fema.gov/api/open/v1/DisasterDeclarationsSummaries.csv (accessed on 22 July 2020).
  48. FEMA. Fire Data and Analysis Tools. 2020. Available online: https://www.usfa.fema.gov/downloads/xls/statistics/us_fire_loss_data_sets_2008-2017.xlsx (accessed on 22 July 2020).
  49. National Oceanic and Atmospheric Administration. Hurricane Costs. 2020. Available online: https://coast.noaa.gov/states/fast-facts/hurricane-costs.html (accessed on 30 June 2020).
  50. Grinsted, A.; Ditlevsen, P.; Christensen, J.H. Normalized US hurricane damage estimates using area of total destruction, 1900–2018. Proc. Natl. Acad. Sci. USA 2019, 116, 23942–23946. [Google Scholar] [CrossRef]
  51. Abdi, H. The Kendall rank correlation coefficient. In Encyclopedia of Measurement and Statistics; Sage: Thousand Oaks, CA, USA, 2007; pp. 508–510. [Google Scholar]
  52. Halsey, L.G.; Curran-Everett, D.; Vowler, S.L.; Drummond, G.B. The fickle p value generates irreproducible results. Nat. Methods 2015, 12, 179–185. [Google Scholar] [CrossRef] [PubMed]
  53. IRWIN. Office of Wildland Fire. 2020. Available online: https://www.doi.gov/wildlandfire/wfit (accessed on 30 June 2020).
  54. Martinuzzi, S.; Stewart, S.I.; Helmers, D.P.; Mockrin, M.H.; Hammer, R.B.; Radeloff, V.C. The 2010 Wildland-Urban Interface of the Conterminous United States; Research Map NRS-8; US Department of Agriculture, Forest Service, Northern Research Station: Newtown Square, PA, USA, 2015; Volume 8, pp. 1–124.
  55. Chong, D.; Druckman, J.N. A theory of framing and opinion formation in competitive elite environments. J. Commun. 2007, 57, 99–118. [Google Scholar] [CrossRef]
  56. Entman, R.M. Framing: Toward clarification of a fractured paradigm. J. Commun. 1993, 43, 51–58. [Google Scholar] [CrossRef]
  57. Hu, M.; Liu, B. Mining and summarizing customer reviews. In Proceedings of the Tenth ACM SIGKDD International Conference on Knowledge Discovery and Data Mining; ACM: New York, NY, USA, 2004; pp. 168–177. [Google Scholar]
  58. Zhang, C.; Luo, L.; Xu, W.; Ledwith, V. Use of local Moran’s I and GIS to identify pollution hotspots of Pb in urban soils of Galway, Ireland. Sci. Total Environ. 2008, 398, 212–221. [Google Scholar] [CrossRef]
  59. Dalli, A. System for spatio-temporal analysis of online news and blogs. In Proceedings of the 15th international conference on World Wide Web, Scotland, UK, 23–26 May 2006; pp. 929–930. [Google Scholar]
  60. Haklay, M.; Weber, P. Openstreetmap: User-generated street maps. IEEE Pervasive Comput. 2008, 7, 12–18. [Google Scholar] [CrossRef] [Green Version]
  61. Butler, L.J.; Scammell, M.K.; Benson, E.B. The Flint, Michigan, water crisis: A case study in regulatory failure and environmental injustice. Environ. Justice 2016, 9, 93–97. [Google Scholar] [CrossRef]
  62. Schaudt, S.; Carpenter, S. The News That’s Fit to Click: An Analysis of Online News Values and Preferences Present in the Most-viewed Stories on azcentral. com. Southwest Mass Commun. J. 2009, 24, 17–26. [Google Scholar]
  63. Buckman, R.T. How eight weekly newsmagazines covered elections in six countries. J. Q. 1993, 70, 780–792. [Google Scholar] [CrossRef]
  64. Wu, H.D. Geographic distance and US newspaper coverage of Canada and Mexico. Gazette 1998, 60, 253–263. [Google Scholar] [CrossRef]
  65. Rosengren, K.E. International news: Methods, data and theory. J. Peace Res. 1974, 11, 145–156. [Google Scholar] [CrossRef]
  66. Newman, S.M.; Carroll, M.S.; Jakes, P.J.; Williams, D.R.; Higgins, L.L. Earth, wind, and fire: Wildfire risk perceptions in a hurricane-prone environment. Soc. Nat. Resour. 2014, 27, 1161–1176. [Google Scholar] [CrossRef]
  67. Graham, A. How Journalists Fan the Flames of Wildfire in the West. 2015. Available online: http://mjr.jour.umt.edu/how-journalists-fan-the-flames-of-wildfire-in-the-west/ (accessed on 12 April 2020).
  68. Jacobson, S.K.; Monroe, M.C.; Marynowski, S. Fire at the wildland interface: The influence of experience and mass media on public knowledge, attitudes, and behavioral intentions. Wildl. Soc. Bull. 2001, 29, 929–937. [Google Scholar]
  69. Toman, E.; Stidham, M.; McCaffrey, S.; Shindler, B. Social Science at the Wildland-Urban Interface: A Compendium of Research Results to Create Fire-Adapted Communities; General Technical Report NRS-111; US Department of Agriculture, Forest Service, Northern Research Station: Newtown Square, PA, USA, 2013.
  70. Walter, G.; Reisner, A. Student opinion formation on animal agriculture issues. J. Anim. Sci. 1994, 72, 1654–1658. [Google Scholar] [CrossRef]
  71. Frick, M.J.; Birkenholz, R.J.; Machtmes, K. Rural and urban adult knowledge and perceptions of agriculture. J. Agric. Educ. 1995, 36, 44–53. [Google Scholar] [CrossRef]
  72. Morehouse, B.J.; Sonnett, J. Narratives of wildfire: Coverage in four US newspapers, 1999–2003. Organ. Environ. 2010, 23, 379–397. [Google Scholar] [CrossRef]
  73. Miller, A.; Goidel, R. News organizations and information gathering during a natural disaster: Lessons from Hurricane Katrina. J. Contingencies Crisis Manag. 2009, 17, 266–273. [Google Scholar] [CrossRef]
  74. Cordner, A.; Schwartz, E. Covering wildfires: Media emphasis and silence after the Carlton and Okanogan complex wildfires. Soc. Nat. Resour. 2019, 32, 489–507. [Google Scholar] [CrossRef]
  75. Kroepsch, A.; Koebele, E.A.; Crow, D.A.; Berggren, J.; Huda, J.; Lawhon, L.A. Remembering the past, anticipating the future: Community learning and adaptation discourse in media commemorations of catastrophic wildfires in Colorado. Environ. Commun. 2018, 12, 132–147. [Google Scholar] [CrossRef]
  76. Ashlin, A.; Ladle, R.J. ‘Natural disasters’ and newspapers: Post-tsunami environmental discourse. Environ. Hazards 2007, 7, 330–341. [Google Scholar] [CrossRef]
  77. Bohensky, E.L.; Leitch, A.M. Framing the flood: A media analysis of themes of resilience in the 2011 Brisbane flood. Reg. Environ. Chang. 2014, 14, 475–488. [Google Scholar] [CrossRef] [Green Version]
  78. Robinson, S. We were all there’: Remembering America in the anniversary coverage of Hurricane Katrina. Mem. Stud. 2009, 2, 235–253. [Google Scholar] [CrossRef]
  79. Wang, S.S.C.; Qian, Y.; Leung, L.R.; Zhang, Y. Identifying key drivers of wildfires in the contiguous US using machine learning and game theory interpretation. Earth’s Future 2021, 9, e2020EF001910. [Google Scholar] [CrossRef] [PubMed]
  80. Murphy, J.T.; Ozik, J.; Collier, N.T.; Altaweel, M.; Lammers, R.B.; Kliskey, A.; Alessa, L.; Cason, D.; Williams, P. Water relationships in the US southwest: Characterizing water management networks using natural language processing. Water 2014, 6, 1601–1641. [Google Scholar] [CrossRef] [Green Version]
  81. Rothberg, D. Close Quarters, Limited Resources: Officials See Coronavirus as New Threat in Fighting Fires. 2020. Available online: https://thenevadaindependent.com/article/close-quarters-limited-resources-officials-see-coronavirus-as-new-threat-in-fighting-fires (accessed on 12 December 2021).
  82. Van Gorp, B. The constructionist approach to framing: Bringing culture back in. J. Commun. 2007, 57, 60–78. [Google Scholar]
  83. McClain, J.T.; Rothganger, F.H.; Trumbo, D.; Warrender, C.E. An Image/Text Fusion Algorithm for Intelligent Web Crawling; Technical Report; Sandia National Lab. (SNL-NM): Albuquerque, NM, USA, 2013. [Google Scholar]
  84. Mavrodieva, A.V.; Rachman, O.K.; Harahap, V.B.; Shaw, R. Role of social media as a soft power tool in raising public awareness and engagement in addressing climate change. Climate 2019, 7, 122. [Google Scholar] [CrossRef] [Green Version]
  85. Farber, D.A.; Chen, J. Disasters and the Law: Katrina and Beyond; Aspen Publishers: New York, NY, USA, 2006. [Google Scholar]
  86. Wang, Z.; Jusup, M.; Guo, H.; Shi, L.; Geček, S.; Anand, M.; Perc, M.; Bauch, C.T.; Kurths, J.; Boccaletti, S.; et al. Communicating sentiment and outlook reverses inaction against collective risks. Proc. Natl. Acad. Sci. USA 2020, 117, 17650–17655. [Google Scholar] [CrossRef]
Figure 1. Overview of the data types and analytical methods used in this study. Correlations for fire and hurricane data were conducted at the annual time scale and state-level spatial scale due to data limitations. The wildfire case study enables extensions of these insights to look at finer resolutions at the daily time scale and county-/city-level spatial scales.
Water 13 03655 g001
Figure 2. Map of Newspaper Articles. Newspaper sources were constrained by the availability of associated articles through the LexisNexis database.
Water 13 03655 g002
Figure 3. Annual Disaster Coverage Over Time. More articles were published for fires than hurricanes (A), while regional variations in coverage are observed in wildfire-related coverage (as a percentage of fire articles) (B).
Water 13 03655 g003
Figure 4. Top 10 Water Concerns during Fires (A) and Hurricanes (B). Water quality issues are more prominent for fires, while food and water issues are more prevalent during hurricanes.
Water 13 03655 g004
Figure 5. State-Level Proximity Associations for (A) Fires and (B) Hurricanes. Point labels indicate two-letter state abbreviations. Hurricane-related declarations and coverage have a higher correlation (0.3 τ , 0.04 p-value) than fire-related declarations and coverage (0.01 τ , 0.9 p-value).
Water 13 03655 g005
Figure 6. Spatial Autocorrelation of Fires by County. Spatial autocorrelation results show high fire frequency values surrounded by other high fire frequencies in the hotspots shown in teal (local indicator of spatial association (LISA)). The Local Moran’s I is 0.09, indicating that counties with high fire frequency are surrounded by other counties with high fire frequency ( p < 0.05). There were no significant coldspots (low–low correlations) or mixed high–low or low–high correlations found.
Water 13 03655 g006
Figure 7. Top five cities mentioned by Newspapers in the (A) west and (B) northeast.
Water 13 03655 g007
Table 1. Correlations between Coverage and Disaster Events. Analysis was conducted for 10 years, from 2008 to 2017. Values represent Kendall correlation values: τ , with p-values in parentheses.
MetricHurricanesFires
Disaster Declarations0.56 (0.03)0.16 (0.60)
Total Events0.36 (0.18)0.16 (0.60)
Event-Related Deaths0.45 (0.07)−0.07 (0.79)
Event-Related Loss0.52 (0.13)−0.20 (0.48)
Table 2. Correlations between Wildfire Events and Coverage at a Daily Scale. Analysis conducted for 28000 (west) and 13000 (NE) records from 2014 to 2017. Values represent Kendall correlation-values: τ , with p-values in parentheses. Newspapers in the west trend towards less coverage and negative sentiment than the northeast newspapers. Correlations with fire size were not conducted due to missing values.
WestNortheast
Number of Wildfires vs. Article Length−0.08 (0.00)0.15 (0.00)
Number of Wildfires vs. Article Sentiment−0.08 (0.00)0.02 (0.52)
Wildfire Duration vs. Article Length−0.13 (0.035)0.04 (0.60)
Wildfire Duration vs. Article Sentiment0.04 (0.080)0.05 (0.51)
Article Length vs. Article Sentiment0.04 (0.08)0.14 (0.00)
Publisher’s Note: MDPI stays neutral with regard to jurisdictional claims in published maps and institutional affiliations.

