
Remote Triggering of Damage Followed by Healing Recorded in Groundwater Pressure


Geological Survey of Israel, Jerusalem 9692100, Israel
*
Author to whom correspondence should be addressed.
Water 2021, 13(24), 3656; https://doi.org/10.3390/w13243656
Submission received: 15 November 2021
/
Revised: 16 December 2021
/
Accepted: 18 December 2021
/
Published: 20 December 2021
(This article belongs to the Special Issue Earthquakes and Groundwater)
Abstract
:Water levels in three adjacent water wells in the Yarmouk Gorge area have all responded to the 2020 Elazığ Mw 6.8 teleseismic earthquake. Water levels in two aquifers exhibited reciprocal behavior: during the first eight days after the earthquake, water level decreased by 40 cm in the deeper highly confined aquifer, and increased by 90 cm in the shallower less confined aquifer. The recovery of the water levels in both aquifers continued for at least three months. We interpret these observations as reflecting the increase in damage along the fault at the Yarmouk Gorge. Ground shaking increased the damage and permeability of this fault, temporarily connecting the two aquifers, allowing flow from the deep aquifer to the shallow one. Model results showing decreased permeability suggest that the fault healed by one order of magnitude within three days. This is the first documentation of decrease in permeability in a fault zone within such short time scales.
1. Introduction
Hydraulic and mechanical properties of rocks change during and after remote earthquakes due to damage and healing/sealing processes [1]. When the fault is active during seismic-induced shaking, the permeability of the fault increases due to fracture damage enhancement while the mechanical properties decrease [2]. Upward migration of fluids from an aquifer with higher pressure to another one through activated faults is expected at this stage [3]. Over time, faults recover their mechanical properties through fracture healing/sealing and the permeability decreases as a result of a combination of chemical and mechanical processes [4,5,6].
Aquifer permeability has been observed to be enhanced by transient stresses induced by distant earthquakes [7,8,9]. Other studies show the co-seismic effects of earthquakes on fault permeability [10,11] or long time permeability variations [12]. Wang et al. [13] showed that a large earthquake creates vertical permeability in groundwater systems by breaching the interlayered aquitards. They hypothesized that breaching of aquitards by large earthquakes is achieved by the formation of many hydraulically conductive cracks across the aquitards.
Groundwater near active faults is affected by stress accumulation associated with tectonic loading, which implies strong feedback between fault strength and permeability [14]. The processes responsible for changes in the strength and permeability of faults include healing and sealing [15] whereby healing involves closure of microscale cracks driven by surface energy [16], and sealing of cracks is carried out by precipitation of minerals transported from distant or local sources [17]. Subsurface fluid flow is expected along faults, whenever earthquakes create pathways (by increasing the permeability). In reactive systems, narrow channels are quickly blocked by mineral precipitation and the permeability is reduced [18]. Mineralized fluids with elevated temperatures accelerate both healing and sealing processes reducing the permeability and terminating the flow.
Dieterich [19,20] performed frictional experiments with different values of normal stress and hold times up to 105 s, and obtained a time-dependent logarithmic increase of the static coefficient of friction, during several hours. The results were interpreted as reflecting enlargement of the real contact area with time, as a result of indentation creep around geometrical asperities [21,22]. Recent laboratory studies have shown that micro-cracks can last for hours to months under a range of hydrothermal conditions [16,23,24,25,26]. Geophysical evidence for various durations of post-seismic healing processes, has been observed in Landers [27], Parkfield [4], Tokai region, Japan [28], and Loma Prieta [29] earthquakes. The recovery of P and S wave velocities (healing) following the 1992 Landers earthquake was recorded to last for years [27]. Cochran et al. [30] documented reduced elastic moduli along the Calico fault using seismic travel times, trapped waves, and InSAR observations that represent the cumulative mechanical damage from past earthquake ruptures. They inferred that the long-living fault damage persisted for hundreds or thousands of years with no significant healing.
The various healing mechanisms cannot be fully isolated from each other in recovery experiments on natural rock samples, and the recovery of damaged rocks in nature is a complex interplay between various healing mechanisms [15]. Therefore, we will not attempt to distinguish between the mechanisms and refer to the healing/sealing as a whole. While fracture, damage and permeability can heal relatively quickly in the experiments, in real fault zones, fast healing/sealing has yet to be documented [31]. This might be due to the fact that the tools used to monitor healing/sealing process in the field do not have the resolution for time scales smaller than weeks. In this paper, we show evidence for the remote earthquake-induced (24 January 2020, Elazığ Mw 6.8) sudden permeability increase of a fault zone, connecting two sub-aquifers followed by the gradual healing/sealing within a few days.
2. Hydrological Setup
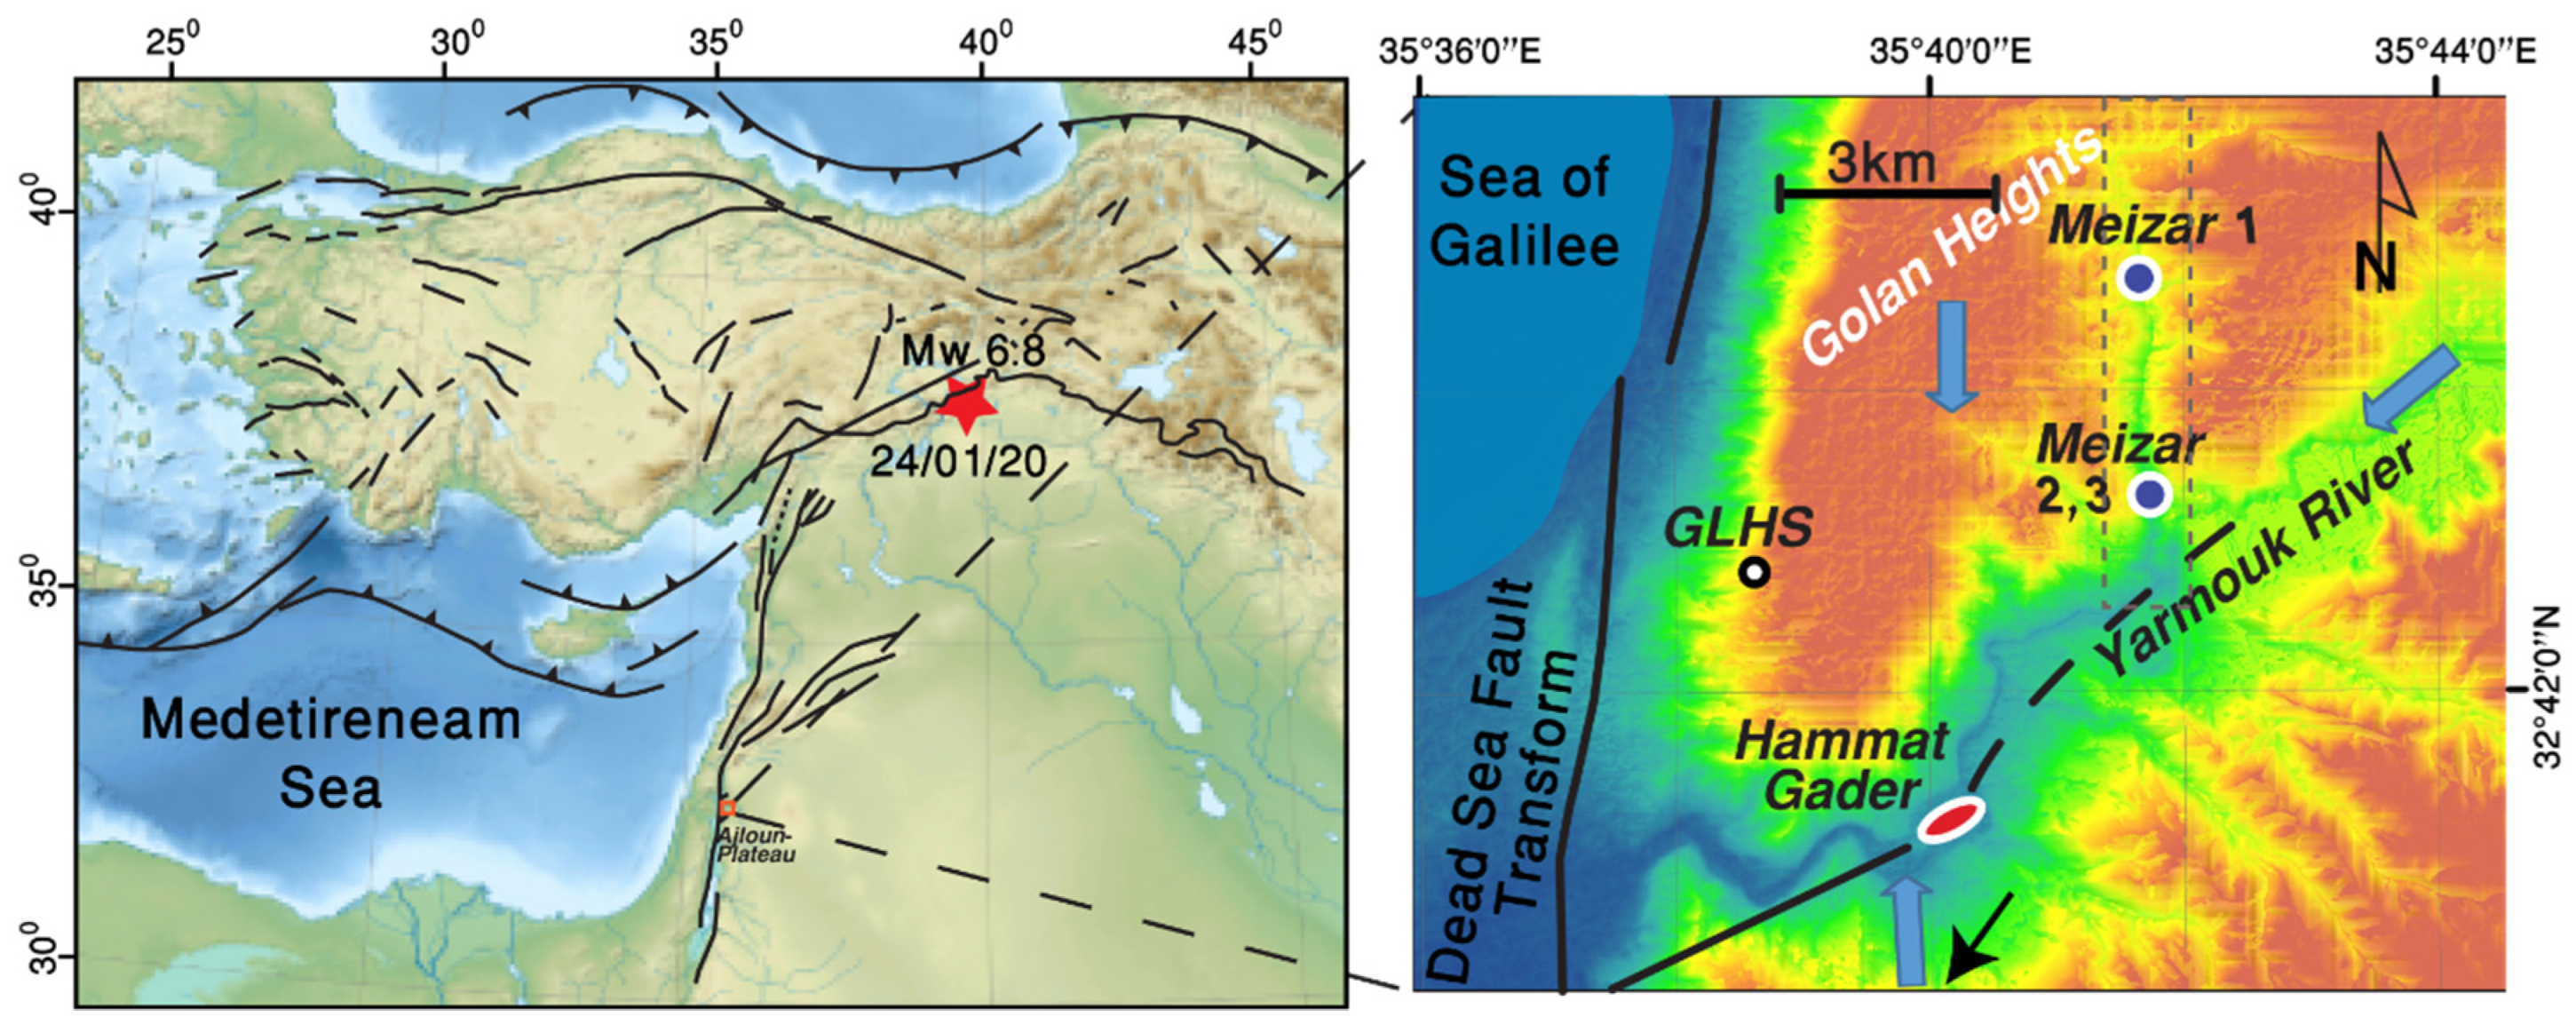
The Yarmouk River and the groundwater resources in its watershed are a strategic transboundary freshwater resource of Syria, Jordan, and Israel. The scattered springs of Hammat Gader (Figure 1) discharge hot pressurized groundwater (45.5 MCM/year up to 50 °C) through extensive deep faulting. Groundwater emerges with different hydraulic heads, chemical compositions, and temperatures [32]. Recent studies attempted to explain the mechanisms responsible for the outflow of hot springs and high-pressure groundwater. Siebert et al. [32] distinguished the source of the springs and wells in the area. Groundwater originates at three different sources: groundwater flows from Golan Heights (north) and Ajloun-Plateau (south) towards the Yarmouk Gorge, where both flows are hydraulically separated by a major fault. Some of the springs and wells in the lowermost Yarmouk Gorge recharge at the Syrian Hauran Plateau (east).
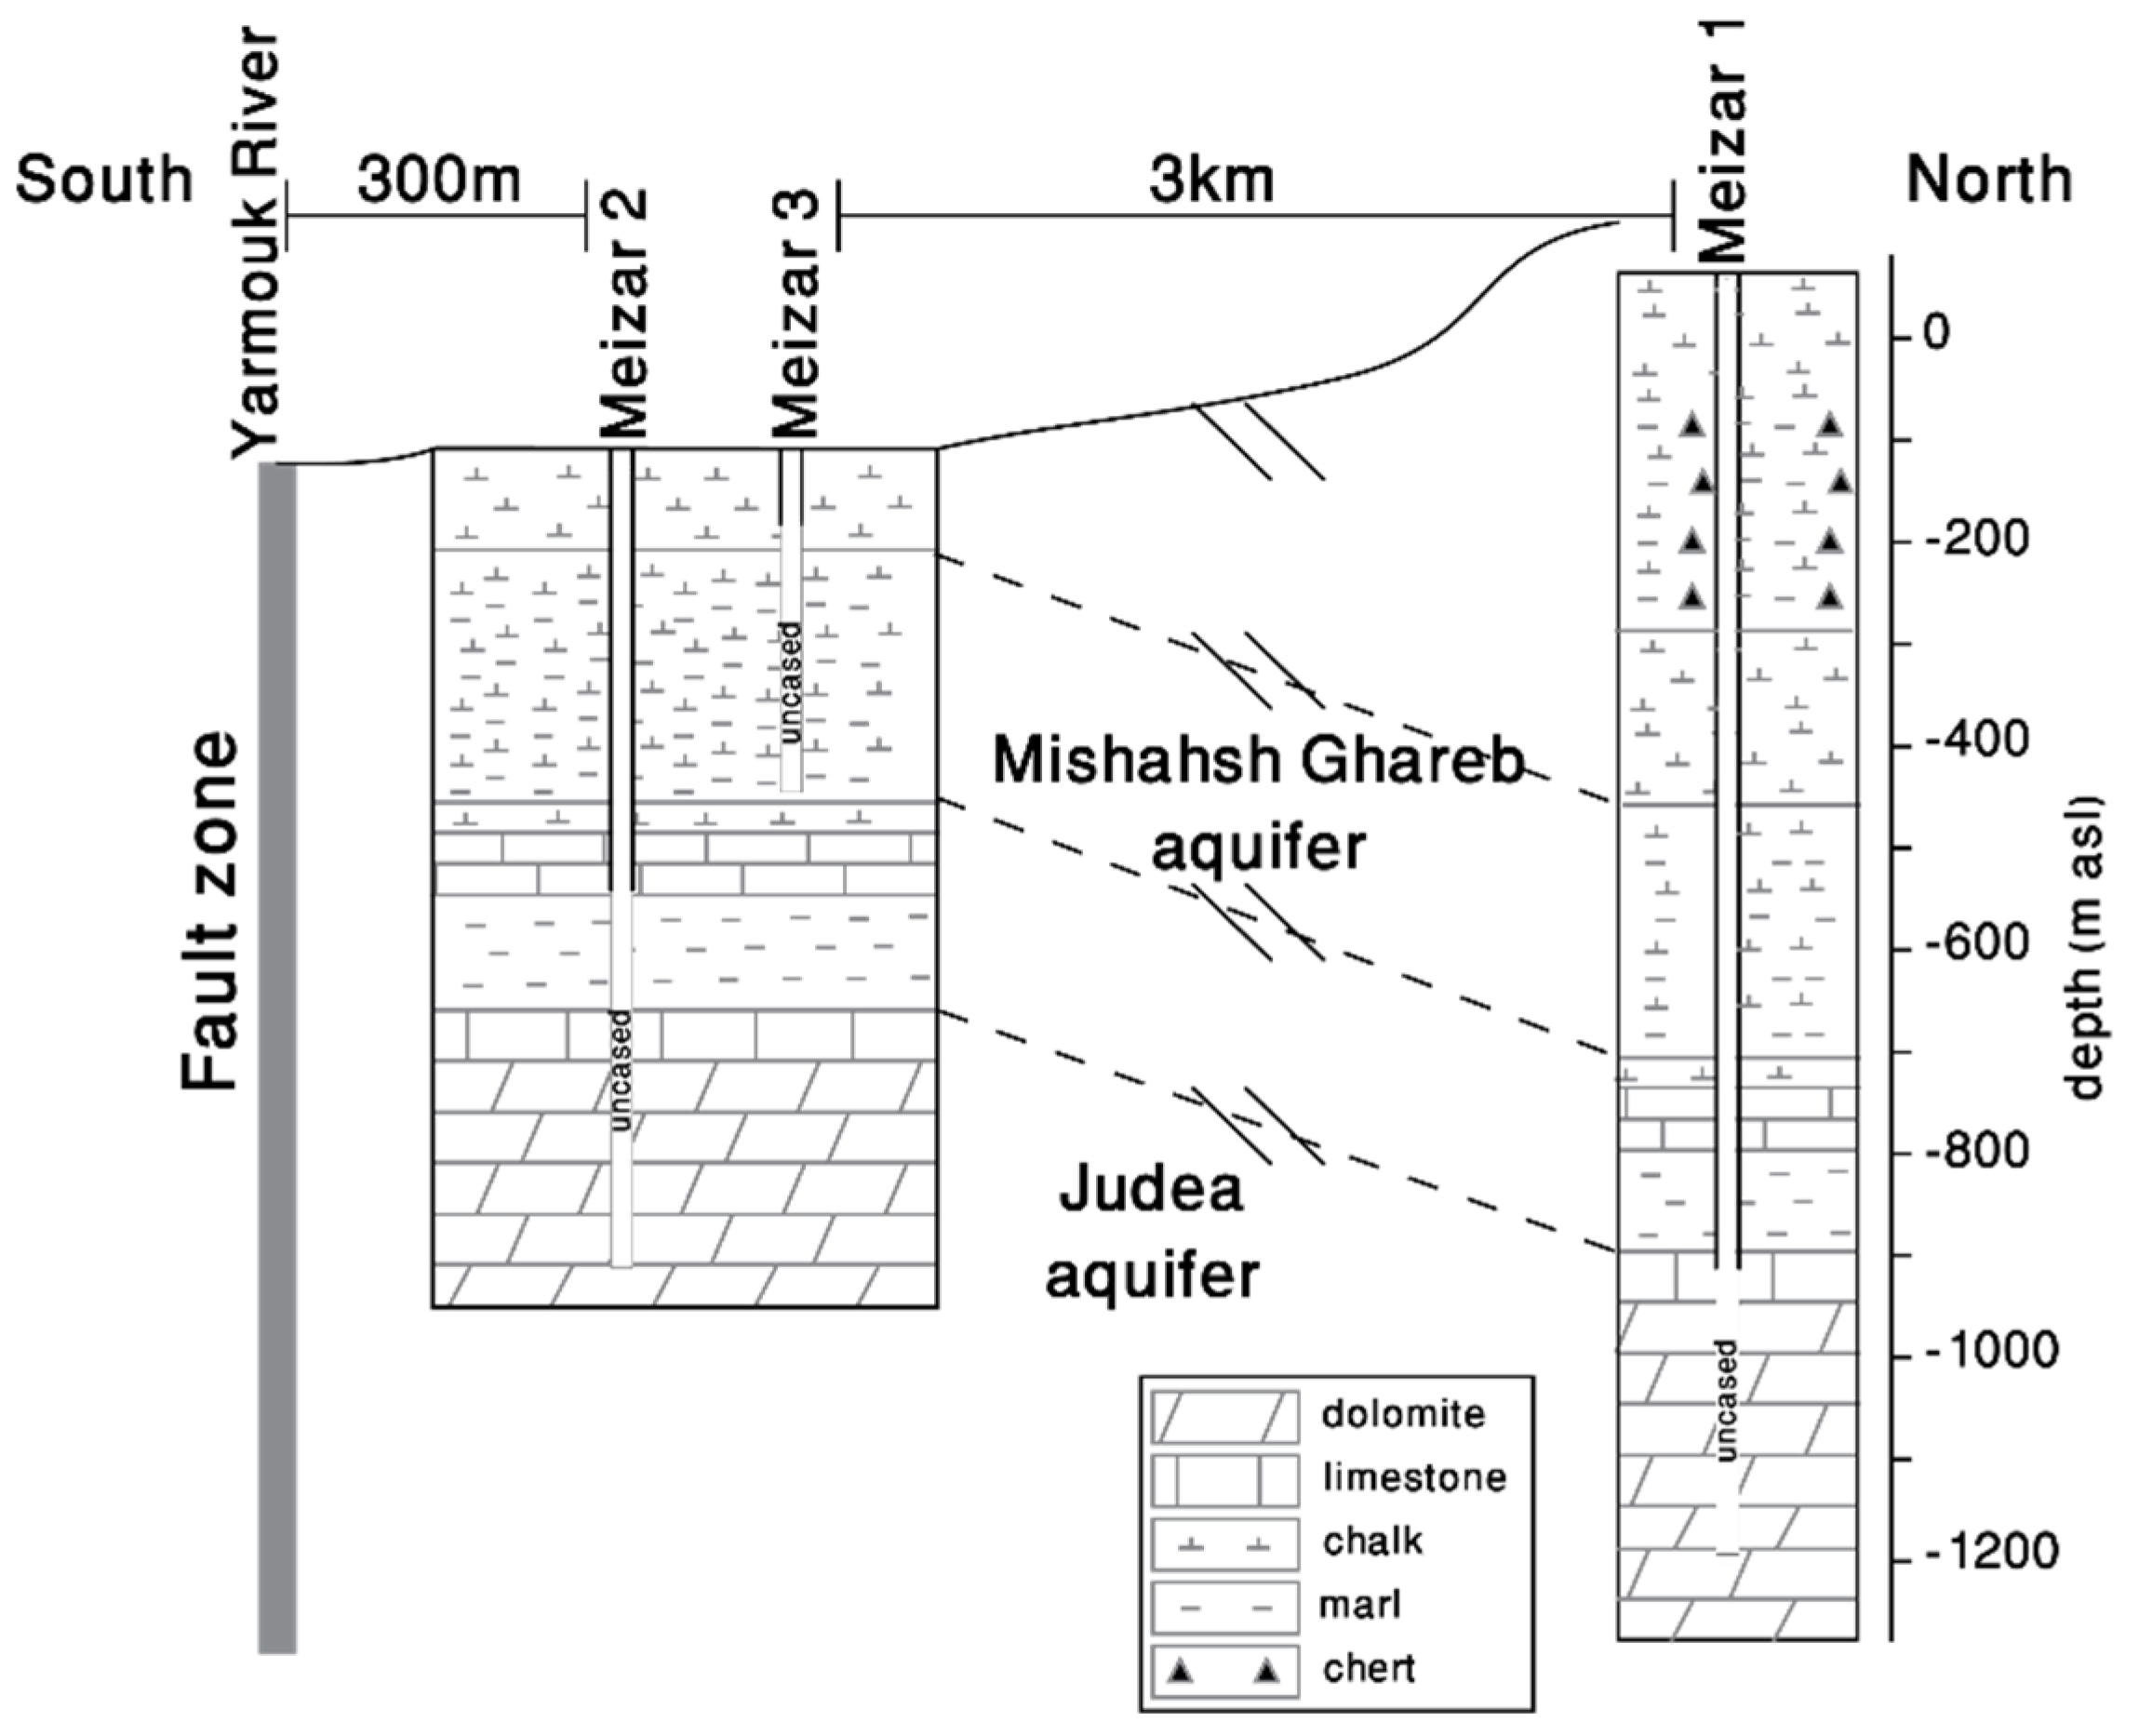
Groundwater pressure data from three wells (Table 1) is analyzed in this work (see Figure 1 for location). The Meizar 1 and 2 deep wells represent water from the upper Cretaceous Judea group and the shallow Meizar 3 well represent water from the Senonian Ghareb-Mishash formations. Meizar 2 and 3 are located 20 m apart and Meizar 1 is located three km to the North of Meizar 2 and 3 (Figure 2). Meizar 2 and 3 are artesian wells with an over-pressure of ~1.7 and ~0.7 bar, respectively. Meizar 1 is not an artesian well due to its high elevation (160 m higher than Meizar 2 and 3).
3. Pumping Tests
Meizar 2 and 3 wells are artesian and pumping tests were performed by opening the valves and measuring the discharge and pressure. The hydraulic connection between the Judea and Mishash-Ghareb aquifers was very limited as observed during pumping tests (Figure 3). However, the aquifers were elastically connected and pumping from Meizar 2 well caused a temporary small increase in the water pressure in Meizar 3. This phenomenon is called the reverse water-level effect [33,34] and it emphasizes the lack of hydrological connection between two aquifers. Water in the wellbore was hot after the pumping (42 °C) and cools down with time to 20 °C, decreasing the pressure after the valves are closed.
It has been observed in many field tests that when groundwater is pumped from an aquifer, the water level may momentarily increase in adjacent aquifers and aquitards [34,35,36,37,38]. This reverse water-level response was first observed in Noordbergum, The Netherlands, where the phenomenon earned its name for a special case where the water-level rise occurs in an aquifer separated by a confining unit from the pumped aquifer [35].
The loss of water due to pumping involves a decrease of volume, producing radial solid displacements towards the well. The displacement field (loading) compensates for the loss of water. For deeper layers, this displacement field causes compression, and hence an increase of pore pressure [35]. This loading information is transferred immediately throughout the elastic medium because of stress compatibility, while water flow and re-distribution of the pore pressure due to pumping, requires time.
4. Hydrological and Seismological Data
Water pressure is monitored using PA 33X in the artesian wells and PA 36XW in the non-artesian wells pressure transmitters (Keller-Druck, Winterthur, Switzerland), configured to a range of 0–0.1 MPa and 0–0.3 MPa, respectively. The accuracy and precision of these transmitters are 50–150 Pa and 2–6 Pa, respectively, depending on the pressure transmitter measuring range. Temperature dependencies and nonlinearities of the pressure transmitters are compensated by the transmitters’ microprocessor. Water pressure is recorded at 40 samples per second. We do not record temperature or electrical conductivity measurements because lowering sensors to the uncased section of the wells is very difficult due to the artesian conditions. Seismic data are obtained from station GLHS (Figure 1), of the recently upgraded Israel Seismic Network [39]. GLHS is a station with collocated sensors, recording ground accelerations, velocities, and displacements. The velocity data used in this study was measured by a Trillium 120 PH broadband seismometer (Nanometrics), located within a posthole, at a depth of 5.5 m below the surface, and recorded by a 6-channel Centaur (Nanometrics), at 200 samples per second, and 40 V peak to peak sensitivity.
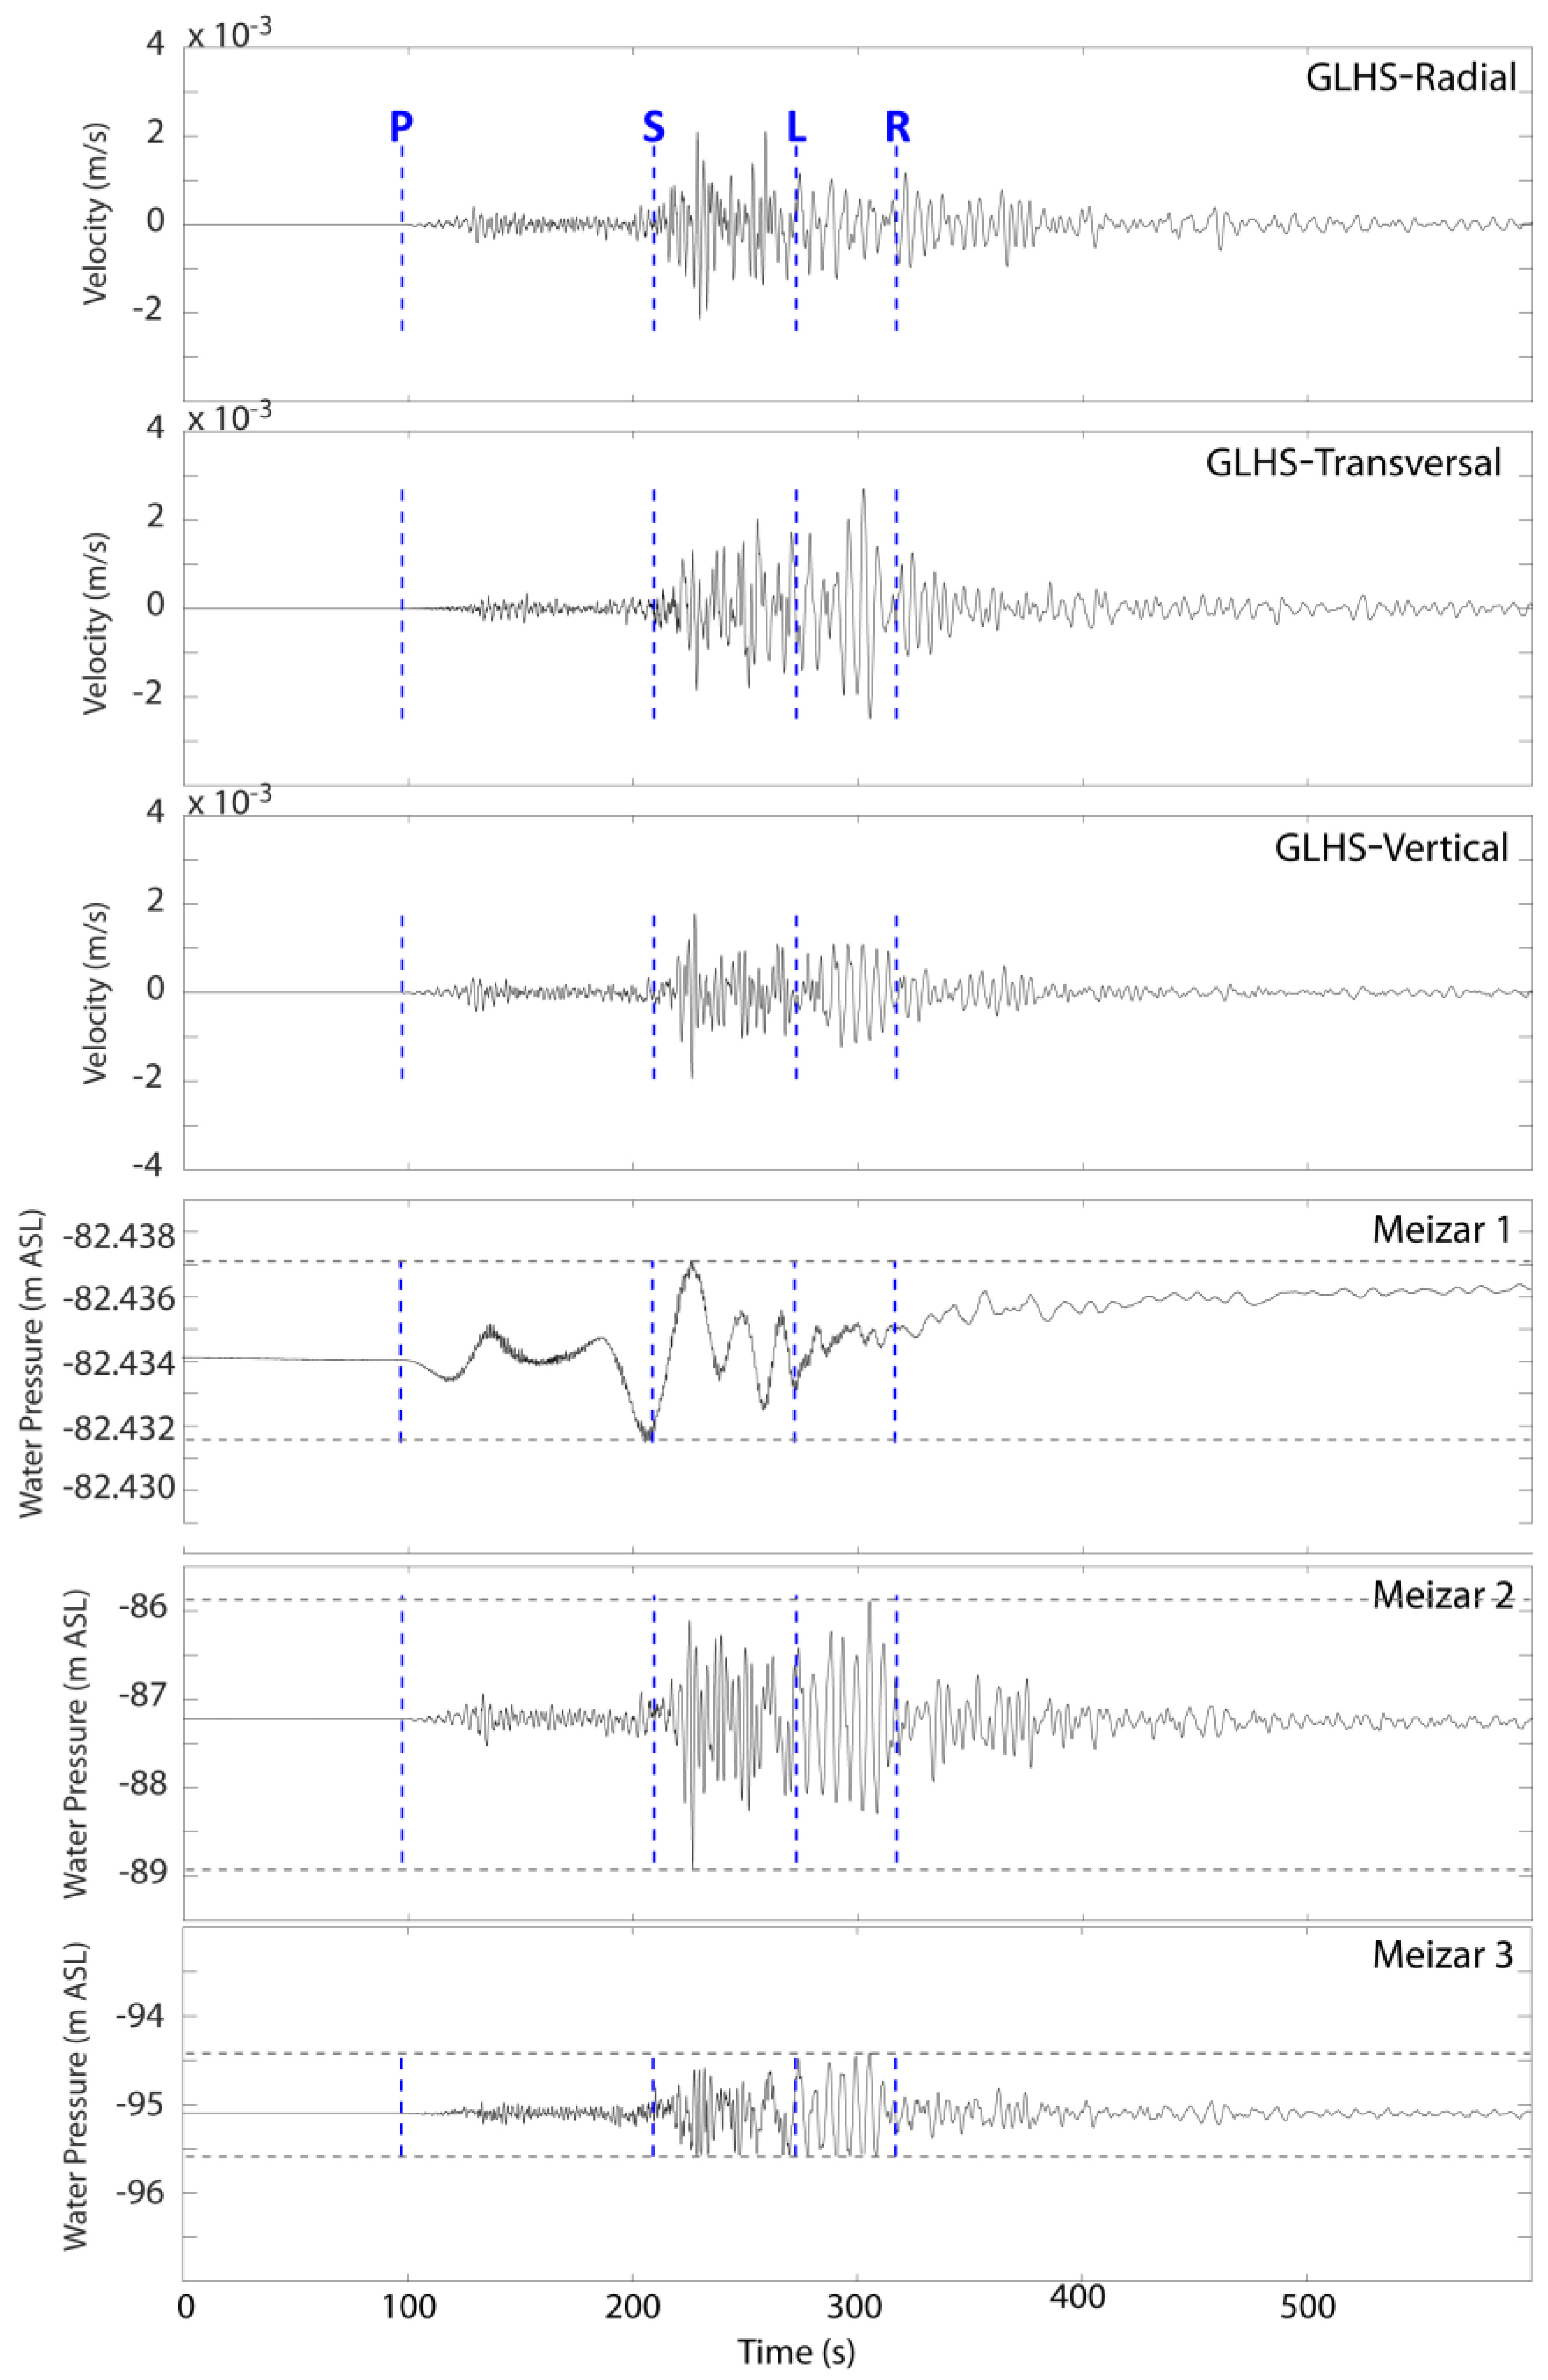
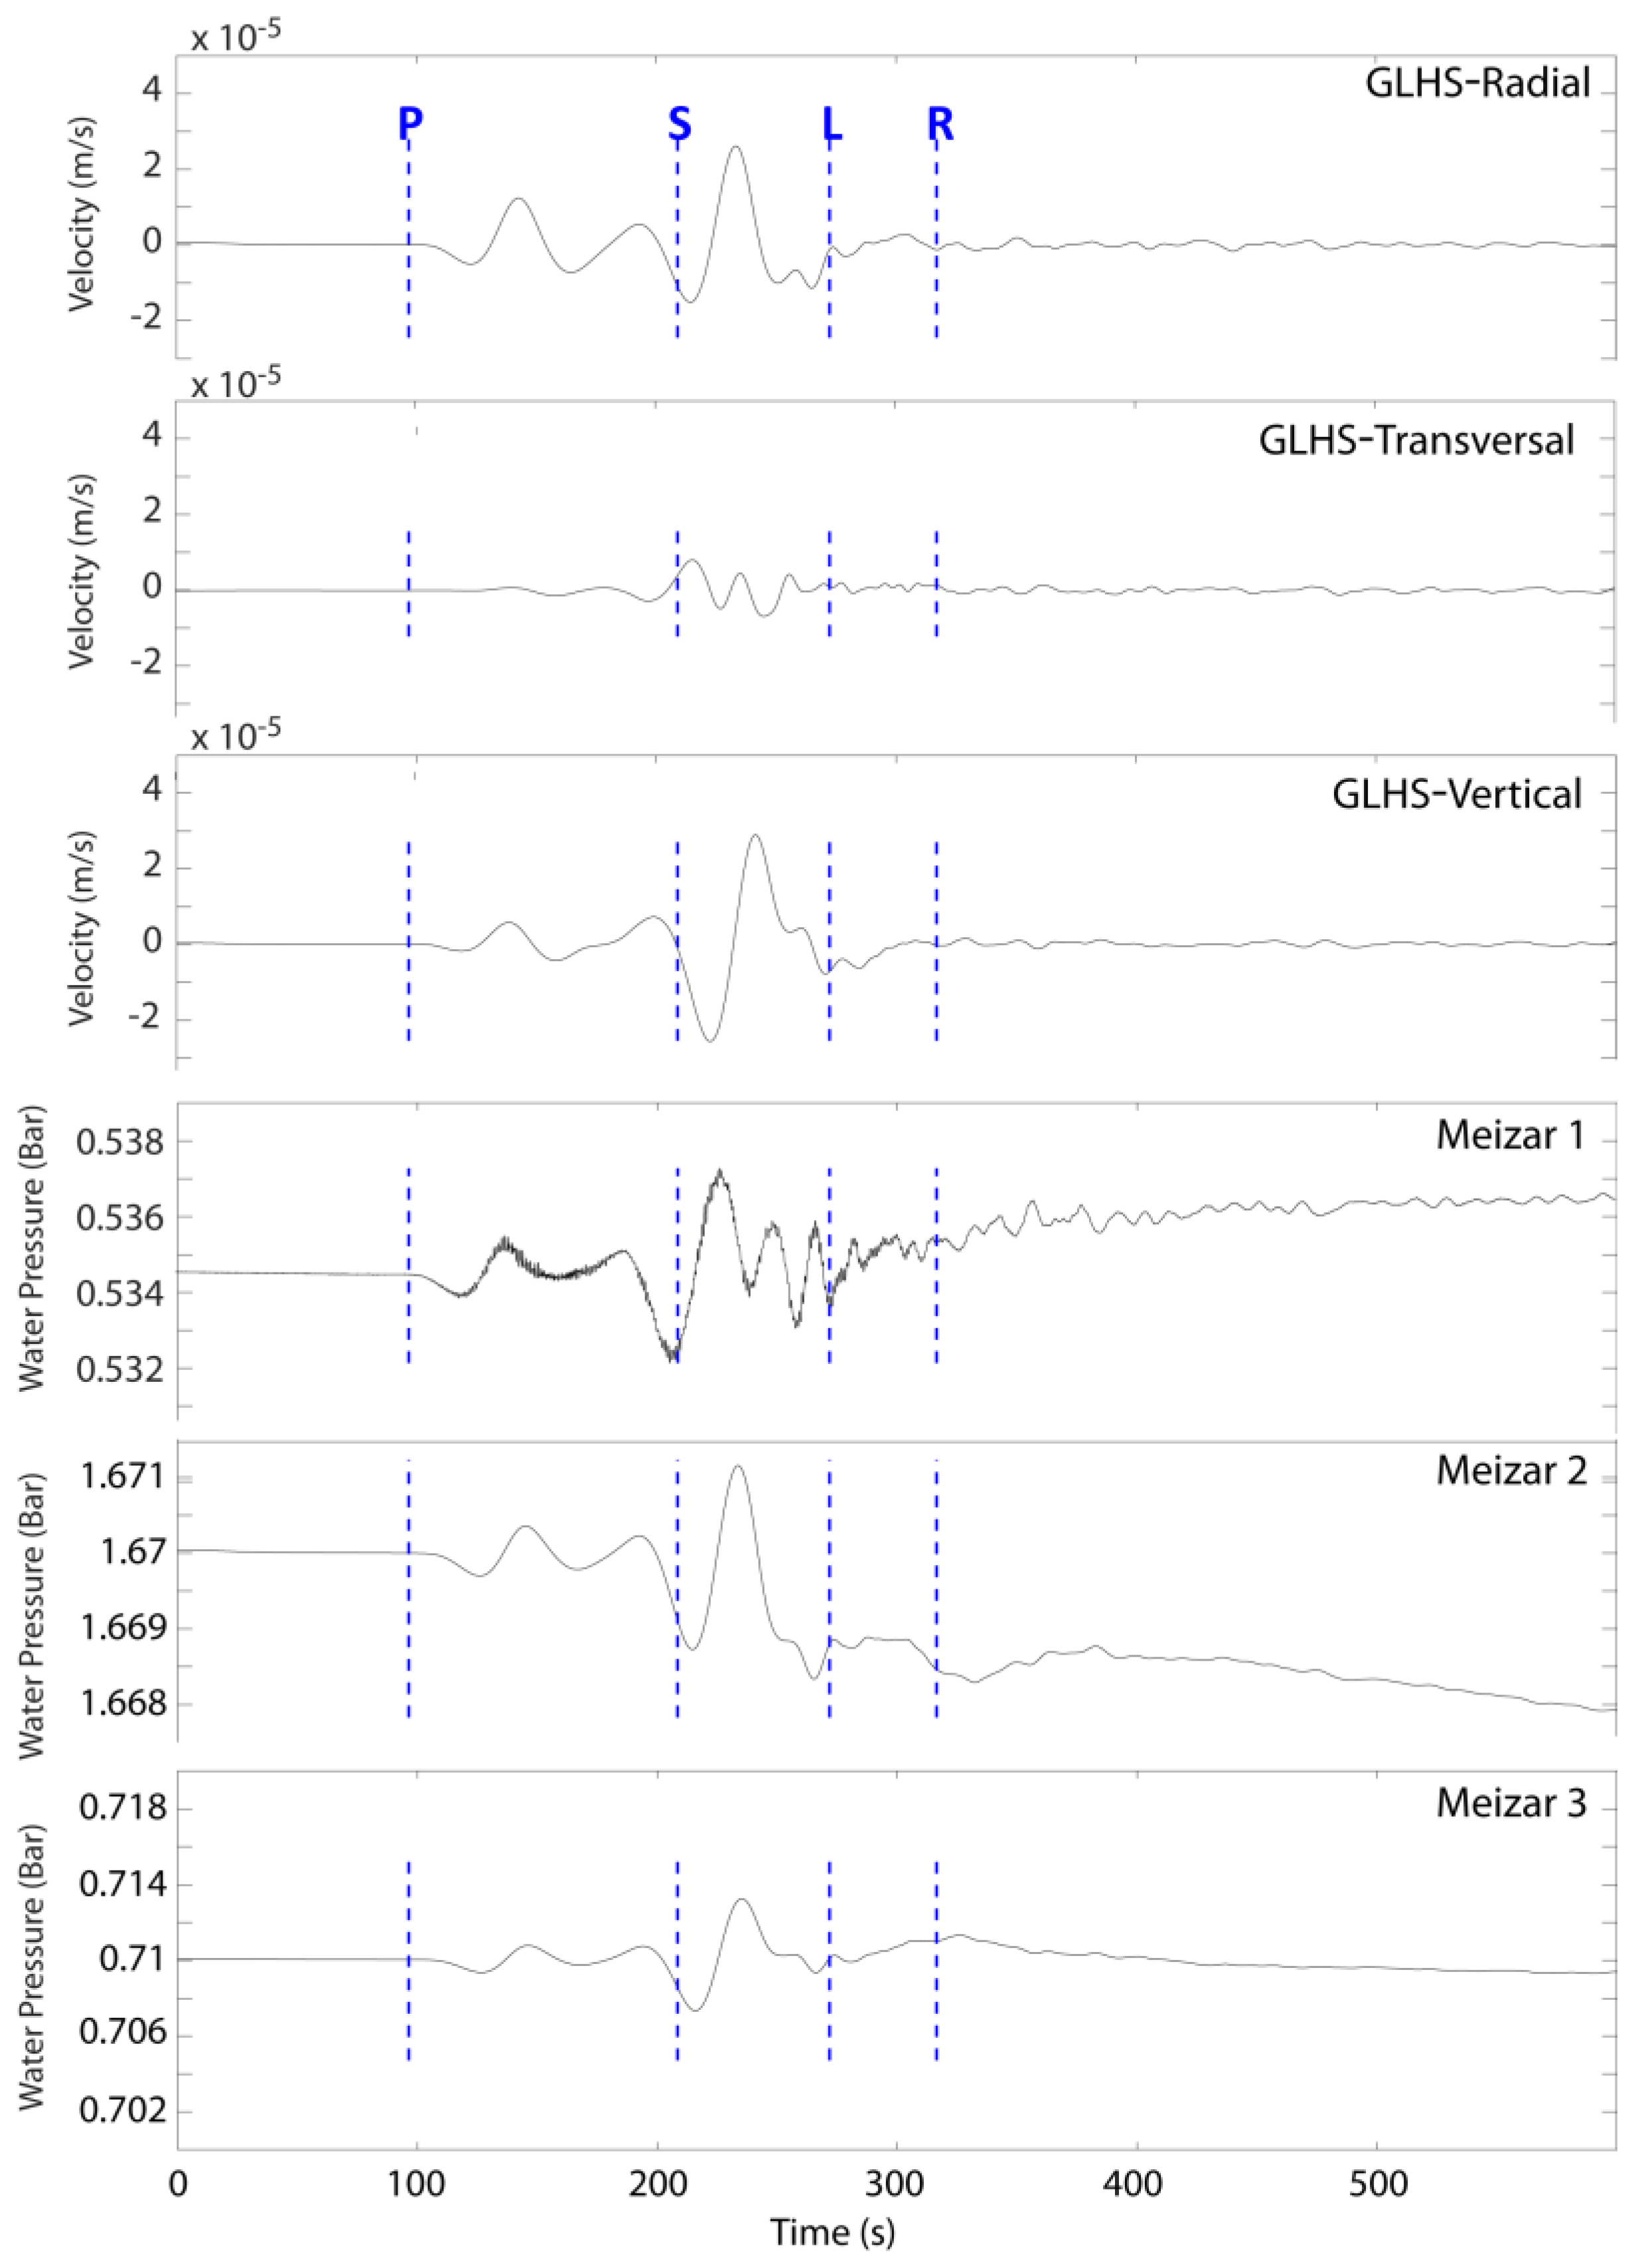
The seismic waves generated by the remote 2020 Elazığ Mw 6.8 earthquake [40,41] are clearly seen in the seismic and hydrological data (Figure 4). During the passage of the waves, there was an average water pressure increase in Meizar 1 well. This sustained increase was also observed in previous cases [42,43]. The highest amplitudes occur after the arrival of the S waves; in Meizar 2 and 3 wells, the amplitudes are 3 m and 1.2 m, respectively; the amplitudes in Meizar 1 are relatively small (5.5 cm), due to its non-artesian nature. The attenuation in the high-frequency range in non-artesian wells is an effect of wellbore storage, where water is actually displaced during oscillations; in closed artesian wells, the attenuation is much smaller [44]. Similar trends are observed in the seismic data and in Meizar 2 and 3 wells, emphasized for specific bandwidths. Such data obtained by applying a Butterworth low-pass filter (with four poles at a cutoff frequency of 0.02 Hz) are provided in Figure 5.
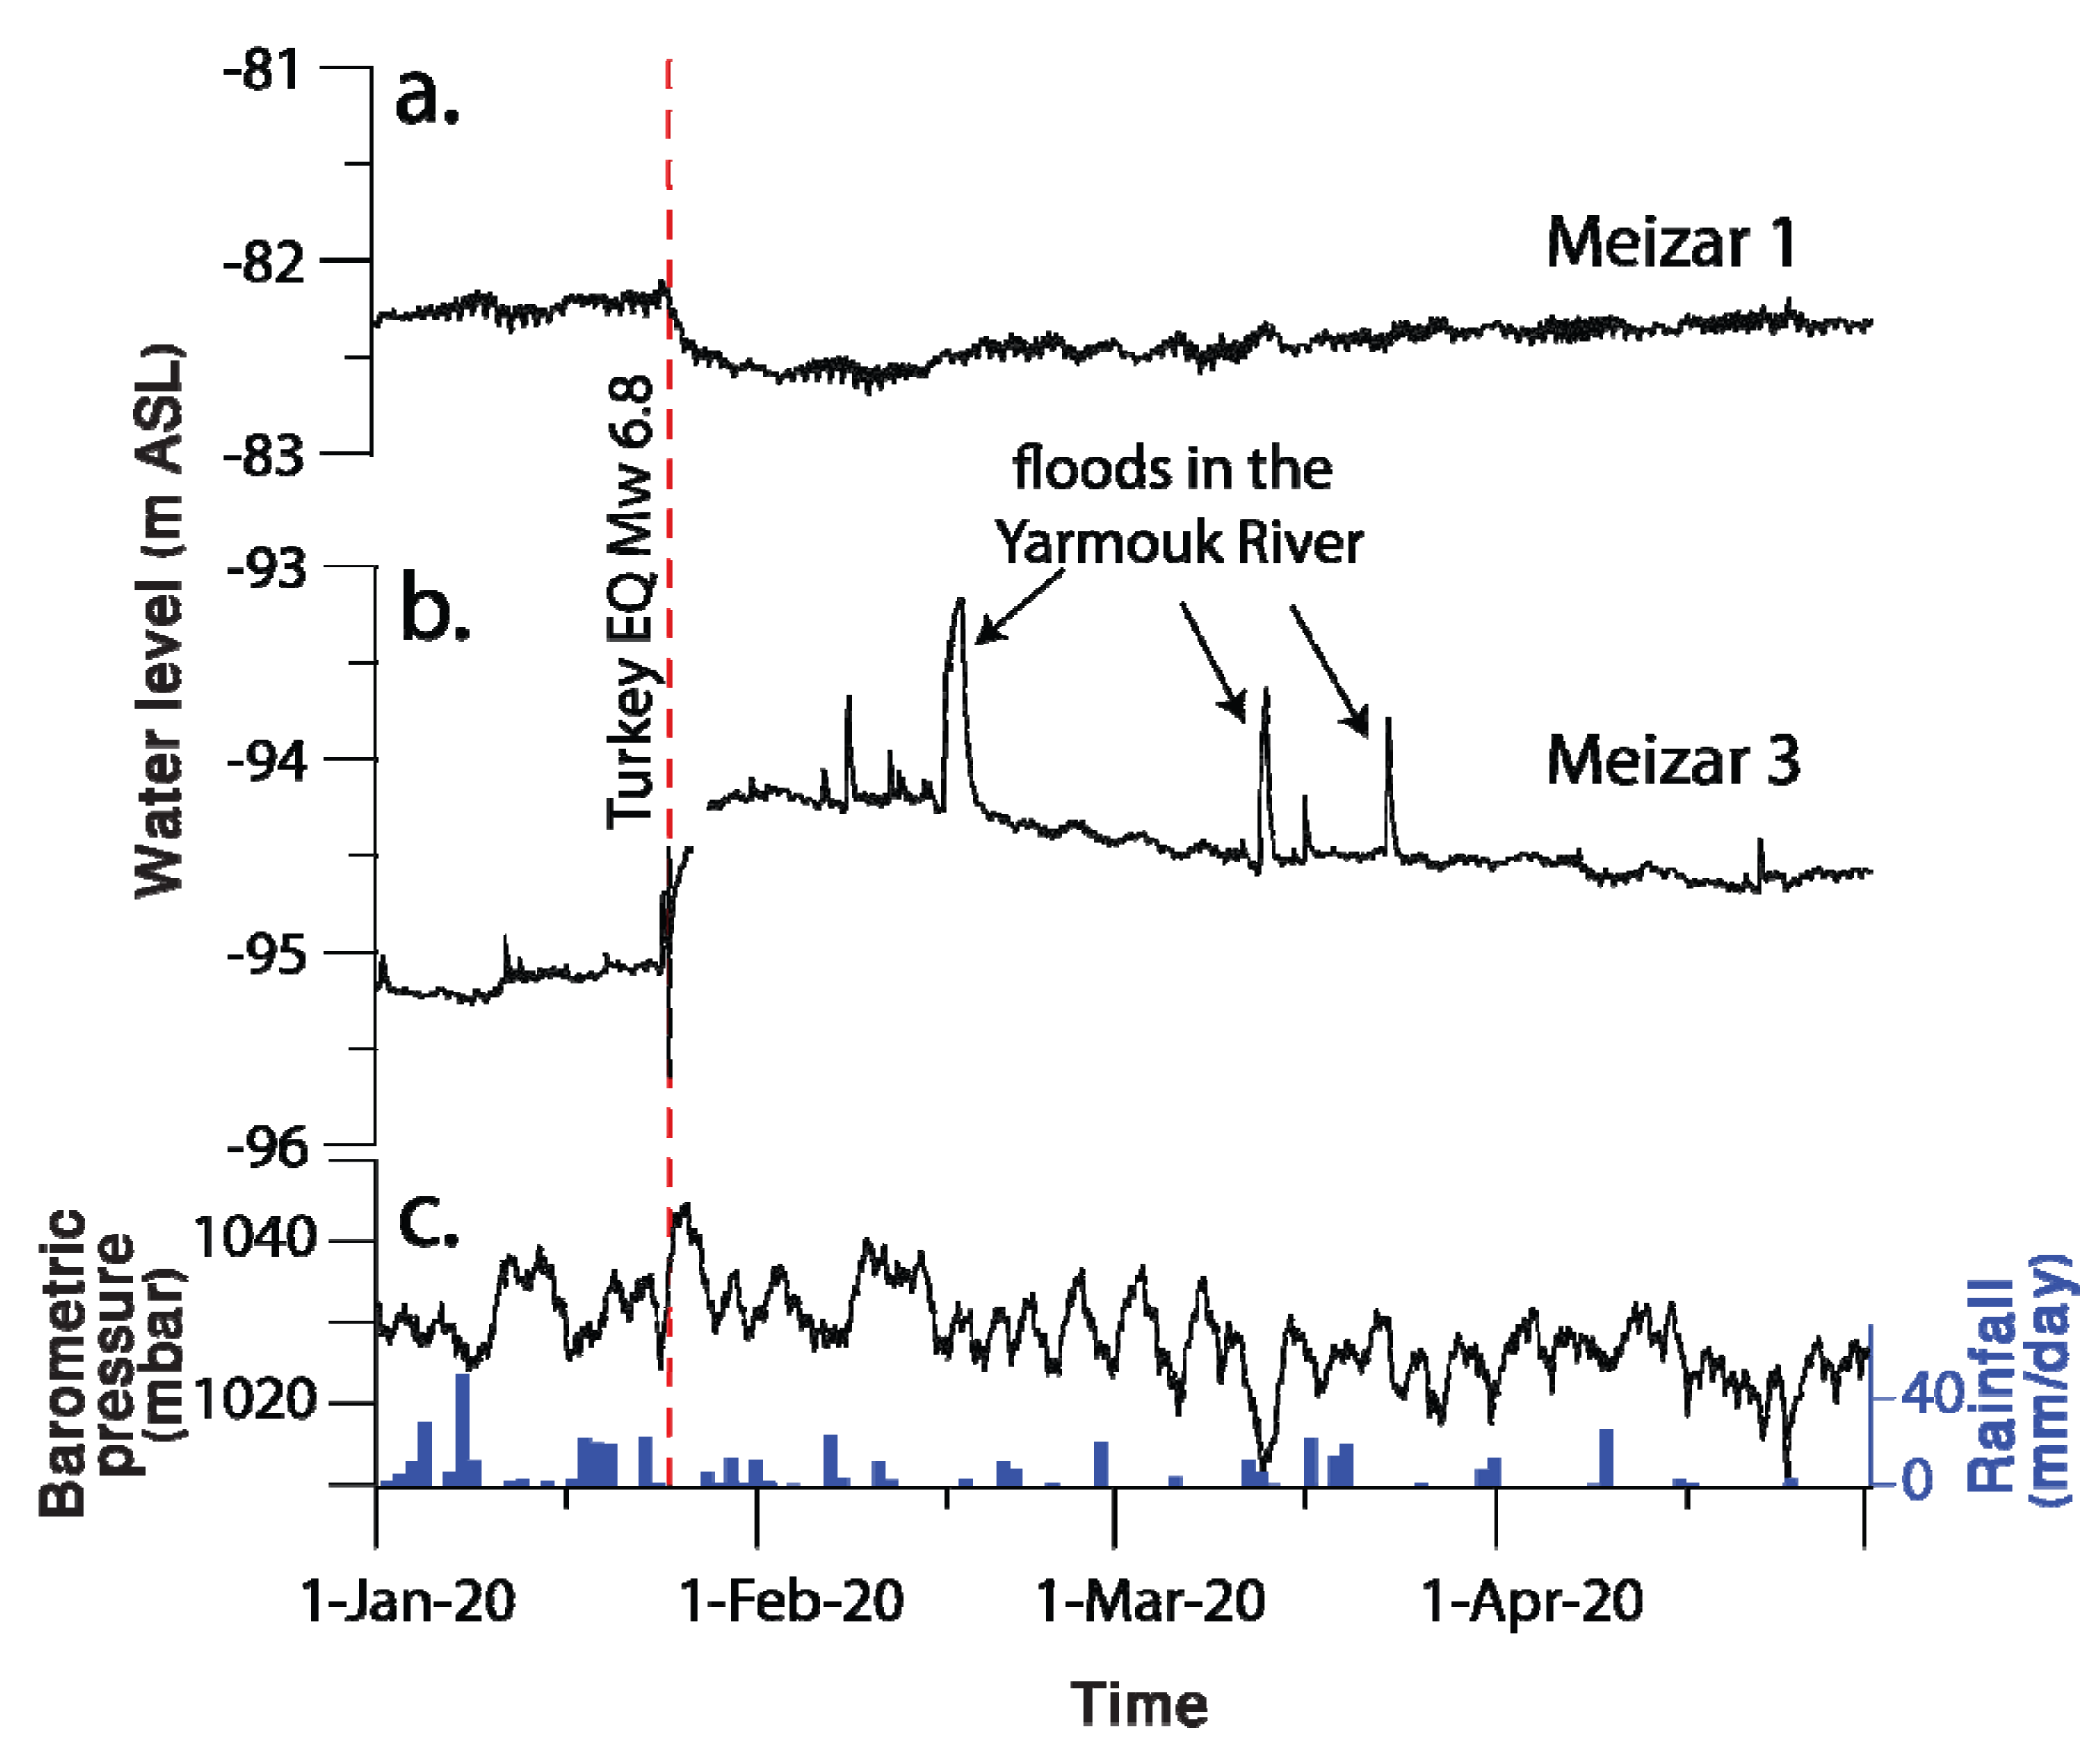
Immediately after the passage of the seismic waves, pressure started to change in all wells. The pressure in Judea aquifer started to decrease and the pressure in the Ghareb-Mishash aquifer started to increase (Figure 6). Unfortunately, industrial pumping in Meizar 2 began soon after the event. Therefore, we discuss here only the water pressure changes in Meizar 1 and 3 wells. During the first 10 days, the water level in Meizar 1 well decreased by 40 cm and then recovered towards its pre-event value. In Meizar 3 well, the water level increased by 90 cm and then started to decay back to its pre-event value (Figure 6). We interpret these changes as fault activation and damage increase in a relatively narrow zone connecting two aquifers, followed by gradual healing/sealing of this zone. Several floods in the nearby Yarmouk River, that recharged the shallower Mishash-Ghareb aquifer without affecting the deeper Judea aquifer, illustrate the separation between the aquifers.
5. Groundwater Modeling
5.1. Model Formulation
Fault activation and damage heeling is incorporated into the groundwater modeling. The results of Dieterich’s [19,20] healing experiments demonstrate the logarithmic increase of the static coefficient of friction fs:
where t is the duration of the hold time in seconds, f0 ≈ 0.6–0.8, A ≈ (1–3)10−2 and B ≈ 1–2 s−1. The non-dimensional A-coefficient defines the magnitude of the static friction change with time and the attribute of B provides a time scale for the evolution of the static friction coefficient. The relation of the rate and state dependent friction model [22] connects the steady-state value of the friction coefficient, fss, with the sliding velocity at slip distances larger than a certain critical value:
The a and b non-dimensional values control the transient stage, while a defines the direct effect to the instantaneous slip velocity change and b defines the recovery to a new steady-state friction value corresponding to the slip velocity V normalized to the reference velocity V0. The difference (a − b) defines the overall change in the steady-state friction value. Numerous experimental studies demonstrated that both the a and b parameters are of the order of 10−1 to 10−2 and the sign of the (a − b) defines the stability of the sliding contact [22]. Elevated values of a, b ~0.15 have been reported for wet frictional experiments in hydrothermal conditions [45,46]. By comparing laboratory results and microphysical models Van den Ende et al. [47] suggested that the b parameter increases with depth (temperature and pressure) approaching b~0.2. Larger values of b up to 0.35 were reported for gouge-bearing faults [48], and in general agreement with recent micromechanical models [23]. These elevated values were also used in dynamic rupture modeling [49,50].
Motivated by the observed logarithmic increase of the static coefficient of friction, Lyakhovsky et al. [51] used a damage-dependent function for the kinetics of healing and suggested the rate of healing under constant compaction strain, εcmp, to be of the form:
where α is the damage parameter, and , , are two positive coefficients. Under static load conditions, the damage healing Equation (3) predicts logarithmic-in-time healing:
with the same structure as of Equation (1). Lyakhovsky et al. [52] also demonstrated that the model with exponential healing (Equation (3)) reproduces the main features of the rate and state friction and connected the parameters and to the static and steady-state friction coefficients. According to their derivations, is between 10−1 and 10−2. The value of the coefficient strongly depends on the value of the coefficient and varies within several orders of magnitude. For two different values of = 0.03, 0.05, and B~1 s−1, εcmp ~10−2, the coefficient is ~10−12 s−1, ~10−6 s−1, respectively. Fault healing at seismogenic depth of 5–10 km and pressure of about 200 MPa is very fast with these parameters during the initial few hours after an earthquake and the rate of healing significantly decreases with time [53]. With healing, the value of damage (α) decreases, leading to permeability reduction. Experimental studies [54,55,56] confirm the correlation between the log-scale permeability variation and micro-crack density. In this model, the damage is a measure for the micro-crack density and thus the enhanced fluid flow and poro-elastic coupling is incorporated using the exponential permeability–damage relation [55]:
To account for the several orders of magnitude change in the permeability between intact rock () and heavily damaged fault zone (), the exponential factor D should vary between 10 and 20 [57].
5.2. Numerical Results
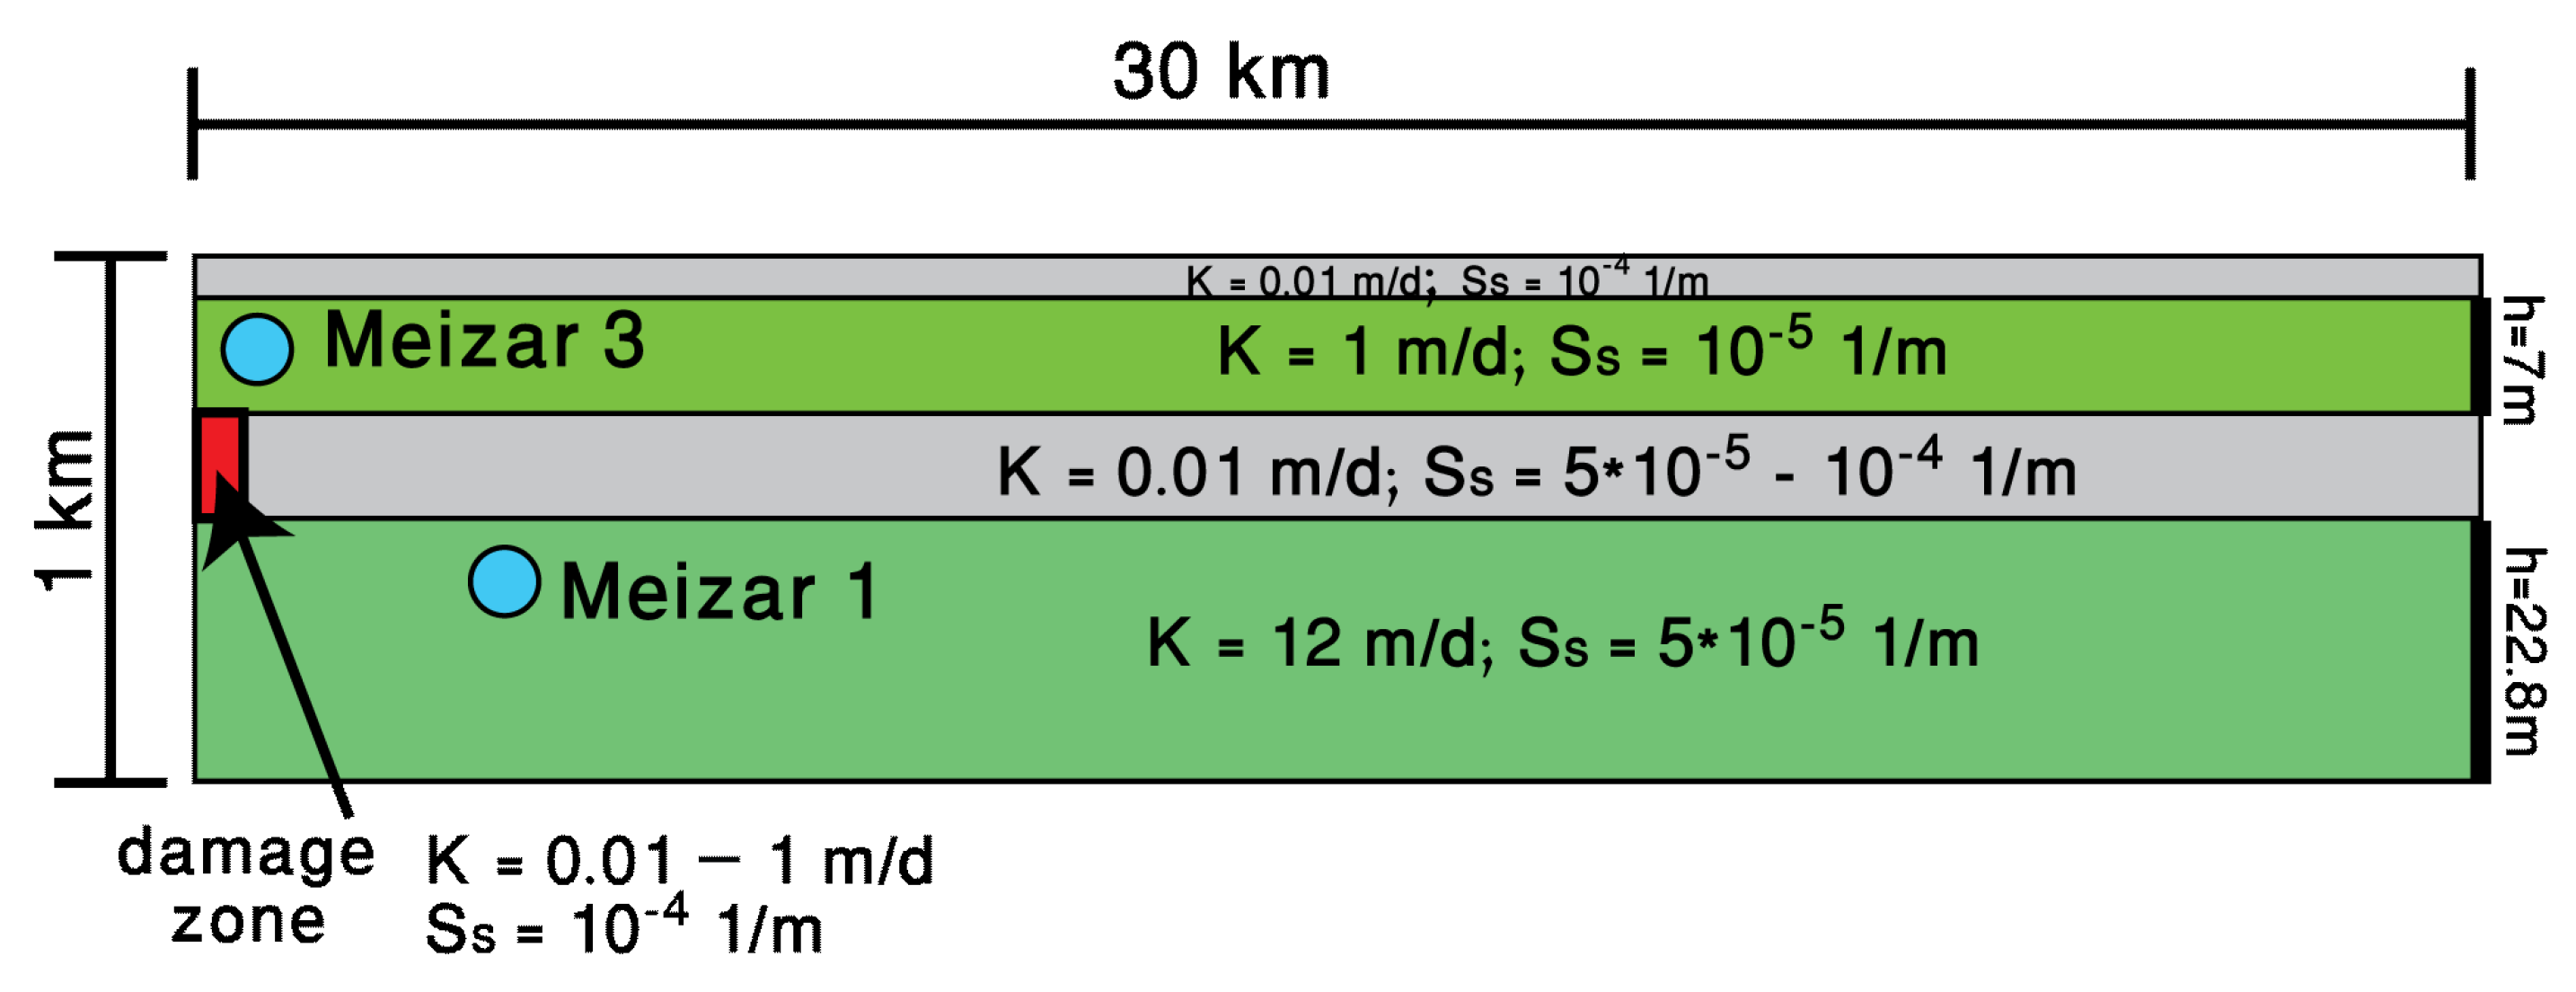
Modeling of the response of the hydrological system to the remote earthquake was done by using a two-dimensional, vertical cross-section, implemented into FeFlow [58]—a finite-element simulator that solves the coupled variable density groundwater flow and solute transport equations. Layers’ properties were obtained from the pumping tests analysis, and the marl and chalk layer separating the two aquifers were assigned with lower hydraulic conductivity. The length of the numerical cross-section was set to 30 km to avoid the influence of the right boundary, and a mesh of 228,090 elements and 114,752 nodes was used to capture the geometrical boundaries of the model. Flow boundary conditions are hydraulic heads at the right boundary and no flow at the top, bottom, and left boundaries (Figure 7). The fault is set to 300 m away from Meizar 3 well. The increased damage of the fault by the passage of seismic waves is simulated by an abrupt increase of the hydraulic conductivity of the fault from 0.1 to 1 m/d. Healing and sealing of the fault reduces the hydraulic conductivity back towards its original value. The amount of time required for healing/sealing processes was evaluated according to this setup. We used different , values (Equation (4)) and D = 15 (Equation (5)) as a representative value and run the groundwater modeling. The model was run for 100 days to represent the monitoring data between 24 January and 1 May (Figure 6).
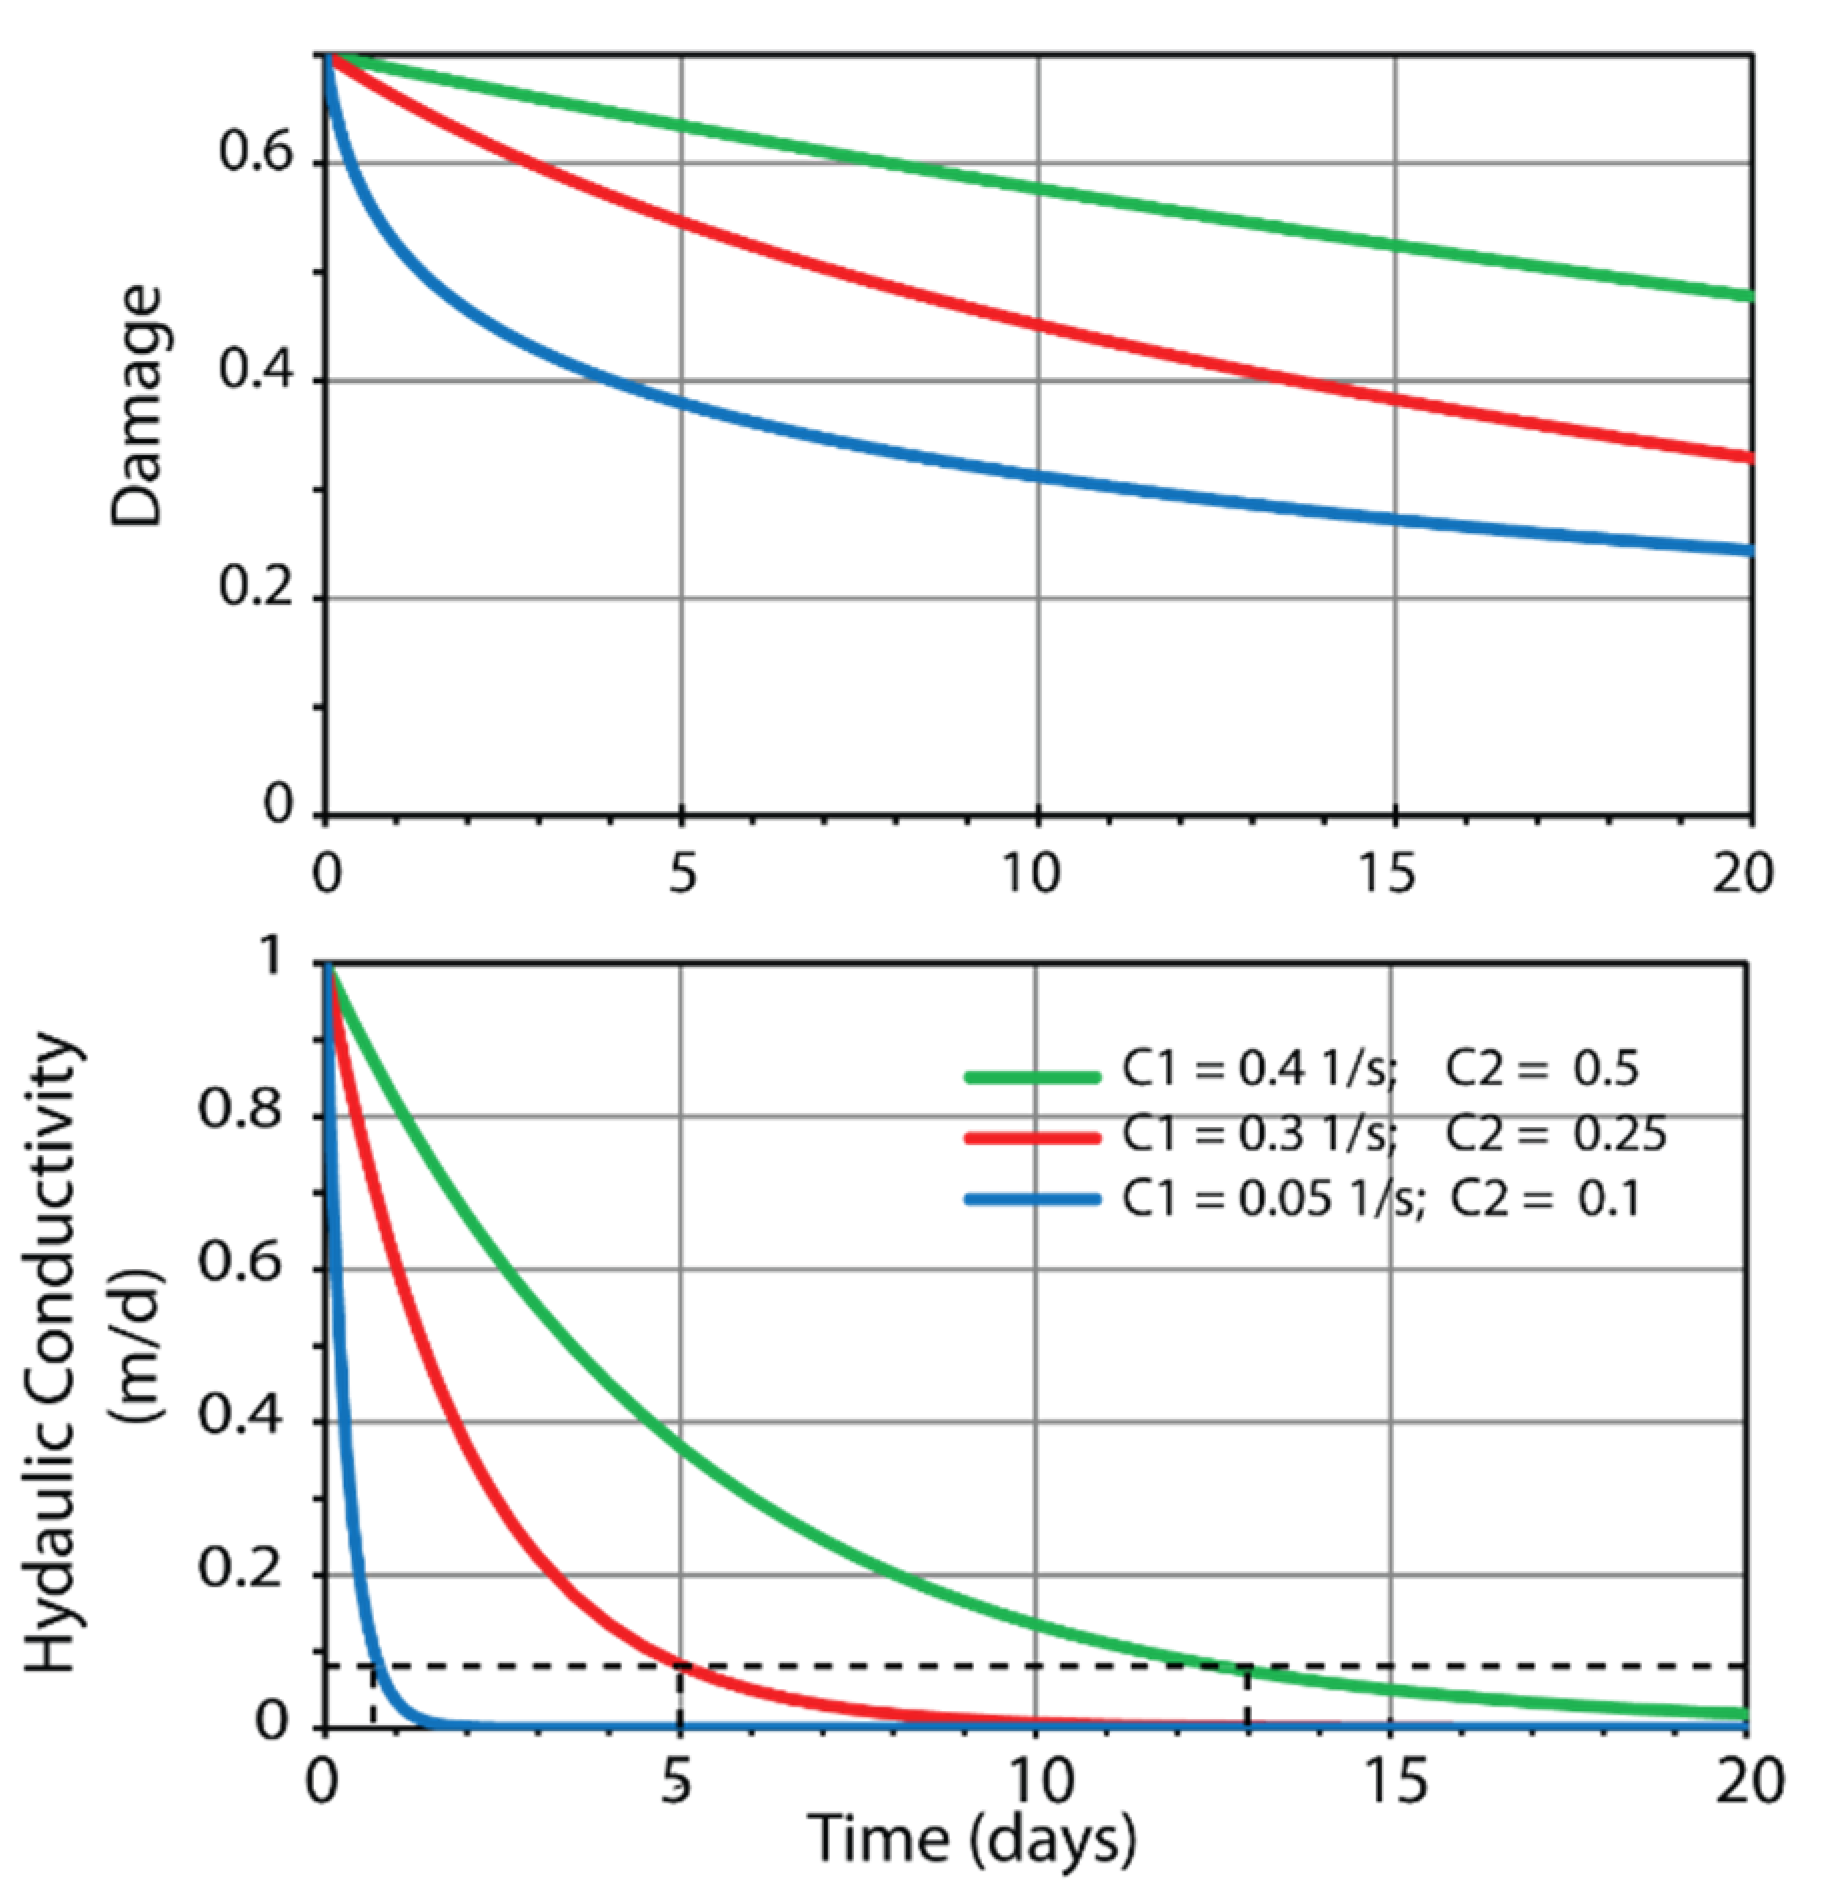
Figure 8 shows the expected damage decrease under εcmp = 3 × 10⁻⁴ corresponding to 15 MPa confining pressure (~600 m depth) for 50 GPa bulk modulus, = 0.1, 0.25, 0.5, and = 0.05, 0.3, 0.4 1/s. The time scale of healing with these parameters is days. Equation (5) predicts the permeability reduction with time (Figure 3b), with these damage-rate parameters. The permeability reduction of one order of magnitude occurs within 0.75, 5, or 13 days depending on the healing parameters ( and ).
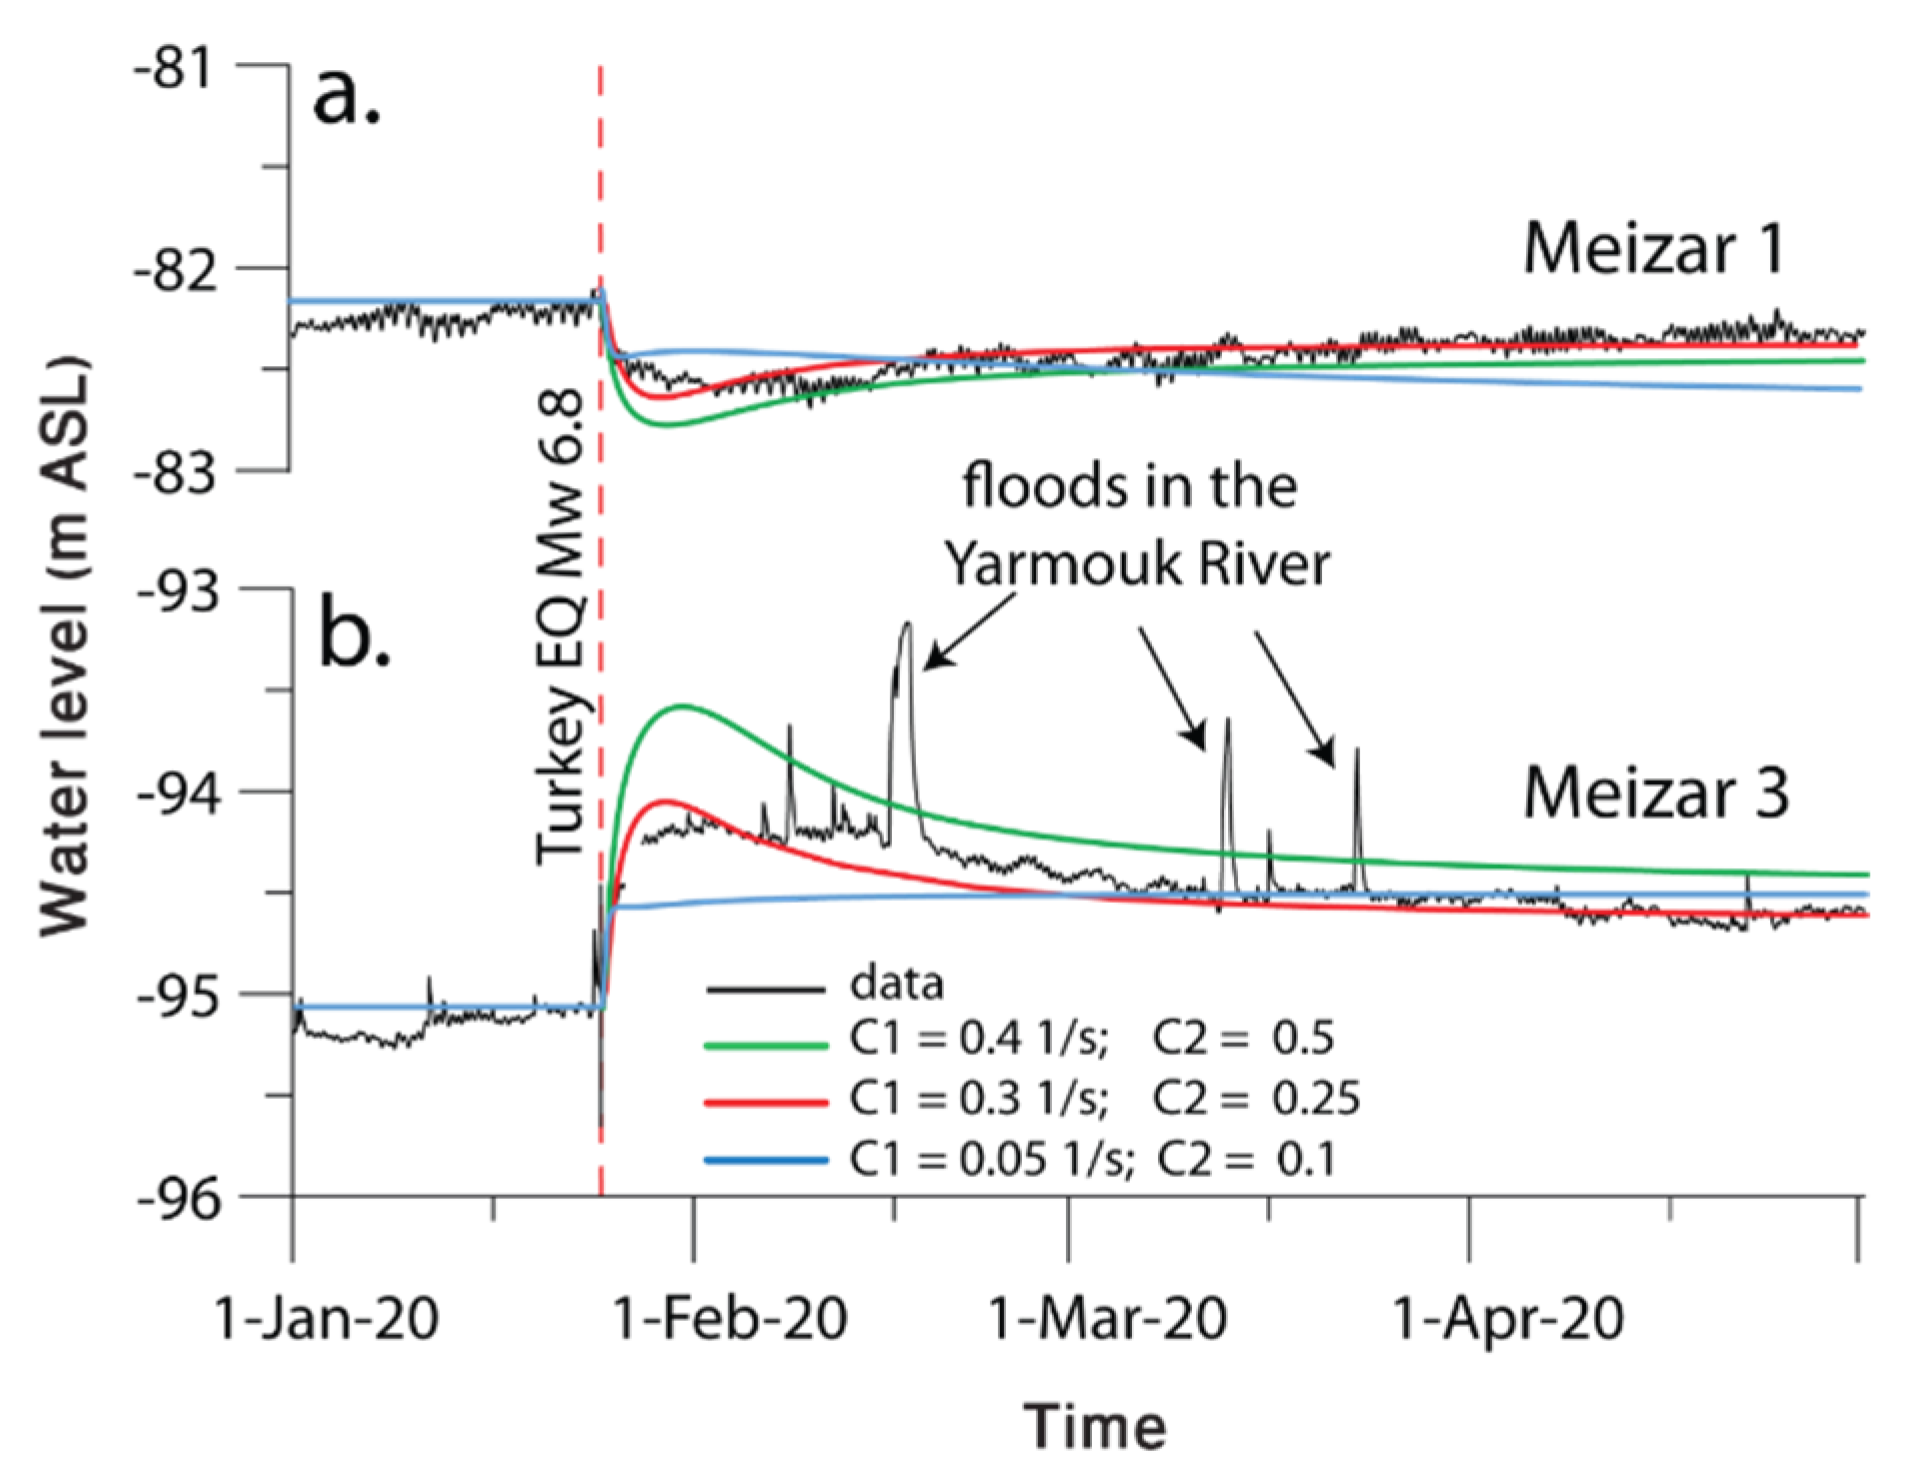
The groundwater flow simulations, using these time-dependent fault zone permeability profiles, predict water level variations (Figure 9). Results of the numerical simulations show that the hydraulic head in the deeper and pressurized aquifer decreased due to the drainage of the groundwater through the fault while the hydraulic head at the shallower and less pressurized shallower aquifer increased. Simulated water levels are sensitive to the time required for healing/sealing of the fault. The fault healing parameters that best fit the observed water levels are C1 = 0.3 s−1 and C2 = 0.25 (Figure 9). It is possible to estimate rate and state friction parameter—b with these damage-healing parameters. Using the obtained C2 ~0.25 and = 0.6–0.8 results with ~0.15–0.2. This value of the rate and state friction model parameter falls slightly above most of the reported values for hard rocks, but still meets the laboratory-based values in gouge-bearing faults. This is compatible with the hydro-geological settings, suggesting hot water flow from the deep aquifer through the activated fault zone.
6. Discussion
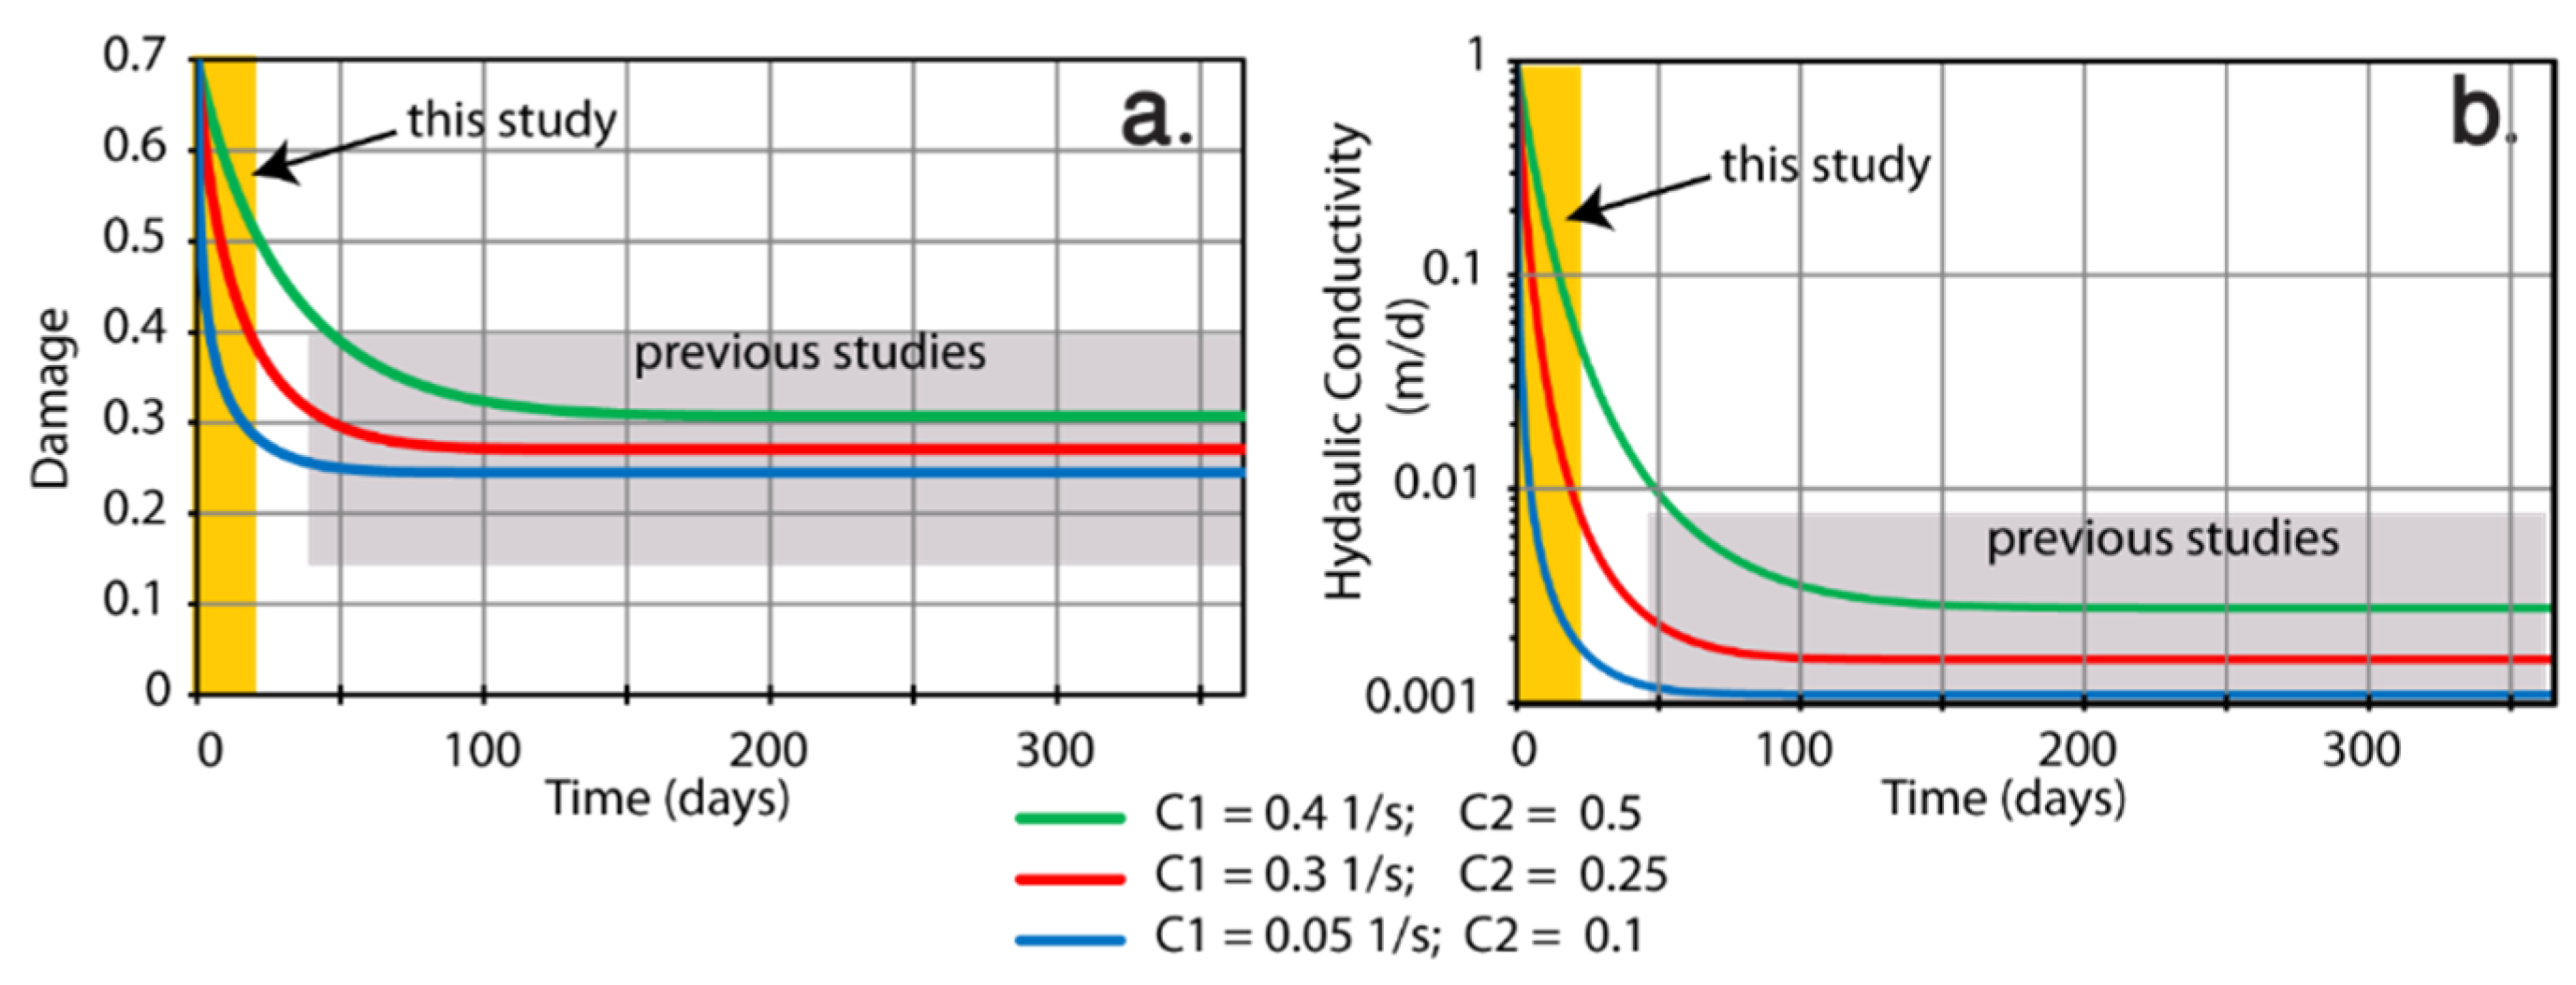
Fault zone permeability can be used as a proxy for fracturing and healing. Groundwater observations and modeling presented in this study demonstrate significant permeability increase (above two orders of magnitude) induced by remote Elazığ earthquake, and relatively fast recovery, with a duration of several days (Figure 9). There are many reports of permeability changes of regional aquifer following earthquakes that cause water level changes and increased spring discharge [59,60,61]. To the best of our knowledge, there is no field documentation of fault zones, showing rates of post-seismic permeability change at time-scale of hours to days. Contrary to the present study, previous observations reported relatively small permeability variations, representing the time window well after the earthquake (Figure 10). For example, Xue et al. [62] used the tidal response of water level in a deep borehole drilled into a ruptured fault zone to track permeability. They observed healing rates that reduced the permeability by a factor of 1.5 during a few months. Similar results were also reported by Shi and Wang, [63,64]. Injection experiments showed a decrease of 50% of the permeability in three years following the Kobe earthquake [65]. In Nojima fault, the permeability stabilized eight years after the occurrence of the earthquake [66]. Tidal analysis requires that the length of the recorded observations should be at least a few days for meaningful property monitoring. Pumping tests cannot be carried out continuously because, depending on the hydraulic properties, relatively long periods are required for recovery. Neither of the methods (tidal analysis and pumping tests) can monitor permeability at a frequency greater than days.
The gradual material recovery in laboratory experiments and the reported post-seismic velocity changes after strong earthquakes are often modeled with a logarithmic fit [19,20,67,68,69,70,71]. The logarithmic function predicts relatively fast healing rate immediately after the event with a gradual decrease in its rate. As noted by Qiu et al. [72], the logarithmic function suffers from an overshooting issue in curve fitting over long periods. Strong healing is not consistent with long-living wide fault zone damage persisted for hundreds or thousands of years with no significant healing. In order to resolve this contradiction, Hobiger et al. [73] suggested using an exponential function to fit the velocity variation curves. Qiu et al. [72] noted that the post-seismic recovery process could be described by either an exponential or logarithmic function.
Here we suggest that relatively short-term healing might be described by a Dieterich type logarithmic relation (Equation (1)) or damage decrease according to the damage-dependent kinetics (Equation (3)). Neglecting any time-dependent stress variations, the damage healing equation (Equation (3)) predicts logarithmic-in-time healing (Equation (4)) similar to the Dieterich equation (Equation (1)). Such constant stress conditions are typical for laboratory experiments and could be utilized for relatively short periods of time in field observations. The complete damage kinetic equation considers three-dimensional structure of the stress or strain tensor and includes the condition for the transition between damage growth and recovery [51]. Even under constant confining pressure, shear stress significantly decreases the rate of material recovery and may even lead to its repeated accumulation when the onset of damage condition is satisfied. Such a decrease in the healing rate leads to the damage stabilization schematically shown in Figure 10. In this case, we start with almost constant load during the initial stage leading to logarithmic healing and reduce the strain function leading to damage stabilization at the level between 0.2 and 0.3, which are values reported for the study area [43].
7. Conclusions
The water level in water wells in the Lower Yarmouk Gorge responded to the remote 2020 Elazığ Mw 6.8 earthquake. The response included a sustain change during the passage of the seismic waves and a post-seismic diffusive response to an activation of a nearby fault. Immediately after the passage of the seismic waves, pressure started to change in all wells. The high pressure in the deep Judea aquifer started to decrease and the lower pressure in the shallower Ghareb-Mishash aquifer started to increase. During the first 10 days, the water level in Meizar 1 well decreased by 40 cm and then recovered towards its pre-event value. In Meizar 3 well, the water level increased by 90 cm and then started to decay back to its pre-event value. The increased damage of the fault allowed for water flow from the deep-pressurized aquifer to the shallow aquifer. As a result, water level decreased in the deep aquifer and increased in the shallow aquifer. Numerical modeling suggest that the hydraulic conductivity of the fault decreased by an order of magnitude within three days. To the best of our knowledge, such fast healing/sealing was never observed by hydrological processes in the field.
Author Contributions
Conceptualization, E.S. and V.L.; methodology, H.L.; software, I.K. and V.L.; validation, H.L. formal analysis, E.S.; writing—original draft preparation, E.S..; writing—review and editing, E.S. and I.K; visualization, I.K. All authors have read and agreed to the published version of the manuscript.
Funding
This study was supported by grant from the Israel Science Foundation (ISF 363/20).
Institutional Review Board Statement
Not applicable.
Informed Consent Statement
Not applicable.
Data Availability Statement
Water level data are available at http://www.hydroshare.org/resource/7147781a9bf44d00b441059dff161814 on 17 December 2021. All data can be obtained from the corresponding author by request.
Conflicts of Interest
The authors declare no conflict of interest.
References
- Yehya, A.; Rice, J.R. Influence of Fluid-Assisted Healing on Fault Permeability Structure. J. Geophys. Res. Solid Earth 2020, 125, e2020JB020553. [Google Scholar] [CrossRef]
- Sibson, R.H. Implications of fault-valve behaviour for rupture nucleation and recurrence. Tectonophysics 1992, 211, 283–293. [Google Scholar] [CrossRef]
- King, G.C.P.; Wood, R.M. The impact of earthquakes on fluids in the crust. Ann. Geophys. 1994, 37, 6. [Google Scholar] [CrossRef]
- Brenguier, F.; Campillo, M.; Hadziioannou, C.; Shapiro, N.M.; Nadeau, R.M.; Larose, E. Postseismic Relaxation Along the San Andreas Fault at Parkfield from Continuous Seismological Observations. Science 2008, 321, 1478–1481. [Google Scholar] [CrossRef] [Green Version]
- Li, Y.-G.; Vidale, J.E.; Aki, K.; Xu, F.; Burdette, T. Evidence of Shallow Fault Zone Strengthening After the 1992 M 7.5 Landers, California, Earthquake. Science 1998, 279, 217–219. [Google Scholar] [CrossRef] [Green Version]
- Wu, C.; Peng, Z.; Ben-Zion, Y. Non-linearity and temporal changes of fault zone site response associated with strong ground motion. Geophys. J. Int. 2009, 176, 265–278. [Google Scholar] [CrossRef] [Green Version]
- Brodsky, E.E.; Roeloffs, E.; Woodcock, D.; Gall, I.; Manga, M. A mechanism for sustained groundwater pressure changes induced by distant earthquakes. J. Geophys. Res. Space Phys. 2003, 108. [Google Scholar] [CrossRef] [Green Version]
- Manga, M.; Beresnev, I.; Brodsky, E.; Elkhoury, J.E.; Elsworth, D.; Ingebritsen, S.E.; Mays, D.C.; Wang, C.-Y. Changes in permeability caused by transient stresses: Field observations, experiments, and mechanisms. Rev. Geophys. 2012, 50. [Google Scholar] [CrossRef]
- Shi, Z.; Wang, G.; Manga, M.; Wang, C.Y. Mechanism of co-seismic water level change following four great earthquakes—insights from co-seismic responses throughout the Chinese mainland. Earth Planet. Sci. Lett. 2015, 430, 66–74. [Google Scholar] [CrossRef] [Green Version]
- Shi, Z.; Zhang, S.; Yan, R.; Wang, G. Fault Zone Permeability Decrease Following Large Earthquakes in a Hydrothermal System. Geophys. Res. Lett. 2018, 45, 1387–1394. [Google Scholar] [CrossRef]
- Sun, X.; Xiang, Y. Heterogeneous Permeability Changes along a Fault Zone Caused by the Xingwen M5.7 Earthquake in SW China. Geophys. Res. Lett. 2019, 46, 14404–14411. [Google Scholar] [CrossRef]
- Ma, Y.; Wang, G.; Yan, R.; Wang, B. Long-term In Situ Permeability Variations of an Active Fault Zone in the Interseismic Period. Pure Appl. Geophys. 2019, 176, 5279–5289. [Google Scholar] [CrossRef]
- Wang, C.; Liao, X.; Wang, L.; Wang, C.; Manga, M. Large earthquakes create vertical permeability by breaching aquitards. Water Resour. Res. 2016, 52, 5923–5937. [Google Scholar] [CrossRef] [Green Version]
- Barbour, A.J. Pore pressure sensitivities to dynamic strains: Observations in active tectonic regions. J. Geophys. Res. Solid Earth 2015, 120, 5863–5883. [Google Scholar] [CrossRef]
- Aben, F.M.; Doan, M.-L.; Gratier, J.-P.; Renard, F. Experimental postseismic recovery of fractured rocks assisted by calcite sealing. Geophys. Res. Lett. 2017, 44, 7228–7238. [Google Scholar] [CrossRef] [Green Version]
- Brantley, S.L.; Evans, B.; Hickman, S.H.; Crerar, D.A. Healing of microcracks in quartz: Implications for fluid flow. Geology 1990, 18, 136–139. [Google Scholar] [CrossRef]
- Im, K.; Elsworth, D.; Fang, Y. The influence of Preslip Sealing on the Permeability Evolution of Fractures and Faults. Geophys. Res. Lett. 2018, 45, 166–175. [Google Scholar] [CrossRef] [Green Version]
- Menefee, A.H.; Welch, N.J.; Frash, L.P.; Hicks, W.; Carey, J.W.; Ellis, B.R. Rapid Mineral Precipitation During Shear Fracturing of Carbonate-Rich Shales. J. Geophys. Res. Solid Earth 2020, 125, e2019JB018864. [Google Scholar] [CrossRef]
- Dieterich, J.H. Time-dependent friction in rocks. J. Geophys. Res. Space Phys. 1972, 77, 3690–3697. [Google Scholar] [CrossRef]
- Dieterich, J.H. Time-dependent friction and the mechanics of stick-slip. Pure Appl. Geophys. 1978, 116, 790–806. [Google Scholar] [CrossRef]
- Dieterich, J.H.; Kilgore, B. Imaging surface contacts: Power law contact distributions and contact stresses in quartz, calcite, glass and acrylic plastic. Tectonophysics 1996, 256, 219–239. [Google Scholar] [CrossRef]
- Scholz, C.H. The Mechanics of Earthquakes and Faulting; Cambridge University Press: Cambridge, UK, 2019. [Google Scholar]
- Chen, J.; Ende, M.P.A.V.D.; Niemeijer, A.R. Microphysical Model Predictions of Fault Restrengthening Under Room-Humidity and Hydrothermal Conditions: From Logarithmic to Power-Law Healing. J. Geophys. Res. Solid Earth 2020, 125. [Google Scholar] [CrossRef] [PubMed] [Green Version]
- Moore, D.E.; Lockner, D.A.; Byerlee, J.D. Reduction of Permeability in Granite at Elevated Temperatures. Science 1994, 265, 1558–1561. [Google Scholar] [CrossRef] [PubMed] [Green Version]
- Richard, J.; Doan, M.-L.; Gratier, J.-P.; Renard, F. Microstructures Induced in Porous Limestone by Dynamic Loading, and Fracture Healing: An Experimental Approach. Pure Appl. Geophys. 2014, 172, 1269–1290. [Google Scholar] [CrossRef]
- Tenthorey, E.; Fitz Gerald, J.D. Feedbacks between deformation, hydrothermal reaction and permeability evolution in the crust: Experimental insights. Earth Planet. Sci. Lett. 2006, 247, 117–129. [Google Scholar] [CrossRef]
- Vidale, J.E.; Li, Y.-G. Damage to the shallow Landers fault from the nearby Hector Mine earthquake. Nature 2003, 421, 524–526. [Google Scholar] [CrossRef]
- Hiramatsu, Y.; Honma, H.; Furumoto, M.; Ooida, T.; Saiga, A. Seismological evidence on characteristic time of crack healing in the shallow crust. Geophys. Res. Lett. 2005, 32. [Google Scholar] [CrossRef] [Green Version]
- Schaff, D.P.; Beroza, G.C. Coseismic and postseismic velocity changes measured by repeating earthquakes. J. Geophys. Res. Space Phys. 2004, 109. [Google Scholar] [CrossRef]
- Cochran, E.S.; Vidale, J.E.; Tanaka, S. Earth Tides Can Trigger Shallow Thrust Fault Earthquakes. Science 2004, 306, 1164–1166. [Google Scholar] [CrossRef] [Green Version]
- Mitchell, T.; Faulkner, D. Towards quantifying the matrix permeability of fault damage zones in low porosity rocks. Earth Planet. Sci. Lett. 2012, 339–340, 24–31. [Google Scholar] [CrossRef]
- Siebert, C.; Möller, P.; Geyer, S.; Kraushaar, S.; Dulski, P.; Guttman, J.; Subah, A.; Rödiger, T. Thermal waters in the Lower Yarmouk Gorge and their relation to surrounding aquifers. Geochemistry 2014, 74, 425–441. [Google Scholar] [CrossRef]
- Hsieh, P.A. Deformation-Induced Changes in Hydraulic Head During Ground-Water Withdrawal. Groundwater 1996, 34, 1082–1089. [Google Scholar] [CrossRef]
- Wolff, R.G. Relationship between Horizontal Strain near a Well and Reverse Water Level Fluctuation. Water Resour. Res. 1970, 6, 1721–1728. [Google Scholar] [CrossRef]
- Verruijt, A. Elastic Storage of Aquifers. In Flow Through Porous Media; de Weist, R.J.M., Ed.; Academic Press: New York, NY, USA, 1969; pp. 331–376. [Google Scholar]
- Langguth, H.; Treskatis, C. Reverse water level fluctuations in semiconfined aquifer systems—“rhade effect”. J. Hydrol. 1989, 109, 79–93. [Google Scholar] [CrossRef]
- Burbey, T.J. Poroelastic Effects on Fracture Characterization. Groundwater 2013, 51, 904–913. [Google Scholar] [CrossRef]
- Gellasch, C.A.; Wang, H.F.; Bradbury, K.R.; Bahr, J.M.; Lande, L.L. Reverse Water-Level Fluctuations Associated with Fracture Connectivity. Groundwater 2013, 52, 105–117. [Google Scholar] [CrossRef]
- Kurzon, I.; Nof, R.N.; Laporte, M.; Lutzky, H.; Polozov, A.; Zakosky, D.; Shulman, H.; Goldenberg, A.; Tatham, B.; Hamiel, Y. The “TRUAA” Seismic Network: Upgrading the Israel Seismic Network—Toward National Earthquake Early Warning System. Seism. Res. Lett. 2020, 91, 3236–3255. [Google Scholar] [CrossRef]
- Pousse-Beltran, L.; Nissen, E.; Bergman, E.A.; Cambaz, M.D.; Gaudreau, É.; Karasözen, E.; Tan, F. The 2020 Mw 6.8 Elazığ (Turkey) Earthquake Reveals Rupture Behavior of the East Anatolian Fault. Geophys. Res. Lett. 2020, 47. [Google Scholar] [CrossRef]
- Ragon, T.; Simons, M.; Bletery, Q.; Cavalié, O.; Fielding, E. A Stochastic View of the 2020 Elazığ Mw 6.8 Earthquake (Turkey). Geophys. Res. Lett. 2021, 48. [Google Scholar] [CrossRef]
- Shalev, E.; Kurzon, I.; Doan, M.-L.; Lyakhovsky, V. Water-level oscillations caused by volumetric and deviatoric dynamic strains. Geophys. J. Int. 2015, 204, 841–851. [Google Scholar] [CrossRef]
- Shalev, E.; Kurzon, I.; Doan, M.-L.; Lyakhovsky, V. Sustained water-level changes caused by damage and compaction induced by teleseismic earthquakes. J. Geophys. Res. Solid Earth 2016, 121, 4943–4954. [Google Scholar] [CrossRef]
- Kitagawa, Y.; Itaba, S.; Matsumoto, N.; Koizumi, N. Frequency characteristics of the response of water pressure in a closed well to volumetric strain in the high-frequency domain. J. Geophys. Res. Space Phys. 2011, 116. [Google Scholar] [CrossRef] [Green Version]
- Blanpied, M.L.; Marone, C.J.; Lockner, D.A.; Byerlee, J.D.; King, D.P. Quantitative measure of the variation in fault rheology due to fluid-rock interactions. J. Geophys. Res. Space Phys. 1998, 103, 9691–9712. [Google Scholar] [CrossRef]
- He, C.; Tan, W.; Zhang, L. Comparing dry and wet friction of plagioclase: Implication to the mechanism of frictional evolution effect at hydrothermal conditions. J. Geophys. Res. Solid Earth 2016, 121, 6365–6383. [Google Scholar] [CrossRef] [Green Version]
- Ende, M.V.D.; Chen, J.; Ampuero, J.-P.; Niemeijer, A. A comparison between rate-and-state friction and microphysical models, based on numerical simulations of fault slip. Tectonophysics 2018, 733, 273–295. [Google Scholar] [CrossRef]
- Bos, B.; Spiers, C.J. Fluid-assisted Healing Processes in Gouge-bearing Faults: Insights from Experiments on a Rock Analogue System. Pure Appl. Geophys. 2002, 159, 2537–2566. [Google Scholar] [CrossRef]
- Tal, Y.; Rubino, V.; Rosakis, A.J.; Lapusta, N. Illuminating the physics of dynamic friction through laboratory earthquakes on thrust faults. Proc. Natl. Acad. Sci. USA 2020, 117, 21095–21100. [Google Scholar] [CrossRef] [PubMed]
- Rubino, V.; Rosakis, A.J.; Nadia, L. Data set for: Understanding dynamic friction through spontaneously evolving laboratory earthquakes. Nat. Commun. 2017, 8, 1–13. [Google Scholar] [CrossRef] [Green Version]
- Lyakhovsky, V.; Ben-Zion, Y.; Agnon, A. Distributed damage, faulting, and friction. J. Geophys. Res. Space Phys. 1997, 102, 27635–27649. [Google Scholar] [CrossRef]
- Lyakhovsky, V.; Ben-Zion, Y.; Agnon, A. A viscoelastic damage rheology and rate- and state-dependent friction. Geophys. J. Int. 2005, 161, 179–190. [Google Scholar] [CrossRef]
- Finzi, Y.; Hearn, E.H.; Ben-Zion, Y.; Lyakhovsky, V. Structural Properties and Deformation Patterns of Evolving Strike-slip Faults: Numerical Simulations Incorporating Damage Rheology. Pure Appl. Geophys. 2009, 166, 1537–1573. [Google Scholar] [CrossRef] [Green Version]
- Suzuki, K.; Oda, M.; Yamazaki, M.; Kuwahara, T. Permeability changes in granite with crack growth during immersion in hot water. Int. J. Rock Mech. Min. Sci. 1998, 35, 907–921. [Google Scholar] [CrossRef]
- Souley, M.; Homand, F.; Pepa, S.; Hoxha, D. Damage-induced permeability changes in granite: A case example at the URL in Canada. Int. J. Rock Mech. Min. Sci. 2001, 38, 297–310. [Google Scholar] [CrossRef]
- Oda, M.; Takemura, T.; Aoki, T. Damage growth and permeability change in triaxial compression tests of Inada granite. Mech. Mater. 2002, 34, 313–331. [Google Scholar] [CrossRef]
- Lyakhovsky, V.; Shalev, E. Runaway Versus Stable Fracturing During Hydraulic Stimulation: Insights from the Damage Rheology Modeling. Rock Mech. Rock Eng. 2021, 54, 5449–5464. [Google Scholar] [CrossRef]
- Diersch, H.-J.G. Finite Element Modeling of Flow, Mass and Heat Transport in Porous and Fractured Media; Springer Science and Business Media LLC: Berlin, Germany, 2014; p. 996. [Google Scholar]
- Kagabu, M.; Ide, K.; Hosono, T.; Nakagawa, K.; Shimada, J. Describing coseismic groundwater level rise using tank model in volcanic aquifers, Kumamoto, southern Japan. J. Hydrol. 2019, 582, 124464. [Google Scholar] [CrossRef]
- Wang, C.-Y.; Manga, M. New streams and springs after the 2014 Mw6.0 South Napa earthquake. Nat. Commun. 2015, 6, 7597. [Google Scholar] [CrossRef] [Green Version]
- Rojstaczer, S.; Wolf, S.; Michel, R. Permeability enhancement in the shallow crust as a cause of earthquake-induced hydrological changes. Nat. Cell Biol. 1995, 373, 237–239. [Google Scholar] [CrossRef]
- Xue, L.; Li, H.-B.; Brodsky, E.E.; Xu, Z.-Q.; Kano, Y.; Wang, H.; Mori, J.J.; Si, J.-L.; Pei, J.-L.; Zhang, W.; et al. Continuous Permeability Measurements Record Healing Inside the Wenchuan Earthquake Fault Zone. Science 2013, 340, 1555–1559. [Google Scholar] [CrossRef]
- Shi, Z.; Wang, G. Aquifers switched from confined to semiconfined by earthquakes. Geophys. Res. Lett. 2016, 43, 11, 166–11, 172. [Google Scholar] [CrossRef]
- Shi, Z.; Wang, G. Sustained groundwater level changes and permeability variation in a fault zone following the 12 May 2008, Mw7.9 Wenchuan earthquake. Hydrol. Process. 2014, 29, 2659–2667. [Google Scholar] [CrossRef]
- Kitagawa, Y.; Fujimori, K.; Koizumi, N. Temporal change in permeability of the rock estimated from repeated water injection experiments near the Nojima fault in Awaji Island, Japan. Geophys. Res. Lett. 2002, 29, 121-1–121-4. [Google Scholar] [CrossRef]
- Kitagawa, Y.; Kano, Y. Changes in permeability of the Nojima fault damage zone inferred from repeated water injection experiments. Earth Planets Space 2016, 68, 206. [Google Scholar] [CrossRef] [Green Version]
- Peng, Z.; Ben-Zion, Y. Temporal Changes of Shallow Seismic Velocity Around the Karadere-Düzce Branch of the North Anatolian Fault and Strong Ground Motion. Pure Appl. Geophys. 2006, 163, 567–600. [Google Scholar] [CrossRef]
- Rubinstein, J.L.; Uchida, N.; Beroza, G.C. Seismic velocity reductions caused by the 2003 Tokachi-Oki earthquake. J. Geophys. Res. Space Phys. 2007, 112. [Google Scholar] [CrossRef] [Green Version]
- Rubinstein, J.L.; Beroza, G.C. Nonlinear strong ground motion in the ML5.4 Chittenden earthquake: Evidence that preexisting damage increases susceptibility to further damage. Geophys. Res. Lett. 2004, 31, L23614. [Google Scholar] [CrossRef]
- Sawazaki, K.; Sato, H.; Nakahara, H.; Nishimura, T. Time-Lapse Changes of Seismic Velocity in the Shallow Ground Caused by Strong Ground Motion Shock of the 2000 Western-Tottori Earthquake, Japan, as Revealed from Coda Deconvolution Analysis. Bull. Seism. Soc. Am. 2009, 99, 352–366. [Google Scholar] [CrossRef]
- Wang, S.-Y.; Zhuang, H.-Y.; Zhang, H.; He, H.-J.; Jiang, W.-P.; Yao, E.-L.; Ruan, B.; Wu, Y.-X.; Miao, Y. Near-surface softening and healing in eastern Honshu associated with the 2011 magnitude-9 Tohoku-Oki Earthquake. Nat. Commun. 2021, 12, 1215. [Google Scholar] [CrossRef]
- Qiu, H.; Hillers, G.; Ben-Zion, Y. Temporal changes of seismic velocities in the San Jacinto Fault zone associated with the 2016 Mw 5.2 Borrego Springs earthquake. Geophys. J. Int. 2019, 220, 1536–1554. [Google Scholar] [CrossRef]
- Hobiger, M.; Wegler, U.; Shiomi, K.; Nakahara, H. Coseismic and post-seismic velocity changes detected by Passive Image Interferometry: Comparison of one great and five strong earthquakes in Japan. Geophys. J. Int. 2016, 205, 1053–1073. [Google Scholar] [CrossRef]
Figure 1.
Location mapshowing the Meizar 1, 2, and 3 wells, providing water level data, and GLHS seismic station, providing seismic data; all for the remote 24.1.2020 Elazığ Mw 6.8 earthquake (red star), including co-seismic and post seismic changes. Blue arrows mark regional groundwater flow directions. The black lines and dashed lines represent faults and suggested fault locations, respectively. The gray box represents the numerical model area that also extends 30 km to the north.

Figure 2.
Cross section between the Meizar wells. Both Mishash-Ghareb and Judea aquifers are confined. Meizar 2 and 3 wells are artesian. Meizar 1 is not an artesian well due to its higher elevation.
Figure 2.
Cross section between the Meizar wells. Both Mishash-Ghareb and Judea aquifers are confined. Meizar 2 and 3 wells are artesian. Meizar 1 is not an artesian well due to its higher elevation.

Figure 3.
Pumping tests in Meizar 2 and 3 wells. (a) Both pumping tests; (b) pumping in Meizar 2 and the corresponding water pressure in Meizar 3; (c) pumping in Meizar 3 and the water pressure in Meizar 2. The wells are not hydraulically affected by pumping in the other well. Meizar 3 is elastically responding to the unloading caused by the withdrawal of water from Meizar 2 (“reverse water level effect”). The recovery of the level in Meizar 2 is higher than the original water level because of thermal effects. Water in the wellbore is hot after the pumping and cools down with time and thereby decreasing the pressure.

Figure 4.
Seismograms and hydro-seismograms of the remote 2020 Elazığ Mw 6.8 earthquake in the Lower Yarmouk Gorge. Upper 3 channels are for stations GLHS, rotating the velocities measured by the Broadband sensor to RTZ orientation. P, S, Love (L) and Rayleigh (R), arrivals are marked. Below are the Meizar wells. While Meizar 2 and 3 wells show similar wave packets, as seen in the GLHS channels, Meizar 1 well shows a significant long-period signal. This signal masks the higher frequencies of the earthquake.

Figure 5.
Filtering the waveforms, using the Butterworth low-pass filter with 4 poles at 0.02 Hz, shows that the low frequency signals that Meizar 1 reacts to, is part of the signal reaching both the borehole and station, and is a low frequency component of the seismic energy of the event.
Figure 5.
Filtering the waveforms, using the Butterworth low-pass filter with 4 poles at 0.02 Hz, shows that the low frequency signals that Meizar 1 reacts to, is part of the signal reaching both the borehole and station, and is a low frequency component of the seismic energy of the event.

Figure 6.
Water level data measured in Meizar 1 (a) and 3 (b) wells showing the effect of the remote 2020 Elazığ Mw 6.8 earthquake on the Meizar wells. (c) Barometric pressure and rainfall data.
Figure 6.
Water level data measured in Meizar 1 (a) and 3 (b) wells showing the effect of the remote 2020 Elazığ Mw 6.8 earthquake on the Meizar wells. (c) Barometric pressure and rainfall data.

Figure 7.
Hydrological model setup.

Figure 8.
Fault healing with time (Equation (4)). Three healing parameter sets options are considered for this case.
Figure 8.
Fault healing with time (Equation (4)). Three healing parameter sets options are considered for this case.

Figure 9.
Water level data and model results: (a) measured water level in Meizar 1 well (black) along with simulated water levels using different healing parameters; (b) measured water level in Meizar 3 well (black) along with simulated water levels using different healing parameters.
Figure 9.
Water level data and model results: (a) measured water level in Meizar 1 well (black) along with simulated water levels using different healing parameters; (b) measured water level in Meizar 3 well (black) along with simulated water levels using different healing parameters.

Figure 10.
Evolution of fault healing (a) and hydraulic conductivity (b). This study shows the rapid healing immediately after the triggered damage increase whereas previous studies only measured healing weeks after the events.
Figure 10.
Evolution of fault healing (a) and hydraulic conductivity (b). This study shows the rapid healing immediately after the triggered damage increase whereas previous studies only measured healing weeks after the events.


Table 1.
Basic data of the three wells.
| Well Name | Depth (m) | Casing Length (m) | Diameter of Well (m) | Diameter of Bare Hole (m) | Aquifer Lithology |
|---|---|---|---|---|---|
| Meizar 1 | 1250 | 954 | 0.34–0.71 | 0.31 | dolomite |
| Meizar 2 | 807 | 448 | 0.34–0.51 | 0.31 | dolomite |
| Meizar 3 | 336 | 80 | 0.38–0.51 | 0.35 | chalk, marl |
Publisher’s Note: MDPI stays neutral with regard to jurisdictional claims in published maps and institutional affiliations. |
© 2021 by the authors. Licensee MDPI, Basel, Switzerland. This article is an open access article distributed under the terms and conditions of the Creative Commons Attribution (CC BY) license (https://creativecommons.org/licenses/by/4.0/).
Share and Cite
MDPI and ACS Style
Shalev, E.; Lutzky, H.; Kurzon, I.; Lyakhovsky, V. Remote Triggering of Damage Followed by Healing Recorded in Groundwater Pressure. Water 2021, 13, 3656. https://doi.org/10.3390/w13243656
AMA Style
Shalev E, Lutzky H, Kurzon I, Lyakhovsky V. Remote Triggering of Damage Followed by Healing Recorded in Groundwater Pressure. Water. 2021; 13(24):3656. https://doi.org/10.3390/w13243656
Chicago/Turabian StyleShalev, Eyal, Hallel Lutzky, Ittai Kurzon, and Vladimir Lyakhovsky. 2021. "Remote Triggering of Damage Followed by Healing Recorded in Groundwater Pressure" Water 13, no. 24: 3656. https://doi.org/10.3390/w13243656
Note that from the first issue of 2016, this journal uses article numbers instead of page numbers. See further details here.