Article

Drought Vulnerability Assessment and Cluster Analysis of Island Areas Taking Korean Island Areas at Eup (Town) and Myeon (Subcounty) Levels as Study Targets

1
P&I HUMANKOREA-Research Institute, 167 Songpa-daero, Songpa-gu, Seoul 05855, Korea
2
Department of Environment Research, Korea Institute of Civil Engineering and Building Technology, Goyangdae-ro, Goyang-si 10223, Korea
*
Author to whom correspondence should be addressed.
Water 2021, 13(24), 3657; https://doi.org/10.3390/w13243657
Submission received: 7 September 2021 / Revised: 29 November 2021 / Accepted: 1 December 2021 / Published: 20 December 2021
(This article belongs to the Section Water Resources Management, Policy and Governance)

Abstract

:
The purpose of this study is to conduct drought vulnerability assessment and cluster analysis of Korean island areas at eup (town) myeon (subcounty) level. Drought vulnerability assessment was conducted using factor analysis and entropy method, and cluster analysis was analyzed using K-means, a nonhierarchical cluster analysis method. Vulnerability consisted of climate exposure, sensitivity, and adaptive capacity. Twenty-two indicators were used to evaluate and analyze vulnerability of drought in small island areas. The results of entropy method showed that winter rainfall, no rainfall days, agricultural population rate, cultivation area rate, water supply rate and groundwater capacity have a substantial impact on drought assessment. The overall assessment of vulnerability indicated that Seodo-myeon Ganghwa-gun, Seolcheon-myeon Namhae-gun, and Samsan-myeon Ganghwa-gun were most vulnerable to drought. The cluster analysis was evaluated by categorizing the regions into three clusters, and policy support and planning are needed to suit the characteristics of each cluster was observed.

1. Introduction

Recently, severe climate change around the world has caused frequent disasters and extreme weather events, such as droughts, floods, cold waves, and severely hot weather. In particular, droughts among natural disasters are more persistent than others and cause great social and economic damage owing to their wide-ranging impact [1]. Global economic losses caused by droughts are estimated at US$ 6–8 billion per year, which is significantly more than that from other meteorological disasters [2].
Korea is also experiencing an increasing frequency of droughts owing to climate change, and extreme droughts of greater scale and longer duration than in the past are occurring [1]. Some studies [1,3] have reported that drought damage will be more frequent owing to the climate change effects, and therefore, continuous efforts are needed to cope with droughts.
According to the Korea Maritime Institute [4], there are 3348 islands in Korea, 472 of which are inhabited islands and 2876 are uninhabited islands. So Korea is the fourth-largest archipelago country in the world after Indonesia, the Philippines, and Japan. Since 884,156 people live in the inhabited island, efforts to cope with drought in the island area are required in case of drought.
Due to lack of rivers and the development of the water source is difficult geographically, drinking water supply is very unstable in case of island area [5]. Therefore, these areas are severely prone to water shortages caused by drought and are vulnerable to natural disasters, such as typhoons and droughts [5,6]. Most island areas rely on a single source of water, such as groundwater, and suffer from depletion of drinking water even during short-term droughts [6]. In island areas, drought-induced water shortages and damage are frequent; however, the relevant studies are limited and mainly limited to facilities and water supply systems to address water shortages [6,7,8,9,10]. To effectively deal with extreme drought and reduce drought damage, appropriate policy-level measures should be established. For this, vulnerability assessment must be preceded in the target areas considering various index that can result from drought [11].
The concept of vulnerability is widely applied in many fields, and because of its ambiguity, its various models are available, and generally the concepts of vulnerability in Intergovernmental Panel on Climate Change (IPCC) and United Nations Development Programme (UNDP) are used a lot [12,13]. UNDP [14] regards climate change vulnerability as a function of the system’s sensitivity to and adaptive capacity to the stimulus of climate change and focuses on enhancing adaptive capacity to external factors and developing measures to reduce the negative effects of climate change on vulnerable people. If the effects of climate change are large and adaptive capacity of a system is weak, the system is said to be highly vulnerable. However, even if the effects of climate change are large, the system with strong adaptive capacity can have opportunities for development if they adapt appropriately [14]. The IPCC sees that vulnerability can be evaluated through a functional relationship between climate change characteristics and sensitivity and adaptive capacity, and opines that for vulnerability assessment, we have to consider the biological and physical impacts and socioeconomic aspects of climate change simultaneously after integrating the various sectors that could be affected by climate change [15,16,17].
Many droughts vulnerability studies [18,19,20] have been done at agriculture aspects, with extensive discussions on framework building [21], methodology [22], and index selection [23]. Various drought indexes have been developed to estimate drought vulnerability. Indicators related to agriculture, such as terrain, crop diversity, nonagricultural share of GDP and grain yield are applicable to agricultural drought vulnerability, which have been widely used [3,24].
Kim et al. [11] performed drought vulnerability analysis by applying principal component analysis and entropy techniques. Park et al. [25] evaluated regional drought risk by calculating drought exposure indices and drought vulnerability indices, whereas Yang and Kim [26] conducted drought vulnerability assessments in the Nakdong-gang River basin by applying Delphi techniques.
In a vulnerability assessment study of islands, Lee et al. [5] conducted a water supply vulnerability assessment by calculating water shortages in Sinan-gun, Jeollanam-do, Korea, but it was limited to the water supply coping with various situations; therefore, it was insufficient for an integrated vulnerability assessment considering various indicators.
Vasilis Kanakoudis [27] also conducted a vulnerability assessment of water resources in the Greek island of Corfu considering climate characteristics, climate change, water resource availability, water quality, and water security. Prithvi Simha [28] conducted a vulnerability assessment of the water resources around the Greek island of Lesbos by applying quantitative tools to the freshwater system. However, these studies are limited to one island alone having no relative assessment criteria.
As seen so far, research on drought vulnerability assessment is being actively conducted mainly on state and mega cities, but there are insufficient studies on island areas using assessment tools presented by UNDP or IPCC to assess vulnerability. Island areas are small administrative districts due to regional characteristics, and are alienated from drought vulnerability assessment.
So, this study conducted a drought vulnerability assessment in island areas located in Eup (town) and Myeon (subcounty) using vulnerability assessment tools from UNDP. For the vulnerability assessment, drought vulnerability indicators suitable for island areas were selected through factor analysis, and vulnerability index was calculated using entropy techniques to apply objective weights, and drought vulnerability assessment was conducted in 90 island areas at eup or myeon level. In addition, the 90 islands were classified into three clusters through cluster analysis, and cluster similarities were defined to explore cluster-specific drought countermeasures.
By conducting a vulnerability assessment on small island areas suffering from severe drought due to climate change, this study derives systematic limitations of island areas. And this study can be used as basic data for pollical direction and priority decision for water supply support projects in the future.
Although vulnerability assessment for island areas, which are vulnerable to drought, is basic data for policy decisions, few studies have been conducted for vulnerability assessment. The objectives of this study are as follows.
First, drought vulnerability assessment was conducted on 90 island areas in eup (town) and myeon (subcounty) units, and vulnerable areas were evaluated.
Second, it is intended to provide basic information for drought response by providing a drought vulnerability map in island areas.
Third, it is intended to compare and analyze the similarity of clusters by cluster analysis of drought vulnerability and seek drought response measures for each cluster.

2. Materials and Methods

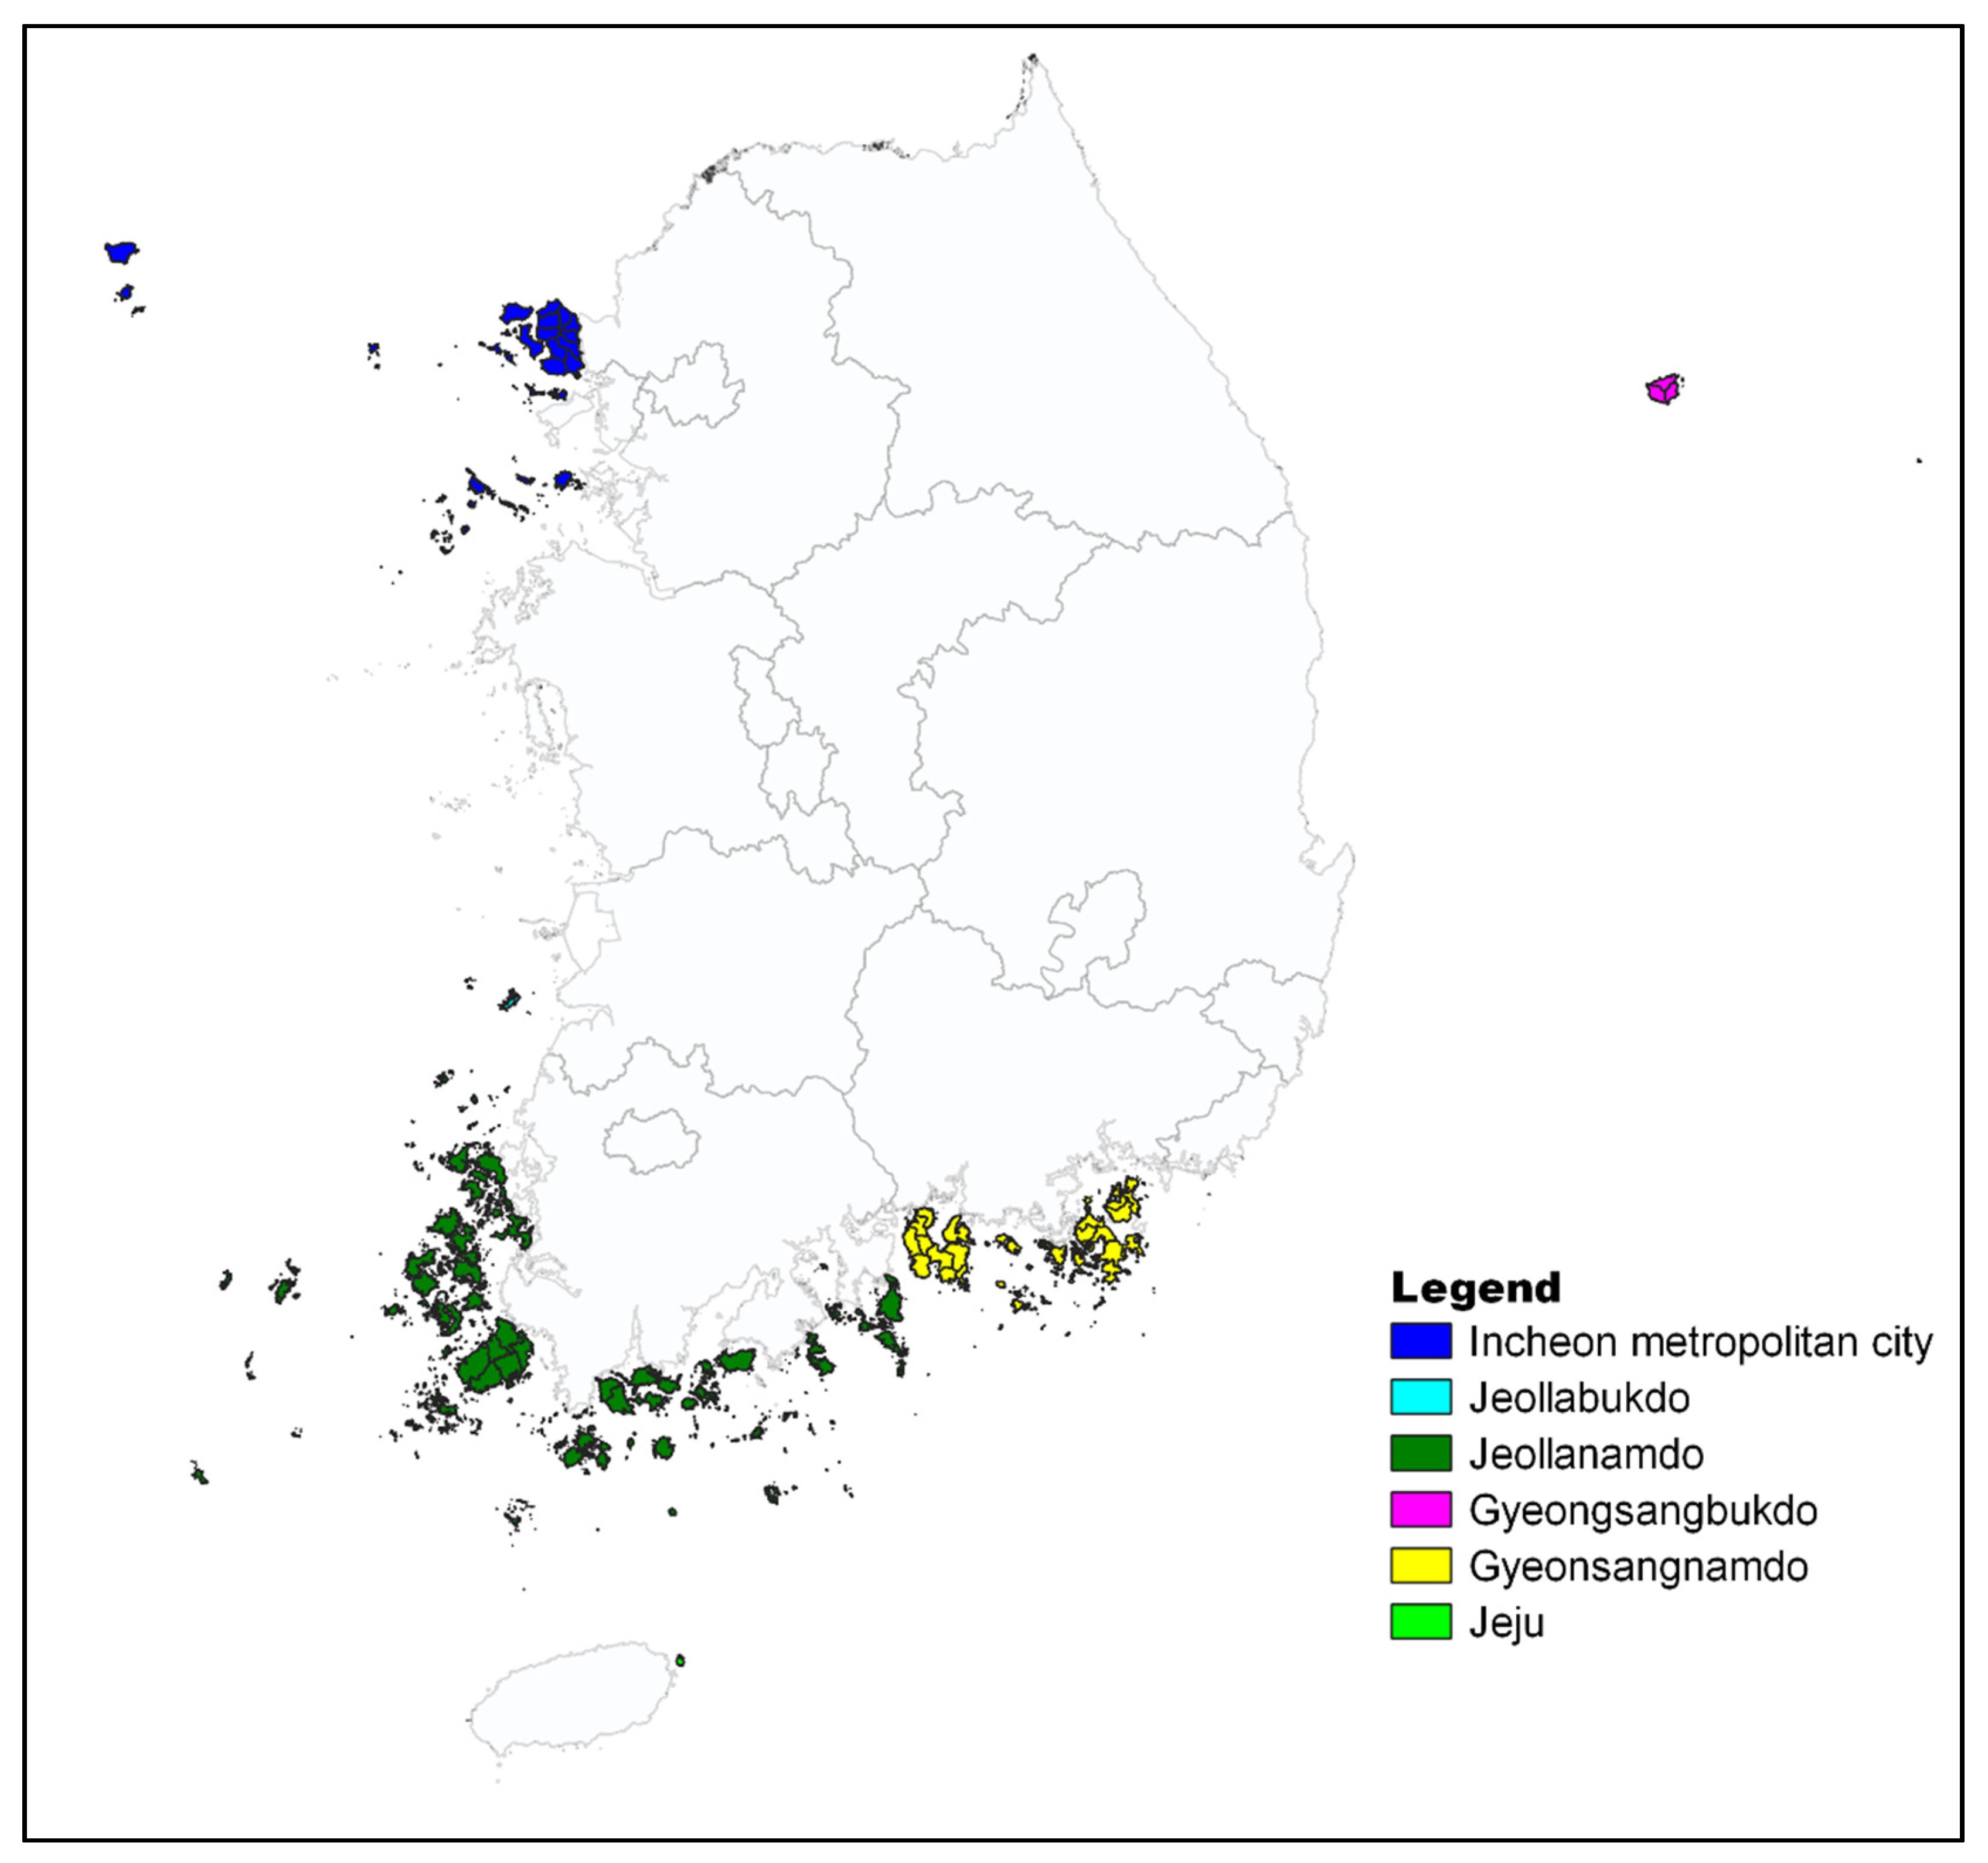
2.1. Study Target Areas and Data Collection

In this study, drought vulnerability assessment of the island areas was the main research task. Except for the main island of Jeju Island, island areas of eups and myeons, which are topographical islands, were selected as study target areas regardless of whether they are connected to land or not. Selected study target areas included 9 eups and 81 myeons over in one metropolitan city and five provinces, namely, Incheon Metropolitan City, Jeollabuk-do Province, Jeollanam-do Province, Gyeongsangbuk-do Province, Gyeongsangnam-do Province, and Jeju Province. Eup and myeon are one of the divisions of a county and some cities of fewer than 500,000 population in Korea. A eup is similar to the unit of town and a myeon is similar to the unit of township. Myeon have smaller populations than eup and represent the rural areas of a county or city. The list and map of the study areas are as shown in Table 1 and Figure 1.
The data used in this study were collected by the Vulnerability assessment tool To build climate change Adaptation Plan (VESTAP) program developed and distributed by the Korea Environment Institute. Since November 2014, Korea Environment Institute has been providing a Web-based VESTAP service to support local government to establish detailed implementation plans for climate change adaptation [29]. Vulnerabilities for 32 items can be evaluated by dividing them into health, disaster/disaster, agriculture, forest, marine/fisheries, water management, and ecosystem sectors. Among the water management sectors of the VESTAP program, drought-related indicators such as water quality vulnerability caused by drought, water (for daily living and agricultural water) vulnerability caused by long-term and short-term drought, water control vulnerability, and only the data of previously presented studies that could be arranged at eup and myeon levels were collected. It was classified into climate exposure, sensitivity, and adaptive capacity.
The data not available from VESTAP were obtained and supplemented by data from each local government statistical annual report and public data portal (www.data.go.kr/, accessed on 30 June 2021). The sources of data for each variable used in this study are as shown in Table 2. Obtaining the data in small administrative unit island areas was very difficult, so we collected as much data as possible.
Vulnerability assessment consists of three components: the degree of climate change (climate exposure index), the degree to which the system is sensitive to climate change (sensitivity index), and the degree to which the system can adapt to climate change (adaptive capacity index) [29]. Climate exposure index indicates that any stimulus or effect impacts the system. The data used in the climate exposure index are HadGEM3-RA climate model data, one of the RCM (Regular Climate Model) data provide by the Meteorological Administration as a national standard scenario, and past RCP (Representative Concentration Pathways) data were used. Since it was difficult to obtain weather data for towns and subcounty, VESTAP data using climate model were used in this study. The Standardized Precipitation Index (SPI), and the evaporative demand drought index (EDDI) were used for drought index. In general, two climatic factors, precipitation, and evaporation, are well used to define the occurrence of drought [30,31]. Since SPI defines drought owing to precipitation fluctuations and EDDI defines drought due to evaporation fluctuations, the two indices do not directly affect each other, both of which are widely used as indices representing meteorological drought [32]. Sensitivity index refers to how sensitive the system responds to climate effects and includes variables related to population, industry, and groundwater affected by climate exposure. Adaptive capacity index indicates the ability to adapt to climate change, and includes variables related to water supply rate, groundwater capacity, economic capacity, and infrastructure facilities.
We performed factor analysis using the SPSS 18 statistical program and cluster analysis using the R program. And we used QGIS for the map of the results.

2.2. Selection of Indicators

After collecting the indicators in Table 2, the dimensions were reduced through factor analysis and statistical significance and validity were analyzed. Factor analysis is a statistical technique that analyzes the correlation between multiple variables and describes variables in common dimensions underlying them and is one of the multivariate analysis methods that reduces many variables to a small number of factors by combining many similar variables [32]. Through factor analysis, variables with low commonality were excluded from the analysis. Commonality is a value indicating what percentage of the variance of the extracted factor can be explained by the variable, and in general, variables with 0.4 or less commonality are excluded from factor analysis [33].
A sample adequacy measure testing of Kaiser–Meyer–Olkin (KMO) and Bartlett’s sphericity test were conducted to evaluate factor analysis for each corresponding variable for the collected drought vulnerability indicator. KMO and Bartlett’s sphericity test. The KMO measure value is defined as the degree to which the correlation between variables is explained by other variables, and analyzes the statistical significance of whether the diversity of correlation coefficients can have a common factor. The closer the value of KMO is to 1, the higher the significance of factor analysis, and normally 0.5 or higher is considered appropriate for factor analysis [13]. Bartlett’s testing verifies the correlation coefficient matrix between the input variables used in factor analysis, and if the p-value representing the significance level is less than 0.05, a degree of correlation that is acceptable to perform factor analysis is to be determined.
Factor analysis was conducted by climate exposure, sensitivity, and adaptive capacity to leave only significant index. In factor analysis, the varimax orthogonal rotation was applied for the factor rotation.

2.3. Standardization of Indicators

Because vulnerability assessment uses multiple factors with different units and ranges, they must undergo the indicator standardization process which combines and integrates into one index [12]. Ranking, normalization scoring (Z-score), and rescaling methods are mainly used for standardization. In this study, the rescaling method was applied to standardize based on the ranges of each indicator, such as climate exposure, sensitivity, and adaptive capacity, which ensures that all the factor values are in the same range of 0 to 1. The rescaling standardization method is as follows:
I = x m i n ( x ) m a x ( x ) m i n ( x ) ,
I = m a x ( x ) x m a x ( x ) m i n ( x ) ,
where, I is the standardization index. Equation (1) is the standardized equation for positively correlated factors, and Equation (2) is the standardized equation for negatively correlated factors. Here a positive correlation means that the greater the value of the assessment factor, the greater the vulnerability, and a negative correlation means that the greater the value of the assessment factor, the smaller the vulnerability [12].

2.4. Calculation of Indicator’s Weight

In the process of calculating the vulnerability index, determining the weight, which means the importance of assessment factors, is critical [34]. As weighting methods, the analytic hierarchy process (AHP) and the Delphi techniques have been traditionally applied, which are methods for determining weights based on expert feedback. However, in this study, the entropy method of estimating the weights has been applied, which is very simple to compute and relatively easy for decision makers to understand. The entropy method numericizes information about signals or attributes within a system and is based on the information theory that finds high cohesive signals according to the information capacity of the signal and then high cohesive signals are given high weights [34,35]. The entropy method is widely used in information theory and transportation model as a general measure of uncertainty [36], with proven objectivity to rule out subjective elements of decision makers and set weights based on attributes of given data [36,37,38].
The procedure for calculating the weight using entropy is as follows. After standardization in Section 2.3, the entropy value (E) for each detailed indicator is calculated as below.
Step 1. The matrix R configured for the item to be evaluated consists of r i j , and if the standardization result for the evaluation item is r i j , r i j is calculated as Equation (3).
R = [ r i j ] ,   r i j = x i j i = 1 m x i j  
where, r i j is standardized matrix, and i is an index of evaluation alternative (i = 1, 2, 3, …, m), j is attributed indicator for evaluation (j = 1, 2, 3, …, n).
Step 2. Calculating entropy for the item to be evaluated is as shown in Equation (4)
H i = k i = 1 n f i , j l o g f i , j  
Here, k = 1 l n   n , n is the number of alternatives, and f i , j = r i j j = 1 n r i j .
Step 3. Using a i , which represents the degree of diversity, the weight ( w i ) for each item to be evaluated through standardization of the degree of diversity ( a i = 1 H i ) is calculated using Equation (5).
w i j = 1 H i i = 1 m ( 1 H i )
Here, 0 ≤   w i   ≤ 1, i = 1 m w i = 1 .

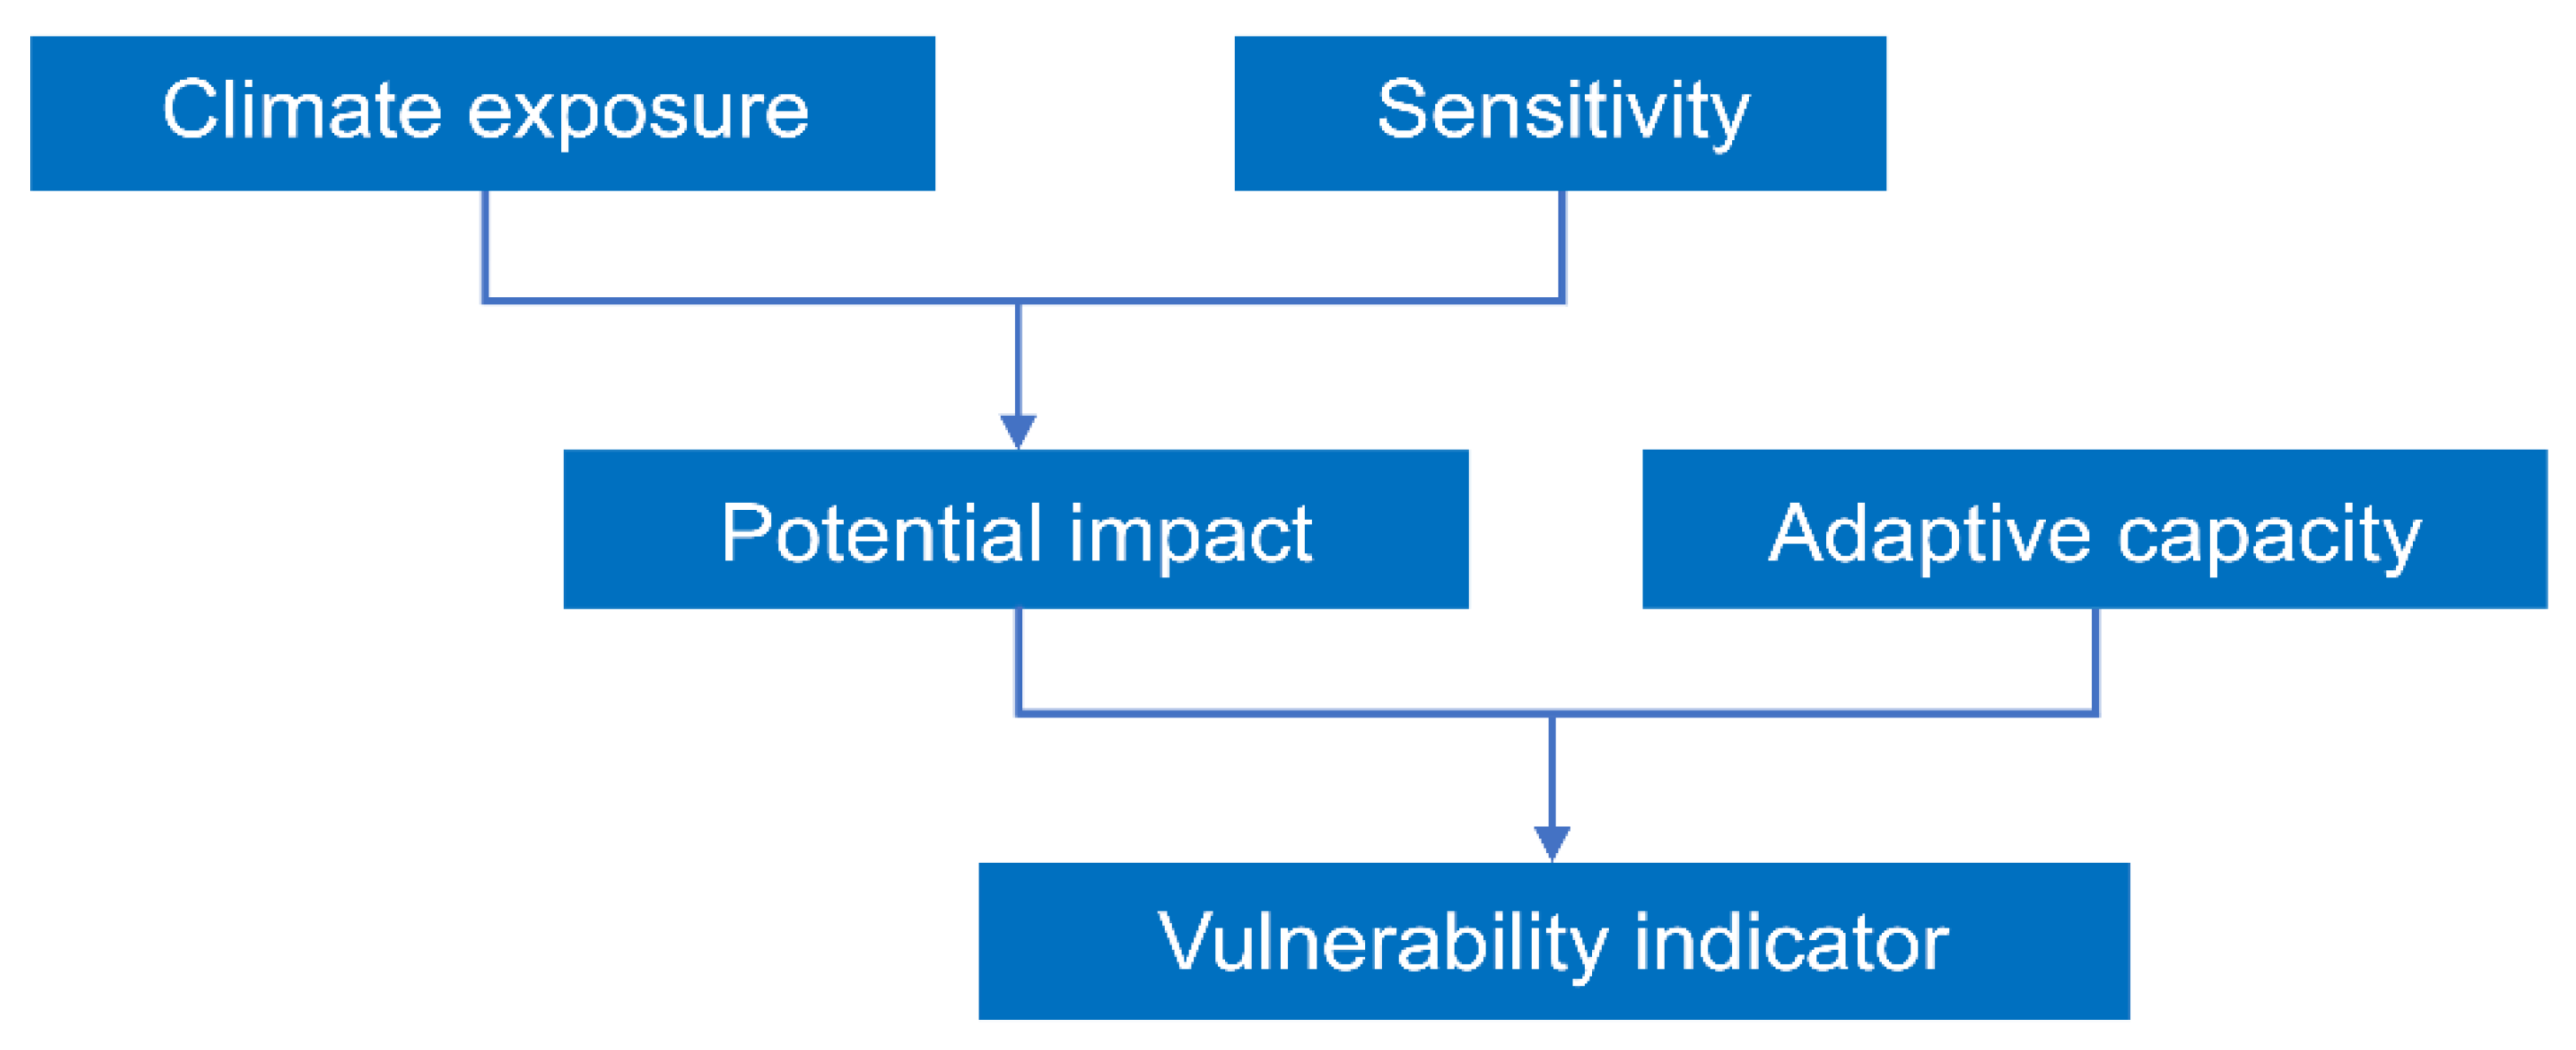
2.5. Vulnerability Assessment

The definition of vulnerability is shown in Figure 2. Exposure to climate change appears to be potential impacts depending on the sensitivity of the system and the vulnerability of the final system is determined according to the adaptive capacity of this system. Each index was calculated by multiplying the standardized evaluation factor by the weight obtained from 2.4 to obtain the corresponding variables, climate exposure index, sensitivity index, and adaptability index, and then the drought vulnerability index was calculated and evaluated using Equation (6). We calculated and evaluated drought vulnerability index for each eup or myeon. Assessments using these mathematical representations are highly used because they can serve as important underlying data for establishing appropriate responsive actions and adaptation directions for a certain system based on vulnerability assessment results [39].
V = ( E × 0.25 ) + ( S × 0.25 ) ( A × 0.5 )
where, V is drought vulnerability index; E is climate exposure index; S is sensitivity index; and A is adaptive capacity index.
Equation (6) states that the sensitivity index and the climate exposure index are weighted lower than the adaptive capacity index. This faithfully reflects the conceptual framework of vulnerability in Figure 2 because climate exposure and system sensitivity combine to have a potential impact, and the potential impact is combined with adaptive capacity to calculate the vulnerability index [14].

2.6. Cluster Analysis

Cluster analysis is an exploratory analysis method that seeks to understand the structure of the entire data by grouping the targets with similar attributes among individuals or multiple entities into several groups, and then identifying the nature of each group [40,41]. In this study, K-means cluster analysis was used, a representative method of nonhierarchical cluster analysis. K-means cluster analysis is a method of assigning each observation to the nearest cluster among the cluster centers based on a predetermined number of clusters. An optimal number of clusters (K) is the most important parameter to calculate cluster analysis. Elbow curve method and silhouette analysis are the most used method to find the best value of K. In this study, elbow curve method was used to select the number of the clusters. Elbow curve method runs k-means clustering on the dataset for a range of values of K (1 to 10). For each of the K values, average distance to the centroid across all data points was calculated. And plot these points and find the point where the average distance from the centroid falls suddenly. This point was an optimal number of the clusters. One-way ANOVA and Tukey’s honestly signature difference (HSD) were performed to increase the reliability and validity of cluster analysis.

3. Results

3.1. Determination of Drought Vulnerability Assessment Indicators of Island Areas

The 28 indicators selected through prior research review and VESTAP were reduced in dimension through factor analysis. As described in Section 2.2, factor analysis was conducted while excluding indicators with a commonality of 0.4 or less. And indicators were selected to enable to factor analysis with KMO of 0.5 or higher. As a result, it was reduced from a total of 28 indicators to 22 indicators. In the climate exposure index, three indicators were excluded from 10 indicators, two indicators were excluded from 10 indicators in sensitivity index, and one out of eight indicators was excluded from adaptive capacity index.
KMO standard goodness of fit check and Bartlett’s unit matrix check were conducted to evaluate the suitability of the data. In the climate exposure index, KMO was 0.512 suitable for factor analysis, and Bartlett’s test of sphericity had a χ2 of 1321.709 (df = 21) and a significance level of 0.000, indicating the presence of a common factor for factor analysis possible.(Table 3) Critical factor in climate exposure index was impact of rainfall, No rainfall and drought index and sub factor consisted of precipitation data such as the number of days with no rainfall, winter precipitation (December to February), spring precipitation (March to May), and drought indices such as the Standardized Precipitation Index (SPI), and the evaporative demand drought index (EDDI).
In the sensitivity index, the KMO standard goodness of fit check showed that KMO was 0.584 and Bartlett test showed that χ2 was 314.466 (df = 28), and the significance level was 0.000. Critical factor in sensitivity index was Impact of population, agriculture and fisheries and water quality vulnerability. Sub-factor was total population, population density, and household water usage as impact of population, classified farming land area, agricultural population, fishing population, and groundwater usage were classified as agricultural and fishing activity factors, and the pollution load was classified as a water quality vulnerability. In the case of adaptive capacity, the KMO standard goodness of fit check showed that KMO was 0.595 and Bartlett test showed that χ2 was 410.414 (df = 21), and the significance level was 0.000. Critical factor in adaptive capacity index was water supply capability, economic capability, reducing water pollution and sub-factor was.
Regarding adaptive capacity, the water supply ratio, the water supply rate of village water/small water supply facilities, groundwater availability, and the water source maximum storage were classified as water supply capacity factors, fiscal independence and gross regional domestic product were classified as local government capacity factors, and the sewer system supply ratio was classified as point pollutant reduction factor. Water supply capacity and point pollutant reduction are indicators that can affect drought vulnerability reduction, namely practical adaptive capacity, and fiscal independence and gross regional domestic product are indicators that evaluate the local government’s potential to invest in policies or technologies, namely potential adaptive capacity [32].
All the variables analyzed in this study had KMO values of 0.5 or higher, so it was analyzed that all the extracted 9 critical factors and 22 sub-factors had explanatory power above a certain level.

3.2. Weight Calculation of Drought Vulnerability Index in Island Areas

For the indicators determined through factor analysis to calculate the drought vulnerability index, Equations (1) and (2) were used to standardize the data. The entropy technique was applied to the normalized factors and calculated the weights. The weights of the assessment factors were determined considering the degree of diversity for entropy. The results are presented in Table 4.
As a result of considering the weights, in the climate exposure, the weights were almost identical like December–February precipitation (0.159), the number of consecutive days without rainfall (0.157), the number of days with an SPI of −1 or less (0.145) for three or six months, and March–May precipitation (0.144). In the sensitivity, agricultural population ratio (0.239), the cultivating land area ratio (0.172), the fishery population ratio (0.155) and the groundwater consumption (0.144) were weighted high, whereas the residential water consumption (0.049) and the water pollution load (0.043) were weighted low. Overall, agriculture-related factors seem to be highly weighted. The results of this study seem to be significant because the assessment factors related to agriculture were found to have gained high weights when calculating weights using entropy techniques in the assessment by Kim et al. [36] of socioeconomic drought vulnerability in Chungcheong-do province.
In the adaptive capacity, the water supply system ratio (0.265), groundwater capacity (0.222), and sewer supply ratio (0.208) were highly weighted, however, the gross regional domestic product was weighted lowest (0.009). The results of the study showed that water supply system ratio and groundwater capacity are important factors to have the adaptive capacity to cope with the drought in island areas. Although community water system and small water supply system are used in island areas where water supply system is not provided, the weight of the water supply ratio through community water system and small water supply system was 0.102, indicating that water supply system should be implemented preferentially to improve practical adaptive capacity.

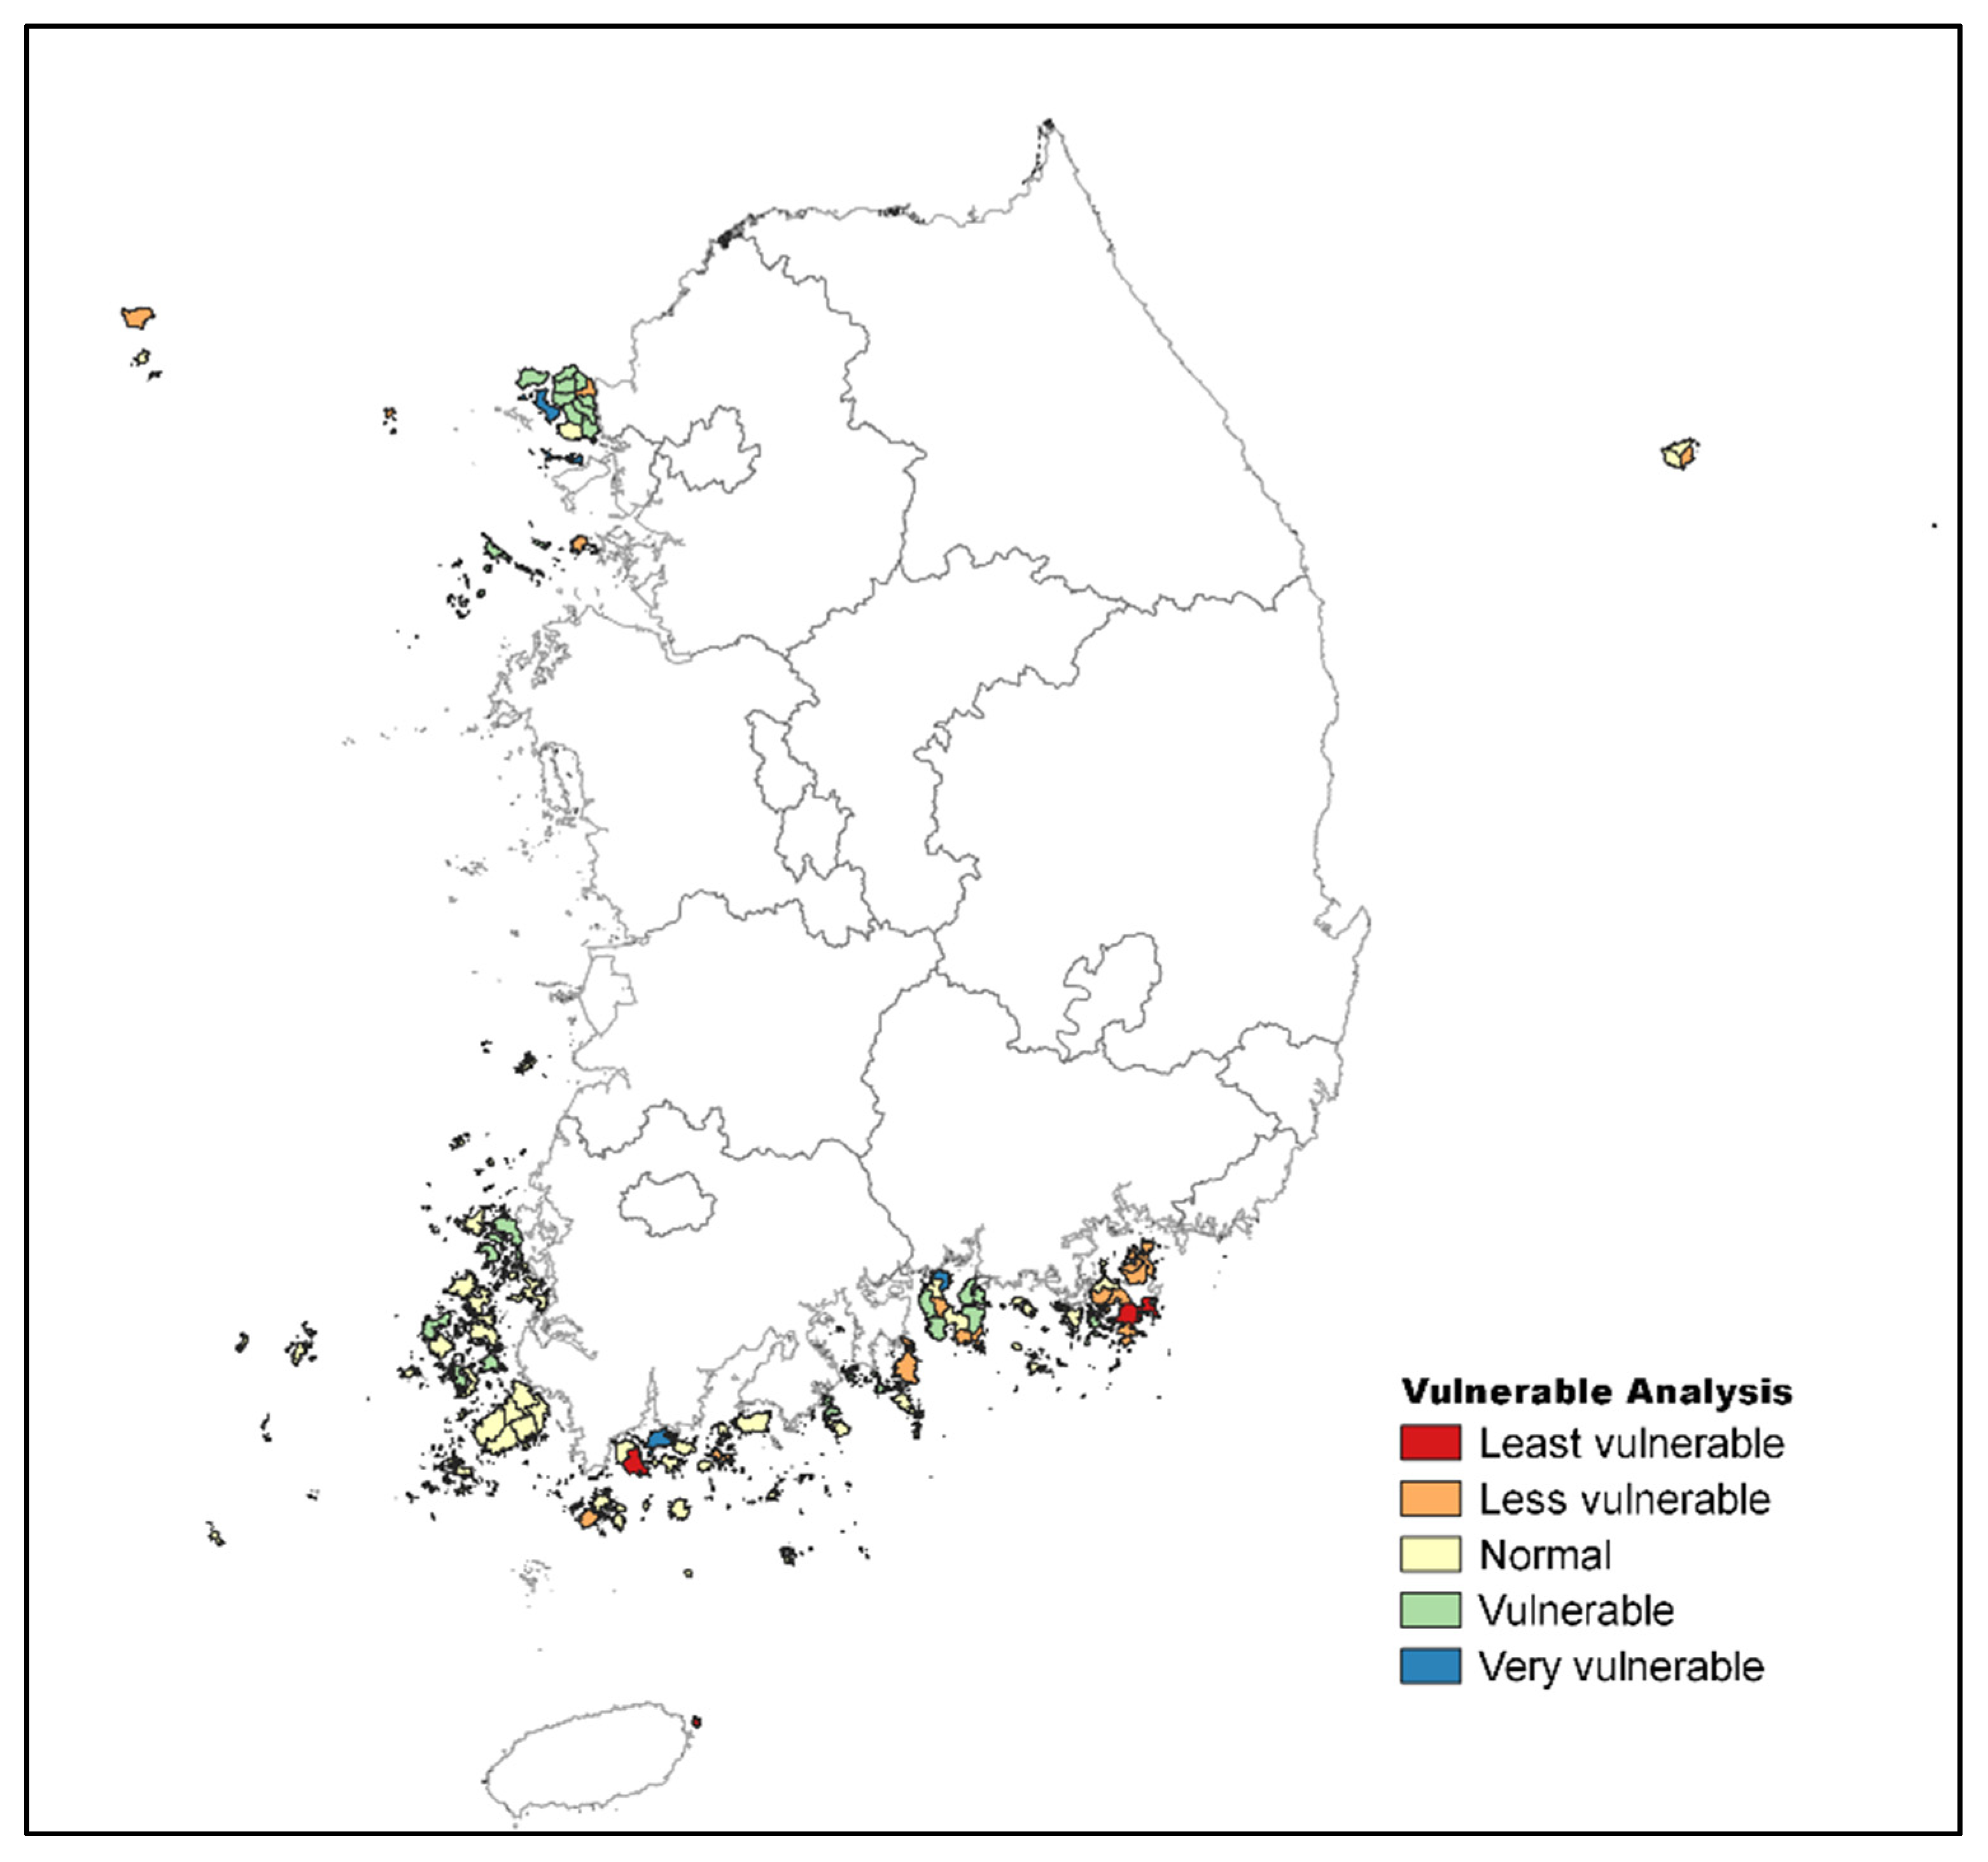
3.3. Assessment of Drought Vulnerability in Island Areas

Finally, the drought vulnerability index was calculated by multiplying the calculated weights by standardized factors, and the drought vulnerability assessment was conducted by substituting each index in Equation (6) for island areas of 90 eups and myeons (Figure 3). In the vulnerability assessment results, the vulnerability values were −0.11 to 0.153, with a mean of 0.0232 and a standard deviation of 0.049. Here, the greater the vulnerability value, the greater the vulnerability to drought. Vulnerability assessment top 10 rankings were presented in Table 5. Vulnerability assessment showed that Ganghwa Seodo-myeon, Namhae Seolcheon-myeon, and Ganghwa Samsan-myeon had high vulnerability to drought, whereas Jeju Chuja-myeon, Geoje Dongbu-myeon, and Geoje Ilun-myeon had low vulnerability to drought (Figure 4).
Looking at it by city and “gun” (county), 9 myeons in Ganghwa-gun, 3 myeons each in Namhae-gun, Ongjin-gun, and Shinan-gun, 1 myeon each in Wando-gun and Tongyeong-gun were the top 20 drought vulnerable areas. Especially, Ganghwa-gun was of relatively high drought vulnerability compared with other cities and guns (counties) having island areas. Therefore, these areas should be considered in preparing future development plans for island areas.

3.4. Cluster Analysis

A cluster analysis was conducted with result data of vulnerability index which consist of climate exposure, sensitivity, and adaptive capacity, which were classified through a vulnerability assessment.

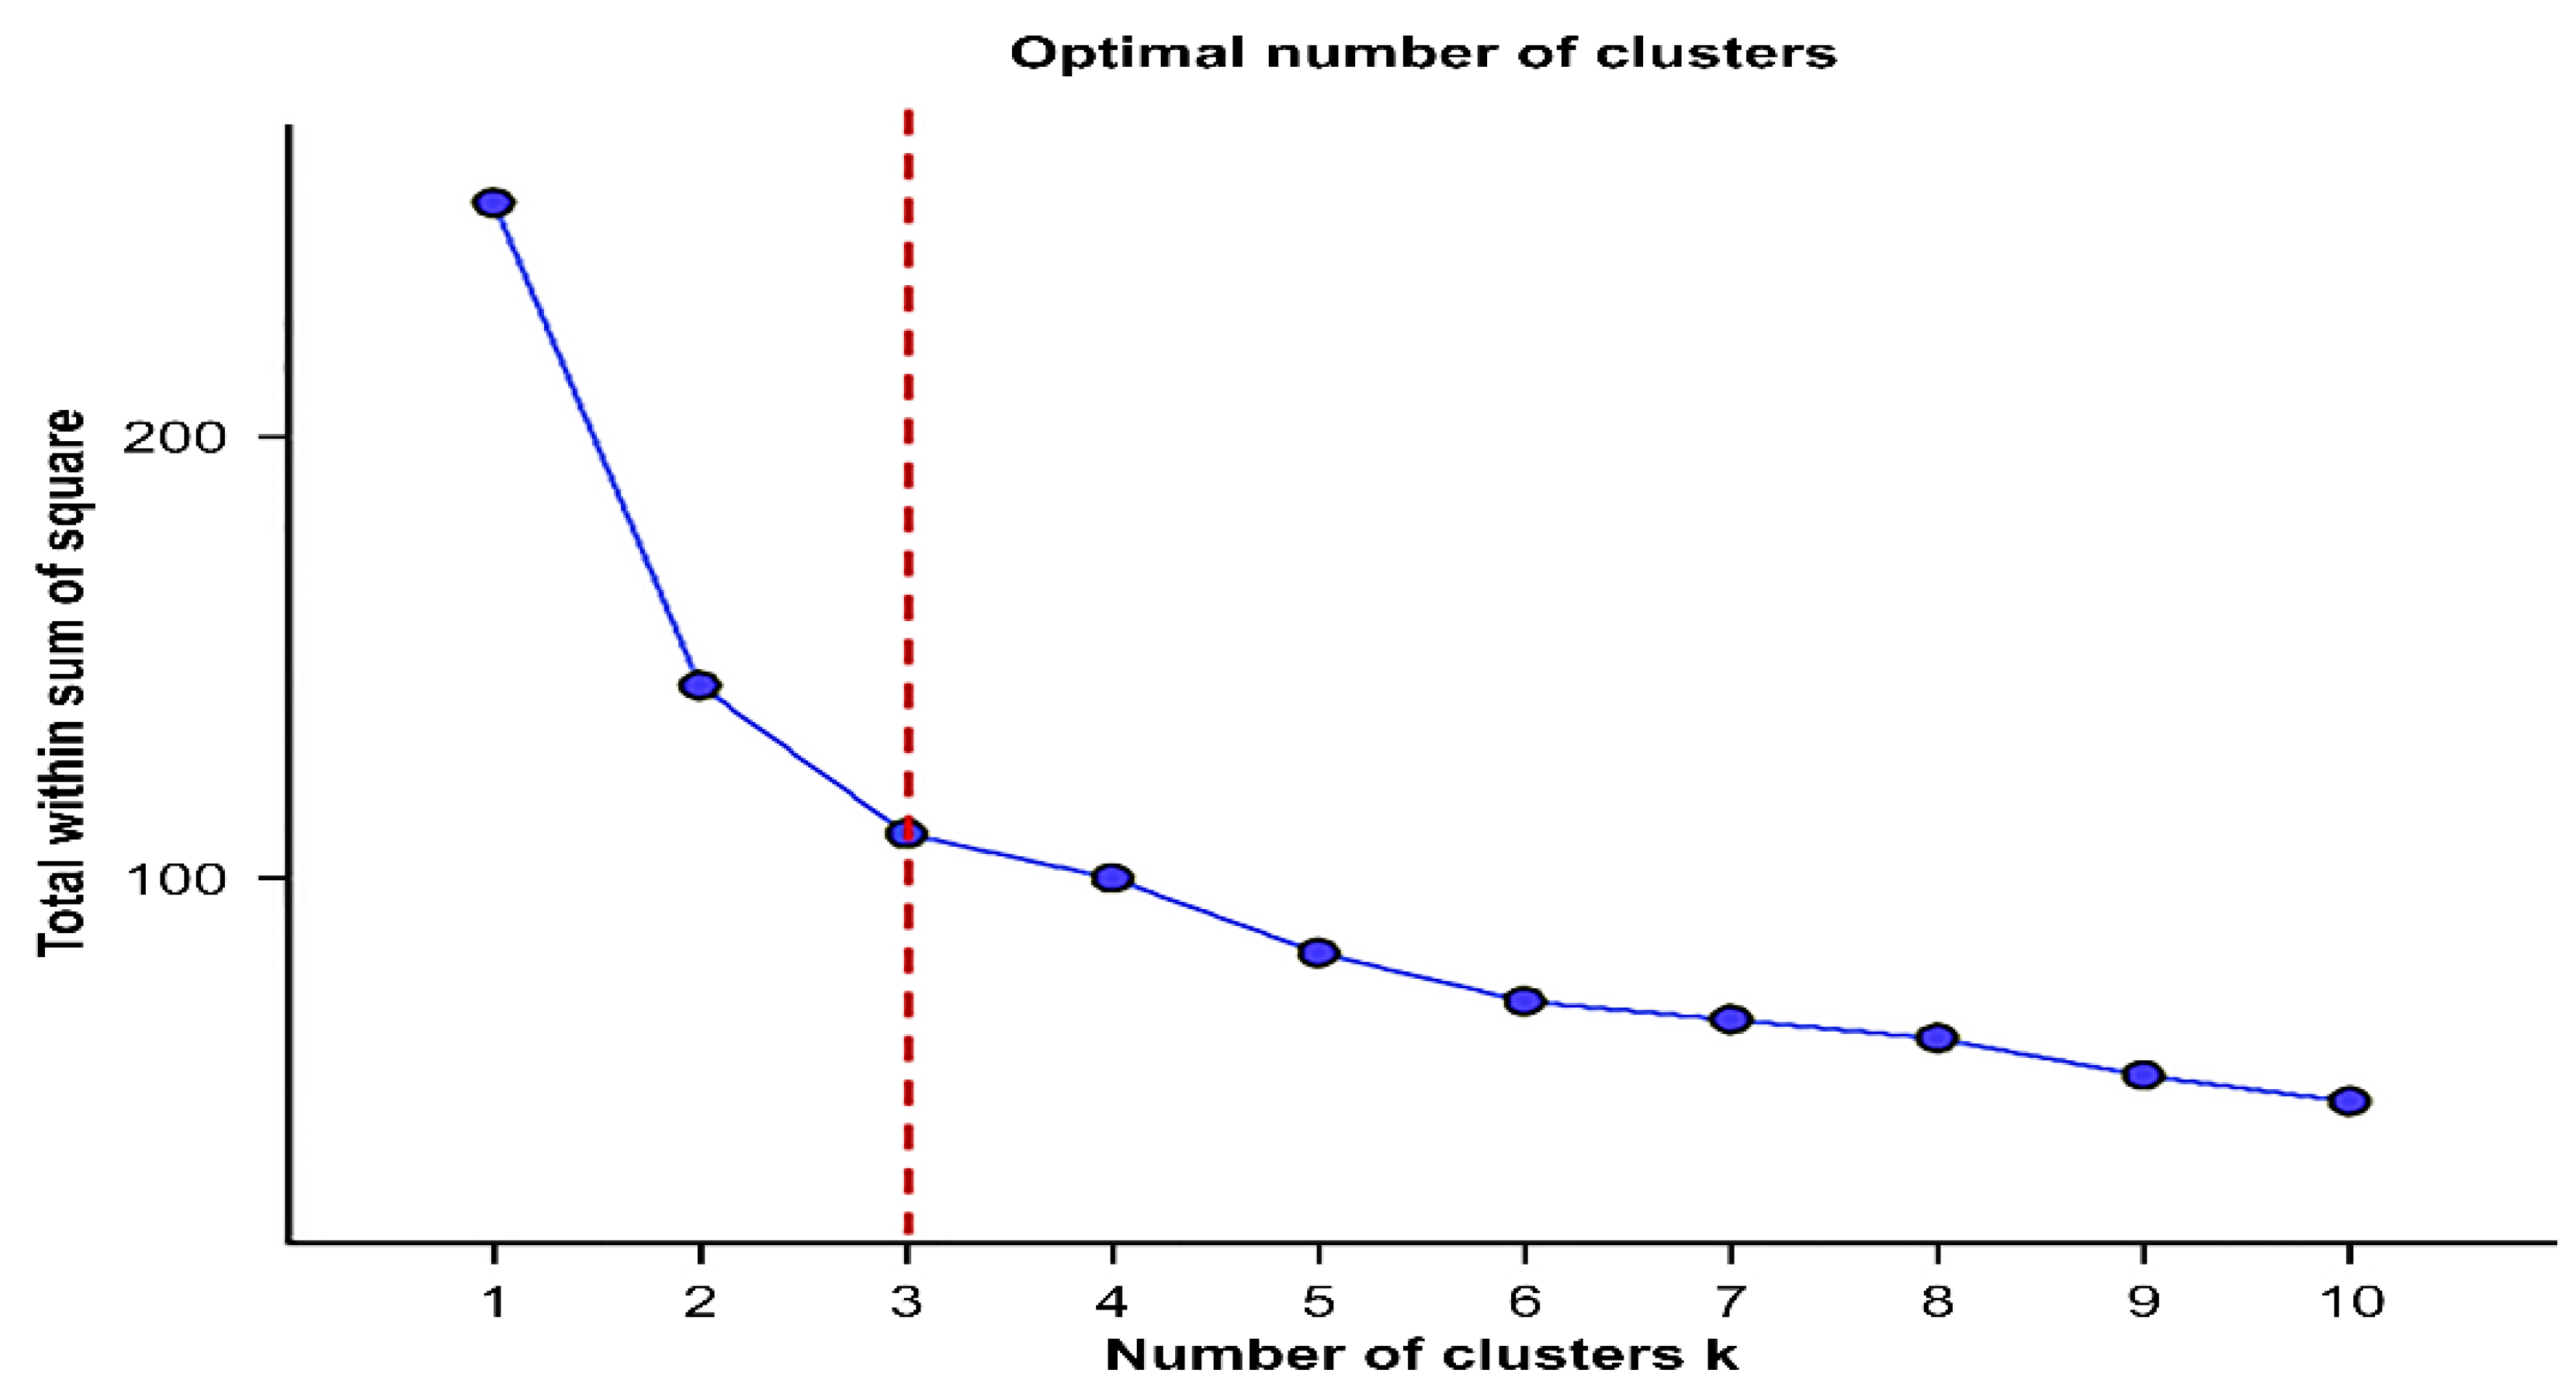
3.4.1. Clustering Count

Determining the number of clusters in cluster analysis is an important factor, and in this study, we used Elbow curve method that are applicable to nonhierarchical methods. Figure 5 shows total within sum of square according to the number of clusters, and the slope is gentle after the three clusters (called elbow point), so the number of clusters was three in this study.

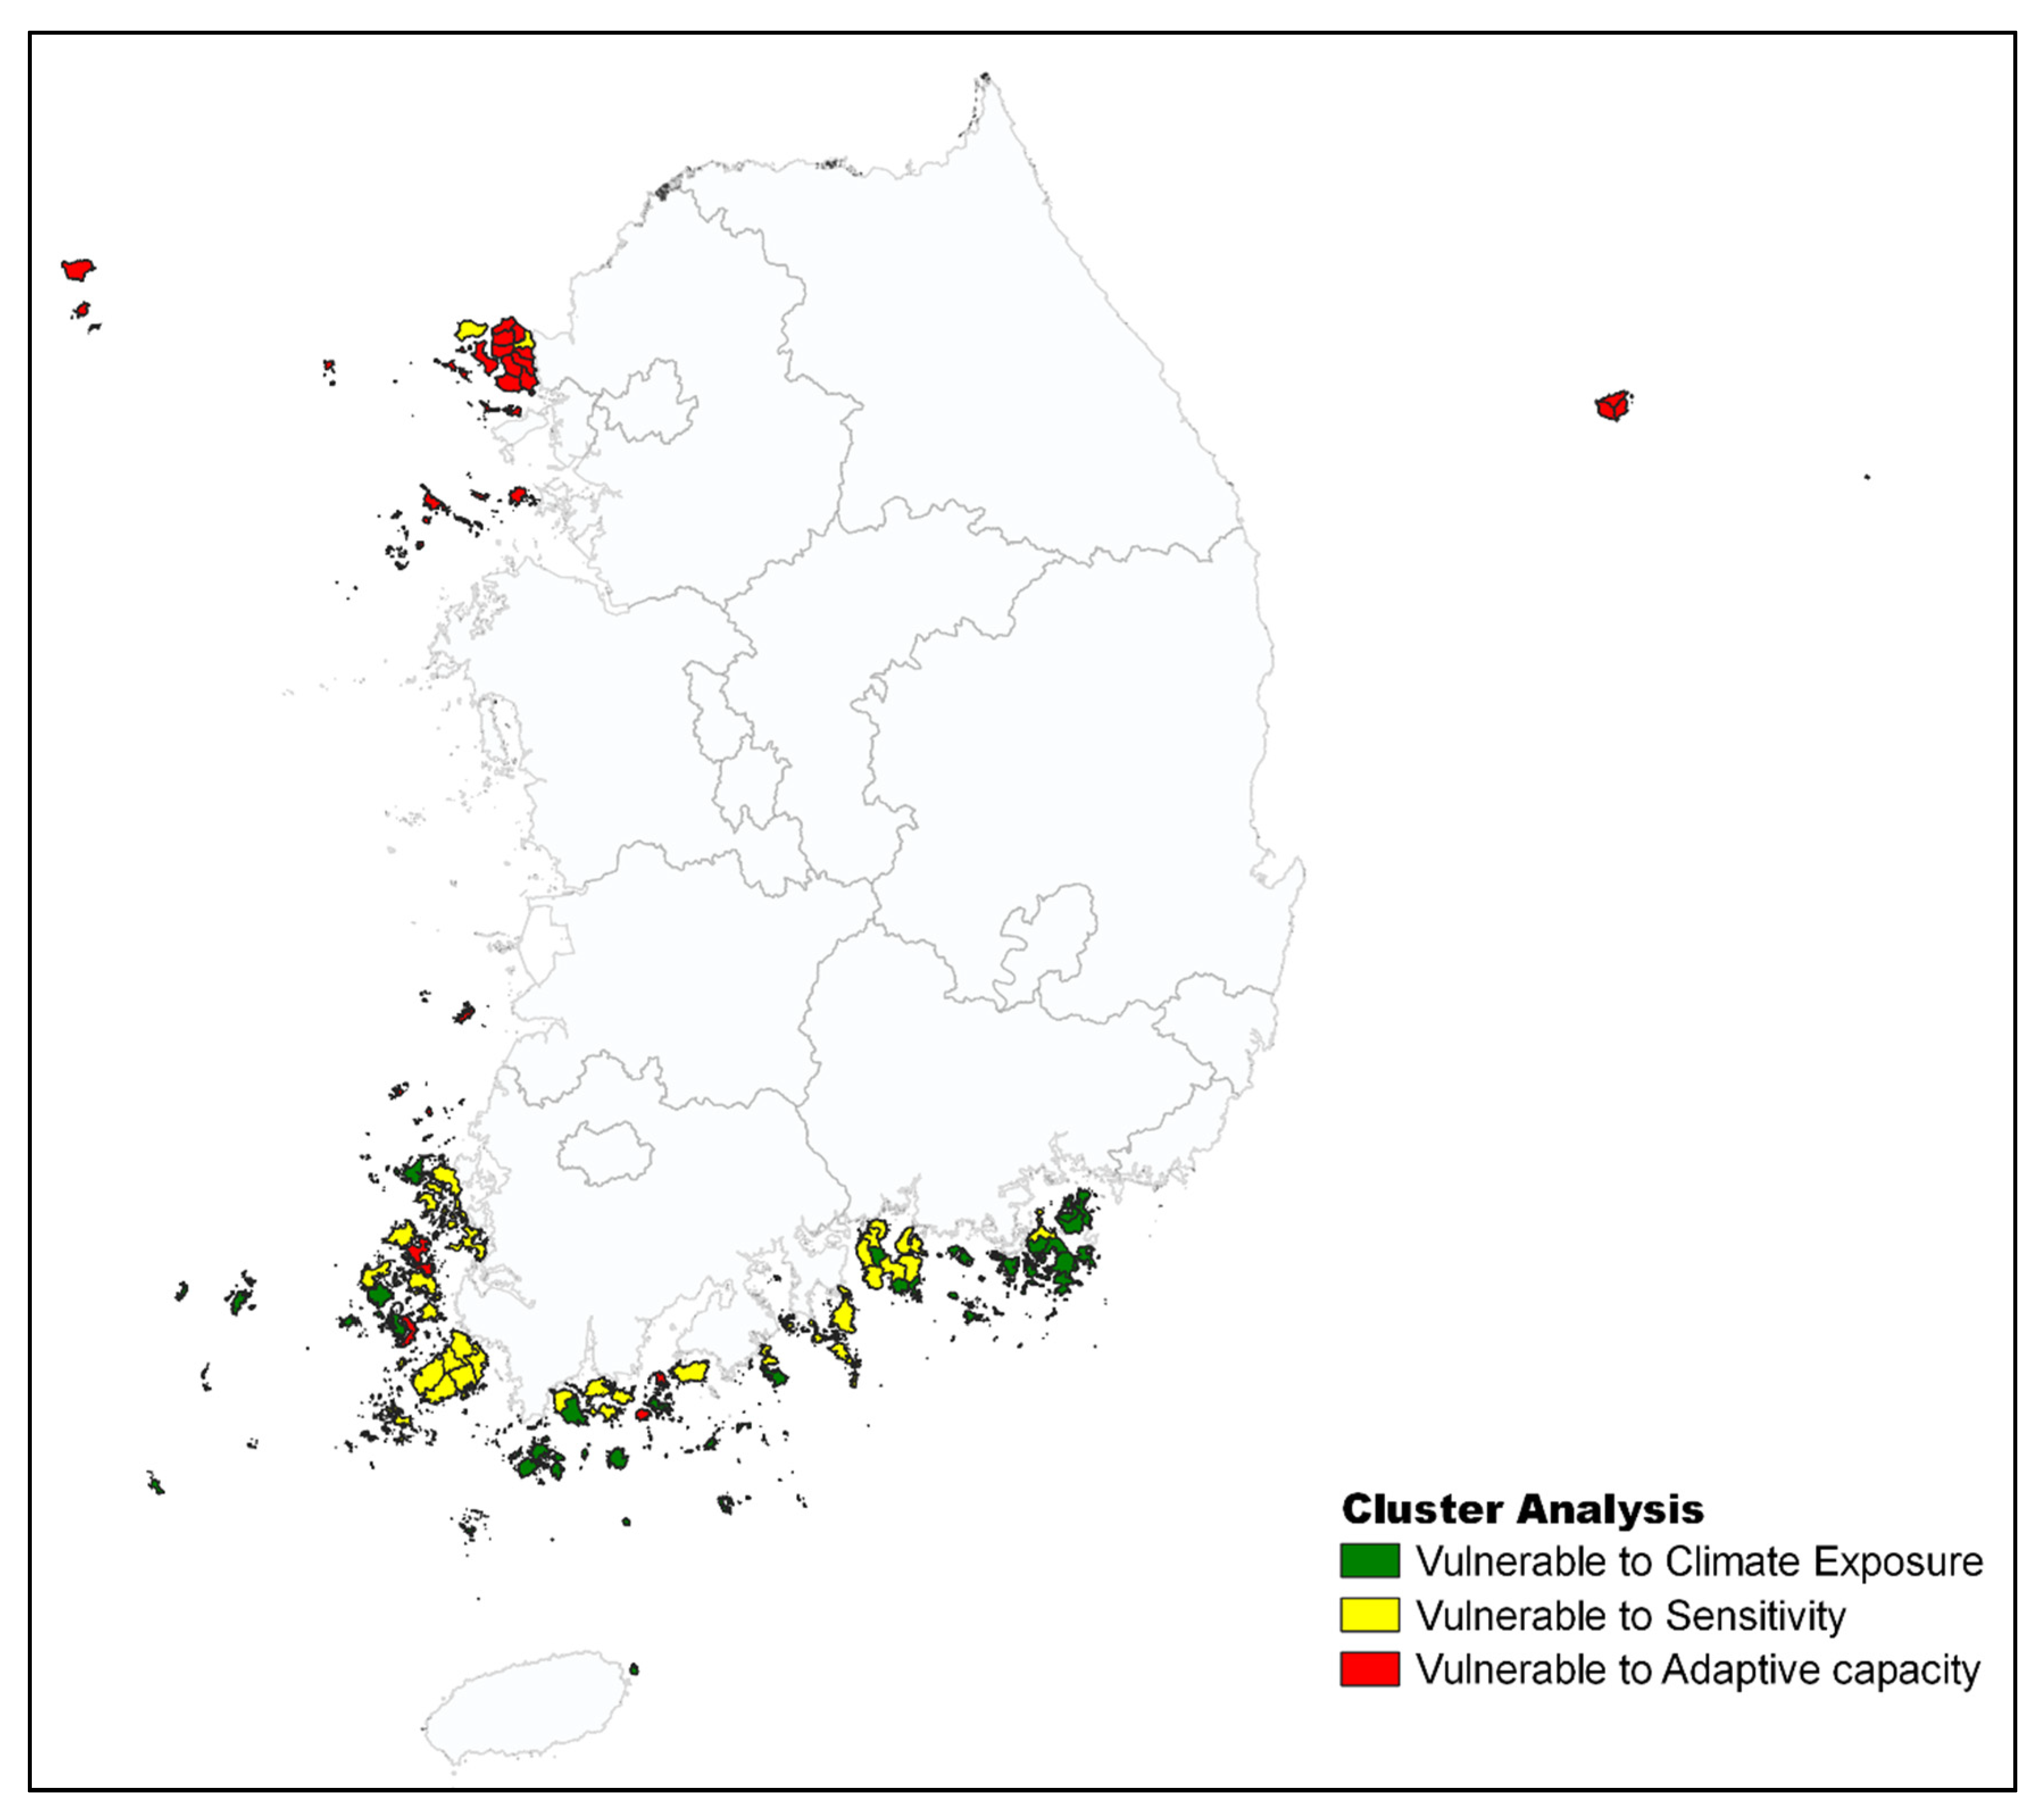
3.4.2. Cluster Analysis Results

The results of analyzing the cluster analysis are as shown in Table 6, indicating the final distances between the cluster centers of the three established clusters and which cluster they belong to. The 90 island areas were grouped into three clusters, cluster 1 with 29 areas, cluster 2 with 33 areas and cluster 3 with 28 areas. Cluster 1 was vulnerable to climate exposure, Cluster 2 was vulnerable to sensitivity, Cluster 3 was good for climate exposure and sensitivity, but vulnerable to adaptive capacity.
Figure 6 shows the cluster analysis of islands with two different dimension 1 and 2 (Dim-1 and Dim-2). As the values indicated on each axis (X and Y) are increased, the clusters may have more tendency of dimensions. The tendencies of dimension are shown in Figure 6b,c. As the result of the cluster analysis. Dim-1 contributed 62.7% and Dim-2 contributed 26.7% to the classification into the three clusters. To identify the components of Dim-1 and Dim-2, factor analysis was performed. Figure 6b showed that Dim-1 consists of climate exposure and adaptive capacity, and Figure 6c showed that Dim-2 consists of sensitivity. As shown in the Figure 6b, there is a base line with a red line, and two factors (climate exposure and adaptive capacity) exceeding the base line contribute statistically the first dimension (Dim-1). Figure 6c showed that sensitivity exceeding the base line contribute the second dimension (Dim-2). The map of the cluster analysis result is shown in Figure 7.

3.4.3. Verification of Properties of Each Cluster Using One-Way ANOVA

A one-way ANOVA was conducted to determine if there was a difference in the means between the clusters (Table 7). Since the p-value is less than 0.05 or below the significant level, we can decide that there is a statistically significant mean difference between clusters related to the three variables: Climate exposure, sensitivity, and adaptive capacity. In addition, by the one-way ANOVA, we could identify the variables that affect cluster formation. The p-value of climate exposure is the smallest, which is analyzed to have the greatest impact on cluster formation.
As we analyzed with a result that there is a difference between clusters at a statistically significant level (p-value < 0.05), Tukey’s honestly significant difference (HSD) tests were conducted as a posteriori tests to see which cluster differs when the difference is significant. The results of Tukey’s HSD are as shown in Table 8.
From a posteriori test results, we can say that clusters 1 and 2 for climate exposure, clusters 1 and 3 for sensitivity, and clusters 1 and 2 for adaptive capacity are not different at a statistically significant level (p-value > 0.05), and that the rest items are different at a statistically significant level with p-value < 0.05.
Table 9 summarizes the results of the cluster analysis.
Cluster 1 is vulnerable to climate change, but it has good sensitivity and adaptive capacity and can respond appropriately in the event of a drought, but owing to high climate exposure, efforts are needed to establish a water circulation system in the island areas. Cluster 2 areas are highly sensitive, where residential water and agricultural water may be scarce in the event of a drought, and countermeasures are needed for this. The last cluster 3 are areas with weak adaptive capacity, and efforts are needed to build a drought responding system through infrastructure expanding and to diversify water sources such as rainwater and greywater to compensate for vulnerability caused by future climate change.
Cluster 1 and cluster 2 are good in adaptive capacity which can be classified as areas good in practically coping with the drought. For the 28 island areas vulnerable to adaptive capacity and belonging to cluster 3, policy priorities are presumed to be needed to cope with drought vulnerability.

4. Discussion

In this study, in order to evaluate drought vulnerability in island areas, vulnerability evaluation indicators were calculated through factor analysis, and drought vulnerability assessment in target areas was conducted using vulnerability assessment tools. Cluster analysis was conducted using the vulnerability assessment indicator to investigate the characteristics of each cluster. The results of this study were analyzed strategically for the vulnerability of drought on islands in Korea.
Existing drought vulnerability assessments have been conducted mainly in state or on land, and there are many related studies. In the case of island areas, vulnerability assessment was conducted as it belongs to a part of mega city and state in the existing vulnerability assessment. Since most of the vulnerability assessments were conducted mainly on the state, only accurate island areas were not quantitatively evaluated. However, in this study, in order to assess the vulnerability of island areas at the eup-myeon level, data from the relevant area were collected, and assessment indicators were derived using vulnerability assessment tools to conduct quantitatively. Based on these results, vulnerability maps and cluster analysis maps were created.
In addition, if the existing vulnerability analysis of island areas intensively conducted vulnerability assessment in limited island areas, this study conducted an overall vulnerability assessment in 90 island areas at the eup-myeon level. The paper, which conducted vulnerability assessment in domestic island areas, had limitations in conducting vulnerability assessment focusing on water supply in water outage situations, but this study used objective vulnerability assessment tools to consider both biological and physical aspects of climate change and integrate various sectors that can be affected by climate change. In this respect, it can be seen as different from existing vulnerability assessment studies for island areas.
After the vulnerability assessment, cluster analysis was conducted based on this result, and island areas with similar characteristics were clustered so that they could be used for policy in the future. In Figure 6, Climate exposure was found to have the greatest contribution to clustering.
The Ministry of Environment of Korea has established a detailed plan to strengthen water security. First, through regional drought cause and vulnerability assessment, drought vulnerability maps are prepared to support local governments, and second, seawater desalination facilities and underground storage facilities are planned in water-deficient areas such as island areas. Therefore, the vulnerability map and cluster analysis result map, which are the results of this study, can contribute to support and make policy decisions when creating drought vulnerability maps in the future, and are expected to provide basic data when determining the priority of installing water supply facilities in the island.
The limitations of this study are as follows.
First, It is limited to deriving indicators with limited data, and the result value may change depending on variables during factor analysis, and it cannot be used as an absolute assessment index.
Second, in order to use existing vulnerability tools, indicators were classified according to the results of previous studies in climate exposure index, sensitivity index and adaptive capacity index.
Third, the island areas mentioned in this paper are eup-myeon unit, and one eup-myeon consists of more than two or three of island. For example, Deokjeok-myeon, Incheon Metropolitan City, consists of 41 inhabited islands and uninhabited islands. Therefore, this study was not the result of vulnerability assessment for independent islands. It was difficult to obtain data from each island. So, vulnerability assessment was conducted for island areas at the eup-myeon unit.

5. Conclusions

In this study, drought vulnerability assessment and cluster analysis were conducted for 90 target eups/myeons in the island areas after calculating the drought vulnerability index. Vulnerability indicators related to drought and water regulation in the water management sector of VESTAP program and vulnerability assessment indicators from existing research cases were collected, and the assessment indicators affecting island areas were determined using factor analysis. Applying entropy techniques, the weights of the assessment indicators were calculated to analyze the impact of each assessment indicator, and the drought vulnerability assessment was conducted for each eup/myeon in the island area. Moreover, a cluster analysis was conducted on three factors, climate exposure, sensitivity, and adaptive capacity, derived from the vulnerability assessment.
Considering the weight, winter precipitation, the number of consecutive days with no rainfall, agricultural population ratio, cultivating area ratio, water supply system ratio, and groundwater capacity were found to have a great influence on the system. And vulnerability assessments showed high drought vulnerability in Ganghwa Seodo-myeon, Namhae Seolcheon-myeon, and Ganghwa Samsan-myeon. Out of the top 20 vulnerable areas, nine eups and myeons in Ganghwa-gun were found to be vulnerable, and therefore, preferential policy support for Ganghwa-gun needs to be considered first when establishing drought measures in the islands under development. We believe that it is necessary to prepare a system to actively respond to drought and adapt to climate change by diversifying measures to secure water available for use such as underground water tanks, expansion of water supply ships, water reservoirs, and alternative water resource supply technologies to use in these islands in an emergency.
In the cluster analysis, we were able to classify into three clusters—groups vulnerable to climate exposure; to climate exposure and sensitivity; and to adaptive capacity, which were found to form clusters at statistically significant levels. The cluster vulnerable to climate change can respond to climate exposure by restoring water circulation in small areas through the application of low-impact development in the areas. The sensitive cluster is vulnerable in the event of a drought due to the high population density with areas where measures such as expanding emergency water supply system and expanding water supply systems on usual days are needed. The cluster with weak adaptive capacity includes areas where the expansion of the foundation system for coping with a drought is urgently needed, and policy priorities are needed over other clusters.

Author Contributions

Data curation, investigation, software, writing original draft, I.S.; Formal analysis, visualization, validation, writing original draft, H.K.; Funding acquisition, project administration, conceptualization, B.H.; Resource, writing—review & editing, J.A.; Supervision, Writing—review & editing, Methodology, T.H. All authors have read and agreed to the published version of the manuscript.

Funding

This research was funded by the Korea Environment Industry & Technology Institute (KEITI) through the Public Technology Program based on Environmental Policy, funded by the Korea Ministry of Environment (MOE) (2018000700001).

Institutional Review Board Statement

Not applicable.

Informed Consent Statement

Not applicable.

Data Availability Statement

Not applicable.

Conflicts of Interest

The authors declare no conflict of interest.

References

  1. Kim, S.H.; Lee, M.H.; Bae, D.H. Estimation and assessment of natural drought index using principal component analysis. J. Korea Water Resour. Assoc. 2016, 49, 565–577. [Google Scholar] [CrossRef]
  2. Smith, A.B.; Katz, R.W. US billion-dollar weather and climate disasters: Data sources, trends, accuracy and biases. Nat. Hazards 2013, 67, 387–410. [Google Scholar] [CrossRef]
  3. Hannaford, M.J. Long-term drivers of vulnerability and resilience to drought in the Zambezi-Save area of southern Africa, 1505–1830. Glob. Planet Chang. 2018, 166, 94–106. [Google Scholar] [CrossRef]
  4. Korea Maritime Institute (KMI). KMI Infographic; Korea Maritime Institute (KMI): Busan, Korea, 2018; Volume 6. [Google Scholar]
  5. Lee, Y.H.; Hong, W.H.; Lee, J.S. The vulnerability assessment of water supply through the analysis of emergency water shortage in cut off water supply-prone island area. J. Archit. Inst. Korea Plan. Des. 2014, 30, 253–260. [Google Scholar] [CrossRef]
  6. An, J.H. Establishment of National Drought Disaster Information System. Disaster Prev. Rev. 2013, 15, 80–81. [Google Scholar]
  7. Moon, Y.R.; Lee, M.J.; Kim, J.G. Guideline for Environmentally Friendly Water Supply Plans in Small Islands; Research Report; Korea Environment Institute: Sejong, Korea, 2010; pp. 1–3. [Google Scholar]
  8. Moon, Y.R.; Kang, Y.S.; Park, N.S. A Study of Water Supply and Use in Small Islands; Basic Research Report; Korea Environment Institute: Sejong, Korea, 2009; pp. 1–3. [Google Scholar]
  9. Han, J.K. Underground Storage Facility Development for Securing Drinking Water Sources in Island Region. Master’s Thesis, Chonnam National University, Gwangju, Korea, 2015. [Google Scholar]
  10. Kim, K.Y.; Park, H.J.; Kim, T.I.; Han, M.Y. Evaluation of stored rainwater quality and economic efficiency at Yangdo elementary rainwater harvesting system. J. Korean Soc. Environ. Eng. 2014, 36, 333–341. [Google Scholar] [CrossRef]
  11. Lee, S.W.; Na, S.H.; Byeon, S.J. A study on rainwater use for alternative water resources in the region—Focusing on island and mountain villages. Korean Crisis Manag. J. 2018, 14, 77–89. [Google Scholar] [CrossRef]
  12. Kim, J.E.; Park, J.Y.; Lee, J.H.; Kim, T.W. Socioeconomic vulnerability assessment of drought using principal component analysis and entropy method. J. Korea Water Resour. Assoc. 2019, 52, 441–449. [Google Scholar] [CrossRef]
  13. Hwang, H.S. An Index and Evaluation of Vulnerability to Climate Change in Urban Area. Master’s Thesis, Inha University, Inha, Korea, 2012. [Google Scholar]
  14. UNDP. Adaptation Policy Frameworks for Climate Change: Developing Strategies, Policies, and Measures; Cambridge University Press: Cambridge, MA, USA, 2005. [Google Scholar]
  15. IPCC. Climate Change 2007: Impacts, Adaptation, and Vulnerability; Fourth Assessment Report; Cambridge University Press: Cambridge, UK, 2007. [Google Scholar]
  16. Yoo, G.Y.; Kim, I.A. Development and Application of a Climate Change Vulnerability Index; No. 05; Korea Environment Institute: Sejong, Korea, 2008. [Google Scholar]
  17. IPCC. Climate Change 2001: Impacts, Adaptation and Vulnerability; Third Assessment Report; Cambridge University Press: Cambridge, UK, 2001. [Google Scholar]
  18. Liu, X.; Guo, P.; Tan, Q.; Xin, J.; Li, Y.; Tang, Y. Drought risk evaluation model with interval number ranking and its application. Sci. Total Environ. 2019, 685, 1042–1057. [Google Scholar] [CrossRef]
  19. Wang, Y.; Yang, J.; Chang, J.; Zhang, R. Assessing the drought mitigation ability of the–reservoir in the downstream of the Yellow River. Sci. Total Environ. 2019, 646, 1327–1335. [Google Scholar] [CrossRef]
  20. Wu, C.; Zhou, L.; Zhang, L.; Jin, J.; Zhou, Y. Precondition Cloud algorithm and copula coupling model-based approach for drought hazard comprehensive assessment. Int. J. Disaster Risk Reduc. 2019, 38, 101220. [Google Scholar] [CrossRef]
  21. Shen, Z.; Zhang, Q.; Singh, V.P.; Sun, P.; Song, C.; Yu, H. Agricultural drought monitoring across Inner Mongolia, China: Model development, spatiotemporal patterns and impacts. J. Hydrol. 2019, 571, 793–804. [Google Scholar] [CrossRef]
  22. Kamali, B.; Abbaspour, K.C.; Wehrli, B.; Yang, H. Drought Vulnerability assessment of maize in Sub-Saharan Africa: Insights from physical and social perspectives. Glob. Planet. Chang. 2018, 162, 266–274. [Google Scholar] [CrossRef] [Green Version]
  23. Hazbavi, Z.; Baartman, J.E.M.; Nunes, J.P.; Keesstra, S.D.; Sadeghi, S.H. Changeability of reliability, resilience and vulnerability indicators with respect to drought patterns. Ecol. Indic. 2018, 87, 196–208. [Google Scholar] [CrossRef]
  24. Wang, P.; Qiao, W.; Wang, Y.; Cao, S.; Zhang, Y. Urban drought vulnerability assessment–A framework to integrate socio-economic, physical, and policy index in a vulnerability contribution analysis. Sustain. Cities Soc. 2020, 54, 102004. [Google Scholar] [CrossRef]
  25. Park, J.Y.; Yoo, J.Y.; Lee, M.W.; Kim, T.W. Assessment of drought risk in Korea: Focused on data-based drought risk map. KSCE 2012, 32, 203–211. [Google Scholar] [CrossRef] [Green Version]
  26. Yang, J.S.; Kim, I.H. Development of drought vulnerability index using Delphi method considering climate change and trend analysis in Nakdong river basin. KSCE 2013, 33, 2245–2254. [Google Scholar] [CrossRef] [Green Version]
  27. Kanakoudis, V.; Tsitsifli, S.; Papadopoulou, A.; Curk, B.C.; Karleusa, B. Water resources vulnerability assessment in the Adriatic Sea region: The case of Corfu Island. Environ. Sci. Pollut. Res. 2017, 24, 20173–20186. [Google Scholar] [CrossRef]
  28. Simha, P.; Mutiara, Z.Z.; Gaganis, P. Vulnerability assessment of water resources and adaptive management approach for Lesvos Island, Greece. Sustain. Water Resour. Manag. 2017, 3, 283–295. [Google Scholar] [CrossRef]
  29. Park, D.S.; Park, B.Y.; Jung, E.H. Guidelines for the VESTAP-based climate change vulnerability assessment. J. Clim. Chang. Res. 2017, 8, 339–346. [Google Scholar] [CrossRef]
  30. Guttman, N.B. Accepting the standardized precipitation index: A calculation algorithm. JAWRA 1999, 35, 311–322. [Google Scholar] [CrossRef]
  31. Hobbins, M.T.; Wood, A.; McEvoy, D.J.; Huntington, J.L.; Morton, C.; Anderson, M.; Hain, C. The evaporative demand drought index. Part I: Linking drought evolution to variations in evaporative demand. J. Hydrometeorol. 2016, 17, 1745–1761. [Google Scholar] [CrossRef]
  32. Baeck, S.H. Development of Water Use and Flood Vulnerability Indices for Watershed. Ph.D. Thesis, Incheon National University, Incheon, Korea, 2016. [Google Scholar]
  33. Kwon, M.J. Development of Traffic Accident Prediction Model Using Cluster Analysis Method Based on the Type of City. Master’s Thesis, Aju University, Suwon, Korea, 2008. [Google Scholar]
  34. Frohlich, M.T.; Westbrook, R. Arcs of integration: An international study of supply chain strategies. J. Oper. Manag. 2001, 19, 185–200. [Google Scholar] [CrossRef]
  35. Seong, J.H.; Byun, Y.S. A study on the weights of the condition evaluation of rock slope used in entropy and AHP method. J. Korean Soc. Saf. 2016, 31, 61–66. [Google Scholar] [CrossRef] [Green Version]
  36. Choi, H.I.; Park, S.Y.; Song, J.H.; Park, M.J. Identification of flood risk areas using a multi-criteria decision making method. J. Korean Soc. Hazard Mitig. 2013, 13, 237–244. [Google Scholar] [CrossRef] [Green Version]
  37. Lotfi, F.H.; Fallahnejad, R. Imprecise Shannon’s entropy and multi attribute decision making. Entropy 2010, 12, 53–62. [Google Scholar] [CrossRef] [Green Version]
  38. Jafari, H. Selecting appropriate quayside equipment for grain unloading using TOPSIS and entropy Shannon methods. Int. J. Innov. Appl. Stud. 2013, 3, 1072–1078. [Google Scholar]
  39. Myeong, S.J.; Yi, D.G. Assessing vulnerability to climate change of the physical infrastructure in Korea through a survey of professionals. J. Environ. Impact Assess. 2009, 18, 347–357. [Google Scholar]
  40. Lee, J.I.; Chun, Y.H.; Ha, C.H. Clustering analysis of films on box office performance: Based on web crawling. J. Soc. Korea Ind. Syst. Eng. 2016, 93, 90–99. [Google Scholar] [CrossRef]
  41. Lee, S.G.; Choi, E.J.; Kim, E.C. A study on the travel characteristics of administrative unit by factor and cluster analysis: Focused on Incheon Metropolitan City. J. Korea Inst. Intell. Transp. Syst. 2016, 15, 94–104. [Google Scholar] [CrossRef]
Figure 1. The map of the study areas (90 Eup/Myeon).
Water 13 03657 g001
Figure 2. Definition of vulnerability indicator.
Water 13 03657 g002
Figure 3. The map of the drought vulnerability assessment results.
Water 13 03657 g003
Figure 4. Drought vulnerability comparison between high vulnerable areas (seodo-myeon, seolcheon-myeon) and low vulnerable areas (chuja-myeon, Dongbu-myeon).
Water 13 03657 g004
Figure 5. Elbow curve method to determine the number of clusters.
Water 13 03657 g005
Figure 6. (a) Visualized cluster analysis of islands with two different Dims. (b) Contributions of variable to Dim–1. (c) Contribution of variable Dim–2.
Water 13 03657 g006
Figure 7. The map of the cluster analysis result.
Water 13 03657 g007
Table 1. The list of study areas of a small island in Korea.
Metropolitan City/ProvincesCityEup (Town)/Myeon (Subcounty)
Incheon metropolitan city (20)Ganghwa-gun (13)Ganghwa (eup), Seonwon, Bureun, Gilsang, Hwado, Yangdo, Naega, Hajeom, Yangsa, Songhae, Gyodong, Samsan, Seodo
Ongjin-gun (7)Bukdo, Yeonpyeong, Baeknyeong, Daecheong, Deokjeok, Jawol, Yeongheung
Jeollabukdo (1)Buan-gun (1)Wido
Jeollanamdo (41)Yeosu-si (4)Dolsan (eup), Nammyeon, Hwajeong, Samsan
Goheung-gun (3)Geumsan, Bongnae, Dongil
Yeonggwang-gun (1)Nagwol
Wando-gun (12)Wando (eup), Geumil, Nohwa (eup), Gunoe, Sinji, Gogeum, Yaksan, Cheongsan, Soan, Geumdang, Bogil, Sangil
Jindo-gun (7)Jindo (eup), Gunnae, Gogun, Uisin, Imhoe, Jisan, Jodo
Sinan-gun (14)Jido (eup), Jeungdo, Imja, Jaeun, Bigeum, Docho, Heuksan, Haui, Sinui, Jangsan, Anjwa, Palgeum, Amtae, Aphae
Gyeongsangbukdo (3)Ulleung-gun (3)Ulleung (eup), Seomyeon, Bukmyeon
Gyeonsangnamdo (23)Tongyeong-si (4)Sanyang (eup), Yokji, Hansan, Saryang
Geoje-si (9)Irun, Dongbu, Nambu, Geoje, Dundeok, Sadeung, Yeoncho, Hacheong, Jangmok
Namhae-gun (10)Namhae (eup), Idong, Sangju, Samdong, Mijo, Nammyeon, Seomyeon, Gohyeon, Seolcheon, Changseon
Jeju (2)Jeju (2)Chuja, udo
Table 2. The list of the collected indicator data and sources to set up the vulnerability assessment.
IndexIndicatorSource
Climate
exposure
Maximum number of days in which continuous no rainfallVESTAP
Model: HadGEM3-RA
(RCP post observation data/2001–2010)
Annual Precipitation (mm)VESTAP
Model: HadGEM3-RA
(RCP post observation data/2001–2010)
Precipitation in December–February (mm)VESTAP
Model: HadGEM3-RA
(RCP post observation data/2001–2010)
Precipitation in March–May (mm)VESTAP
Model: HadGEM3-RA
(RCP post observation data/2001–2011)
Evapotranspiration in December–February (mm)VESTAP
Model: HadGEM3-RA
(RCP post observation data/2001–2012)
Evapotranspiration in March–May (mm)VESTAP
Model: HadGEM3-RA
(RCP post observation data/2001–2012)
Number of days in which 3-month SPI is less than −1 VESTAP
Model: HadGEM3-RA
(RCP post observation data/2001–2012)
Number of days in which 6-month SPI is less than −1VESTAP
Model: HadGEM3-RA
(RCP post observation data/2001–2012)
Number of days in which 3-month EDDI is less than −1VESTAP
Model: HadGEM3-RA
(RCP post observation data/2001–2012)
Number of days in which 6-month EDDI is less than −1VESTAP
Model: HadGEM3-RA
(RCP post observation data/2001–2012)
SensitivityPopulationStatistical year book of local government (2017)
Population density (person/km2)Statistical year book of local government (2017)
Residential water consumption
(thousand m3/year)
VESTAP (data modified)
Cultivating area rate (%)VESTAP
Agricultural population rate (%)VESTAP
Fishery population rate (%)VESTAP
Groundwater consumption (m3/year)Groundwater annual report (2018)
The population under 5 rate (%)Statistical annual report of local government (2017)
Irrigation rate (%)VESTAP
Water pollution load
(point + nonpoint) (kg/day)
VESTAP
Adaptive
capacity
Water supply system rate (%) 1Statistical year book of local government, National Drought information-Analysis center
Community water system and small water supply system rateOpen data portal
Capacity of groundwaterVESTAP
Maximum capacity of reservoir for water supply (million m3)VESTAP
Financial independence rate of local government (%)VESTAP
GRDP (Gross Reginal Domestic Product)VESTAP (data modified)
The number of civil servants per person (persons)VESTAP
Sewer supply rate (%)Statistical year book of local government, Open data portal
1 Only wide water supply system and local water supply system rate.
Table 3. The factor analysis results and factor loads.
CategoryCritical FactorSub-FactorFactor Loads
Factor 1Factor 2Factor 3
Climate
exposure
Drought indexNumber of days in which 3-month EDDI is less than −10.9650.1680.065
Number of days in which 6-month EDDI is less than −10.9260.0440.087
Number of days in which 6-month SPI is less than −10.8200.4130.003
Number of days in which 3-month SPI is less than −10.8080.458−0.012
Impact of rainfallPrecipitation in December–February0.1970.920−0.119
Precipitation in March–May0.5520.5630.543
No rainfallMaximum number of days in which continuous no rainfall−0.010−0.1140.978
KMO :   0.512 ,   χ 2 : 1321.709, df: 21, p-value: 0.000 **
SensitivityImpact of populationPopulation0.9150.1550.221
Population density0.897−0.1090.077
Residential water consumption0.7640.013−0.082
Agricultural and fishing activityCultivating area rate−0.0470.8690.118
Agricultural population rate−0.3910.807−0.018
Fishery population rate−0.341−0.685−0.088
Groundwater consumption0.3380.4800.362
Water quality
vulnerability
Water pollution load
(point + nonpoint)
0.0330.0170.938
KMO :   0.584 ,   χ 2 : 314.466, df: 28, p-value: 0.000 **
Adaptive
capacity
Water supply capabilityWater supply system rate0.9440.112−0.087
Community water system and small water supply system rate−0.942−0.0940.082
Capacity of groundwater0.658−0.185−0.052
Maximum capacity of reservoir for water0.458−0.4180.403
Economic
capability
Financial independence rate of local government−0.1270.866−109
GRDP (Gross Regional Domestic Product)0.1710.8360.230
Reducing water pollutionSewer supply rate−0.2060.0960.896
KMO : 0.595   χ 2 : 410.414, df: 21, p-value: 0.000 **
  p   * * < 0.01 .
Table 4. Weights of index applying the entropy method.
Vulnerability IndexWeightCritical Factor/Sub-FactorWeight
Climate
exposure
0.25Impact of rainfallPrecipitation in December–February0.159
Precipitation in March–May0.144
No rainfallMaximum number of days in which continuous no rainfall0.157
Drought indexNumber of days in which 3-month EDDI is less than −10.125
Number of days in which 6-month EDDI is less than −10.122
Number of days in which 6-month SPI is less than −10.145
Number of days in which 3-month SPI is less than −10.145
Sensitivity0.25Impact of populationPopulation0.122
Population density0.073
Residential water consumption0.049
Agriculture and fisheriesCultivating area rate0.172
Agricultural population rate0.239
Fishery population rate0.155
Groundwater consumption0.144
Water quality
vulnerability
Water pollution load
(point + nonpoint)
0.043
Adaptive
capacity
0.5Water supply capabilityWater supply system rate0.265
Community water system and small water supply system rate0.102
Capacity of groundwater0.222
Maximum capacity of reservoir for water0.036
Economic
capability
Financial independence rate of local government0.158
GRDP (Gross Reginal Domestic Product)0.009
Reducing water pollutionSewer supply rate0.208
Table 5. The ranks of vulnerability assessment of drought (1st~10 h).
RankVulnerability (Total)Climate ExposureSensitivityAdaptive Capacity
AreaScoreAreaScoreAreaScoreAreaScore
1GanghwaSeodo0.15Geo-jeHacheong0.84WandoGogeum0.49GanghwaSeodo0.15
2NamhaeSeolcheon0.12JindoJindo (eup)0.83JindoJisan0.49OngjinBukdo0.16
3GanghwaSamsan0.12NamhaeNammyeon0.82NamhaeChangseon0.46OngjinDeokjeok0.19
4WandoGogeum0.11JindoJisan0.82YeosuDolsan (eup)0.44GanghwaSamsan0.20
5OngjinBukdo0.10GeojeYeoncho0.81GoheungGeumsan0.44OngjinJawol0.23
6GanghwaSonghae0.10GeojeNambu0.80SinanJido (eup)0.42OngjinDaecheong0.25
7GanghwaGyodong0.10JindoImhoe0.80JindoImhoe0.41Gang-hwaSonghae0.29
8GanghwaHajeom0.09GeojeSa-deung0.80JindoGunnae0.41UlleungSeomyeon0.29
9NamhaeSeomyeon0.09GeojeGeoje0.79JindoUisin0.40GanghwaYangsa0.29
10SinanAnjwa0.09JindoJodo0.79Gang-hwaGyodong0.39GanghwaGilsang0.30
Table 6. The distance between the final cluster centers of the cluster and the cluster belonging to it.
ClusterClimate ExposureSensitivityAdaptive Capacity
1 (n = 29)0.555−0.527−0.672
2 (n = 33)0.5160.931−0.307
3 (n = 28)−1.184−0.5511.059
Table 7. The results of the one-way ANOVA.
ClusterResidualsFp-Value
dfMean sqdfMean sq
Climate exposure228.51870.3677.592.2 × 1016 ***
Sensitivity245.22870.5044.933.9 × 1014 ***
Adaptive capacity223.84870.4750.213.1 × 1015 ***
  p   * * * < 0.001 .
Table 8. The results of the Posteriori tests (Tukey’s honestly significant difference).
Dependent Variables(I) Group(J) GroupMean Differencep-Value95% CI
Lower
Bound
Upper
Bound
Climate exposureCluster 2Cluster 1−0.0390.965−0.4060.328
Cluster 3Cluster 1−1.7393.1 × 10−10 ***−2.122−1.356
Cluster 3Cluster 2−1.7003.1 × 10−10 ***−2.072−1.329
SensitivityCluster 2Cluster 11.45873.2 × 10−10 ***1.02821.889
Cluster 3Cluster 1−0.0240.990−0.4720.423
Cluster 3Cluster 2−1.4833.2 × 10−10 ***−1.917−1.048
Adaptive capacityCluster 2Cluster 1−0.3650.099−0.7830.052
Cluster 3Cluster 1−1.7323.1 × 10−10 ***−2.167−1.297
Cluster 3Cluster 2−1.3673.6 × 10−10 ***−1.789−0.944
  p   * * * < 0.001 .
Table 9. The result of the cluster analysis.
ClusterClusterFp-Value
Cluster 1
(n = 29)
Cluster 2
(n = 33)
Cluster 3
(n = 28)
Climate exposure0.5550.516−1.18477.592.2 × 1016 ***
Sensitivity−0.5270.931−0.55144.933.9 × 1014 ***
Adaptive capacity−0.672−0.3071.05950.213.1 × 1015 ***
Cluster
properties
Vulnerable to climate exposureVulnerable to sensitivityVulnerable to adaptive capacity--
  p   * * * < 0.001 .
Publisher’s Note: MDPI stays neutral with regard to jurisdictional claims in published maps and institutional affiliations.

