
A Canopy Transpiration Model Based on Scaling Up Stomatal Conductance and Radiation Interception as Affected by Leaf Area Index


1
Precision Agriculture Research Group, University of New England, Armidale, NSW 2351, Australia
2
Department of Agricultural Engineering, Sher-e-Bangla Agricultural University, Dhaka 1207, Bangladesh
3
Food Agility Cooperative Research Centre Ltd., University of New England, Armidale, NSW 2351, Australia
4
Plant, Soil and Environment Systems, School of Environmental and Rural Science, University of New England, Armidale, NSW 2351, Australia
*
Author to whom correspondence should be addressed.
Water 2021, 13(3), 252; https://doi.org/10.3390/w13030252
Submission received: 25 December 2020
/
Revised: 17 January 2021
/
Accepted: 18 January 2021
/
Published: 20 January 2021
(This article belongs to the Special Issue Evapotranspiration Measurements and Modeling)
Abstract
:Estimating transpiration as an individual component of canopy evapotranspiration using a theoretical approach is extremely useful as it eliminates the complexity involved in partitioning evapotranspiration. A model to predict transpiration based on radiation intercepted at various levels of canopy leaf area index (LAI) was developed in a controlled environment using a pasture species, tall fescue (Festuca arundinacea var. Demeter). The canopy was assumed to be a composite of two indistinct layers defined as sunlit and shaded; the proportion of which was calculated by utilizing a weighted model (W model). The radiation energy utilized by each layer was calculated from the PAR at the top of the canopy and the fraction of absorbed photosynthetically active radiation (fAPAR) corresponding to the LAI of the sunlit and shaded layers. A relationship between LAI and fAPAR was also established for this specific canopy to aid the calculation of energy interception. Canopy conductance was estimated from scaling up of stomatal conductance measured at the individual leaf level. Other environmental factors that drive transpiration were monitored accordingly for each individual layer. The Penman–Monteith and Jarvis evapotranspiration models were used as the basis to construct a modified transpiration model suitable for controlled environment conditions. Specially, constructed self-watering tubs were used to measure actual transpiration to validate the model output. The model provided good agreement of measured transpiration (actual transpiration = 0.96 × calculated transpiration, R2 = 0.98; p < 0.001) with the predicted values. This was particularly so at lower LAIs. Probable reasons for the discrepancy at higher LAI are explained. Both the predicted and experimental transpiration varied from 0.21 to 0.56 mm h−1 for the range of available LAIs. The physical proportion of the shaded layer exceeded that of the sunlit layer near LAI of 3.0, however, the contribution of the sunlit layer to the total transpiration remains higher throughout the entire growing season.
1. Introduction
Transpiration, the plant component of evapotranspiration, is a key element in the terrestrial water balance. It is strongly connected to biomass productivity as it occurs simultaneously with photosynthetic gas exchange [1]. It is primary pathway for water released to the atmosphere by vegetation and occurs via the stomatal diffusion of water molecules during the exchange of carbon dioxide [2]. Stomata play a dominant role in controlling transpiration, and is supported by theoretical studies of gas exchange through individual pores, for individual leaves, and for entire canopies [3]. There is, however, debate as to the extent to which stomata control transpiration and the relative influence of micrometeorological factors and canopy structure [4,5]. Transpiration at the individual leaf scale can be made with specialised instrumentation [6]. However, the impact of controlling variables such as stomatal conductance on transpiration from a composite layer of canopy can only be achieved through mathematical modelling. Theoretical models for a variety of plants and crops have been developed that provide an estimation of evapotranspiration [3,7,8,9] or transpiration [10,11,12,13] from leaf-level stomatal conductance measurements scaled up to the canopy level. Leaf stomatal conductance, as well as other environmental factors that control evapotranspiration, are comparatively easy to measure, however, calculating the resulting canopy conductance requires more complex mechanistic or empirical approaches [14,15].
A common approach is the so-called “big-leaf” model, where the canopy is considered as a single leaf and the canopy stomatal conductance is calculated by multiplying the single leaf stomatal conductance by the leaf area index (LAI). The dual-source model defined by Shuttleworth and Wallace [11] separately estimates evaporation and transpiration and can also approximate the interrelation between biophysical and hydrological processes within the plant canopy. The model forms the foundation for the theoretical estimation of transpiration, however, because of complexity in parameterization, the model has typically been used only in a simplified format [16,17]. The model is also prone to over- or underestimation of the net transpiration, as for the “big-leaf” model, due to the non-linear stomatal reaction to in situ light which is critically dependent on the assumed LAI value in the model [18,19].
An alternative weighted “dual-leaf” model was developed for irrigated maize by dividing the canopy into sunlit and shaded categories and then scaling up stomatal conductance from the components to the canopy level [7]. Predicted canopy conductance was reported to be in good agreement with the daytime measured values of evapotranspiration (slope 1.01, R2 = 0.98) when tested at different crop growth stages. The authors concluded that the precision of estimating evapotranspiration and soil evaporation using the “dual-leaf” model was higher than that for the “big-leaf” model and could be an effective substitute for estimating and partitioning evapotranspiration components. However, the model performance was only validated against variable solar radiation, but the impact of variations in canopy coverage or LAI on the magnitude of transpiration was not investigated. Moreover, a single canopy conductance value was calculated for the whole canopy and therefore the potential benefits of assuming a “dual-leaf” configuration was not realized.
A further example of scaling up of stomatal conductance to canopy level for estimating evapotranspiration in maize was the development of a weighted integration model by Zhang, et al. [20]. A comparison was made between the modelled and measured values of canopy conductance, together with evapotranspiration with respect to the diurnal variation of incident radiation. In that study, two types of models, namely the weighted model and the weighted integration model, were applied to the Penman–Monteith equation for scaling up stomatal conductance and for calculating evapotranspiration, respectively. The estimated canopy conductance and evapotranspiration derived through both models closely resembled the values measured both by inverting the Penman–Monteith equation and Eddy Covariance methods. This result is, in itself, surprising. It could be expected that for an actively growing crop, with no limit of soil moisture, the theoretical value of stomatal conductance, and consequently the canopy conductance, could well exceed the saturation limit for the available energy. One would expect, on balance, that the actual canopy conductance would be considerably higher than that measured by model inversion. Soil evaporation, which dominates the evapotranspiration at lower LAI, was not included and this was considered by the authors as the primary reason for the apparent discrepancy between their modelled and measured values. Considering soil evaporation separately is important as the soil surface evaporation can change significantly as the soil surface layers dry [21,22]. At the same time, transpiration can remain unchanged as it is controlled by available soil moisture at rooting depth [23].
Whether calculated by the “big-leaf” or “dual-leaf” method, LAI remains the most significant determinant of canopy conductance [8,20], and it therefore plays an important role in the estimation of transpiration. It is evident from previous studies that transpiration is linked to the canopy LAI [24,25,26,27].
The tendency of basal crop coefficients to saturate at higher LAI is reflective of a limited evaporative demand within the canopy [28]. Available energy is the ultimate limiting factor for total water loss; however, it is useful to understand the contribution of leaves at different layers within the canopy to the observed nonlinear relationship between canopy LAI and measured transpiration. It has been found that stomatal conductance, whether directly measured or theoretically modelled, is higher at the top of the canopy [29]. However, the single “big-leaf” or “dual-leaf” canopy models for calculating total evapotranspiration using stomatal conductance do not factor in this vertical variability in stomatal conductance. Furthermore, it is contended that failure to accommodate this vertical variability explains the nonlinear behaviour of transpiration with increasing LAI.
The Penman–Monteith equation, considered the standard approach to evapotranspiration modelling, incorporates the aerodynamic resistance and the canopy resistance to calculate evapotranspiration [30]. Jarvis and McNaughton [3] created a similar model of evapotranspiration by scaling up stomatal conductance from a single pore in a leaf to the leaf, and then to canopy level. However, this approach does not allow separation of evaporation from transpiration components, and, with the canopy being treated as a single layer, does not allow testing of the role of canopy LAI.
There are alternative models that describe the relationship between canopy LAI and transpiration or basal crop coefficient for pasture and crop canopies in the field and in controlled environments [26,31]. However, these have not incorporated canopy conductance.
To better explore the relationship between canopy transpiration resulting from stomatal conductance and LAI variations, it is important to consider the micro-climate within the canopy as this influences localised evaporative demand. Conducting an experiment in a controlled environment is therefore particularly helpful so as to allow precise monitoring and control of the environment. A transpiration model developed under greenhouse conditions will enable a better understanding of the environmental effects on transpiration, not only in the greenhouse but also under field conditions.
Different models maybe required for different applications, but the Penman–Monteith approach that merges the physical processes of energy, mass and heat transfer, remains at the core of all models and is of use in both greenhouse conditions and in field applications [32,33,34,35].
The aim of this paper is therefore to combine measurements of leaf stomatal conductance and canopy LAI with bulk measures of plant transpiration to develop a theoretical model for canopy transpiration based on the Penman–Monteith evapotranspiration model to improve our understanding of the inter-relationship between these parameters.
2. Constructing a Theoretical Model of Canopy Conductance
2.1. Defining the Model Structure
A pasture canopy can be segmented into two indistinct layers of upper (sunlit) and lower (shaded) portions (Figure 1).
The figure demonstrates the solar zenith angle (θ), the azimuth angle (φ) and variable leaf angles (α), which determines the value of leaf angle distribution parameter (χ) and canopy extinction coefficient (kb) in Equation (4). Considering each layer of the canopy as a “big-leaf” in a weighted layer model [8,20] the canopy conductance (gc) for any of the assumed canopy layers can be written as:
where:
gs(ab) = abaxial stomatal conductance (m s−1)
gs(ad) = adaxial stomatal conductance (m s−1), and,
LAI = leaf area index of the corresponding canopy layer.
The subscripts, sl and sh, refer to the sunlit and shaded layers, respectively.
The proportion of sunlit and shaded leaves within a canopy is dictated by the LAI and external illumination parameters, e.g., solar illumination angle. Following Dai et al. [8], the simplified way to calculate LAI of the sunlit and shaded portions of a canopy can be given by:
where is the direct beam extinction coefficient of the canopy, which can be expressed as:
where and . For these equations, the value for the leaf angle distribution parameter, χ, may be taken as 1 (planophile), −1 (erectophile) or 0 (spherical leaf angle) [8]. The extinction coefficient is associated with the mean projection of unit leaf area on the plane perpendicular to beam direction as described by Nilson [36].
2.2. Modelling Transpiration
Following the usual derivation of the Penman–Monteith equation [28], and incorporating the additional refinement of Jarvis and McNaughton [3], the equation for evaporation from a single, asymmetric leaf (El) can be written as:
where,
GH and GV are the total conductance for sensible heat and for water vapour, respectively,
∆ = slope of the saturation vapour pressure curve, (kPa °C−1),
Rn = net radiation, (MJ m−2 h−1),
ρa = air density, (kg m−3),
Cp = specific heat of air, (MJ kg−1 °C−1),
D = vapour pressure saturation deficit, (kPa) and
λ = latent heat of vaporization of water, (MJ kg−1).
The overall conductance (gc) of the composite canopy can be calculated by combining the adaxial and abaxial stomatal conductances for both the sunlit and shaded layers. In this context, the sensible heat conductance, GH, (Equation (5)) can be replaced by the surface layer aerodynamic conductance (ga), and water vapour conductance, GV, replaced by (1 + ga/gc) [3]. A ground heat flux term (G) can also be introduced. The overall canopy evapotranspiration (ETr) can, therefore, be re-written as [28,30]:
where, in addition to the terms of Equation (5),
G = ground heat flux, (MJ m−2 h−1),
gc = canopy conductance calculated from stomatal conductance and LAI data, (m s−1) and
ga = aerodynamic conductance, (m s−1).
The value of aerodynamic conductance (ga) can be calculated using the following equation:
where,
k = the Karman constant, (0.40),
u = wind speed at reference height, (m s−1),
z = the reference height, (2 m),
hc = mean crop height, (m),
zo = roughness length of the crop relative to momentum transfer, (m) and
d = zero plane displacement, (m).
Both zo and d are functions of the mean crop height and can be defined as:
The calculation of aerodynamic conductance in a greenhouse is quite complicated and for accurate estimation it requires the thermodynamic properties of the canopy surface and the convection heat and mass loss to be quantified. However, the aerodynamic term calculated in this way can still produce erroneous results when the Penman–Monteith equation is used to calculate transpiration [37]. Moreover, given we are dealing with different layers of the canopy and forced ventilation in the greenhouse, it was assumed that effective ventilation will surpass the convective heat transfer. We used the conventional method to estimate aerodynamic conductance so that Equation (6) can be applied separately to each segment of sunlit and shaded layers.
The amount of energy intercepted by each layer, together with the vapour pressure deficit and aerodynamic resistance, can be estimated using the proportion of canopy LAI for each layer. The radiation flux intercepted by a given canopy segment can be calculated as:
where PAR is the photosynthetically active radiation received by the canopy (mmol m−2 s−1) at the top of the canopy. The constant 0.00173 is the conversion factor used to convert PAR into MJ m−2 h−1 (total radiation energy in all wavelengths), assuming that approximately 45% of the total energy in solar radiation is in the range of 400–700 nm [38,39]. For the sunlit canopy layer, PARsl is the measured value at top of the canopy, whereas, for the shaded layer the PARsh value is PARsl minus the amount that was intercepted by the sunlit portion. The fAPARLAI is the fraction of photosynthetically active radiation absorbed by the canopy for a particular LAI. In the model, this is broken up into sunlit and shaded components of the canopy. By introducing fAPAR, the energy that passes through the canopy and is intercepted by the soil is excluded from the model and therefore excludes the soil evaporation component. For each of the sunlit (sl) and shaded (sh) portions, Equation (6) can be re-written in terms of transpiration, Tr, as:
The ground flux (G) component of Equation (6) is omitted from Equations (9) and (10), as both the upwelling and down-welling energy propagating through the canopy is accounted for in the fAPAR.
3. Materials and Methods
3.1. Establishing and Monitoring the Growing Environment
The experiment was conducted in a controlled environment greenhouse at the University of New England (Australia) from November 2018 to January 2019 (Spring-Summer). The greenhouse was not heated, but there was a forced ventilation cooling system present in the greenhouse chamber.
A grass sward was grown in 0.038 m3 self-watering tubs (surface area = 0.02 m2). Highly permeable peat river sand potting mix (3:1 v/v) was placed as a 1.5 cm thick base layer to facilitate water infiltration into and out of the soil from the underlying water reservoir. The tubs were then filled to within 3 cm of the top with a cracking clay soil (35% clay, bulk density 0.91 g cm−3) (vertosol) sourced from the Laureldale Field Station (Figure 2).
The tubs were sown with tall fescue (Festuca arundinacea var. Demeter) seed at a rate of 60 kg ha−1 (approx. 2000 seedlings m−2) on three sowing dates and with four rates of urea/triple superphosphate fertilizer (0, 33, 66 and 100 kg N ha−1) to achieve a range of growth rates and vegetation coverage during the growing season. All treatments were randomized.
Prior to sowing, the tubs were irrigated to field capacity. Moisture content was monitored over a period of one week using an MP306 soil moisture probe (ICT International, Armidale, Australia) to confirm a temporally stable and spatially uniform moisture distribution throughout each tub.
Following seedling emergence, the soil surface was covered with white plastic beads to minimise soil evaporation, and thus ensure measured water loss was only from transpiration [40,41,42].
Air temperature and relative humidity were recorded using a thermocouple (ICT International, Armidale, Australia) and hygrometer (Visala Oy, HMP 35A, Helsinki, Finland). Seedlings were grown under non-water-limiting conditions throughout the measurement period. The canopy LAI and fraction of absorbed photosynthetically active radiation (fAPAR) was measured with an AccuPAR ceptometer (LP-80; Decagon Devices, Pullman, WA, USA) using a 0.5 m active portion of a 1 m long sensor probe to ensure canopy coverage [43,44]. Wind velocity immediately above the canopy was estimated using a CFM/CMM Thermo Anemometer (Digitech, QM 1646, Model, 0.40–30.00 m s−1, Electus Distribution Pty. Ltd., Rydalmere, Australia).
3.2. Measuring Canopy Transpiration
Water level in each tub reservoir was monitored using a U-tube observation port equipped with a micro-level ‘pin’. This pin was installed at the bottom of the funnel so that the tip of the pin could be observed closely. Reservoirs were first filled to the point of surface contact with the tip of the pin. After a measured time interval (1–3 h), the reservoir was again filled to the start point using a 50 mL burette and the quantity of replenishment water (mL) recorded. Actual transpiration (mm h−1) was calculated from the amount of water loss (amount required to refill), the time elapsed and the pot surface area.
Pre-trial testing was undertaken by draining an amount of water and then refilling it up to the same original level. The drained water was later measured and compared against the amount of water required to refill in order to confirm the accuracy of the refill process. It was found that the average difference between the required quantity and that initially removed was ±6.69 mL (Root Mean Square Error (RMSE) based on 33 repeated attempts); equivalent to ±0.033 mm m−2 of water loss from the tub surface area.
3.3. Measuring Canopy Conductance
An AP4 Porometer (AP4-UM-3, Delta –T Devices Ltd, Cambridge, UK) was used to measure the stomatal conductance of individual leaves in the target canopies [45]. To obtain a representative value of stomatal conductance for each canopy layer, five plants were randomly selected from each tub having a specific LAI in response to the fertilization and sowing date regime at any given sampling date/time. A total of 31 LAI values ranging from 0.86 to 4.61 were obtained in the regime for examination. Measurements were performed on the adaxial and abaxial surfaces of two leaves from each plant within the canopy; bottom (considered as ‘shaded’) and the crown leaf (considered to be ‘sunlit’). Four conductance measurements were made for each plant in the category of sunlit adaxial, sunlit abaxial, shaded adaxial and shaded abaxial. Five conductance values in each category were obtained from five plants (a total of 20 point measurements for a specific LAI, five in each category) which were then averaged to obtain a single representative value. The equivalent canopy conductance for each canopy layer of the grass sward was then calculated by weighting the average stomatal conductance of each layer with the proportion of total canopy corresponding to that layer. Each measurement was completed at the midpoint of the extended leaf, avoiding the midrib of the leaf.
The measurement of actual canopy transpiration, canopy conductance for a specific LAI together with the corresponding canopy LAI measurements were carried out in one go inside the greenhouse. Data were collected between 1000–1300 h Australian Eastern Daylight Time (AEDT), (GMT + 11 h) in a number of days during the active growing period in between 26 and 42 days after sowing. We used Microsoft Excel and Minitab software for data analysis and visualization of the results.
4. Results and Discussion
The canopy structure of the pasture was observed to exhibit a complex leaf angle distribution which changed with both the crop height and LAI. A value of the leaf angle distribution parameter, χ, for the observed pasture species was assumed to be 0. This produced an extinction coefficient of 0.5 which has been widely used as an average for the entire growing season of grassland having similar canopy structure [46,47].
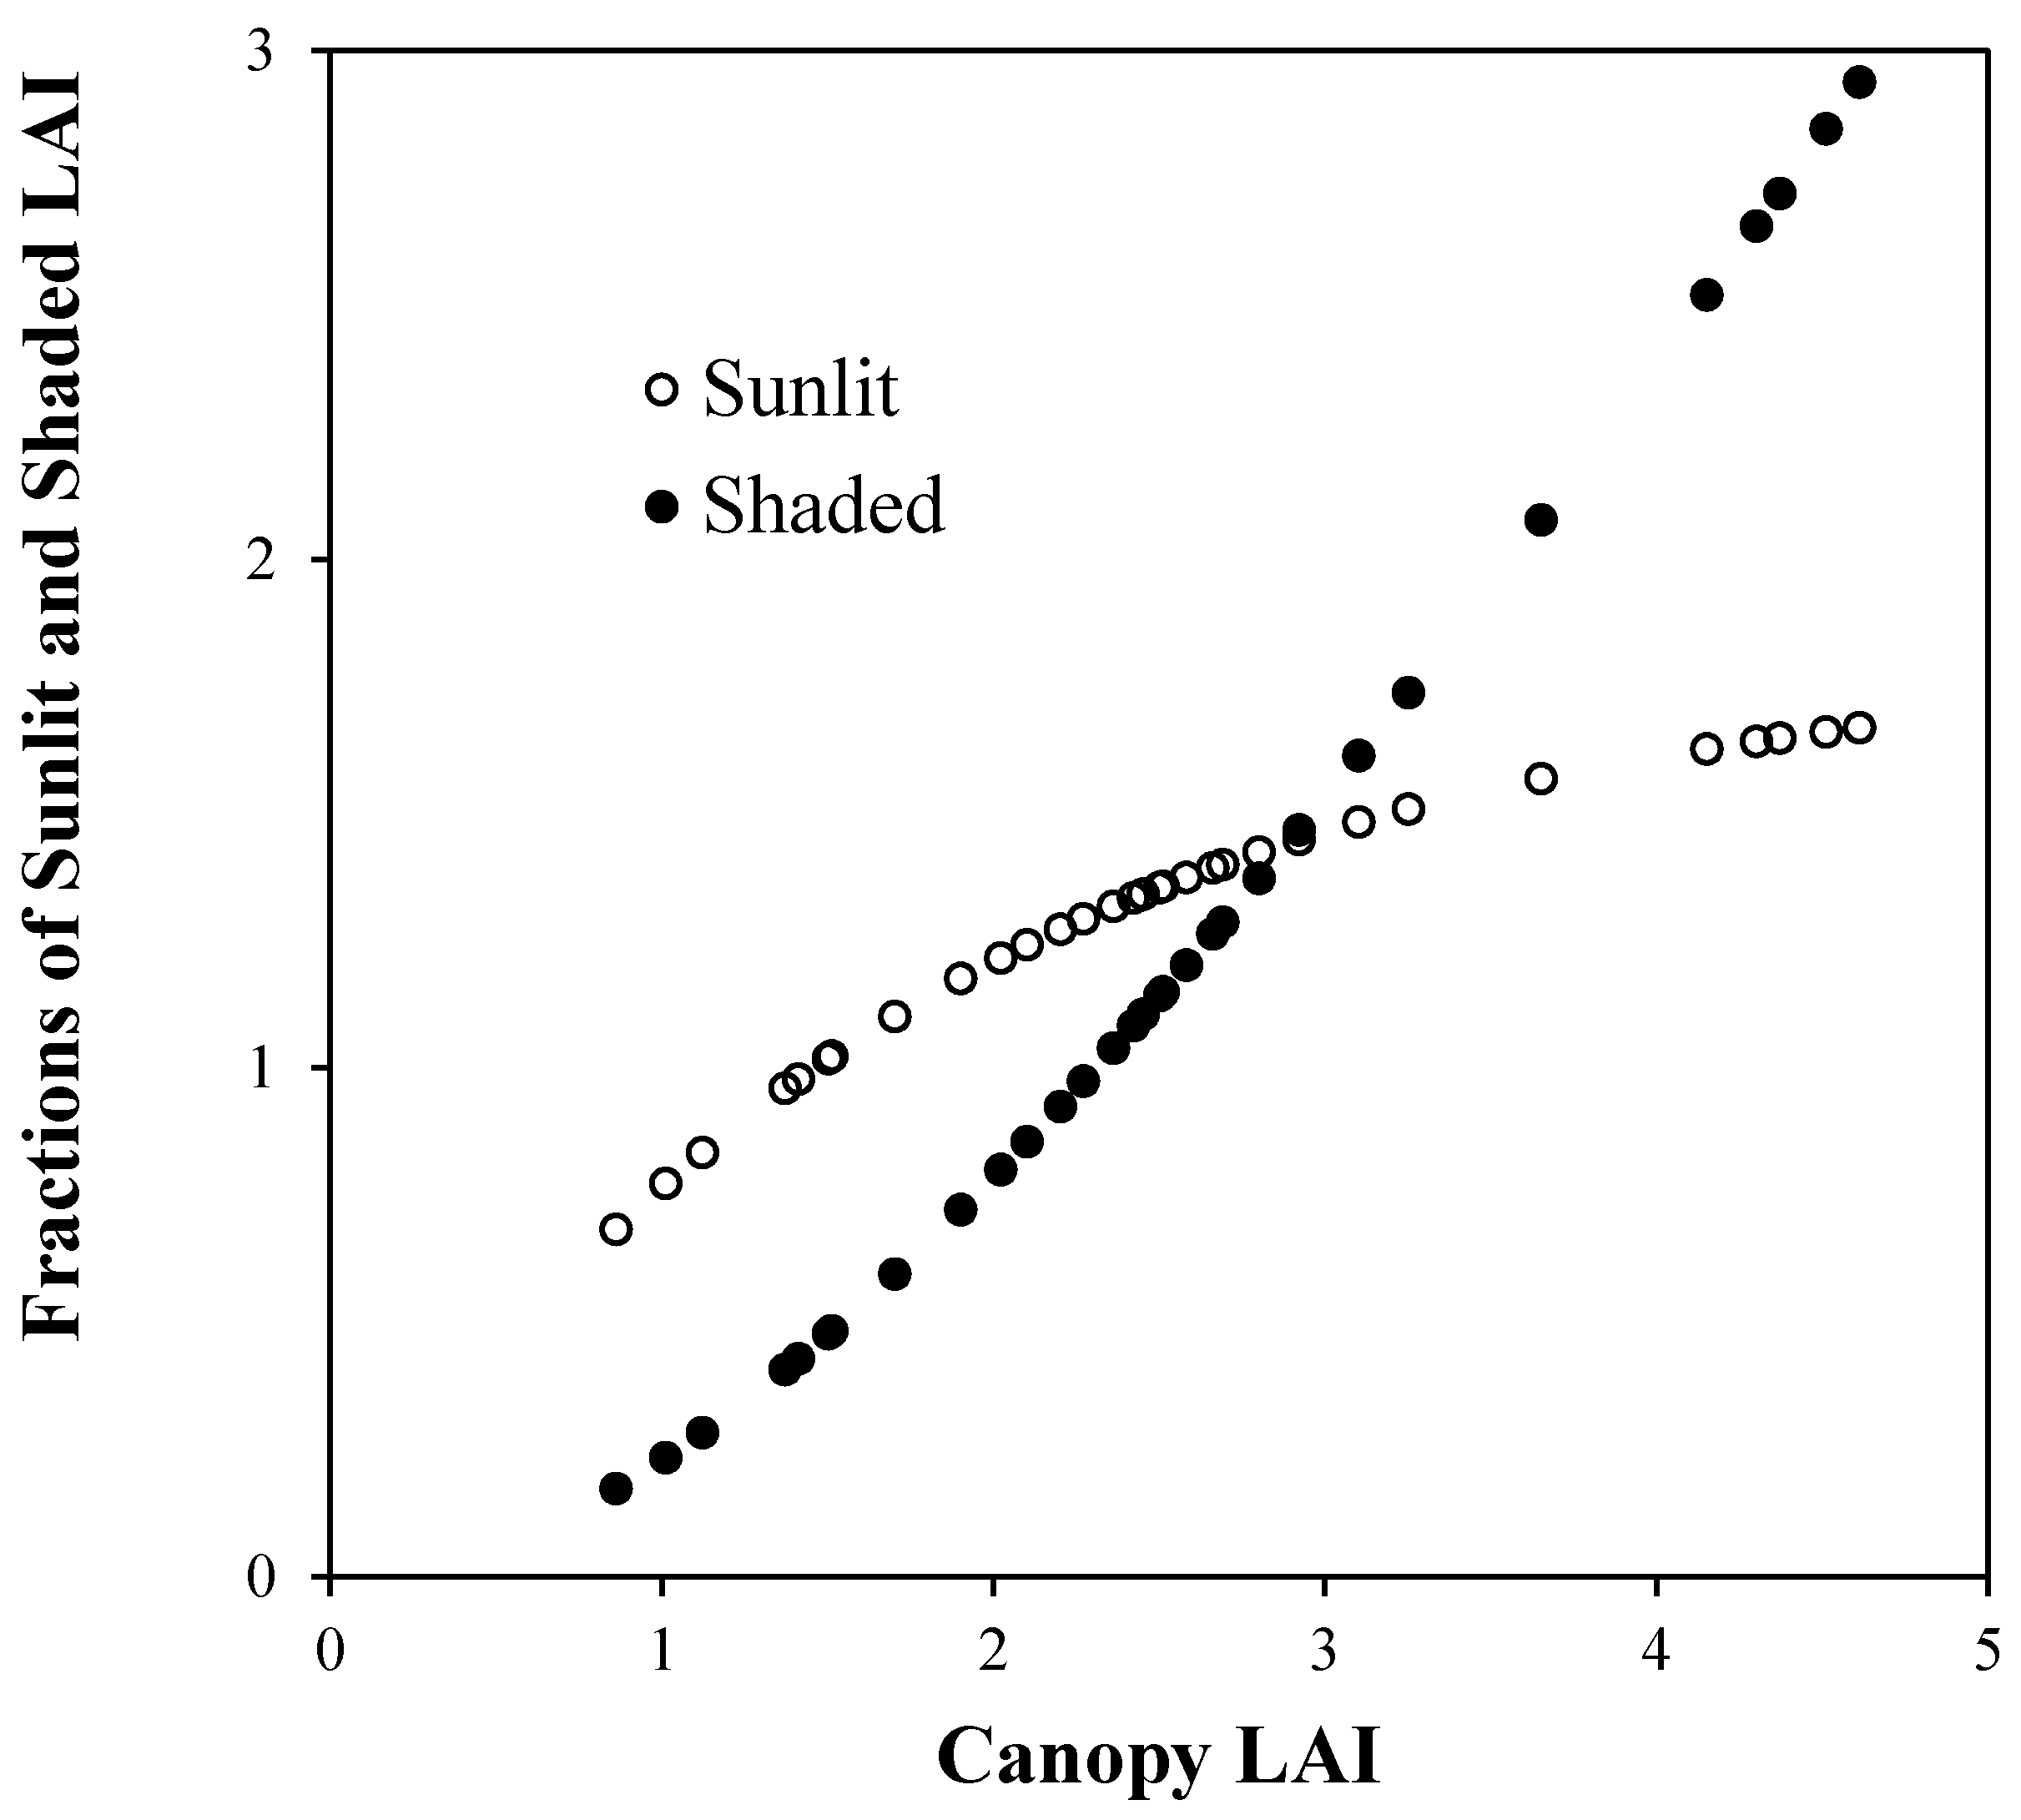
Figure 3 depicts a quadratic response of fAPAR to the increasing LAI which saturated at LAI greater than 3. In this case, measured fAPAR is shown as a function of LAI for the range of canopy variations achieved in this study but for a specific solar zenith angle of 25°. In Figure 4, the sunlit and shaded fractions of the canopy as it evolves, in relation to increasing LAI, are shown. The fractions were calculated using Equations (2) and (3). The sunlit fraction starts to saturate at LAI above 3 where it also surpassed by the shaded fraction.
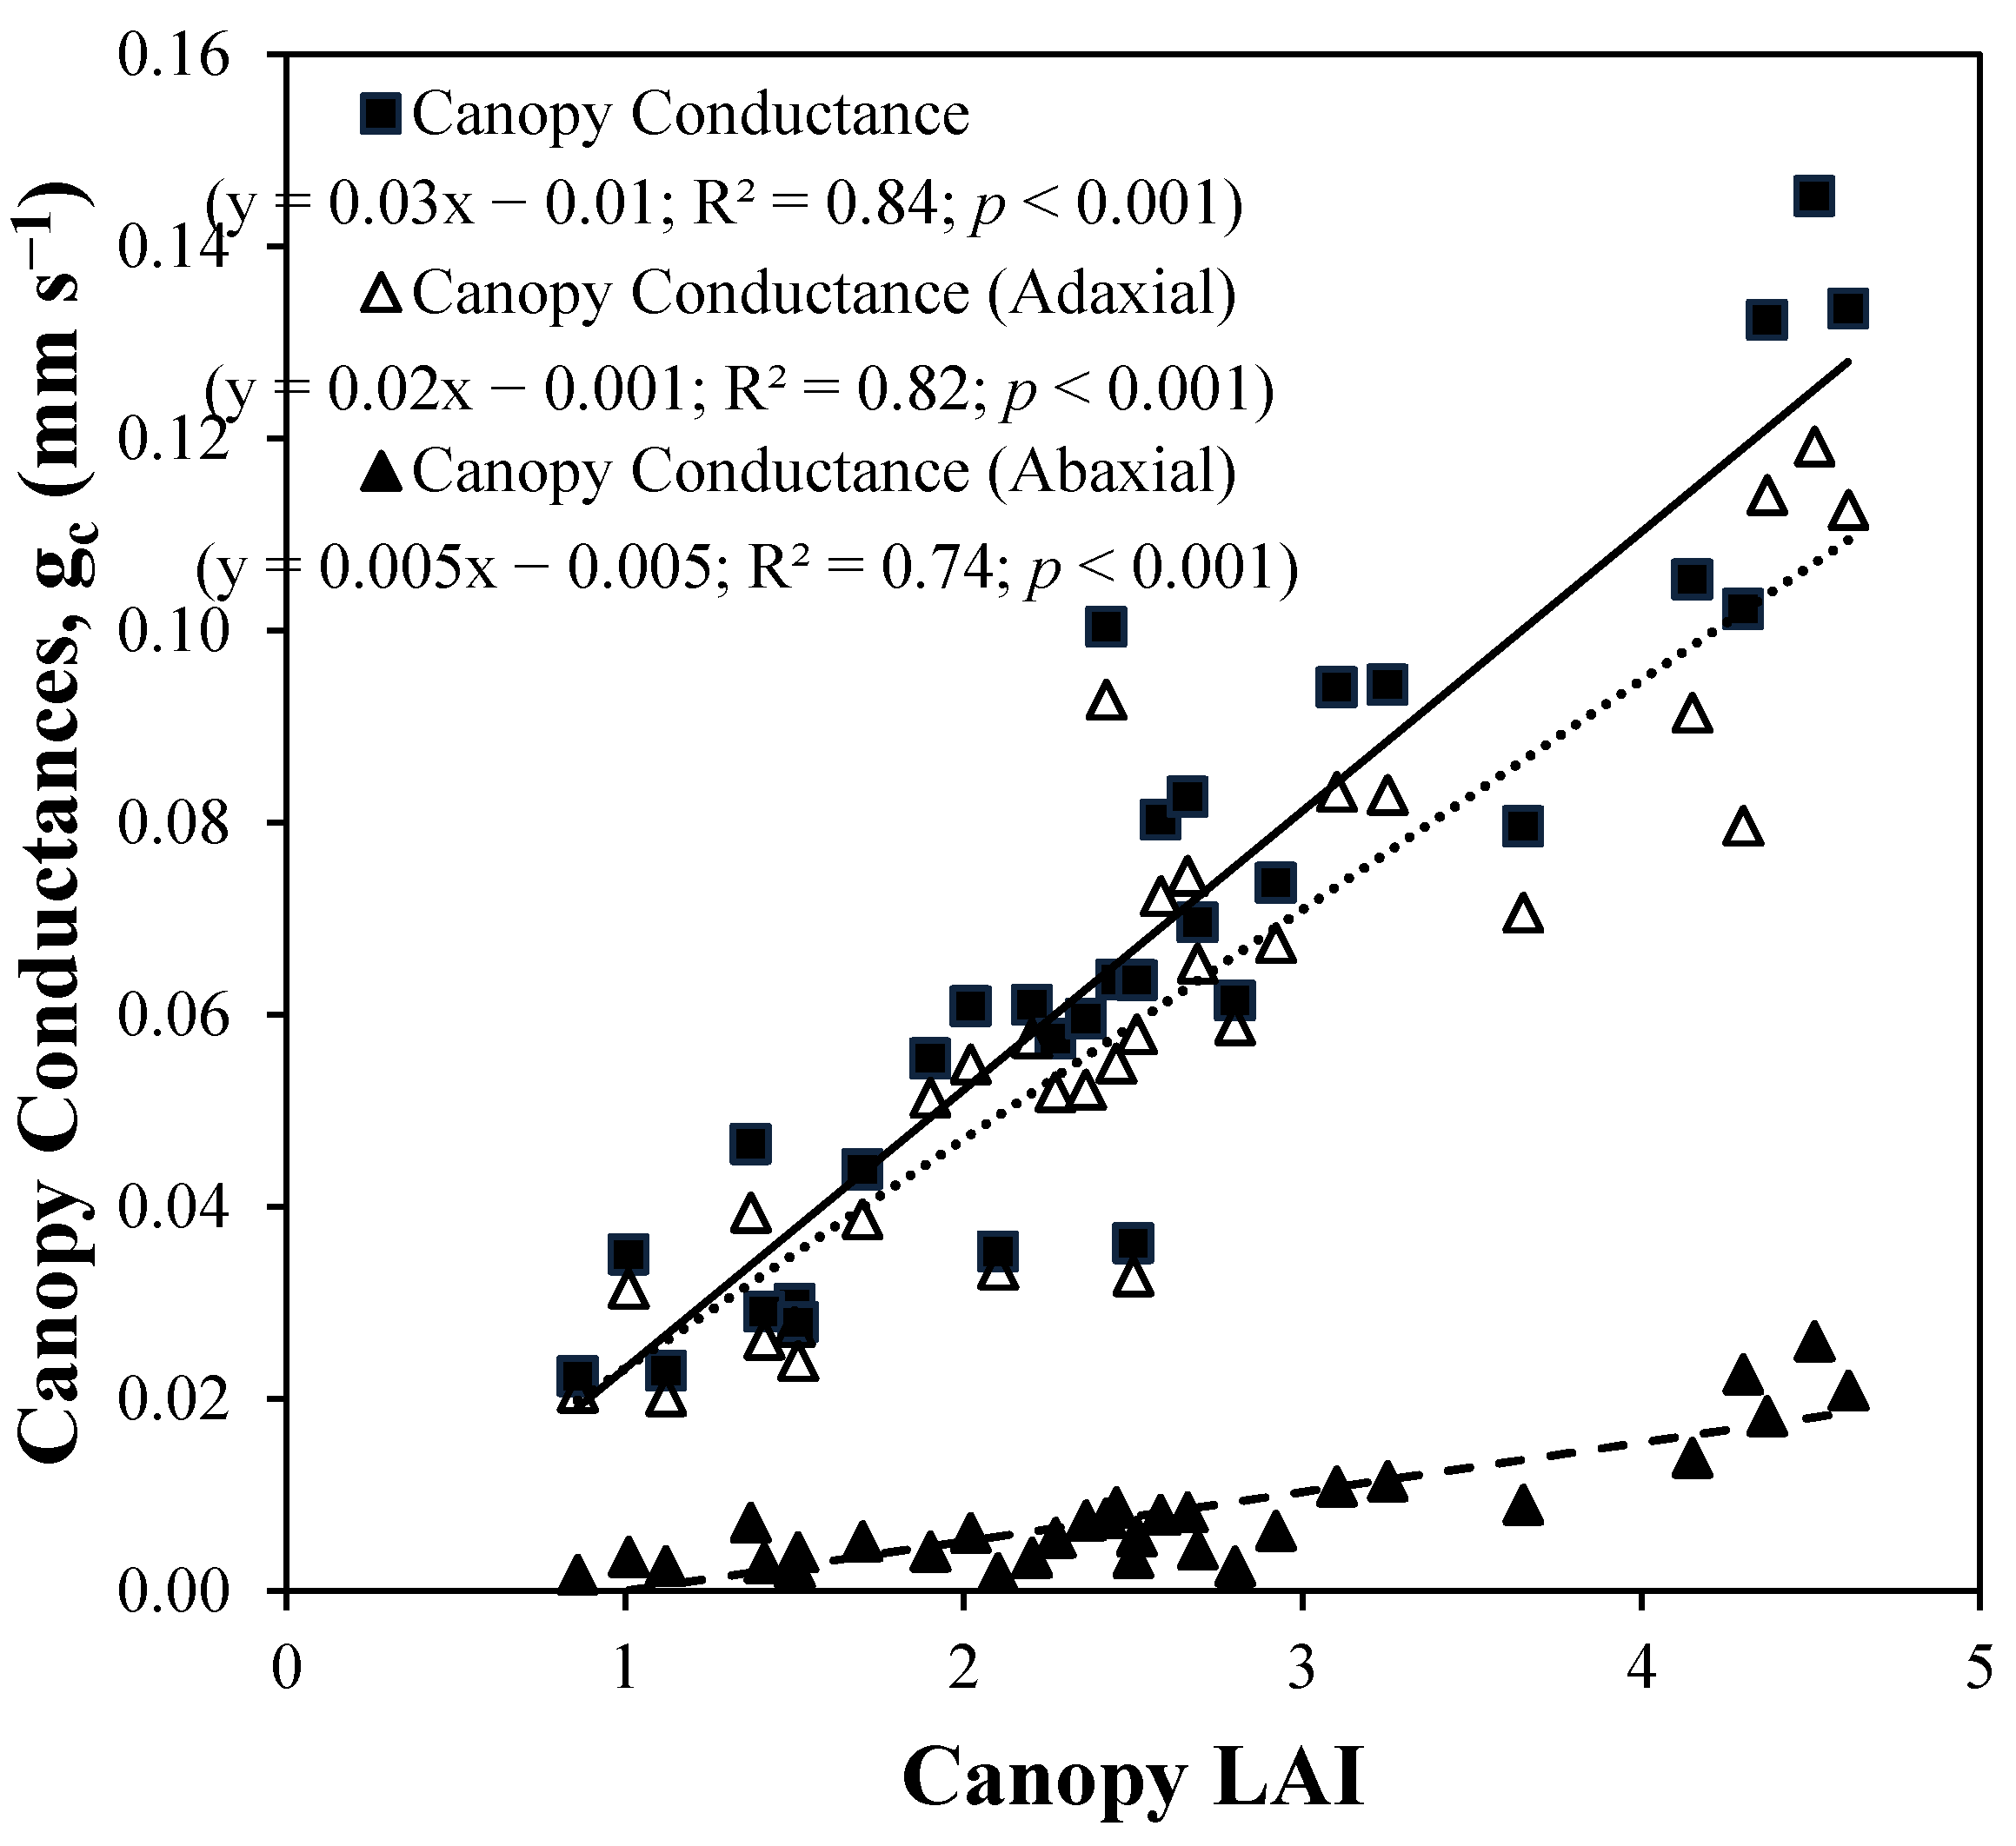
Overall canopy conductance increased linearly with LAI for both adaxial and abaxial leaf surfaces, however, the adaxial canopy conductance was found to be dominant in overall canopy conductance (Figure 5).
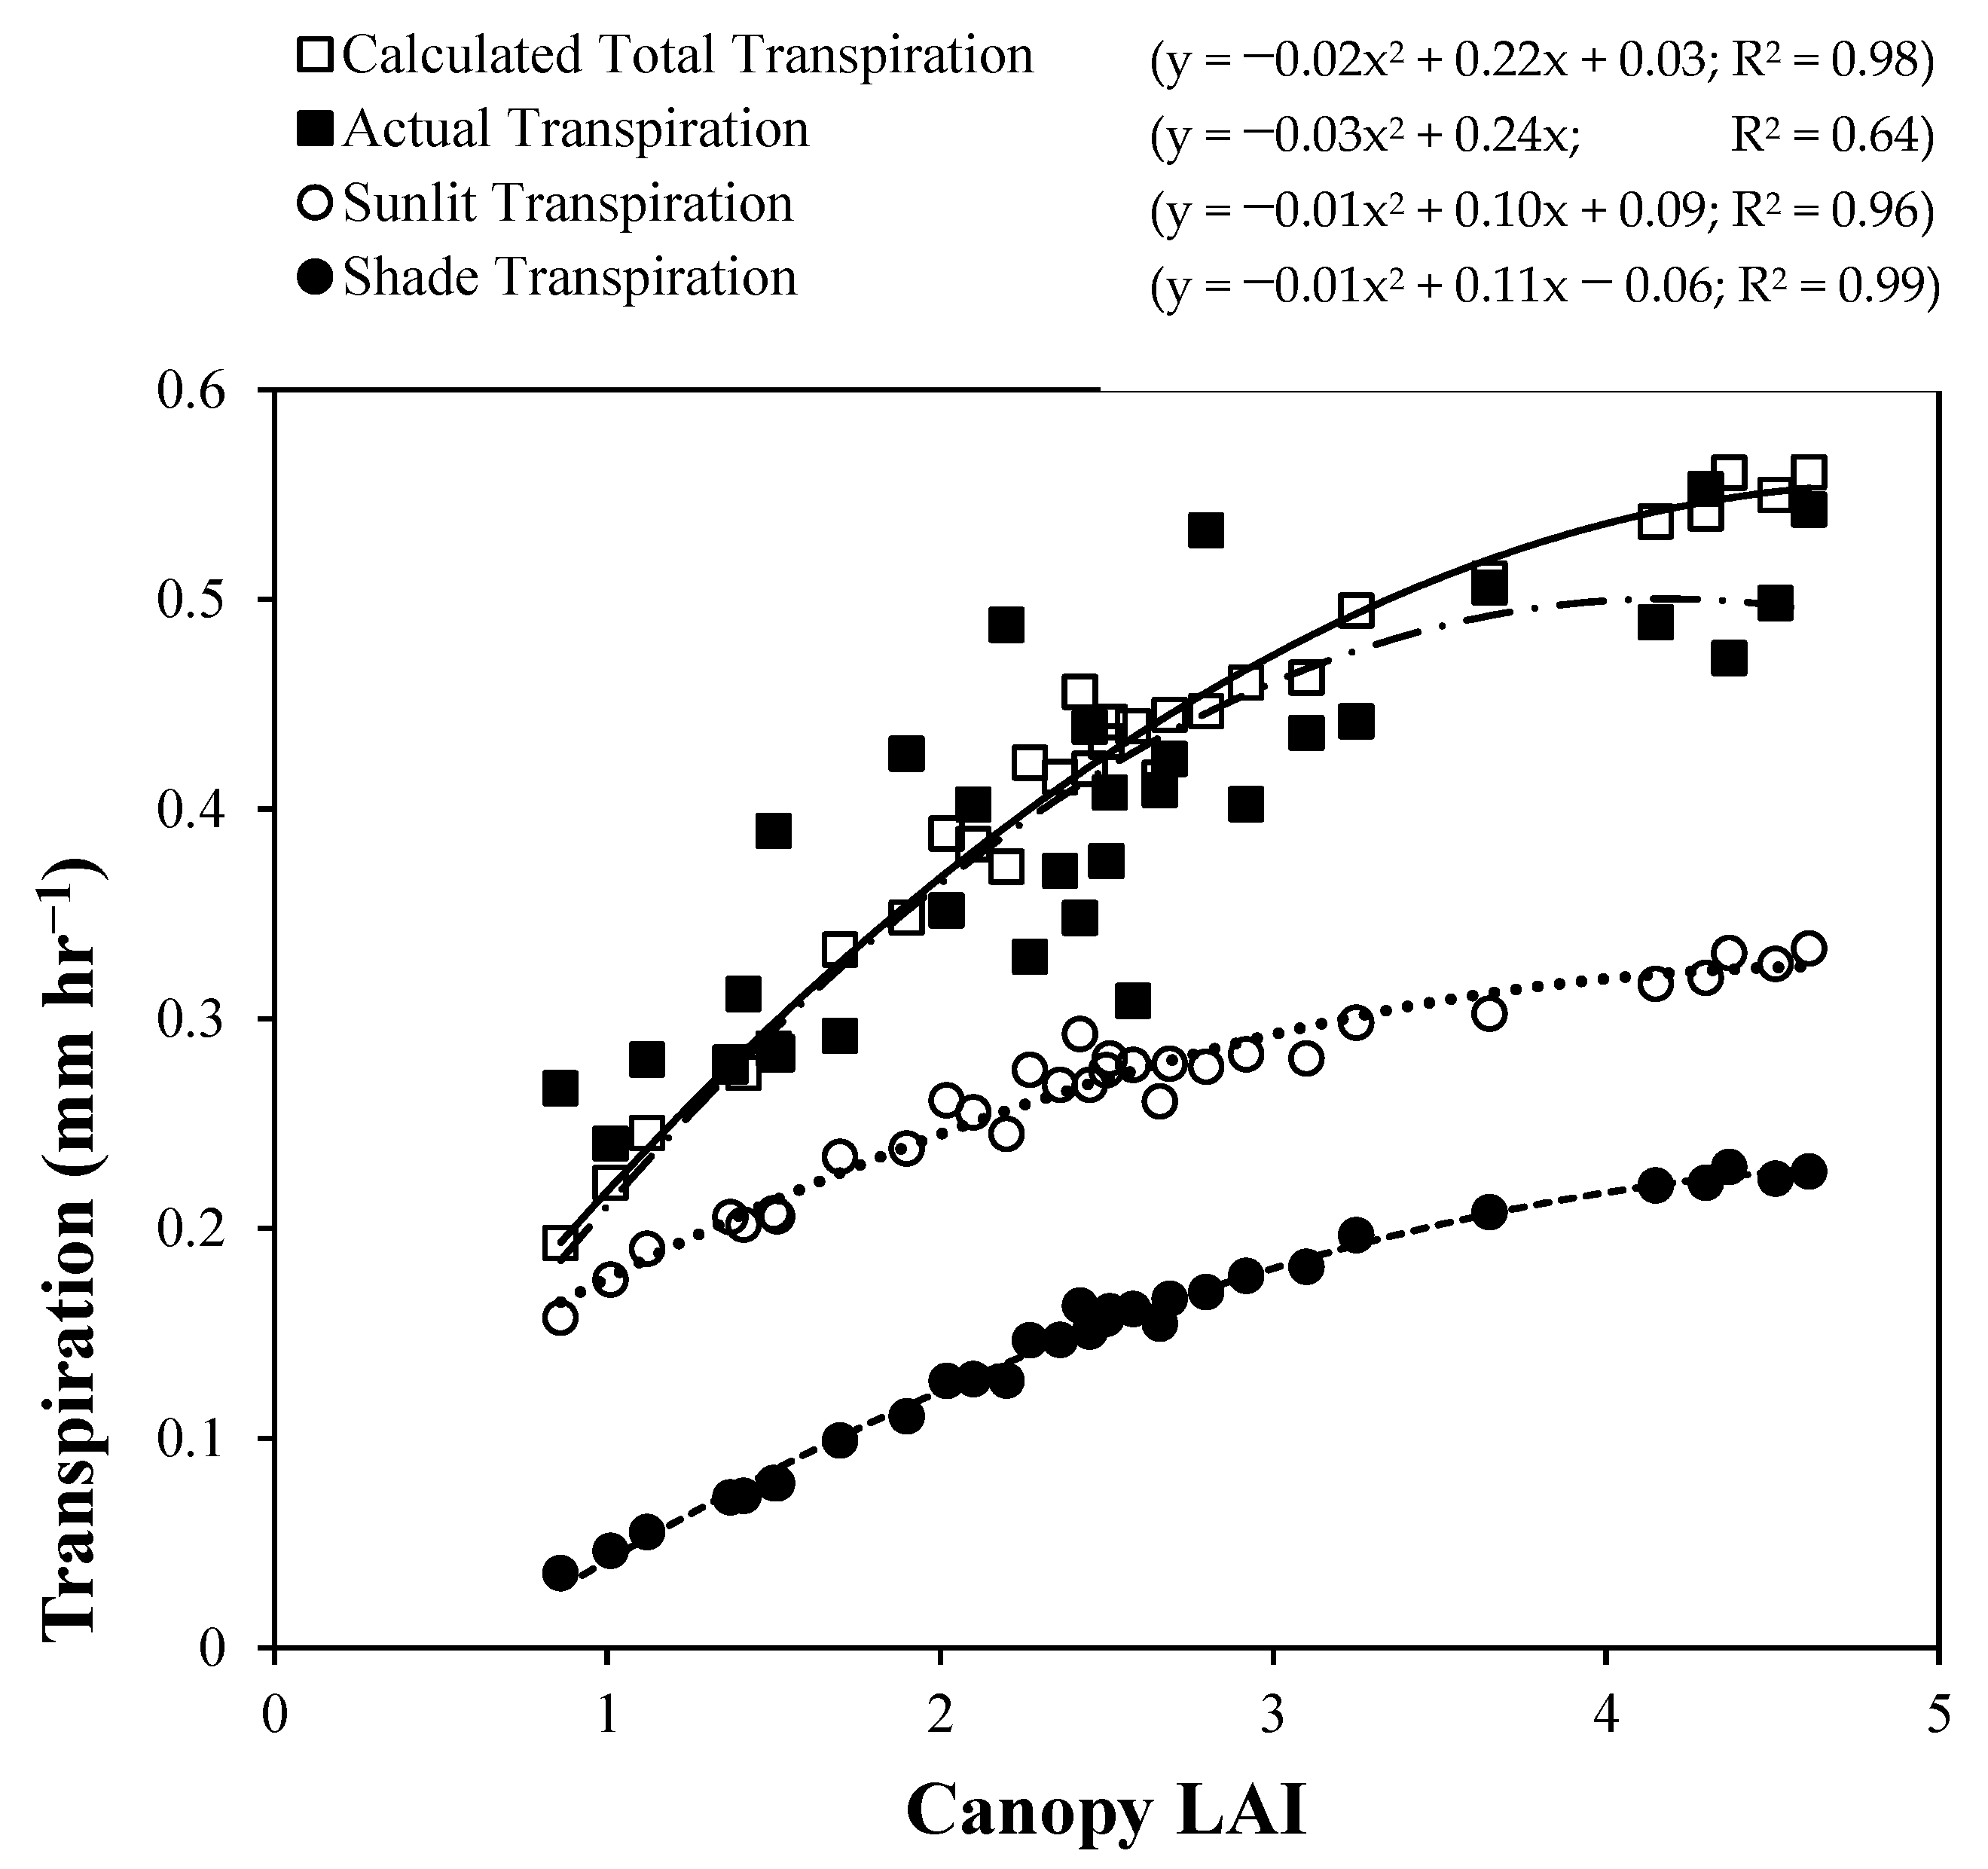
Measurements were taken when the stomata were fully open, under well-watered conditions and this dominance of the adaxial component has also been observed by Pachepsky et al. [48]. Figure 6 shows the dynamic relations between LAI and the components of transpiration as it was calculated for sunlit and shaded canopy proportions using equations developed in this study. Total calculated and actual measured transpiration were also shown in the figure which compares the two and visualize the performance of the model developed.
The shape of the total transpiration-LAI curves, specifically the tendency towards saturation at higher LAI, is similar to that reported in pasture [24] and wheat [49], where the results were expressed in terms of a basal crop coefficient (Kcb). A controlled atmosphere experiment involving the same pasture species (tall fescue), where the transpiration was separately calculated through isotopic observation, found that transpiration can be as high as 0.55 mm hr-1 for an LAI of 4, which is also very close to the model-predicted values in this experiment [31].
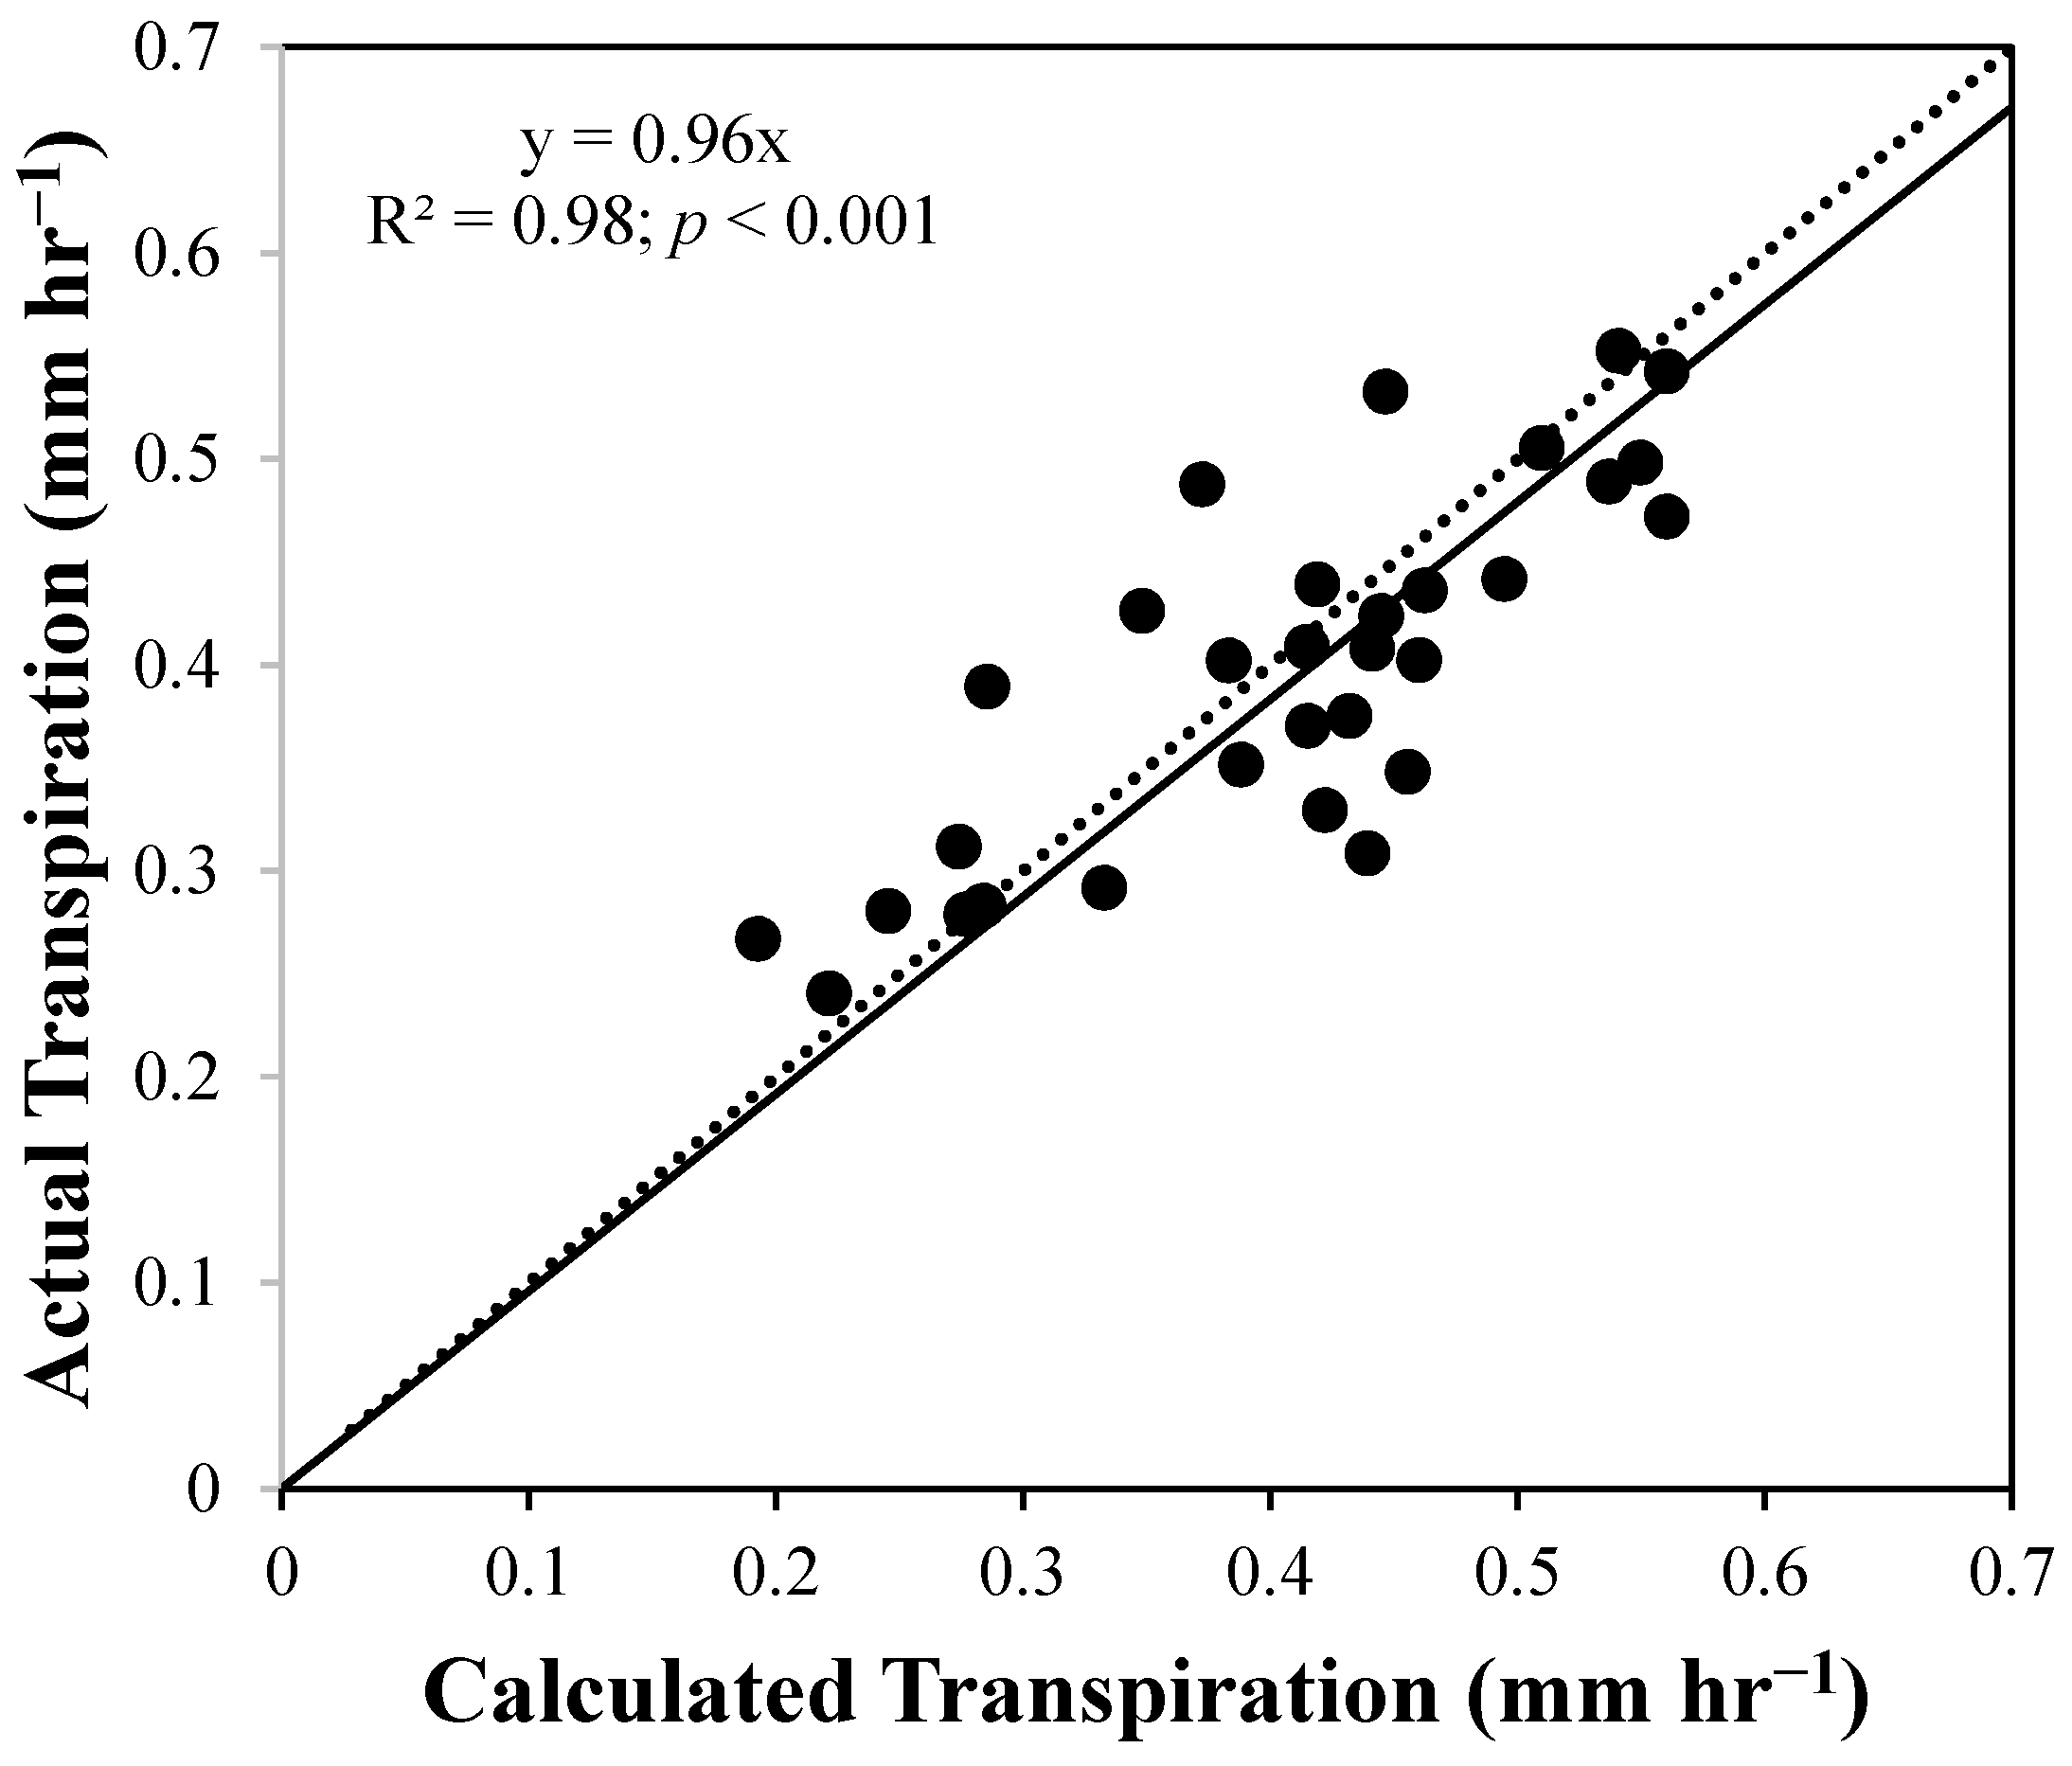
For LAI < 3, the modelled and actual transpiration agreed very closely, but for LAI > 3 the modelled value exceeds that inferred from the water level measurements (Figure 6). The level of agreement between actual and modelled transpiration does not show any dependency on the value of transpiration itself (Figure 7), rather it appears to be an LAI-driven phenomenon. The discrepancy at higher LAI suggests that the model does not fully account for water vapour retention inside the canopy (and hence the restrictive effect on transpiration) at the higher LAIs. This model prediction was obtained assuming that the effective wind velocity above the canopy was zero, as confirmed using an anemometer. It is plausible that there was some airflow over the canopies (given the forced air ventilation) and it was observed that the model is highly sensitive to airflow. Indeed, introducing an airflow velocity at the plant canopies of 0.05 m s-1 (which mimics the bulk airflow in the centre of the greenhouse bay resulting from the ventilation), yielded a net increase in modelled transpiration of 20%.
Other model assumptions may also be important. The fAPAR was used to account the net energy absorption by the canopy, which may not accurately represent absorption in the near-infrared band and could a reason for the model discrepancy. The overestimation of transpiration particularly at higher LAI could be due to the inability to neatly divide the canopy into two, unrelated and non-interacting layers. Single point measurement of relevant variables for each layer could not be expected to equally represent a physically deeper layer at higher LAI, as for a thinner layer at low LAI. Moreover, at high LAI (40 d after sowing), the tips of some of the upper canopy leaves had become senescent and inactive and hence the sunlit layer could also reach a saturation limit of transpiration relative to incident energy; both of which contribute to the overestimation of transpiration. This could, in future work, be mitigated by developing a model that accounts for more layers in the canopy, as discussed by [10]. For this specific canopy structure, scaling up stomatal conductance firstly up to leaf level and then plant level could perhaps prove much more useful. There are some other developmental and physiological aspects like the variation in age of the plants having same or different LAI values while measurement was done, which were not incorporated into the model, which could be another underlying reason for model inaccuracy.
Another reason could be because the Penman–Monteith equation was not originally developed for greenhouse conditions. It has been shown by Prenger [34] that use of the original Penman–Monteith equation in greenhouse environments can produce a small overestimation of evapotranspiration, however, it still generates better results than that of other models specifically developed for use in greenhouses [31].
Notwithstanding the limitations discussed above, Figure 6 provides interesting insights into the relative contributions of the sunlit and shaded fractions of the plant canopies. At early stages of canopy development, when the LAI is near 1, the total transpiration is mostly (approx. 80%) contributed by the sunlit layer. At an LAI closer to 3, the proportion of sunlit and shaded LAI became approximately equal, but the contribution from the sunlit layer is still double that of the shaded layer. Usually the upper canopy, or sunlit layer, can be expected to experience a higher effective vapour pressure deficit, higher canopy conductance and lower aerodynamic resistance (as found in this experiment) which would see the sunlit layer contribute more to the overall transpiration [50,51]. Therefore, despite the fact that the proportion of the shaded layer surpasses that of the sunlit layer at higher LAIs, the contribution to transpiration from the shaded layer never reaches that of the sunlit layer.
5. Conclusions
A canopy transpiration model, segmented into sunlit and shaded portions, was developed to scale up single leaf conductance measurements to derive whole-of canopy estimates of transpiration as a function of LAI for tall fescue, a widely-grown grassland pasture species. Accurate estimation of transpiration was derived from water depletion measurements in tubs and the model canopy parameters were provided by detailed measurements of stomatal conductance, PAR, fAPAR and canopy LAI. Model-derived values of transpiration were found to agree to within 20% of the measured values. At higher LAI (>3), however, the model overestimated the measured values, and this was attributed to failure of the model to account for microclimate effects within the higher LAI canopy. The model was developed in a greenhouse environment with little modification of the original Penman–Monteith equation which can also be used understand how LAI controls the transpiration under field conditions.
Author Contributions
Conceptualization, M.S.A. and D.W.L.; methodology, M.S.A.; formal analysis, M.S.A. and N.W.M.W.; investigation, M.S.A. and N.W.M.W.; resources, M.S.A., D.W.L. and N.W.M.W.; data curation, M.S.A.; writing—original draft preparation, M.S.A.; writing—review and editing, D.W.L. and N.W.M.W.; supervision, D.W.L. and N.W.M.W.; funding acquisition, M.S.A. and D.W.L. All authors have read and agreed to the published version of the manuscript.
Funding
This research received no external funding.
Institutional Review Board Statement
Not applicable.
Informed Consent Statement
Not applicable.
Data Availability Statement
Data available in the publicly accessible University of New England research data repository (Doctoral Thesis-2019, Muhammad Shahinur Alam) that does not issue DOIs. Data can be requested through: https://rune.une.edu.au/web/.
Acknowledgments
The authors wish to acknowledge the technical assistance of Derek Schneider in preparation and instrumentation of the experimental setup. One of us (MSA) wish to acknowledge receipt of a Strategic International Postgraduate Research Scholarship from the University of New England, Australia and the support from Sher-e-Bangla Agricultural University through study leave. DL would like to acknowledge the support of Food Agility CRC Ltd., a Cooperative Research Centre funded under the Commonwealth Government CRC Program. The CRC Program supports industry-led collaborations between industry, researchers, and the community.
Conflicts of Interest
The authors declare no conflict of interest.
References
- Pieruschka, R.; Huber, G.; Berry, J.A. Control of transpiration by radiation. Proc. Natl. Acad. Sci. USA 2010, 107, 13372–13377. [Google Scholar] [CrossRef] [Green Version]
- Schlesinger, W.H.; Jasechko, S. Transpiration in the global water cycle. Agric. For. Meteorol. 2014, 189, 115–117. [Google Scholar] [CrossRef]
- Jarvis, P.; McNaughton, K. Stomatal Control of Transpiration: Scaling Up from Leaf to Region. In Advances in Ecological Research; Elsevier BV: Amsterdam, The Netherlands, 1986; Volume 15, pp. 1–49. [Google Scholar]
- Penman, H.L. Natural evaporation from open water, bare soil and grass. Proc. R. Soc. London. Ser. A Math. Phys. Sci. 1948, 193, 120–145. [Google Scholar] [CrossRef] [Green Version]
- Priestley, C.H.B.; Taylor, R. On the assessment of surface heat flux and evaporation using large-scale parameters. Mon. Weather Rev. 1972, 100, 81–92. [Google Scholar] [CrossRef]
- Kool, D.; Agam, N.; Lazarovitch, N.; Heitman, J.; Sauer, T.; Bengal, A. A review of approaches for evapotranspiration partitioning. Agric. For. Meteorol. 2014, 184, 56–70. [Google Scholar] [CrossRef]
- Ding, R.; Kang, S.; Du, T.; Hao, X.; Zhang, Y. Scaling Up Stomatal Conductance from Leaf to Canopy Using a Dual-Leaf Model for Estimating Crop Evapotranspiration. PLOS ONE 2014, 9, e95584. [Google Scholar] [CrossRef] [Green Version]
- Dai, Y.; Dickinson, R.E.; Wang, Y.-P. A Two-Big-Leaf Model for Canopy Temperature, Photosynthesis, and Stomatal Conductance. J. Clim. 2004, 17, 2281–2299. [Google Scholar] [CrossRef]
- Gao, Q.; Zhao, P.; Zeng, X.; Cai, X.; Shen, W. A model of stomatal conductance to quantify the relationship between leaf transpiration, microclimate and soil water stress. Plant Cell Environ. 2002, 25, 1373–1381. [Google Scholar] [CrossRef]
- Shuttleworth, W.J. Putting the “vap” into evaporation. Hydrol. Earth Syst. Sci. 2007, 11, 210–244. [Google Scholar] [CrossRef] [Green Version]
- Shuttleworth, W.J.; Wallace, J. Evaporation from sparse crops-an energy combination theory. Q. J. R. Meteorol. Soc. 1985, 111, 839–855. [Google Scholar] [CrossRef]
- Villalobos, F.J.; Testi, L.; Orgaz, F.; García-Tejera, O.; Lopez-Bernal, A.; González-Dugo, M.V.; Ballester-Lurbe, C.; Castel, J.R.; Alarcón-Cabañero, J.J.; Nicolás-Nicolás, E.; et al. Modelling canopy conductance and transpiration of fruit trees in Mediterranean areas: A simplified approach. Agric. For. Meteorol. 2013, 171–172, 93–103. [Google Scholar] [CrossRef]
- Infante, J.; Rambal, S.; Joffre, R. Modelling transpiration in holm-oak savannah: Scaling up from the leaf to the tree scale. Agric. For. Meteorol. 1997, 87, 273–289. [Google Scholar] [CrossRef]
- Xu, S.; Yu, Z.; Zhang, K.; Ji, X.; Yang, C.; Sudicky, E.A. Simulating canopy conductance of the Haloxylon ammodendron shrubland in an arid inland river basin of northwest China. Agric. For. Meteorol. 2018, 249, 22–34. [Google Scholar] [CrossRef]
- García-Santos, G.; Bruijnzeel, L.; Dolman, A.J. Modelling canopy conductance under wet and dry conditions in a subtropical cloud forest. Agric. For. Meteorol. 2009, 149, 1565–1572. [Google Scholar] [CrossRef]
- Brisson, N.; Itier, B.; L’Hotel, J.C.; Lorendeau, J.Y. Parameterisation of the Shuttleworth-Wallace model to estimate daily maximum transpiration for use in crop models. Ecol. Model. 1998, 107, 159–169. [Google Scholar] [CrossRef]
- Li, X.; Yang, P.; Ren, S.; Li, Y.; Liu, H.; Du, J.; Li, P.; Wang, C.; Ren, L. Modeling cherry orchard evapotranspiration based on an improved dual-source model. Agric. Water Manag. 2010, 98, 12–18. [Google Scholar] [CrossRef]
- Irmak, S.; Mutiibwa, D.; Irmak, A.; Arkebauer, T.; Weiss, A.; Martin, D.; Eisenhauer, D. On the scaling up leaf stomatal resistance to canopy resistance using photosynthetic photon flux density. Agric. For. Meteorol. 2008, 148, 1034–1044. [Google Scholar] [CrossRef]
- Campbell, G.S.; Norman, J.M. An Introduction to Environmental Biophysics; Springer Nature: Berlin/Heidelberg, Germany, 1998. [Google Scholar]
- Zhang, B.; Liu, Y.; Xu, D.; Cai, J.; Li, F. Evapotranspiraton estimation based on scaling up from leaf stomatal conductance to canopy conductance. Agric. For. Meteorol. 2011, 151, 1086–1095. [Google Scholar] [CrossRef]
- Idso, S.B.; Reginato, R.J.; Jackson, R.D.; Kimball, B.A.; Nakayama, F.S. The three stages of drying of a field soil. Soil Sci. Soc. Am. J. 1974, 38, 831–837. [Google Scholar] [CrossRef]
- Allen, R.G.; Pereira, L.S.; Smith, M.; Raes, D.; Wright, J.L. FAO-56 Dual Crop Coefficient Method for Estimating Evaporation from Soil and Application Extensions. J. Irrig. Drain. Eng. 2005, 131, 2–13. [Google Scholar] [CrossRef] [Green Version]
- Zotarelli, L.; Dukes, M.; Morgan, K. Interpretation of Soil Moisture Content to Determine soil Field Capacity and Avoid Over-Irrigating Sandy Soils Using Soil Moisture Sensors; University of Florida Cooperation Extension Services: Gainesville, FL, USA, 2010. [Google Scholar]
- Alam, M.S.; Lamb, D.W.; Rahman, M.M. In-situ partitioning of evaporation and transpiration components using a portable evapotranspiration dome—A case study in Tall Fescue (Festuca arundinacea). Agric. Water Manag. 2019, 213, 352–357. [Google Scholar] [CrossRef]
- Alam, M.S.; Lamb, D.W.; Rahman, M.M. A refined method for rapidly determining the relationship between canopy NDVI and the pasture evapotranspiration coefficient. Comput. Electron. Agric. 2018, 147, 12–17. [Google Scholar] [CrossRef]
- Er-Raki, S.; Chehbouni, A.; Boulet, G.; Williams, D.G.A. Using the dual approach of FAO-56 for partitioning ET into soil and plant components for olive orchards in a semi-arid region. Agric. Water Manag. 2010, 97, 1769–1778. [Google Scholar] [CrossRef] [Green Version]
- Al-Kaisi, M.; Brun, L.J.; Enz, J.W. Transpiration and evapotranspiration from maize as related to leaf area index. Agric. For. Meteorol. 1989, 48, 111–116. [Google Scholar] [CrossRef]
- Monteith, J.L. Evaporation and environment. Symp. Soc. Exp. Biol. 1965, 19, 205–234. [Google Scholar]
- Eensalu, E.; Kupper, P.; Sellin, A.; Rahi, M.; Sõber, A.; Kull, O.; Kaurilind, E. Do stomata operate at the same relative opening range along a canopy profile of Betula pendula? Funct. Plant Biol. 2008, 35, 103–110. [Google Scholar] [CrossRef]
- Allen, R.G.; Pereira, L.S.; Raes, D.; Smith, M. Crop Evapotranspiration-Guidelines for Computing Crop Water Requirements-FAO Irrigation and Drainage; Paper 56; FAO: Rome, Italy, 1998; Volume 300, p. D05109. [Google Scholar]
- Rothfuss, Y.; Biron, P.; Braud, I.; Canale, L.; Durand, J.-L.; Gaudet, J.-P.; Richard, P.; Vauclin, M.; Bariac, T. Partitioning evapotranspiration fluxes into soil evaporation and plant transpiration using water stable isotopes under controlled conditions. Hydrol. Process. 2010, 24, 3177–3194. [Google Scholar] [CrossRef]
- Katsoulas, N.; Stanghellini, C. Modelling Crop Transpiration in Greenhouses: Different Models for Different Applications. Agronomy 2019, 9, 392. [Google Scholar] [CrossRef] [Green Version]
- Stanghellini, C. Transpiration of greenhouse crops: An aid to climate management. Ph.D. Thesis, The Institute of Agricultural Engineering (IMAG), Wageningen, The Netherlands, 1987. [Google Scholar]
- Prenger, J.J.; Fynn, R.P.; Hansen, R.C. A comparison of four evapotranspiration models in a greenhouse environment. Trans. ASAE 2002, 45, 1779. [Google Scholar] [CrossRef]
- Fynn, R.P.; Al-Shooshan, A.; Short, T.H.; McMahon, R.W. Evapotranspiration measurement and modeling for a potted Chrysanthemum crop. Trans. ASAE 1993, 36, 1907–1913. [Google Scholar] [CrossRef]
- Nilson, T. A theoretical analysis of the frequency of gaps in plant stands. Agric. Meteorol. 1971, 8, 25–38. [Google Scholar] [CrossRef]
- Zhang, L.; LeMeur, R. Effect of aerodynamic resistance on energy balance and Penman-Monteith estimates of evapotranspiration in greenhouse conditions. Agric. For. Meteorol. 1992, 58, 209–228. [Google Scholar] [CrossRef]
- Thimijan, R.W.; Heins, R.D. Photometric, radiometric, and quantum light units of measure: A review of procedures for interconversion. HortScience 1983, 18, 818–822. [Google Scholar]
- Delgado-Bonal, A. Entropy of radiation: The unseen side of light. Sci. Rep. 2017, 7, 1642. [Google Scholar] [CrossRef] [Green Version]
- Lu, Y.; Ma, D.; Chen, X.; Zhang, J. A simple method for estimating field crop evapotranspiration from pot experiments. Water 2018, 10, 1823. [Google Scholar] [CrossRef] [Green Version]
- Hagishima, A.; Narita, K.-I.; Tanimoto, J. Field experiment on transpiration from isolated urban plants. Hydrol. Process. 2007, 21, 1217–1222. [Google Scholar] [CrossRef]
- Bell, M. Guide to soil measurements for agronomic and physiological research in small grain cereals. Wheat Spec. Rep. 1993, 18, 40. [Google Scholar]
- Rahman, M.M.; Stanley, J.N.; Lamb, D.W.; Trotter, M.G. Methodology for measuring fAPAR in crops using a combination of active optical and linear irradiance sensors: A case study in Triticale (X Triticosecale Wittmack). Precis. Agric. 2014, 15, 532–542. [Google Scholar] [CrossRef]
- Rahman, M.; Lamb, D.W.; Stanley, J. The impact of solar illumination angle when using active optical sensing of NDVI to infer fAPAR in a pasture canopy. Agric. For. Meteorol. 2015, 202, 39–43. [Google Scholar] [CrossRef]
- Bragg, T.; Webb, N.; Spencer, R.; Wood, J.; Nicholl, C.; Potter, E. User Manual for the Porometer type AP4. Document Code: AP4-UM-3; Delta-T Devices Ltd.: Cambridge, UK, 2004; Volume 4, p. 197. Available online: https://www.delta-t.co.uk/wp-content/uploads/2020/03/AP4-Porometer-User-Manual-A5-v4.pdf (accessed on 2 October 2019).
- Lantinga, E.A.; Nassiri, M.; Kropff, M.J. Modelling and measuring vertical light absorption within grass–clover mixtures. Agric. For. Meteorol. 1999, 96, 71–83. [Google Scholar] [CrossRef]
- Zhang, L.; Hu, Z.; Fan, J.; Zhou, D.; Tang, F. A meta-analysis of the canopy light extinction coefficient in terrestrial ecosystems. Front. Earth Sci. 2014, 8, 599–609. [Google Scholar] [CrossRef]
- Pachepsky, L.; Lu, Z.; Reddy, V. Analysis of abaxial and adaxial stomatal regulation in leaves of Pima cotton (Gossypium barbadense L.) using the 2DLEAF, two-dimensional model of leaf gas exchange. Biotronics 2000, 29, 79–95. [Google Scholar]
- Duchemin, B.; Hadria, R.; Er-Raki, S.; Boulet, G.; Maisongrande, P.; Chehbouni, A.; Escadafal, R.; Ezzahar, J.; Hoedjes, J.; Kharrou, M.; et al. Monitoring wheat phenology and irrigation in Central Morocco: On the use of relationships between evapotranspiration, crops coefficients, leaf area index and remotely-sensed vegetation indices. Agric. Water Manag. 2006, 79, 1–27. [Google Scholar] [CrossRef]
- Will, R.E.; Wilson, S.M.; Zou, C.B.; Hennessey, T.C. Increased vapor pressure deficit due to higher temperature leads to greater transpiration and faster mortality during drought for tree seedlings common to the forest-grassland ecotone. New Phytol. 2013, 200, 366–374. [Google Scholar] [CrossRef]
- Whitehead, D.; Sheriff, D.; Greer, D. The relationship between stomatal conductance, transpiration rate and tracheid structure in Pinus radiata clones grown at different water vapour saturation deficits. Plant Cell Environ. 1983, 6, 703–710. [Google Scholar]
Figure 1.
Schematic representation of the canopy structure for tall fescue (Festuca arundinacea var. Demeter) and the relevant parameters. The proportion of each layer can be theoretically calculated in terms of leaf area index LAI and varies with canopy LAI.
Figure 1.
Schematic representation of the canopy structure for tall fescue (Festuca arundinacea var. Demeter) and the relevant parameters. The proportion of each layer can be theoretically calculated in terms of leaf area index LAI and varies with canopy LAI.

Figure 2.
Schematic diagram of the plant growth tubs.

Figure 3.
Quadratic relationship between fAPAR and canopy LAI at θ = 25°.

Figure 4.
Fraction of sunlit (open circles) and shaded (closed circles) components of LAI as a function of canopy LAI.
Figure 4.
Fraction of sunlit (open circles) and shaded (closed circles) components of LAI as a function of canopy LAI.

Figure 5.
Measured canopy conductance, gc (mm s−1) of adaxial (△, dotted trend line) and abaxial (▲, dashed trend line) leaf surfaces, and net canopy conductance (■, solid trend line) as a function of canopy LAI.
Figure 5.
Measured canopy conductance, gc (mm s−1) of adaxial (△, dotted trend line) and abaxial (▲, dashed trend line) leaf surfaces, and net canopy conductance (■, solid trend line) as a function of canopy LAI.

Figure 6.
Measured (■, dotted line), predicted total transpiration (□, solid line), sunlit transpiration (○, long dashed line) and shaded transpiration (●, short dashed line) for the canopy layers and overall canopy with LAI. All trend curves are significant polynomial fits (p < 0.001).
Figure 6.
Measured (■, dotted line), predicted total transpiration (□, solid line), sunlit transpiration (○, long dashed line) and shaded transpiration (●, short dashed line) for the canopy layers and overall canopy with LAI. All trend curves are significant polynomial fits (p < 0.001).

Figure 7.
Relationship between actual and calculated transpiration (mm h−1). The dotted line represents 1:1 equivalence and solid line is the fitted linear equation.
Figure 7.
Relationship between actual and calculated transpiration (mm h−1). The dotted line represents 1:1 equivalence and solid line is the fitted linear equation.

Publisher’s Note: MDPI stays neutral with regard to jurisdictional claims in published maps and institutional affiliations. |
© 2021 by the authors. Licensee MDPI, Basel, Switzerland. This article is an open access article distributed under the terms and conditions of the Creative Commons Attribution (CC BY) license (http://creativecommons.org/licenses/by/4.0/).
Share and Cite
MDPI and ACS Style
Alam, M.S.; Lamb, D.W.; Warwick, N.W.M. A Canopy Transpiration Model Based on Scaling Up Stomatal Conductance and Radiation Interception as Affected by Leaf Area Index. Water 2021, 13, 252. https://doi.org/10.3390/w13030252
AMA Style
Alam MS, Lamb DW, Warwick NWM. A Canopy Transpiration Model Based on Scaling Up Stomatal Conductance and Radiation Interception as Affected by Leaf Area Index. Water. 2021; 13(3):252. https://doi.org/10.3390/w13030252
Chicago/Turabian StyleAlam, Muhammad Shahinur, David William Lamb, and Nigel W. M. Warwick. 2021. "A Canopy Transpiration Model Based on Scaling Up Stomatal Conductance and Radiation Interception as Affected by Leaf Area Index" Water 13, no. 3: 252. https://doi.org/10.3390/w13030252
Note that from the first issue of 2016, this journal uses article numbers instead of page numbers. See further details here.