Increase in Daily Household Water Demand during the First Wave of the Covid-19 Pandemic in Germany


1
ISOE—Institute for Social-Ecological Research, 60486 Frankfurt, Germany
2
WBV—Wasserbeschaffungsverband Harburg, 21218 Seevetal, Germany
*
Author to whom correspondence should be addressed.
Water 2021, 13(3), 260; https://doi.org/10.3390/w13030260
Submission received: 18 December 2020
/
Revised: 11 January 2021
/
Accepted: 18 January 2021
/
Published: 21 January 2021
(This article belongs to the Section Water Use and Scarcity)
Abstract
:Precautionary measures and governmental regulations during the COVID-19 pandemic’s first wave have drastically altered daily activities and hence water consumption patterns. Many people had to change their working routines, the organization of childcare and hygiene practices. While first evidence appears on the impacts of COVID-19 on, e.g., carbon emissions, energy demand and water treatment, even indicating an unexpected increase in water consumption during that period, no study has investigated the pandemic’s sole and in-depth implications for water supply so far. This paper investigates hourly and daily water consumption volumes of a utility in northern Germany for the first wave of the pandemic. We performed a linear mixed model to compare the 2020 daily water consumption volumes with previous years. We eliminated the effects of climate using Bayesian statistic in order to carve out and estimate the original COVID-19 effect. We also compared hourly water consumption of similar time periods and calculated the percentage difference between 2020 and the two previous years. Our results reveal about 14.3% (3 968 m3) higher residential water consumption per day with higher morning and evening demand peaks during the day. We hypothesis that the reasons for the increasing water demand may be found in changed behavioral routines with an important question for water utilities, if and which of these new dynamics may persist after COVID-19 and hence pose a challenge for long-term infrastructure planning.
1. Introduction
On 30 December 2019, the World Health Organisation (WHO) announced new arising cases of “pneumonia of unknown aetiology” as a “Public Health Emergency of International Concern” posing a high risk to countries with vulnerable health systems [1]. This disease was later identified and named COVID-19 and, due to its rapid spread and severity, characterized as a pandemic on 11 March 2020 [2]. In the following weeks and month, this pandemic had an unprecedented magnitude on our daily lives all over the world. In Germany for example, containment measures were implemented in order to keep the spread at bay and the German Infection Protection Act (IfSG) took effect. With travel restrictions, closed businesses and contact restrictions, many people spend their time at home. In order to further contain the rapid spread of the virus, also most of the schools and daycare centers in Germany were closed down by 16 March 2020 [3], representing the start of the first lockdown phase and eventually forcing many parents to stay at home during office hours to take over child care.
These and other consequences of the COVID-19 pandemic for society and the environment are yet to be explored. Evidence from the pandemic’s first-wave months suggests a rapid decline of carbon emissions [4], though long-term climate change mitigation effects are unlikely [5]. Likewise, localized findings on energy demand show a decline [6] while uncertainty exists as to which of the uncovered patterns may remain [7]. The water sector is also affected from the diverse impacts of induced behavioral changes. Recent studies focused on the assessment of sewage water and if residues of the corona virus could potentially be detected therein [8,9]. RNA residues were indeed found in effluent streams of several water treatment plants in Germany. The concentration of these substances could pave the way to monitor COVID-19 outbreaks in the population. Additionally, first evidence of altered water consumption patterns during COVID-19 measures was already reported, e.g., [10,11,12]. However, as to our knowledge, none of these studies balanced the effect of the COVID-19 measures with the interplay of multiple influencing factors (e.g., climatic fluctuations, population variation) affecting water consumption rates at the same time.
In Germany, access to and availability of fresh drinking water is a matter of course. Complex drinking water distribution networks provide water from the utilities to almost every household [13]. Water management aims to ensure water security for society, i.e., making water available in sufficient quantity and quality, as well as to provide access to safe sanitation. Hence, despite prevailing challenges for the transformation of the German water sector [14], overall drinking water supply is constant and regarded as reliable [13]. However, the behavioral changes induced by COVID-19 (home office, home schooling, hygiene practices, etc.) may alter the daily patterns and total amounts of water consumed locally. Against the declining trend of per capita water consumption on the household level [15], these alterations may pose a critical challenge for water utilities as new consumption dynamics might evolve. The long-term design of water distribution infrastructure could be undermined due to, e.g., unforeseen daily peak water demands or shifted consumption volumes from one utility to the next.
In this paper, we investigate the daily and hourly water consumption volumes of a region in northern Germany to make the following contributions: First, we explore the sole effect of the socioeconomic and sociocultural restrictions imposed due to the COVID-19 lockdown situation on water consumption of a whole water utility service area in a peri-urban environment. Second, we discuss potential reasons for the change in water demand. We follow the line of a recent study by Alda-Vidal et al. [16] that found specific changes in terms of household and outdoor water consumption. Based on the literature, we identified five overarching dimensions that reflect how altered practices have changed the demand during the lockdown. Further, we also highlight possible future implications for water utilities. In this regard, we hypothesize that certain water demand patterns may persist beyond the original pandemic situation due to long-term changes in consumption practices and habits, representing a sixth dimension. Subsequent to this introduction, the remainder of the paper is structured as follows: In Section 2, we describe the study area and the dataset, and we present the statistical methodologies we performed. In Section 3, we showcase our results. We discuss the aforementioned reasons in Section 4. Finally, Section 5 gives the conclusions.
2. Materials and Methods
The water demand from a drinking water network in a peri-urban area in northern Germany was used as a case study in this paper. In the following, we will briefly present (i) the service area of the water utility considered with its key socioeconomic characteristics, (ii) the data used for water demand analysis and (iii) the statistical procedures carried out to identify the water demand effects of COVID-19-induced behavioral changes.
2.1. Service Area
The service area of the Wasserbeschaffungsverband WBV Harburg is located in northern Germany, south of the Elbe river and in the metropolitan area of the city of Hamburg. Its coverage encompasses around 960 km2 (Figure 1), which is about 77% of the entire administrative district of Harburg. The service area is in turn divided into nine service zones that are provided with distinct water meters [17]. The main water sources are several underground sources (22 wells) that provide groundwater through pumping. The whole network is comprised of 1669 km of pipes supplying drinking water to 12 municipalities [18] and thereby satisfying the water demand of approximately 184,000 people [19]. Since the district is located in the metropolitan area of Hamburg, it is tightly connected to the city, economically. This is supported by the fact that 64,617 out of 82,998 employees resident in the district (78%) are outbound commuters, while another 27,431 people come in from neighboring districts on a daily basis. This results in a net negative commuters accounting balance of −37,186 people, which means that, on a regular weekday, the district’s total population is reduced by about −15% [20]. In the service area itself, about 37% of the employees work in the trade, transport and hospitality sectors, while another 21% work in the manufacturing industry. Only 2% are employed in the agricultural sector [20]. Overall, the district’s municipalities are characterized by extensive residential areas with about 81% of all residential buildings being single-family houses [20].
2.2. Data
Table 1 gives an overview of all data obtained and their respective sources. Daily and hourly water volume data were provided by the WBV Harburg for its service area from 1 January 2006 until 28 June 2020. In addition, they provided information on the number of customers within the service area on an annual basis until 2019. To account for hypothetical daily changes in the number of customers (deaths, influx or immigration, births, etc.), we approximated the number of customers for each day by assigning the annual count to June 30 of each year, respectively, and then interpolating between the years. However, since there is no information on the customer numbers for 2020, yet, we extrapolated the data and assumed that the population growth rate was the same as it was for the time between 2018 and 2019.
We obtained climate data for the region from the historic weather database of the German Meteorological Service, where we used the closest meteorological station with consistent data throughout the study period (Hamburg-Neuwiedenthal). We particularly obtained consistent daily data for precipitation, temperature, and humidity [21].
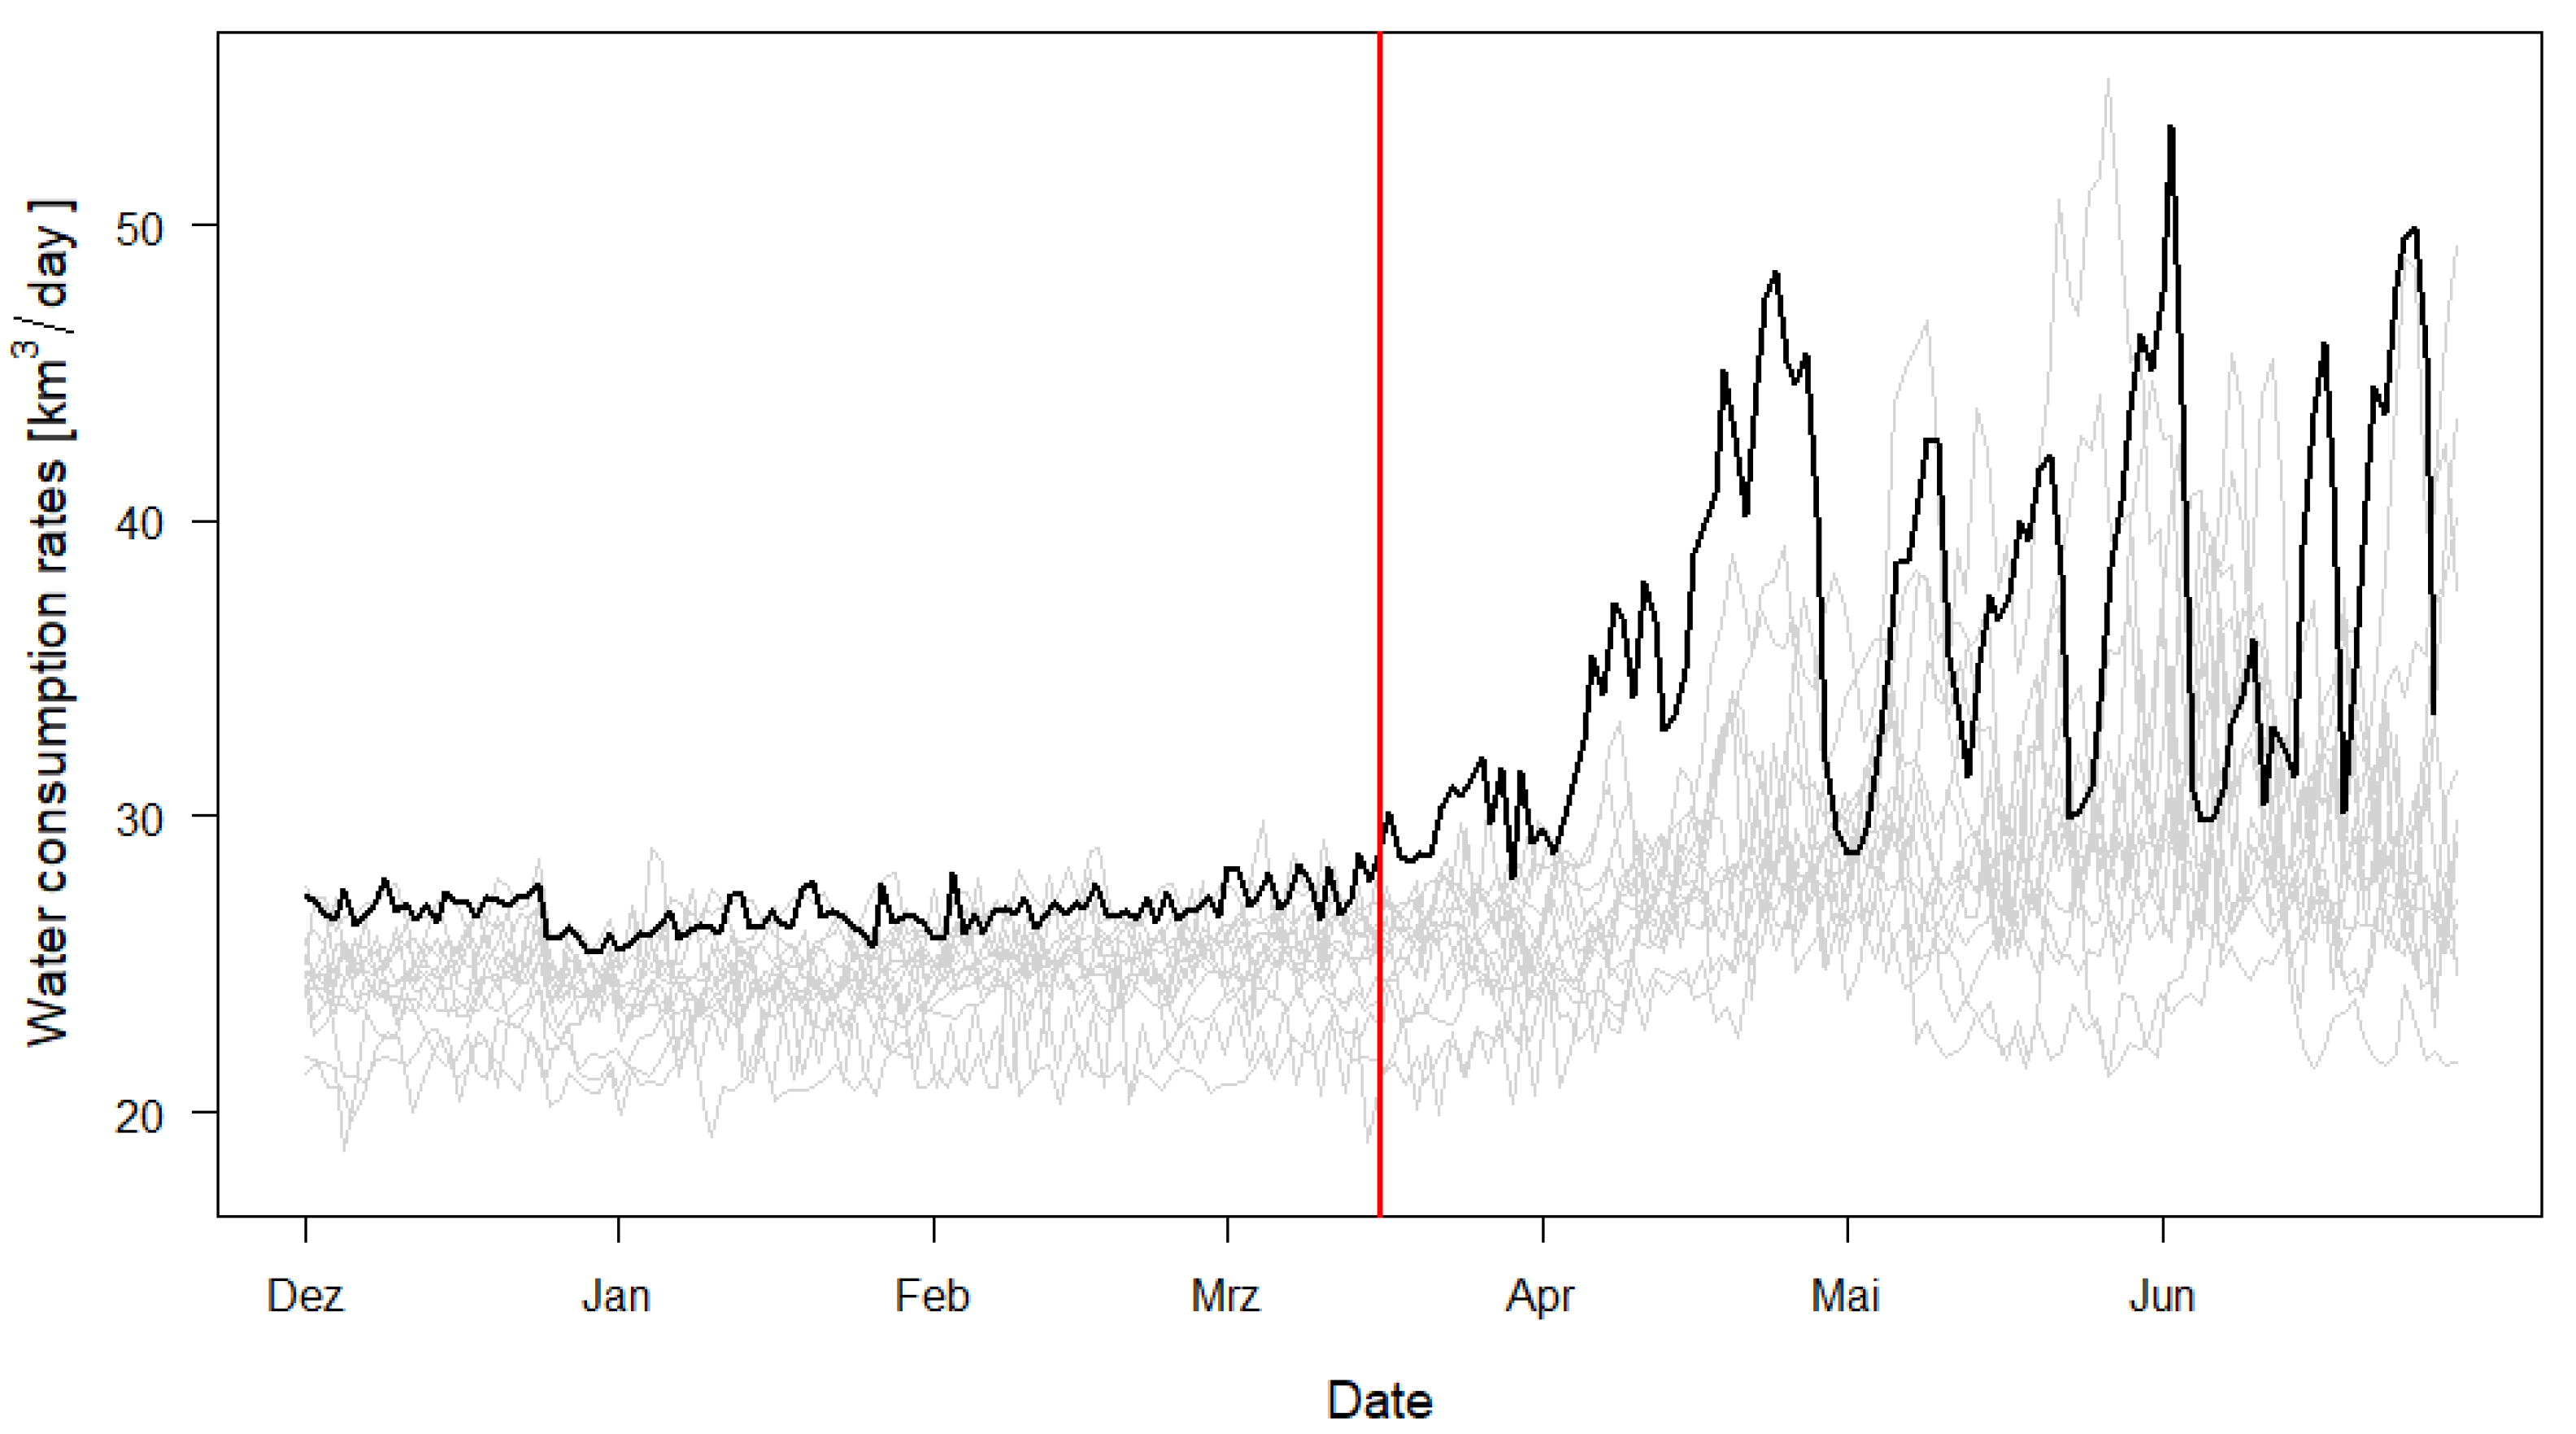
Although general recommendations for social distancing were already formulated at the end of February 2020, strict measures and contact restrictions were implemented on 16 March 2020 for the first time. With the exception of grocery stores, pharmacies and banks, all retail, cultural, sports, leisure and entertainment facilities had to close [22]. Schools and daycare centers also had to be closed down [23], forcing many parents to organize day care themselves. We assumed that this time point marked the most severe effects in terms of restrictions and we suspected that the pandemic was in the general public’s mind from that moment on. As evident from Figure 2, the onset of an increased water consumption in 2020 coincided with the implementation of strict measures and the presumed utilization of home office practices. However, daily water consumption rates are greatly variable (see Figure 2, grey lines), and the demand is affected and influenced by multiple parameters, e.g., [24,25]. Therefore, detailed analyses were necessary to distinguish the magnitude and the specific effects on water consumption rates caused by the COVID-19 measures from those caused by climatic effects.
In addition, we obtained water consumption data for each hour from two service zones for three different time periods (between 1 January and 25 June 2018 and between 25 December 2018 + 2019 and 25 June 2019 + 2020, respectively).
2.3. Statistical Analysis
In order to analyze, if the COVID-19 restrictions had an effect on the water volumes supplied by the utility company, a linear mixed model (LMM) was constructed and evaluated. We only included data of the same time periods of each year (16 March–28 June). We constructed several indicators from the data available to simulate daily water demands and validate the model results against the observed data.
In order to account for dry periods, we defined an aridity index (AridI) and counted the past days in which the AridI was true. By iteratively testing combinations of precipitation and temperature thresholds, we finally declared the AridI to be met when the daily mean temperature exceeded 25 °C (threshold for a summer day; DWD) and the precipitation was less than 1.1 mm.
For the analyses, we used population size (number of consumers), daily precipitation (mm), daily maximum temperature (°C) and its quadratic term, dry period (consecutive number of days), and humidity (%) as continuous independent variables, and the presence or absence of strict COVID-19 measures as a binary dummy variable (0; 1). We standardized all continuous variables so that their means were zero and their standard deviations one. We applied linear mixed models (LMM, R package lme4) [26] to investigate the specific impact of the changed situation during the strict measures of the pandemic. We included month and year as random factors to account for non-independent statistical observations. For a random factor, the between-group variance is estimated which is equivalent to partial pooling of the data [27].
The general form of a LMM model is specified as follows:
where y is the dependent variable; β0 … βn are the coefficients to be estimated; x1 … xn are the independent variables; n is the number of independent variables; bm is a random-effects vector for m random effects; and ε is the error term related to each observation.
In this study, we specified our model with the semi-log form as this follows a common approach in the literature, e.g., [28,29]. The semi-log linear regression model transforms the dependent variable to its logarithmic form, while the independent variables remain in their original distribution. This resulted in an approximately normal distribution of daily water consumption.
We applied Bayesian methods to obtain 95% credible intervals (CrI) of the parameter estimates and model predictions. By using 10,000 simulated random values obtained from the joint posterior distribution of the model parameter (function sim, R package arm) [30], we were able to calculate the exact uncertainty of model predictions. We concluded that a parameter had a significant effect on the response variable if the 95% CrI of its estimate did not cross zero [31]. We used R 4.0.2 for all calculations.
To determine the extent of the COVID-19 effect, we simulated the data for the absence and presence of the measures, while keeping the other parameters constant at the mean. Hence, we were able to investigate the exclusive impact of the COVID-19 measures without the effects of other parameters, such as climate or population.
In addition to the daily water consumption, we investigated the hourly consumption volumes. To compare the water consumption volumes of the time period of 2020 where strict COVID-19 measures were effective to the same time periods of the previous years, we divided the dataset into “before” and “during” Corona measures. “During” included the data beginning with 16 March until 25 June of all three years, respectively. “Before” included the data of the dates before that, respectively. Additionally, we also compared water consumption rates between weekends and weekdays (“during the week”) for the time periods “before” and “during”. As a result, we ended up with four distinct comparison groups: Bulleted lists look like this:
- “Before Corona|During the week”;
- “Before Corona|On the weekend”;
- “During Corona|During the week”;
- “During Corona|On the weekend”.
For the comparison, we calculated the percentage deviation between 2020 and 2019 as well as between 2020 and 2018 for all hours of the day for the respective time periods described before.
3. Results
3.1. Daily Water Consumption
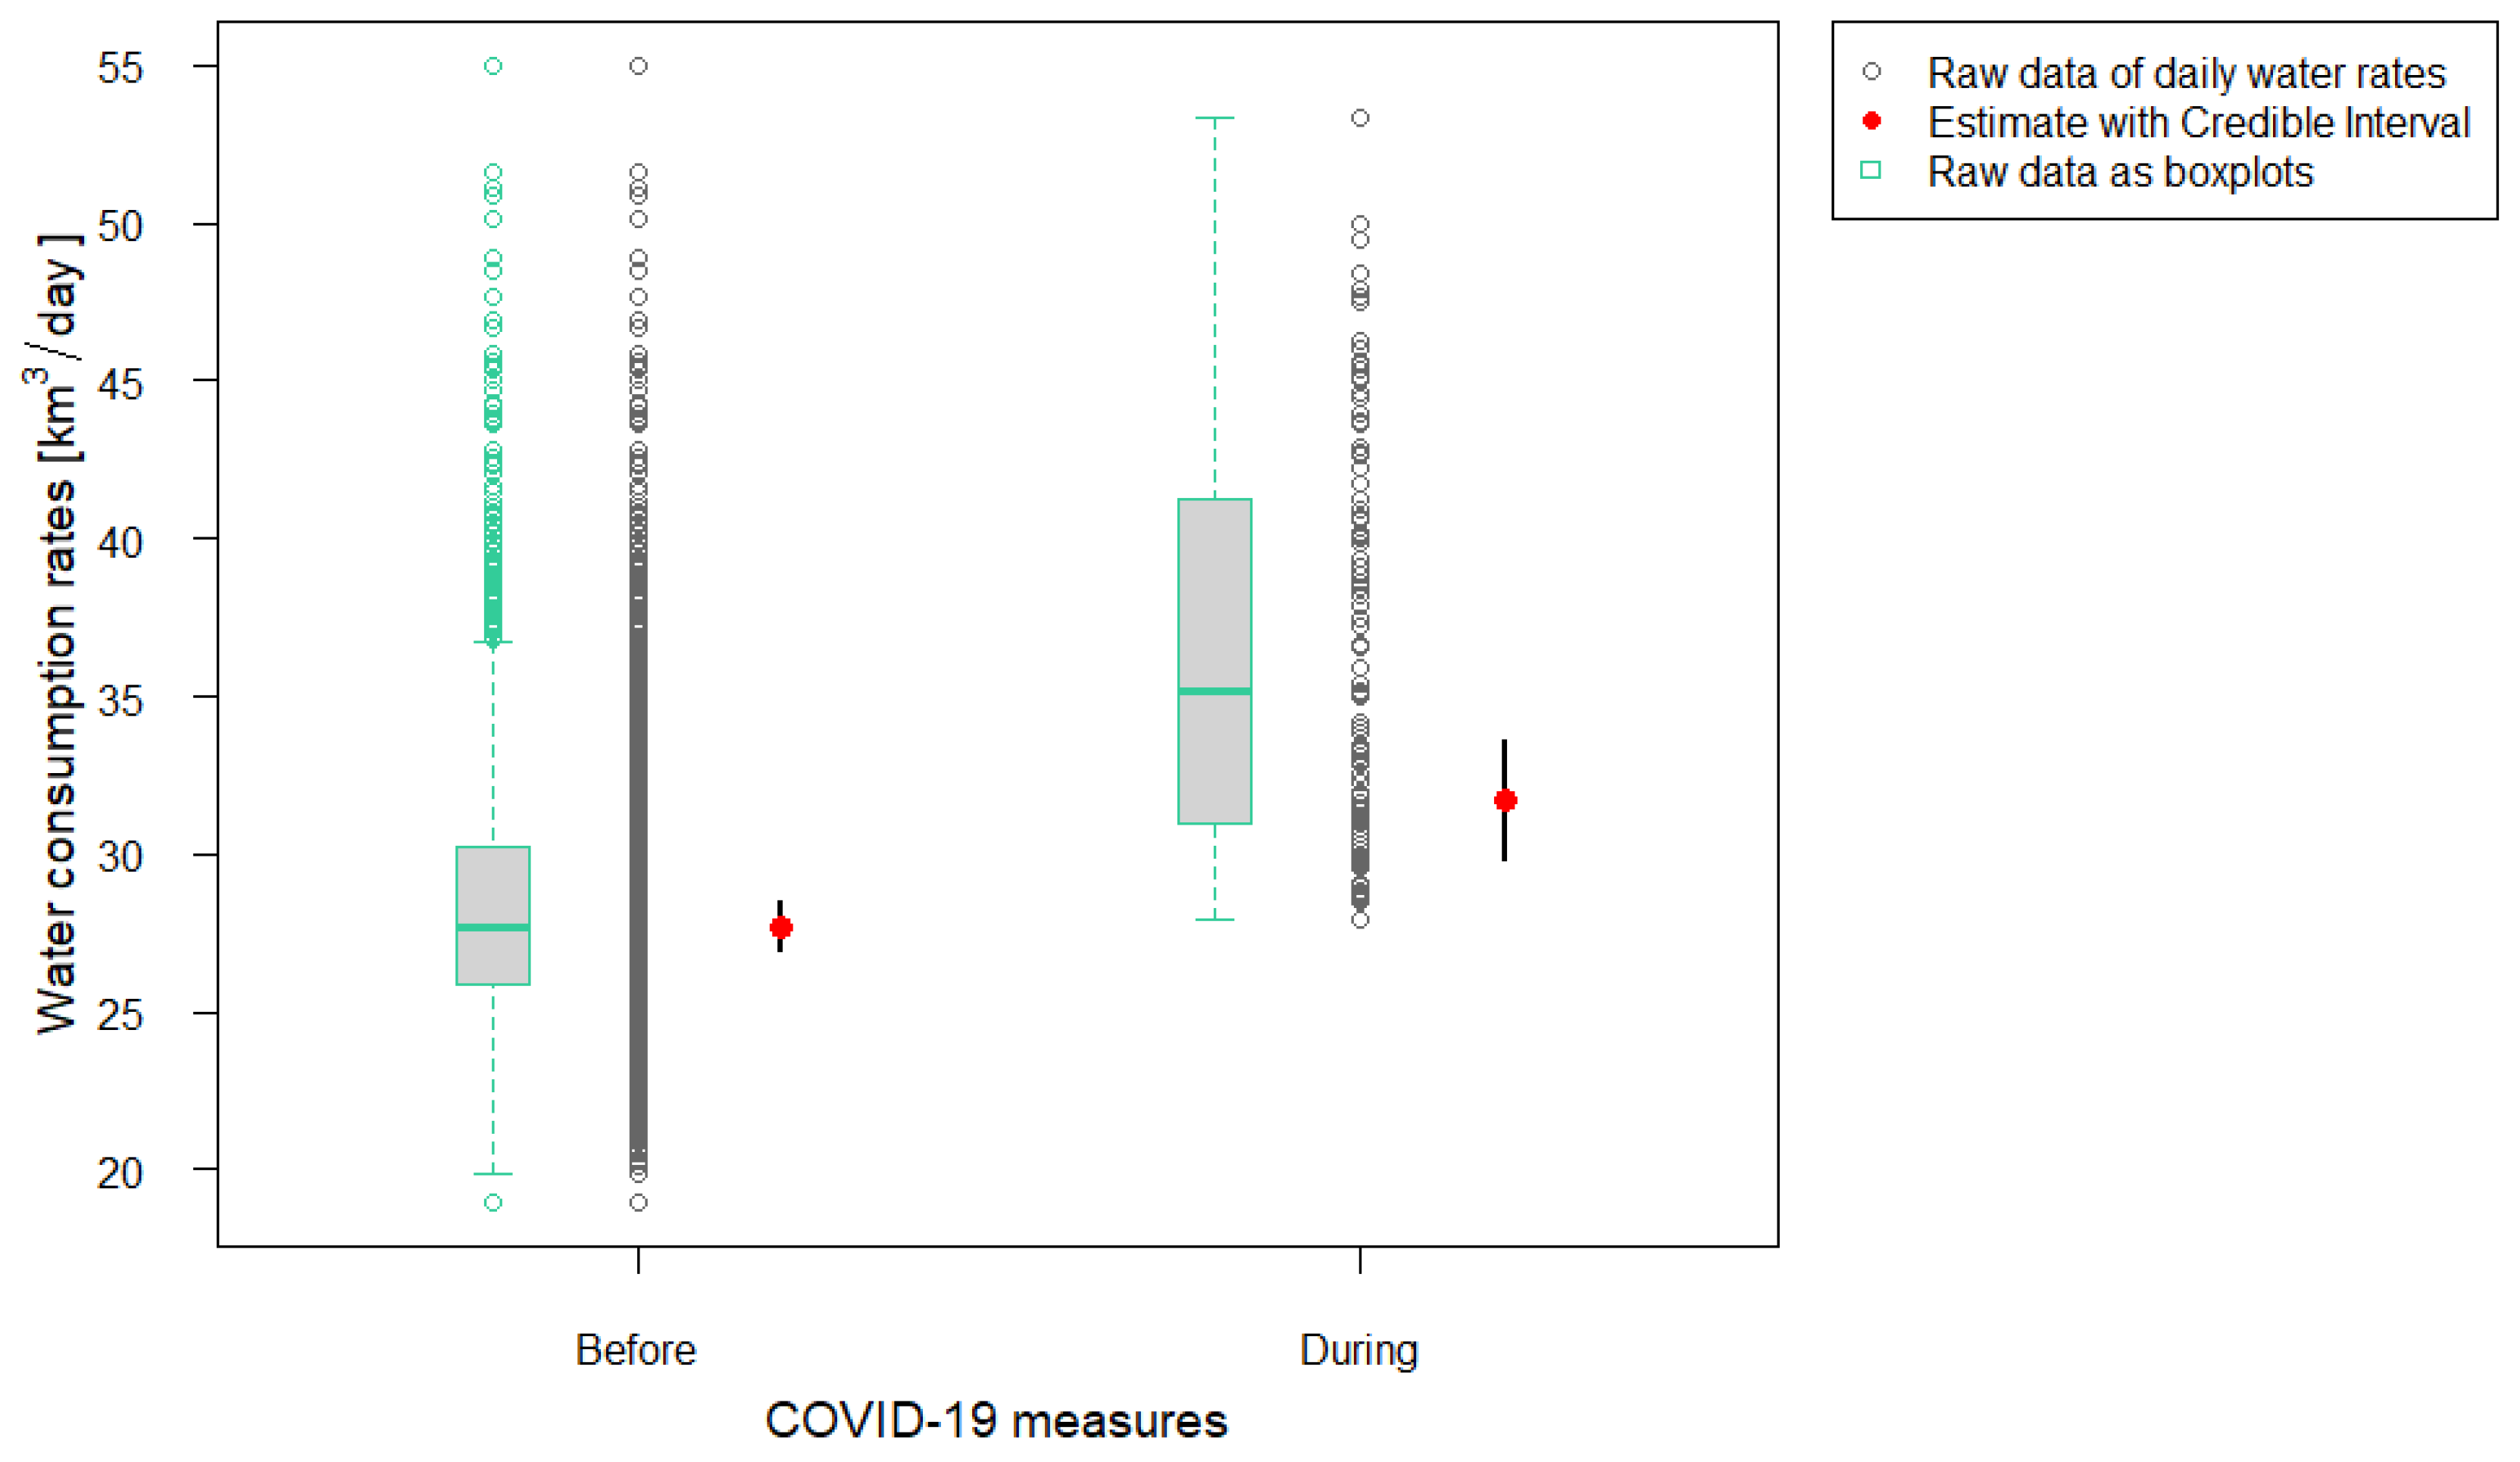
We present the results from the developed water demand model in Table 2. In general, more water was used when temperatures were higher. As opposed to this, water consumption decreased with increasing humidity. Most interestingly, however, compared to the years before, daily water consumption was about 14.3% higher, which translates to about 3968 m3, during the COVID-19 measures independent of climatic features or population size (before: 27,718.97 m3, during: 31,687.29 m3; Figure 3).
3.2. Hourly Water Consumption
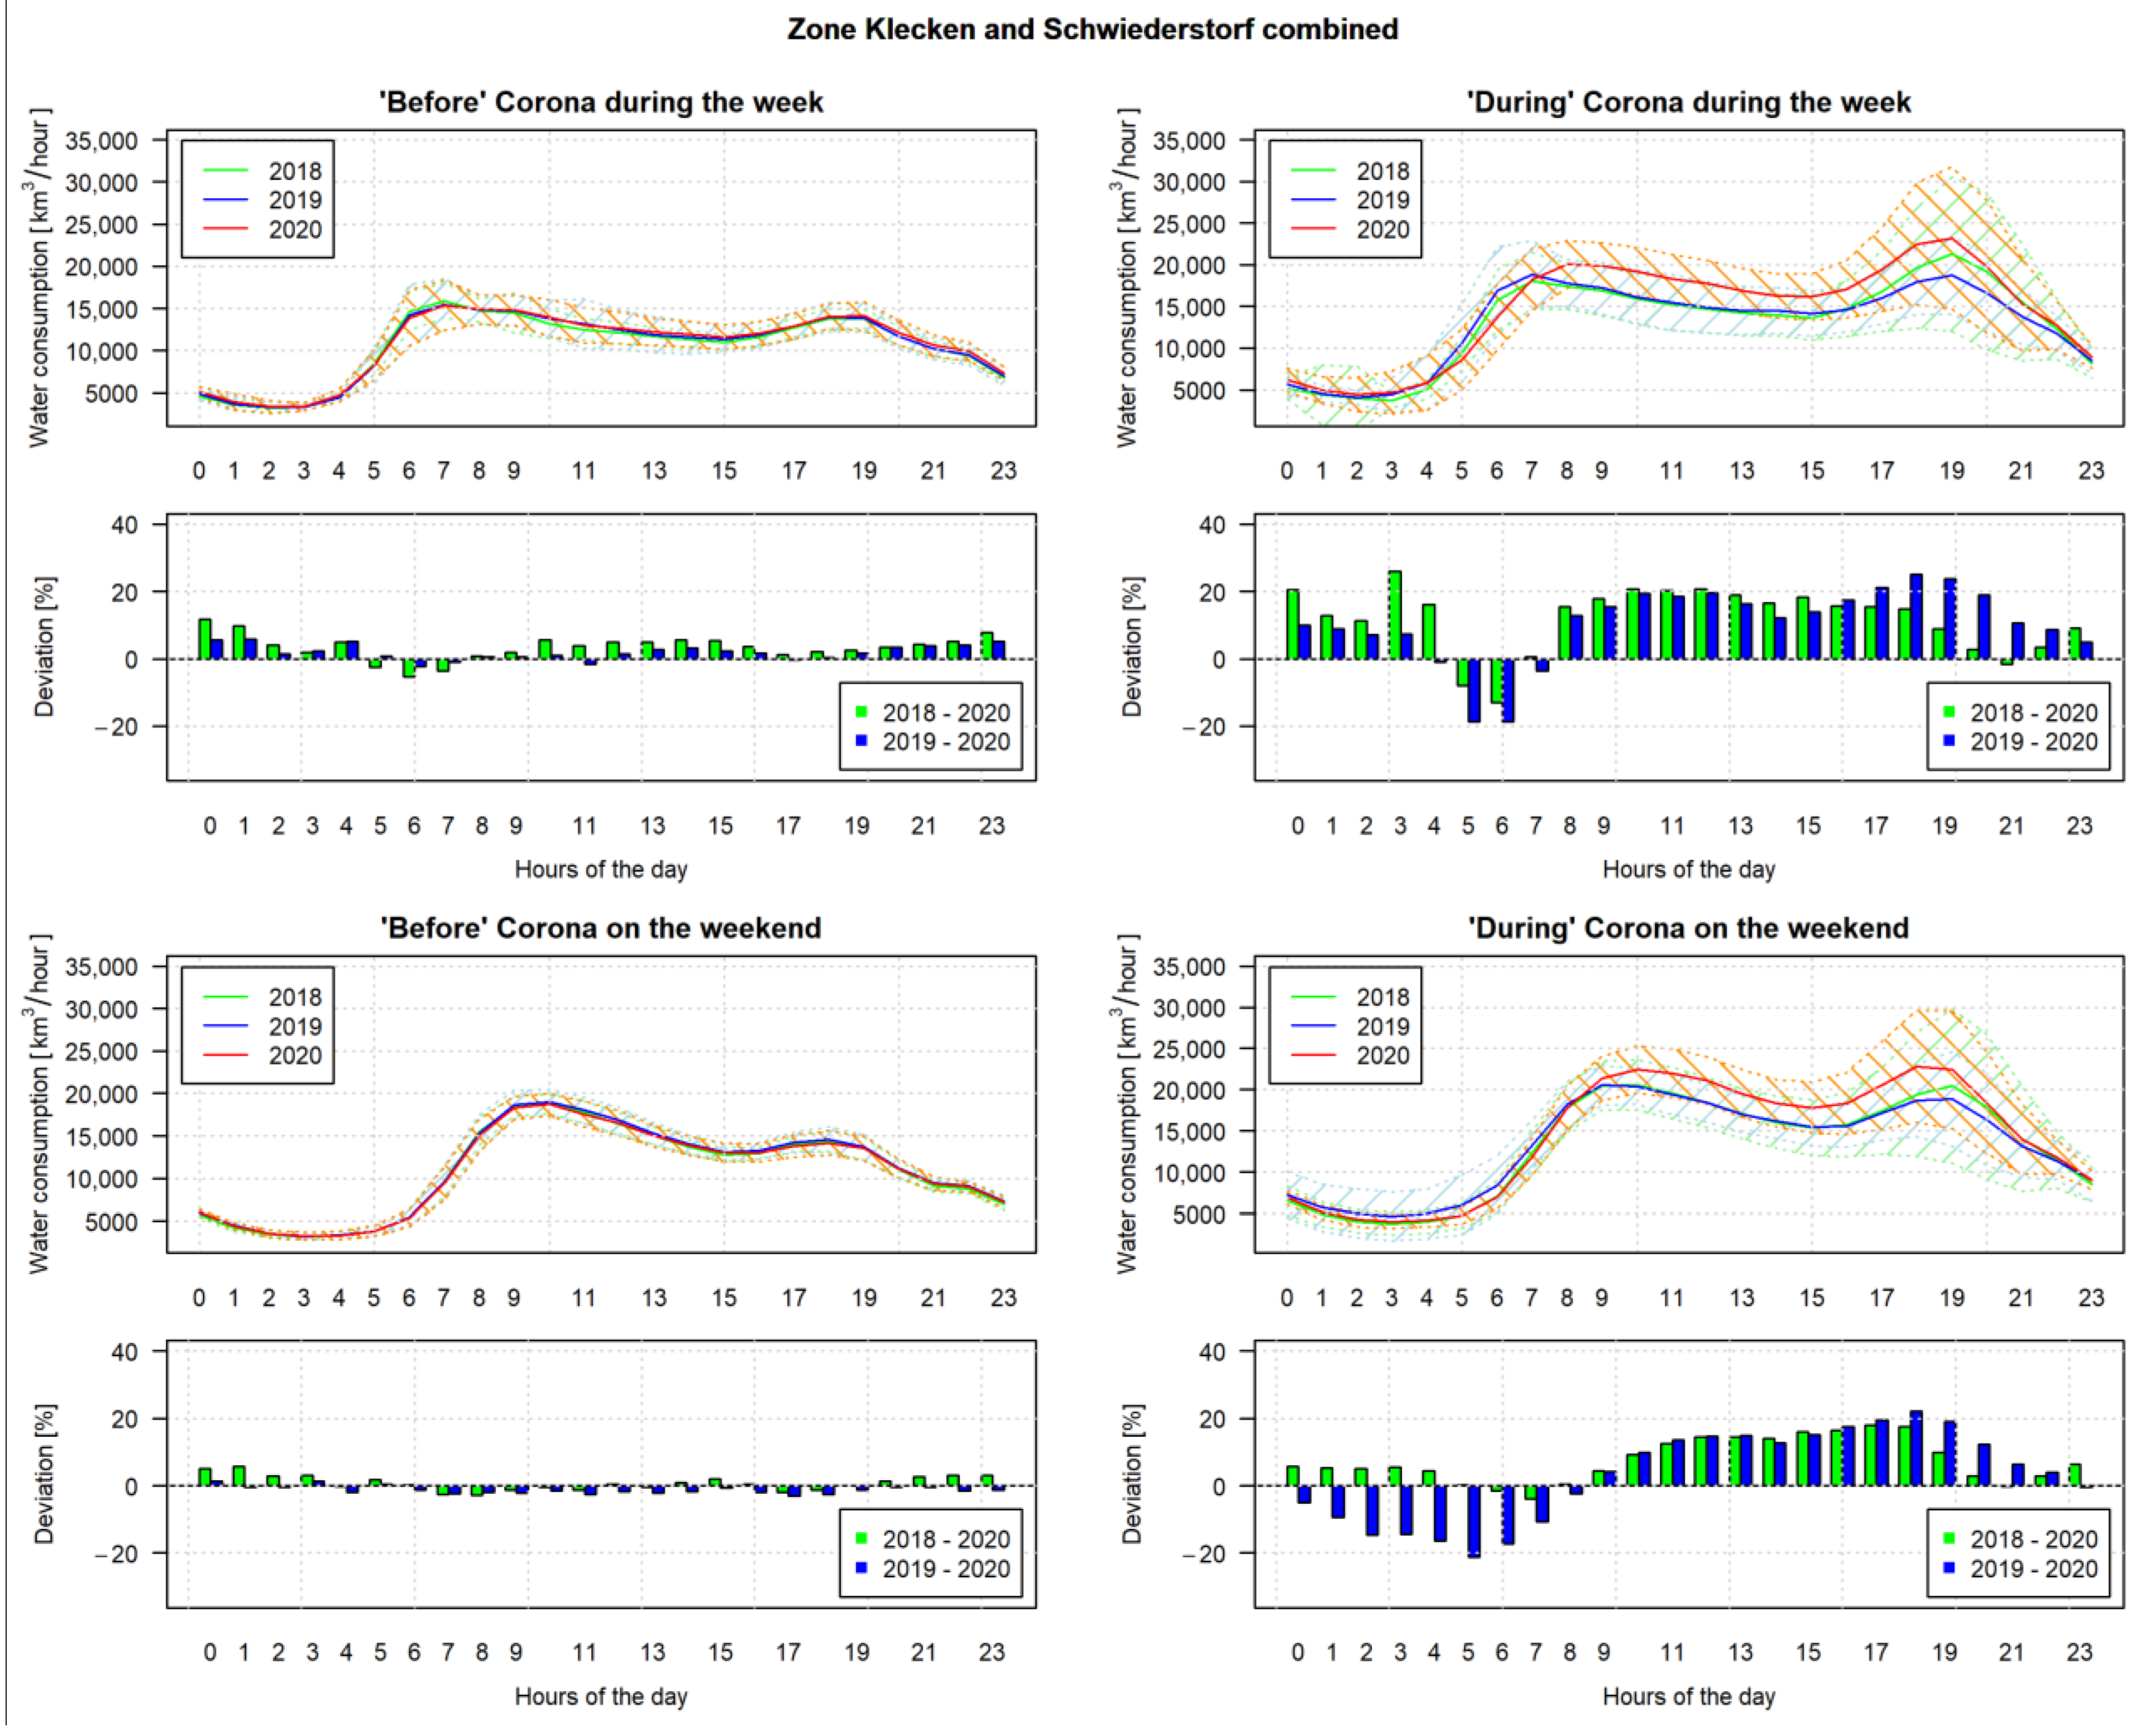
The curves of water consumption volumes show a typical shape of a diurnal cycle (Figure 4). For all respective periods, we can observe a morning peak consumption. Under normal conditions before COVID-19 (Figure 4, left side; see also green and blue line for 2018 and 2019 on right side), the morning peak was at 7 a.m. during the week (upper top graphs) and shifted to 9 or 10 a.m. on the weekend (upper bottom graphs). As opposed to that, we can detect a distinct time shift in the morning peak activity by approximately one to two hours during weekdays for the year 2020. Here, the morning peak was at 8 or 9 a.m. (Figure 4, upper top right graph). In addition, an evening peak consumption at 7 p.m. arises in all three years during the period that coincided with the COVID-19 measures (right side).
Since we only had hourly data available for time periods between December and June of the different years, the comparison groups “before” and “during” COVID-19 measures coincided with a winter and spring period, respectively. In general, water consumption was higher during spring periods in all three years. However, the comparison of the percentage deviation between the years is striking. Before the measures were implemented (left side), the difference between the years was very small. Deviations only exceeded 10% on one occasion at midnight (lower top graphs). On the other hand, for the time period when strict measures became effective in 2020, i.e., “during” Corona (right side), we can observe obvious differences. As already reported for the daily consumption volumes, water consumption was higher in 2020 during the general waking hours for both weekdays and weekends. Here, the deviation exceeded the 10% mark in many cases.
4. Discussion
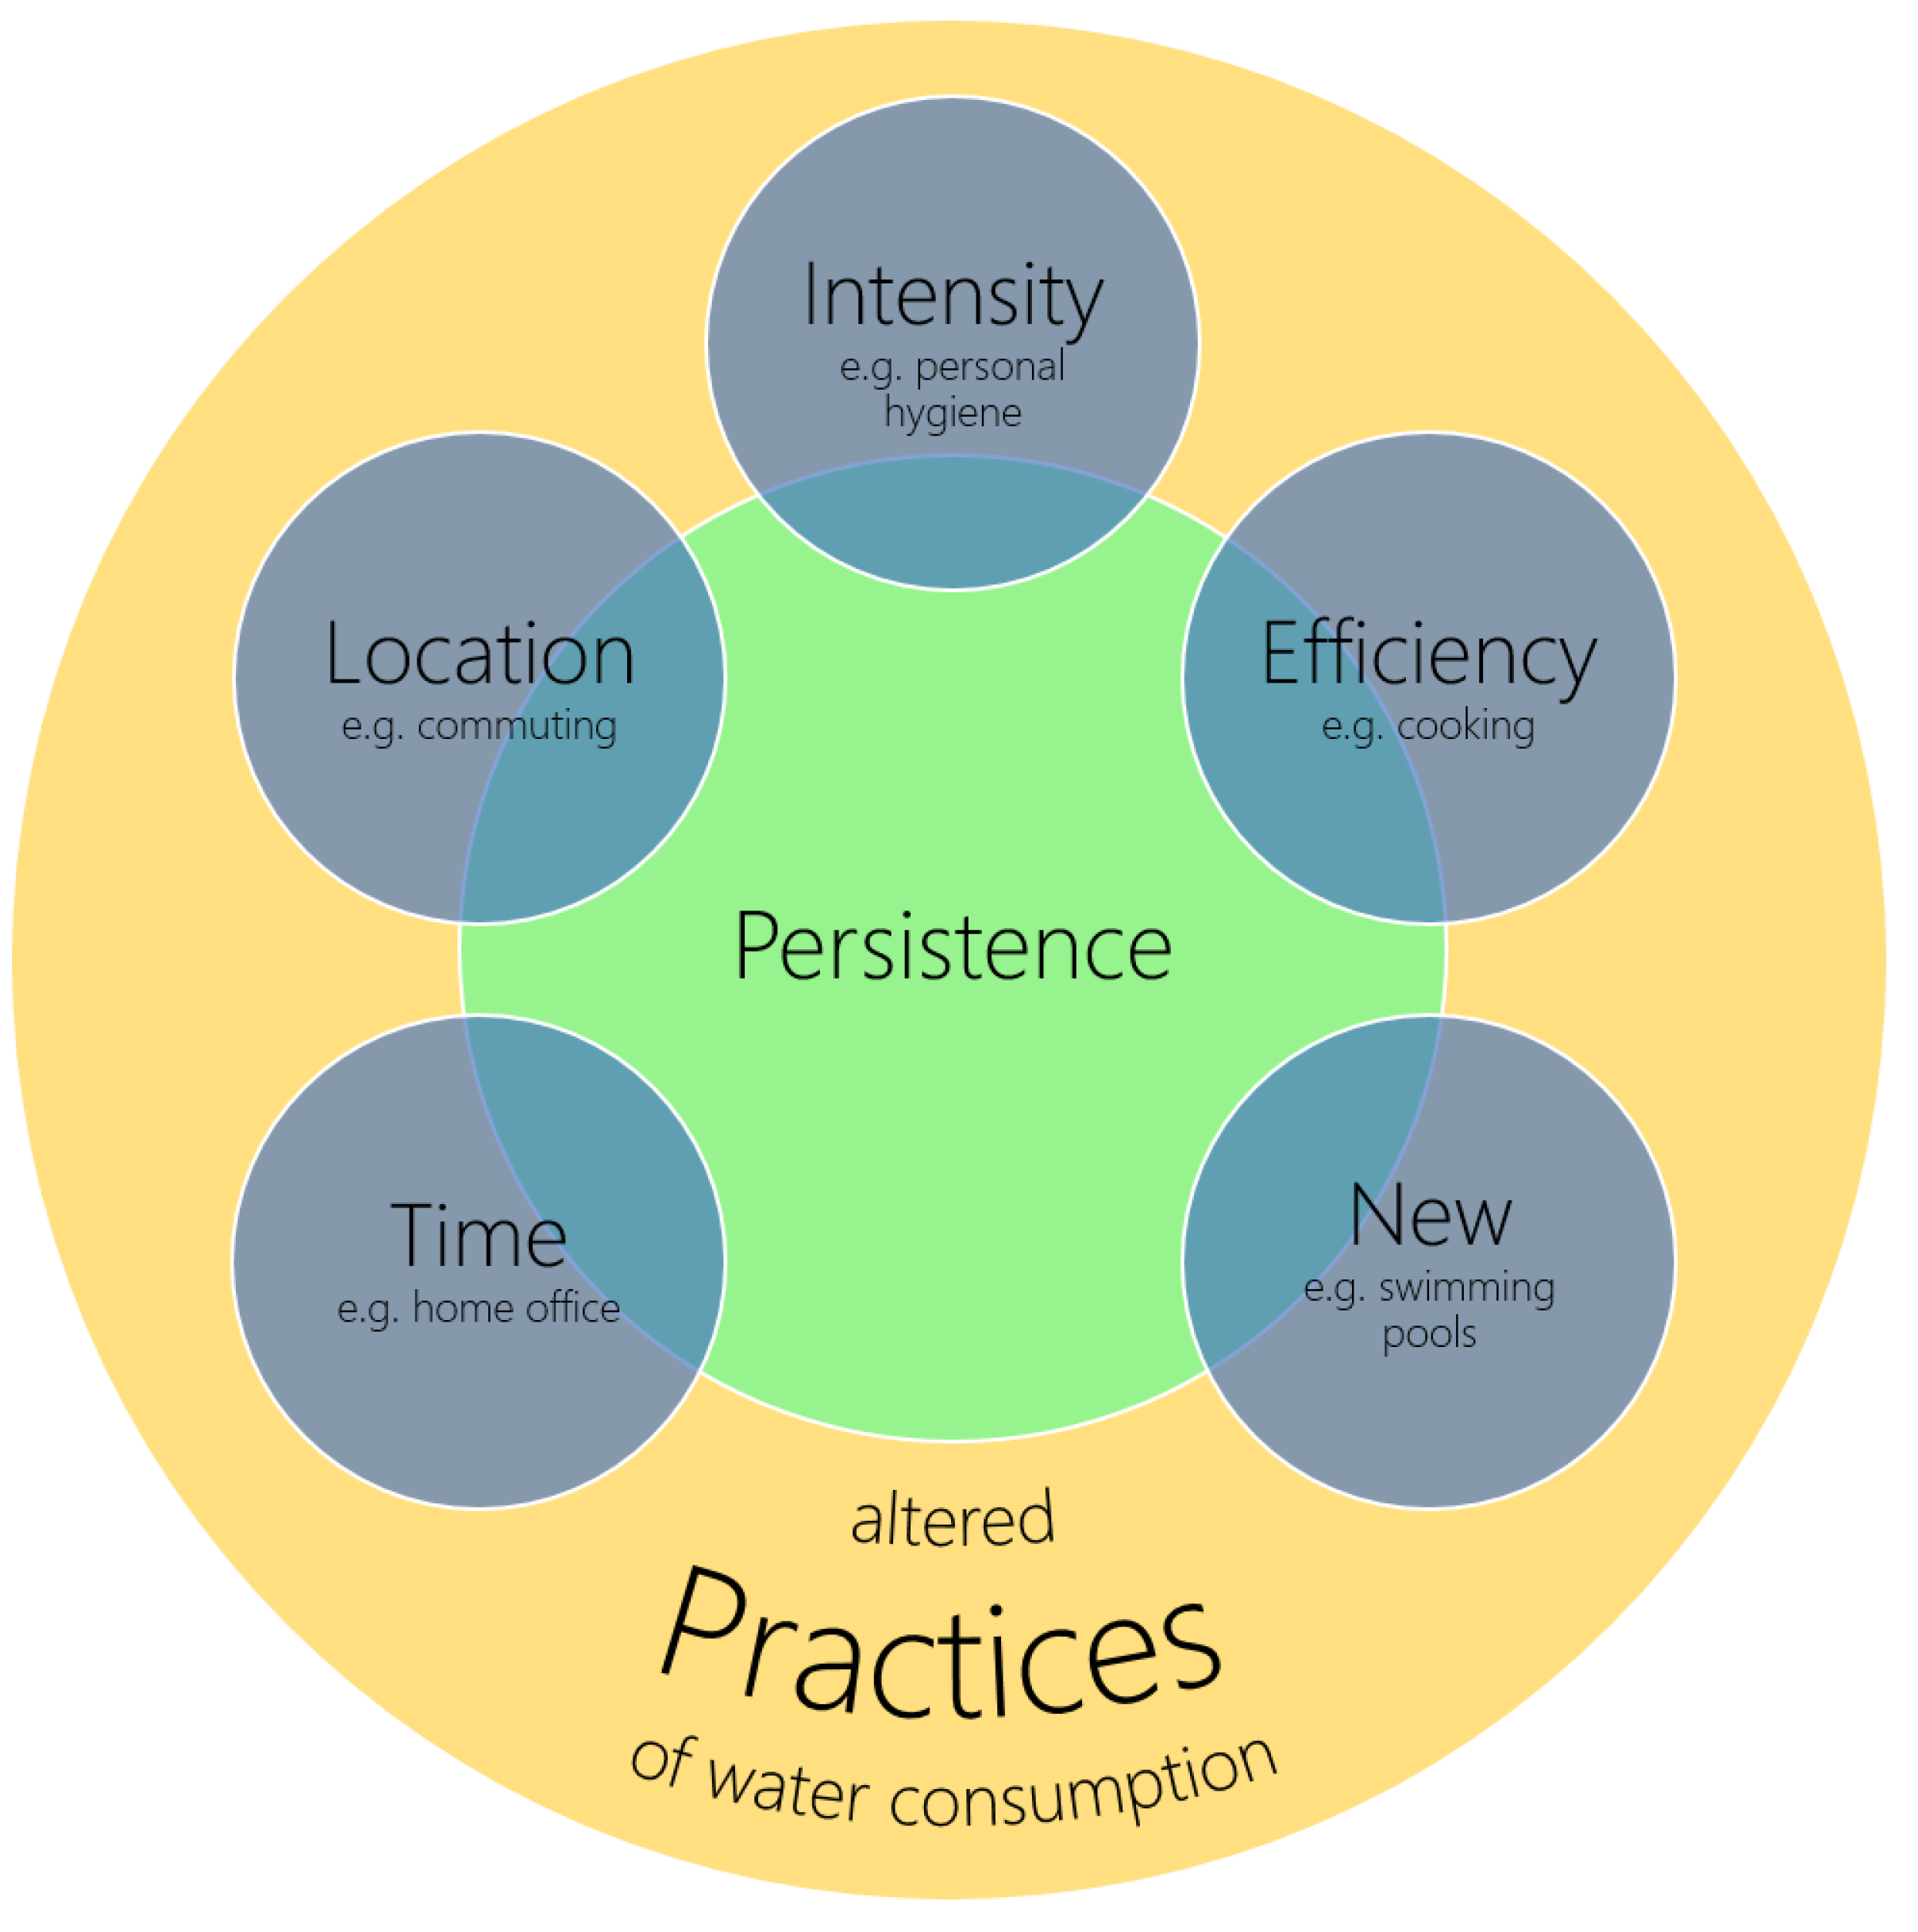
Our analysis reveals that the COVID-19 restrictions of public life resulted in an increase of domestic water demand in the study area. This effect is likely to occur in similar regions of Germany and beyond, as the socioeconomic and sociocultural structures of Harburg (cf. Chapter 2.1) are typical for many metropolitan regions close to larger, economically important cities (e.g., Berlin, Frankfurt, Munich, Stuttgart, etc.) [32]. The interesting question at this point is, why do these effects occur? In the following, we intend to provide a brief discussion of potential hypotheses and how these may be empirically tested. It is not our aim to propose a comprehensive framework of altered water consumption practices, but rather to suggest speculative hypotheses that need further empirical consideration. In this regard, we build upon and look beyond the findings of a recent study conducted by Alda-Vidal et al. [16] in England and Wales, who looked into household water consumption during COVID-19. Figure 5 gives an overview of five dimensions for which we think that altered practices may have caused the observed water consumption increases. A sixth dimension covers the cross-cutting question of the short- and long-lasting character of the observed changes.
TIME: The effect on an hourly basis of shifted peak demands in the morning hours can be an indication for changed activity patterns in general. The same effect was already reported for another city in southern Germany [12], where four Tuesdays were compared (the two Tuesdays right before the COVID-19 restrictions were implemented and the two Tuesdays when the restrictions came into effect). This effect might have occurred, first, because many people stayed at home due to home office and working on short time [33,34]. The commute for employees disappeared and people did not have to get up as early as before. Second, also students and pupils did not have to get to school on time since they were also closed. Schools provided students with packages of homework and self-learning material that students were able to work on at any preferred time of the day. Therefore, students, too, were able to sleep longer and might have used the bathroom later.
LOCATION: Alongside temporal changes in daily routines, spatial shifts of respective practices may lead to changes in water demand for certain utilities. This effect may be particularly relevant for utilities that supply residential areas in a metropolitan region where a large share of the inhabitants regularly commutes to other municipalities. When employees stay at home due to home office or working on short time, water consumption that is normally taking place at work (e.g., toilet flushing, drinking) is shifted to peoples’ homes. This reduces the volume of water supplied in areas with a balance net surplus of commuters (i.e., more people commuting into an area than commuting out) and increases it in residential areas that have a balance net-deficit of commuters.
INTENSITY: Spatio-temporal changes of daily routines may explain shifts in consumption patterns. In addition to these, we hypothesize that certain water-consuming practices may have been intensified on the household level. In this regard, more emphasis on overall personal hygiene with more frequent handwashing and showering as well as clothes washing or disinfecting surfaces (e.g., tables) could have increase daily water volumes consumed at home [16]. In this regard, an additional recent study found that the time spent to do housework did indeed increase during the COVID-19 pandemic [33]. Additionally, as people were confined to their homes and leisure time increased, the amount of garden irrigation might have also increased [16], since precipitation and humidity was also low during the lockdown phase [21]. This could either represent an intensification when gardening was already established or could gain a new quality and significance when gardening was adopted as a new hobby (see NEW).
EFFICIENCY: Since we investigated the water consumption of an entire service area, the impact of location only effects total consumption volumes for outbound commuters that were now working from home. People who are resident and work in the same area, on the other hand, are supposed to use water regardless of social distancing measures. However, water use efficiency on the household level may also contribute to increased water volumes consumed. Commercial kitchens that sustain many people, for instance, use less water per person as compared to private kitchens with less persons per household [35]. This means that not consuming food during the lunch breaks and for dinner in a restaurant increases the water demand for food preparation, as many people switched to doing their own cooking [16]. Likewise, toilet infrastructure in public buildings and at companies may be considered as more water-efficient (e.g., urinals, water reuse systems) compared to facilities at home, e.g., [36,37,38].
NEW: While the previous dimensions indicated how existing routines and practices may have changed and thus resulted in altered water consumption volumes, new practices are likely to contribute to the overall effect. In this regard, we hypothesize that the utilization of swimming pools (e.g., inflatable) increased due to travel restrictions and a search for leisure alternatives. Many families were forced to stay at home during Easter holidays, paired with warm and dry weather conditions and more time to spare could have resulted in increased water use for leisure activities (e.g., swimming), gardening and renovations taking place cf. [33]. In addition, Alda-Vidal et al. [16] also found that domestic gardens became more important for leisure activities and mental health during the lockdown phase and an increasing number of people started to grow their own food.
PERSISTENCE: Given the examples mentioned above, of how daily routines may have been altered or even emerged as a consequence of the COVID-19 restrictions, the question is whether the increase in water consumption observed will persist beyond the pandemic or not. Will people adopt the new routines, or go back to normal after the situation settled? For water utilities, not just in Germany but worldwide, this is an important question to be answered in the near future as the overall water consumption trend may be critically affected. Will we have to deal with higher water consumption volumes in the future, possibly paired with hot and dry situations in the summer months as climate change consequences? Are water utilities resilient to mitigate situations of restricted water availability and new peak demands?
One important driver for the persistence is the utilization of home office. The acceptance of teleworking (here: working from home) increased during the pandemic [33,34,39] and might be also utilized more often in industries with predominantly desk work in the future [40,41]. Even politics in Germany started to draft a bill that allows employees to be legally entitled to work mobile 24 days a year [42]. This is an indication that some practices might well persist to some extent in the long run. In addition, participants in a group discussion in England and Wales stated that they would continue gardening and using their outdoor spaces [16]. The magnitude, however, will perhaps not be as intense as during the restriction measures. The same study pointed out that personal hygiene practices are expected to recede once the threat of the pandemic weakens. Nevertheless, a persistence in some of these practices paired with the likely increase of droughts and heat waves in the future [43] could well have major implications for future management actions.
Lastly, observed effects of the altered water consumption on a household level might likely be transferred to other sectors, too. For example, household energy demand increased due to an increase in cooking, entertainment use, lighting and indoor cooling/heating in a coastal city in China [7].
5. Conclusions
The COVID-19 pandemic altered the daily lives of people worldwide. Impacts on social life, economic activities and the environment are visible, but in-depth research into the concrete consequences is yet to be done. We investigated the implications of COVID-19-induced behavioral changes for water supply, taking a utility in northern Germany as a case.
From our analysis, we found that daily water consumption was 14.3% higher during the first lockdown in 2020 than in previous years at the same time period. Additionally, demand patterns over the day changed with a time shift of the morning peak and higher evening demand peaks. We conclude that an important question for water utilities and for similar service providers is whether the behavioral changes will persist beyond the COVID-19 period. If people consider the adaptations of their daily lives (e.g., home office, hygiene practices) as favorable, this may lead to a long-term change of practices and hence to an increase in water demand which may be a long-term phenomenon. This, together with climatic effects (e.g., droughts and heat waves), may pose a considerable threat to water supply safety. Additionally, a shift in daily peak demand is to be expected if the abovementioned adaptations persist. Further, as daily routines change, the water demand might not only change in volume rates but also between user groups such as households and economic sectors. This, in turn, would lead to spatial shifts over service areas and might entail constructional planning by water suppliers as households and economic sectors are not homogeneously distributed.
We see the need to empirically investigate the behavioral changes of peoples’ daily lives in terms of water usage to understand the consequences for water supply in Germany and worldwide.
Author Contributions
Conceptualization, D.U.L., R.L. and S.L.; methodology, D.U.L. and R.L.; formal analysis, D.U.L.; resources, M.S.; data curation, D.U.L. and R.L.; writing—original draft preparation, D.U.L. and R.L.; writing—review and editing, D.U.L., R.L., M.S. and S.L.; visualization, D.U.L. and R.L.; supervision, S.L.; project administration, S.L.; funding acquisition, S.L. All authors have read and agreed to the published version of the manuscript.
Funding
This research received no external funding.
Institutional Review Board Statement
Not applicable.
Informed Consent Statement
Not applicable.
Data Availability Statement
Restrictions apply to the availability of these data. Data were obtained from WBV Harburg and are available from the authors on request with the permission of WBV Harburg.
Acknowledgments
We would like to thank Immanuel Stieß, Konrad Götz, Johanna Kramm, and Ronja Kraus for their help, their critical input, and their greatly appreciated suggestions.
Conflicts of Interest
The authors declare no conflict of interest.
References
- Sohrabi, C.; Alsafi, Z.; O’Neill, N.; Khan, M.; Kerwan, A.; Al-Jabir, A.; Iosifidis, C.; Agha, R. World Health Organization declares global emergency: A review of the 2019 novel coronavirus (COVID-19). Int. J. Surg. 2020, 76, 71–76. [Google Scholar] [CrossRef] [PubMed]
- World Health Organisation. WHO Director-General’s Opening Remarks at the Media Briefing on COVID-19. 11 March 2020. Available online: https://www.who.int/dg/speeches/detail/who-director-general-s-opening-remarks-at-the-media-briefing-on-covid-19---11-march-2020 (accessed on 25 November 2020).
- BPA. Vereinbarung Zwischen der Bundesregierung und den Regierungschefinnen und Regierungschefs der Bundesländer Angesichts der Corona-Epidemie in Deutschland; Bundespresseamt: Berlin, Germany, 2020. [Google Scholar]
- Liu, Z.; Ciais, P.; Deng, Z.; Lei, R.; Davis, S.J.; Feng, S.; Zheng, B.; Cui, D.; Dou, X.; Zhu, B.; et al. Near-real-time monitoring of global CO2 emissions reveals the effects of the COVID-19 pandemic. Nat. Commun. 2020, 11, 5172. [Google Scholar] [CrossRef] [PubMed]
- Forster, P.M.; Forster, H.I.; Evans, M.J.; Gidden, M.J.; Jones, C.D.; Keller, C.A.; Lamboll, R.D.; Le Quéré, C.; Rogelj, J.; Rosen, D.; et al. Current and future global climate impacts resulting from COVID-19. Nat. Clim. Chang. 2020, 10, 913–919. [Google Scholar] [CrossRef]
- Abu-Rayash, A.; Dincer, I. Analysis of the electricity demand trends amidst the COVID-19 coronavirus pandemic. Energy Res. Soc. Sci. 2020, 68, 101682. [Google Scholar] [CrossRef] [PubMed]
- Cheshmehzangi, A. COVID-19 and household energy implications: What are the main impacts on energy use? Heliyon 2020, 6, e05202. [Google Scholar] [CrossRef]
- Westhaus, S.; Weber, F.-A.; Schiwy, S.; Linnemann, V.; Brinkmann, M.; Widera, M.; Greve, C.; Janke, A.; Hollert, H.; Wintgens, T.; et al. Detection of SARS-CoV-2 in raw and treated wastewater in Germany—Suitability for COVID-19 surveillance and potential transmission risks. Sci. Total Environ. 2020, 751, 141750. [Google Scholar] [CrossRef]
- La Rosa, G.; Bonadonna, L.; Lucentini, L.; Kenmoe, S.; Suffredini, E. Coronavirus in water environments: Occurrence, persistence and concentration methods—A scoping review. Water Res. 2020, 179, 115899. [Google Scholar] [CrossRef]
- Kalbusch, A.; Henning, E.; Brikalski, M.P.; Luca, F.V.D.; Konrath, A.C. Impact of coronavirus (COVID-19) spread-prevention actions on urban water consumption. Resour. Conserv. Recycl. 2020, 163, 105098. [Google Scholar] [CrossRef]
- Balacco, G.; Totaro, V.; Iacobellis, V.; Manni, A.; Spagnoletta, M.; Piccinni, A.F. Influence of COVID-19 Spread on Water Drinking Demand: The Case of Puglia Region (Southern Italy). Sustainability 2020, 12, 5919. [Google Scholar] [CrossRef]
- WatEner. Wasserverbrauch und Bedarfsprognose während der COVID-19-Krise. Available online: http://watener.com/index.php/wasserverbrauch-und-bedarfsprognose-wahrend-der-covid-19-krise/?lang=de (accessed on 30 November 2020).
- BMU/UBA. Wasserwirtschaft in Deutschland. Grundlagen, Belastungen, Maßnahmen; Umweltbundesamt: Dessau-Roßlau, Germany, 2017. [Google Scholar]
- Winker, M.; Schramm, E.; Schulz, O.; Zimmermann, M.; Liehr, S. Integrated water research and how it can help address the challenges faced by Germany’s water sector. Environ. Earth Sci. 2016, 75, 1226. [Google Scholar] [CrossRef]
- BDEW. Wasserfakten im Überblick (Engl.: Water Facts Overview); Bundesverband der Energie- und Wasserwirtschaft e.V.: Berlin, Germany, 2020. [Google Scholar]
- Alda-Vidal, C.; Smith, R.; Lawson, R.; Browne, A.L. Understanding Changes in Domestic Water Consumption Associated with COVID-19 in England and Wales. AR1380. 2020. Available online: https://artesia.shinyapps.io/Artesia-Reports/ (accessed on 7 December 2020).
- WBV. Zahlen Und Fakten. Available online: https://wbv-harburg.de/zahlen/ (accessed on 7 December 2020).
- WBV. 50 Jahre Wasserbeschaffungsverband Harburg. Chronik 1953–2003; WBV: Seevetal, Germany, 2003. [Google Scholar]
- WBV. Number of Customers and Meter Connections for the Service Area between 2018–2019; WBV: Seevetal, Germany, 2020. [Google Scholar]
- LSN. Online Statistical Database. 2020. Available online: https://www.statistik.niedersachsen.de/datenangebote/lsnonlinedatenbank/ (accessed on 30 November 2020).
- DWD. Climate Data Center (CDC). Available online: ftp://opendata.dwd.de/climate_environment/CDC/ (accessed on 30 November 2020).
- Nds. MSGG. Maßnahmen Nach §28Abs.1 IfSG, Beschränkung von Sozialen Kontakten im Öffentlichen Bereich Angesichts der Corona-Epidemie; Schutz der Bevölkerung vor der Verbreitung des Coronavirus SARS-CoV-2; Niedersächsisches Ministerium für Soziales, Gesundheit und Gleichstellung: Hannover, Germany, 2020; Available online: https://www.niedersachsen.de/download/153171/Erlass_des_Niedersaechsischen_Gesundheitsministeriums_zur_Beschraenkung_von_sozialen_Kontakten_im_oeffentlichen_Bereich_Handeln-Freizeit-Kultur_vom_16.03.2020.pdf (accessed on 31 March 2020).
- Nds. MK. Eindämmung des Coronavirus SARS-CoV-2:. Landesweiter Unterrichtsausfall und Kitaschließungen Angeordnet—Notbetreuung für Beschäftigte der öffentlichen Daseinsvorsorge; Niedersächsisches Kultusministerium: Hannover, Germany, 2020; Available online: https://www.mk.niedersachsen.de/startseite/aktuelles/presseinformationen/eindammung-des-coronavirus-sars-cov-2-landesweiter-unterrichtsausfall-und-kitaschliessungen-angeordnet-notbetreuung-fur-beschaftigte-der-offentlichen-daseinsvorsorge-186113.html (accessed on 31 March 2020).
- Haque, M.M.; Egodawatta, P.; Rahman, A.; Goonetilleke, A. Assessing the significance of climate and community factors on urban water demand. Int. J. Sustain. Built Environ. 2015, 4, 222–230. [Google Scholar] [CrossRef]
- Rondinel-Oviedo, D.R.; Sarmiento-Pastor, J.M. Water: Consumption, usage patterns, and residential infrastructure. A comparative analysis of three regions in the Lima metropolitan area. Water Int. 2020, 16, 1–23. [Google Scholar] [CrossRef]
- Bates, D.; Mächler, M.; Bolker, B.; Walker, S. Fitting linear mixed-effects models using lme4. J. Stat. Softw. 2015, 67. [Google Scholar] [CrossRef]
- Korner-Nievergelt, F.; von Felten, S.; Almasi, B.; Guélat, J.; Roth, T.; Korner-Nievergelt, P. Bayesian Data Analysis in Ecology Using Linear Models with R, BUGS, and STAN. Including Comparisons to Frequentist Statistics; Elsevier Science & Technology: Saint Louis, MI, USA, 2015; ISBN 978-0-12-801370-0. [Google Scholar]
- Donkor, E.A.; Mazzuchi, T.A.; Soyer, R.; Alan Roberson, J. Urban Water Demand Forecasting: Review of Methods and Models. J. Water Resour. Plan. Manag. 2014, 140, 146–159. [Google Scholar] [CrossRef]
- Haque, M.; Rahman, A.; Hagare, D.; Chowdhury, R. A Comparative Assessment of Variable Selection Methods in Urban Water Demand Forecasting. Water 2018, 10, 419. [Google Scholar] [CrossRef] [Green Version]
- Gelman, A.; Su, Y.-S. Arm: Data Analysis Using Regression and Multilevel/Hierarchical. R Package Version 1.11-1. 2020. Available online: https://CRAN.R-project.org/package=arm (accessed on 30 November 2020).
- Bolker, B.M.; Brooks, M.E.; Clark, C.J.; Geange, S.W.; Poulsen, J.R.; Stevens, M.H.H.; White, J.-S.S. Generalized linear mixed models: A practical guide for ecology and evolution. Trends Ecol. Evol. 2008, 24, 127–135. [Google Scholar] [CrossRef]
- Statistische Ämter des Bundes und der Länder. Available online: http://www.statistikportal.de/de (accessed on 30 November 2020).
- Gerold, S.; Geiger, S. Arbeit, Zeitwohlstand und Nachhaltiger Konsum während der Corona-Pandemie; TU: Berlin, Germany, 2020. [Google Scholar]
- von Gaudecker, H.-M.; Holler, R.; Janys, L.; Siflinger, B.; Zimpelmann, C. Labour Supply in the Early Stages of the COVID-19 Pandemic: Empirical Evidence on Hours, Home Office, and Expectations. IZA Discuss. Pap. 2020, 13158, 1–22. [Google Scholar]
- Richter, C.P.; Stamminger, R. Water Consumption in the Kitchen—A Case Study in Four European Countries. Water Resour. Manag. 2012, 26, 1639–1649. [Google Scholar] [CrossRef]
- BMU. Wassersparende Toilettenspülung; Bundesministerium für Umwelt, Naturschutz und Nukleare Sicherheit: Berlin, Germany, 2016; Available online: https://www.bmu.de/themen/wasser-abfall-boden/binnengewaesser/verbrauchertipps/wassersparende-toilettenspuelung/ (accessed on 7 December 2020).
- Danielsson, M.; Spuhler, D. Reduce Water Consumption in Industry. Available online: https://sswm.info/water-nutrient-cycle/water-use/hardwares/optimisation-water-use-industries/reduce-water-consumption-in-industry (accessed on 7 December 2020).
- Horsburgh, J.S.; Leonardo, M.E.; Abdallah, A.M.; Rosenberg, D.E. Measuring water use, conservation, and differences by gender using an inexpensive, high frequency metering system. Environ. Model. Softw. 2017, 96, 83–94. [Google Scholar] [CrossRef]
- Belzunegui-Eraso, A.; Erro-Garcés, A. Teleworking in the context of the Covid-19 crisis. Sustainability 2020, 12, 3662. [Google Scholar] [CrossRef]
- Levy, A. Working from Home is Here to Stay, Even When the Economy Reopens. CNBC [Online]. 11 May 2020. Available online: https://www.cnbc.com/2020/05/11/work-from-home-is-here-to-stay-after-coronavirus.html (accessed on 13 October 2020).
- Cotterill, S.; Bunney, S.; Lawson, E.; Chisholm, A.; Farmani, R.; Melville-Shreeve, P. COVID-19 and the water sector: Understanding impact, preparedness and resilience in the UK through a sector-wide survey. Water Environ. J. 2020. [Google Scholar] [CrossRef] [PubMed]
- SZ. SPD: Heil will Mindestanspruch auf Home-Office. Süddeutsche Zeitung (SZ) [Online]. 4 October 2020. Available online: https://www.sueddeutsche.de/wirtschaft/home-office-mobiles-arbeiten-heil-mindestanspruch-1.5053283 (accessed on 12 October 2020).
- Hari, V.; Rakovec, O.; Markonis, Y.; Hanel, M.; Kumar, R. Increased future occurrences of the exceptional 2018-2019 Central European drought under global warming. Sci. Rep. 2020, 10, 12207. [Google Scholar] [CrossRef] [PubMed]
Figure 1.
Location of the service area (orange shaded area) and the nine service zones of the Wasserversorgungsverband (WBV) Harburg. The different names of the service zones are given. The background map is taken from OpenStreetMap.
Figure 1.
Location of the service area (orange shaded area) and the nine service zones of the Wasserversorgungsverband (WBV) Harburg. The different names of the service zones are given. The background map is taken from OpenStreetMap.

Figure 2.
First seven months starting with December of each year of daily water rates provided by the WBV Harburg to the whole service area. The red line marks 16 March when all schools and daycare centers closed in 2020 [23]. At the same time, this represents the beginning of strict Corona measures. For comparison, data of all years are overlapped. Grey lines represent the years 2006–2019, black line represents 2020.

Figure 3.
Daily water consumption volumes before and during strict Corona measures. Fitted values (red circle), predicted from the linear mixed model, with 95% credible intervals are given assuming average values for all other independent variables. NBefore = 1470 days (2006–2019 each 03/16–06/28); NDuring = 105 days (16 March–28 June 2020).

Figure 4.
Hourly water consumption in two zones (Klecken, Schwiederstorf) for the first half of the three years (2018–2020) and the deviation from 2020 to the two previous years. Data were divided into time periods that corresponded to the days before and during strict Corona measures in 2020 and into weekdays and weekends. Solid lines show the mean consumption volumes per hour, dashed polygon lines show the standard deviation, and bars show the percentage deviation of volumes between 2020 and the two other years.

Figure 5.
Overview of the different dimensions of altered practices that might have caused the increase of the observed water consumption and the outlook of a presumed persistence. It illustrates that some of the altered practices will presumably not continue in the future, but a small amount will persist when people find such adaptations favorable.


Table 1.
Overview of the available data. We removed two outliers of the daily water volume rates.
| Data | Time Scale | Spatial Scale | Time Period | N | Source |
|---|---|---|---|---|---|
| Water supply | |||||
| Water volume rates | daily | Service area | 2006/01/01–2020/06/28 | 5291 | WBV Harburg |
| Water volume rates | hourly | Two service zones | 2018/01/01–2018/06/25 | 25,419 | WBV Harburg |
| 2018/12/25–2019/06/25 | |||||
| 2019/12/25–2020/06/25 | |||||
| Socioeconomics | |||||
| Population | yearly | Service area | 2006–2019 | 14 | WBV Harburg |
| Climate | |||||
| Max. temperature | daily | Closest meteorological station to service area | 2006/01/01–2020/06/28 | 5295 | DWD |
| Precipitation | daily | Closest meteorological station to service area | 2006/01/01–2020/06/28 | 5295 | DWD |
| Humidity | daily | Closest meteorological station to service area | 2006/01/01–2020/06/28 | 5295 | DWD |
Table 2.
Estimates and their 95% credible intervals from the linear mixed model analysis for water volume rates. For the fixed-factor Corona (yes/no) the effect is given for presence of Corona measures compared to no measures. Significant estimates are shown in bold. N = 1575.
Table 2.
Estimates and their 95% credible intervals from the linear mixed model analysis for water volume rates. For the fixed-factor Corona (yes/no) the effect is given for presence of Corona measures compared to no measures. Significant estimates are shown in bold. N = 1575.
| Fixed Factors and Covariates | 2.5% Quantile | Estimated Effect | 97.5% Quantile | Std. Error | Marginal R2 | Conditional R2 |
|---|---|---|---|---|---|---|
| Intercept | 10.143 | 10.171 | 10.199 | 0.014 | 0.686 | 0.733 |
| Population | 0.048 | 0.062 | 0.076 | 0.007 | ||
| Corona (yes) | 0.076 | 0.133 | 0.191 | 0.029 | ||
| Precipitation | −0.007 | −0.002 | 0.002 | 0.002 | ||
| Max. temperature | 0.052 | 0.062 | 0.072 | 0.005 | ||
| (Max. temperature)2 | 0.036 | 0.042 | 0.049 | 0.003 | ||
| Dry period | −0.015 | 0.001 | 0.016 | 0.008 | ||
| Humidity | −0.051 | −0.046 | −0.040 | 0.003 |
Publisher’s Note: MDPI stays neutral with regard to jurisdictional claims in published maps and institutional affiliations. |
© 2021 by the authors. Licensee MDPI, Basel, Switzerland. This article is an open access article distributed under the terms and conditions of the Creative Commons Attribution (CC BY) license (http://creativecommons.org/licenses/by/4.0/).
Share and Cite
MDPI and ACS Style
Lüdtke, D.U.; Luetkemeier, R.; Schneemann, M.; Liehr, S. Increase in Daily Household Water Demand during the First Wave of the Covid-19 Pandemic in Germany. Water 2021, 13, 260. https://doi.org/10.3390/w13030260
AMA Style
Lüdtke DU, Luetkemeier R, Schneemann M, Liehr S. Increase in Daily Household Water Demand during the First Wave of the Covid-19 Pandemic in Germany. Water. 2021; 13(3):260. https://doi.org/10.3390/w13030260
Chicago/Turabian StyleLüdtke, Deike U., Robert Luetkemeier, Michael Schneemann, and Stefan Liehr. 2021. "Increase in Daily Household Water Demand during the First Wave of the Covid-19 Pandemic in Germany" Water 13, no. 3: 260. https://doi.org/10.3390/w13030260
Note that from the first issue of 2016, this journal uses article numbers instead of page numbers. See further details here.