Article

Integrating Structural Resilience in the Design of Urban Drainage Networks in Flat Areas Using a Simplified Multi-Objective Optimization Framework

1
Institute of Urban Water Management, Department of Civil Engineering, TU Kaiserslautern, 67663 Kaiserslautern, Germany
2
Department of Stochastic Simulation and Safety Research (LS3), Faculty of Civil and Environmental Engineering, University of Stuttgart, 70569 Stuttgart, Germany
3
Faculty of Civil Engineering and Architecture, Shahid Chamran University of Ahvaz, Ahvaz 61357831351, Iran
*
Author to whom correspondence should be addressed.
Water 2021, 13(3), 269; https://doi.org/10.3390/w13030269
Submission received: 19 November 2020 / Revised: 16 January 2021 / Accepted: 20 January 2021 / Published: 22 January 2021
(This article belongs to the Special Issue Urban Drainage Systems)

Abstract

:
Structural resilience describes urban drainage systems’ (UDSs) ability to minimize the frequency and magnitude of failure due to common structural issues such as pipe clogging and cracking or pump failure. Structural resilience is often neglected in the design of UDSs. The current literature supports structural decentralization as a way to introduce structural resilience into UDSs. Although there are promising methods in the literature for generating and optimizing decentralized separate stormwater collection systems, incorporating hydraulic simulations in unsteady flow, these approaches sometimes require high computational effort, especially for flat areas. This may hamper their integration into ordinary commercially designed UDS software due to their predominantly scientific purposes. As a response, this paper introduces simplified cost and structural resilience indices that can be used as heuristic parameters for optimizing the UDS layout. These indices only use graph connectivity information, which is computationally much less expensive than hydraulic simulation. The use of simplified objective functions significantly simplifies the feasible search space and reduces blind searches by optimization. To demonstrate the application and advantages of the proposed model, a real case study in the southwest city of Ahvaz, Iran was explored. The proposed framework was proven to be promising for reducing the computational effort and for delivering realistic cost-wise and resilient UDSs.

1. Introduction

Stormwater drainage is an essential service in safeguarding public health and safety [1,2,3]. Flooding not only causes an inconvenience to local inhabitants but also can cause significant economic damage and even mortality. Due to climate change, more extreme weather events are anticipated in the future. This, together with continuous urbanization, the increase in impervious surfaces, and population growth, can debilitate a city during a major storm event [4,5]. Therefore, urban drainage systems (UDSs) should be resilient to extreme loading conditions to lessen the span and extent of failure [4,5,6].
Two types of resilience pertain to UDSs: structural resilience and functional resilience. Structural resilience is the UDS’s ability to minimize the consequences of structural failures, such as clogging and pipe cracking [7]. A UDS’s functional resilience is its ability to maintain service or to return quickly to service during extreme loading conditions. In other words, the system can handle loads for which it was not designed [8].
Concurrently, the need to construct new UDSs in developing countries is increasing [9,10,11]. Nonetheless, planning an efficient UDS can be tricky as various cities do not have sufficient resources for stormwater management improvements and may not have the capital to address all regulatory requirements. As municipalities often work under budgetary limitations, they must allocate their resources wisely and make decisions to find the optimal tradeoff between the service objectives and the life cycle costs (LCC) [12,13].
Conventional approaches to design UDSs in “non-flat” areas include some fundamental stages. Firstly, an outlet is identified and its contributing area (catchment) is marked on a topographical map. Next, a preliminary horizontal alignment (layout) is produced. As pipe networks are supposed to collect wastewater and stormwater gravitationally, the designer can rely on the topography of the area and can follow natural ground slopes in the direction of the determined outlet. This approach might lead to a near-optimal layout depending on the designer’s experience and the steepness of the area [14]. In flat areas, the problem is much more challenging to solve. There is no considerable variation in topography elevations; subsequently, the designer cannot see and trace prominent natural ground slopes to a distinguished outlet. In such areas, there are numerous possibilities for connectivity of the sewers and the outlet(s) location. In contrast with steep areas, engineering experience and judgment are not adequate to design an optimal sewer layout in flat areas. In such areas, the number of possible layouts exponentially increases with the number of sewers [15,16]. The lack of natural slopes in the network highly increases the sensitivity of design specifications and the construction and operational costs for layout configuration [14,15,16,17]. Therefore, utilizing optimization methods to generate optimal layouts is needed [3,16,18].
A limited number of sewer layout generation and optimization methods can be found in the literature, for example, in [15,17,19,20,21,22,23]. Some of these works use graph theory to represent the layout of UDSs. Manholes, lift pump stations, storage tanks, and outlets of the system are depicted as nodes (vertices) in the graph, and sewers, under-pressure pumps, and weirs are represented as the edges.
Most of the methods presented so far for UDS layout generation can only generate and optimize centralized layouts with one main artery, which conveys the flow to a single outlet. However, centralized UDSs are costly to construct, maintain, and operate and have limited resilience and adaptability to future challenges [9,24,25]. Along with economic deterrents, there are concerns about the resilience of centralized UDSs or their ability to provide long-term sustainability [26,27,28,29,30]. Recently, the idea of centralized urban drainage networks has increasingly been questioned. The latest investigations suggest a transition from centralized to decentralized or hybrid schemes.
The current literature supports structural decentralization as a way to introduce structural resilience into an UDS [24]. Structural decentralization strategies reduce the degree of centralization (DC) by reducing the number of elements that are linked and interconnected by releasing stormwater by various outlets to different water bodies locations (see Section 2.2) [10]. Structural resilience is often neglected in the design of UDSs [31,32,33]. However, it can play a significant role in system performance during extreme events.
After layout design, the size of the pipes and their slopes as well as the size and location of pumping and storage facilities are calculated based on the estimated flows from the contributing area in a way that satisfies all technical and practical design constraints and criteria [15,34]. The so-called rational method is the most common approach to sizing the sewers of UDSs. The sewers are sized such that they convey the design discharge in the steady uniform flow [35,36]. Open-channel unsteady flow should be considered in the simulation of sized sewers to prevent possible shortcomings of some conventional approaches in finding optimal UDSs [35].
Sometimes, a trial-and-error design procedure is used to size the system’s components. The size of components is suggested and verified for compliance with technical and hydraulic constraints. In the case of a constraint violation, a new design is proposed, and this procedure is iterated until a feasible design is obtained. This approach only provides a limited number of feasible designs that are not necessarily optimal, especially in the case of large systems in flat areas [16,18]. Besides not providing optimal solutions, trial-and-error approaches are time-consuming and require considerable human effort. Additionally, hydraulic reliability-based approaches, which assure adequate hydraulic capacity for the conveyance of design, do not equip the system for future challenges or guarantee ongoing reliability and resilience of services as the system ages and incurs wear and tear [8]. Therefore, recent academic literature has tried to utilize modern optimization methods (1) to deliver optimal solutions, (2) to make the design procedure systematic, and (3) to integrate different performance indicators (e.g., resilience and sustainability) into the design procedure [37,38].
These approaches mainly call for simulation-optimization procedures in which (1) a mathematical model is employed to mimic the real sewer network and (2) an optimization solver is linked to the mathematical model to aid decision-making by automatically generating and evaluating a large number of scenarios [36]. Although there is a massive number of academic works on the optimal design of UDSs over many years, the concepts and techniques developed have not yet found their way into routine practice [1]. One reason is that the aforementioned approaches are complicated and time-consuming, making them unfavorable for integration into conventional UDS design software like SWMM (Storm Water Management Model). Conjointly, most available optimization frameworks and tools for planning UDSs consider only the second sub-problem (hydraulic design) for a fixed (predesigned) centralized layout. However, as mentioned before, layout design and DC play significant roles in the ultimate design costs and structural resilience.
Recently, Bakhshipour et al., (2019) [24] introduced a UDS layout generator algorithm, namely the hanging gardens algorithm (HGA), to generate and optimize (de)centralized urban drainage systems for both flat and steep terrains. The proposed method was applied against a real case study: a section of the city of Ahvaz, Iran. Although their results showed that the proposed model can generate realistic layouts and can find near-optimal solutions, they only considered construction costs as the objective function. Moreover, their proposed optimization framework required about 100,000 hydraulic simulations to converge to the optimal solution for that test case.
In a follow-up study, Bakhshipour et al. (2021) [39] included other performance indicators such as resilience and sustainability in their design. To do that, they introduced a multicriteria decision-making model for sustainable planning of UDSs considering different centralized or decentralized strategies. Although their proposed framework is promising in handling many decisions, objective functions, and indicators for designing sustainable UDSs, they did not manage to solve the required high computation effort problem. For the same case study, their framework required about 800,000 hydraulic simulations to deliver optimal solutions.
This study aims to improve the algorithms and frameworks introduced in the above two works to significantly lessen the burden of computations and to increase the efficiency of separate stormwater collection networks’ simulation-optimization. To do that, this study introduces a simplified cost function and structural resilience indices that can be used as heuristic parameters for finding the optimal DC and layout configuration. These indices only use graph connectivity information, which is computationally less expensive than hydraulic simulation, to estimate the construction cost and structural resilience of each generated layout. The use of a simplified objective function allows for so-called prescreening of layout designs before the hydraulic optimization step. This leads to a significant reduction in the number of solutions to be computed.

2. Materials and Methods

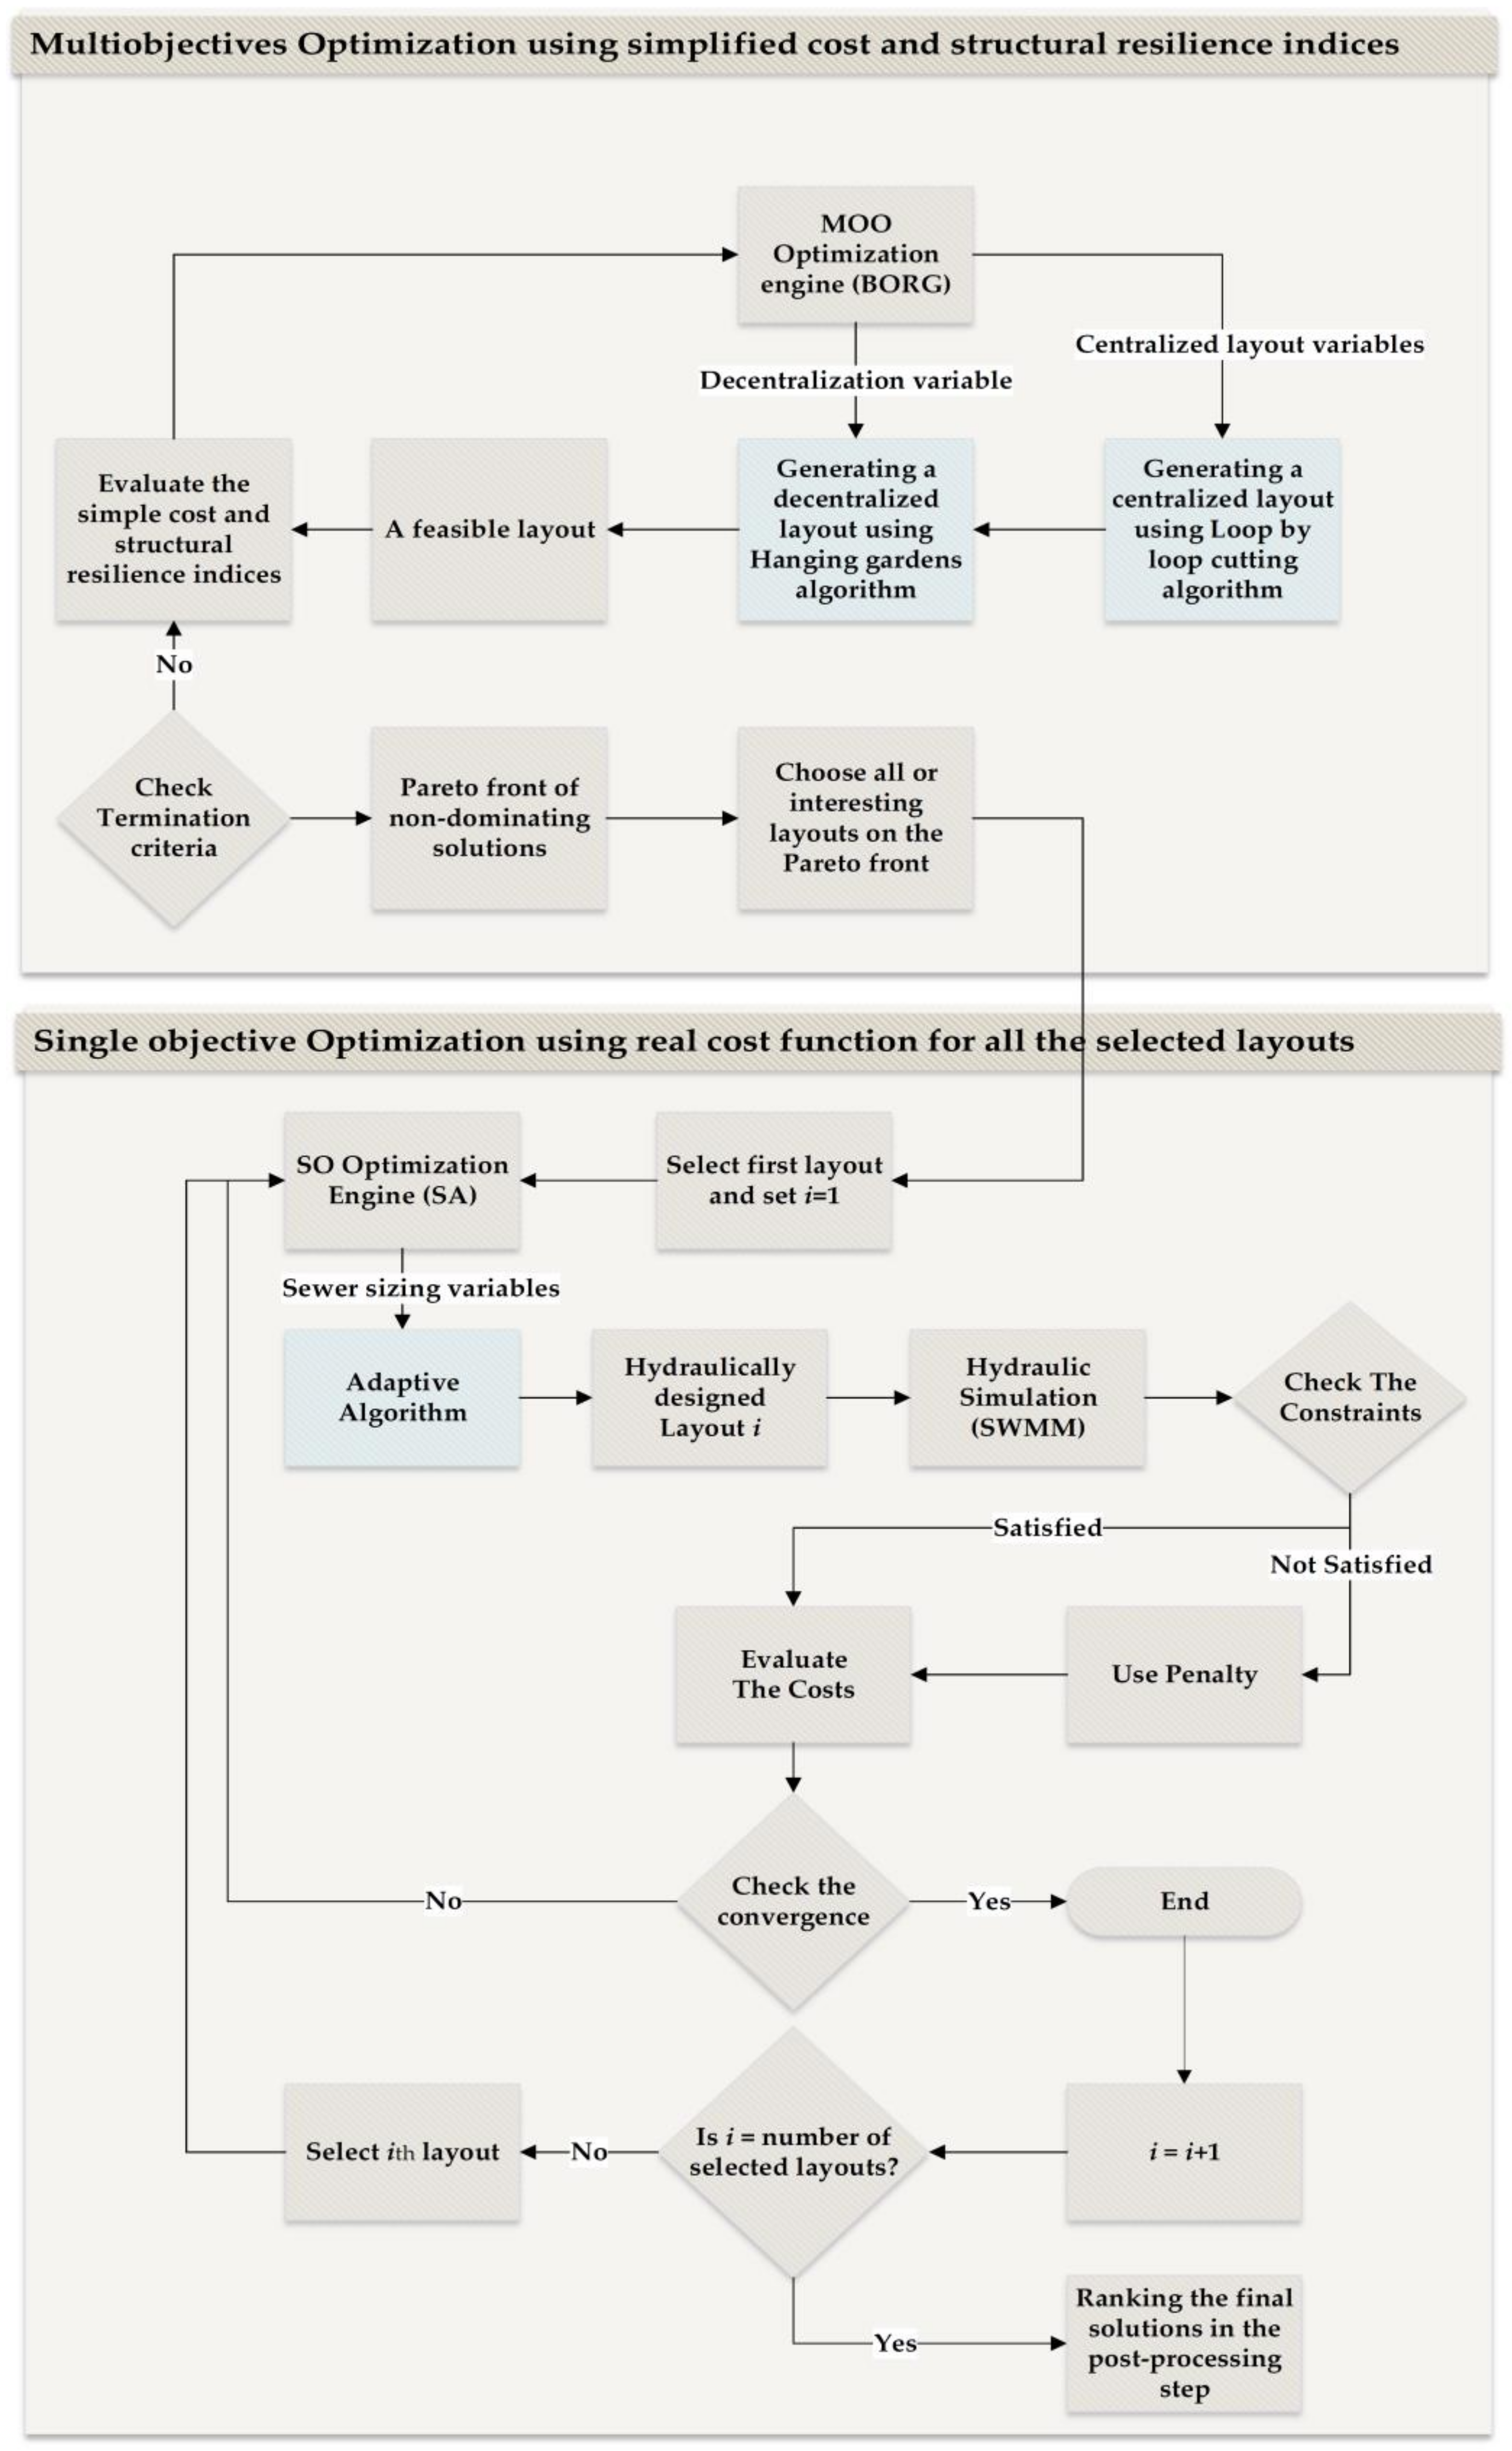
2.1. Problem Formulation and the Proposed Method

Mathematically, the optimization of separate stormwater collection networks can be formulated as follows [39]:
d o p t = arg     d D max f Indicator   1 ,   f Indicator   2 ,   ,   f Indicator   n
d = D C   a n d   l a y o u t   p a r a m e t e r s , h y d r a u l i c   s p e c i f i c a t i o n s
where d o p t is the optimal choice for decision variable d that define the UDS. Decision variable d contains the elements of two sub-problems (Equation (2)): D C   and layout parameters that determine the connectivity between pipes in the system in each part, and the distribution of the system as a whole when multiple outlet candidates are available. Here, D C is defined using Equation (3) adopted from [24].
DC = 100 × 1 N SO 1 N PO 1 %
where N S O is the number of selected outlets from a list of candidates and N P O is the number of possible candidate outlets. The hydraulic specifications are the size of each component such as pipe diameters, slopes, locations, and technical details of pump stations as well as the location and size of storage tanks. D is the feasible space where all structural, technical, hydraulic, environmental, and economic constraints are met. f Indicator   i is the i t h performance indicator or objective function.
For systematic optimization, it is vital to systematically generate various UDS schemes that satisfy all technical and physical constraints. As discussed in the Introduction section, Bakhshipour et al. (2019 and 2021) [24,39] developed two simulation-optimization frameworks to solve this highly complex optimization problem. They tried to simultaneously find the optimal combination of layout, DC, and system hydraulic specifications among numerous candidates. In large networks, as the number of possible layouts exponentially increases with the number of sewers in the system [16], the problem becomes more intractable to solve and the simulation-optimization approach becomes computationally more and more expensive. For instance, the layout generator hanging gardens algorithm works on a random basis. As a consequence, it generates many irrational but feasible, in terms of graph theory, layouts. All the irrational layouts were evaluated using the hydraulic simulation software. This not only increased needless computational effort but also prevented the optimization solver from efficiently exploring the search space by forcing it to explore unfeasible parts of the search space.
By first designing the layout, the number of solutions taken forward for hydraulic optimization can be reduced. This is beneficial when model complexity and computational demand are high. A prescreening of the layout designs can be done regarding one or more chosen performance metrics such as structural resilience and/or construction costs. To do that, an appropriate and simple objective function is needed to evaluate and compare different generated layouts during optimization, based only on the sewer network characteristics—connectivity between edges (or sewers) and nodes (or manholes).
Hence, this study’s first contribution is to develop, evaluate, and choose appropriate simplified objective functions. To do that, first, several simplified cost indices were introduced (see Section 2.2). Then, each index was used as the objective function to conduct a single objective optimization (SOO) to optimize the layout configuration. In other words, when designing the layout, the only objective function was the particular cost index. A second SOO was then performed to design the optimized layouts hydraulically, and each fully designed system was evaluated. After evaluation, one superior cost index was chosen.
The second contribution is the integration of structural resilience into the design of UDSs by proposing a fast multi-objective optimization (MOO) framework based on the simplified objective functions developed in the previous step (see Section 3.2). In this step, the MOO phase was conducted. The layout generation problem then had the following properties: (1) the chosen superior simple cost index and (2) the structural resilience index. As both objectives were based on the graph properties, this MOO was done very quickly in comparison to the works that had tried to solve the layout and hydraulic design sub-problems simultaneously. A postprocessing step was performed to select potentially interesting layouts from the resulting Pareto front of non-dominating solutions. Next, an SOO was done to optimize the selected layout(s) hydraulically.
The proposed framework employed several algorithms, including an algorithm to generate (de)centralized layouts (hanging gardens algorithm, Section 2.2), an algorithm to systematically size the sewers (adaptive algorithm, Section 2.3), and an SOO and a MOO engine (simulated annealing and Borg Multiobjective Evolutionary Algorithm (MOEA). Figure 1 demonstrates the relationship between these algorithms (proposed framework). In the next section, each algorithm is described in short. More detail about each method can be found in the given references.
In this study, Simulated Annealing (SA) was employed for SOO (Section 3.2) [40], and the Borg Multi-Objective Evolutionary Algorithm [41] was employed for the MOO (Section 3.3) based on its successful application for water resource problems [42].

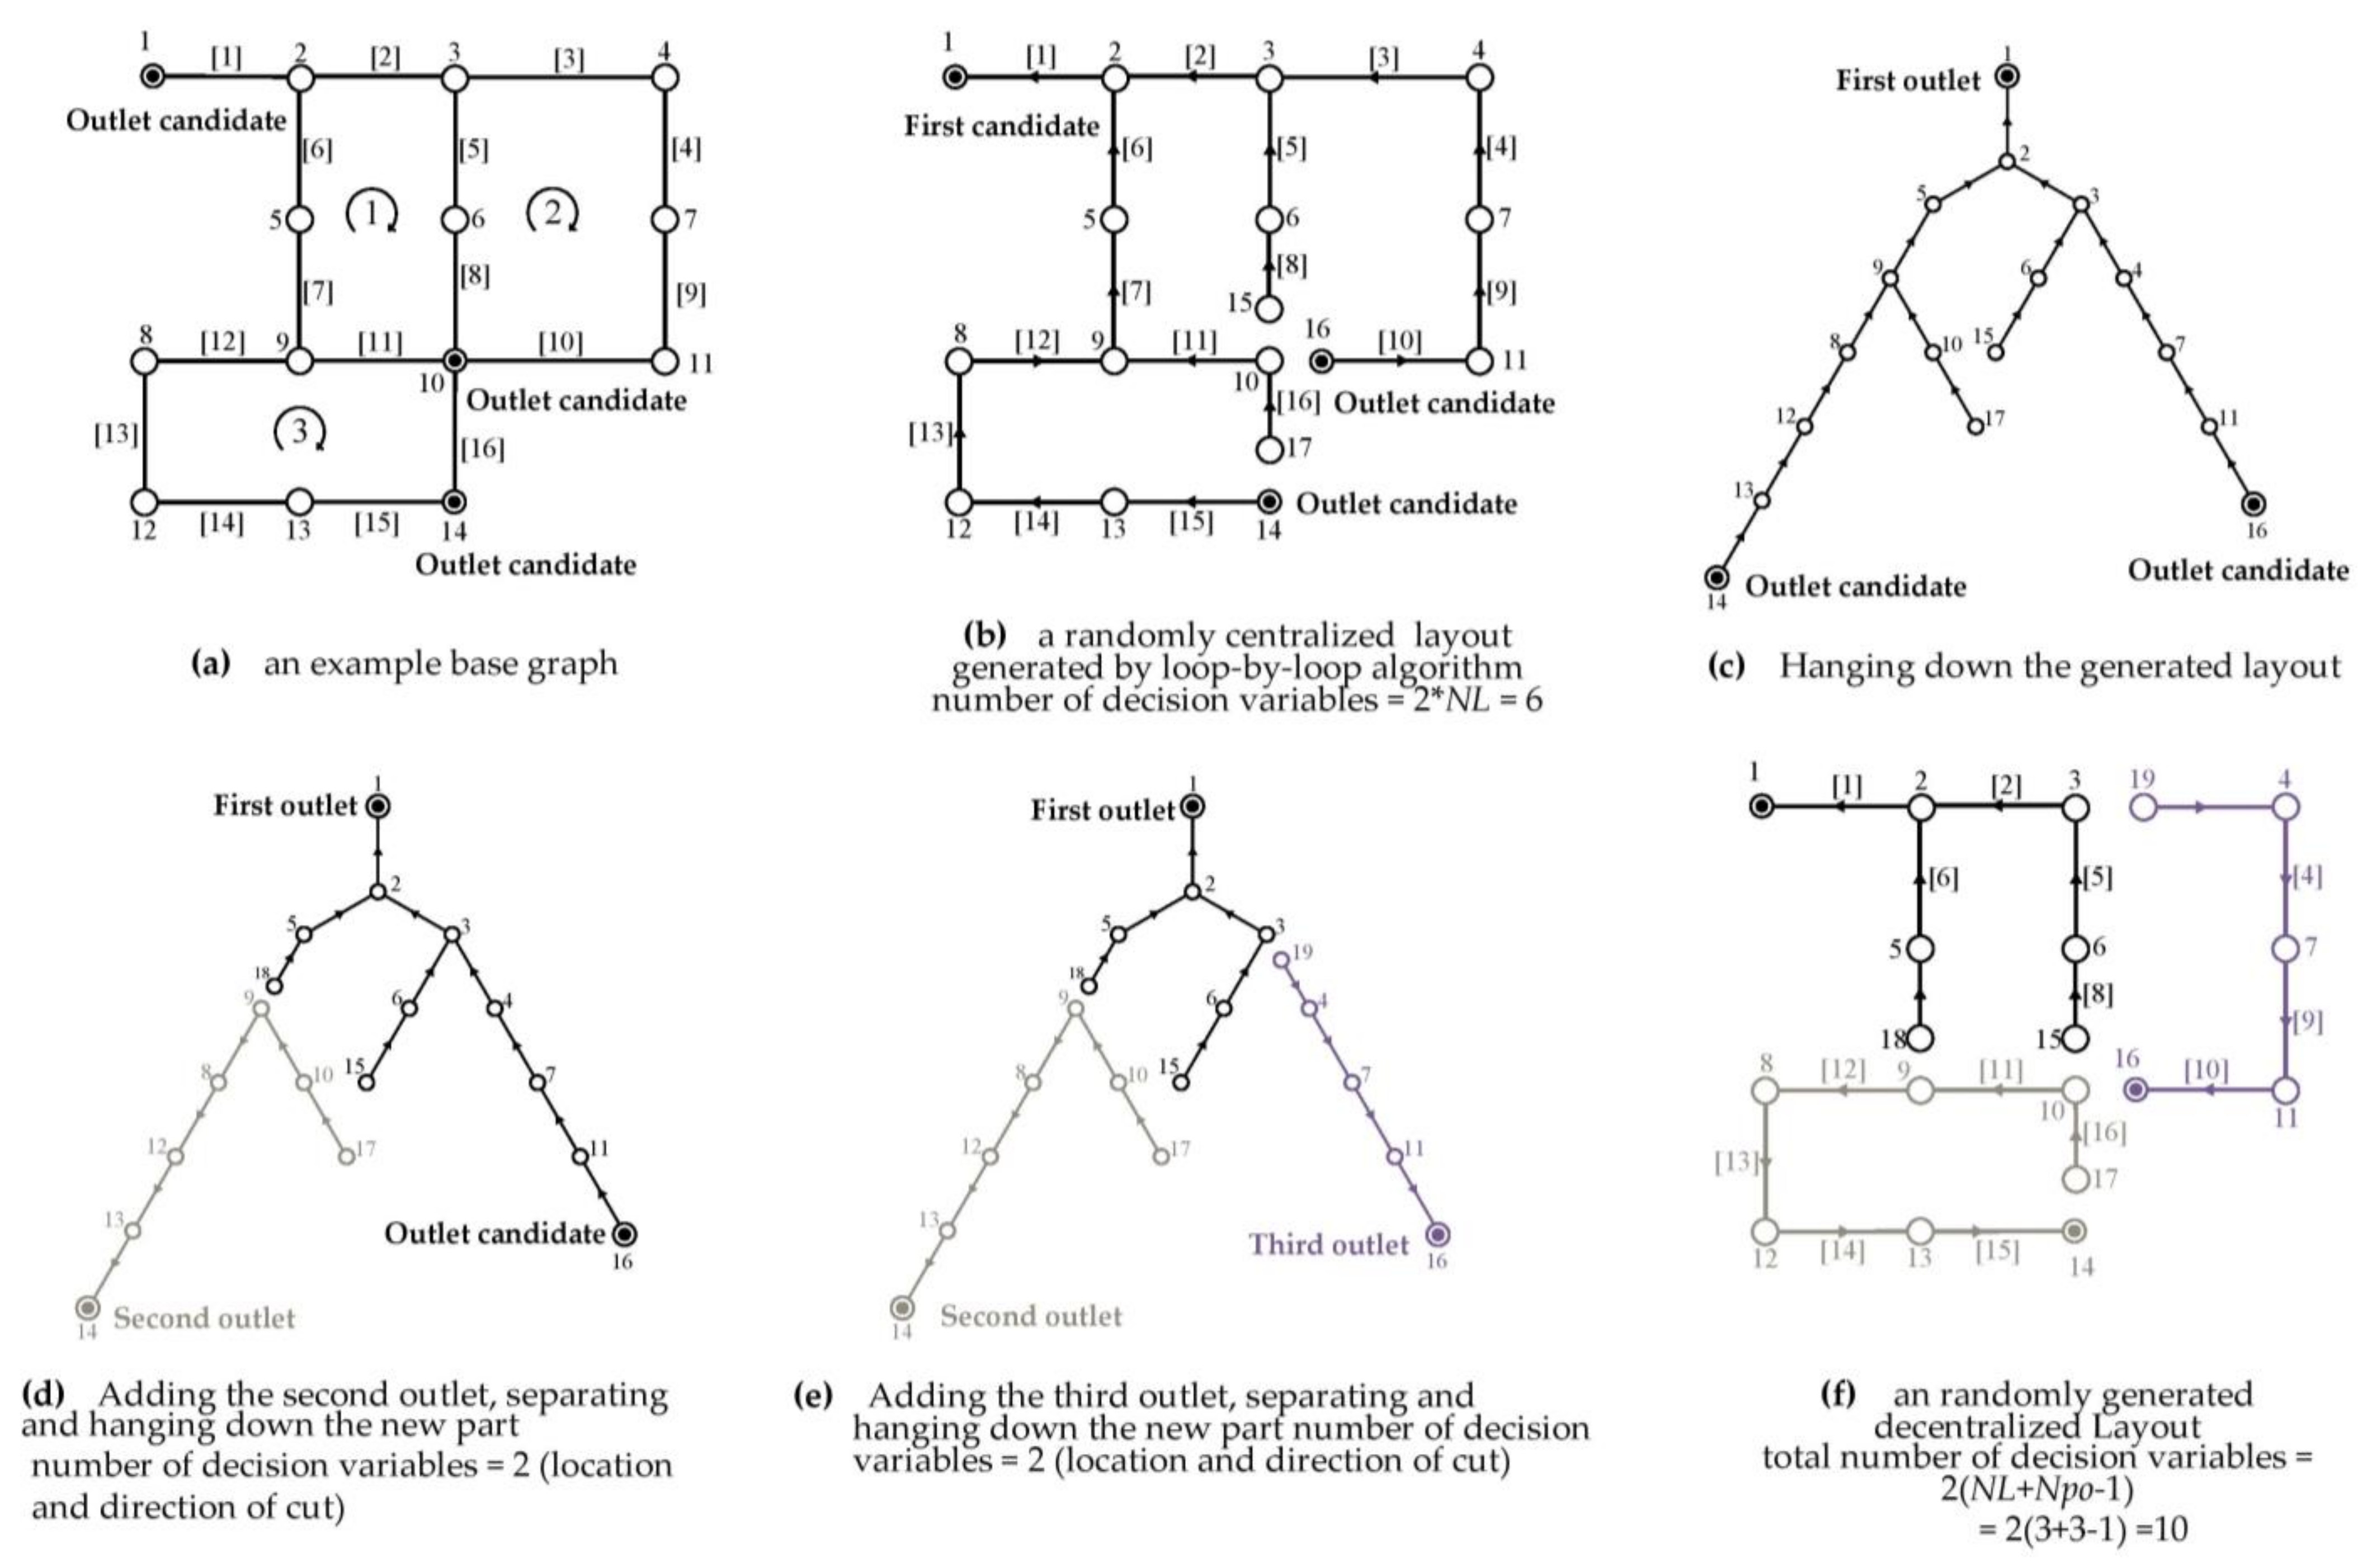
2.2. Layout Generator (Hanging Gardens Algorithm)

The layout of an UDS can mathematically be presented as a graph with specific properties. Graph theory is a branch of discrete mathematics that studies the principles of the mathematical expression of graphs. The hanging gardens algorithm, recently introduced by [24], is a sewer layout generator algorithm based on graph theory that can generate all possible sewer layouts and can explore different DCs. The hanging gardens algorithm starts with nominating several outlet candidates in the area under design and generating a centralized layout with an arbitrary outlet from the candidate list.
It uses loop-by-loop cutting to generate a feasible centralized layout. Then, other arbitrary outlets from the candidates are added to the generated layout considering the desired DC. The hanging gardens algorithm uses a graph-theory-based approach to assign parts of the layout to different outlets and to generate a decentralized layout. The algorithm needs 2 × N L + N P O 1 decision variables to generate one feasible layout. N L is the number of loops in the base graph, and N P O is the number of possible outlets. Figure 2 summarizes this procedure. For more in-depth information, please see [17] and [24].

2.3. Sizing the Network’s Components (Adaptive Algorithm)

The next step for the sewer network with a given layout generated by the hanging gardens algorithm is to size the sewers and pumps. Sewer diameters and slopes as well as the number and location of pumping stations must be designed in a way that satisfies all the hydraulic and technical constraints. To satisfy technical constraints like the telescopic pattern, minimum cover depth, maximum excavation depth, and minimum and maximum slope, the adaptive approach introduced in [14,34] was employed. This algorithm can automatically handle all constraints in designing sewage collection networks. Designing a sewage collection network is based on steady-state flow, but as discussed in the introduction, designing stormwater collection networks must be done using full 1D Saint Venant equations for more accurate results. When unsteady flow equations are used to simulate flow in the pipes, flow-related constraints such as keeping flow velocity between the minimum and maximum bounds or maintaining the proportional water depth under the specified maximum value are not satisfied. In this study, the flow-related constraints were handled using penalty functions during optimization, and the following constraints were automatically satisfied using the adaptive algorithm described in the next paragraph:
  • For each manhole, place upstream pipes at elevations higher than the downstream one;
  • choose sewer diameters from the commercial list;
  • maintain the minimum buried depth to prevent damages from the traffic loads and other surface activities; and
  • for each manhole, assign the outlet pipe’s diameter equal to or greater than the upstream inlet pipes’ (telescopic pattern).
If N P is the number of pipes in the UDS, the adaptive algorithm needs 3 N P decision variables to design the system hydraulically: one per pipe to assign the size of a pipe [D], one to assign the slope of it [S], and one that determines whether there is a lift pump station upstream of a pipe [P]. Herein, a vector having 3 N P members in the range of (0, 1) named as the normal design vector is introduced to the model. This vector indirectly represents pipe diameters (the first NP members) and slopes (the second N P members) and directly gives the pump indicators (the third N P members). For more in-depth information, please see [34]. Here, it is explained how the adaptive algorithm determines the pipe sizes and adaptively satisfies the telescopic pattern constraint. Suppose that d is a vector generated during optimization by the optimization engine (e.g., SA or BORG). The adaptive algorithm uses this vector ( d ) to assign the diameter of pipes using the following equation [34]:
D = D m i n + D m a x D m i n × d
where D m a x   is the largest commercially available size and D m i n   is determined concerning the telescopic pattern [20]. The size of each pipe must be equal to or larger than that of its upstream pipes, which mathematically means the following:
D m a x D U
where D U contains the pipe diameters connected to the upstream end of the pipe at hand. The hanging gardens algorithm calculates D U by simply using the layout connectivity matrix [24].
The layout generator algorithm and the adaptive algorithm can provide the essential materials for optimization. They need in total 2 N L + N P O 1 + 3 N P decision variables (generated by the optimization engine) to produce one structurally feasible (not necessarily hydraulically) UDS. The only remaining step is to define the objective function to evaluate different generated designs during the optimization. The next section introduces three simplified cost functions and one simple indicator to evaluate structural resilience.

2.4. Simplified Cost Functions (Proposed Indices)

2.4.1. Cost of UDSs

The cost of a UDS is dependent upon pipe diameters, slopes, and the specifications of pumping facilities. The pumps were disregarded in this study (for designing separate storm collection networks) as all layouts that required pumps were penalized. The pipe diameters and slopes are only known after the hydraulic design step but are dependent upon layout characteristics known during the layout design step. Therefore, assumptions about the cost of a UDS can be made based upon its layout characteristics. The proposed cost indices were developed based on hydraulic assumptions and sewer layout characteristics, such as pipe length and contributing area connected to each sewer. All assumptions were made to develop simplified indices further and to reduce the computational complexity of the UDS design optimization problem. Next, three simple cost indices are introduced: the length area index, the area diameter index, and the elevation rank index.

2.4.2. Elevation Rank Index (ERI)

Although it is difficult to determine the actual cost or resilience of a UDS layout without completing the hydraulic specifications, one method of determining relative cost and resilience is through heuristic techniques, which act to indirectly reach a desired goal (i.e., minimized construction cost and maximized resilience) through correlated relations of layout parameters with desired objectives. Villiers et al. (2017) [43] developed and proposed a list of 13 heuristic influence factors which can guide the optimization procedures towards UDS designs with these desired characteristics. Although decentralized layouts (layouts with multiple outlets) were not considered, it was concluded that three proposed factors, namely distance rank, elevation rank, and betweenness centrality, have a promising correlation with construction cost. They act by shaping different layout parameters to promote a reduction of the average diameter size of the system. Here, the elevation rank index (ERI) was adopted as the first simplified cost metric.
To calculate the elevation rank, all nodes or manholes were reordered from the lowest elevation to the highest elevation and then ranked accordingly, with the node with the lowest elevation ranked as 1 and so on. Elevation Rank Difference ( E R D ) is the difference between the ranks of connecting manholes, i.e., each pair of the upstream and downstream manhole, and is formulated in Equation (6). This will result in an N P of values. Then, the standard deviation of the E R D s is computed. The standard deviation of the E R D s is one component of the elevation rank index.
E R D i   =   U E R i     D E R i
where U E R i   is the elevation rank of the upstream manhole for pipe i and D E R i is the elevation rank of the downstream manhole for pipe i.
The standard deviation of E R D s has been proven to have a positive correlation with system construction cost. In other words, when the standard deviation of E R D s decreases, so does the construction cost [40].
Initially, elevation rank was not developed considering decentralized sewer system layouts. To adapt the index to decentralized UDS layouts, two additional values, S t d N n   and r , (Equation (7)) were incorporated into the E R I . S t d N n   is the standard deviation of the number of nodes (manholes) in each tree. This will inherently favor layouts with smaller DC, as layouts with fewer trees will have higher variances. r is the ratio of the number of nodes in the largest tree to the total number of nodes. This ratio promotes more evenly distributed trees with respect to the number of nodes per tree.
r =   N m a x N t o t a l
The fully proposed ER index is as follows:
E R I =   e S t d N n + S t d E R D + r
E R I can be used as a simple metric that would minimize the elevation rank of a sewer layout design and inherently the construction costs.

2.4.3. Length Area Index

The length area index ( L A I ) relates the relative system cost to the length and contributing area (the cumulative summation of the impervious area upstream, which drains to a pipe) of each pipe. This index was inspired by the index that Walters and Smith (1995) [44] proposed. Their simple objective function reflected the layout cost in terms of the length and concave function of the flow rate of each link. Here, as calculating the flow rate requires hydraulic simulation, it was proposed to use the cumulative impervious area connected to each pipe as a surrogate for the real flow rate. The length of pipes ( L i ) can be retrieved from the graph connectivity matrix (see [24]). The accumulated connected impervious area ( A c u m , i ) can be implicitly obtained using the layout configuration. The final index value is the sum of the length of each pipe by the square root of the contributing area (Equation (9)).
L A I = i = 1 N P L i A c u m , i

2.4.4. Area Diameter Index ( ADI )

The area diameter index ( A D I ) was formed from hydraulic assumptions based on the total impervious area connected to a single pipe. As mentioned previously, the cost of a pipe depends predominantly on its diameter, and diameter is dependent on runoff volume draining into the sewer. Consequently, larger contributing areas lead to larger pipe design diameters. Therefore, an estimation of the cost of each pipe can be obtained by relating the diameter of a single pipe directly to its contributing area. The contributing area can be easily calculated using the layout configuration and is usually already known when designing a sewer network. To overcome the inability to calculate the exact diameter during the layout design stage, a relation between the contributing area and design diameter was assumed.
To do that, for each available commercial pipe size, the rational method and a predefined design storm were used to calculate the maximum impervious area that can be connected to a pipe with a certain diameter and fixed slope. In such areas, satisfying the maximum excavation depth constraint and avoiding too many lift pump stations are very problematic tasks. Therefore, the minimum allowable slope is usually considered the optimal slope in flat areas [14,24]. By fixing the slope and using the rational method, a relation between the contributing area and design diameter can be obtained. Alternatively, the ADI can be calculated using a simple trial-and-error approach in SWMM. To do that, it is enough to construct a simple model with a sub-catchment and a pipe connected to it. Then, for each available commercial pipe with a fixed slope, the maximum area that can be drained by that can be determined. In this approach, it is possible to consider different types of design storms (e.g., Block Rain and Euler-type II) for a more robust design. The maximum area connected to each pipe size is the minimum calculated impervious area for all different design storms. It is also possible to perform a long-term simulation using historical precipitation data. After calculating the ADI using different types of design storms, each diameter and its corresponding impervious area as calculated are tested using the long-term simulation. If the capacity of the calculated diameter(s) is not enough, the maximum impervious area must be updated. The single events from historical data that cause flood problems in this step are extracted. For hydraulic optimization, any desirable type of design storm and several extreme events can be used. As our proposed approach (see Section 3.2) can significantly reduce the number of hydraulic simulations, this is not computationally problematic. However, doing that can increase the robustness of the final design meaningfully.
As explained before, it is easy to retrieve the length of pipes ( L i ) and the accumulated connected impervious area ( A c u m , i ) from the graph connectivity matrix. Upon having the length, diameter, and slope of each pipe, it is possible to estimate the construction cost of a generated layout using a cost function. An example of this method is given in Section 3.2.

2.4.5. Structural Resilience Index (SRI)

The maximum structural resilience is obtained when clogging in a sewer has the least effect on its upstream lines [45]. The structural resilience can be considered during the layout design problem, as will be explained in the following paragraphs. On the other hand, evaluation of the UDS’s functional resilience can only be done using hydraulic simulations (after designing the layout and sizing the sewers).
To quantify the clogging consequences in sewer networks, Haghighi and E. Bakhshipour (2015) [45] proposed a simple criterion that uses layout design properties. This criterion can indirectly evaluate how well a sewer system can react to sewage flow blockage. The principle adopted is that “Averagely, less population affected by a pipe clogging the sewer network would be more reliable”. If it is assumed that the probability of simultaneous sewer clogging in the network is extremely low, one-at-a-time clogging is adapted here to evaluate the resilience of the system’s performance. The resilience of each individual sewer ( R e s s t r , i ) is mathematically measured by the following index.
R e s s t r , i = 100 1 A c u m , i A t o t a l   %
where A c u m , i is the area connected to p i p e i and A t o t a l is the total area. For the entire network, the averaged resilience index ( R e s s t r u c t r u a l ) is measured as follows:
R e s s t r u c t r u a l = i = 1 N P R e s s t r , i N P   %
R e s s t r u c t r u a l can be very insensitive to large networks as there are a large number of upstream pipes with low discharges and high resilience. This restricts Equation (11) from comparing alternative layouts. To reduce this effect, for large sewer networks, using only sewers with a resilience index less than the threshold 90% was suggested [45]. Therefore, R e s s t r , i became R e s s t r , i < 90 % . This removed the upstream branches from consideration. As a result, this caused the layout optimization to be more sensitive to designing a layout with one main collector, which conveys high sewage discharges. To account for the effect of DC on the resilience of the layout, Bakhshipour et. al., (2020) [39] proposed Equation (12) to quantify the structural resilience.
S R I = N P R e s s t r , i > 90 % N P i = 1 N P R e s s t r , i < 90 % R e s s t r , i < 90 % N P R e s s t r , i < 90 % % 100 %   i f   N P R e s s t r , i < 90 % = 0
in which N P R e s s t r , i > 90 % is the number of pipes with structural resiliency more than 90% and N P R e s s t r , i < 90 % is the number of pipes with structural resiliency less than 90%. S R I is equal to zero when all sewers are connected to more than 10% percent of the total area ( N P R e s s t r , i > 90 % = 0 ) and 100% if each outfall is connected to up to 10% percent of the total area ( N P R e s s t r , i < 90 % = 0 ).

3. Results and Discussion
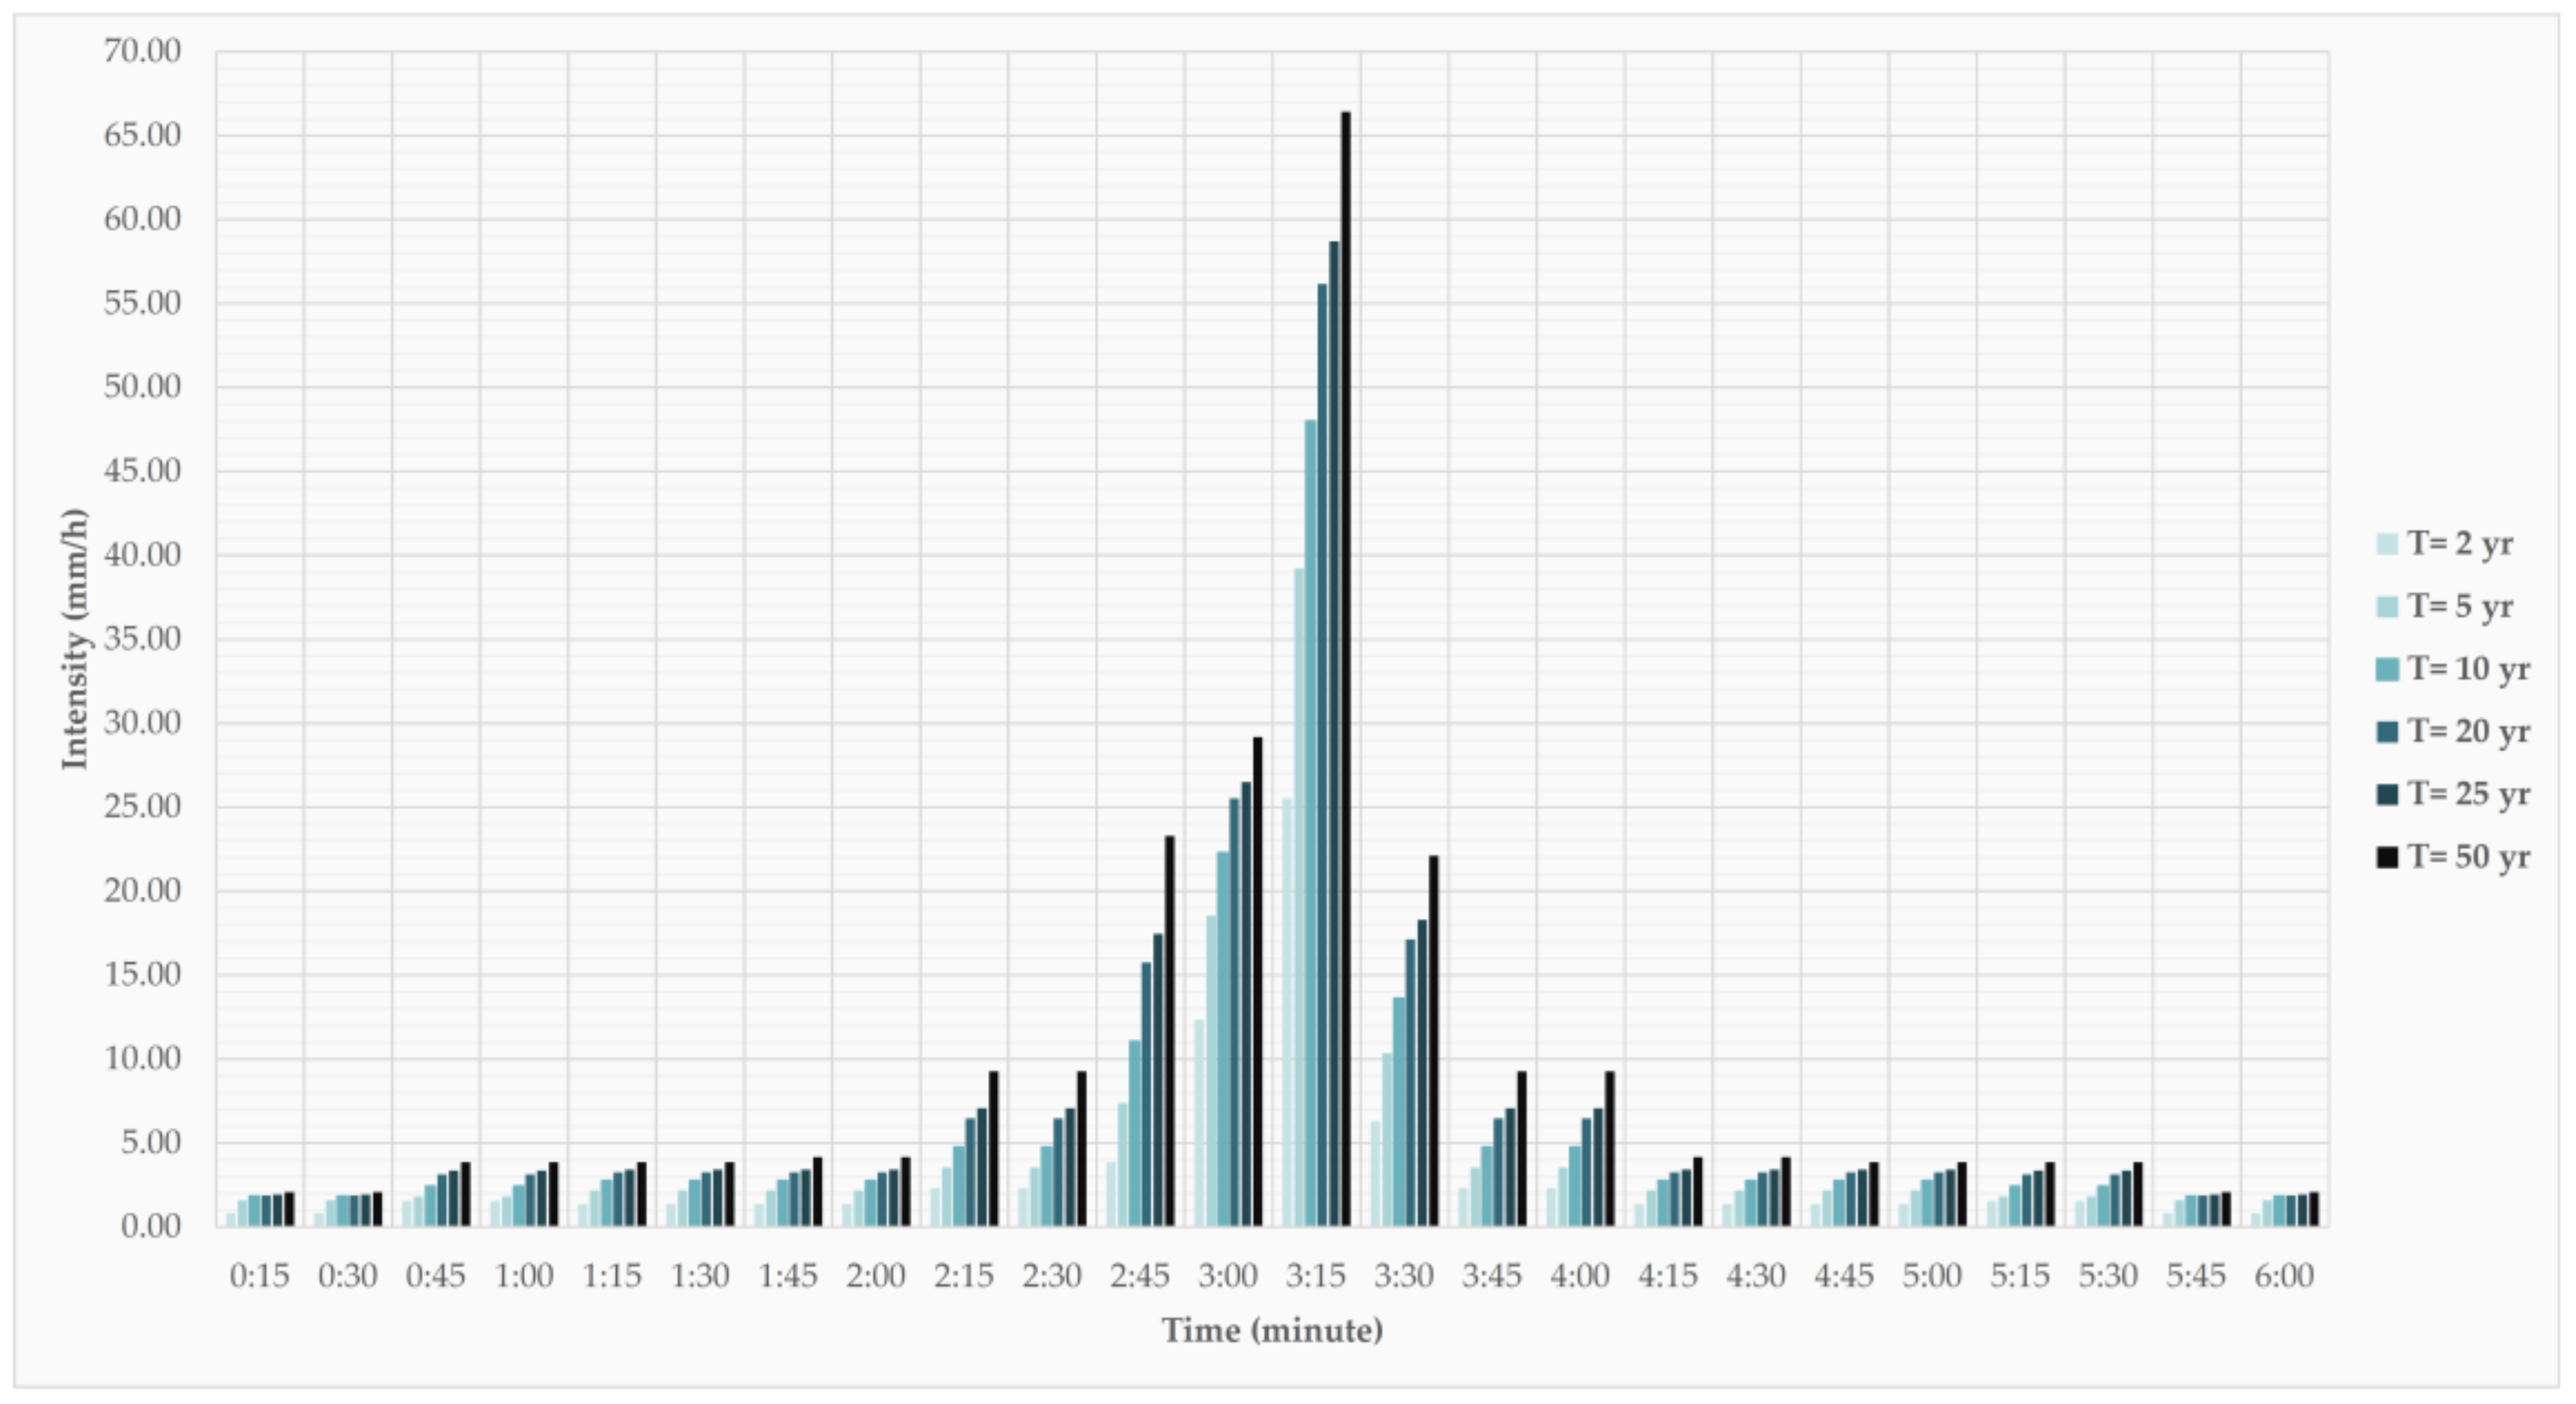
3.1. Case Study

To show how the proposed framework works, a real case study introduced in [46] was considered. The case study is a section of the city of Ahvaz, which is in the southwest of Iran. With a semi-dessert climate, entirely flat topography, and high groundwater level, Ahvaz is highly urbanized and has no stormwater management system (it has only an aged sewage collection system). Due to this, Ahvaz encounters urban flooding, which causes public inconvenience, and economic and environmental destruction. Due to the aforementioned issues and the unaffordable high initial investment costs, it is not feasible for the city to construct a centralized stormwater management system. Consequently, a decentralized separate stormwater collection system is the favored approach for this area.
The section of Ahvaz considered here is 500 ha, and the total area of the city is 18,500 ha. The base graph (Figure 3) has 181 sub-catchments (loops in the base graph), 530 pipes (total length of 75 km), and 10 candidate outlets [46]. The design constraints, including minimum slopes for different diameters, are presented in Table 1. As the minimum required slope for smaller diameters is larger than that for larger pipes, the optimal solution is implicitly related to both parameters. That means that the model sometimes prefers using larger diameters in some branches to avoid deep excavation and the lowering of all other parts of the system.
For the hydraulic simulations to design the sewers (second sub-problem), the dynamic wave approach in SWMM was used with a 5-year design storm (6-hour duration with a total depth of 30.2 mm) for a corresponding hydraulic simulation. Surcharging was allowed to use the full capacity of the pipe networks, but flooding was not acceptable. The maximum allowable velocity in the pipes was 4 m/s, and the maximum allowable excavation depth was fixed at 5 m. Layouts that would need lift stations or designs that cannot satisfy the abovementioned hydraulic constraints were automatically omitted using a penalty function.
For evaluating the functional resilience of the selected solutions in the last part of this study, design storms with return periods of 10, 20, 25, and 50 years were used (with respective total depths of 38.3, 46.7, 49.5, and 57.5, as shown in Figure 4). Besides the storm designs, the selected designs were evaluated using six months of recorded rainfall data from October 2018 to March 2019. This period was selected because of several extreme events that caused a lot of trouble in the area. Total precipitation during this period was 268.4 mm, which was 45% more than the 30-year average precipitation. The maximum precipitation in 24 hours during this period was 45.1 mm, which was close to the 10 years design storm but happened in 24 hours instead of 6 hours (Figure 5).

3.2. Analyzing the Cost Indices

To evaluate each cost index, a single objective optimization problem coupled with the simulated annealing algorithm was formulated. The problem was structured as two separate optimization problems: the first for layout design and the second for hydraulic design. The layout design was optimized considering a simple cost index, and then, the resulting optimized layout configuration was progressed to hydraulic optimization. The life cycle cost (LCC) was the objective function of the hydraulic optimization, which included the capital and operation and maintenance costs for a 30-year service life. The cost function used in this study can be found in [24]. The HGA was applied to optimize the layout, and then, the resulting layout was hydraulically designed using the adaptive algorithm and SWMM hydraulic simulation. This was done for the LAI, ADI, and ERI. After the hydraulic optimization was completed, each fully designed UDS was evaluated for average and maximum diameter and buried depth. Table 2 presents a summary of these parameters for each optimized design.
After evaluating the LCC, it can be said that the ADI was the superior simple cost index for this special case study. For further analysis, the LAI and ERI were skipped and only ADI and S R I were used. Table 3 presents the calculated AD parameters for the test case. To calculate the ADI for the test case, the 5-year design storm, the recorded precipitation (Figure 4 and Figure 5), and the approach described in Section 2.4.4 were used. For all commercial pipe sizes, the design storm was decisive in our case. Therefore, no single extreme event from the recorded time-series was taken here for hydraulic optimization.

3.3. Introducing the Fast MOO Framework

First, a MOO for the layout design was done with the objective functions of the ADI and S R I . As both ADI and S R I work only based on the graph connectivity matrix (inexpensive calculations), this step can be done quickly. Depending on how large the area under design is and how fast the computer, is it can take from minutes to hours.
In the next step, selected layouts from the resulting Pareto front were hydraulically optimized using the adaptive algorithm. The layout design optimization step was coupled with BORG MOEA, and the hydraulic optimization step was coupled with the simulated annealing algorithm (SA).
For hydraulic optimization, the results of the AD index (from Table 4) were used as the initial solution for the SA. This means that the maximum diameter ( D m a x ) was assigned for each pipe as the diameter suggested by the ADI, as presented in Equation (13). For example, if the total impervious area connected to a particular pipe in the network is 60 ha, the D m a x from Table 3 is equal to 1.2 m.
D = D m i n + D m a x D m i n × d D m a x = D A D I D c o m m e r c i a l = 0.25 ,   0.35 ,   0.4 ,   0.5 ,   0.63 ,   0.8 ,   1.0 ,   1.2 ,   1.5 ,   2.0  
where D A D I   is the size of each pipe in the network based on ADI and D m i n   is determined concerning the telescopic pattern and smallest commercially available size, as explained in Equations (4) and (5). D c o m m e r c i a l is the commercially available sizes for this case study. Doing this significantly reduces the search space and accelerates the optimization procedure. As the ADI assigns each pipe’s diameter based on the rational method and the minimum allowable slopes, it usually tends to overestimate the size of pipes. Therefore, by starting the optimization from the design that the ADI gives (set d   for all pipes in Equation (13)), the optimization is simplified from assigning the size of all pipes from a completely random space (that has many infeasible solutions) to reducing the size of pipes from a feasible near-optimal solution. In our test case, D m a x and D m i n for many upstream pipes were equal or there were only one or two alternatives for each of them. For example, considering the available diameters in Table 1, if D m a x that the ADI dictates for a particular pipe is equal to 0.4, the only available sizes for this pipe during optimization are 0.25, 0.35, and 0.4. Without including this, the SA must choose randomly from the whole list of available sizes (10 alternatives in Equation (13)). Considering the telescopic pattern, if the optimization engine assigns a larger diameter (the probability of doing that in this example is 70%), all pipes downstream will be overdesigned. This approach, not reducing the search space, significantly increases the number of iterations that the optimization engine needs for convergence.

3.4. MOO Results Analysis

The result of the MOO for the case study was a Pareto front containing 33 non-dominated layout alternatives, as can be seen in Figure 6.
Three promising layouts from the Pareto front were chosen to be hydraulically designed. The following three layout alternatives were chosen based upon their S R I and ADI value (LCC): (1) the least costly layout (design 1), (2) the most resilient layout (design 3), and (3) the median-valued alternative (design 2), almost directly in between the first two selected layouts (design 1 and design 3). The purple squares present the final cost of the selected layouts after hydraulic optimization with SA. The hydraulically optimized designs for designs 1–3 can be seen in Figure 7, Figure 8 and Figure 9. Figure 10 shows the optimal design suggested in Bakhshipour et. al. (2019) [24], where only the construction cost is considered as the objective function (design 4). In the following paragraphs, these designs are analyzed and compared in depth.

3.5. Analyzing the Computational Efficiency

The LCC of the first design is identical to the LCC of design 4. Recall that design 4 was obtained from Bakhshipour et. al., (2019) [24], where they formulated a single objective optimization (only for cost) using a simultaneously layout-hydraulic optimization method. In theory, the simultaneous single optimization might result in more promising solutions, but it did not here. The reason is that the predefined maximum number of iterations (100,000 in that study) might not be enough to reach the global optimization.
Optimizing the first scenario hydraulically using the proposed algorithm in the current framework only required approximately 1500 hydraulic simulations. Additionally, this design guaranteed a much higher structural resilience (85.3% instead of 79.9%). This proved that the proposed framework can integrate structural resilience into the UDS design procedure and can significantly reduce the computational burden. The number of required hydraulic simulations for the design 2 and 3 hydraulic optimizations were about 2000 and 2500, respectively. It can be said that, on average, the proposed framework reduced the computational effort by 98% for the hydraulic simulations in comparison with the framework proposed in Bakhshipour et. al (2019) [24] for this specific test case. The proposed framework in Bakhshipour et. al. (2020) [39] can also consider structural resilience, but for the same case study, it needed 800,000 hydraulic simulations until convergence. However, as they integrated other objectives like reliability, functional resilience, and sustainability and green-gray-blue infrastructures as decisions instead of pipe-only in this study, the results cannot be compared directly.
By looking carefully at the Pareto front, it can be interpreted that, although the hydraulic optimization step can reduce LCC, this reduction is not substantial. For the three selected layouts in this study, the average reduction was less than 5.0%, indicating that the ADI can generate near-optimal pipe diameters for designing stormwater collection systems in flat areas. Therefore, in such areas, the DC and layout configurations mostly determine the cost and structural resilience of the system. Notwithstanding, currently in the literature, most efforts in UDS optimization are focused on sizing the sewers. It can be concluded that it is possible to skip the second optimization (hydraulic design) for the preliminary design aims.

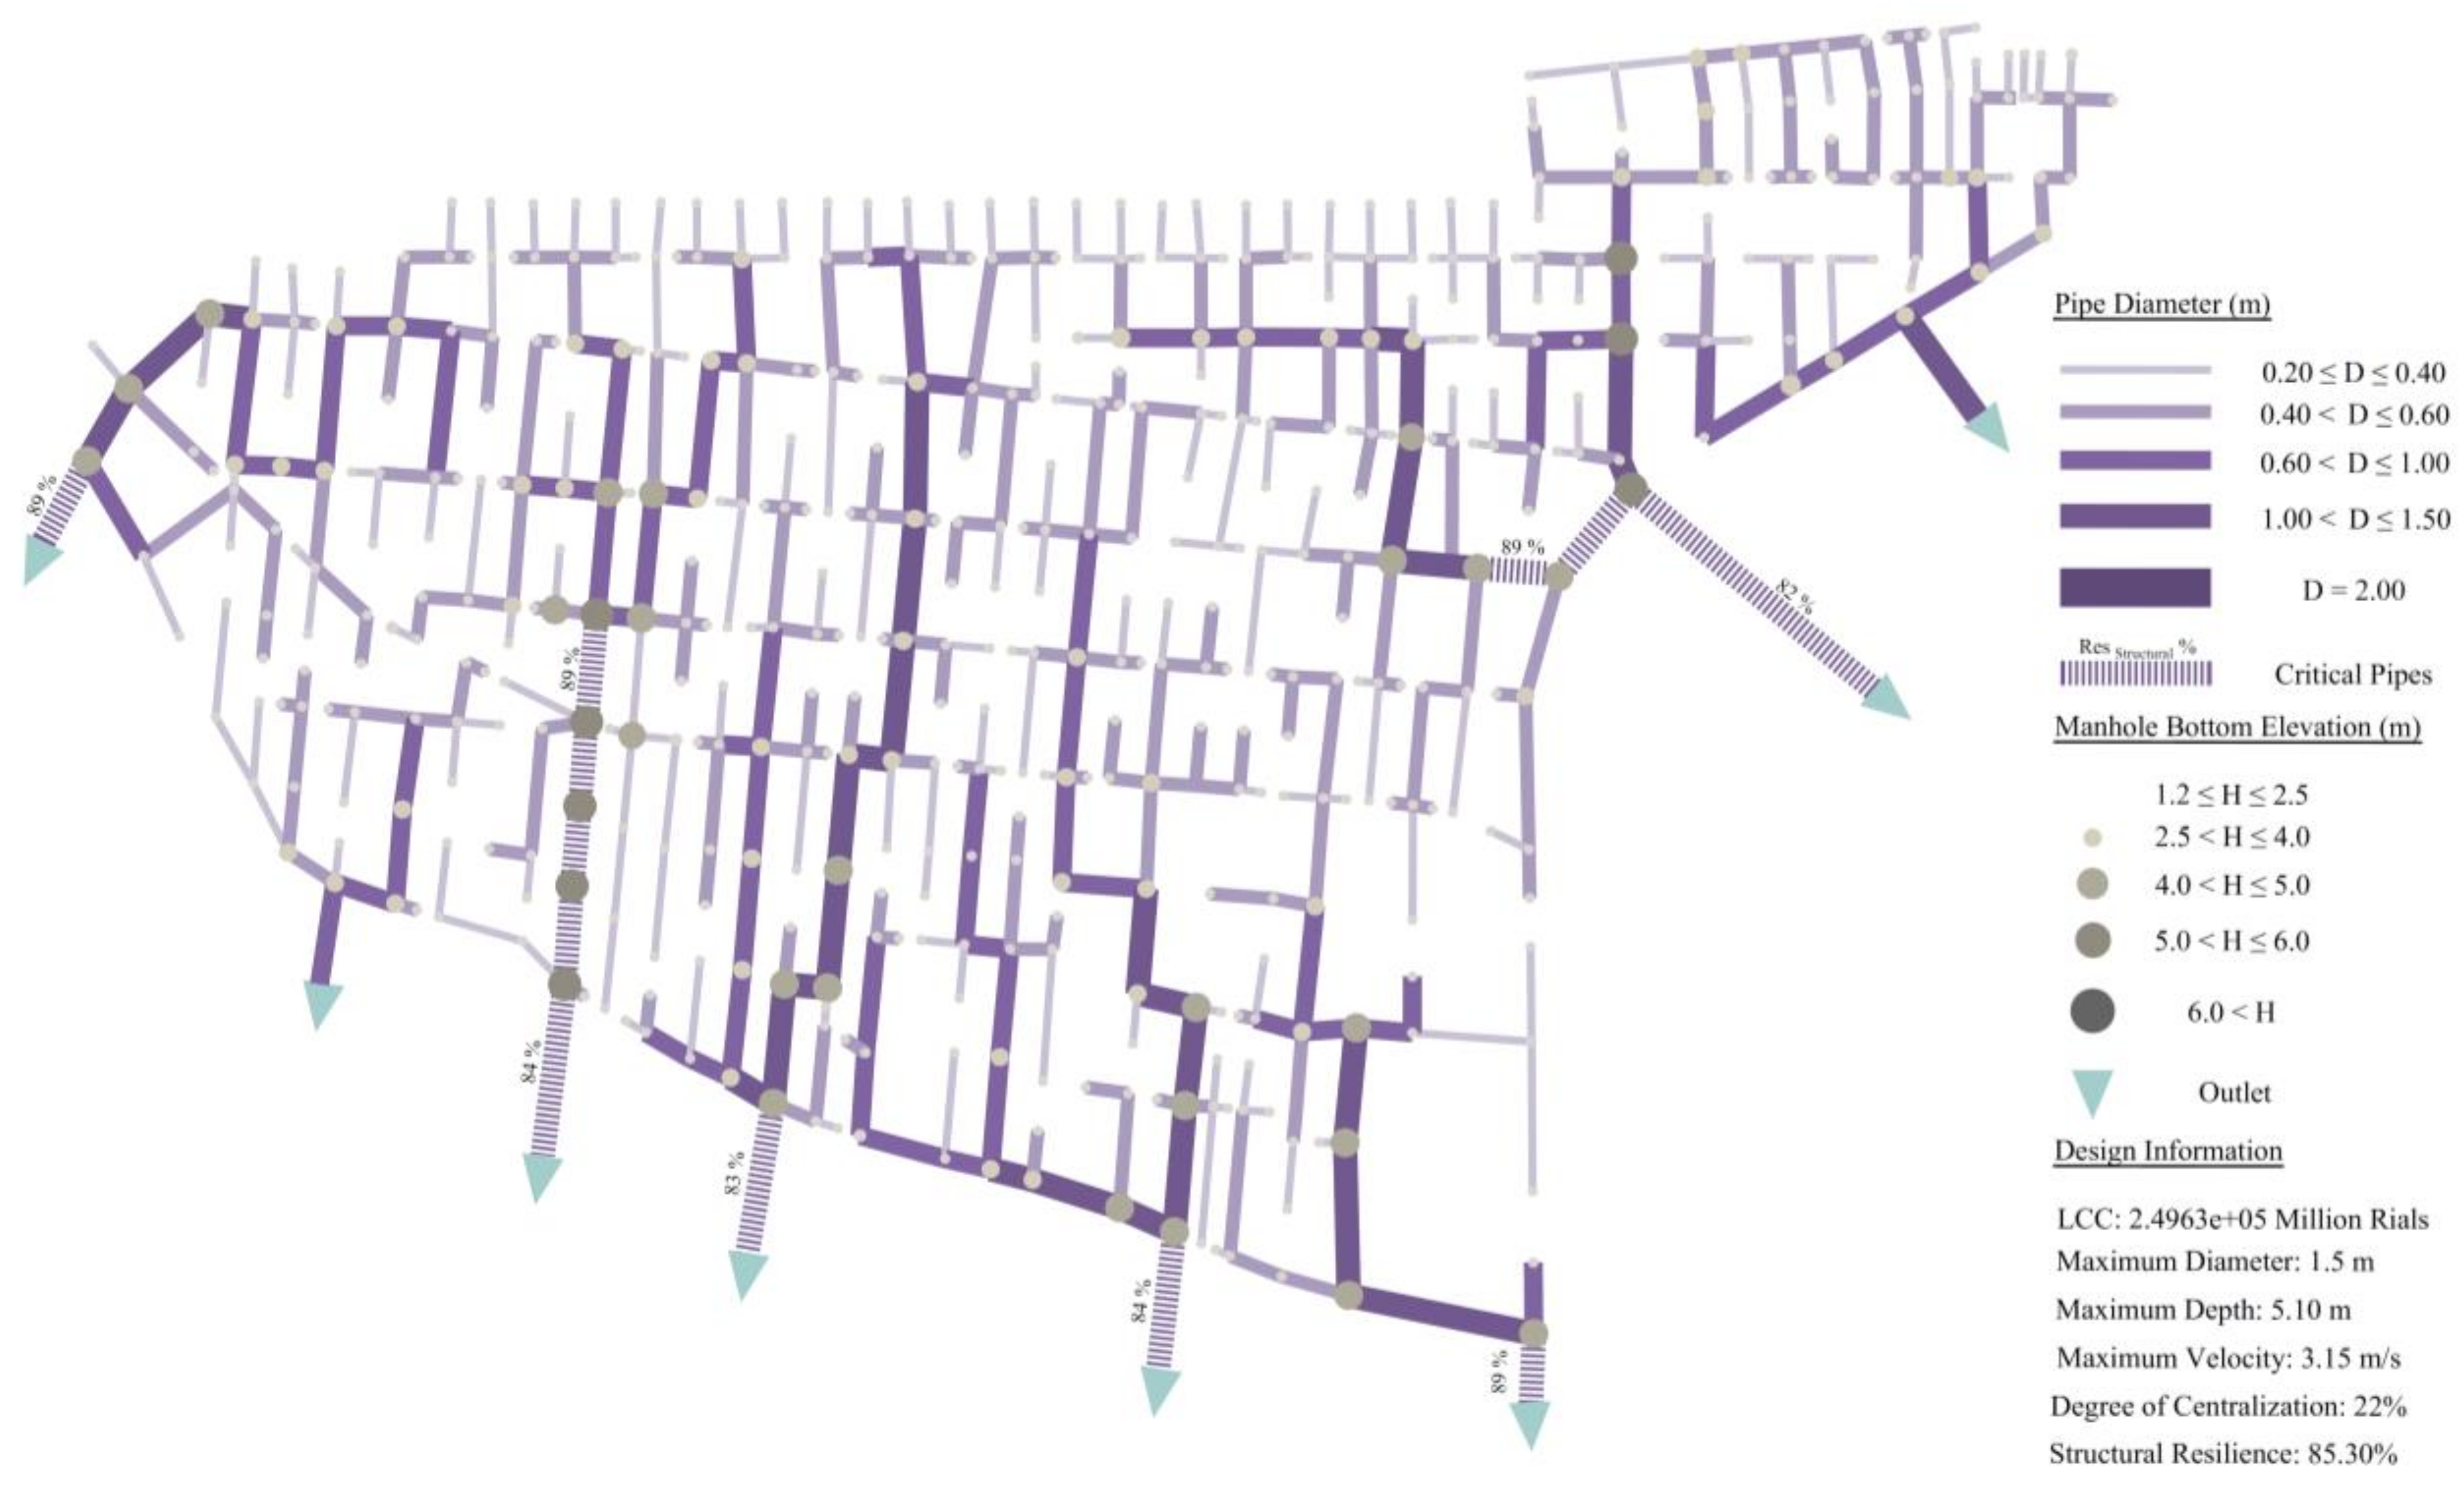
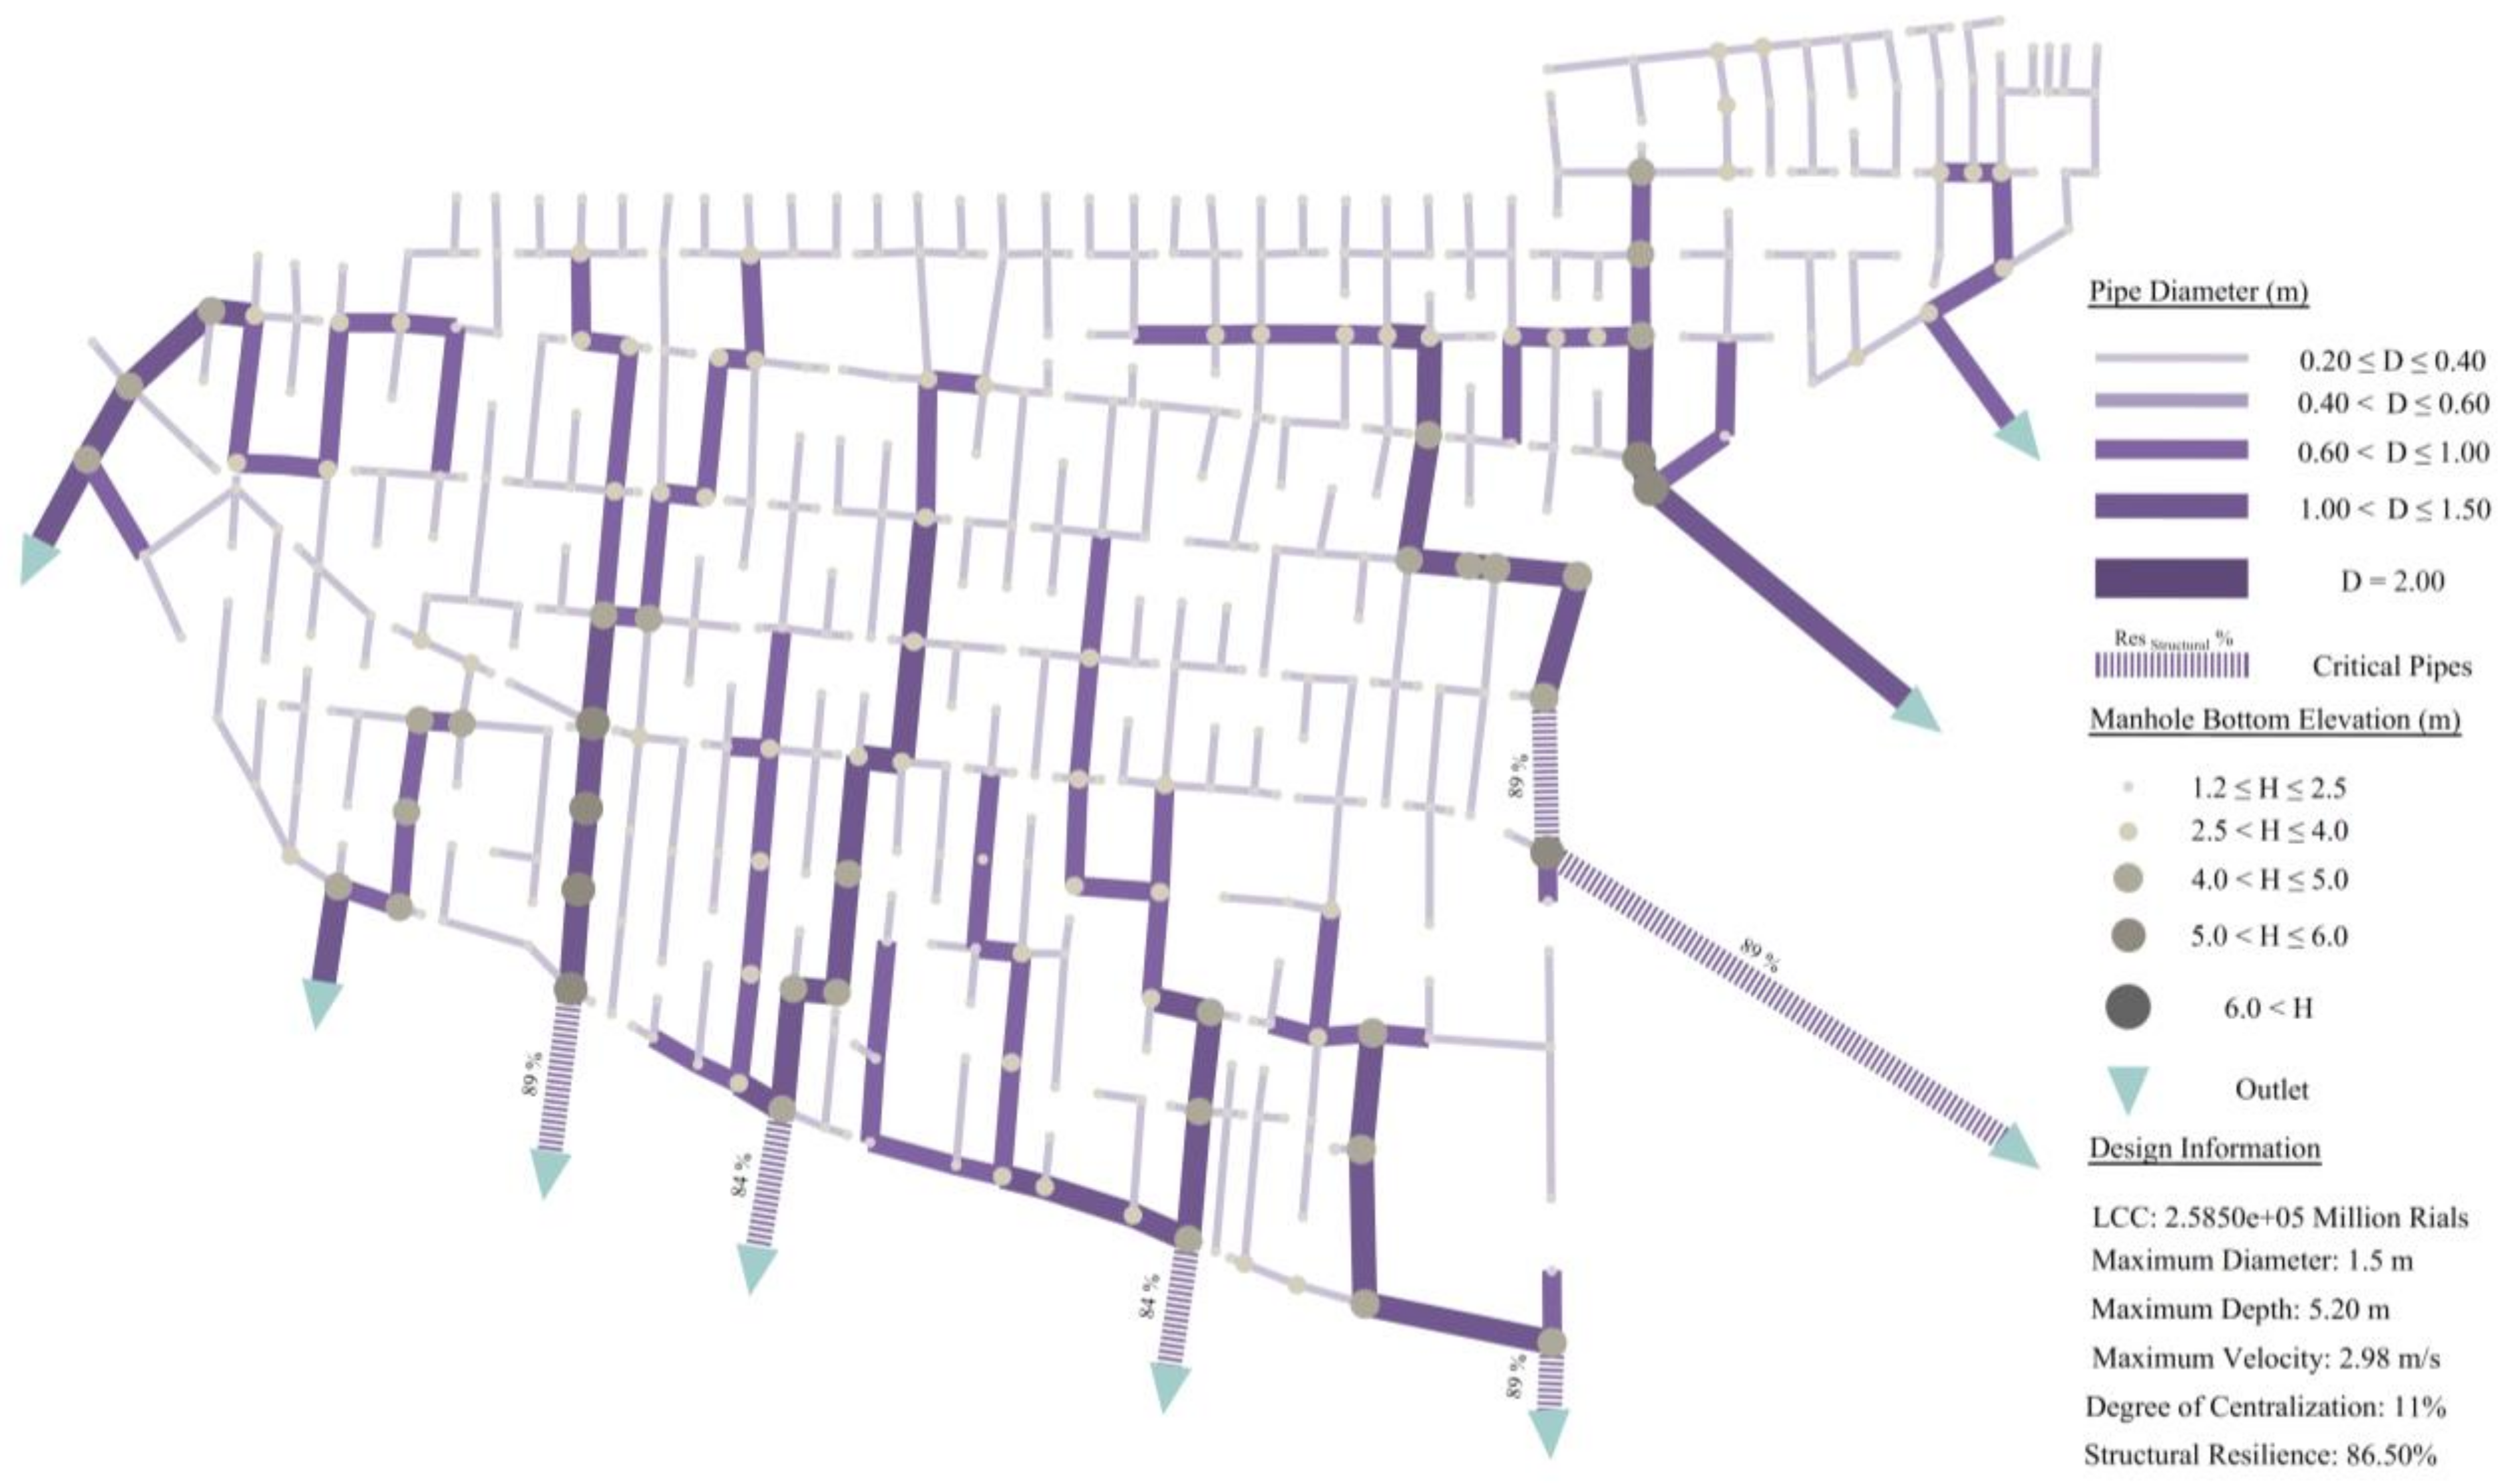
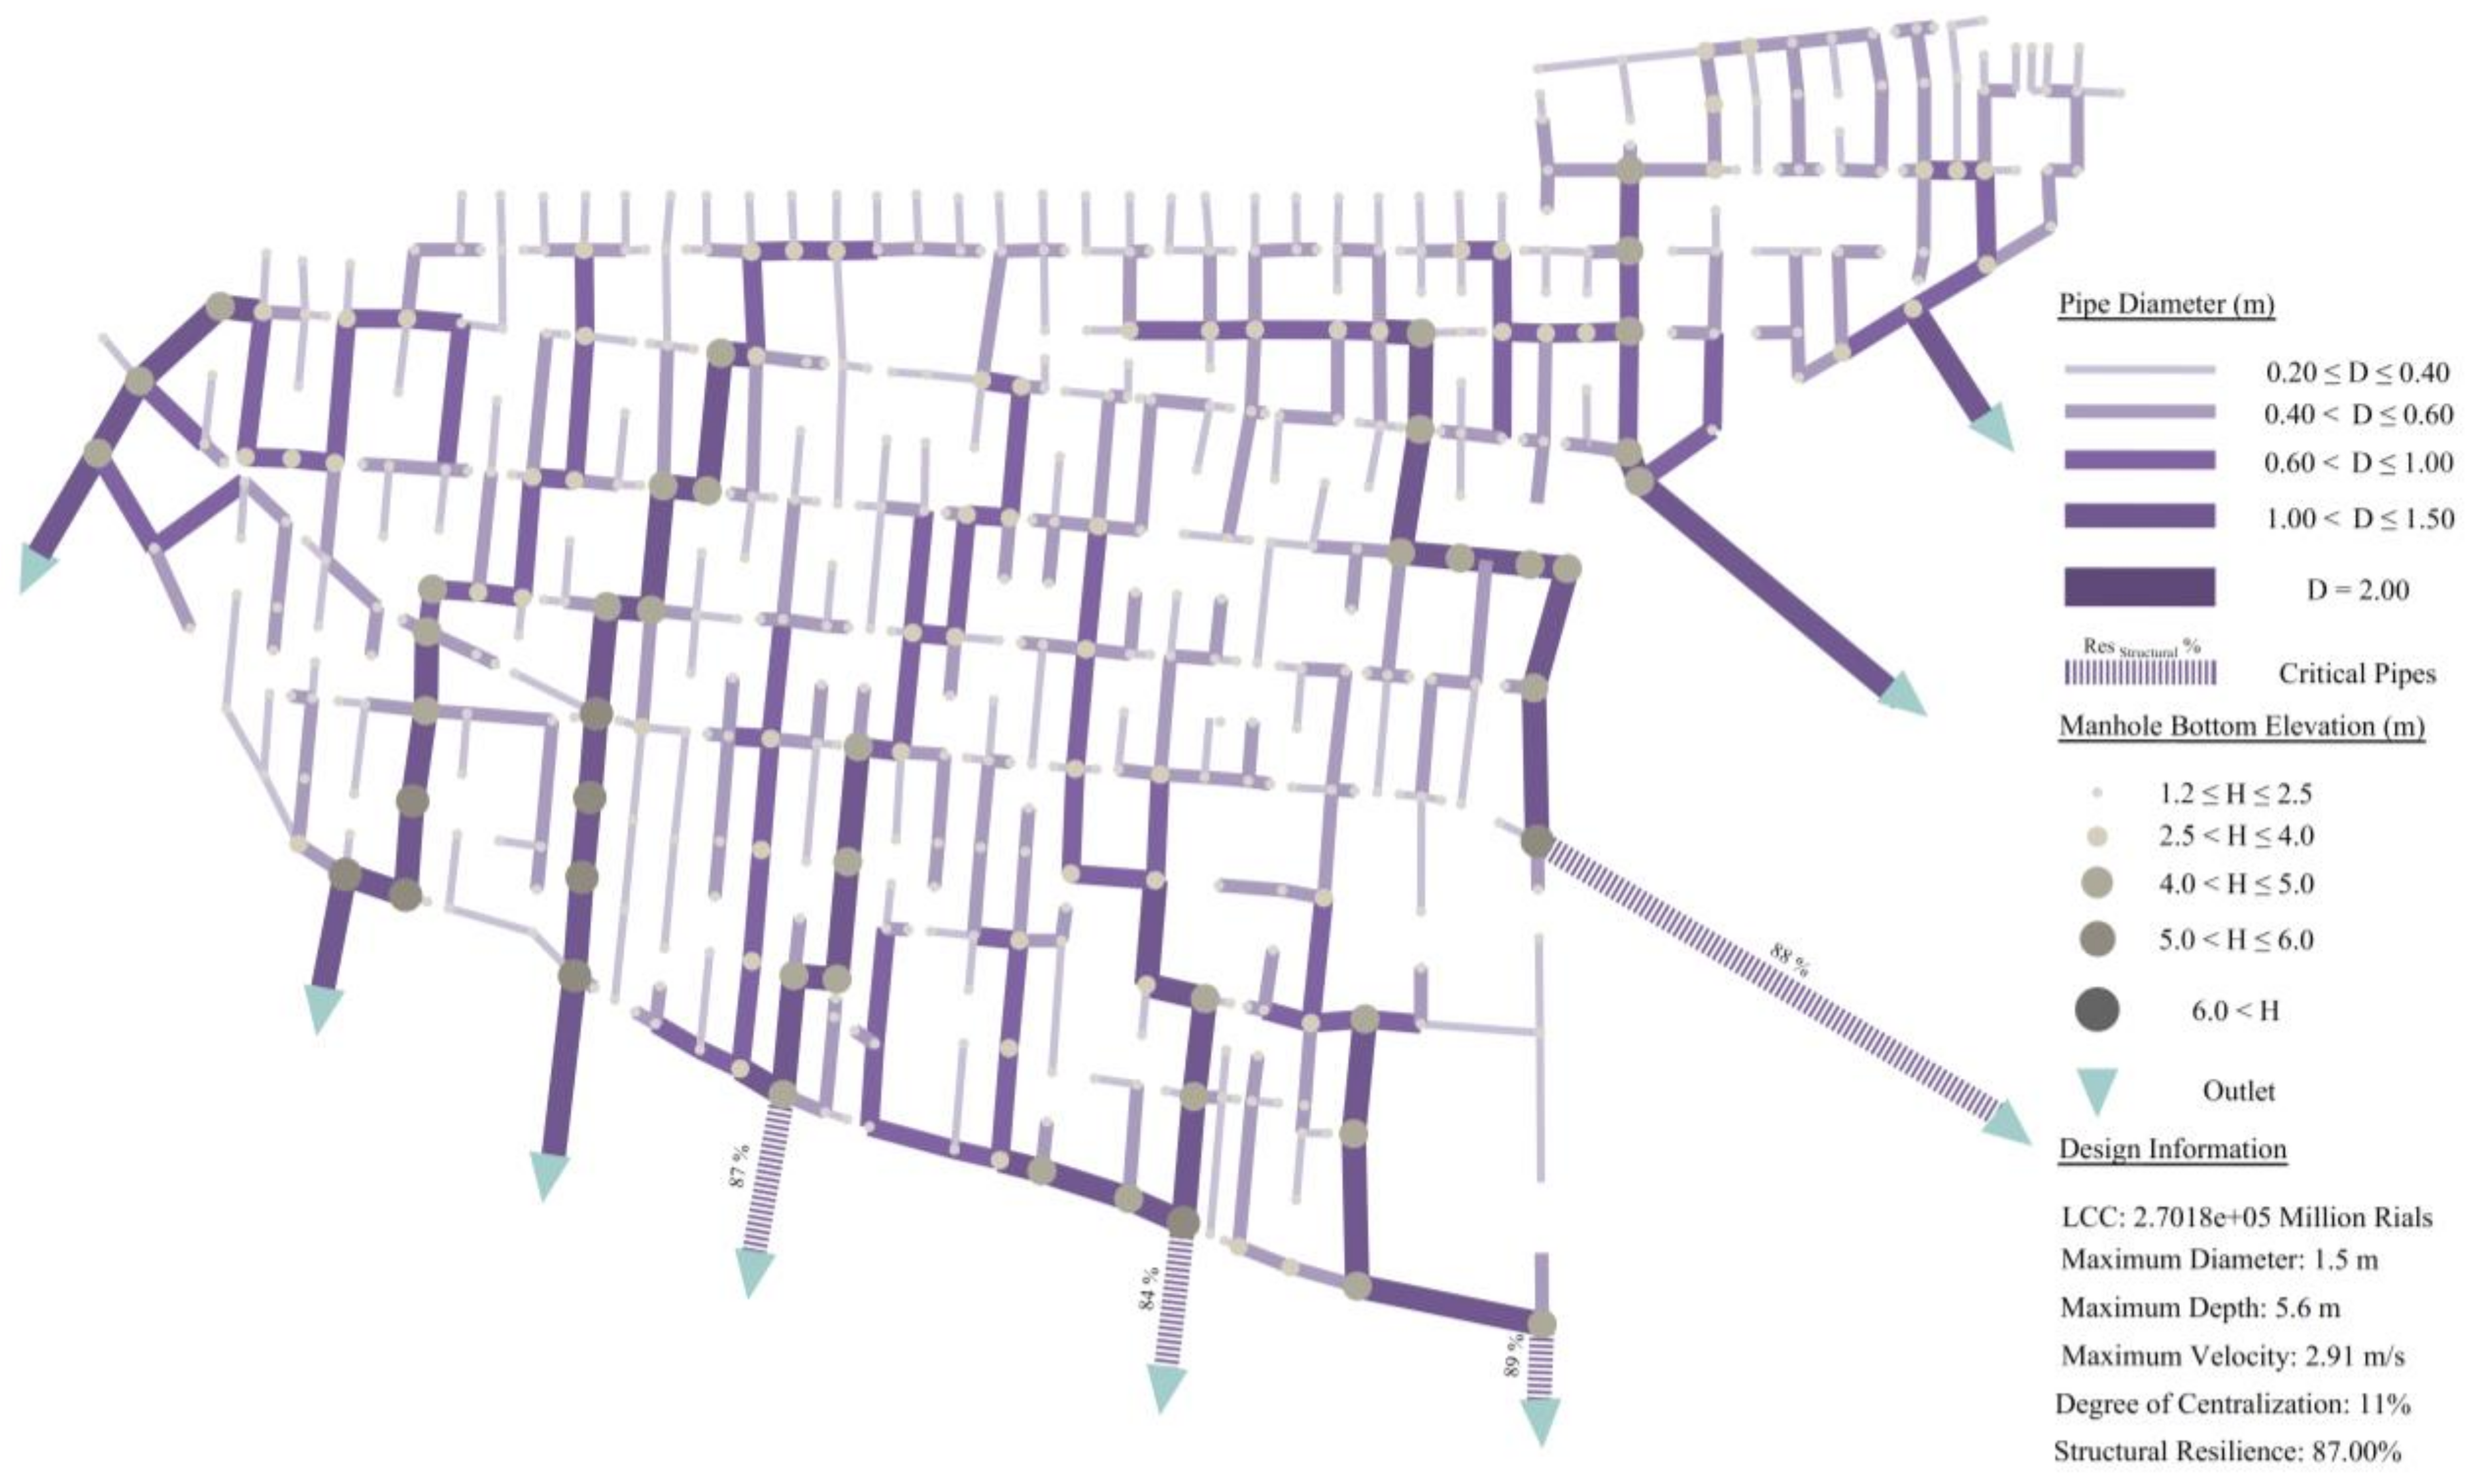
3.6. Analyzing the Structural Resilience

The Pareto front in Figure 6 shows the relationship between LCC and structural resilience that can be described using a polynomial equation. This trend remained identical for the selected layouts after hydraulic optimization (purple squares). To gain 1.2% structural resilience, from design 1 to design 2, 3.5% more capital investment is needed, and to gain only 0.5% more structural resilience, from design 2 to design 3, 4.5% more capital investment (8% in total) is required.
In Figure 7, Figure 8, Figure 9 and Figure 10, the structural resilience of critical pipes and outfalls is demonstrated. These values implicitly indicate the fraction of the total area not affected by any structural failure. Design 1 has a total of 12 pipes, with structural resilience of less than 90%. However, there are 21 critical elements in design 4 with very similar LCC. Comparing the structural resilience of designs 1 and 4 (85.3 and 79.9 in order) proves that the proposed index is a reliable indicator for assessing and optimizing the structural resilience of UDSs. The critical elements in designs 2 and 3 are very identical. Interestingly, in design 3, there is no critical non-outfall element. This shows that the total area is well distributed between different outlets and in each part of the system. The minimum structural resilience in both designs 2 and 3 is 84%, which is 10% more than that for design 4. Design 2 has only 1 non-outfall critical element very close to one outfall. Therefore, spending 4.5% more capital to go from design 2 to design 3 might not be reasonable.
Recognizing the critical points in the system can be crucial. By strengthening the system in these points, one can make sure no single structural failure can affect a predefined fraction of the serving area (10% percent in this study). Strengthening the weak points can be achieved by introducing extra elements to the system. For example, by connecting a manhole near a critical point using an extra sewer to a manhole in an adjacent part (tree).
Not considering the structural resilience in the design of the existing sewage collection network caused trouble for citizens during the fluvial flood that happened in winter 2020. The fluvial flood dramatically increased the groundwater level in the riversides. Although the existing levees successfully protected the city from a destructive flood, the infiltration of river water and groundwater into the pipes resulted in choking and blockage of several main collectors of the existing centralized sewage collection network (structural failure) in parts near the riversides. Consequently, several parts of the network, even far away from the riversides, were out of service. This led to spilling from the manholes and overflowing wastewater into the streets, resulting in serious disturbances and health problems for the citizens [29]. Therefore, by integrating the structural resilience in the design of new UDSs using the proposed framework, the adverse consequences of such extreme events can be lessened.

3.7. Analyzing the Functional Resilience

In the end, the relation between structural resilience and LCC with the functional resilience of UDSs was investigated. The functional resilience of each scenario was assessed with the hydraulic performance indicator ( H P I ) using equation 14 adopted from [47]. For this purpose, the design storms with the return periods of 10, 20, 25, and 50 years were used. The HPI is defined by the following [47]:
H P I = 100 × 1 V f l o o d i n g V r u n o f f                 %
where V f l o o d i n g is the total water that overflows the manholes and V r u n o f f is the total runoff volume. Table 5 summarizes this analysis. After an initial inspection of the functional resilience for all designs during each design storm, designs 1 to 3 seemed to exhibit similar values. Although when comparing both designs with similar DC (designs 2 and 3) it was noticed that design 2 has slightly higher functional resilience for each design storm despite its lower structural resilience, in general, no distinct relationship can be identified between structural resilience and functional resilience. However, it can be seen that design 1 (DC = 22%) and design 4 (DC = 33%) have lower functional resilience than designs 2 and 3 (DC = 11%). It can be concluded that functional resilience is more a function of DC and storage volume in the system than a function of structural resilience.
Also, the performance of each design was evaluated using the recorded time-series represented in Figure 5. The results showed that all design scenarios can handle this challenging time period without any flooding.

4. Summary and Conclusions

This study introduced a simplified multi-objective optimization framework for integrating structural resilience in the layout design of urban drainage systems (UDSs). First, three simplified cost indices that only use simple layout graph connectivity information were introduced. Next, each index was analyzed and evaluated using a single optimization method. Then, one superior simplified cost index (Area Diameter Index (ADI) in this study) was chosen. To integrate structural resilience in the design of UDSs, a multi-objective optimization of the layout design considering structural resilience and the ADI index was conducted. As both ADI and the structural resilience index work only based on the graph connectivity matrix (inexpensive calculations), this step was not computationally expensive. Finally, some selected layouts from the resulting Pareto front were hydraulically optimized using a novel computationally efficient approach based on the ADI. The key conclusions resulting from this research are as follows:
  • The proposed framework can significantly reduce the computational effort needed for optimizing UDSs in flat areas without a noticeable sacrifice in the quality of solutions. Doing that will increase the potential of the proposed frameworks and algorithms to be incorporated into commercial UDS design software to deliver more sustainable and less expensive designs.
  • As the number of required hydraulic simulations for optimizing sewers’ sizes was significantly reduced (98% in our test case), it is possible to consider different types of design storms and historical precipitation data within the proposed framework. That leads, apparently, to more robust designs.
  • The proposed indicator of structural resilience can reliably evaluate the structural resilience of different UDSs. Furthermore, the proposed framework can integrate structural resilience into the UDS design procedure.
  • In flat areas, the layout configuration and the degree of centralization are the most challenging and decisive problems for optimizing the UDSs, and sizing the sewers can be handled with simple optimization methods, as proposed in this study.
  • There is no apparent relation between functional and structural resilience in UDSs. Therefore, to build these different types of resilience into the system, completely different strategies must be taken.
Finally, based on this study’s results and a review of the existing literature in the field, we suggest the following Table 6 as a guideline to choose an appropriate approach for different UDS design optimization problems. Although the focus of the present study was on the design of separate stormwater collection networks, layout selection is very relevant to the design of combined and separate sewage collection systems. Other crucial criteria must be considered for sewage collection layout design. These include sulfide control, air and water pollution, and requirements for wastewater treatment, with all of its high costs of construction and operation associated. Sulfide control may be particularly important in large systems and/or hot climates. For more information, we highly encourage the readers to refer to [48,49]. It worth mentioning that the proposed model for sewage collection systems design in [15] included suitable pumping systems or lift stations and that the costs associated with WWTPs is deterministic, efficient, and very fast, at least when the hydraulic simulations in unsteady flow are not considered or coupled with the design hydraulic model in steady uniform flow.

Author Contributions

Conceptualization, A.E.B. and W.N.; methodology, A.E.B., A.H., and W.N.; programming, A.E.B. and J.H.; writing—original draft preparation, A.E.B. and J.H.; writing—review and editing, U.D., A.H., and W.N.; supervision, U.D. and W.N. All authors have read and agreed to the published version of the manuscript.

Funding

This study was supported by BMBF-DAAD Sustainable Water Management: Study Scholarships and Research Grants 2015 (57156376).

Institutional Review Board Statement

Not applicable.

Informed Consent Statement

Not applicable.

Data Availability Statement

The data presented in this study are available on request from the corresponding author.

Conflicts of Interest

The authors declare no conflict of interest.

References

  1. Butler, D.; Davies, J. Urban Drainage, 3rd ed.; CRC Press: London, UK, 2011; ISBN 9781315272535. [Google Scholar]
  2. Haghighatafshar, S.; Nordlöf, B.; Roldin, M.; Gustafsson, L.G.; Jansen, J.L.C.; Jönsson, K. Efficiency of blue-green stormwater retrofits for flood mitigation–Conclusions drawn from a case study in Malmö, Sweden. J. Environ. Manag. 2018, 207, 60–69. [Google Scholar] [CrossRef] [PubMed]
  3. Diogo, A.F.; Barros, L.T.; Santos, T.J.; Temido, J.S. An effective and comprehensive model for optimal rehabilitation of separate sanitary sewer systems. Sci. Total. Environ. 2018, 612, 1042–1057. [Google Scholar] [CrossRef] [PubMed]
  4. Butler, D.; Farmani, R.; Fu, G.; Ward, S.E.; Diao, K.; Astaraie-Imani, M. A New Approach to Urban Water Management: Safe and Sure. Procedia Eng. 2014, 89, 347–354. [Google Scholar] [CrossRef] [Green Version]
  5. Dong, X.; Guo, H.; Zeng, S. Enhancing future resilience in urban drainage system: Green versus grey infrastructure. Water Res. 2017, 124, 280–289. [Google Scholar] [CrossRef] [PubMed]
  6. Sweetapple, C.; Fu, G.; Butler, D. Reliable, Robust, and Resilient System Design Framework with Application to Wastewater-Treatment Plant Control. J. Environ. Eng. 2017, 143, 04016086. [Google Scholar] [CrossRef]
  7. Mugume, S.N.; Gomez, D.E.; Fu, G.; Farmani, R.; Butler, D. A global analysis approach for investigating structural resilience in urban drainage systems. Water Res. 2015, 81, 15–26. [Google Scholar] [CrossRef] [Green Version]
  8. Mugume, S.N.; Butler, D. Evaluation of functional resilience in urban drainage and flood management systems using a global analysis approach. Urban Water J. 2016, 14, 727–736. [Google Scholar] [CrossRef]
  9. Eggimann, S.; Truffer, B.; Maurer, M. To connect or not to connect? Modelling the optimal degree of centralisation for wastewater infrastructures. Water Res. 2015, 84, 218–231. [Google Scholar] [CrossRef] [Green Version]
  10. Eggimann, S. The Optimal Degree of Centralisation for Wastewater Infrastructures. A Model-Based Geospatial Economic Analysis. Ph.D. Thesis, ETH, Zurich, Switzerland, 2016. [Google Scholar]
  11. Spuhler, D.; Scheidegger, A.; Maurer, M. Generation of sanitation system options for urban planning considering novel technologies. Water Res. 2018, 145, 259–278. [Google Scholar] [CrossRef] [Green Version]
  12. McDonald, W.M. Drones in urban stormwater management: A review and future perspectives. Urban Water J. 2019, 16, 505–518. [Google Scholar] [CrossRef]
  13. McDonald, W.M.; Naughton, J.B. Stormwater management actions under regulatory pressure: A case study of southeast Wisconsin. J. Environ. Plan. Manag. 2019, 62, 2273–2294. [Google Scholar] [CrossRef]
  14. Haghighi, A.; Bakhshipour, A.E. Deterministic Integrated Optimization Model for Sewage Collection Networks Using Tabu Search. J. Water Resour. Plan. Manag. 2015, 141, 04014045. [Google Scholar] [CrossRef]
  15. Diogo, A.F.; Walters, G.A.; De Sousa, E.R.; Graveto, V.M. Three-Dimensional Optimization of Urban Drainage Systems. Comput. Civ. Infrastruct. Eng. 2000, 15, 409–425. [Google Scholar] [CrossRef]
  16. Diogo, A.F.; Graveto, V.M. Optimal Layout of Sewer Systems: A Deterministic versus a Stochastic Model. J. Hydraul. Eng. 2006, 132, 927–943. [Google Scholar] [CrossRef]
  17. Haghighi, A. Loop-by-Loop Cutting Algorithm to Generate Layouts for Urban Drainage Systems. J. Water Resour. Plan. Manag. 2013, 139, 693–703. [Google Scholar] [CrossRef]
  18. Haghighi, A. Intelligent Optimization of Wastewater Collection Networks. In Intelligence Systems in Environmental Man-agement: Theory and Applications; Springer: Berlin/Heidelberg, Germany, 2017; pp. 41–65. [Google Scholar]
  19. Tekeli, S.; Belkaya, H. Computerized Layout Generation for Sanitary Sewers. J. Water Resour. Plan. Manag. 1986, 112, 500–515. [Google Scholar] [CrossRef]
  20. Li, G.; Matthew, R.G.S. New Approach for Optimization of Urban Drainage Systems. J. Environ. Eng. 1990, 116, 927–944. [Google Scholar] [CrossRef]
  21. Moeini, R.; Afshar, M.H. Arc Based Ant Colony Optimization Algorithm for optimal design of gravitational sewer networks. Ain Shams Eng. J. 2017, 8, 207–223. [Google Scholar] [CrossRef] [Green Version]
  22. Moeini, R.; Afshar, M.H. Layout and size optimization of sanitary sewer network using intelligent ants. Adv. Eng. Softw. 2012, 51, 49–62. [Google Scholar] [CrossRef]
  23. Duque, N.; Duque, D.; Aguilar, A.; Saldarriaga, J. Sewer Network Layout Selection and Hydraulic Design Using a Mathematical Optimization Framework. Water 2020, 12, 3337. [Google Scholar] [CrossRef]
  24. Bakhshipour, A.E.; Bakhshizadeh, M.; Dittmer, U.; Haghighi, A.; Nowak, W. Hanging Gardens Algorithm to Generate Decentralized Layouts for the Optimization of Urban Drainage Systems. J. Water Resour. Plan. Manag. 2019, 145, 04019034. [Google Scholar] [CrossRef]
  25. Alves, A.; Gersonius, B.; Kapelan, Z.; Vojinovic, Z.; Sanchez, A. Assessing the Co-Benefits of green-blue-grey infrastructure for sustainable urban flood risk management. J. Environ. Manag. 2019, 239, 244–254. [Google Scholar] [CrossRef] [PubMed]
  26. Dhakal, K.P.; Chevalier, L.R. Urban Stormwater Governance: The Need for a Paradigm Shift. Environ. Manag. 2016, 57, 1112–1124. [Google Scholar] [CrossRef]
  27. Goncalves, M.L.R.; Zischg, J.; Rau, S.; Sitzmann, M.; Rauch, W.; Kleidorfer, M. Modeling the Effects of Introducing Low Impact Development in a Tropical City: A Case Study from Joinville, Brazil. Sustainability 2018, 10, 728. [Google Scholar] [CrossRef] [Green Version]
  28. Barron, N.J.; Kuller, M.; Yasmin, T.; Castonguay, A.C.; Copa, V.; Duncan-Horner, E.; Gimelli, F.M.; Jamali, B.; Nielsen, J.S.; Ng, K.; et al. Towards water sensitive cities in Asia: An interdisciplinary journey. Water Sci. Technol. 2017, 76, 1150–1157. [Google Scholar] [CrossRef] [Green Version]
  29. Porse, E. Stormwater Governance and Future Cities. Water 2013, 5, 29–52. [Google Scholar] [CrossRef] [Green Version]
  30. Sitzenfrei, R.; Möderl, M.; Rauch, W. Assessing the impact of transitions from centralised to decentralised water solutions on existing infrastructures–Integrated city-scale analysis with VIBe. Water Res. 2013, 47, 7251–7263. [Google Scholar] [CrossRef] [PubMed] [Green Version]
  31. Reyes-Silva, J.D.; Bangura, E.; Helm, B.; Benisch, J.; Krebs, P. The Role of Sewer Network Structure on the Occurrence and Magnitude of Combined Sewer Overflows (CSOs). Water 2020, 12, 2675. [Google Scholar] [CrossRef]
  32. Hesarkazzazi, S.; Hajibabaei, M.; Reyes-Silva, J.D.; Krebs, P.; Sitzenfrei, R. Assessing Redundancy in Stormwater Structures Under Hydraulic Design. Water 2020, 12, 1003. [Google Scholar] [CrossRef] [Green Version]
  33. Fathy, I.; Abdel-Aal, G.M.; Fahmy, M.R.; Fathy, A.; Zelenakova, M. The Negative Impact of Blockage on Storm Water Drainage Network. Water 2020, 12, 1974. [Google Scholar] [CrossRef]
  34. Haghighi, A.; Bakhshipour, A.E. Optimization of Sewer Networks Using an Adaptive Genetic Algorithm. Water Resour. Manag. 2012, 26, 3441–3456. [Google Scholar] [CrossRef]
  35. Diogo, A.F.; Carmo, J.S.A.D. Peak Flows and Stormwater Networks Design—Current and Future Management of Urban Surface Watersheds. Water 2019, 11, 759. [Google Scholar] [CrossRef] [Green Version]
  36. Price, R.K.; Vojinovic, Z. Urban Hydroinformatics. Data, Models and Decision Support for Integrated Urban Water Management; IWA Publishing: London, UK, 2011; ISBN 9781780401362. [Google Scholar]
  37. Maier, H.R.; Razavi, S.; Kapelan, Z.; Zhu, Z.; Kasprzyk, J.R.; Tolson, B. Introductory overview: Optimization using evolutionary algorithms and other metaheuristics. Environ. Model. Softw. 2019, 114, 195–213. [Google Scholar] [CrossRef]
  38. Bakhshipour, A.E.; Dittmer, U.; Haghighi, A.; Nowak, W. Hybrid green-blue-gray decentralized urban drainage systems design, a simulation-optimization framework. J. Environ. Manag. 2019, 249, 109364. [Google Scholar] [CrossRef] [PubMed]
  39. Bakhshipour, A.E.; Dittmer, U.; Haghighi, A.; Nowak, W. Towards sustainable urban drainage infrastructure planning: A combined multiobjective optimization and multicriteria decision-making platform. J. Water Resour. Plan. Manag. Forthcom. 2021, in press. [Google Scholar] [CrossRef]
  40. Van Laarhoven, P.J.M.; Aarts, E.H.L. (Eds.) Simulated annealing. In Simulated Annealing: Theory and Applications; Springer: Berlin/Heidelberg, Germany, 1987; pp. 7–15. ISBN 978-90-481-8438-5. [Google Scholar]
  41. Hadka, D.; Reed, P. Borg: An Auto-Adaptive Many-Objective Evolutionary Computing Framework. Evol. Comput. 2013, 21, 231–259. [Google Scholar] [CrossRef] [PubMed]
  42. Eckart, K.; McPhee, Z.; Bolisetti, T. Multiobjective optimization of low impact development stormwater controls. J. Hydrol. 2018, 562, 564–576. [Google Scholar] [CrossRef]
  43. De Villiers, N.; Van Rooyen, G.C.; Middendorf, M. Sewer network design: Heuristic algorithm for hydraulic optimisation. J. South Afr. Inst. Civ. Eng. 2017, 59, 48–56. [Google Scholar] [CrossRef] [Green Version]
  44. Walters, G.A.; Smith, D.K. Evolutionary design algorithm for optimal layout of tree networks. Engineering Optimization. Eng. Optim. 1995, 24, 261–281. [Google Scholar] [CrossRef]
  45. Haghighi, A.; Bakhshipour, A.E. Reliability-based layout design of sewage collection systems in flat areas. Urban Water J. 2015, 13, 790–802. [Google Scholar] [CrossRef]
  46. Bakhshipour, A.E.; Bakhshizadeh, M.; Dittmer, U.; Nowak, W.; Haghighi, A. A Graph-Theory Based Algorithm to Generate Decentralized Urban Drainage Layouts. In New Trends in Urban Drainage Modelling; Mannina, G., Ed.; Springer: Berlin/Heidelberg, Germany; New York, NY, USA, 2018; pp. 633–637. ISBN 978-3-319-99866-4. [Google Scholar]
  47. Zischg, J.; Rogers, B.; Gunn, A.; Rauch, W.; Sitzenfrei, R. Future trajectories of urban drainage systems: A simple exploratory modeling approach for assessing socio-technical transitions. Sci. Total. Environ. 2019, 651, 1709–1719. [Google Scholar] [CrossRef]
  48. Diogo, A.F.; Oliveira, M.C. A simplified approach for the computation of steady two-phase flow in inverted siphons. J. Environ. Manag. 2016, 166, 294–308. [Google Scholar] [CrossRef] [PubMed]
  49. Diogo, A.F.; Oliveira, M.C. A Preliminary Numerical Approach for the Study of Compressed Air Injection in Inverted Siphons. J. Hydraul. Eng. 2013, 139, 772–784. [Google Scholar] [CrossRef]
  50. Shao, Z.; Zhang, X.; Li, S.; Deng, S.; Chai, H. A Novel SWMM Based Algorithm Application to Storm Sewer Network Design. Water 2017, 9, 747. [Google Scholar] [CrossRef] [Green Version]
Figure 1. Multi-objective optimization and structural resilience analysis framework.
Water 13 00269 g001
Figure 2. Hanging gardens algorithm [38].
Water 13 00269 g002
Figure 3. Case study base graph of a section from the city of Ahvaz, Iran [46].
Water 13 00269 g003
Figure 4. Synthetic design storms with different return periods for the city of Ahvaz.
Water 13 00269 g004
Figure 5. The daily precipitation in Ahvaz from October 2018 to March 2019.
Water 13 00269 g005
Figure 6. Pareto front of non-dominated solutions, selected layouts, and their respective hydraulically optimized costs.
Water 13 00269 g006
Figure 7. Design 1 (life cycle cost (LCC) = 249,630 M. Rials and degree of centralization (DC) = 22%).
Water 13 00269 g007
Figure 8. Design 2 (LCC = 258,500 M. Rials and DC = 11%).
Water 13 00269 g008
Figure 9. Design 3 (LCC = 270,180 M. Rials and DC = 11%).
Water 13 00269 g009
Figure 10. Design 4 (LCC = 250,900 M. Rials and DC = 33%).
Water 13 00269 g010
Table 1. Design constraints for the case study [24].
DescriptionConstraint
Maximum Velocity 4.0 m/s
Maximum excavation depth5.0 m
Minimum cover depth1.2 m
Minimum slope0.0041 if D = 200 mm
0.0033 if D = 250 mm
0.0027 if D = 350 mm
0.0020 if D = 400 mm
0.0016 if D = 500 mm
0.0014 if D = 630 mm
0.0010 if D = 800 mm
0.0010 if D 1000 mm
Table 2. Design parameters of simple cost index-optimized urban drainage system (UDS) designs.
IndexLCC
(M. Rials)
Average
Diameter
(m/m)
Average
Buried
Depth (m)
Maximum
Diameter
(m)
Maximum
Buried Depth
(m)
DC
(%)
LAI2800700.682.171.55.7822
ADI2501500.632.081.55.2233
ERI2909470.712.2525.9855
Table 3. Commercial sewer diameter and corresponding maximum impervious contributing area for Area Diameter Index (ADI).
Diameter (m)Maximum Impervious Connected Area (ha)
0.250.4
0.350.8
0.401.2
0.53.2
0.634.8
0.8010.4
1.032.0
1.272.0
1.596.0
2.0400.0
Table 4. Hydraulic and layout specifications of different scenarios.
DesignLCC
(M. Rials)
Structural
Resilience
(%)
DC
(%)
Average
Diameter
(m/m)
Average
Buried
Depth (m)
Maximum
Diameter
(m)
Maximum
Buried Depth
(m)
N P R e s s t r < 90 % ( - ) N P R e s s t r < 90 %
Non-outfall(-)
Minimum
Structural
Resilience (%)
124963085.3220.562.171.55.1012682
225850086.5110.572.201.55.206184
327018087.0110.582.261.55.604084
425095379.9330.642.131.54.70211674
Table 5. Comparison between functional resilience of the four optimal layouts during different design storms.
DesignDC
(%)
10 Years
(38.3 mm)
20 Years
(46.7 mm)
25 Years
(49.5 mm)
50 Years
(58.5 mm)
12297.794.092.889.2
21198.194.993.890.5
31198.094.493.189.5
43396.9791.8590.0184.43
Table 6. The suggested methods for different UDS design optimization problems.
Optimization ProblemCentralized Layout
(Flat Area)
Decentralized Layout
(Flat Area)
Centralized Layout
(Steep Area)
Decentralized Layout Design (Steep Area)Sizing the Sewers
(Flat Area)
Sizing the Sewers
(Steep Area)
Optimization Approach
Design of sewage collection
systems
Loop-by-loop algorithm
[17]
Hanging gardens algorithm
[24] or Forest Algorithm [15]
Engineering judgmentHanging gardens algorithm
[24], SNIP model [9], or Forest Algorithm [15]
Adaptive algorithm
[34]
Adaptive algorithm
[34]
Simultaneous optimization (layout and sizes)
Design of stormwater collection
systems
Loop-by-loop algorithm
[17]
Hanging gardens algorithm
[24] or Forest Algorithm [15]
Engineering judgmentHanging gardens algorithm
[24], SNIP model [9], or Forest Algorithm [15]
Adaptive algorithm
[34]
The method proposed in
[50]
Separate optimization (first layout then sizes)
Publisher’s Note: MDPI stays neutral with regard to jurisdictional claims in published maps and institutional affiliations.

