
Performance Improvement of a Drag Hydrokinetic Turbine
by
 , , and
Mabrouk Mosbahi
1,2 ,
,
Mariem Lajnef
1,
Mouna Derbel
3,
Bouzid Mosbahi
4,
Costanza Aricò
5,*,
Marco Sinagra
5 and
Zied Driss
1
1
Laboratory of Electro-Mechanic Systems (LASEM), National School of Engineers of Sfax (ENIS), University of Sfax, B.P. 1173, km 3.5 Soukra, Sfax 3038, Tunisia
2
Higher National Engineering School of Tunis (ENSIT), University of Tunis, Avenue Taha Hussein Montfleury, Tunis 1008, Tunisia
3
Advanced Materials Laboratory, National School of Engineers of Sfax (ENIS), University of Sfax, B.P. 1173, km 3.5 Soukra, Sfax 3038, Tunisia
4
Higher Institute for Technological Studies of Sidi Bouzid, Sidi Bouzid 9100, Tunisia
5
Department of Civil, Environmental, Aerospace and Materials Engineering (DICAM), University of Palermo, Viale delle Scienze, 90128 Palermo, Italy
*
Author to whom correspondence should be addressed.
Water 2021, 13(3), 273; https://doi.org/10.3390/w13030273
Submission received: 11 January 2021
/
Revised: 19 January 2021
/
Accepted: 21 January 2021
/
Published: 23 January 2021
(This article belongs to the Special Issue Hydraulic Dynamic Calculation and Simulation)
Abstract
:Hydropower is at present in many locations, among all the other possible renewable energy sources, the best one for net cost per unit power. In contrast to traditional installation, based on water storage in artificial basins, free flow river turbines also provide a very low environmental impact due to their negligible effect on solid transport. Among them, kinetic turbines with vertical axis are very inexpensive and have almost zero impact on fish and local fauna. In application to tidal waves and sea waves, where vertically averaged velocities have alternate direction, a Savonius rotor also has the advantage of being productive during the whole time cycle. In this work, the effect of an upstream deflector system mounted upstream of a twisted Savonius rotor inside a channel has been investigated through numerical simulations and experimental tests. Numerical simulations were carried on using the ANSYS FLUENT 17.0 software. Based on this numerical study, it is shown that the proposed deflector system has improved the power coefficient of the Savonius rotor by 14%. The utilization of this new design system is predicted to contribute towards a more efficient use of flows in rivers and channels for electricity production in rural areas.
1. Introduction
The harvesting of hydrokinetic energy from river streams and small irrigation channels has recently become an important source of renewable energy [1], even in the case of low speed water flow [2,3,4]. The twisted Savonius water turbine is ranked as a drag-type of vertical axis water turbine, which can rotate at low speed water flow, starting from any position of the blades. The original design is made with two cylindrical half-circular blades bound to a rotating shaft using bearings [5]. The difference between the drag force applied on the concave and on the convex side of its blades results in a net torque, which remains almost constant during rotation if a twisted shape is adopted in the axis direction instead of a cylindrical one. Its simple structure makes it easy to be installed in an irrigation channel or even in a river.
Many efforts have been made to boost the efficiency of the Savonius water turbine. In fact, several geometrical parameters such as the overlap ratio, the aspect ratio, the number of blades and stages and the form of the blades were optimized to improve the performance characteristics, mainly the torque and the power coefficients. In addition, various augmentation techniques, such as the use of deflector plates, a guiding box, nozzles and curtain design, were also investigated with the intention of performance improvement.
The aspect ratio (Ar) is defined as the ratio between the rotor height and its diameter. Studies by Alexander et al. [6], Saha et al. [7], and Kamoji [8] were carried out for different Reynolds numbers to study its effect on a single stage (Ar = 1.0), two stage (Ar = 1.0 and Ar = 2.0) and three stage (Ar = 1.0 and Ar = 3.0) classical Savonius rotor. A higher aspect ratio improves the torque coefficient, but it reduces the rotational speed because of the structural larger volume. However, it is possible to improve the efficiency of a lower aspect ratio rotor with the addition of end plates. Jeon et al. [9] studied the effect of upper and lower end plates addition, with different shapes and dimensions, on the performance of a 180° twist angle Savonius turbine. They found that there is an increase up to 36% for this type of rotor. In addition, they noted that the circular form works better than other forms. Saha et al. [7] found experimentally that the two-blade Savonius rotor produces better performance (Cp max = 0.31) than the three-blade Savonius rotor. The same conclusion was found with numerical simulations by Zhao et al. [10], who worked on a 180° twist Savonius rotor. Zheng et al. [11] also carried out a numerical study for a modified Savonius rotor with four, five and six blades. They found that the maximum power coefficient is equal to 27.14%, 28.493% and 30.864%, respectively. According to Kamoji et al. [8] and Hayashi et al. [12], a single stage Savonius rotor is more efficient than two and three stage Savonius rotors at the same Reynolds number. The blade shape is another parameter that has been studied to find the optimum form which gives best performances [13,14]. Driss et al. [15] studied the effect of a bucket arc angle on an unconventional Savonius rotor. A novel two-bladed turbine proposed by Roy et al. [16] was tested in the lab and its power and torque coefficients were compared with standard semi elliptic, semi-circular, bach and benesh blade shapes. An important gain of 19.2%, 34.8%, 3.3% and 6.9%, respectively, is obtained. A combined elliptical and conventional Savonius rotor was investigated by Hassan et al. [17], obtaining an improvement of 35.9%.
Another geometrical parameter that directly affects the blade form of the Savonius turbine is the twist angle ψ, which transforms the conventional Savonius rotor into the helical Savonius rotor. Many studies have been carried out to prove that angle ψ affects and directly improves the self-starting ability of the Savonius rotor [18]. Saha et al. [19] found that a 15° helical blade is the optimum one. By maintaining the other geometrical parameters, Lee et al. [20] studied four helical Savonius rotors characterized by the angles 0°, 45°, 90°and 135°. They found that the optimum power corresponds to a 45° twist angle. However, the 90° and 135° rotor powers are lower than 0°. Beyond 90°, the torque coefficient became stabilized.
The overlap ratio is the ratio between the overlap distance and the blade chord length (Figure 1). According to previous works, the gap between rotor buckets leads to a water flow from the forward to the returning blade, and it increases the pressure on the back side of the concave blade, with a reduction in its drag force. Blackwell et al. [21] discovered that from 0.1 to 0.15 is the optimum interval for the overlap ratio. Akwa et al. [22] found by numerical tests that a maximum power coefficient of 0.316 is obtained at an overlap ratio of 0.15 for a tip speed ratio of 1.25. The effect of overlap ratio on static torque was also performed on a Savonius rotor with a single stage by Roya et al. [16]. Six overlap ratios varying from 0 to 0.3 were studied and compared. The peak in static torque was observed with an overlap ratio equal to 0.2. This ratio turns out to be a threshold value; beyond it, any increment of the overlap ratio leads to a reduction in the effective pressure on the concave surface of the blade.
Another way to improve the performance of the Savonius rotor is to control the water direction of the inlet flow. The basic idea is to locally increase the kinetic energy by reducing the section of the stream flow already channeled toward the concave face of the advanced blade and to prevent the water flow from the convex face of the returning blade. With such a technique, the pressure resulting on the advanced blade is enhanced and the negative torque given by the returning blade is reduced. Many investigations have been carried out in this field. Mohamed et al. [23] put a plate before the rotor to shield the returning blade. With such a design, they improved the power coefficient by more than 27%. They also found that this improvement is more important for a two-blade than for a three-blade Savonius rotor. A deflector containing two plates was studied numerically and realized at a 2:1 scale by Maldonadoa et al. [24]. Altan et al. [25] proposed three configurations of curtains. These ones were tested and compared with the non-curtain Savonius design. The optimum arrangement leads to a 38.5% power coefficient increase.
In summary, an overview of the literature on the twisted Savonius rotor confirms a lack of studies for the optimization of the deflector efficiency, with respect to the large number of papers addressing the optimization of the rotor parameters. The present work attempts to investigate the use of a novel deflector system upstream a twisted Savonius hydrokinetic rotor.
To this end, different configurations of the proposed deflector have been numerically investigated. Numerical investigations of the Savonius water rotor were performed using the computational fluid dynamics (CFD) software ANSYS FLUENT 17.0.
2. Materials and Methods
2.1. Experimental Test Rig
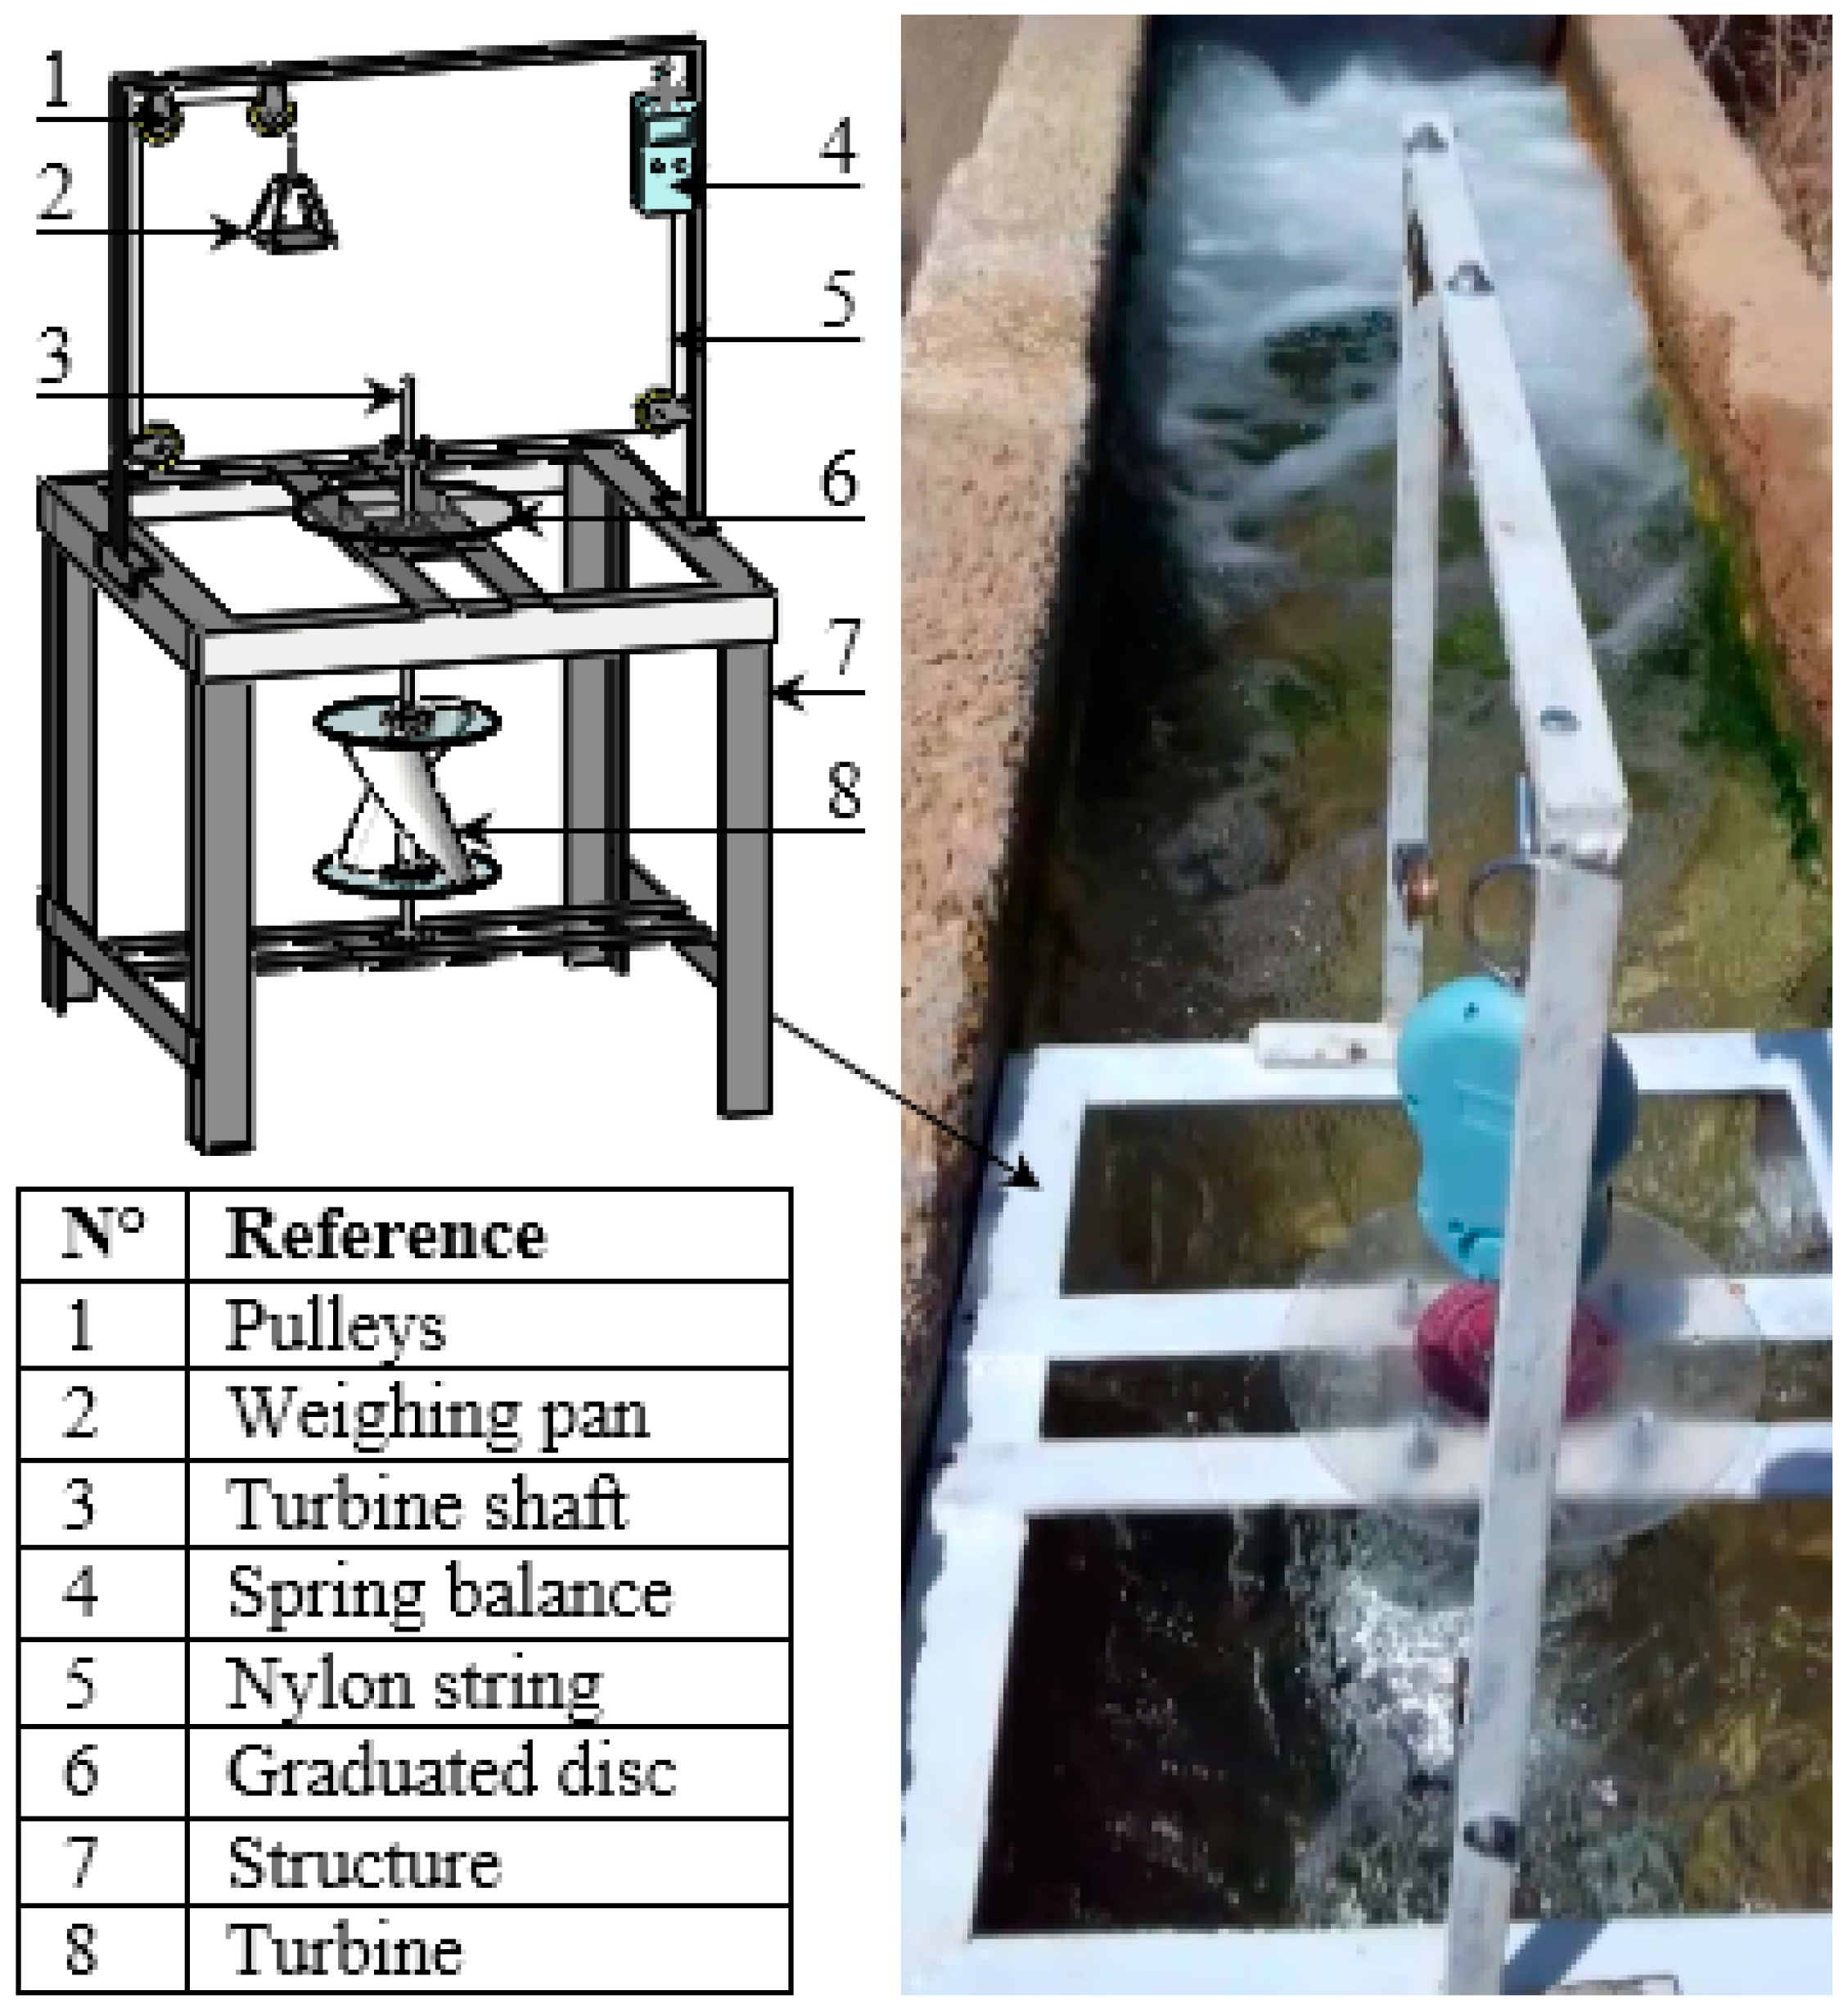
The experimental tests have been carried out in an irrigation channel located in El-Khebayet city. El-Khebayat city belongs to the governorate of Gabes, southeast of Tunisia, Northeast of Africa. It has been known as one of the principal thermal water regions in Tunisia. For this reason, El-Khebayet city is considered to be the main physiotherapy region, which is also frequented by many foreigners from around the world. The natural hot springs are also used for the irrigation of the oasis of El-Khebayat city. Indeed, the hot water is cooled by means of a cooling system before using it for irrigation (Figure 2a). The irrigation canal (Testing site) is the outlet of the cooling system, which is characterized by a water flow velocity of 0.86 m·s−1, a width of 0.6 m and a height of 0.5 m (Figure 2b). A Pitot tube is used to measure the water flow velocity upstream the rotor.
2.2. Savonius Rotor Physical Model
The tested Savonius rotor has been constructed through the additive manufacturing method. This method is based on building up the sought-after object by sequentially adding many thin layers, starting from a three-dimensional digital model created using a solid model computer-aided design (Figure 3).
Observe that 3D printing, in mini-hydro applications, allows a strong reduction in manufacturing costs, especially when low water velocities allow a small admissible stress of the blade material and the complexity of the rotor shape would otherwise require a lot of human time. The tested rotor consists of two twisted vanes characterized by a height of 20 cm, a diameter of 16 cm, a chord of 9 cm, a thickness of 0.2 cm and a twist angle of 90° (Figure 3c). The two vanes are mounted over a central shaft with a diameter of 2 cm. Table 1 presents the different geometrical parameters of the tested Savonius water rotor.
2.3. Experimental Apparatus
Figure 4 shows the schematic diagram of the experimental setup used to calculate the performance parameters of the Savonius rotor, i.e., torque coefficient (CT) and power coefficient (CP), by measuring the load applied on the rotor shaft along with its rotational speed. It consists of four rectangular plates acting as a supporting structure which houses the Savonius rotor. The rotation of the rotor shaft is conducted by two ball bearings which are mounted at the top and at the bottom of the metallic structure.
The dynamic torque of the Savonius rotor is calculated using a rope brake dynamometer, which is composed of a spring balance, a pulley, nylon string and a weighing pan. A digital tachometer is used to measure the rotational speed of the rotor shaft. The different performance parameters of the Savonius rotor, i.e., the torque coefficient (CT), the power coefficient (CP) and the Tip Speed Ratio (TSR), were expressed by the following equations:
where:
- Tr: The dynamic torque,
- ω: The angular velocity,
- ρ: The water density,
- A: The area of the rotor blade,
- V∞: The water flow velocity,
- R: The radius of the rotor.
- Fr: The force applied on the rotor shaft,
- rp: The radius of the pulley,
- rn: The radius of the nylon string,
- M: The mass loaded on the weighing pan,
- m: The spring balance load reading.
3. Numerical Procedures
Numerical 3D transient simulations of the Savonius water rotor were performed using ANSYS FLUENT 17.0. FLUENT 17.0 is a CFD software solving the Reynolds averaged Navier-Stokes equations (RANS equations) also in complex domains of roto-machinery, where the solid boundary of the fluid domain is given by a static domain and a rotating one, both crossed by the water flow. In the code, the Semi Implicit Linked Equations (SIMPLE) technique, which assures good stability of the computed solution, is used with a second order upwind scheme. Using the Einstein’s indicial notation, the Navier-Stokes equations, for the unsteady, viscous, and incompressible turbulent flow, can be written in the following form [26,27]:
where
- : The averaged velocity,
- : The averaged pressure,
- : The kinematic viscosity,
- : The specific Reynolds Stress tensor.
For numerical investigations, the selection of the turbulence stress model and of its parameters is one of the most relevant choices. Various turbulence models are available in FLUENT, such as standard k-ω model, SST k-ω model, standard k-ε model, Realizable k-ε model and RNG k-ε model. Numerous researchers confirmed that the Realizable k-ε model, which captures extensive types of flows such as flow with adverse pressure gradients, flow over airfoils and rotating flows, has predicted results in roto-machinery significantly better than the other ones [28,29]. Therefore, the Realizable k-ε model is used for three-dimensional (3D) CFD simulation in this work. The transport equations of the realizable k-ε model can be written as follows:
Based on earlier studies, the time step is set as the inverse of the rotational velocity, measured as degree per seconds. This implies a rotation of 1° per time step.
3.1. Computation Domain and Boundary Conditions
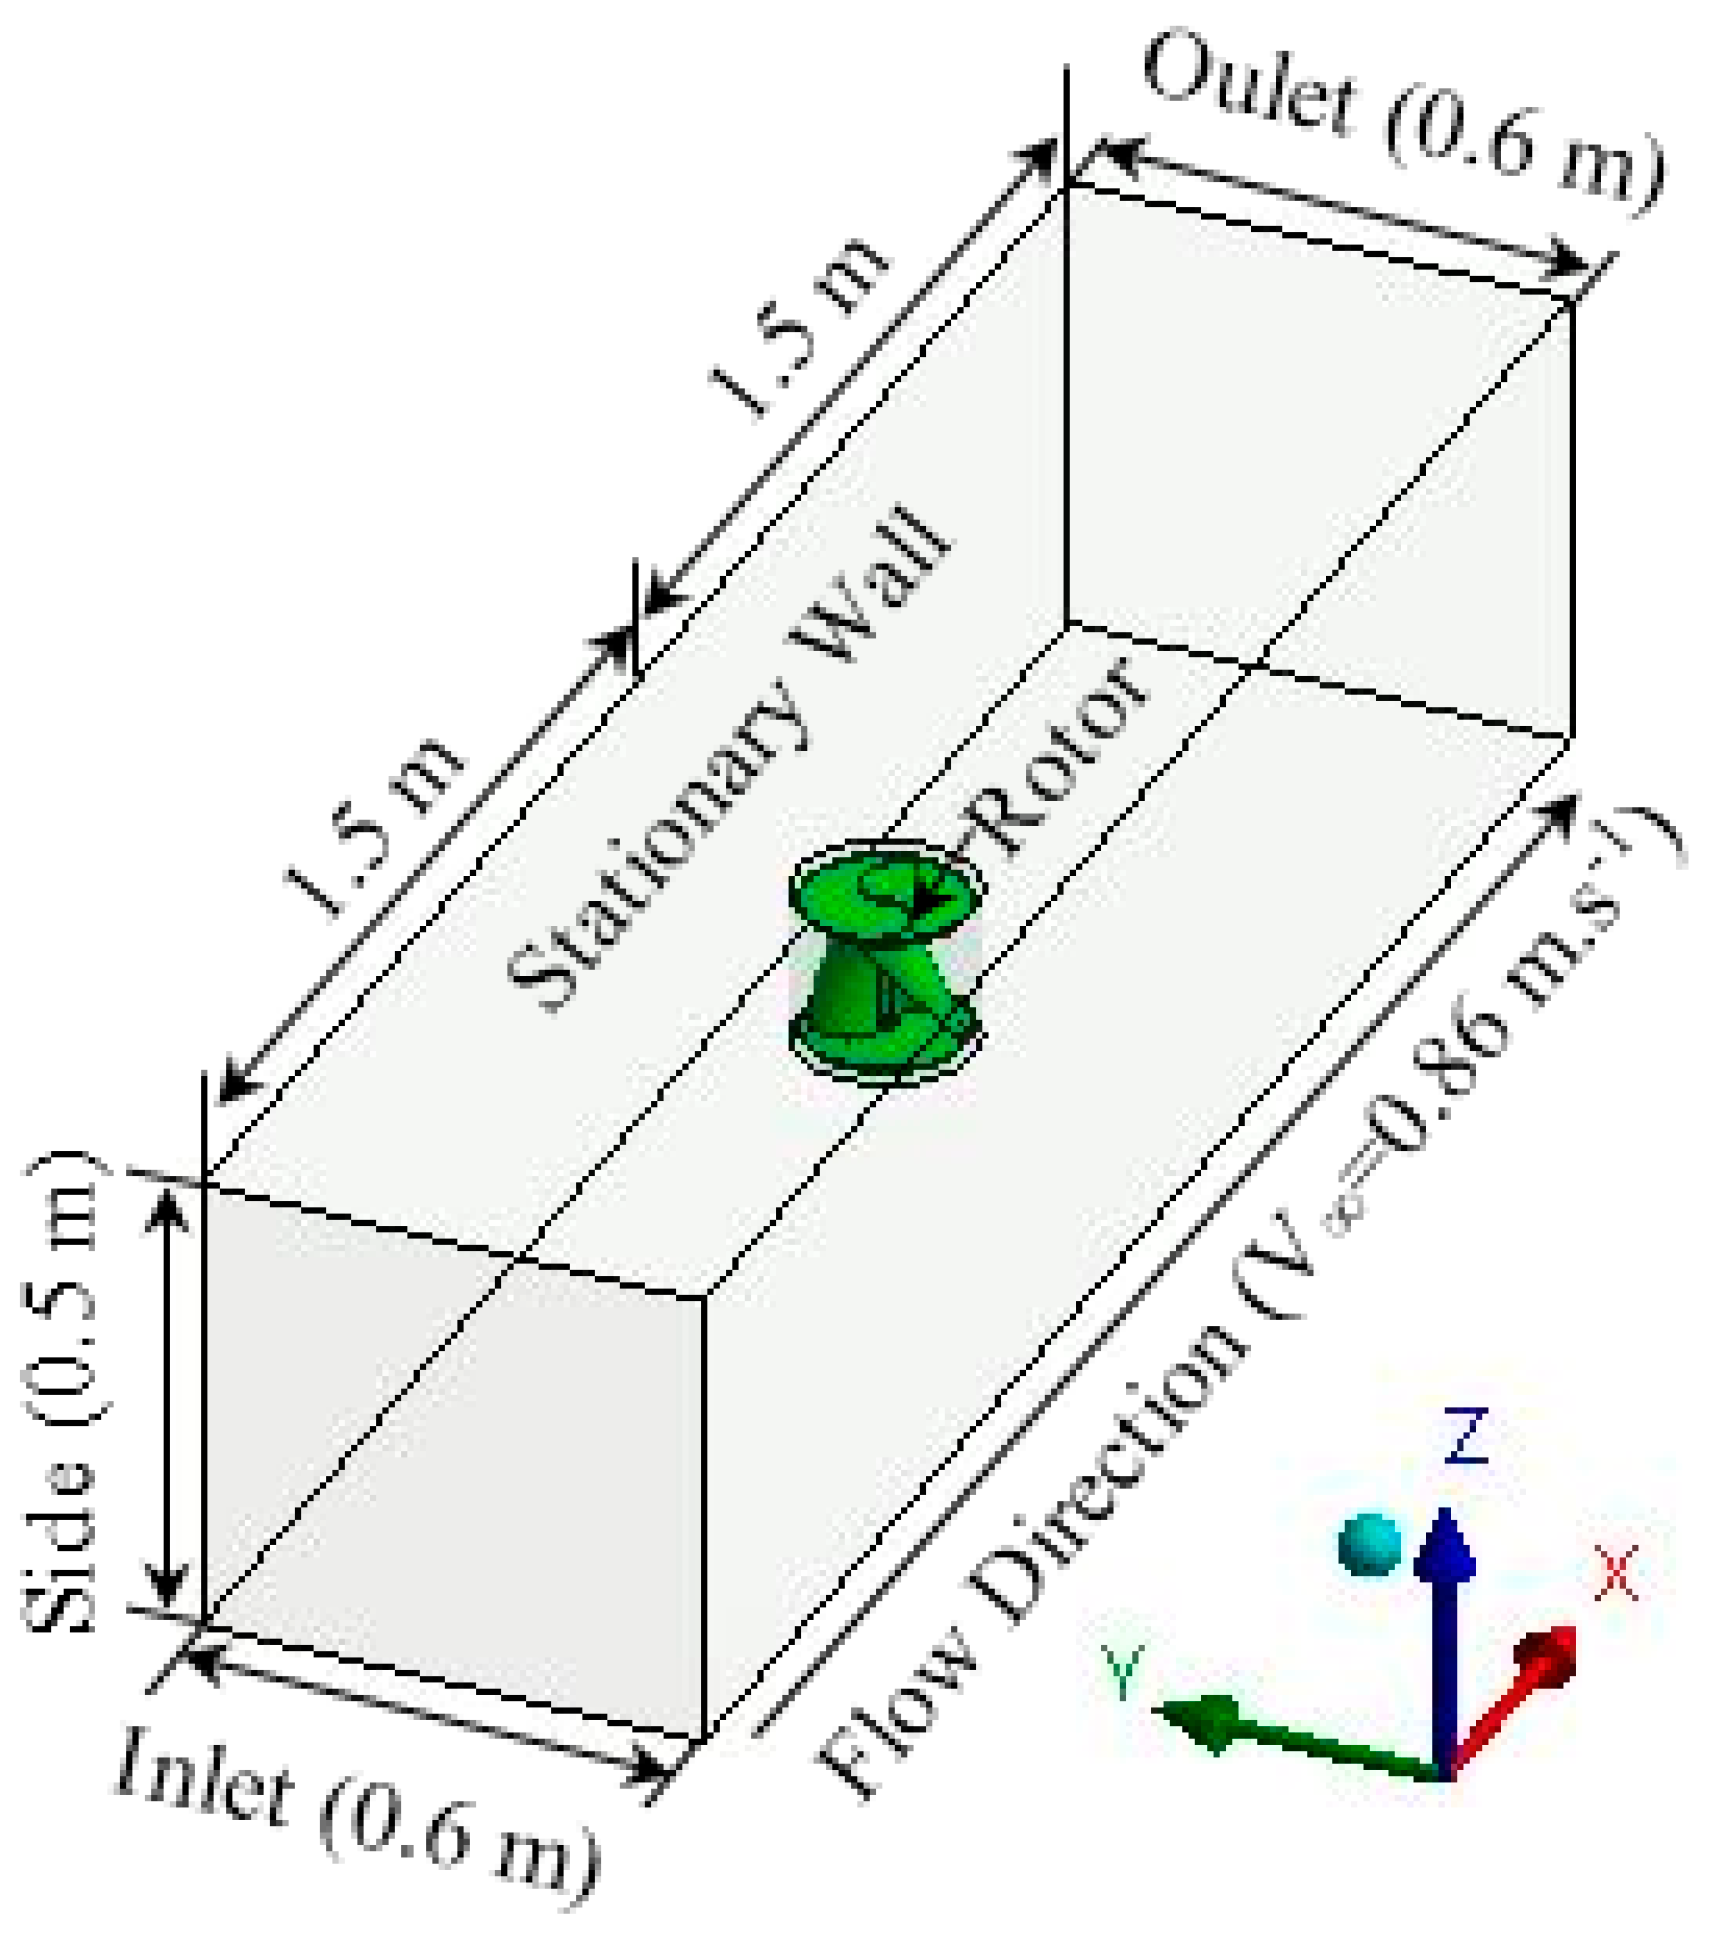
Figure 5 presents the 3D computational domain with the Savonius rotor created using the ANSYS design modeler. Indeed, two zones, stationary and rotating zones separated by a sliding interface, are created. The stationary zone is characterized by 3 m length, 0.6 m width and 0.5 m height. The rotating zone is created by using an enclosure with a diameter equal to 1.2 times the diameter of the Savonius rotor. To correctly simulate the rotor test rig, a velocity inlet equal to 0.86 m·s−1 is set as b.c. at the front face of the 3D computational domain, and the outlet boundary condition is set in the rear front [28,29]. For the side and bottom faces of the domain, a slip boundary condition is applied in order to reduce the lateral boundary effect of the experimental channel. The top surface of the domain is assumed as a symmetry boundary condition. It is assumed that the turbine operates at the proper depth in order to reduce the surface effect, and free surface effects are neglected in the simulation. At the vanes of the Savonius rotor, a no-slip moving walls condition is imposed. Turbulence intensity and viscosity are, respectively, set equal to 5% and 10% for both inlet and outlet.
3.2. Meshing
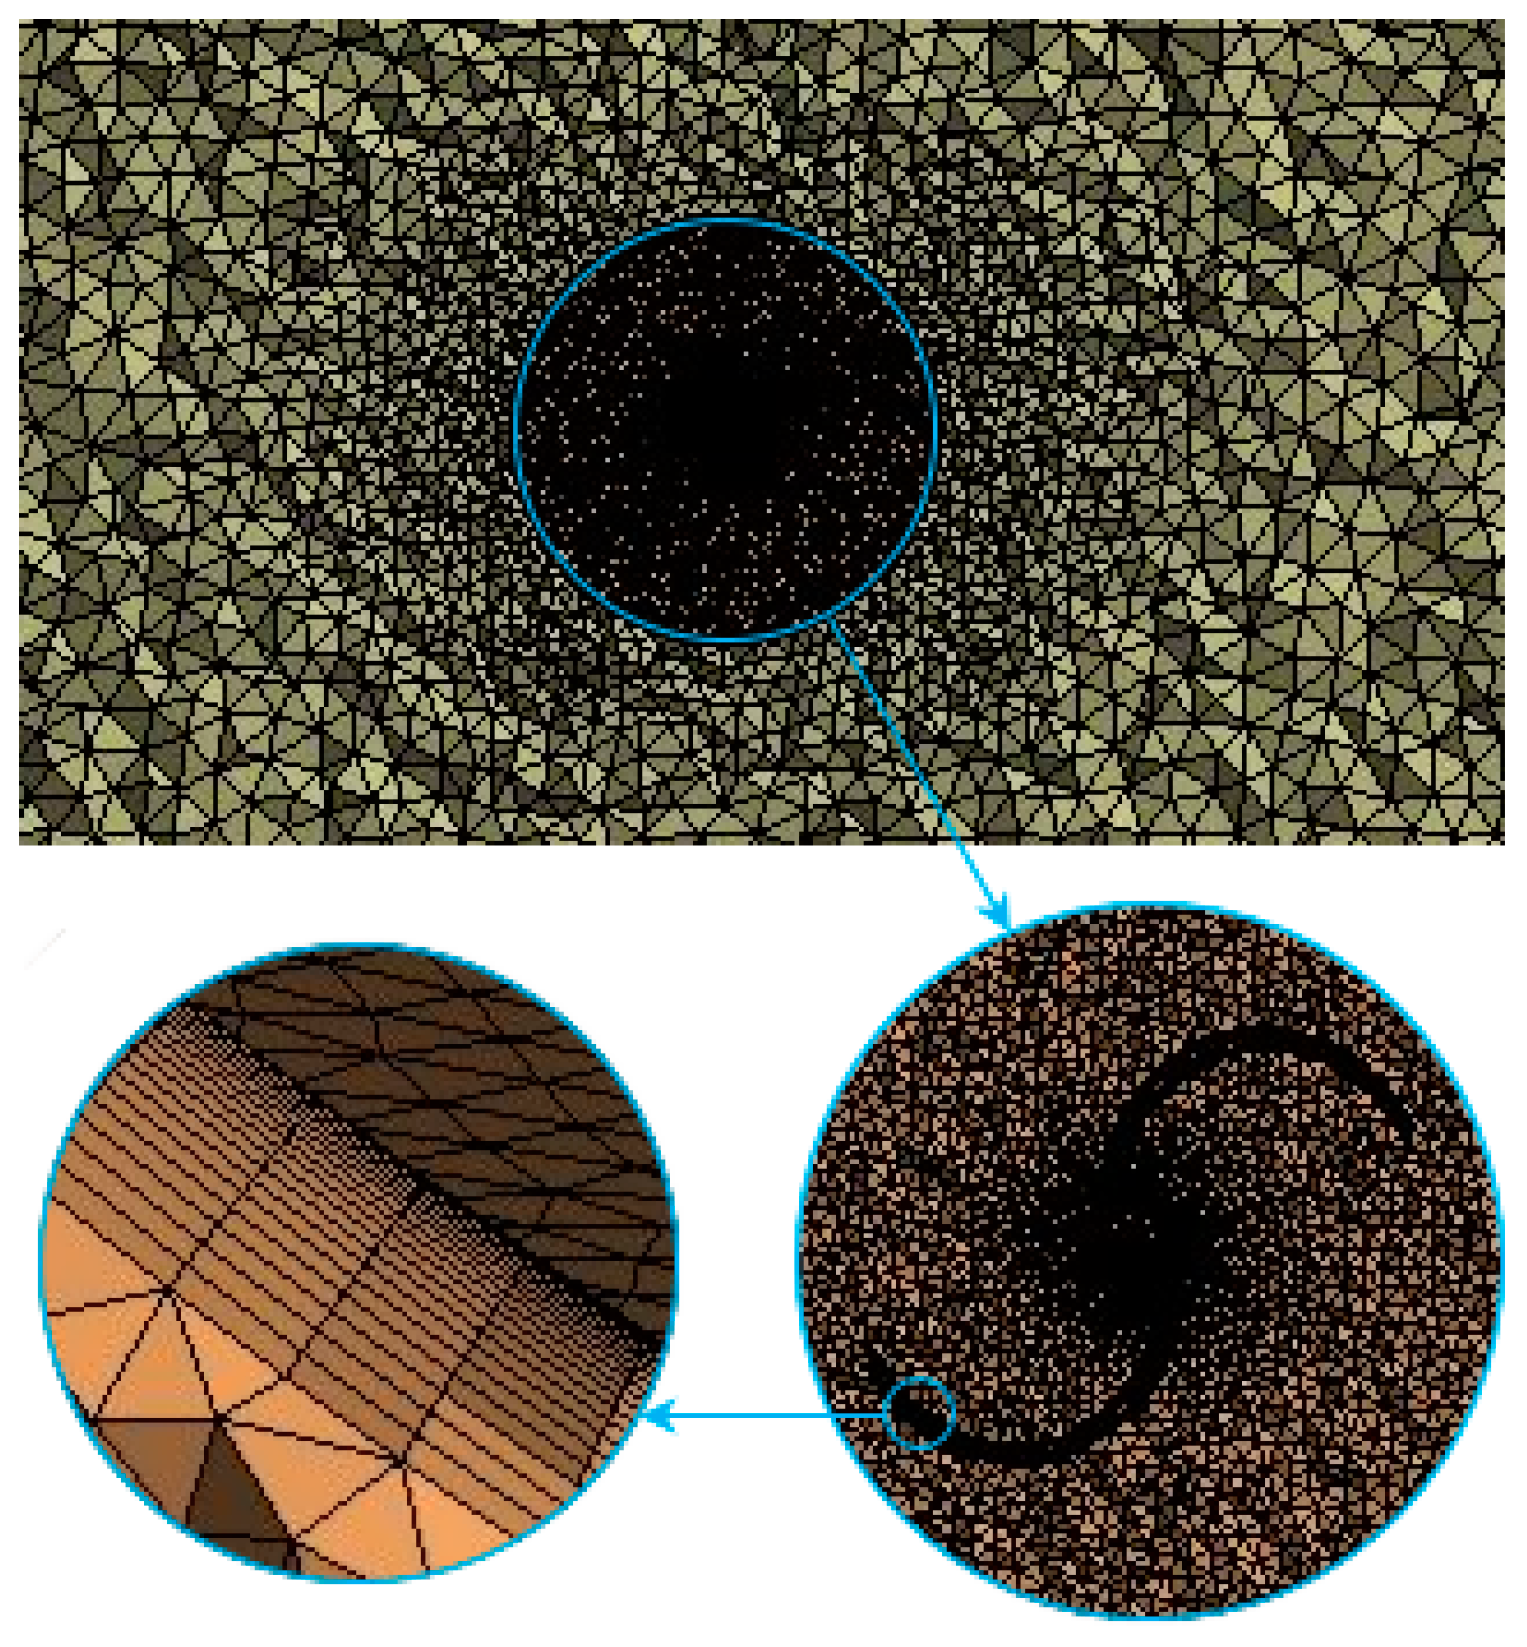
After importing the 3D computational domain to ANSYS workbench, an unstructured mesh, characterized by tetrahedral elements, is applied for both rotating and stationary sub-domains. Indeed, a finer mesh is given to the rotating zone where stronger pressure and velocity gradients occur, as shown in Figure 6. An inflation is applied for the two vanes of the Savonius rotor, with a total number of elements in the stationary and in the rotating zones equal, respectively, to 9.4 million and 5.8 million. The non-dimensional wall distance (y+) is chosen as less than 1 to capture the high separation levels and the gradients of the adverse pressure around the vane surfaces of the Savonius rotor. In fact, a high y+ value reduces the accuracy of the numerical simulation. Therefore, the boundary layer will not be resolved by ANSYS-prescribed wall functions.
3.3. Deflector System
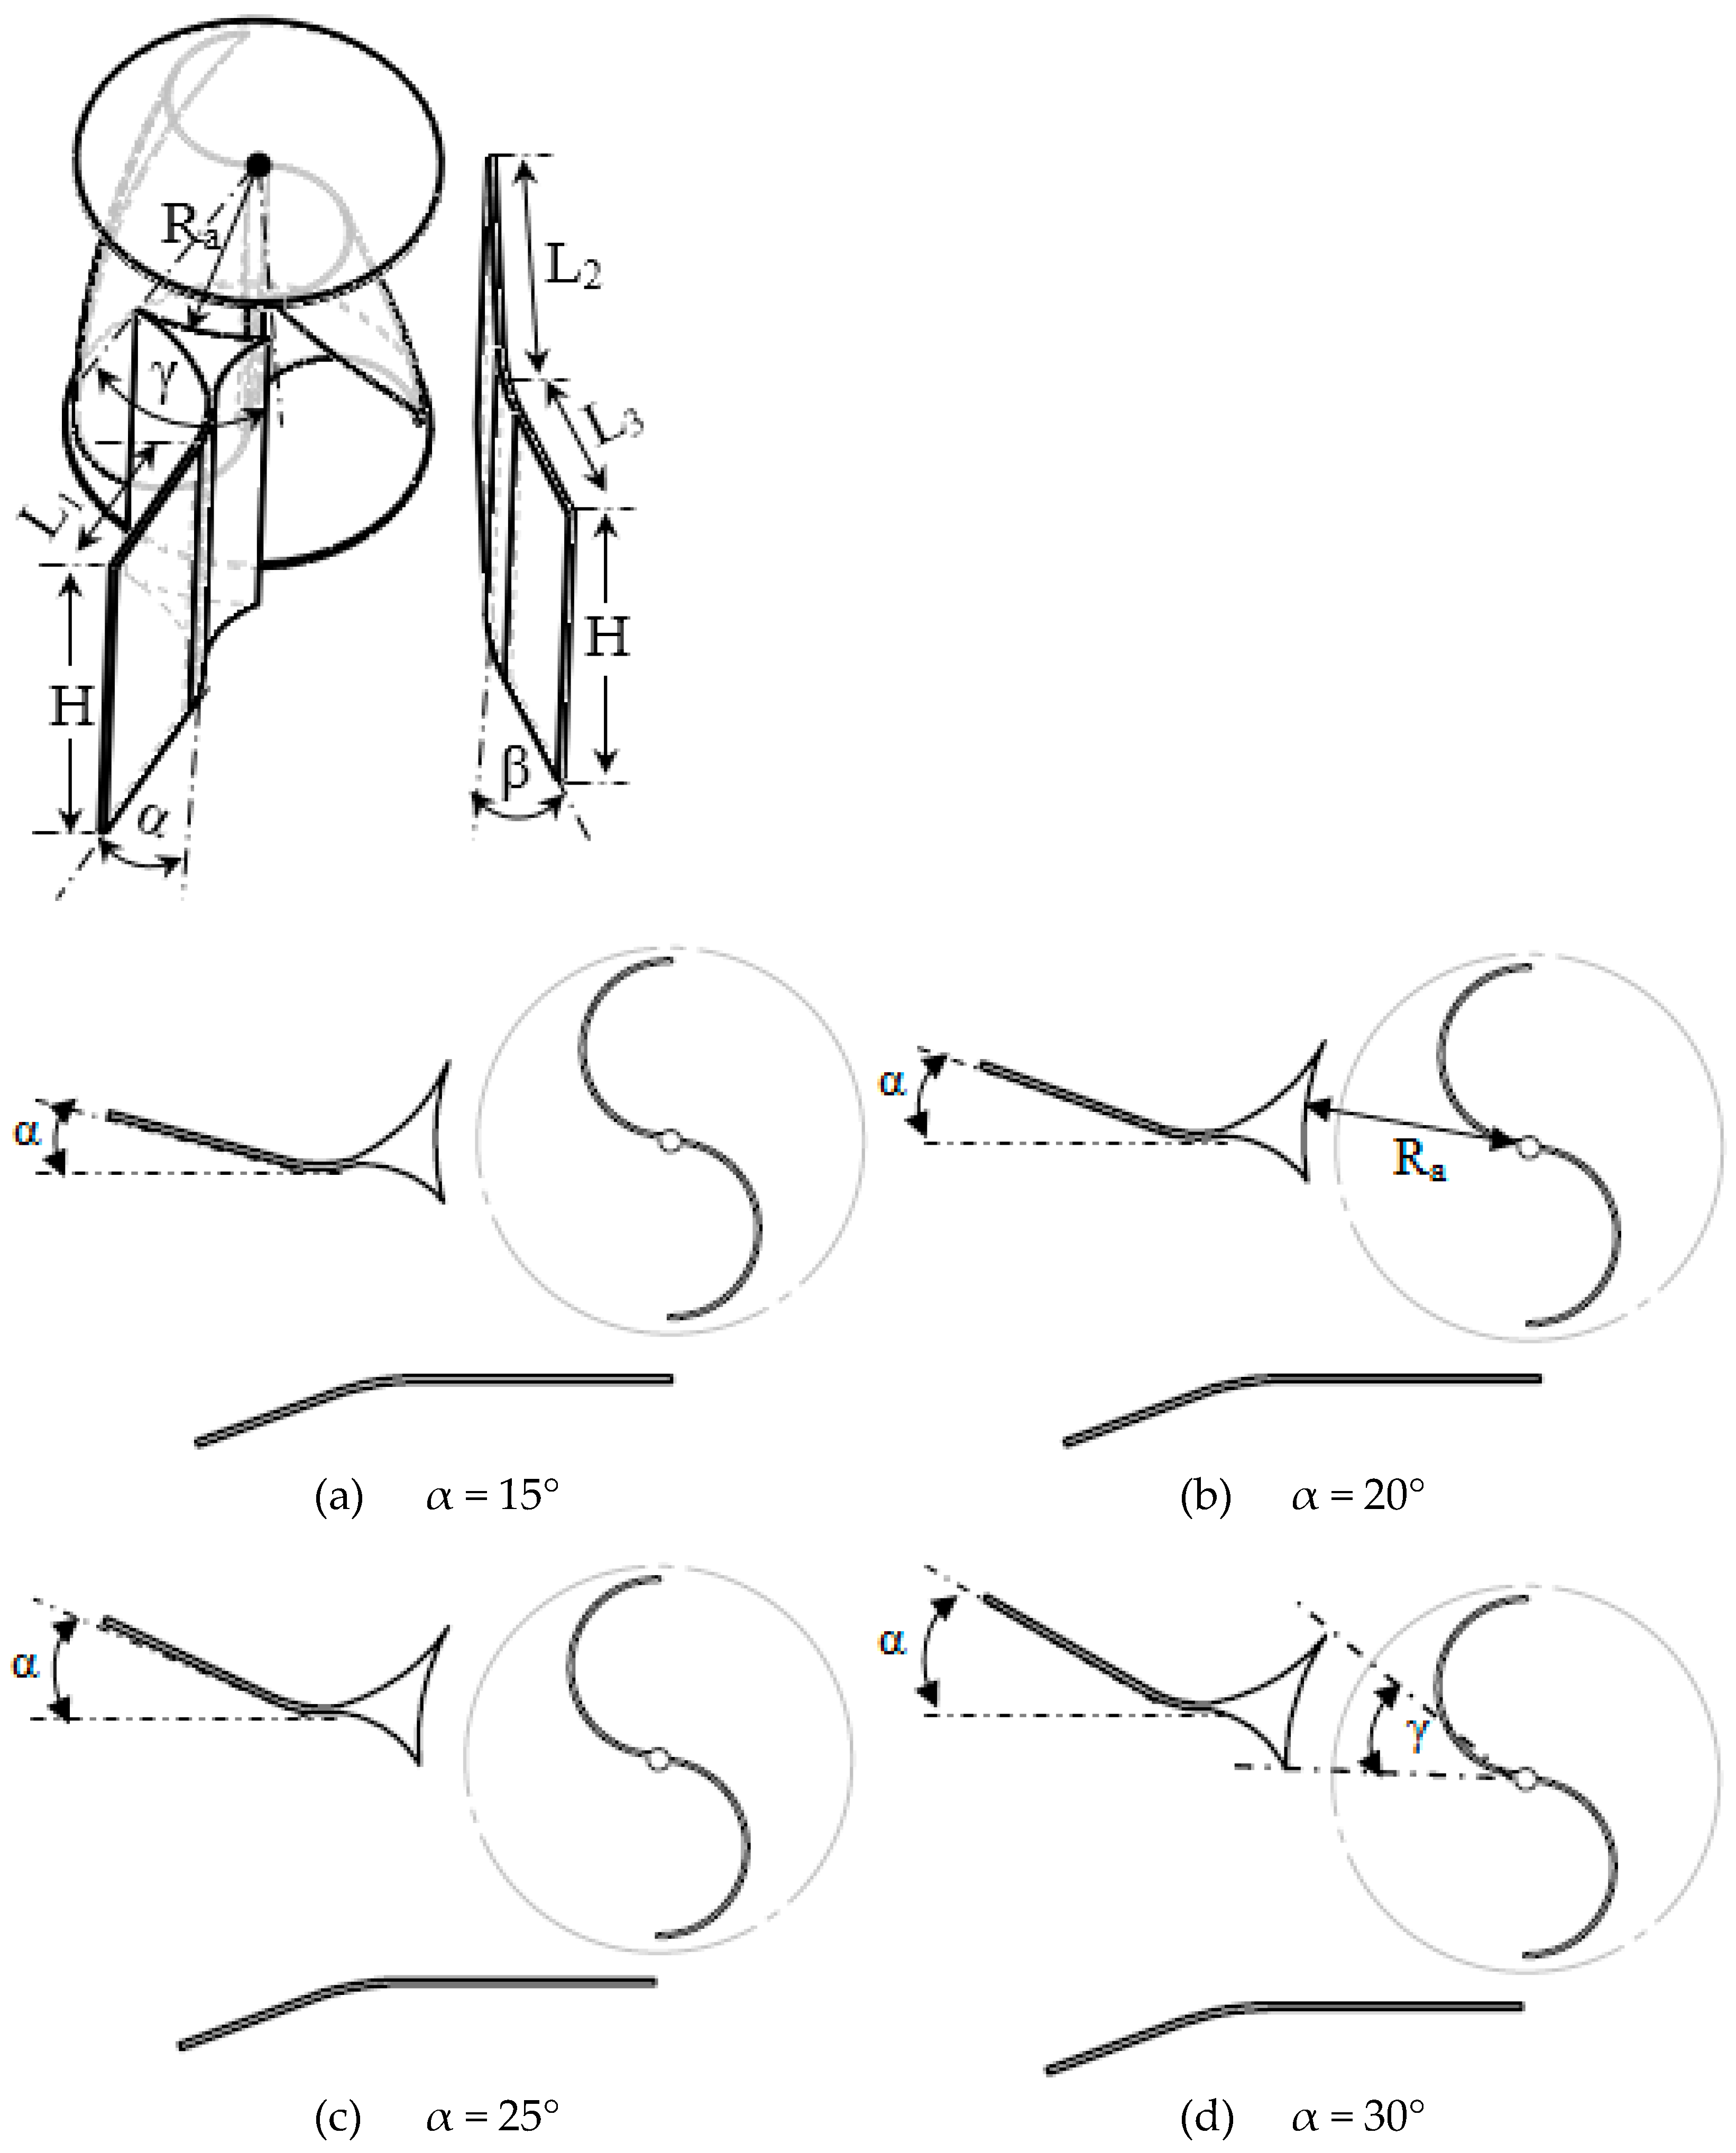
In order to improve the performance parameters of the Savonius rotor, a deflector system, placed upstream the rotor, is proposed. The optimization of the deflector system is based on improving the involvement of the advancing blade in the torque production. Indeed, it consists of directing the main part of the incoming water flow to the concave part of the advancing blade. For sake of simplicity, only one of the geometrical parameters of the deflector system is modified: the deflection angle α. All the other parameters are kept constant. The deflection angle is increased up to α = 30° in a step of 5° starting with a minimum value of α = 15°. Subsequently, four configurations of the deflector systems are studied. The 3D and 2D models of the deflector system are shown, respectively, in Figure 7. All the geometrical parameters are shown in detail in Table 2.
4. Experimental Results and Validation
The Savonius rotor is tested in an irrigation canal with an inlet velocity of 0.86 m·s−1. The performance characteristics such as CP and CT are calculated experimentally using a rope type dynamometer. The CT and CP are plotted versus TSR, as shown in Figure 8.
Initially, the Savonius rotor spins freely without applying any resistance on its shaft. At this condition, the highest rotational speed, which corresponds to CT equal to zero, could be evaluated. The maximum rotational speed is equal to 119 rpm. The increase in the braking torque on the rotor shaft raises the CT at the cost of a reduction in the rotational speed and in TSR, up to a maximum value. Further reduction in the TSR leads to a quick increase in CT. The maximum CT is equal to 0.25 at TSR = 0.54. For the variation of CP versus TSR, it has been observed that CP follows the same behavior as CT, but attains the maximum value of 0.14 at a larger TSR, equal to 0.69. Table 3 shows the systematic error for the different experimental apparatus which are used in this work.
Three-dimensional numerical investigations are performed to be sure of the good agreement between experimental and computational data and to then study the effect of the deflector system on both the hydrodynamic and performance parameters of the Savonius rotor using different configurations, without the need for new experiments. A mesh independence study was carried out for different refinement levels of grids named coarse, medium, fine and extra fine, with 370,000, 580,000, 910,000 and 1.4 million nodes, respectively.
Figure 9 presents the mesh sensitivity on the torque coefficient of the Savonius rotor computed at TSR = 0.69. As the number of grid nodes rises from 370,000 to 910,000, there is a change in CT with respect to TSR. However, from 910,000 to 1.4 million, the change in CT is negligible. Therefore, the fine mesh is assumed as the best grid level for the present simulation to optimize the computational time.
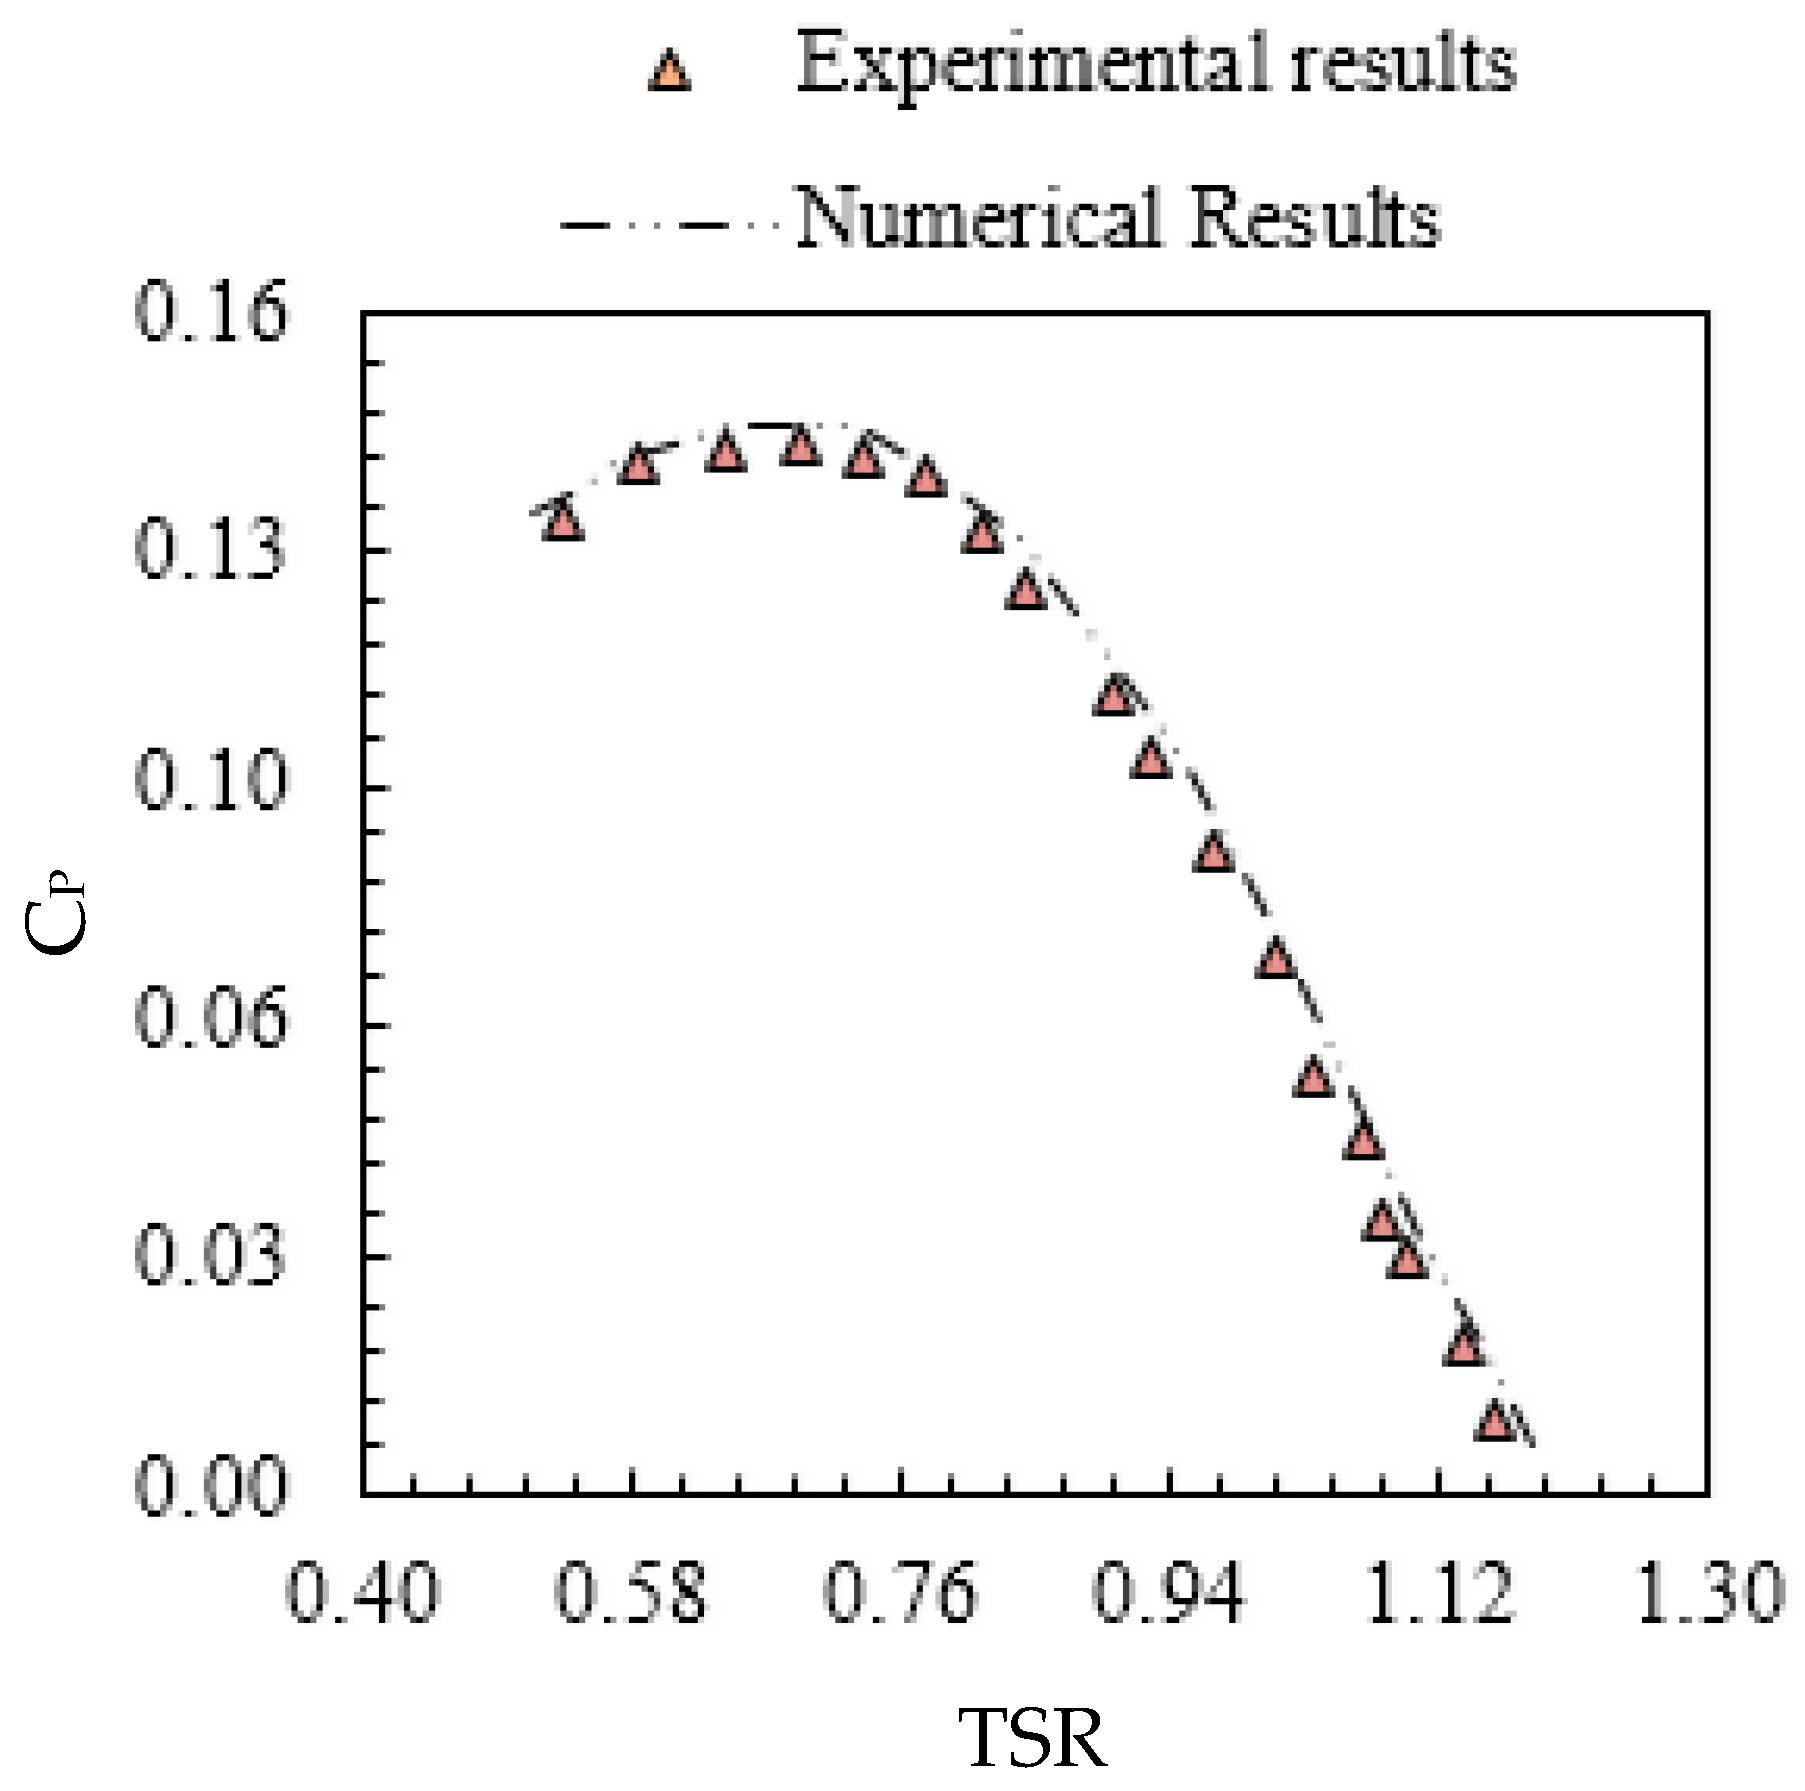
Figure 10 shows the variation of CP with TSR for different numerical simulations, which seems to be in good agreement with the experimental data. The average error value is about 4.6%. Thus, the numerical model is appropriate for predicting the impact of the deflector system on both hydrodynamic and performance parameters of the Savonius rotor.
5. Numerical Results
5.1. Velocity Distribution
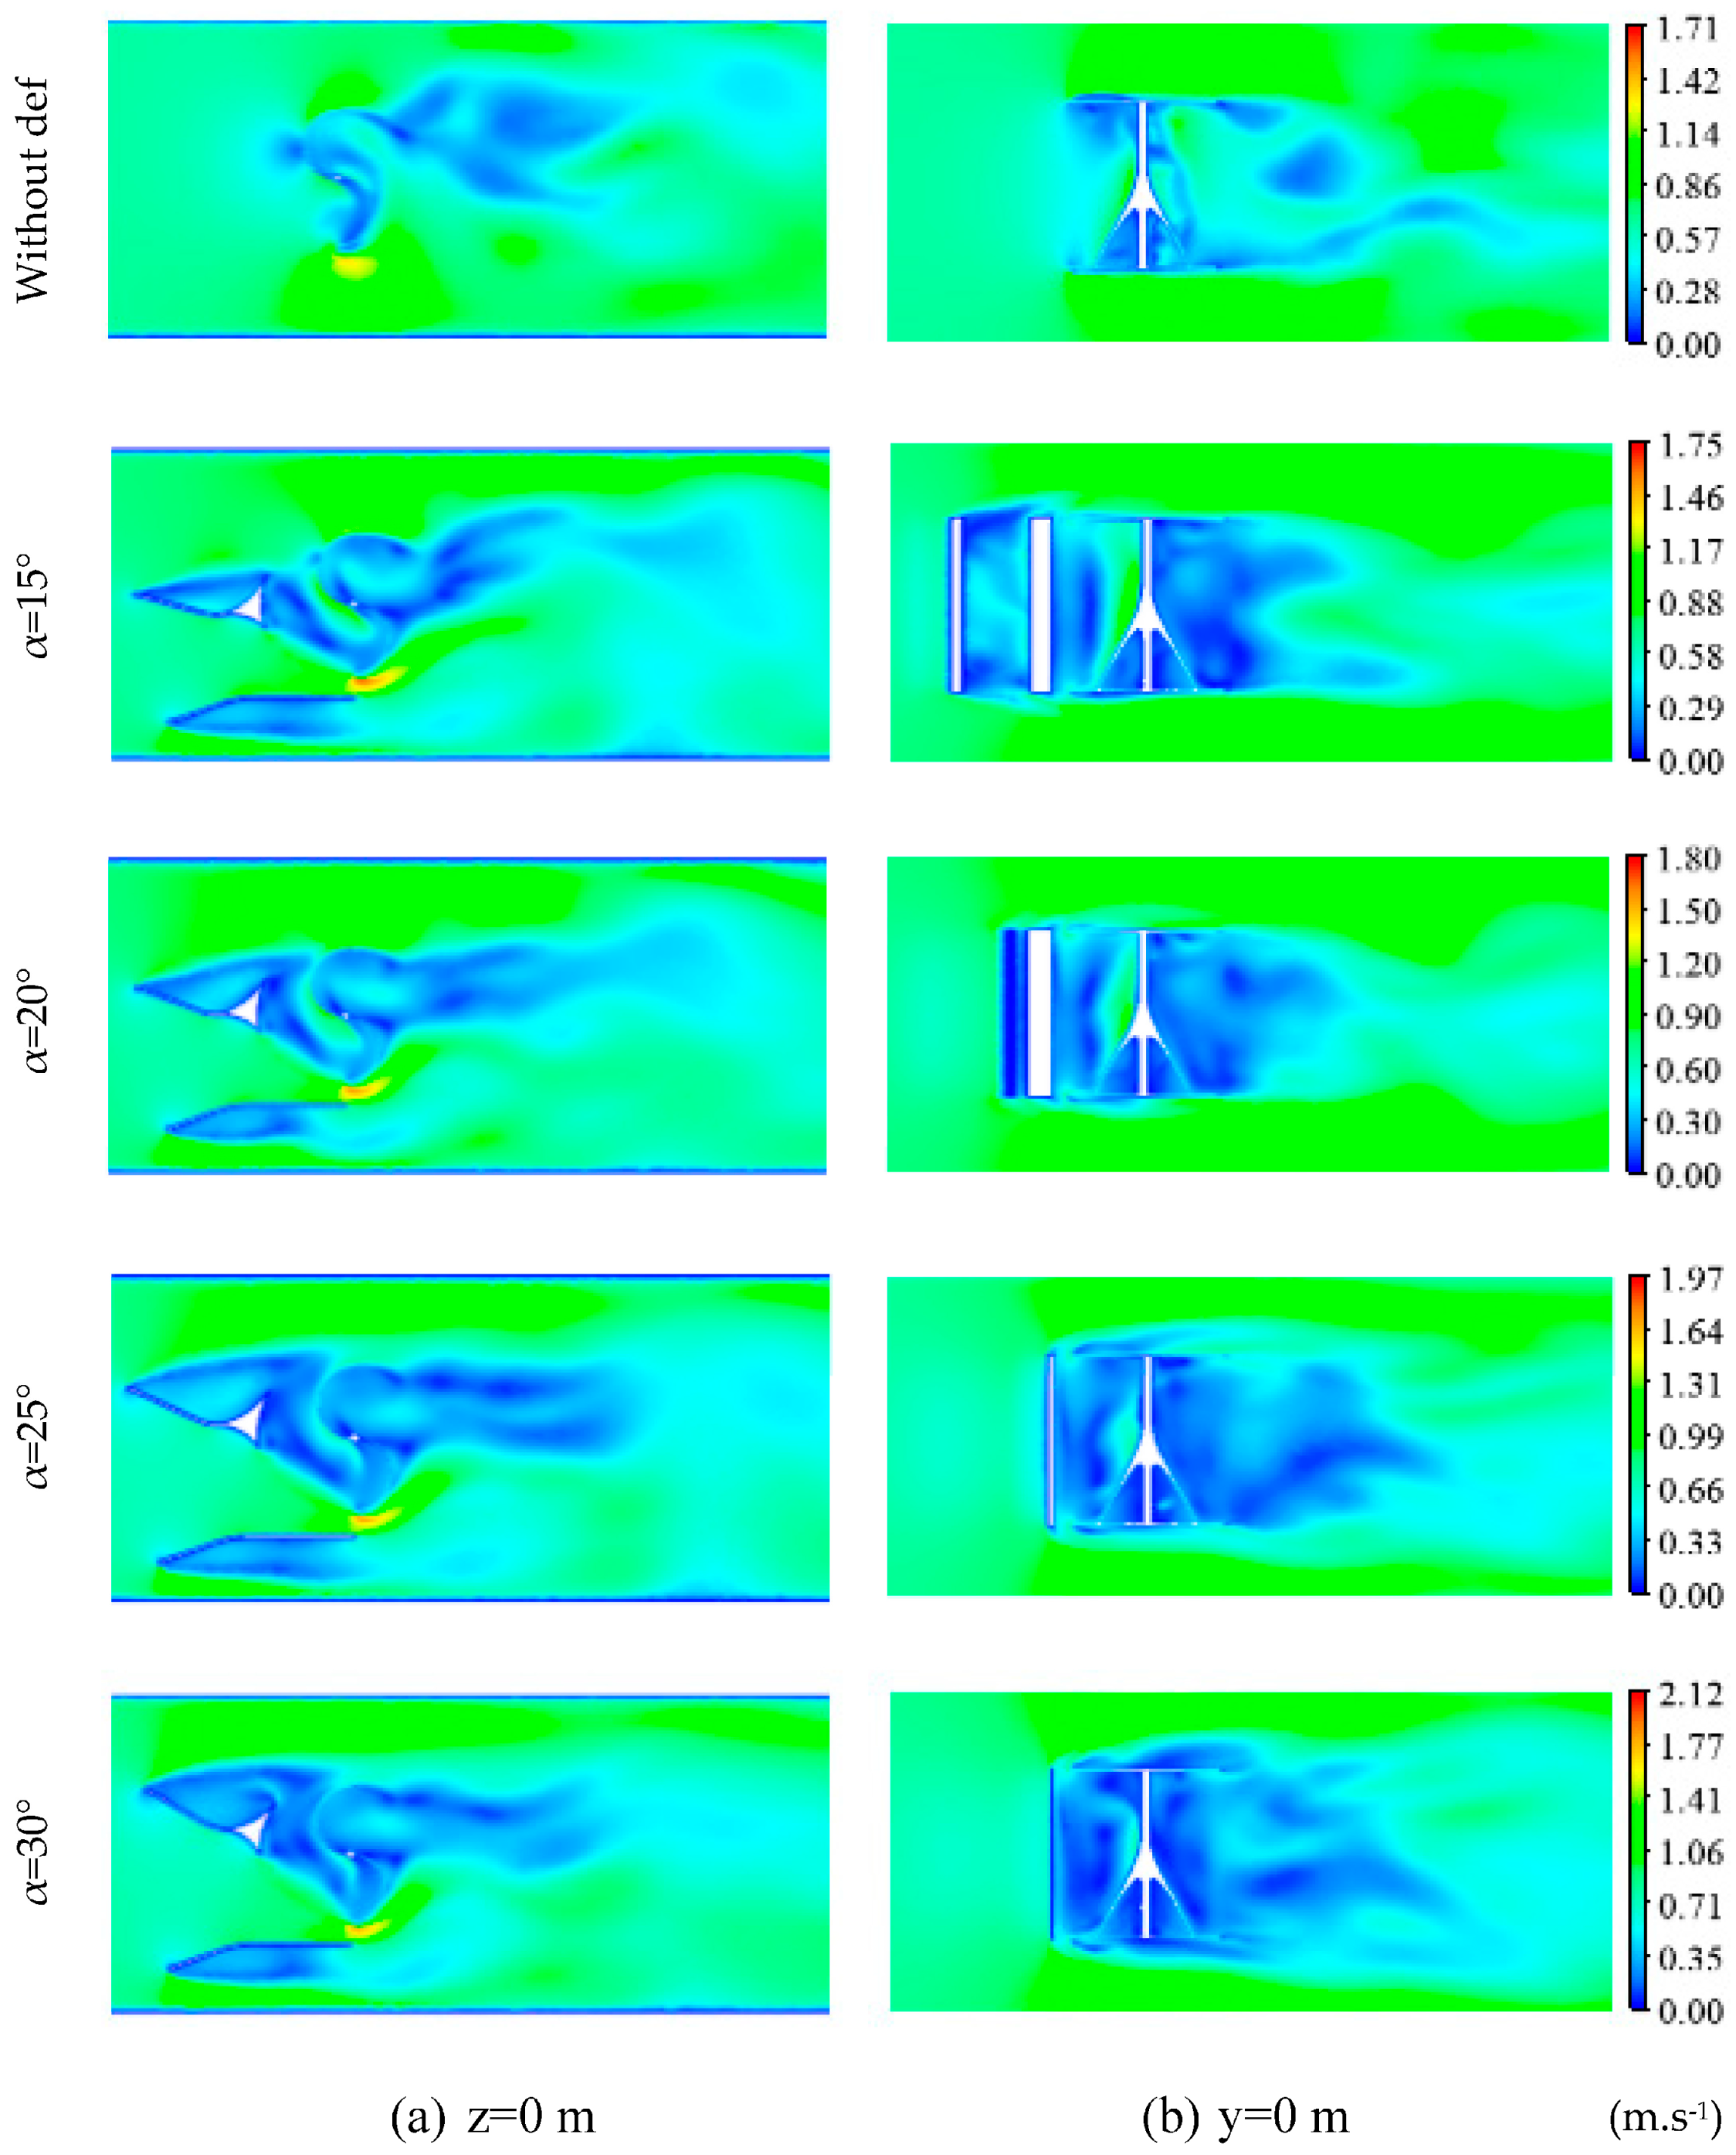
Figure 11 presents the distribution of the magnitude velocity around the Savonius rotor for the proposed deflector systems in the plane sections defined, respectively, by z = 0 m and y = 0 m at TSR = 0.69. From these results, it has been observed that upstream the Savonius rotor the velocity is almost uniform and similar to the value V = 0.86 m·s−1, as set in the boundary conditions for all studied cases. Without a deflector, the presence of a slowing zone of the water velocity upstream the rotor has been noted. In fact, the Savonius rotor is considered as a barrier in front of the flowing water. When the rotor starts to rotate, different important zones are developed, i.e., a high-velocity zone and a wake zone. In fact, it has been observed that a high velocity zone is developed at the tip of the returning vane. In addition, cyclical high flow velocity zones have been noticed near the wake zone of the flow velocity created downstream the rotor. This fact could be explained by the increase in the flow speed after passing the wake zone. By installing a deflector upstream the rotor, a noticeable increase in the peak value of the flow velocity has been observed. Indeed, this peak value has been noted at the tip of the returning vane for all deflector designs. The improvement of the flow velocity near the rotor vanes could be explained by the enhancement of the rotational speed of the Savonius rotor due to the large water volume absorbed by the deflector plates. The maximum magnitude velocity is V = 1.71 m·s−1, V = 1.75 m·s−1, V = 1.80 m·s−1, V = 1.97 m·s−1 and V = 2.12 m·s−1 for the configuration without a deflector, α = 15°, α = 20°, α = 25° and α = 30°, respectively. Comparing the different distributions, it could be confirmed that the different deflector designs affect the flow velocity around the rotor.
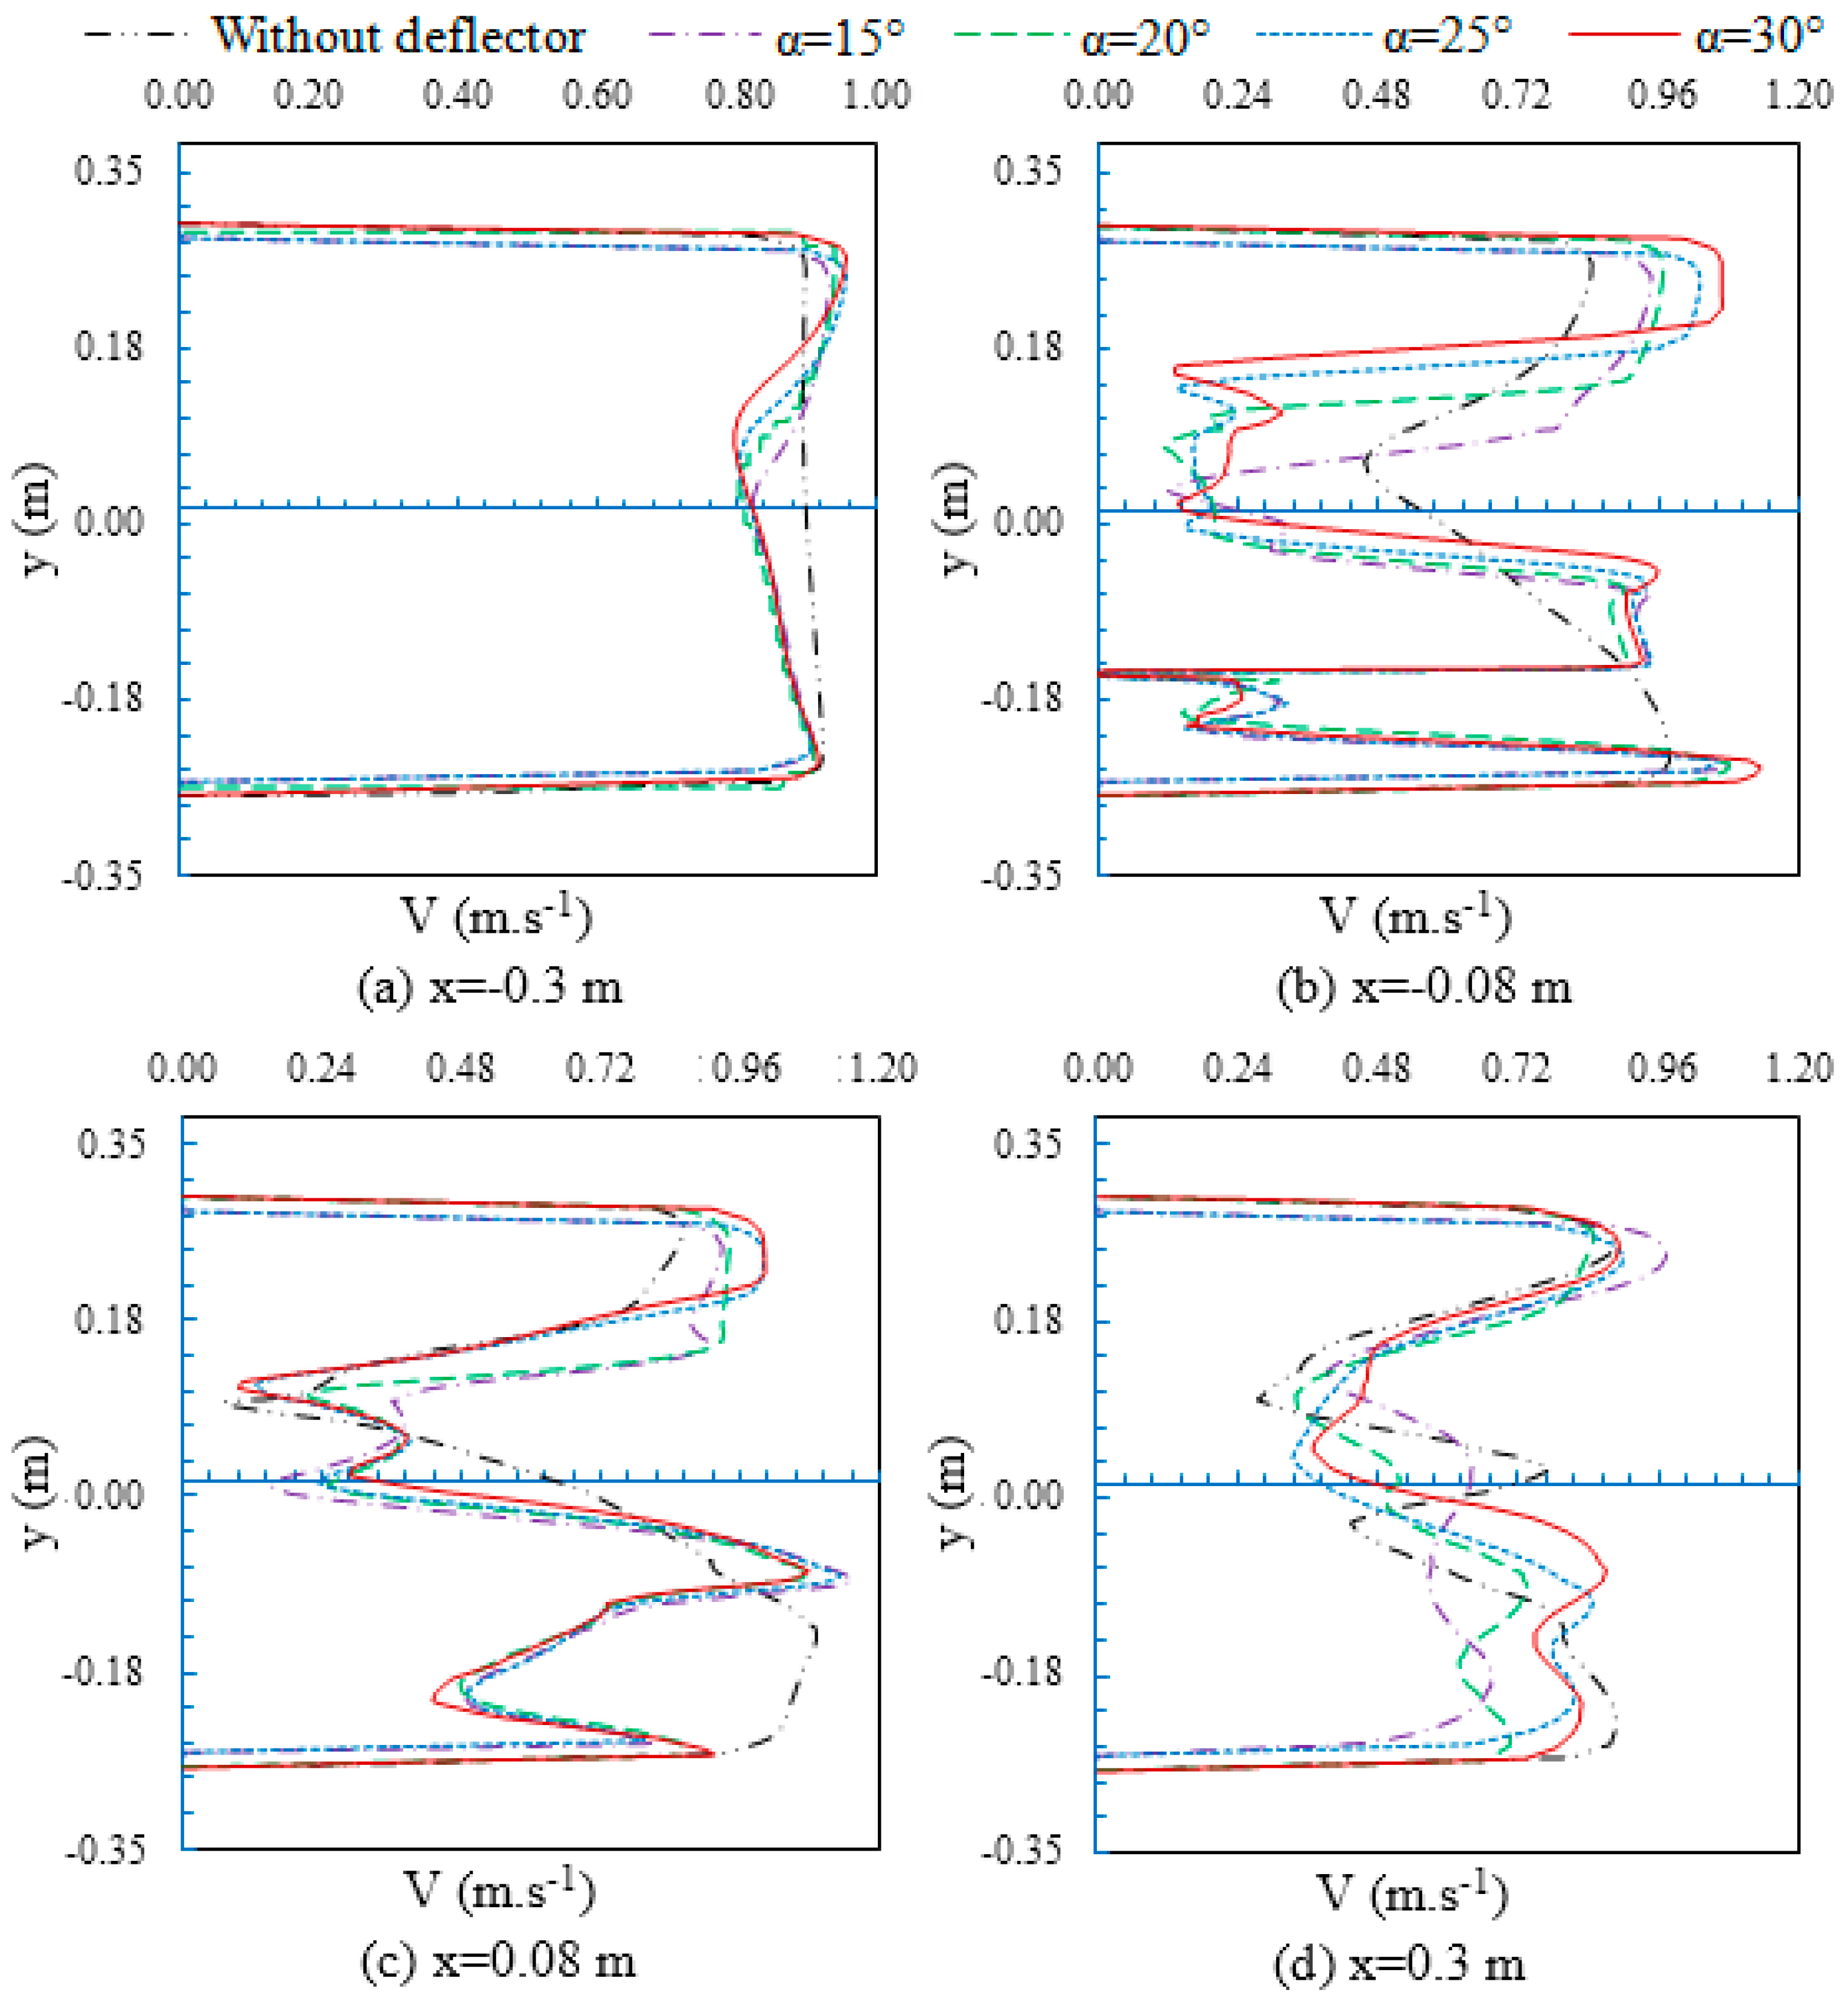
For the same axial position z = 0 and for a y coordinate ranging from y = −0.3 m to y = 0.3 m, different velocity magnitude profiles are generated to follow the evolution of the velocity for each transversal plane defined, respectively, by the x-coordinate value x = −0.3 m, x = −0.08 m, x = 0.08 m and x = 0.3 m.
The velocity profiles for the proposed configurations are shown in Figure 12. Based on these results, the velocity magnitude distribution previously described is confirmed. In fact, upstream the deflector system for x = −0.3 m, the velocity is strongly affected by the inlet boundary condition defined by V = 0.86 m·s−1 (Figure 12a). A deceleration is observed in Figure 12b,c, which corresponds to the area around the rotor. From Figure 12b and for an interval ranging from y = −0.1 m to y = 0 m and corresponding to the area in front of the concave side of the advancing blade, the velocity of the water directed to the concave side increases with the use of the deflector system compared to that without deflector. For an interval ranging from y = 0 m to y = 0.1 m and corresponding to the area in front of the convex side of the returning blade, the velocity of the water directed to the convex returning blade decreases with the use of deflector systems compared to that without a deflector. Indeed, the role of the deflector system mentioned before is confirmed. Downstream, while moving away from the rotor, the velocity starts to increase (Figure 12d). This increment characterizes the wake zone, which gradually disappears with the increase in the downstream distance, and this behavior is enhanced by the increment of the deflection angle. Comparing all configurations, it turns out that the addition of the deflector system positively affects the flow filed around the Savonius rotor in terms of velocity magnitude. The increment of the deflection angle, based on these findings, improves the predicted net torque. The highest increment is obtained for a deflection angle equal to α = 30°.
5.2. Total Pressure
Figure 13 shows the distribution of the total pressure around the Savonius rotor for the proposed deflector systems in the longitudinal planes defined by z = 0 m and y = 0 m at TSR = 0.69. The pressure distribution for all proposed configurations presents a high and a low-pressure zone. The high-pressure zone is located upstream the deflector system and is quite uniform. The low-pressure zone is located downstream the Savonius. The pressure difference upstream and downstream the rotor is responsible for the production of kinetic energy and, therefore, the rotation of the Savonius rotor.
Comparing the different configurations, it is clear that with the use of the deflector system, the pressure on the convex side of the returning blade is reduced with the increase in the deflection angle (Figure 13a). It is proved that the deflector system prevents the appearance of negative drag pressure forces, which reduces the negative produced drag torque and improves the pressure upstream the advancing blade. At the same time, a high-pressure zone appears at the tip of the advancing blade. Its maximum value increases with the increase in the deflection angle and takes the highest value for α = 30°. The pressure passes from p = 640 Pa for the configuration without a deflector to p = 812 Pa for α = 30°. The positive drag is thus improved.
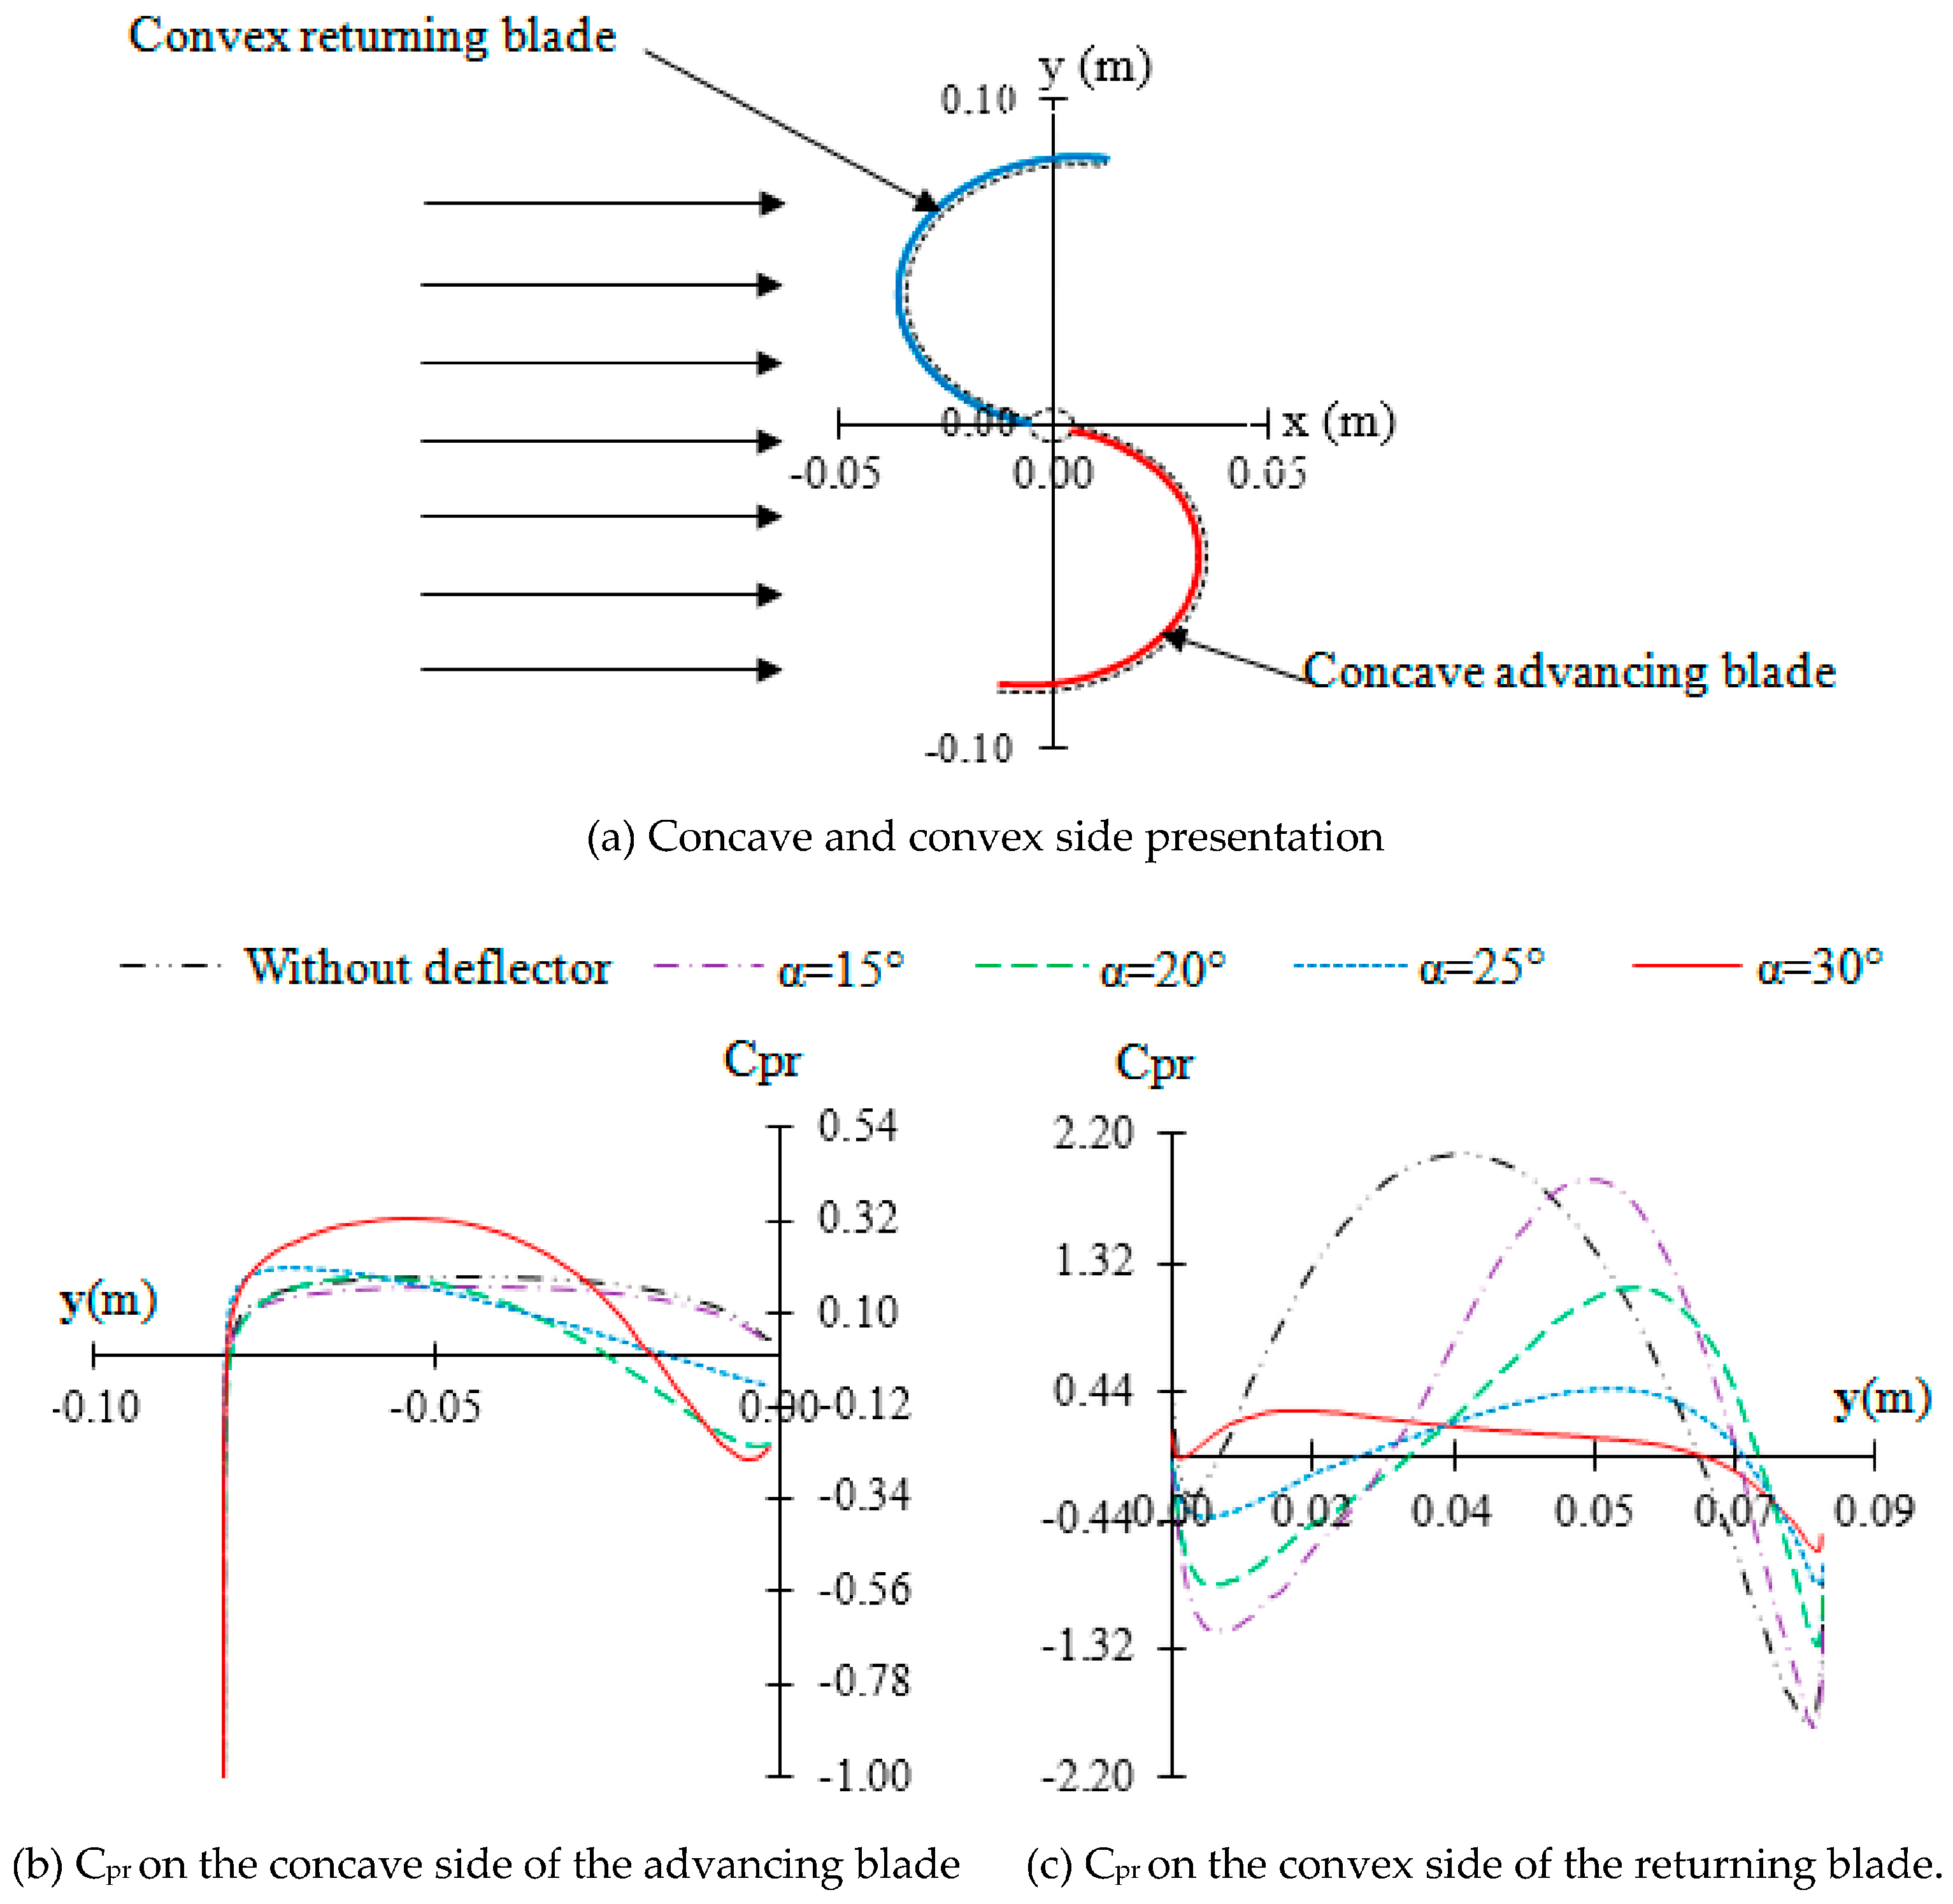
To give a further insight into the effect of the deflector system with different deflection angles on the pressure, the distribution of the pressure coefficient is plotted in the plane defined by z = 0 m, which corresponds to the middle plane of the Savonius rotor at TSR = 0.69.
The variation of the pressure coefficient (Cpr) shown in Figure 14 is plotted along the y coordinate with incoming water in the x direction. As it is depicted in Figure 14a, positive values of the y coordinate correspond to the convex side of the returning blade and negative values correspond to the concave side of the advancing blade. From Figure 14b, the highest-pressure coefficient on the concave side of the advancing blade is obtained for α = 30°, corresponding to Cpr = 0.33 against the value Cpr = 0.2 obtained without a deflector. Therefore, a higher positive drag is obtained for α = 30°. From Figure 14c, the pressure coefficient on the convex side of the returning blade decreases with the increase in the deflection angle. Its lowest value is computed for α = 30°, corresponding to Cpr = 2.07 against the value Cpr = 0.31 obtained without a deflector. Therefore, a lesser negative drag is obtained. Thus, the highest total drag is obtained with a deflection angle of α = 30°.
5.3. Turbulent Kinetic Energy
Figure 15 shows the distribution of the turbulent kinetic energy around the Savonius rotor for the proposed deflector systems in the longitudinal planes defined by z = 0 m and y = 0 m at TSR = 0.69.
Upstream the rotor, the turbulent kinetic energy is almost negligible. It increases slightly around the rotor and seems more remarkable at the attack point of both the advancing and the returning blade for the proposed configurations (Figure 15a). This increment is likely to be related to the energy produced from the lift force while the turbine rotates. Comparing the distribution of the turbulent kinetic energy for the proposed deflector systems, it is noticed that the increase in the deflection angle leads to an improvement in the range of the turbulent kinetic energy values. In fact, the increase in the deflection angle increases the upstream flow fields directed to the rotor blades, which results in an improved rotational speed of the rotor and in an increment of the energy production. Downstream the rotor, a remarkable zone characterized by a slight increase in the turbulent kinetic energy values is observed for all configurations. From Figure 15b, this zone becomes more important with the increase in the deflection angle. It is about the wake phenomenon. This wake is improved with the use of the deflector systems and remains more important for α = 30°. While getting away from the rotor, the turbulent kinetic energy decreases gradually because of its dissipation far away from the rotor. Thus, the use of the deflector system positively affects the turbulent kinetic energy distribution around the Savonius rotor.
5.4. Turbulence Eddy Dissipation
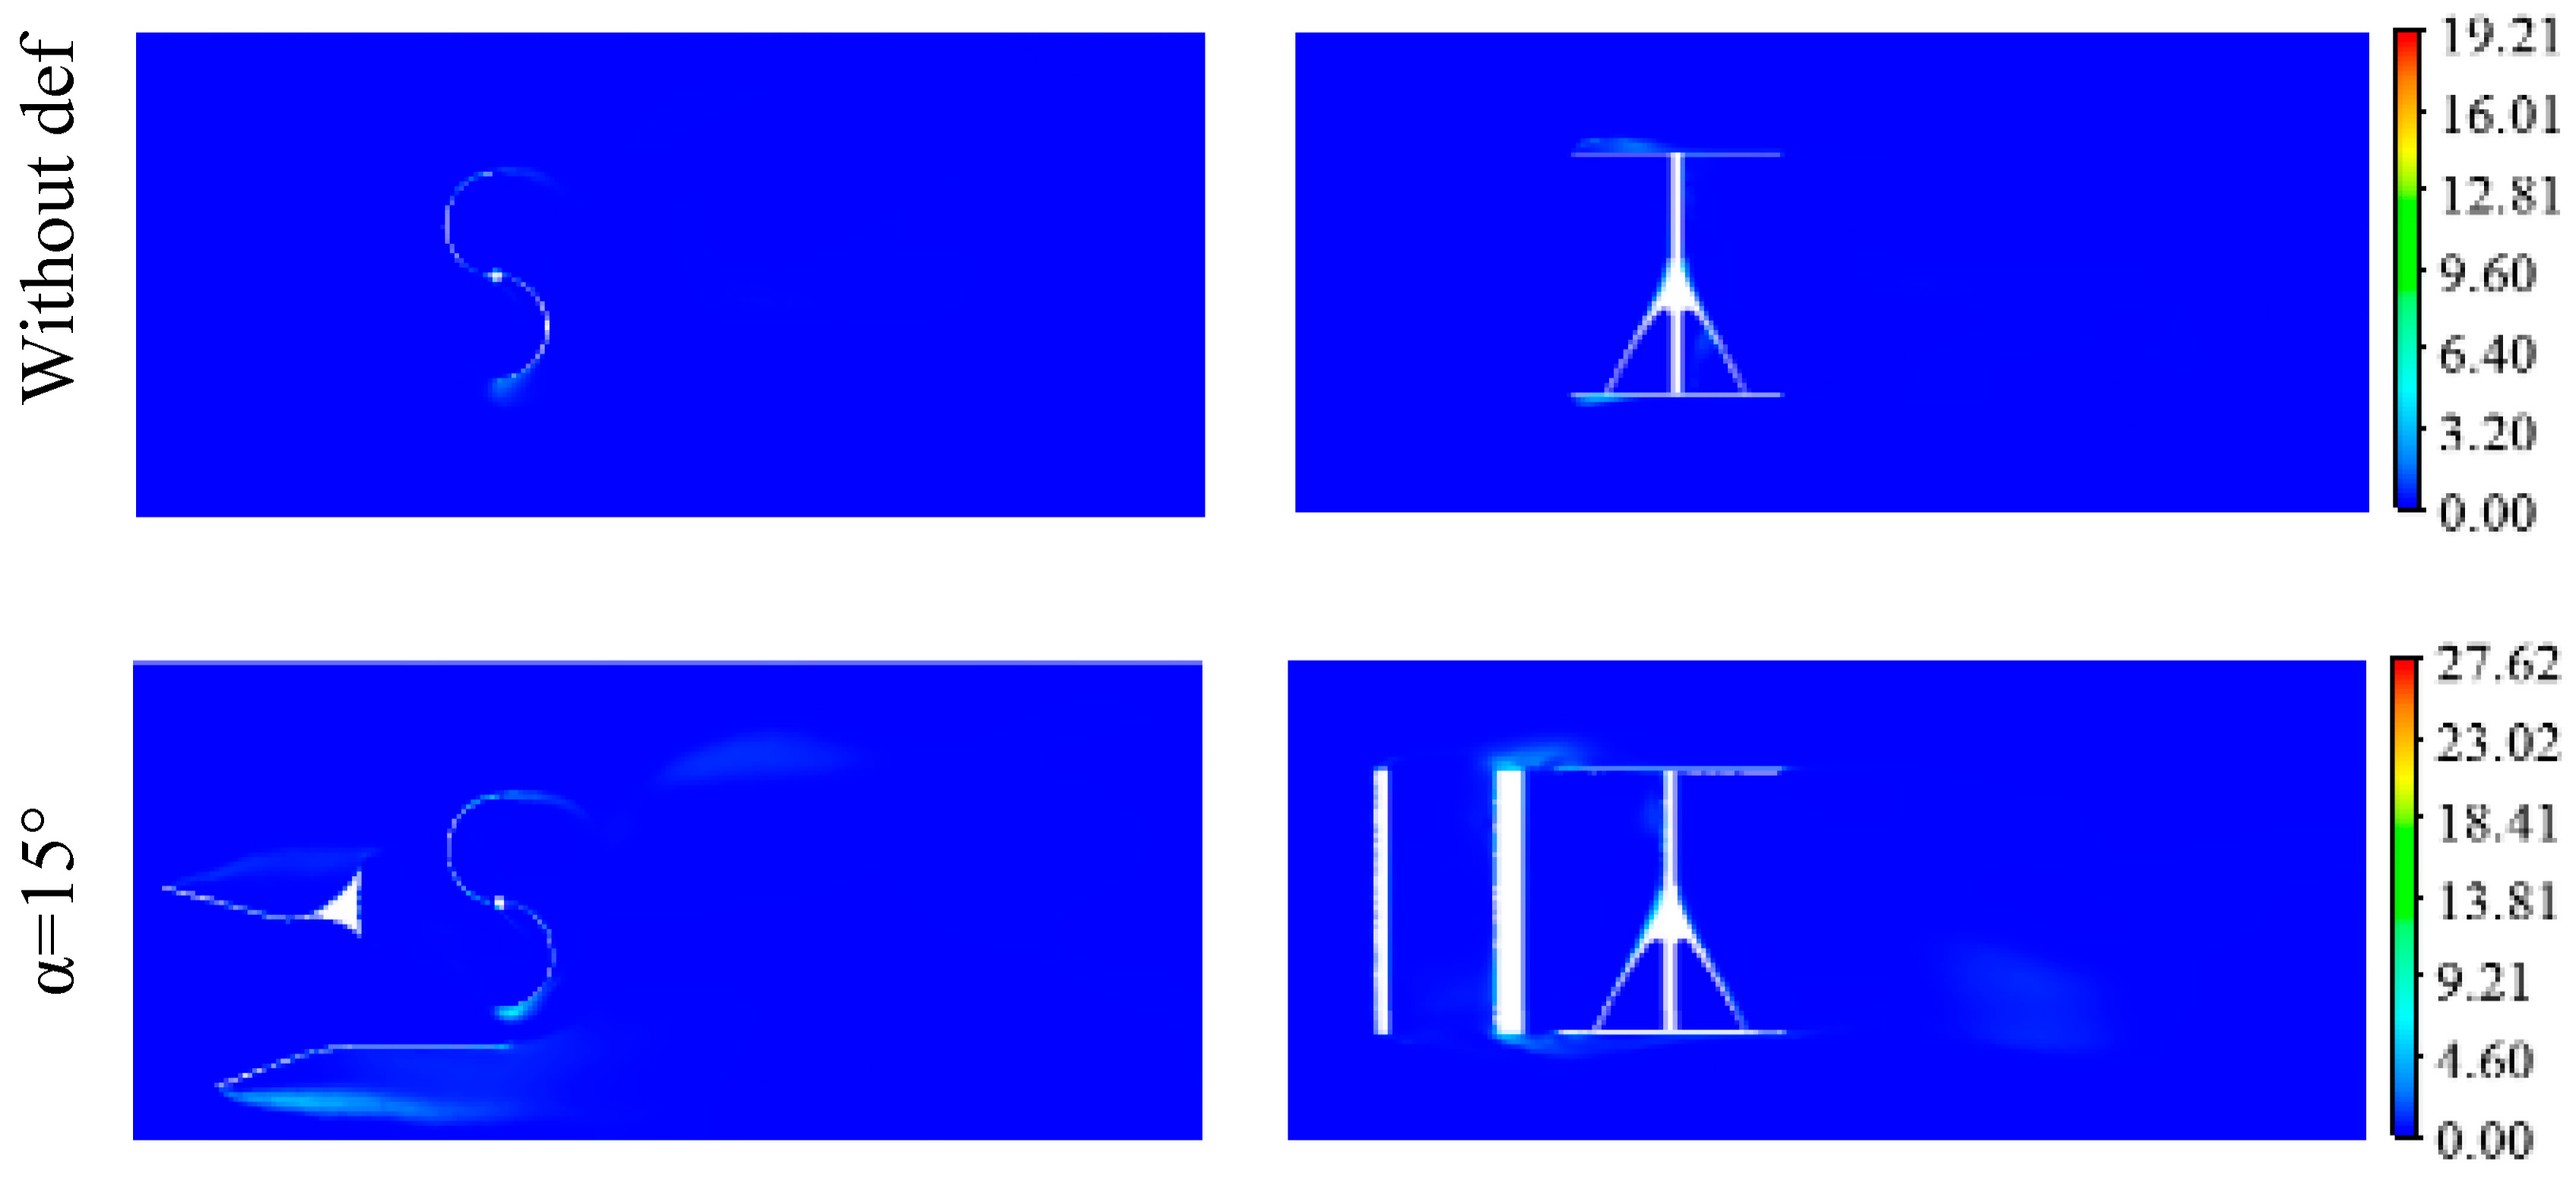
Figure 16 shows the distribution of the turbulent eddy dissipation around the Savonius rotor for the proposed deflector systems in the longitudinal planes defined by z = 0 m and y = 0 m at TSR = 0.69. These results indicate the turbulent eddy dissipation ε relative to the turbulent kinetic energy. The turbulent eddy dissipation is practically negligible in the entire computational domain, but it remains slightly noteworthy at the level of the deflector system tips and at the rotor blade surfaces. In fact, the turbulent eddy dissipation increases mainly at the attack point of both advancing and returning blades, which corresponds to high turbulent kinetic energy zones. Thus, higher dissipation zones are derived from higher energy zones. Comparing the range of values corresponding to the proposed deflector systems, it is noted that the turbulent eddy dissipation increases with the increase in the deflection angle. This fact is expected as it was found that the turbulent kinetic energy increases along with the increase in the deflection angle, and as the turbulent eddy dissipation is proportional to the turbulent kinetic energy. Thus, the maximum value of the turbulent eddy dissipation is obtained for a deflection angle of α = 30°.
5.5. Turbulent Viscosity
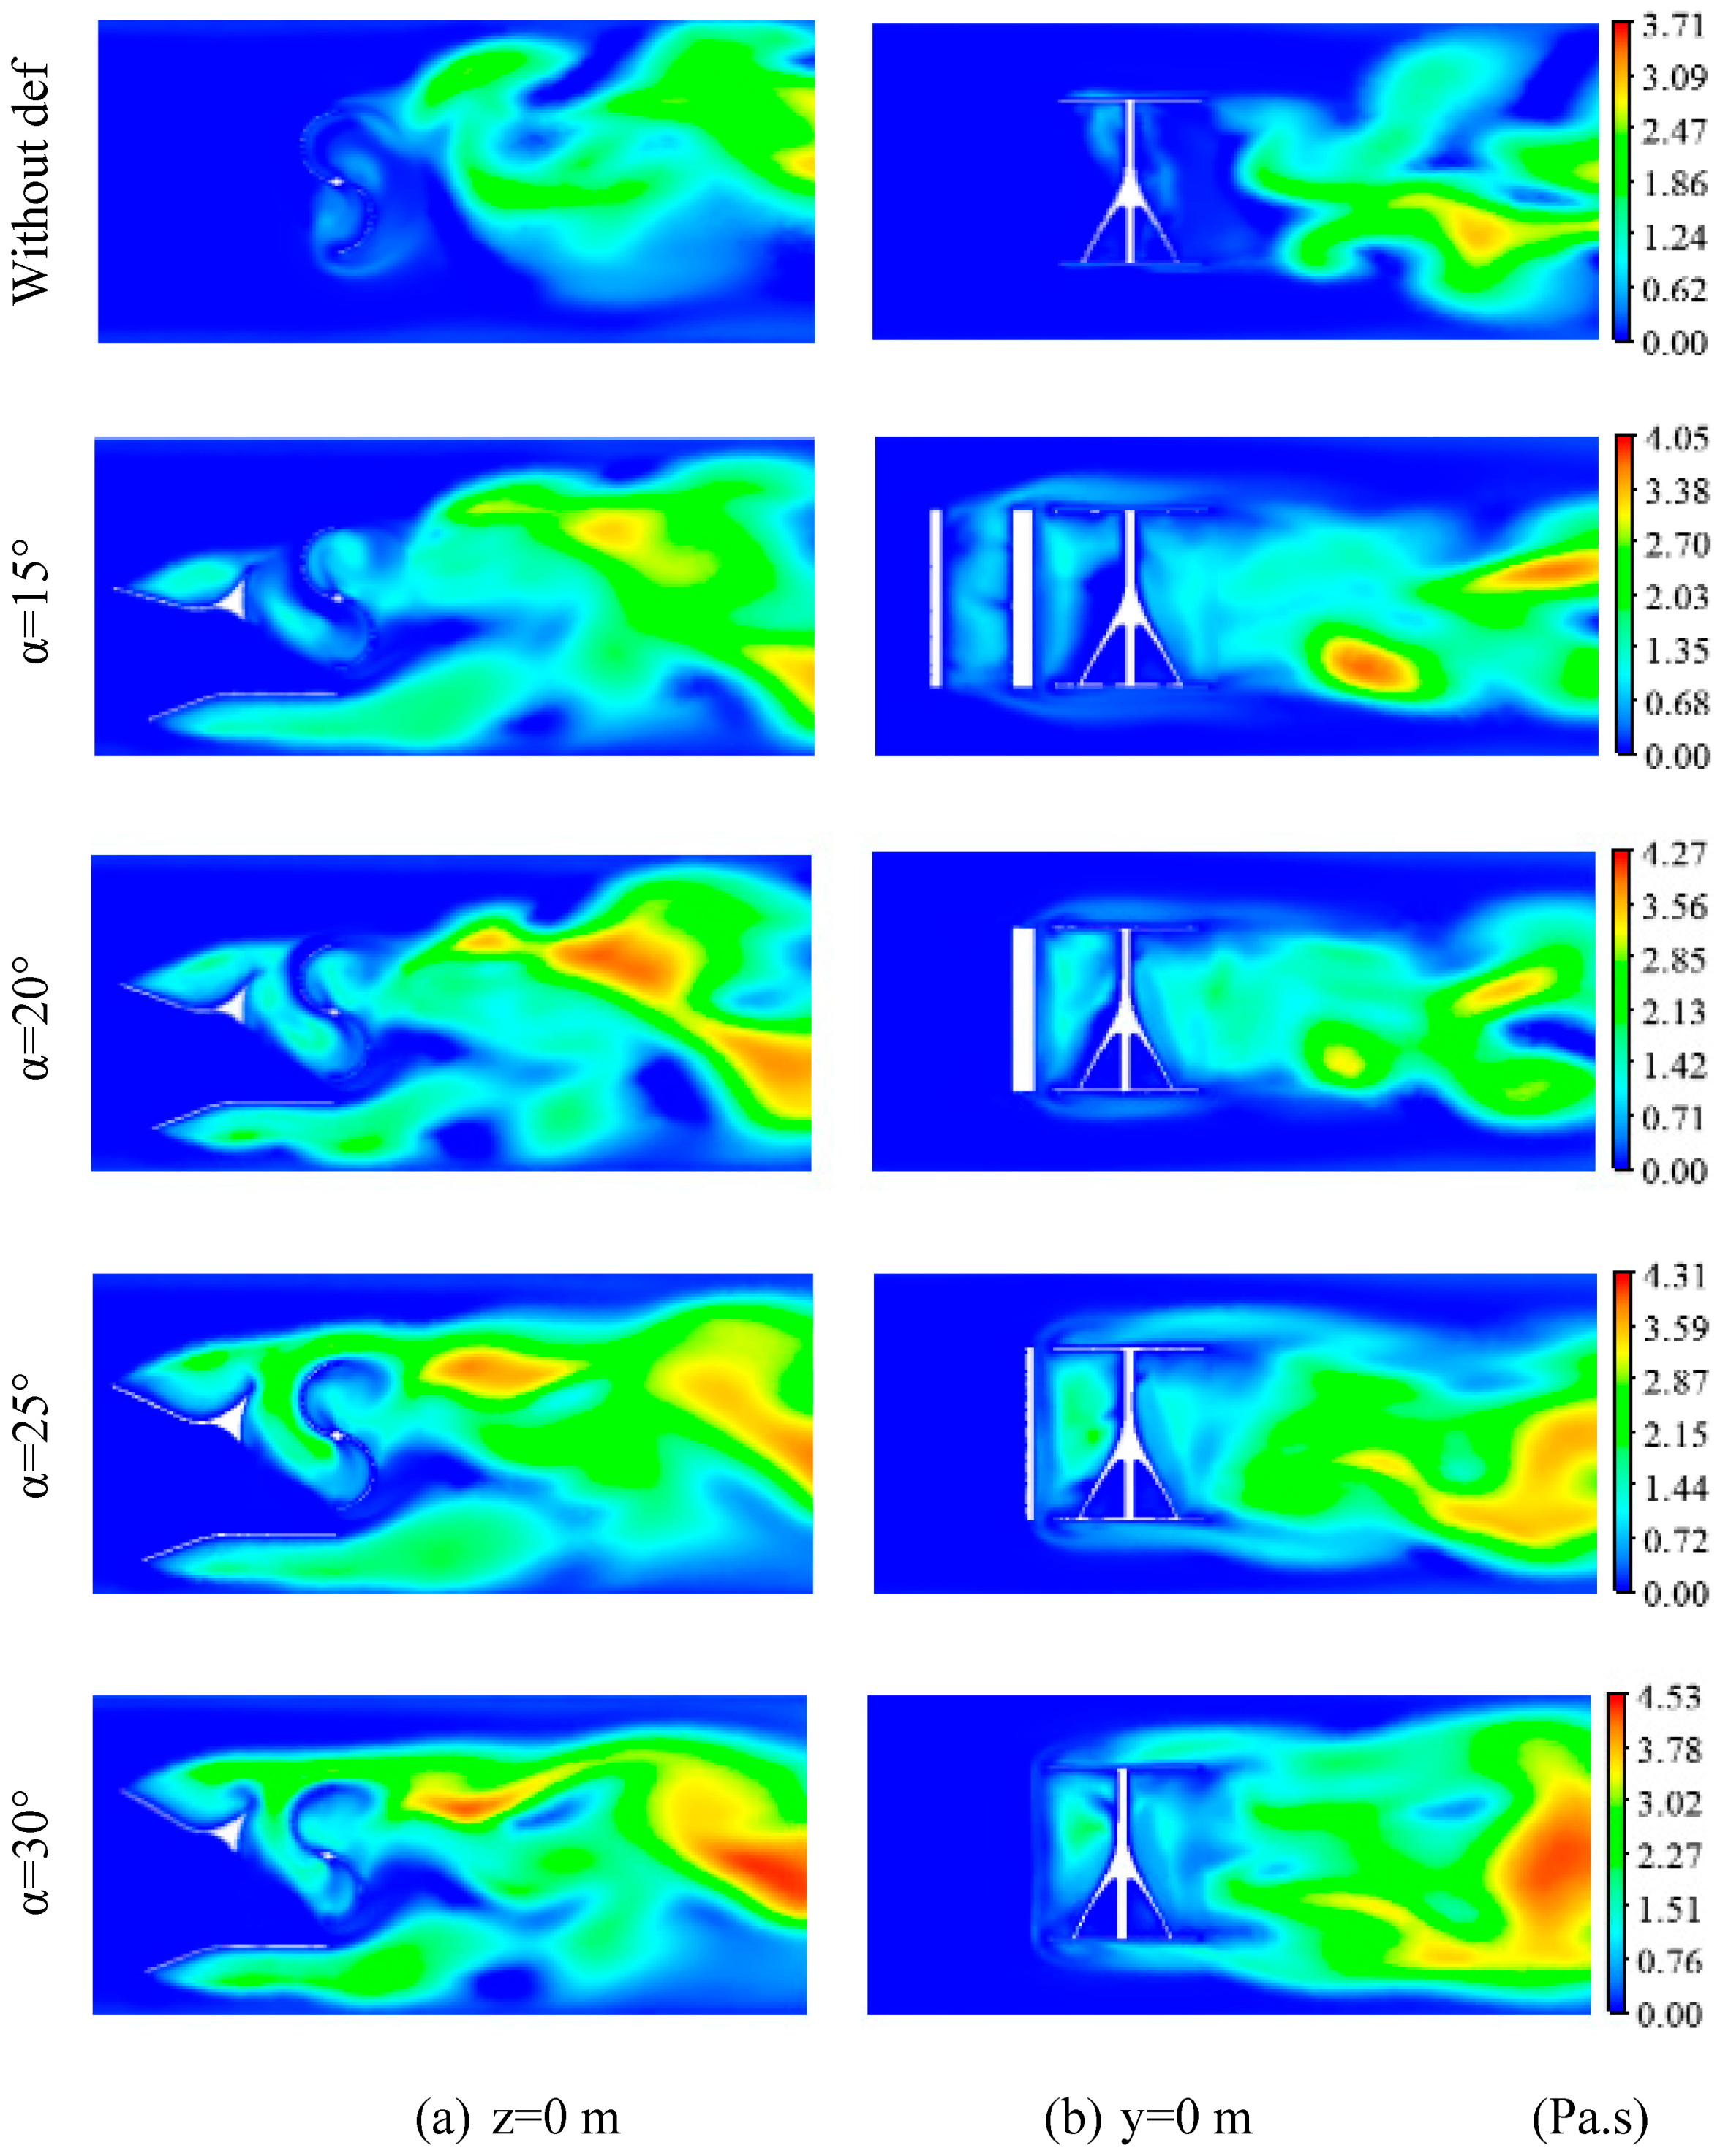
Figure 17 shows the distribution of the turbulent viscosity around the Savonius rotor for the proposed deflector systems in the longitudinal planes defined by z = 0 m and y = 0 m at TSR = 0.69. For all configurations, it is clearly noted that the turbulent viscosity is very low upstream the deflector system. Around the rotor, the turbulent viscosity distribution becomes more noteworthy and highlights remarkable zones located in front of the concave side of both the advancing and the returning blade. These zones become more important with the increase in the deflection angle, especially the zone of the advancing blade. Indeed, the flow around the concave side of the advancing blade is ameliorated with the aid of the deflector system, as well as the flow around the concave side of the returning blade. Thus, the Savonius rotor anti-clockwise rotation is ameliorated. Downstream the rotor, a zone highlighting maximum turbulent viscosity values appears. Weak velocity is due to more vortices born there, which are responsible for more turbulent viscosity detected there. From Figure 17a, this zone becomes wider with a higher range of values while increasing the deflection angle. The maximum value of the turbulent viscosity is obtained for a deflection angle equal to α = 30°. Thus, the wake is improved with the increase in the deflection angle and seems optimum for α = 30°. Getting away from the rotor, the turbulent viscosity decreases progressively, as shown in Figure 17b. This fact is due to the dissipation of vortices.
5.6. Turbulent Intensity
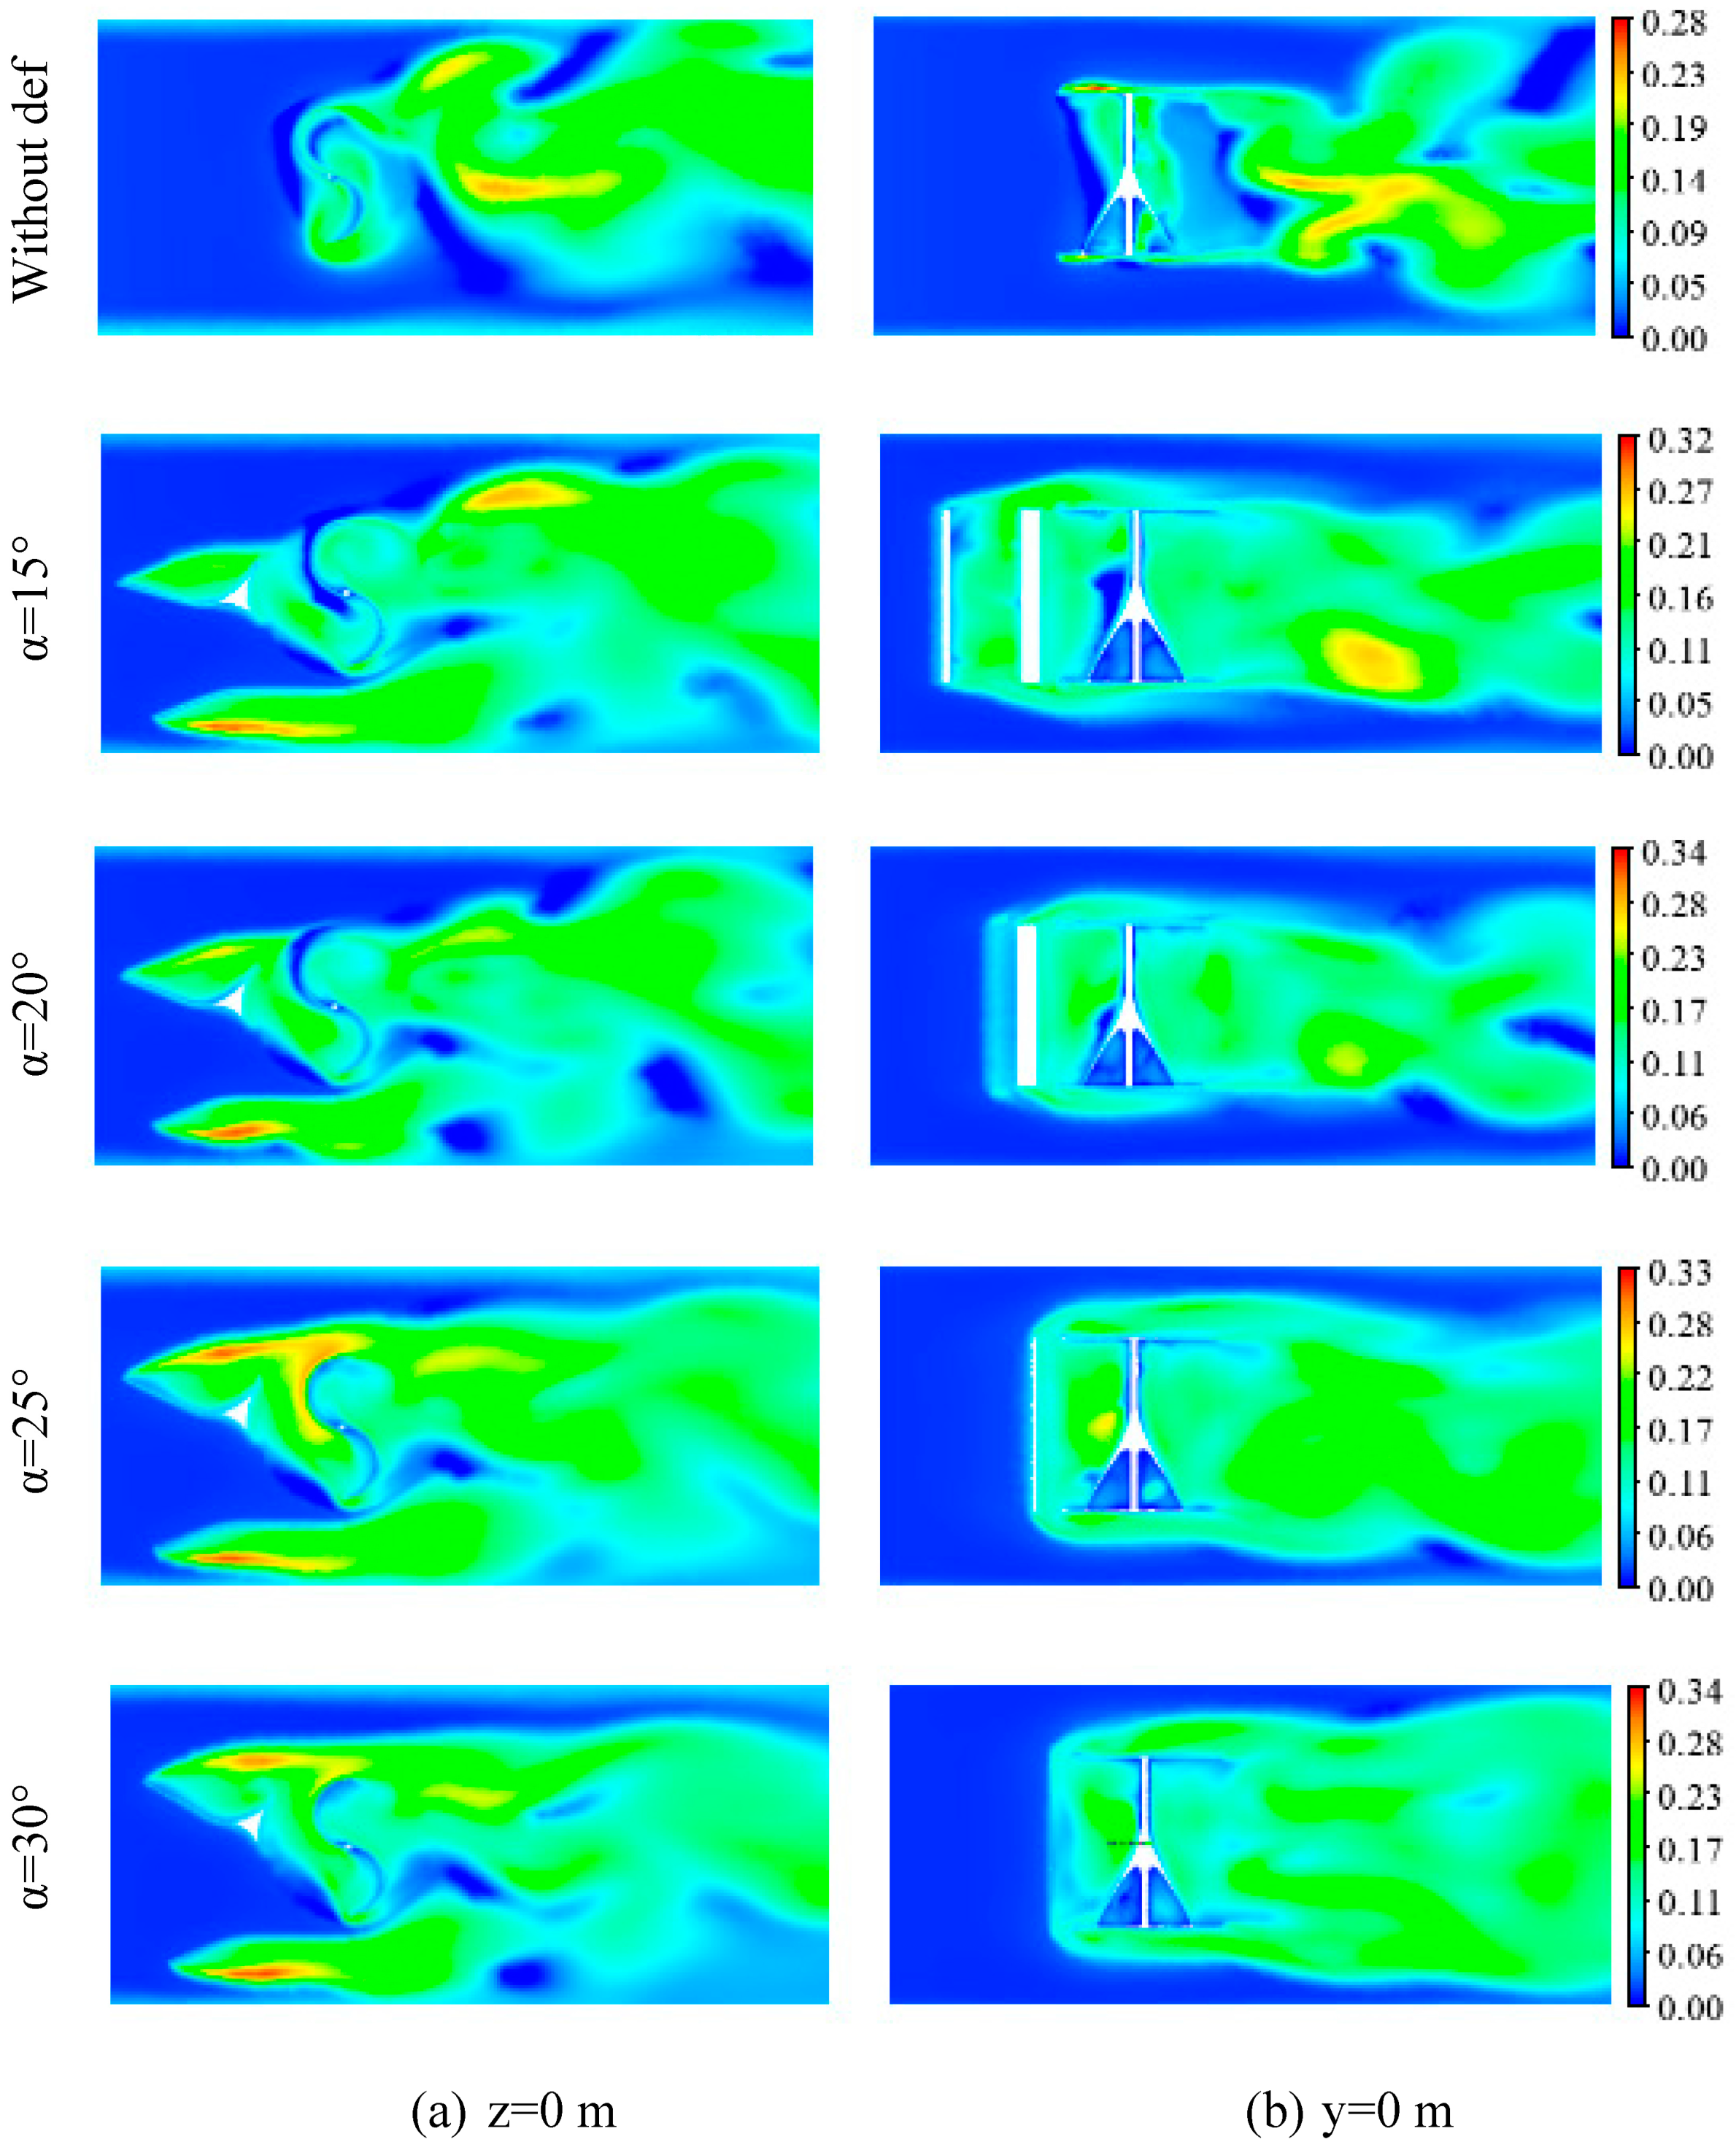
Figure 18 shows the distribution of the turbulent intensity around the Savonius rotor for the proposed deflector systems in the longitudinal planes defined by z = 0 m and y = 0 m at TSR = 0.69.
Upstream the deflector system, the turbulent intensity seems to be weak for all configurations. Approaching the rotating domain of the helical Savonius rotor, it is noticed that the turbulent intensity increases brutally and shows important zones with a higher range of values located in front of the concave side of both the advancing and the returning blades (Figure 18a). By comparing the different configurations, it has been noted that these zones become more noteworthy with the increase in the deflection angle, mainly in front of the advancing blade. This is related to the creation of more vortices and so more viscosity detected there, as mentioned before. The use of a deflector system enhances the rotation anti-clockwise by directing the flow to the concave side of the advancing blade and redirecting an amount of it to the concave side of the returning blade. Downstream the rotor, a remarkably high turbulent intensity zone appears as an index of the wake phenomenon. The flow becomes more turbulent due to the vortices formation, resulting in a deficit of the velocity values and in the wake of the flow downstream. According to Figure 18a, this zone becomes wider with a higher range of values while increasing the deflection angle. The maximum value of the turbulent intensity is obtained for a deflection angle equal to α = 30°. Thus, the wake is improved with the increase in the deflection angle and seems optimum with α = 30°. Getting away from the rotor, the turbulent intensity decreases progressively, as shown in Figure 18b. This fact is due to the dissipation of the turbulence downstream while moving away from the rotor, as mentioned before.
5.7. Performance Characteristics
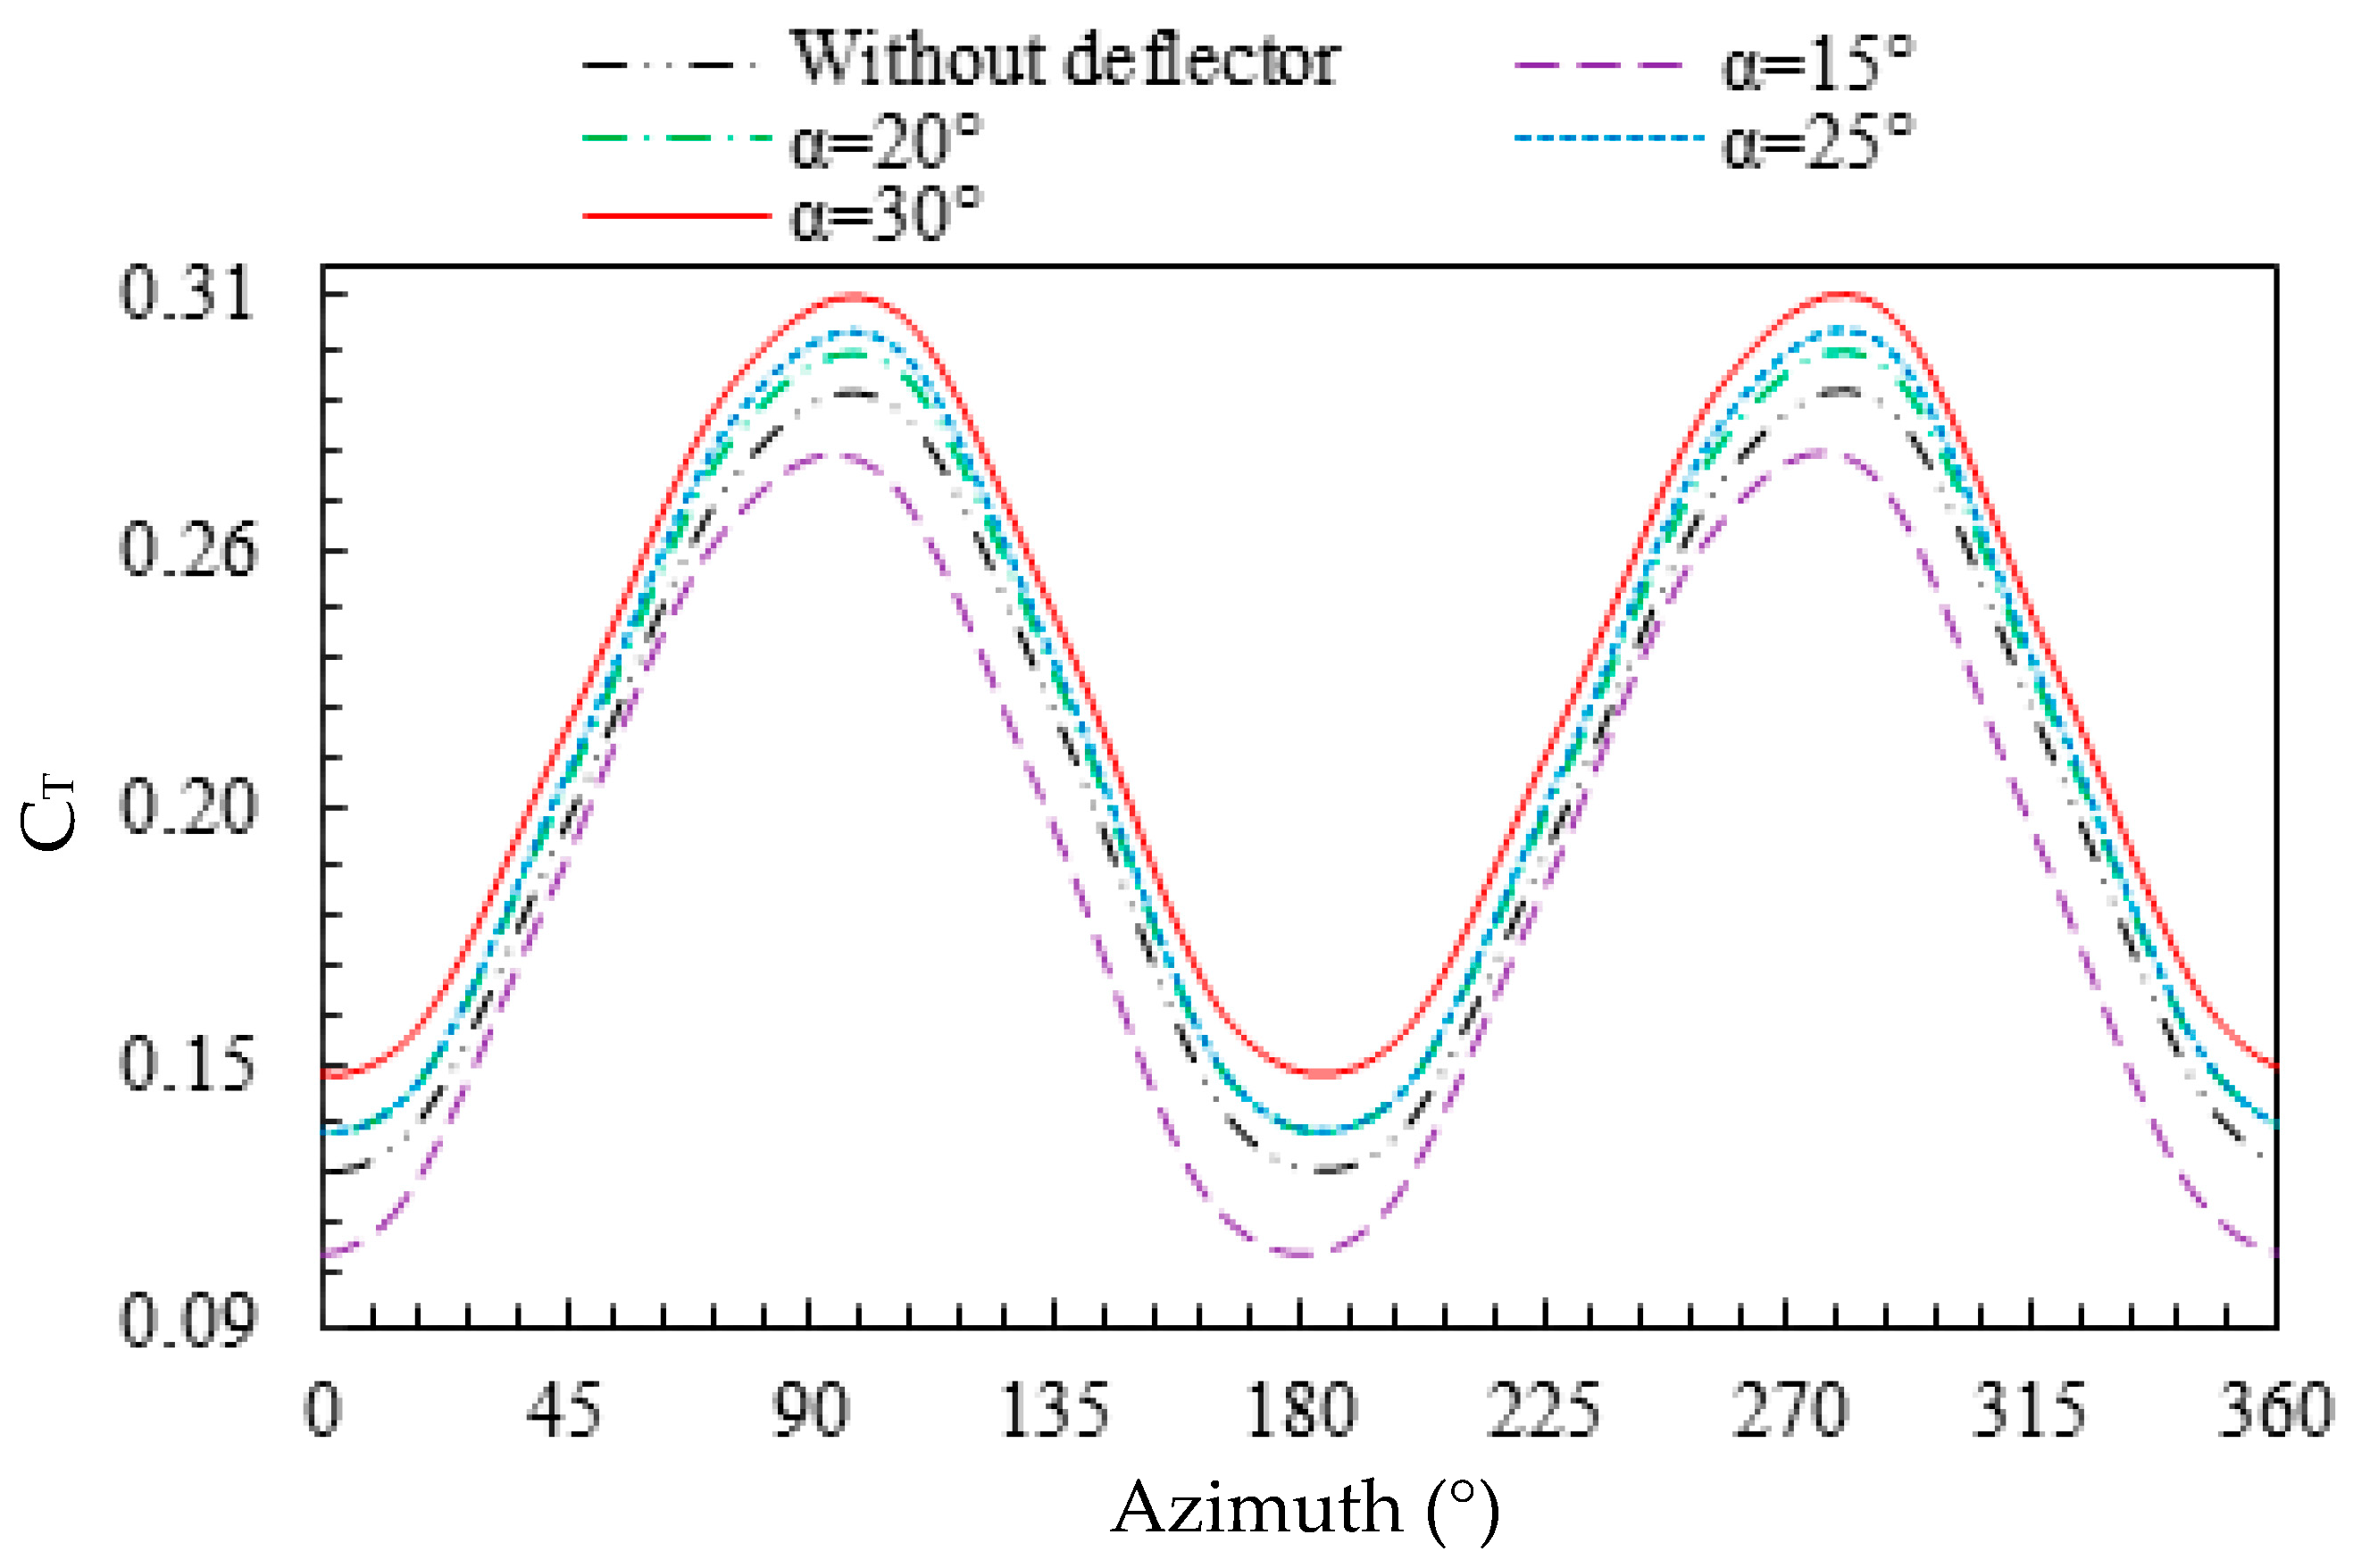
The variation of the torque coefficient versus the angular position θ for one revolution is presented in Figure 19 for the different configurations of the deflector system at TSR = 0.69. From these results, it is clear that the addition of the deflector system positively affects the torque coefficient of the Savonius rotor. Its average value increases with the increase in the deflection angle, except for α = 15°. The highest value is obtained for a deflection angle of α = 30°, as it was predicted from the results above. The average torque coefficient changes from CT = 0.20 for the configuration without a deflector to CT = 0.23 for α = 30°. Thus, a significant improvement in the predicted net torque is obtained. This fact is justified by the reduction in the negative drag force by preventing the convex returning blade from the incoming water and the increase in the positive drag force by redirecting the water flow to the concave advancing blade.
The effect of the addition of the deflector system on the efficiency of the Savonius rotor is investigated. A superposition of the power coefficients for a wide range of tip speed ratios varying from TSR = 0.4 to TSR = 1.2 is presented in Figure 20 for the configuration without a deflector and with a deflector system for different deflection angles. The power coefficient has the same evolution for the studied configurations. It increments with the rise in the tip speed ratio until it reaches its peak, over which it decays. According to these findings, it could be confirmed that the deflector systems with α = 30° present the highest power coefficient value compared to the other configurations. In fact, using a deflection angle equal to α = 30°, the power coefficient of the Savonius rotor reaches a peak value equal to Cp,max = 0.163 at a tip speed ratio TSR= 0.81. For the configuration without a deflector, the maximum power coefficient is equal to Cp,max = 0.143 at a tip speed ratio TSR = 0.7. Thus, we numerically confirm an improvement in CP by 14%.
6. Conclusions
In this paper, experimental studies were carried out to assess the efficiency of a Savonius rotor in an irrigation canal with a flow velocity of V∞ = 0.86 m·s−1. In addition, a deflector system was suggested and four deflector designs were numerically tested to examine their influence on the efficiency of the Savonius rotor. Computational investigations were conducted by means of the CFD code ANSYS FLUENT 17.0. The main outputs of this paper are summarized as follows:
- The rotational speed of the Savonius rotor reaches a peak value of 119 rpm.
- The maximum experimental power coefficient Cp max = 0.14 is reached at a tip speed ratio equal to TSR = 0.69.
- From the numerical results, it has been confirmed that the performance parameters of the Savonius rotor are improved with the use of the upstream deflector.
- The most performant configuration over the different studied cases gives an improvement of 14% in the power coefficient.
- The proposed deflector system affects the flow characteristics around the Savonius rotor.
It is suggested that the present work may be extended for further experimental and numerical studies on the proposed deflector system by varying design parameters such as height and deflector plate profile with varying flow rates.
Author Contributions
Conceptualization, M.M.; methodology, C.A. and M.S.; software, M.M., M.D. and B.M.; validation, C.A., M.S. and Z.D.; formal analysis, M.M. and Z.D.; investigation, M.M. and M.L.; resources, M.M.; data curation, M.M.; Writing—Original draft preparation, M.M.; Writing—Review and editing, M.M., C.A., M.S. and Z.D.; visualization, M.M., C.A., M.S. and Z.D.; supervision, C.A., M.S. and Z.D.; project administration, M.M.; funding acquisition, M.M. All authors have read and agreed to the published version of the manuscript.
Funding
This research received no external funding.
Institutional Review Board Statement
Not applicable.
Informed Consent Statement
Not applicable.
Data Availability Statement
The data presented in this study are available on request from the corresponding author.
Acknowledgments
This research was supported by the Higher National Engineering School of Tunis (ENSIT).
Conflicts of Interest
The authors declare no conflict of interest.
Nomenclature
| C1ε | constant of the k-ε turbulence model, dimensionless |
| c | vane chord, m |
| D | Savonius turbine diameter, m |
| Gk | production term of turbulence, kg·m−1·s−3 |
| H | Savonius turbine height, m |
| k | turbulent kinetic energy, m2·s−2 |
| average pressure, Pa | |
| R | Savonius turbine radius, m |
| s | turbine shaft diameter, m |
| Tr | turbine torque, N·m |
| t | time, s |
| uj | velocity components, m·s−1 |
| fluctuating velocity components, m·s−1 | |
| V∞ | flow velocity, m·s−1 |
| xi | Cartesian coordinate, m |
| x | Cartesian coordinate, m |
| y | Cartesian coordinate, m |
| z | Cartesian coordinate, m |
| ε | dissipation rate of the turbulent kinetic energy, W·kg−1 |
| μ | dynamic viscosity, Pa·s |
| μt | turbulent viscosity, Pa·s |
| ρ | density, kg·m−3 |
| ω | turbine rotational speed, rad·s−1 |
| TSR | tip-speed ratio, dimensionless |
| σk | constant of the k-ε turbulence model, dimensionless |
| σε | constant of the k-ε turbulence model, dimensionless |
| ψ | Savonius turbine vane twist angle, ° |
References
- Ocetkiewicz, I.; Tomaszwska, B.; Mróz, A. Renewable energy in education for sustainable development. The Polish experience. Renew. Sustain. Energy Rev. 2017, 80, 92–97. [Google Scholar] [CrossRef]
- Peng, Z.; Guo, W. Saturation characteristics for stability of hydro-turbine governing system with surge tank. Renew. Energy 2019, 131, 318–332. [Google Scholar] [CrossRef]
- Patel, V.; Eldho, T.I.; Prabhu, S.V. Velocity and performance correction methodology for hydrokinetic turbines experimented with different geometry of the channel. Renew. Energy 2019, 131, 1300–1317. [Google Scholar] [CrossRef]
- Khan, M.J.; Bhuyana, G.; Iqbal, M.T.; Quaicoe, J.E. Hydrokinetic energy conversion systems and assessment of horizontal and vertical axis turbines for river and tidal applications: A technology status review. Appl. Energy 2009, 86, 1823–1835. [Google Scholar] [CrossRef]
- Gupta, R.; Biswas, A.; Sharma, K.K. Comparative study of a three-bucket Savonius rotor with a combined three-bucket Savonius–three-bladed Darrieus rotor. Renew. Energy 2008, 33, 1974–1981. [Google Scholar] [CrossRef]
- Alexander, A.J.; Holownia, B.P. Wind tunnel tests on a Savonius rotor. Wind Eng. Ind. Aerodyn. 1978, 3, 343–351. [Google Scholar] [CrossRef]
- Saha, U.K.; Thotla, S.; Maity, D. Optimum design configuration of Savonius rotor through wind tunnel experiments. Wind Eng. Ind. Aerodyn. 2008, 96, 1359–1375. [Google Scholar] [CrossRef]
- Kamoji, M.A.; Kedare, S.B.; Prabhu, S.V. Experimental investigations on single stage two stage and three stage conventional Savonius rotor. Int. J. Energy 2008, 32, 877–895. [Google Scholar] [CrossRef]
- Jeon, K.S.; Jeong, J.I.; Pan, J.K.; Ryu, K.W. Effects of the end plates with various shapes and sizes on helical Savonius wind turbines. Renew. Energy 2015, 79, 167–176. [Google Scholar] [CrossRef]
- Zhao, Z.; Zheng, Y.; Xu, X.; Liu, W.; Hu, G. Research on the improvement of the performance of Savonius rotor based on numerical study. In Proceedings of the International Conference on Sustainable Power Generation and Supply, Nanjing, China, 6–7 April 2009. [Google Scholar]
- Zheng, M.; Zhang, X.; Zhang, L.; Teng, H.; Hu, J.; Hu, M. Uniform Test Method Optimum Design for Drag-Type Modified Savonius VAWTs by CFD Numerical Simulation. Arab. J. Sci. Eng. 2017, 43, 4453–4461. [Google Scholar] [CrossRef]
- Hayashi, T.; Li, Y.; Hara, Y. Wind tunnel tests on a different phase three-stage Savonius rotor. JSME Int. J. Ser. B Fluids Therm. Eng. 2005, 48, 9–16. [Google Scholar] [CrossRef] [Green Version]
- Yasuyuki, N.; Ayumu, A.; Ushiyama, I. A study of the twisted sweeney-type wind turbine. Wind Eng. 2003, 27, 317–322. [Google Scholar]
- Prabhu, S.V.; Kamoji, M.A.; Kedare, S.B. Performance tests on helical Savonius rotors. Renew. Energy 2009, 34, 521–529. [Google Scholar]
- Driss, Z.; Mlayeh, O.; Driss, S. Study of the bucket design effect on the turbulent flow around unconventional Savonius wind rotors. Energy 2015, 89, 708–729. [Google Scholar] [CrossRef]
- Roy, S.; Saha, U.K. Wind tunnel experiments of a newly developed two-bladed Savonius-style wind turbine. Appl. Energy 2015, 137, 117–125. [Google Scholar] [CrossRef]
- Hassan, A.; Hassan, S.; Ahmed, M.N.E.; Sadek, Z.K. Numerical study of improving Savonius turbine power coefficient by various blade shapes. Alex. Eng. J. 2019, 58, 429–441. [Google Scholar] [CrossRef]
- Mosbahi, M.; Elgasri, S.; Lajnef, M.; Mosbahi, B.; Driss, Z. Performance enhancement of a twisted Savonius hydrokinetic turbine with an upstream deflector. Int. J. Green Energy 2021, 18, 51–65. [Google Scholar] [CrossRef]
- Saha, U.K.; Rajkumar, M.J. On the Performance Analysis of Savonius rotor with twisted blades. Renew. Energy 2006, 31, 1776–1788. [Google Scholar] [CrossRef]
- Lee, J.H.; Lee, Y.T.; Lim, H.C. Effect of helical angle on the performance of Savonius wind turbine. In Proceedings of the 2014 World Congress on Advances in Civil Environmental and Materials (ACEM14), Busan, Korea, 24–28 August 2014. [Google Scholar]
- Blackwell, B.F.; Sheldahl, R.E.; Feltz, L.V. Wind tunnel performance data for two and three-bucket Savonius rotors. J. Energy 1978, 3, 160–164. [Google Scholar]
- Akwa, J.V.; Júnior, G.A.S.; Petry, A.P. Discussion On The Verification Of The Overlap Ratio Influence On Performance Coefficients of A Savonius Wind Rotor Using Computational Fluid Dynamics. Renew. Energy 2012, 38, 141–149. [Google Scholar] [CrossRef]
- Mohamed, M.H.; Janiga, G.; Pap, E.; Thévenin, D. Optimization of Savonius turbines using an obstacle shielding the returning blade. Renew. Energy 2010, 35, 2618–2626. [Google Scholar] [CrossRef]
- Maldonado, R.D.; Huerta, E.; Corona, J.E.; Ceh, O.; Castillo, A.I.L.; Acosta, M.P.G.; Andrade, E.M. Design simulation and construction of a Savonius wind rotor for subsidized houses in Mexico Energy. Procedia Eng. 2014, 57, 691–697. [Google Scholar] [CrossRef] [Green Version]
- Altan, B.D.; Atilgan, M. An Experimental and Numerical Study on the improvement of the performance of Savonius wind rotor. Energy Convers. Manag. 2008, 49, 3425–3432. [Google Scholar] [CrossRef]
- Mosbahi, M.; Ayadi, A.; Chouaibi, Y.; Driss, Z.; Tucciarelli, T. Experimental and numerical investigation of the leading edge sweep angle effect on the performance of a delta blades hydrokinetic turbine. Renew. Energy 2020, 162, 1087–1103. [Google Scholar] [CrossRef]
- Lajnef, M.; Mosbahi, M.; Chouaibi, Y.; Driss, Z. Performance Improvement in a Helical Savonius Wind Rotor. Arab. J. Sci. Eng. 2020, 45, 9305–9323. [Google Scholar] [CrossRef]
- Kumar, A.; Saini, R.P. Performance analysis of a single stage modified Savonius hydrokinetic turbine having twisted blades. Renew. Energy 2017, 113, 461–478. [Google Scholar] [CrossRef]
- Kumar, A.; Saini, R.P. Performance analysis of a Savonius hydrokinetic turbine having twisted blades. Renew. Energy 2017, 108, 502–522. [Google Scholar] [CrossRef]
Figure 1.
Geometrical parameters of Savonius rotor [12].
Figure 1.
Geometrical parameters of Savonius rotor [12].

Figure 2.
(a) Cooling system (b) irrigation canal.

Figure 3.
Savonius Rotor.

Figure 4.
Schematic diagram of the experimental setup.

Figure 5.
Schematic representation of the computational domain.

Figure 6.
Mesh generation and distribution around Savonius rotor.

Figure 7.
Two-dimensional models of the deflector system with different deflection angles.

Figure 8.
Performance parameters.

Figure 9.
Variation of torque coefficient for different refinement levels of grid.

Figure 10.
Power coefficient validation.

Figure 11.
Magnitude velocity distribution for different deflection angles.

Figure 12.
Velocity profiles for different deflection angles.

Figure 13.
Total pressure distribution for different deflection angles.

Figure 14.
Pressure coefficient distribution for different deflection angles.

Figure 15.
Turbulent kinetic energy distribution for different deflection angles.

Figure 16.
Turbulent eddy dissipation distribution for different deflection angles.


Figure 17.
Turbulent viscosity distribution for different deflection angles.

Figure 18.
Turbulent intensity distribution for different deflection angles.

Figure 19.
Torque coefficient for different deflection angles.

Figure 20.
Power coefficient for different deflection angles.


Table 1.
Geometrical parameters of Savonius rotor.
| Parameter | Value |
|---|---|
| Rotor diameter (D) | 160 mm |
| Rotor height (H) | 200 mm |
| End plate diameter (De) | 165 mm |
| Shaft diameter (s) | 20 mm |
| Number of blades | 2 |
| Blade chord (d) | 90 mm |
| Blade thickness | 2 mm |
| Blade twist angle (ψ) | 90° |
Table 2.
Geometrical parameters of the deflector system.
| Configuration | H (mm) | L1 (mm) | L2 (mm) | L3 (mm) | Ra (mm) | β (°) | γ (°) |
|---|---|---|---|---|---|---|---|
| α = 15° | 200 | 115 | 100 | 110 | 110 | 20 | 35 |
| α = 20° | 200 | 115 | 100 | 110 | 110 | 20 | 35 |
| α = 25° | 200 | 115 | 100 | 110 | 110 | 20 | 35 |
| α = 30° | 200 | 115 | 100 | 110 | 110 | 20 | 35 |
Table 3.
Systematical error for the different experimental apparatus.
| Experimental Apparatus | Systematical Error |
|---|---|
| Pitot tube | 1% |
| Electrical balance | 2% |
| Non-contact digital tachometer | 3% |
Publisher’s Note: MDPI stays neutral with regard to jurisdictional claims in published maps and institutional affiliations. |
© 2021 by the authors. Licensee MDPI, Basel, Switzerland. This article is an open access article distributed under the terms and conditions of the Creative Commons Attribution (CC BY) license (http://creativecommons.org/licenses/by/4.0/).
Share and Cite
MDPI and ACS Style
Mosbahi, M.; Lajnef, M.; Derbel, M.; Mosbahi, B.; Aricò, C.; Sinagra, M.; Driss, Z. Performance Improvement of a Drag Hydrokinetic Turbine. Water 2021, 13, 273. https://doi.org/10.3390/w13030273
AMA Style
Mosbahi M, Lajnef M, Derbel M, Mosbahi B, Aricò C, Sinagra M, Driss Z. Performance Improvement of a Drag Hydrokinetic Turbine. Water. 2021; 13(3):273. https://doi.org/10.3390/w13030273
Chicago/Turabian StyleMosbahi, Mabrouk, Mariem Lajnef, Mouna Derbel, Bouzid Mosbahi, Costanza Aricò, Marco Sinagra, and Zied Driss. 2021. "Performance Improvement of a Drag Hydrokinetic Turbine" Water 13, no. 3: 273. https://doi.org/10.3390/w13030273
Note that from the first issue of 2016, this journal uses article numbers instead of page numbers. See further details here.