Article

Optical Absorption Characteristics, Spatial Distribution, and Source Analysis of Colored Dissolved Organic Matter in Wetland Water around Poyang Lake

1
School of Geography and Environmental Science & Ministry of Education’s Key Laboratory of Poyang Lake Wetland and Watershed Research, Jiangxi Normal University, Nanchang 330022, China
2
School of Geosciences, East China University of Technology, Nanchang 330013, China
*
Author to whom correspondence should be addressed.
Water 2021, 13(3), 274; https://doi.org/10.3390/w13030274
Submission received: 18 December 2020 / Revised: 19 January 2021 / Accepted: 21 January 2021 / Published: 24 January 2021
(This article belongs to the Special Issue Dissolved Organic Matter Dynamics in Groundwater, Rivers, and Lakes)

Abstract

:
Colored dissolved organic matter (CDOM) is an important part of aquatic ecosystems and plays a key role in the biogeochemical cycle. In this study, CDOM absorption spectrum curves and water quality parameters from 30 sampling sites in the wetlands of Poyang Lake, Jiangxi Province, China, were collected in October 2016. The optical absorption characteristics and spatial distribution of CDOM, the correlation between the absorption coefficient of CDOM at a wavelength of 355 nm (ag(355)), and the concentration of dissolved organic carbon (DOC) were analyzed. Spectral characteristic parameters—namely, E2/E3 (the ratio of the CDOM absorption coefficient at a wavelength of 250 nm to the CDOM absorption coefficient at a wavelength of 365 nm), SUVA254 (the ratio of the CDOM absorption coefficient at a wavelength of 254 nm to the DOC concentration), and spectral slopes—were used to infer the composition and sources of CDOM in the Poyang Lake wetlands. The results showed the following: (1) the CDOM absorption spectrum of water of the Poyang Lake wetlands presented significant spatial variation, showing a trend of south > west > north > east; (2) there was a strong linear correlation between the CDOM absorption coefficient and the DOC concentration in the water of the Poyang Lake wetlands (ag(355) = 1.075DOC–0.659 (r2 = 0.723, p < 0.001, n = 30)); (3) the analysis of the spectral characteristic parameters E2/E3, SUVA254, and spectral slopes showed that the CDOM in the Poyang Lake wetlands has relatively high aromaticity and molecular weight, which were shown to be mainly affected by terrestrial inputs. The results showed that the molecular weight and aromaticity of CDOM were higher in the south of the lake than in other parts.

1. Introduction

Colored dissolved organic matter (CDOM) is an assortment of organic matter composed of humic acid, fulvic acid, lipids, and polycyclic aromatic hydrocarbons dissolved in water [1]. This matter is an important part of the dissolved organic matter pool and dissolved organic carbon (DOC), and it plays a key role in the water environment, aquatic ecosystems, and the global carbon cycle [2,3]. The concentration and composition of CDOM can change the underwater light field, thereby affecting primary productivity [4,5]. Additionally, CDOM strongly absorbs ultraviolet light and can thereby protect aquatic ecosystems from harmful ultraviolet radiation [5,6]. The spectral absorption characteristics of CDOM are closely related to the concentration of DOC. The analysis of the absorption characteristics of CDOM helps us understand its source and the carbon-cycling process in aquatic ecosystems.
Due to the important influence of the ultraviolet-visible absorption characteristics of CDOM on water bio-optics, much research has been conducted on the optical characteristics, spatial and temporal distribution, and sources of CDOM in different regions. For example, such research has been extensively conducted in lake and wetland water [7,8,9,10,11]. Song et al. [7] studied the optical properties of CDOM in major lakes in China and found that the CDOM absorption is higher in saline lakes than in freshwater lakes. Zhang et al. [8] studied the seasonal changes and spatial distribution of optical properties of CDOM in Lake Taihu and found that these changes are related to river input and the degree of algae blooms. In recent years, the optical properties, spatial and temporal distribution, and sources of CDOM in wetland water have attracted research attention. Qi et al. [12] found that Phragmites australis and Suaeda salsa are important sources of CDOM in wetlands in the Yellow River Delta. Clark et al. [13] reported that the absorption coefficient of CDOM in a constructed wetland in Southern California decreased between the inlet and outlet of the wetland, and they additionally showed that wetland plants (pampas and reeds) produced CDOM during the decomposition process. Griffin et al. [14] found that rivers flowing through wetlands have higher CDOM concentrations. Maie et al. [15] conducted quantitative and qualitative research on the DOC of senescent plants in oligotrophic wetlands and found that polyphenols extracted from senescent plants are important sources of CDOM in the wetland environment. However, due to different sources, the characteristics of CDOM are also different in different aquatic ecosystems [16].
Poyang Lake, Jiangxi Province, China, is a seasonal lake with high dynamic changes in water level (Max of Hukou gauging station: 22.59 m on 31 July 1998, Min of Hukou gauging station: 5.9 m on 6 February 1963) [16]. Affected by the subtropical monsoon climate, the seasonal variations of water levels present a unique annual changing landscape of lake water and wetlands [17]. Poyang Lake is a unique wetland ecosystem with complex climatic and hydrological conditions [17,18]. Wetland ecosystems are transitional ecosystems between terrestrial and aquatic ecosystems. The wetlands of Poyang Lake not only have important social and economic functions but also play a very important role in maintaining the health of the ecosystem of the lake. However, the Poyang Lake wetlands are affected by human activities such as industrial and agricultural production and the lives of surrounding residents, which has caused its water quality to continuously decline and its degree of eutrophication to intensify [19,20]. CDOM, one of the important parameters that affects the composition of wetland water, can be used as an indicator of the pollution and eutrophication status of wetland water environments. Therefore, in this study, CDOM absorption spectrum curves and water quality parameters were collected at 30 sampling sites in the Poyang Lake wetlands in October 2016. The optical absorption characteristics and spatial distribution of CDOM, and the correlation between CDOM and DOC were analyzed. Spectral characteristic parameters were used to infer the composition and sources of CDOM in the Poyang Lake wetlands. The results of this study are expected to provide basic data and a scientific basis for the protection of the water ecological environment of the Poyang Lake wetlands.

2. Materials and Methods

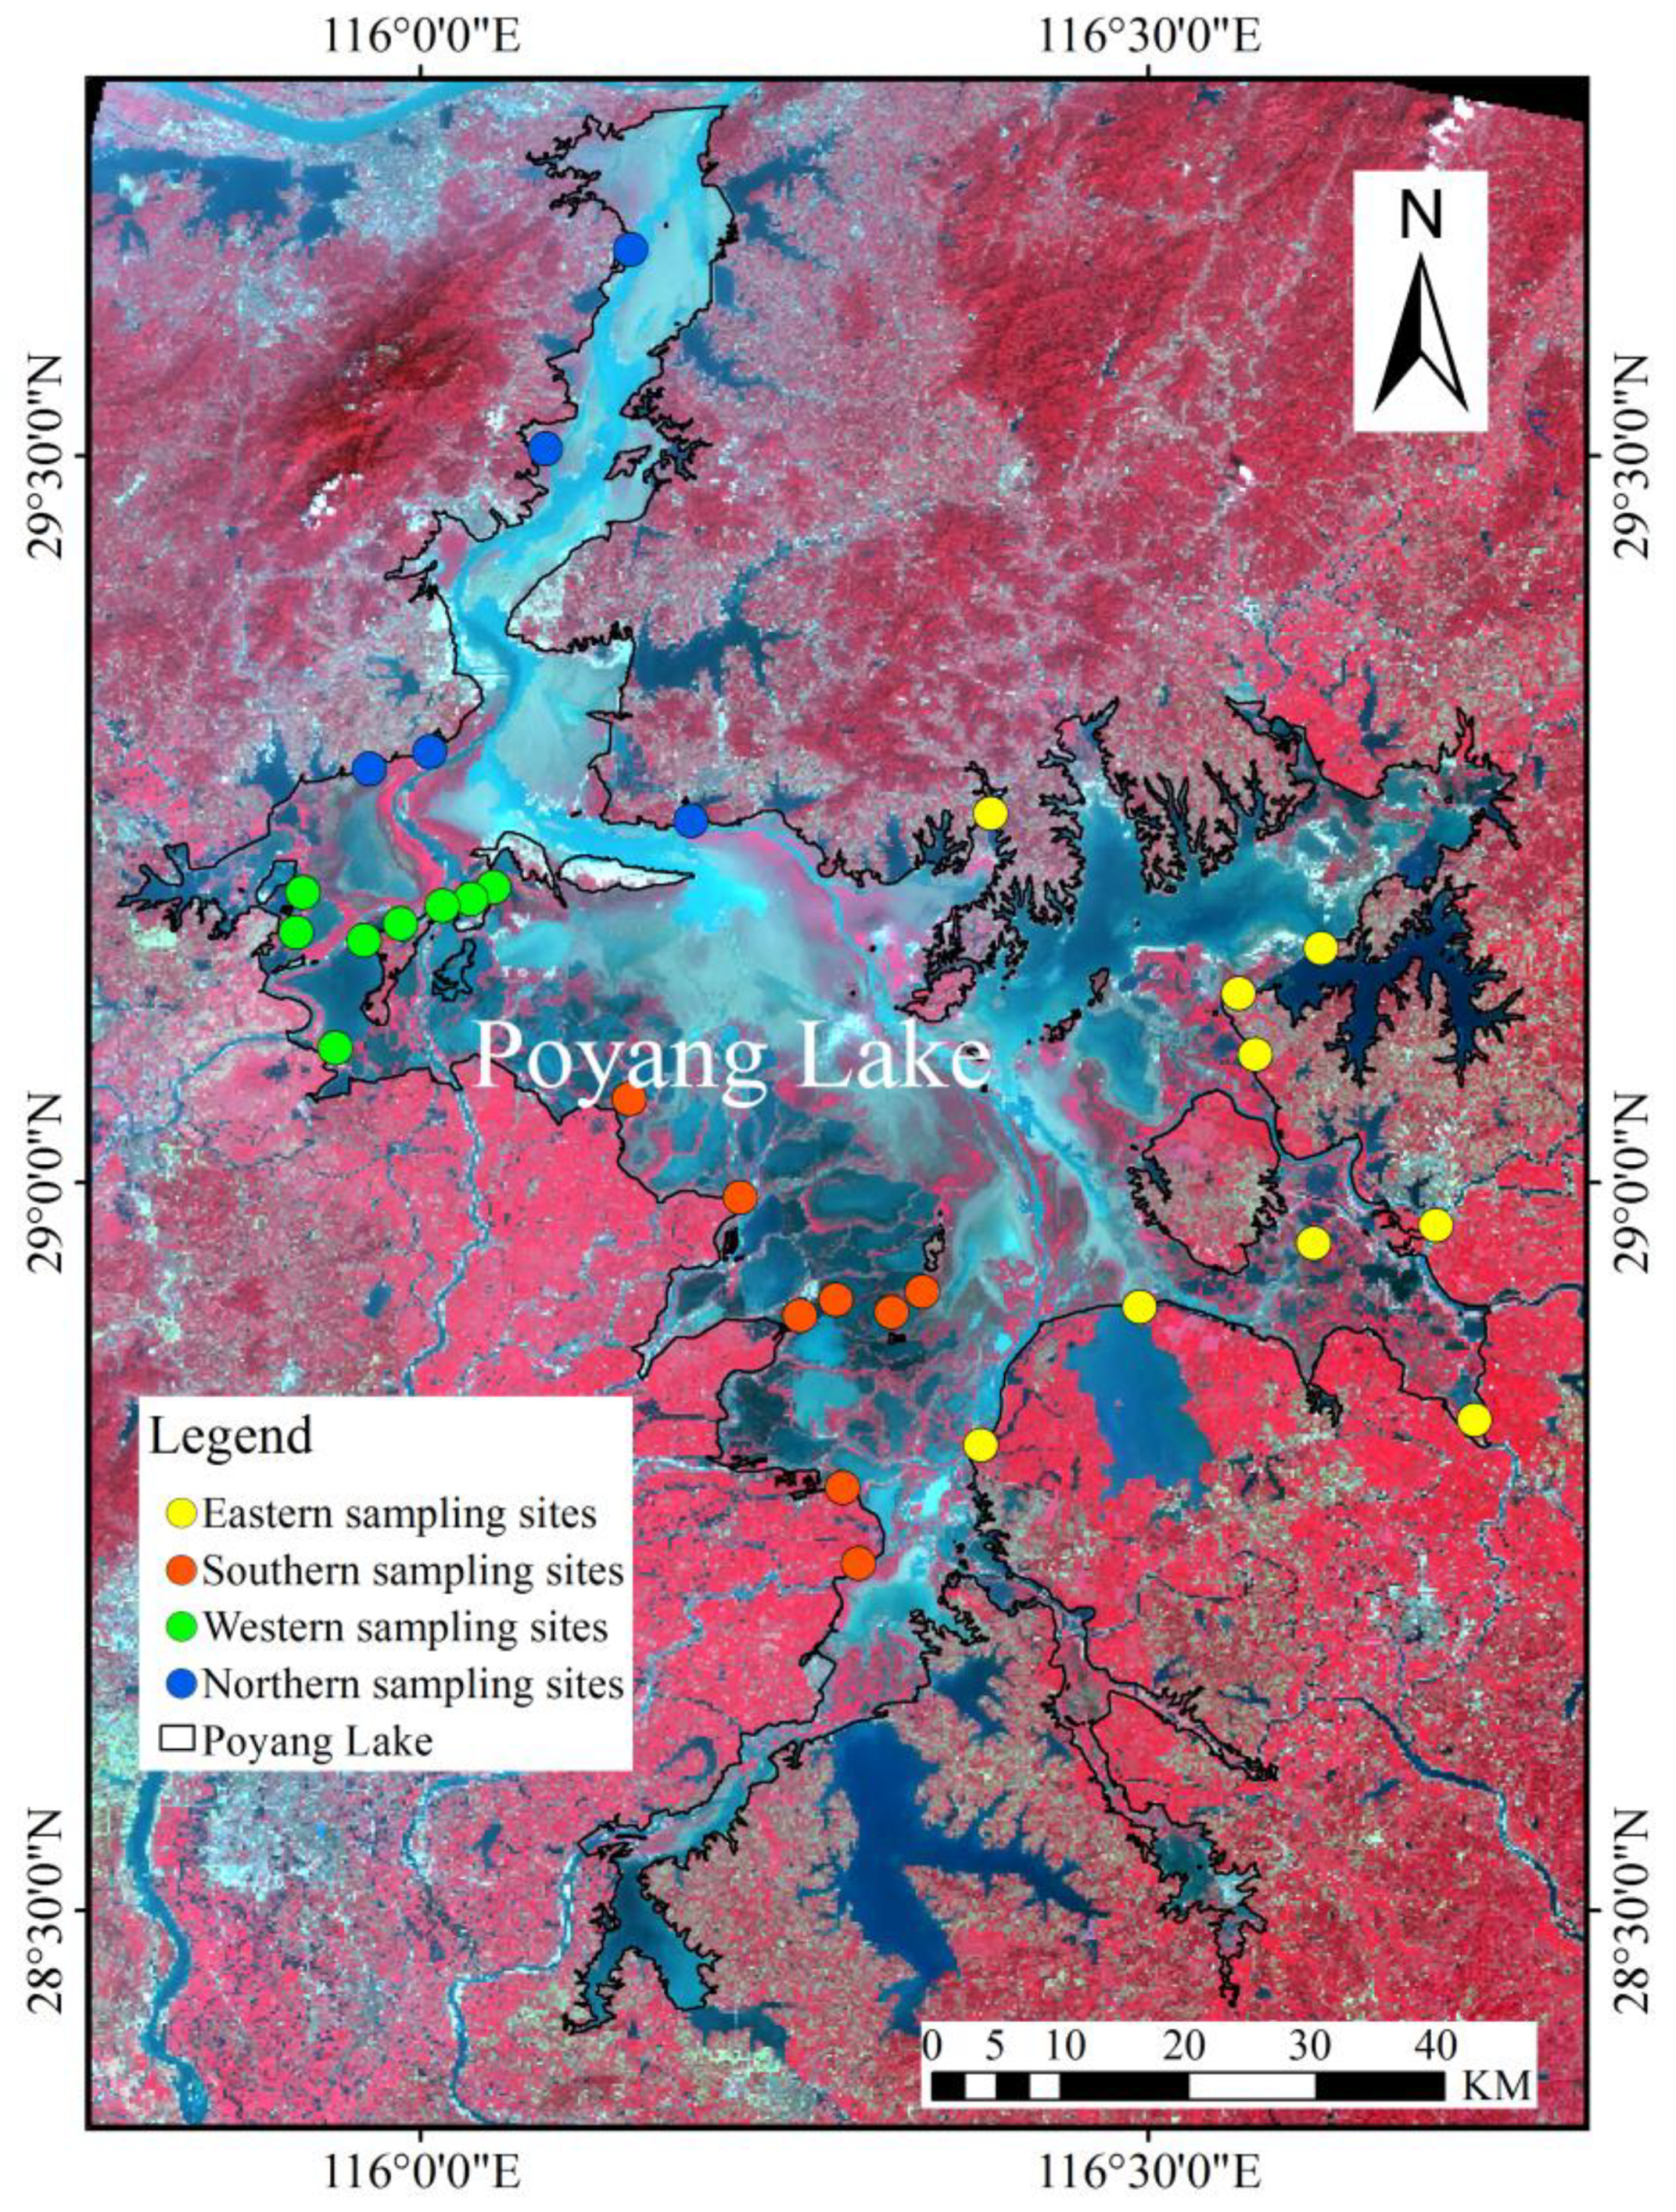
2.1. Study Area and Sampling Site

Poyang Lake, the largest freshwater lake in China [21], is located in the north of Jiangxi Province on the south bank of the Yangtze River [22] (Figure 1). Poyang Lake receives water from five major rivers (Jiangxi, Ganjiang, Fuhe, Xinjiang, Raohe, and Xiushui) and exchanges water with the Yangtze River. Poyang Lake has a subtropical monsoon climate with an average annual precipitation of 1680 mm [23]. The seasonal variations in water level of Poyang Lake present a changing landscape of wetlands and lake water throughout a year [24]. The lake is divided into many disconnected parts separated by the exposed floodplains with an inundation area less than 1000 km2 during the dry season between October and March. During the wet season between April and September, almost all of the disconnected parts of the lake are connected to form an inundated area of >3000 km2 [25]. Additionally, Poyang Lake is one of the world’s most famous wetlands, hosting millions of migratory birds, including about 98% of the world’s population of Siberian cranes [26], which winter in the lake area [27]. The northern and northeastern parts of the Poyang Lake area are mostly hilly and mountainous, while the western and southern parts are mostly estuary delta plains. Historically, the estuary delta of Poyang Lake underwent frequent reclamation activities, which have resulted in the widespread construction of arable land and repeated human activities.
From September to October each year, the water level of Poyang Lake gradually decreases, and the wetland landscape appears; therefore, the sampling time selected in this study (October 2016) corresponds to the exposure time of the Poyang Lake wetland landscape. The number of sampling sites (30) was selected considering factors such as the representativeness and spatial balance of sampling sites [28] (Figure 1). To better analyze the spatial variation of CDOM in different areas of the Poyang Lake wetlands, the 30 sampling points were divided into four groups—nine samples in the east, eight samples in the south, eight samples in the west, and five samples in the north—as shown in Figure 1.
At each sampling site, surface water was collected from depths between 0 and 50 cm in a 2500 mL cleaned plastic bottle. All water samples were placed in a cooler equipped with ice packs and were brought back to the laboratory on the same day for the determination of absorption coefficients and the concentrations of water constituents. The positions of the sample points were determined using a handheld GPS (GPS map 62sc, Garmin, Olathe, KS, USA). At each sampling site, a portable water quality monitor (YSI 6600, Yellow Springs Instruments, Yellow Springs, OH, USA) was used to monitor water temperature, pH, turbidity, electrical conductivity, and total dissolved solids. The transparency of the wetland water was measured at each sampling point using a Secchi disk, and water depth was simultaneously measured with a depth sounder (SM-5, Speedtech Instruments, Great Falls, VA, USA).

2.2. Water Quality Analysis

Water samples for DOC measurement were filtered under low vacuum through pre-combusted (pre-fired at 450 °C for four hours) glass fiber filters (GF/F, Whatman, Buckinghamshire, United Kingdom) (0.7 μm) and stored in 60 mL opaque glass bottles at 4 °C in the dark until analysis [29]. DOC concentrations were determined by a high-temperature catalytic oxidation method using a total organic carbon analyzer (TOC L-CPN, Shimadzu, Kyoto, Japan). Chlorophyll a (Chl-a), collected on Whatman GF/F filters (0.7 μm) and extracted with hot 90% ethanol [30], was measured using a UV-vis spectrophotometer (UV-2600PC, Shimadzu, Kyoto, Japan).

2.3. CDOM Absorption Analysis

The water samples were filtered using a Whatman GF/F filter (0.7 μm) membrane before being filtered again with a Millipore membrane with a pore size of 0.22 μm; then, they were placed in a refrigerator at 4 °C until analysis. The absorption coefficient of CDOM was measured in a 10 cm quartz cuvette between 240 and 750 nm (1 nm interval) using a Shimadzu UV-2600PC UV-vis with ultrapure water (from a Millipore Direct-Q 5 system) as a blank. The absorption coefficient of CDOM was obtained using the following Formulas (1) and (2):
a’g(λ) = 2.303⋅D(λ)/r
ag(λ) = a’g(λ) − a’g(700)⋅λ/700
where a’g(λ) and ag(λ) represent the uncorrected CDOM absorption coefficient and the modified CDOM absorption coefficient that has been corrected for scattering, both for wavelength λ; D(λ) refers to the optical density at wavelength λ; and r is the cuvette light path length in m (0.1 m in this study).
As the CDOM composition is difficult to measure directly due to its complex composition, in previous studies, a wavelength of 355 or 400 nm was generally selected to characterize the CDOM concentration [31,32]. In this study, ag(355) was used to characterize the CDOM content.
The ratio (E2/E3) of the absorption coefficient of CDOM at a wavelength of 250 nm (ag(250)) and that at 365 nm (ag(365)) were used to characterize the molecular weight of CDOM [33]. The E2/E3 was expressed as follows:
E2/E3 = ag(250)/ag(365).
The specific absorption coefficient (SUVA254) of CDOM in the 254 nm band was used to characterize the light absorption capacity of CDOM per unit DOC concentration and was obtained by the following Formula (4) [34]:
SUVA254 = ag(254)/DOC.
The spectral slope of CDOM was calculated using a single exponential function according to the non-linear regression of Formula (5):
ag(λ) = ag0) × exp[−Sg(λ − λ0)]
where λ0 is a reference wavelength at 440 nm, and Sg refers to the fitted parameter for the exponential decay of ag(λ) with increasing accuracy. In this study, the spectral slopes (S275–295, S350–400, and S400–600) between wavelengths of 275–295 nm, 350–400 nm and 400–600 nm were analyzed using the OriginPro 8.0 software (OriginLab Corp, Northampton, MA, USA).
The spectral slope ratio SR was defined as the ratio of the spectral slope of the shorter wavelength range (275–295 nm) to that of the longer wavelength range (350–400 nm) and was calculated as the following [35]:
SR = S275–295/S350–400.
The spectral characteristic parameters of E2/E3, SUVA254, and spectral slopes are important parameters to characterize the absorption spectrum of CDOM and are related to the molecular composition and sources of CDOM [36,37,38].

2.4. Data Analysis

A diagram showing the spatial distribution of CDOM was made using the ArcGIS 10.5 software (ESRI, Redlands, CA, USA). The OriginPro 8.0 software (OriginLab Corp, Northampton, MA, USA) was used for the fitting analysis and plot. The statistical analysis of the parametric data was performed with the SPSS version 19 software (IBM Corp, Chicago, IL, USA). The Kruskal–Wallis test was applied to check the significance of the differences in the parameters of different groups (eastern, southern, western, and northern groups). Linear regression analysis was used to check the relationship between the different parameters. The Pearson method was used to determine the correlation coefficient. For all tests, the results were considered to be insignificant when the p value was greater than 0.05, and they were significant when the p value was less than 0.05.

3. Results

3.1. Water Quality Parameters of the Poyang Lake Wetlands

The water quality parameters of the Poyang Lake wetlands (including DOC concentration, CDOM absorption coefficient, pH, dissolved oxygen (DO), water temperature (WT), electrical conductivity (EC), chlorophyll a (Chl-a), turbidity (Tur), water transparency (SD), and total dissolved solids (TDS)) are presented in Table 1. The DOC concentration of the samples ranged from 1.79 to 7.22 mg/L, with a mean value of 3.85 ± 1.41 mg/L; the ag(355) values of the samples ranged from 0.91 to 7.97 m−1, with a mean value of 3.48 ± 1.75 m−1. A comparison among different regions showed that the mean value of ag(355) was the highest in the south of the lake (5.09 ± 1.68 m−1), with values ranging from 2.91 to 7.97 m−1, and it was the lowest in the east of the lake (2.08 ± 0.65 m−1). The pH of the samples ranged from 7.15 to 8.04, with a mean value of 7.68 ± 0.24. The DO of the samples ranged from 4.75 to 10.5 mg/L, with a mean value of 8.61 ± 1.58 mg/L. The WT of the samples ranged from 14.64 to 28.85 °C, with a mean value of 19.84 ± 3.04 °C. The EC of the samples ranged from 4 to 341 µS/cm, with a mean value of 125.10 ± 73.51 µS/cm. The Chl-a concentration ranged from 2.2 to 28.8 μg/L, with a mean value of 10.94 ± 7.54 μg/L. It was found that the mean concentration of Chl-a was the highest in the western part of the lake (16.33 ± 9.31 μg/L), and the lowest value of mean Chl-a (8.24 ± 6.5 μg/L) was found in the east. The Tur of the samples ranged from 3.7 to 824.4 NTU (Nephelometric Turbidity Units), with a mean value of 95.24 ± 158.67 NTU. The SD of the samples ranged from 2 to 45 cm, with a mean value of 16.35 ± 11.44 cm. The TDS of the samples ranged from 0.003 to 0.249 g/L, with a mean value of 0.090 ± 0.051 g/L.

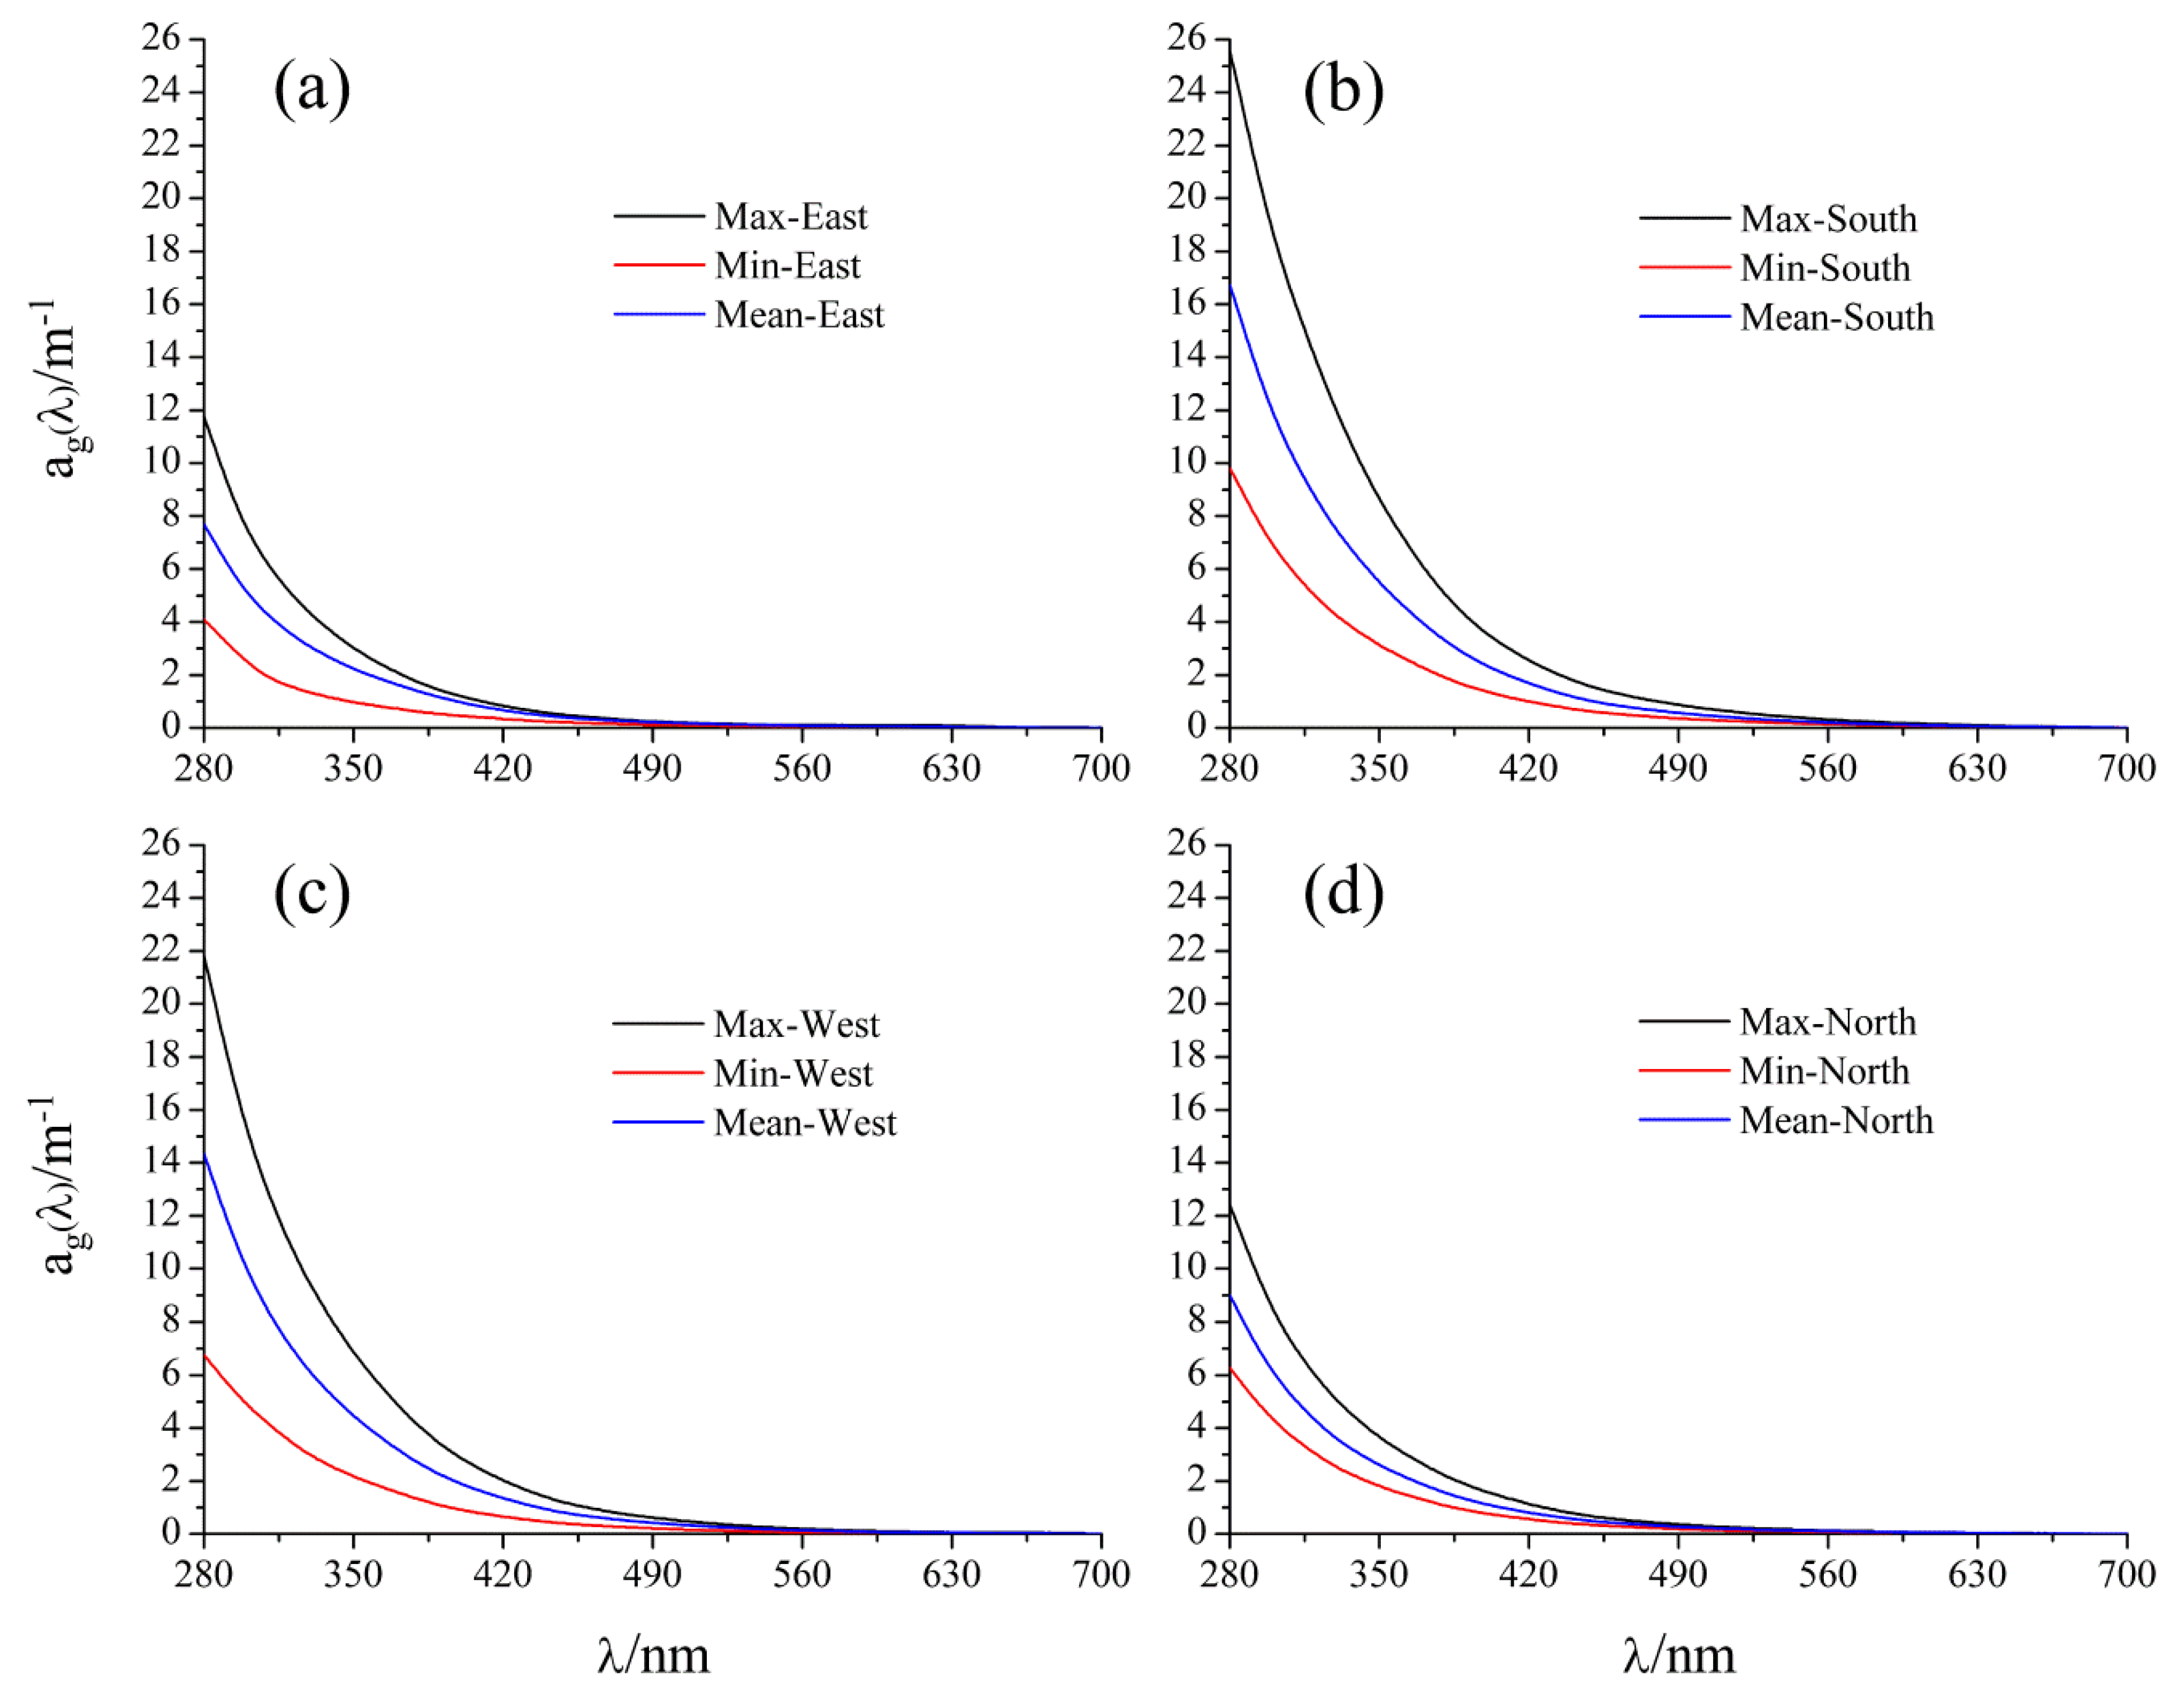
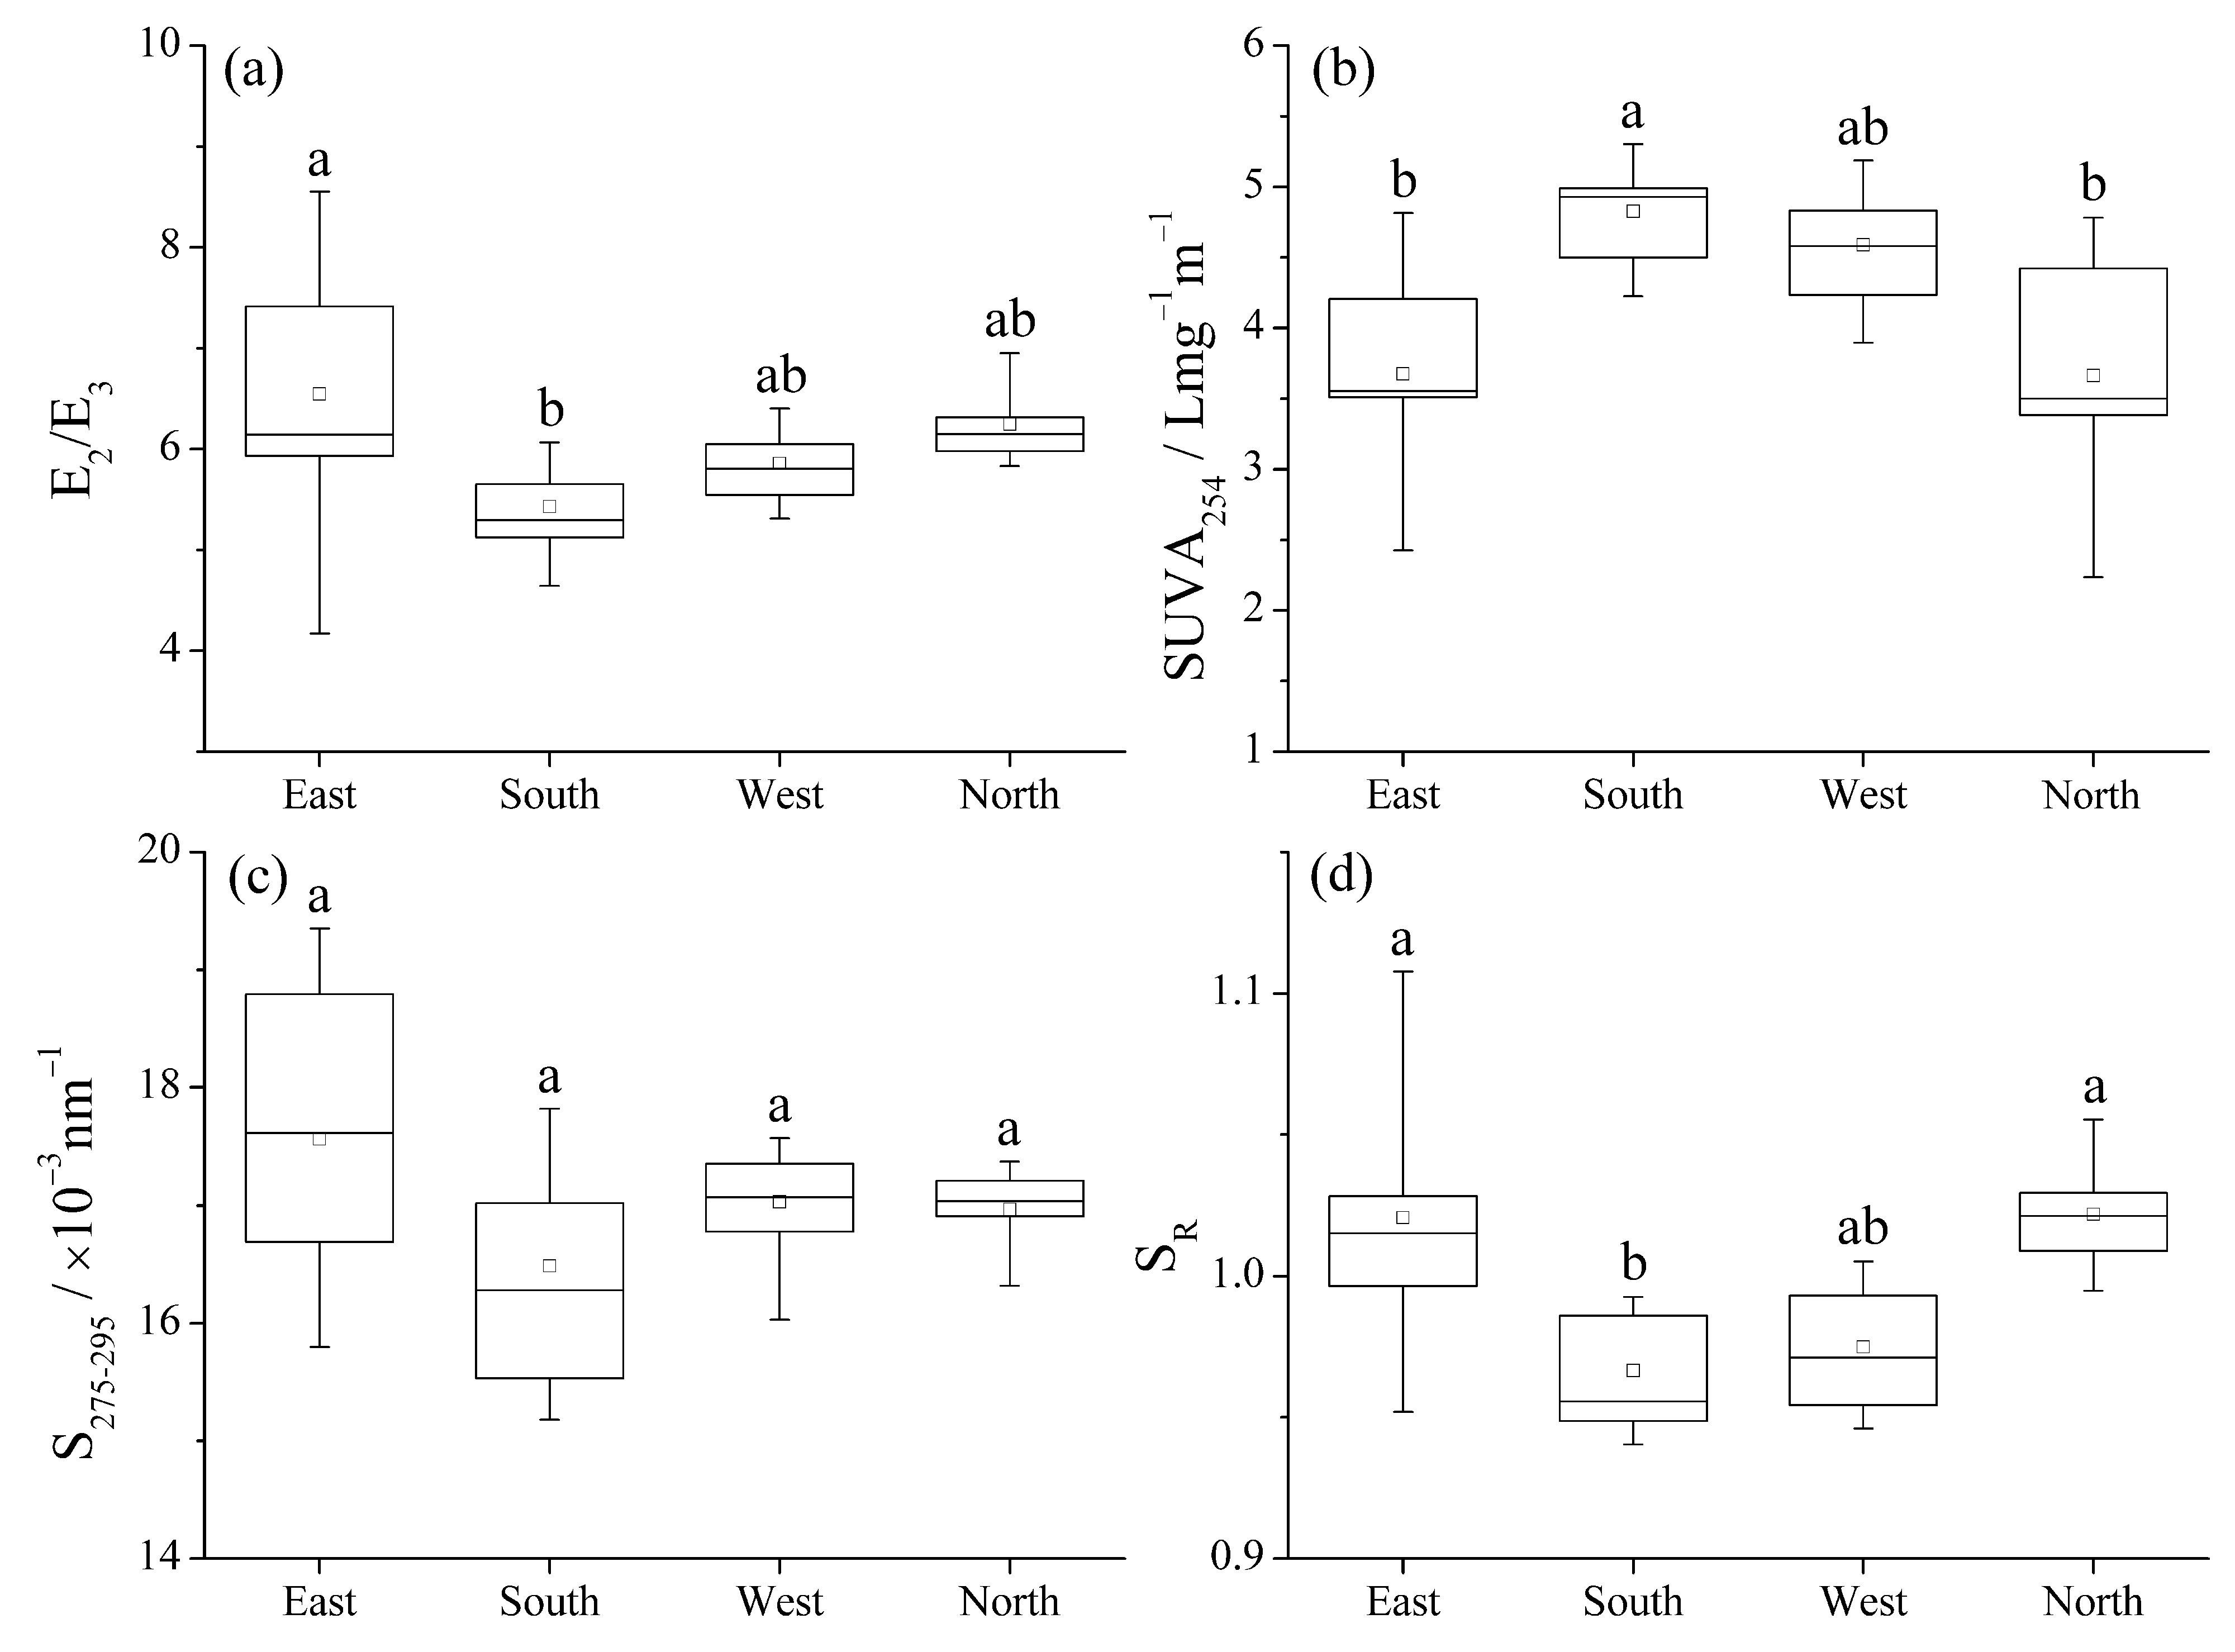
3.2. CDOM Absorption Spectrum Characteristics of Wetland Water of Poyang Lake

Figure 2 shows the CDOM absorption spectra of the samples. The CDOM spectra curves decreased exponentially with increasing wavelength. The absorption of CDOM was particularly strong in the ultraviolet and blue range, whereas the absorption was almost zero in the red range. As shown in Figure 2, the absorption spectra are quite different in different parts of Poyang Lake, showing a trend of south > west > north > east.
According to the CDOM absorption spectra, the CDOM absorption coefficients were calculated to obtain the characteristic indexes (Figure 3). The values of E2/E3 ranged from 4.17 to 8.55, with a mean of 6.01 ± 0.91; the SUVA254 values ranged from 2.23 to 5.30 L mg−1 m−1, with a mean of 4.22 ± 0.80 L mg−1 m−1; the S275–295 values ranged from 0.0152 to 0.0194 nm−1, with a mean of 0.0170 ± 0.0009 nm−1; and the SR values ranged from 0.940 to 1.108, with a mean of 0.994 ± 0.039. The results show that the average values of E2/E3 and SR were lower in the west and south than in the east and north, while the average value of SUVA254 was higher in the west and south than in the east and north.

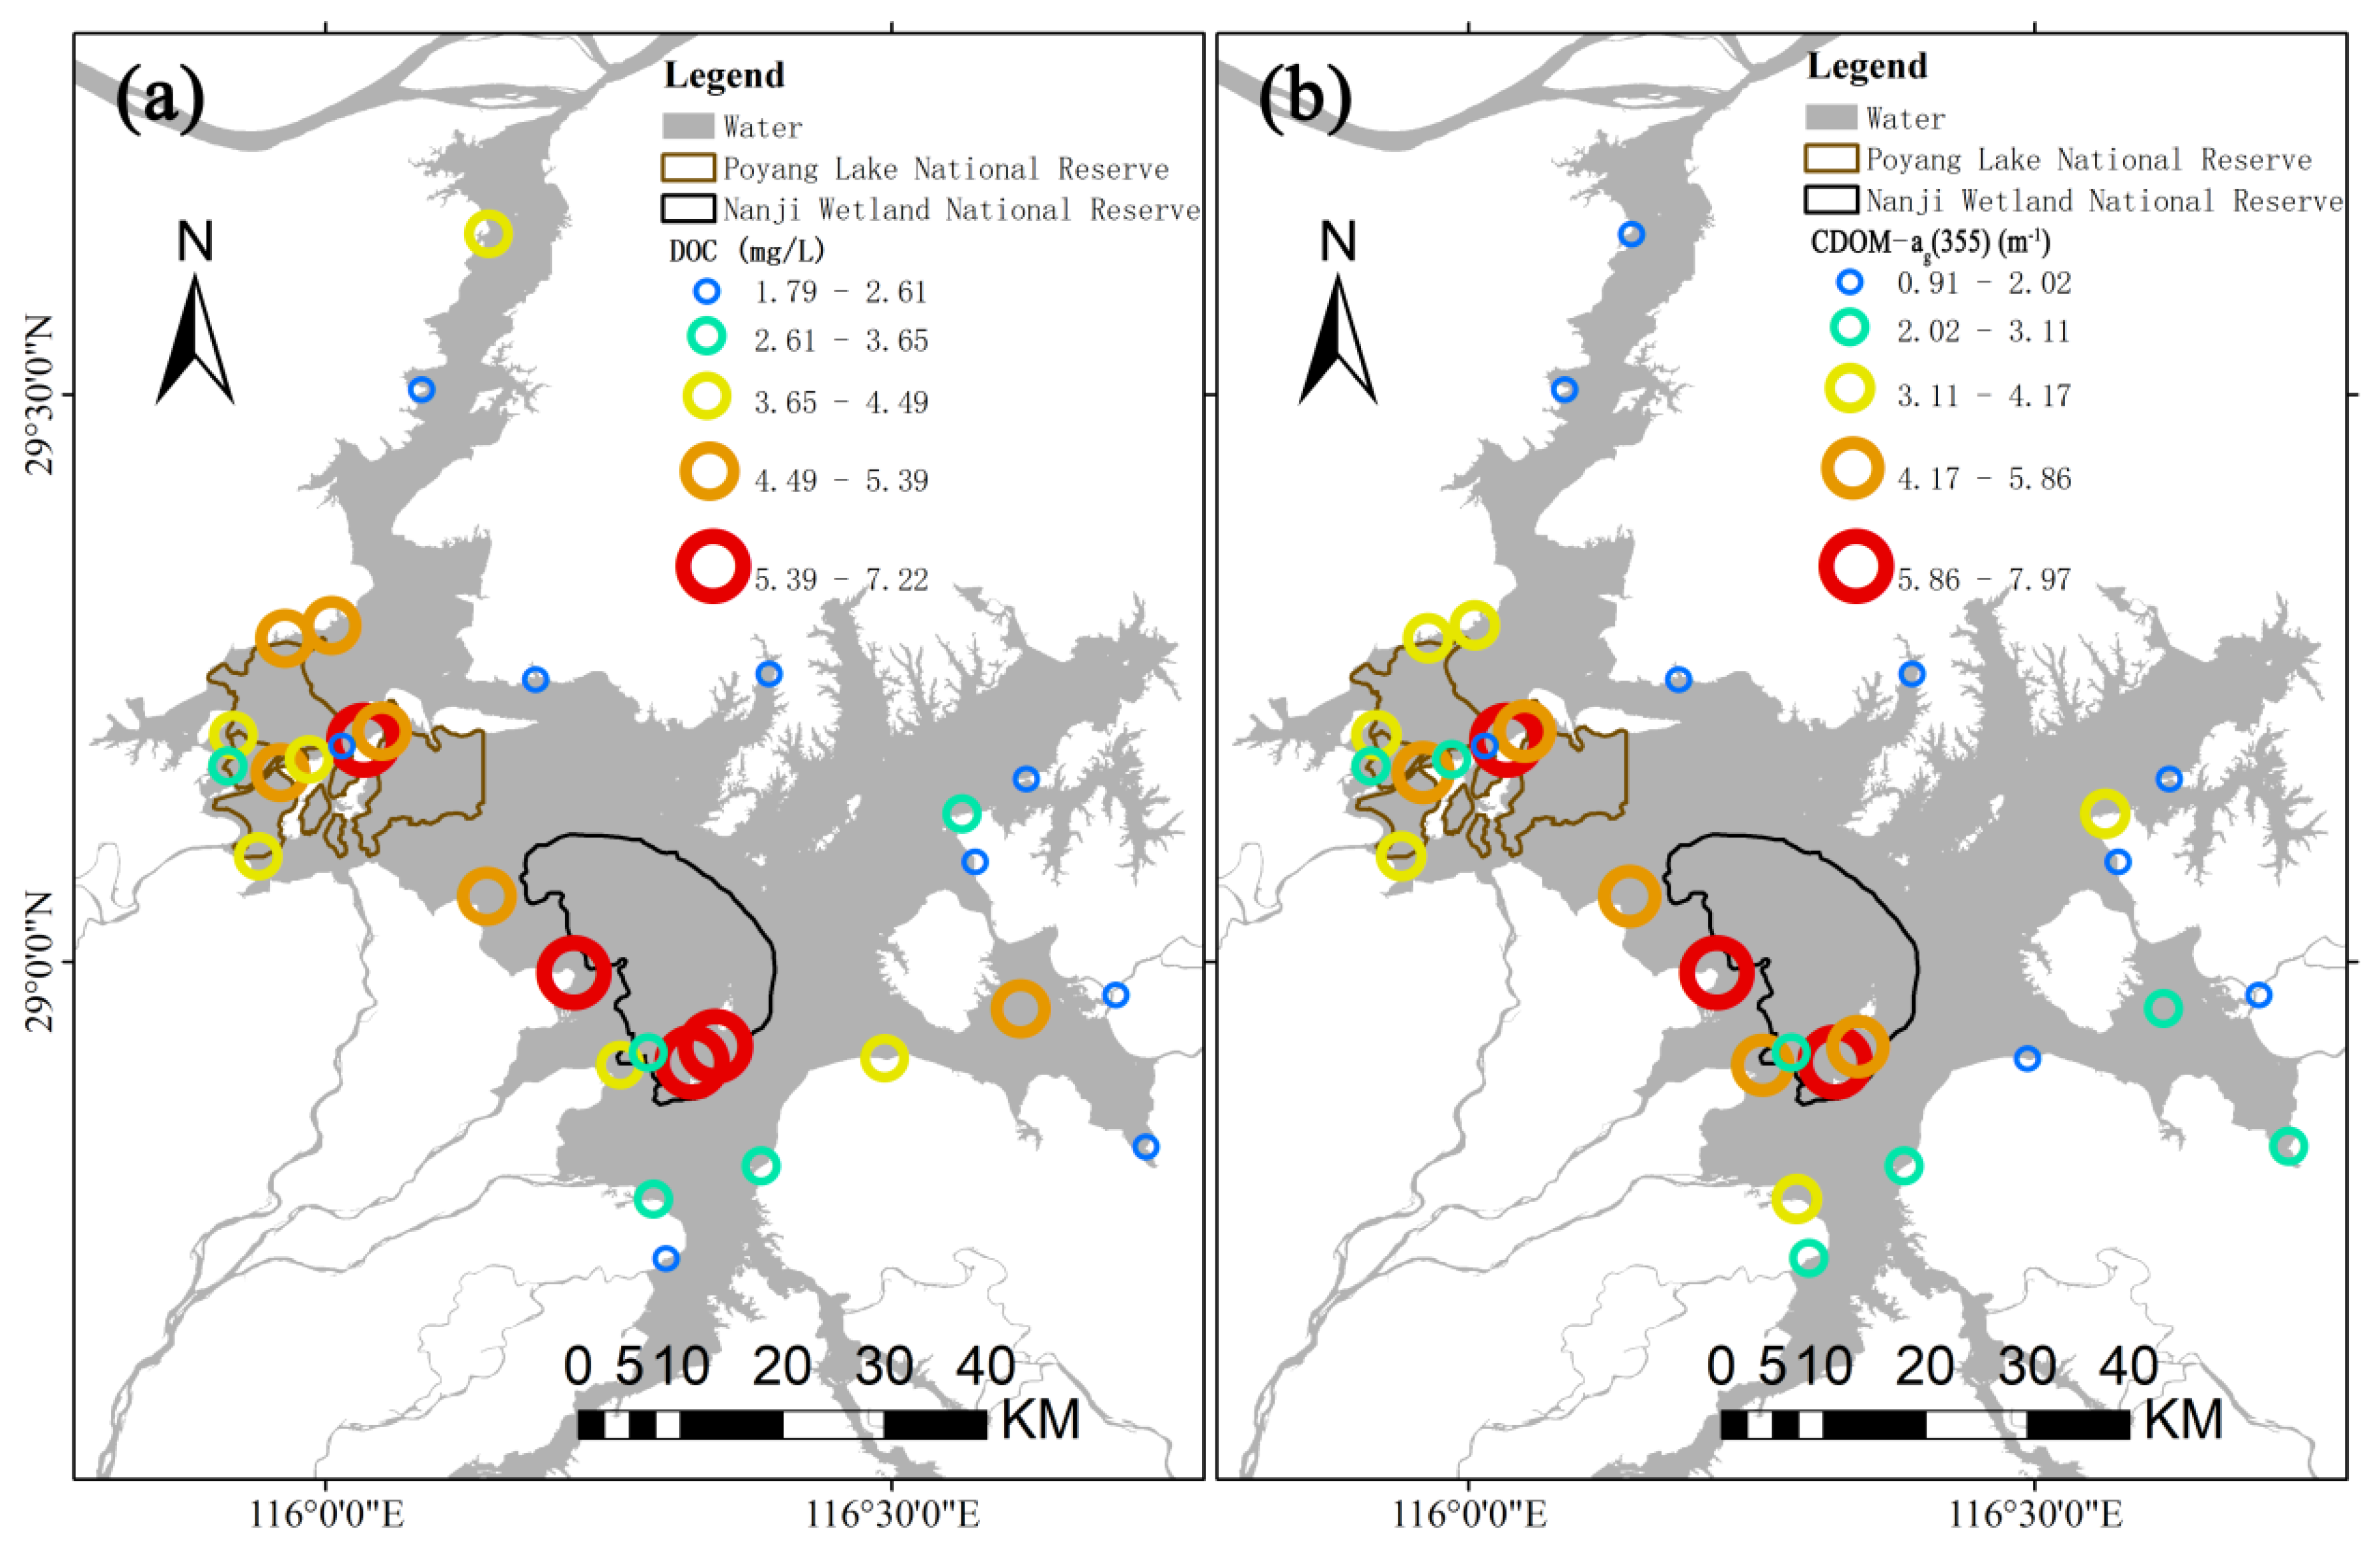
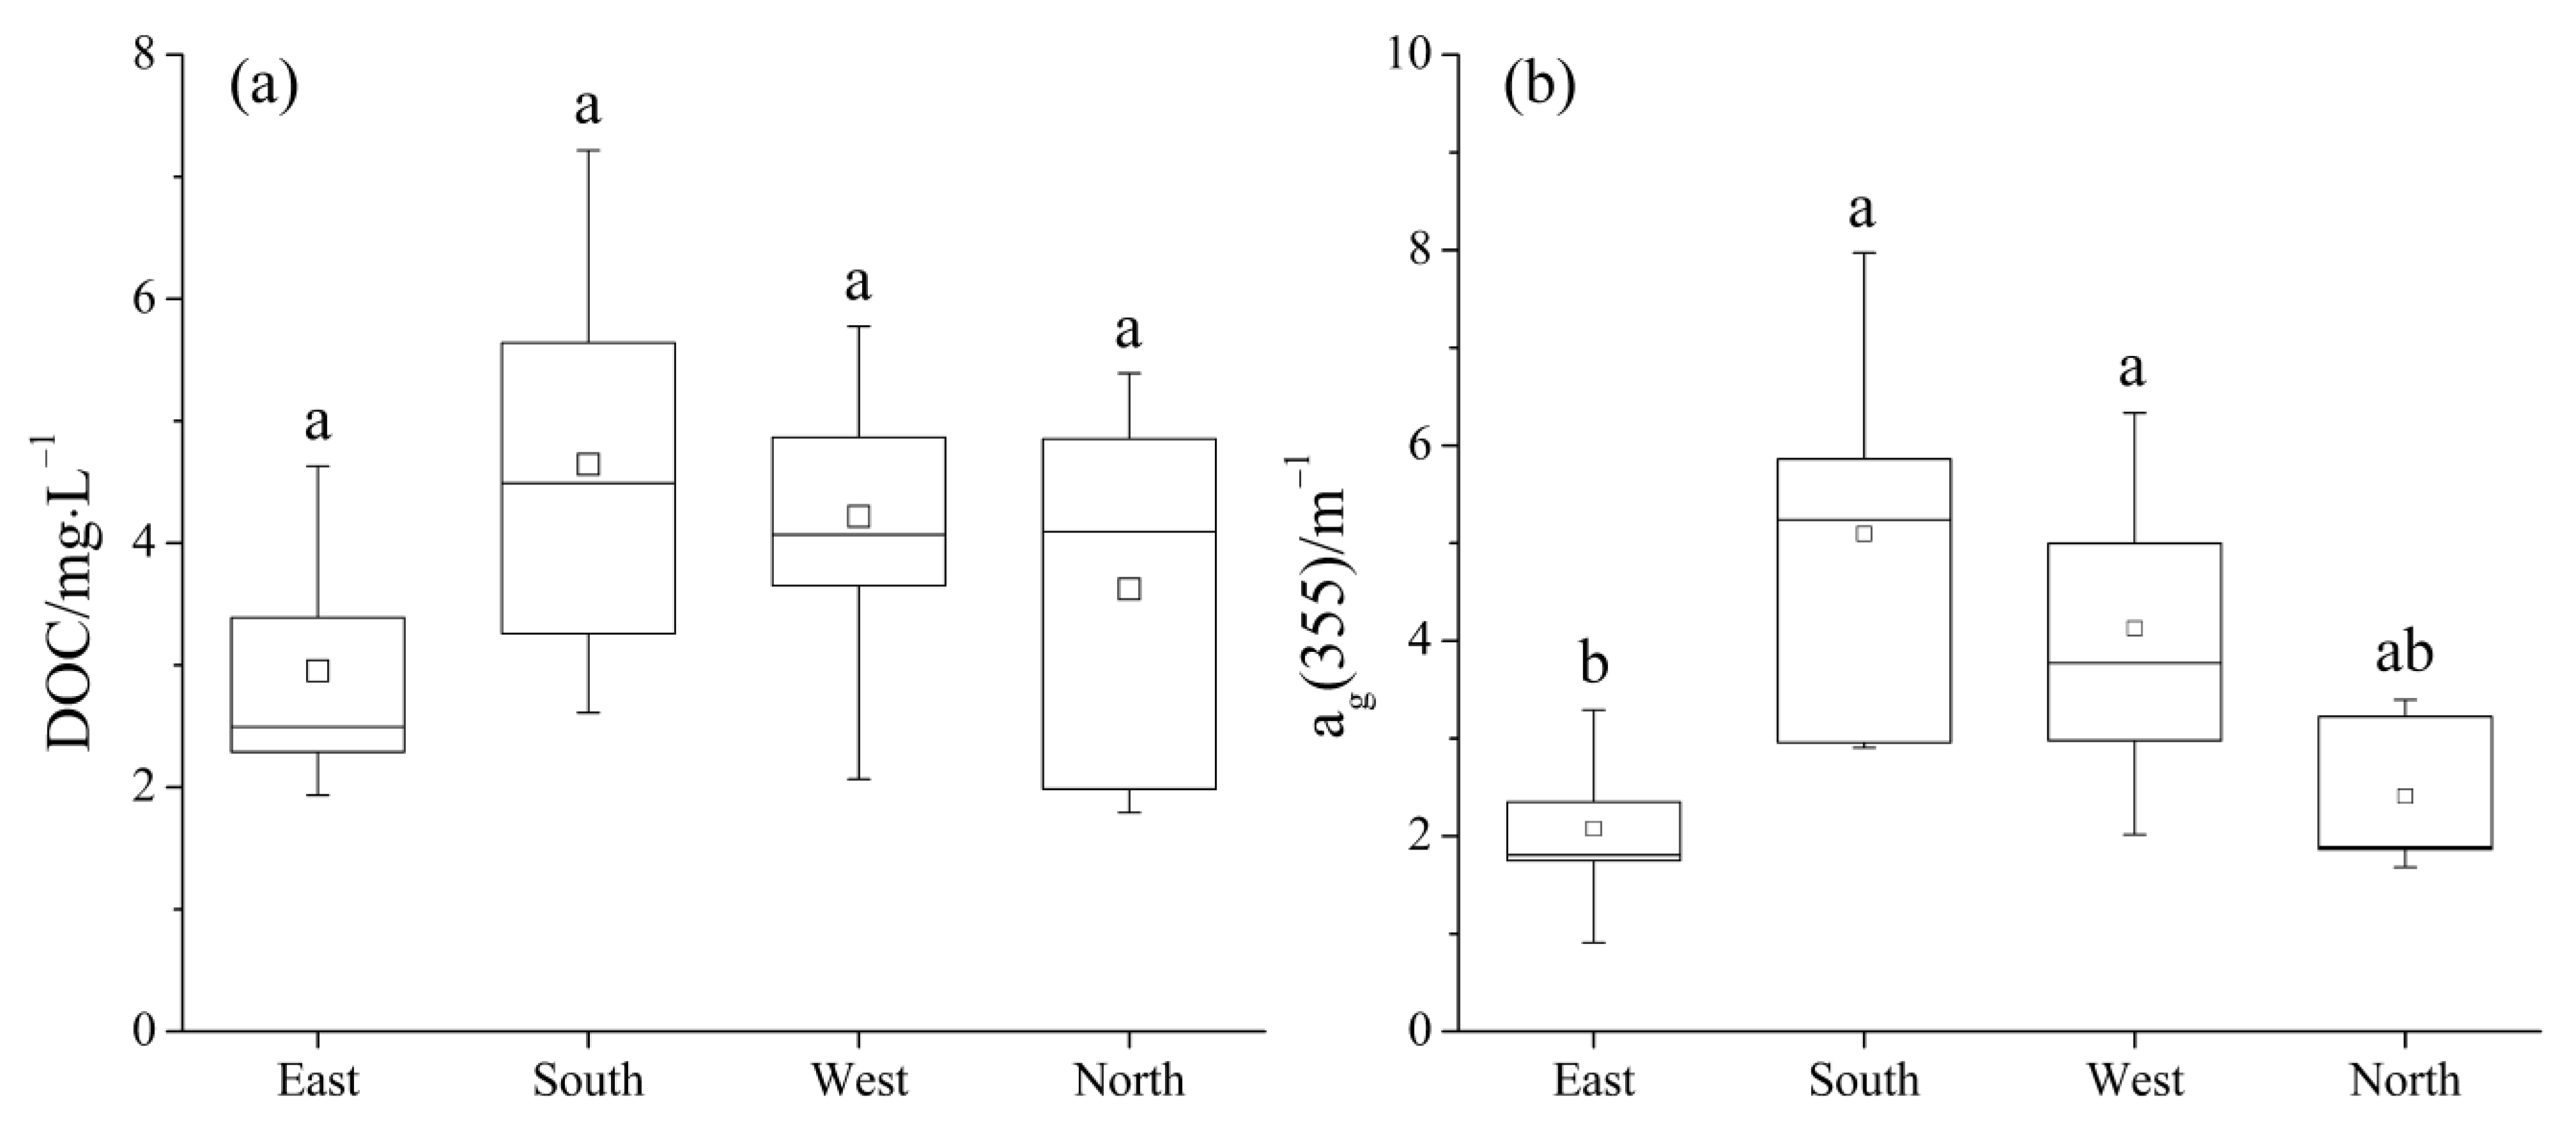
3.3. Spatial Distribution Characteristics of DOC and CDOM in Wetland Water of Poyang Lake

The spatial distribution of the DOC and CDOM of the samples is shown in Figure 4. As can be seen in the figure, the low values of the DOC concentration and CDOM absorption coefficient were found in the east and north of Poyang Lake, while the high values were observed in the southwest of the lake. High values in the west of the lake were concentrated in the Poyang Lake Nature Reserve, which is centered on Wucheng Town, Yongxiu County, while high values in the south were concentrated in the Nanji Wetland Nature Reserve.
Figure 5 shows the spatial distribution of the DOC and CDOM from different parts of Poyang Lake. The DOC concentration ranged from 1.79 mg/L in the north to 7.22 mg/L in the south. The mean concentrations of DOC in the four areas of the lake were as follows: south (4.65 mg/L) > west (4.22 mg/L) > north (3.62 mg/L) > east (2.95 mg/L). The values of ag(355) ranged from 0.91 m−1 in the east to 7.97 m−1 in the south. The average values of ag(355) in the four areas were as follows: south (5.09 m−1) > west (4.13 m−1) > north (2.41 m−1) > east (2.08 m−1).
Through the Kruskal–Wallis test of the significance of the difference, it was found that the CDOM absorption coefficients (ag(355)) in the east of the lake were significantly different from those in the south (p = 0.003) and the west (p = 0.028).

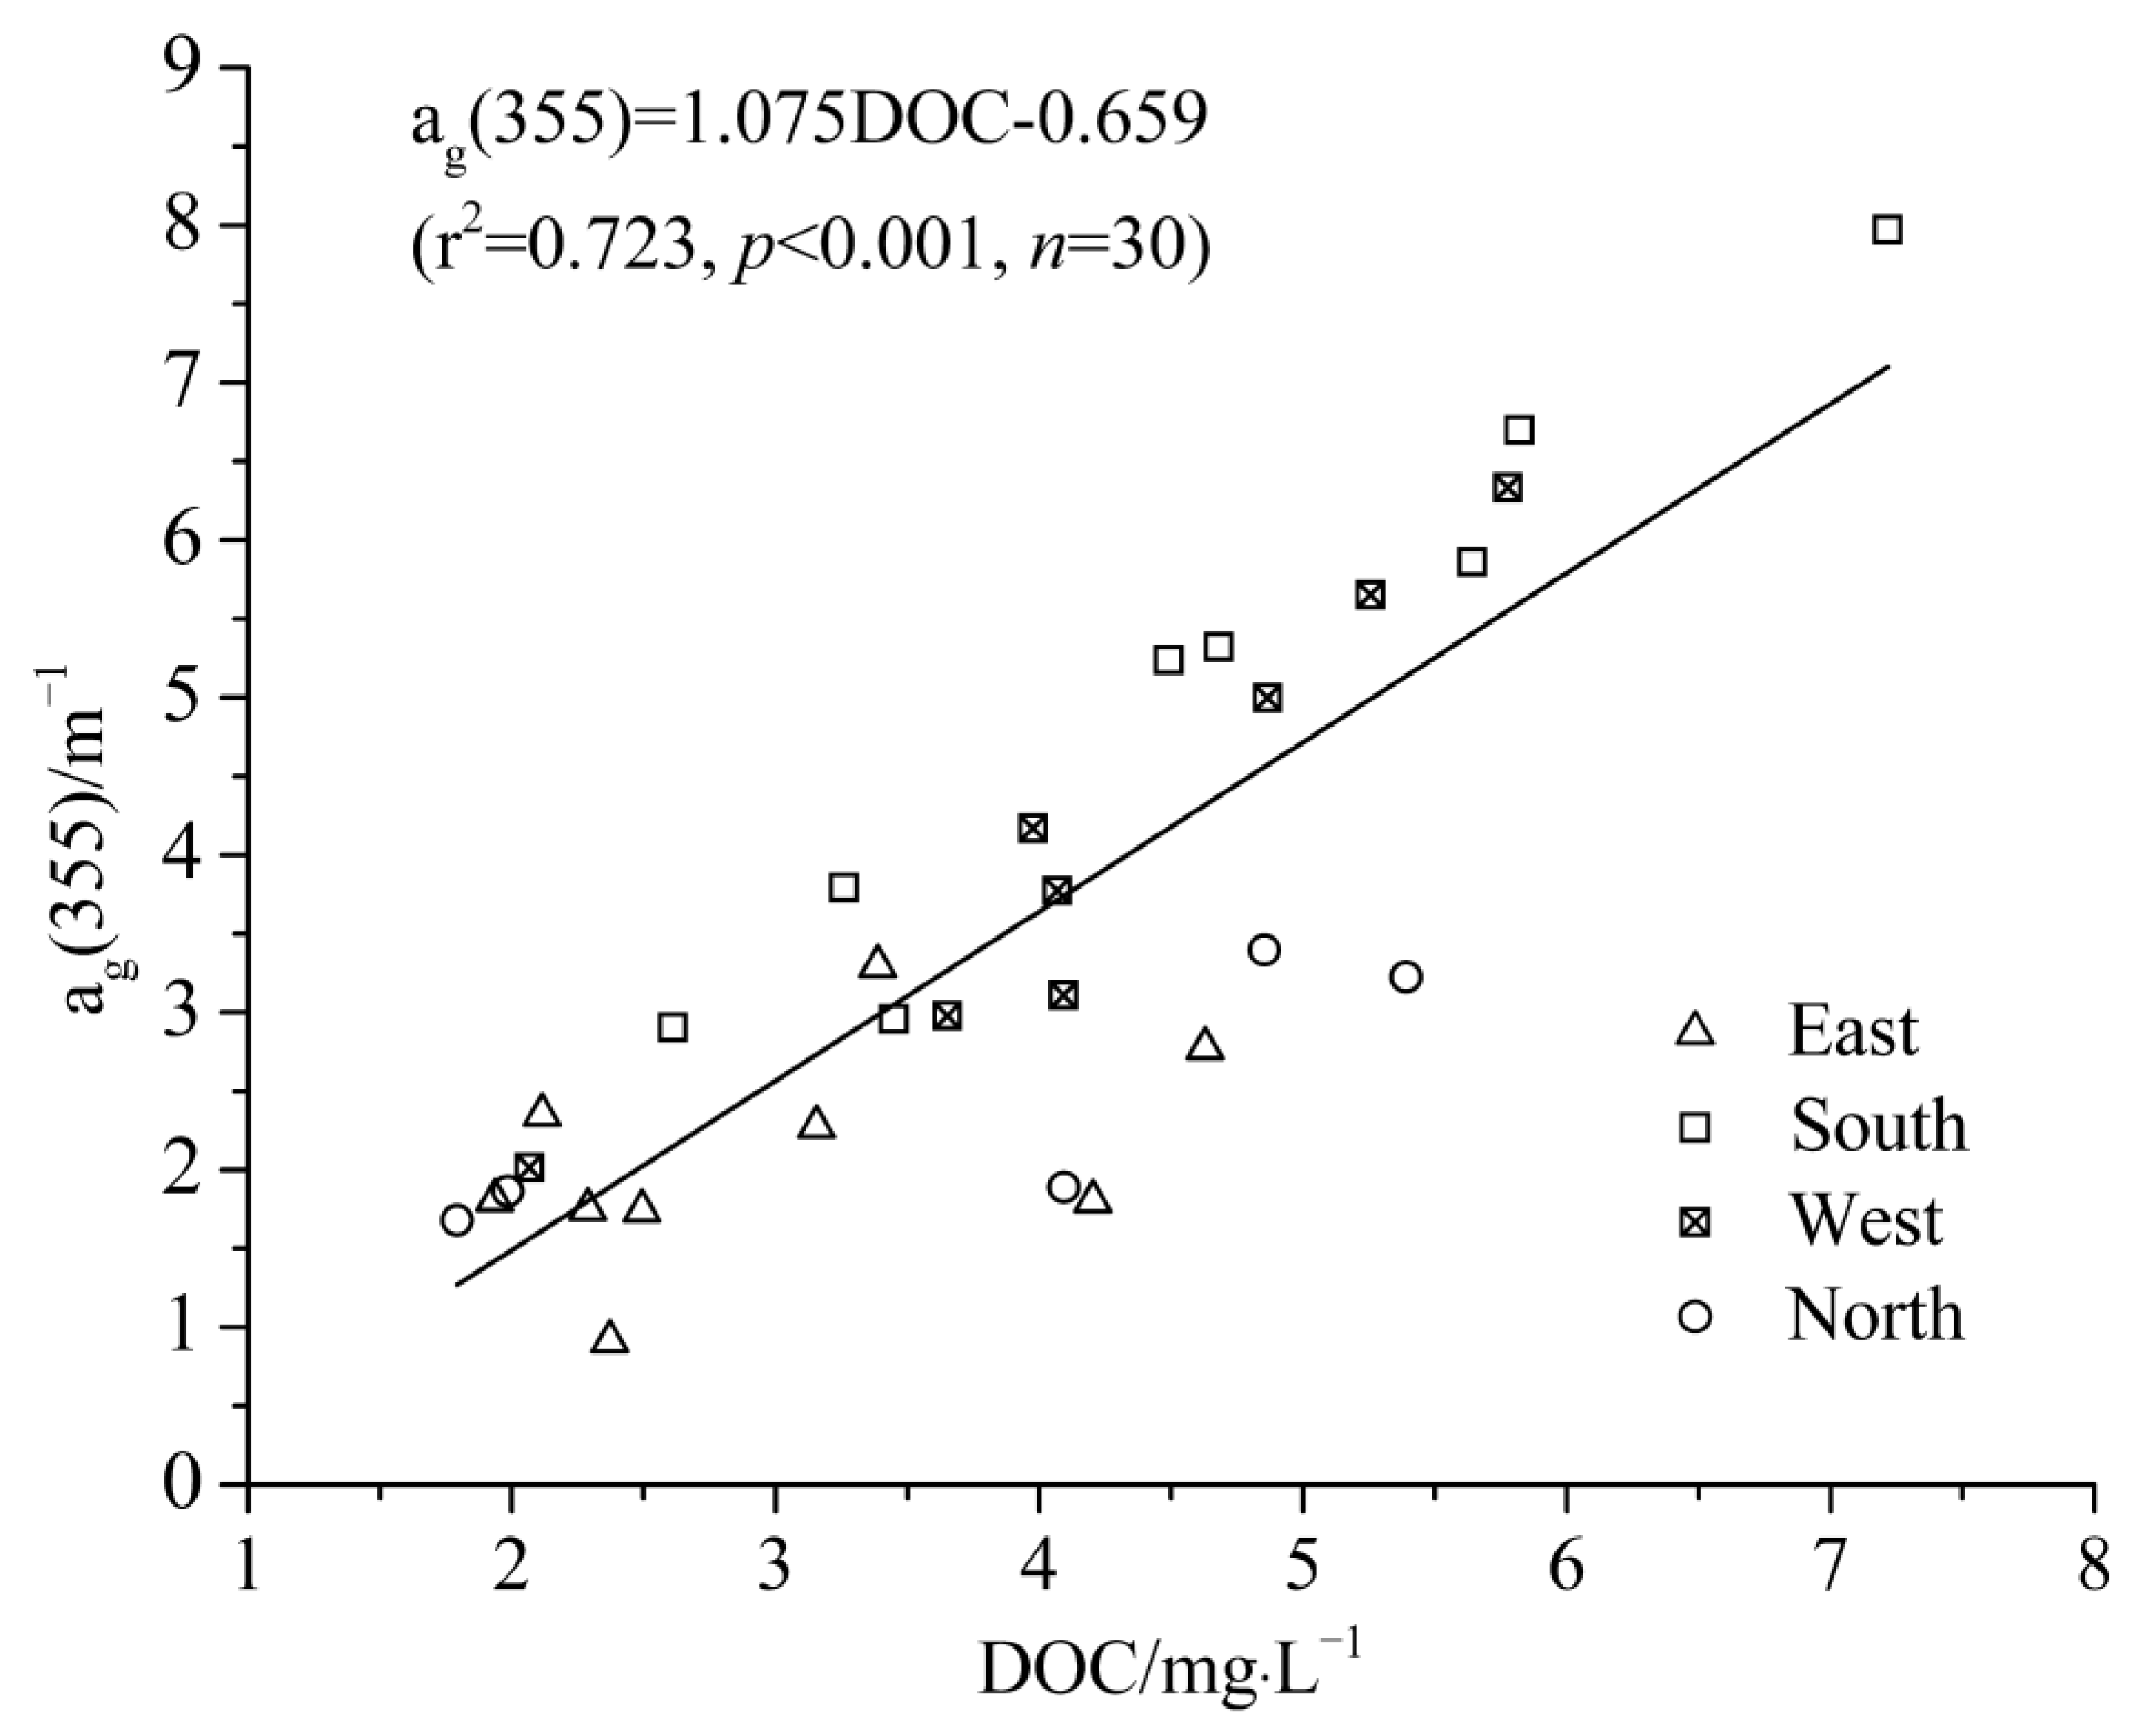
3.4. The Relationship between CDOM and DOC in Wetland Water of Poyang Lake

The DOC concentrations of the samples ranged from 1.79 to 7.22 mg/L, with a mean value of 3.85 ± 1.41 mg/L (Table 1). The DOC concentrations were much lower than those reported for Lake Taihu (6.00–10.9 mg/L, average 8.17 ± 1.38 mg/L), which is a eutrophic lake in Jiangsu Province, China [4]. In the present study, the spatial distribution of the DOC concentration was found to be similar to that of the CDOM absorption coefficient ag(355) (Figure 4), with high values appearing in the southwest of the lake. The present study found a significant positive correlation between the CDOM absorption coefficient ag(355) and DOC concentration in wetland waters of Poyang Lake, and the correlation formula is ag(355) = 1.075DOC–0.659 (r2 = 0.723, p < 0.001, n = 30) (Figure 6).

4. Discussion

4.1. CDOM as a Proxy for DOC in Wetland Water around Poyang Lake

CDOM is an important component of DOC that is mainly composed of humic acid and fulvic acid and has strong absorption in the ultraviolet-visible band. Many studies have shown that the CDOM absorption coefficient is significantly positively correlated with DOC concentration [39]. Thus, the absorption coefficient of CDOM can track changes in DOC concentration [40]. For example, Del Vecchio and Blough [31] reported strong correlations (r2 ranging from 0.501 to 0.904) between ag(355) and DOC for waters from the Mid-Atlantic Bight across different seasons. Additionally, a previous study observed a significant linear relationship (ag(355) = 0.01DOC–0.39 (r2 = 0.59, p < 0.001)) between ag(355) and DOC in water from Chesapeake Bay [41]. Furthermore, another study found strong positive relationships between DOC and CDOM absorption at a range of wavelengths (254 nm, 350 nm, 440 nm) in the majority of rivers in 30 selected watersheds in the United States [35]. A significant relationship was also reported between DOC and CDOM (ag(355) = 1.14DOC–4.77 (r2 = 0.77, p < 0.001) in Lake Taihu [4]. In this study, a significant positive correlation between the CDOM and DOC in wetland water around Poyang Lake had also been found. This indicates that CDOM can be used for the remote sensing-based estimation of DOC [42,43], thus improving the ability to estimate the input and output DOC flux from rivers to wetlands. Additionally, establishing the relationship between CDOM and DOC is useful for the optical remote-sensing-based inversion of the DOC concentration in large lakes such as Poyang Lake [44].

4.2. Sources of CDOM in Wetland Water around Poyang Lake

Peuravuori and Pihlaja [39] observed that the increase of E2/E3 values indicated a decrease in the molecular weight and aromaticity of CDOM. For example, the E2/E3 values of inland water were found to be 8.7 ± 1.67 in Taihu Lake [8], between 8.80 and 17.5 in Lake Superior [45], 8.02 ± 3.84 in terminal lakes of the Hulun Buir Plateau [32], and 7.80 ± 2.30 in rivers of the Hulun Buir Plateau [32]. In the present study, the E2/E3 values in the Poyang Lake wetlands were found to range from 4.17 to 8.55, with an average value of 6.01 ± 0.91, which presented a case of lower E2/E3 value and higher aromaticity and molecular weight of CDOM.
SUVA254 can also be used as an effective index to evaluate the aromaticity and molecular weight of CDOM [34,46]. A previous study found that high SUVA254 values indicated that the organic matter in aquatic systems was mainly derived from allochthonous sources, with significant inputs from vascular plants [35]. Conversely, low SUVA254 values were found to indicate that the main source of organic matter was from algae and microorganisms [34]. In the present study, the value of SUVA254 in the Poyang Lake wetlands was found to range from 2.23 to 5.30 L mg−1 m−1, with a mean of 4.22 ± 0.80 L mg−1 m−1. Other studies showed that the SUVA254 values of inland water dominated by terrestrial inputs were 3.64 ± 0.77 L mg−1 m−1 in a humus lake in Sweden [47], 4.91 ± 0.40 L mg−1 m−1 in Poyang Lake [16], and 3.4–4.5 L mg−1 m−1 in the Congo River [48]. Furthermore, the SUVA254 values of water dominated by autochthonous contribution were found to be 1.7 L mg−1 m−1 in Pony Lake [35] and 1.8 L mg−1 m−1 in Fryxell Lake [49]. In the present study, it was found that the SUVA254 values of the Poyang Lake wetlands were significantly higher than those of water environments dominated by autochthonous contribution; however, these SUVA254 values were similar to the values of water environments dominated by terrestrial inputs.
Helms et al. [36] found that S275–295 values were inversely proportional to the molecular weight of CDOM. Additionally, the S275–295 values in inland water systems were found to be 0.022–0.028 nm−1 in the northern Gulf of Mexico [50], 0.0302 nm−1 in the prairie lakes of the US Great Plains [51], and 0.02 ± 0.004 nm−1 in the terminal lakes of the Hulun Buir Plateau [32]. In this study, it was found that the value of S275–295 in the Poyang Lake wetlands ranged from 0.0152 to 0.0194 nm−1, with a mean value of 0.0170 ± 0.0009 nm−1. The results showed that the S275–295 values of the Poyang Lake wetlands were relatively low.
Previous studies showed that SR is an important indicator of allochthonous and autochthonous source inputs. SR < 1 indicates that CDOM is derived from allochthonous inputs, while SR > 1 indicates that CDOM is derived from autochthonous contributions [52]. The SR values in the Poyang Lake wetlands ranged from 0.940 to 1.108, with a mean value of 0.994 ± 0.039, which indicates that the CDOM of the Poyang Lake wetlands is mainly derived from allochthonous inputs.
The analysis presented in this paper indicates that the CDOM in the Poyang Lake wetlands has a relatively high aromaticity and molecular weight, which were mainly affected by allochthonous inputs. The majority of sample sites were located in the Nanji Wetland Nature Reserve of Poyang Lake, the Poyang Lake migratory birds National Nature Reserve, the mouth of rivers, and wetland waters with frequent human activities. These results suggest that due to the influence of rainfall runoff, river input, and human activities, the sources of CDOM in Poyang Lake wetlands are mainly from allochthonous inputs. The spatial distribution trend of E2/E3 in different parts of the Poyang Lake wetlands was as follows: east > north > west > south (Figure 3). The E2/E3 in the south of the lake was significantly lower than that in the east (p = 0.039). The increase of E2/E3 values indicates the decrease of the molecular weight and aromaticity of CDOM [39]. The variation of E2/E3 values in the Poyang Lake wetlands indicate that the molecular weight and aromatization degree of CDOM are low in the east and north, while the molecular weight and aromatization degree of CDOM is higher in the south. The distribution trend of the SUVA254 of CDOM in the Poyang Lake wetlands was as follows: south > west > east > north (Figure 3). The SUVA254 was significantly higher in the south than in the east (p = 0.01) and north (p = 0.039). Hur et al. [46] found that the increase of SUVA254 values indicated the increase in the molecular weight and aromaticity of CDOM. In the present study, it was directly proven that the degree of aromaticity and humification in the south of Poyang Lake wetland were higher than in other parts of the lake. Meanwhile, the CDOM in the east and north of the lake had relatively low aromaticity. The distribution trend of S275–295 in the Poyang Lake wetlands was as follows: east > west > north > south (Figure 3). The variation of S275–295 indicated that the allochthonous inputs were the strongest in the south of the lake. The distribution trend of SR in the Poyang Lake wetlands was as follows: north > east > west > south (Figure 3). The SR was significantly lower in the south than in the east (p = 0.016) and north (p = 0.013). The values of SR in the south were mostly less than 1, which means that the southern CDOM had stronger allochthonous inputs and higher molecular weight and aromatization.
The results showed that the molecular weight and aromaticity of CDOM were higher in the south of the Poyang Lake wetlands than in other parts. The CDOM in the south of the wetlands was mainly from terrestrial inputs, while the CDOM in the east and north had relatively low aromaticity. The sampling sites in the south were located in the Nanji Wetland National Nature Reserve and the estuary of Ganjiang and Fuhe rivers. There are abundant vascular plants around these areas [26]. The CDOM in the south of the Poyang Lake wetlands could be mainly affected by terrestrial vascular vegetation and river contribution. Most of the sampling sites in the east and north were located in sub-lakes. The phytoplankton content in the sub-lakes of Poyang Lake has previously been shown to be higher than that in rivers [53]. In the present study, the maximum Chl-a concentration was found to be higher in the east of Poyang Lake than in the south, and the average value of Chl-a concentration was higher in the north than in the south (Table 1). Therefore, the CDOM in the east and north of the Poyang Lake wetlands could be produced by autochthonous such as microscopic heterotrophs and phytoplankton, which cause the CDOM in these areas to have relatively low aromaticity.
In this study, the source of CDOM in Poyang Lake wetland was discussed by quantitative and qualitative analysis of aromaticity and molecular weight of CDOM using UV-vis absorption characteristics. In addition, the fluorescence excitation–emission matrix spectroscopy (Fluorescence EEMs) and pyrolysis gas chromatography/mass spectrometry (Pyrolysis GC/MS) can provide abundant and precise information of CDOM characteristics [54,55]. In the future work, we will focus on CDOM source tracing through Fluorescence EEMs and Pyrolysis GC/MS as they have promising potential for characterizing the high-resolution composition of CDOM in the wetland water of Poyang Lake.

5. Conclusions

Wetlands are the key node in the connection between rivers and lakes. Studying the CDOM optical properties of the wetlands around Poyang Lake is necessary to understand the water quality changes in the lake and identify the health of its ecosystem. In this study, CDOM absorption spectrum curves and water quality parameters were collected from 30 sampling sites in the Poyang Lake wetlands in October 2016. The following conclusions can be drawn regarding the CDOM optical absorption characteristics of the wetland waters surrounding Poyang Lake:
(1) The CDOM absorption spectrum presented significant spatial variation, with the absorption coefficient showing a trend of south > west > north > east.
(2) There was a strong linear correlation between the CDOM absorption coefficient and the DOC concentration (ag(355) = 1.075DOC–0.659 (r2 = 0.723, p < 0.001, n = 30)), and the average concentration of DOC and the average value of ag(355) followed the spatial pattern of south > west > north > east.
(3) The analysis of the spectral characteristic parameters of E2/E3, SUVA254, and spectral slopes showed that the CDOM in the Poyang Lake wetlands has relatively high aromaticity and molecular weight, which were mainly affected by terrestrial inputs. The results show that the molecular weight and aromaticity of CDOM were higher in the south of the Poyang Lake wetlands than in other parts.

Author Contributions

Conceptualization, J.X., X.H., W.Y. and Q.H.; methodology, J.X.; software, Z.J.; investigation, J.X.; data curation, Z.J.; writing—original draft preparation, Z.J. and J.X.; writing—review and editing, J.X. and Z.J.; supervision, J.X.; funding acquisition, J.X. All authors have read and agreed to the published version of the manuscript.

Funding

This study was supported by the National Natural Science Foundation of China (grant no. 41471298); the Key Research and Development Project of Jiangxi Province (grant no. 20192ACB70014); the Opening Fund of the Key Laboratory of Poyang Lake Wetland and Watershed Research (Jiangxi Normal University), Ministry of Education (grant no. PK2018002); the Science and Technology Project of the Education Department of Jiangxi Province (grant no. GJJ191706); the Young Talents Project of Jiangxi Normal University, and the Innovation Fund Designated for Graduate Students of Jiangxi Province (grant no. YC2020–S152).

Institutional Review Board Statement

Not applicable.

Informed Consent Statement

Not applicable.

Data Availability Statement

Data is contained within the article.

Acknowledgments

We appreciate the insightful and constructive comments and suggestions from the anonymous reviewers and the editor that helped improve the quality of the manuscript.

Conflicts of Interest

The authors declare no conflict of interest.

References

  1. Zhou, Y.Q.; Jeppesen, E.; Zhang, Y.L.; Niu, C.; Shi, K.; Liu, X.H.; Zhu, G.W.; Qin, B.Q. Chromophoric dissolved organic matter of black waters in a highly eutrophic Chinese lake: Freshly produced from algal scums? J. Hazard. Mater. 2015, 299, 222–230. [Google Scholar] [CrossRef] [PubMed]
  2. Granskog, M.A.; Macdonald, R.W.; Mundy, C.J.; Barber, D.G. Distribution, characteristics and potential impacts of chromophoric dissolved organic matter (CDOM) in Hudson Strait and Hudson Bay, Canada. Cont. Shelf Res. 2007, 27, 2032–2050. [Google Scholar] [CrossRef]
  3. Carlson, C.A.; Ducklow, H.W.; Michaels, A.F. Annual flux of dissolved organic carbon from the euphotic zone in the northwestern Sargasso Sea. Nature 1994, 371, 405–408. [Google Scholar] [CrossRef]
  4. Zhang, Y.L.; Qin, B.Q.; Zhu, G.W.; Zhang, L.; Yang, L.Y. Chromophoric dissolved organic matter (CDOM) absorption characteristics in relation to fluorescence in Lake Taihu, China, a large shallow subtropical lake. Hydrobiologia 2007, 581, 43–52. [Google Scholar] [CrossRef]
  5. Bricaud, A.; Morel, A.; Prieur, L. Absorption by Dissolved Organic Matter of the Sea (Yellow Substance) in the UV and Visible Domains. Limnol. Oceanogr. 1981, 26, 43–53. [Google Scholar] [CrossRef]
  6. Stedmon, C.A.; Markager, S.; Kaas, H. Optical Properties and Signatures of Chromophoric Dissolved Organic Matter (CDOM) in Danish Coastal Waters. Estuar. Coast. Shelf Sci. 2000, 51, 267–278. [Google Scholar] [CrossRef]
  7. Song, K.S.; Shang, Y.X.; Wen, Z.D.; Jacinthe, P.A.; Liu, G.; Lyu, L.L.; Fang, C. Characterization of CDOM in saline and freshwater lakes across China using spectroscopic analysis. Water Res. 2019, 150, 403–417. [Google Scholar] [CrossRef] [Green Version]
  8. Zhang, Y.L.; Yin, Y.; Liu, X.H.; Shi, Z.Q.; Feng, L.Q.; Liu, M.L.; Zhu, G.W.; Gong, Z.J.; Qin, B.Q. Spatial-seasonal dynamics of chromophoric dissolved organic matter in Lake Taihu, a large eutrophic, shallow lake in China. Org. Geochem. 2011, 42, 510–519. [Google Scholar] [CrossRef]
  9. Cheng, Q.-L.; Zheng, B.-H.; Wang, S.-R.; Jiao, L.-X.; Huang, M.-S. Optical Signatures of Chromophoric Dissolved Organic Matter in Water Body of Tien Lake. Spectrosc. Spectr. Anal. 2014, 34, 698–703. [Google Scholar]
  10. Zhou, Q.C.; Zhang, Y.L.; Li, K.D.; Huang, L.C.; Yang, F.L.; Zhou, Y.Y.; Chang, J.J. Seasonal and spatial distributions of euphotic zone and long-term variations in water transparency in a clear oligotrophic Lake Fuxian, China. J. Environ. Sci. 2018, 72, 185–197. [Google Scholar] [CrossRef]
  11. Su, Y.L.; Chen, F.Z.; Liu, Z.W. Comparison of optical properties of chromophoric dissolved organic matter (CDOM) in alpine lakes above or below the tree line: Insights into sources of CDOM. Photochem. Photobiol. Sci. 2015, 14, 1047–1062. [Google Scholar] [CrossRef] [PubMed]
  12. Qi, Y.; Xue, Y.; Wang, X. Release and Microbial Degradation of Dissolved Organic Carbon and Nitrogen from Phragmites australis and Suaeda salsa in the Wetland of the Yellow River Estuary. J. Oceanogr. Mar. Res. 2017, 5, 2. [Google Scholar] [CrossRef]
  13. Clark, C.D.; De Bruyn, W.J.; Brahm, B.; Aiona, P. Optical properties of chromophoric dissolved organic matter (CDOM) and dissolved organic carbon (DOC) levels in constructed water treatment wetland systems in southern California, USA. Chemosphere 2020, 247, 9. [Google Scholar] [CrossRef] [PubMed]
  14. Griffin, C.G.; Frey, K.E.; Rogan, J.; Holmes, R.M. Spatial and interannual variability of dissolved organic matter in the Kolyma River, East Siberia, observed using satellite imagery. J. Geophys. Res. Biogeosci. 2011, 116, 12. [Google Scholar] [CrossRef] [Green Version]
  15. Maie, N.; Jaffe, R.; Miyoshi, T.; Childers, D.L. Quantitative and qualitative aspects of dissolved organic carbon leached from senescent plants in an oligotrophic wetland. Biogeochemistry 2006, 78, 285–314. [Google Scholar] [CrossRef]
  16. Xu, J.; Wang, Y.Q.; Gao, D.; Yan, Z.R.; Gao, C.; Wang, L.L. Optical properties and spatial distribution of chromophoric dissolved organic matter (CDOM) in Poyang Lake, China. J. Great Lakes Res. 2017, 43, 700–709. [Google Scholar] [CrossRef]
  17. Yang, W.; You, Q.; Fang, N.; Xu, L.; Zhou, Y.; Wu, N.; Ni, C.; Liu, Y.; Liu, G.; Yang, T. Assessment of wetland health status of Poyang Lake using vegetation-based indices of biotic integrity. Ecol. Indic. 2018, 90, 79–89. [Google Scholar] [CrossRef]
  18. Han, X.; Chen, X.; Feng, L. Four decades of winter wetland changes in Poyang Lake based on Landsat observations between 1973 and 2013. Remote Sens. Environ. 2015, 156, 426–437. [Google Scholar] [CrossRef]
  19. Deng, X.Z.; Zhao, Y.H.; Wu, F.; Lin, Y.Z.; Lu, Q.; Dai, J. Analysis of the trade-off between economic growth and the reduction of nitrogen and phosphorus emissions in the Poyang Lake Watershed, China. Ecol. Model. 2011, 222, 330–336. [Google Scholar] [CrossRef]
  20. Jun, Y.C.; Won, D.H.; Lee, S.H.; Kong, D.S.; Hwang, S.J. A Multimetric Benthic Macroinvertebrate Index for the Assessment of Stream Biotic Integrity in Korea. Int. J. Environ. Res. Public Health 2012, 9, 3599–3628. [Google Scholar] [CrossRef]
  21. Duan, W.L.; He, B.; Nover, D.; Yang, G.S.; Chen, W.; Meng, H.F.; Zou, S.; Liu, C.M. Water Quality Assessment and Pollution Source Identification of the Eastern Poyang Lake Basin Using Multivariate Statistical Methods. Sustainability 2016, 8, 133. [Google Scholar] [CrossRef] [Green Version]
  22. Xu, J.; Fang, C.; Gao, D.; Zhang, H.; Gao, C.; Xu, Z.; Wang, Y. Optical models for remote sensing of chromophoric dissolved organic matter (CDOM) absorption in Poyang Lake. Isprs J. Photogramm. Remote Sens. 2018, 142, 124–136. [Google Scholar] [CrossRef]
  23. Ye, X.; Zhang, Q.; Bai, L.; Hu, Q. A modeling study of catchment discharge to Poyang Lake under future climate in China. Quat. Int. 2011, 244, 221–229. [Google Scholar] [CrossRef]
  24. Feng, L.; Hu, C.; Chen, X.; Cai, X.; Tian, L.; Gan, W. Assessment of inundation changes of Poyang Lake using MODIS observations between 2000 and 2010. Remote Sens. Environ. 2012, 121, 80–92. [Google Scholar] [CrossRef]
  25. Wang, L.; Dronova, I.; Gong, P.; Yang, W.; Li, Y.; Liu, Q. A new time series vegetation–water index of phenological–hydrological trait across species and functional types for Poyang Lake wetland ecosystem. Remote Sens. Environ. 2012, 125, 49–63. [Google Scholar] [CrossRef]
  26. Jiang, F.; Qi, S.H.; Liao, F.Q.; Ding, M.J.; Wang, Y.Q. Vulnerability of Siberian crane habitat to water level in Poyang Lake wetland, China. Giscience Remote Sens. 2014, 51, 662–676. [Google Scholar] [CrossRef]
  27. Xu, J.; Gao, C.; Wang, Y.Q. Extraction of Spatial and Temporal Patterns of Concentrations of Chlorophyll-a and Total Suspended Matter in Poyang Lake Using GF-1 Satellite Data. Remote Sens. 2020, 12, 622. [Google Scholar] [CrossRef] [Green Version]
  28. Herlihy, A.T.; Larsen, D.P.; Paulsen, S.G.; Urquhart, N.S.; Rosenbaum, B.J. Designing a Spatially Balanced, Randomized Site Selection Process for Regional Stream Surveys: The EMAP Mid-Atlantic Pilot Study. Environ. Monit. Assess. 2000, 63, 95–113. [Google Scholar] [CrossRef]
  29. Huang, W.; Chen, R.F. Sources and transformations of chromophoric dissolved organic matter in the Neponset River Watershed. J. Geophys. Res. Biogeosci. 2009, 114, 114. [Google Scholar] [CrossRef]
  30. Lorenzen, C.J. Determination of chlorophyll and pheopigments: Spectrophotometric equations. Limnol. Oceanogr. 1967, 12, 343–346. [Google Scholar] [CrossRef]
  31. Del Vecchio, R.; Blough, N.V. Spatial and seasonal distribution of chromophoric dissolved organic matter and dissolved organic carbon in the Middle Atlantic Bight. Mar. Chem. 2004, 89, 169–187. [Google Scholar] [CrossRef]
  32. Wen, Z.D.; Song, K.S.; Zhao, Y.; Du, J.; Ma, J.H. Influence of environmental factors on spectral characteristics of chromophoric dissolved organic matter (CDOM) in Inner Mongolia Plateau, China. Hydrol. Earth Syst. Sci. 2016, 20, 787–801. [Google Scholar] [CrossRef] [Green Version]
  33. Jaffrain, J.; Gerard, F.; Meyer, M.; Ranger, J. Assessing the quality of dissolved organic matter in forest soils using ultraviolet absorption spectrophotometry. Soil Sci. Soc. Am. J. 2007, 71, 1851–1858. [Google Scholar] [CrossRef]
  34. Weishaar, J.L.; Aiken, G.R.; Bergamaschi, B.A.; Fram, M.S.; Fujii, R.; Mopper, K. Evaluation of specific ultraviolet absorbance as an indicator of the chemical composition and reactivity of dissolved organic carbon. Environ. Sci. Technol. 2003, 37, 4702–4708. [Google Scholar] [CrossRef] [PubMed]
  35. Spencer, R.G.M.; Butler, K.D.; Aiken, G.R. Dissolved organic carbon and chromophoric dissolved organic matter properties of rivers in the USA. J. Geophys. Res. Biogeosci. 2012, 117, 14. [Google Scholar] [CrossRef]
  36. Helms, J.R.; Stubbins, A.; Ritchie, J.D.; Minor, E.C.; Kieber, D.J.; Mopper, K. Absorption spectral slopes and slope ratios as indicators of molecular weight, source, and photobleaching of chromophoric dissolved organic matter. Limnol. Oceanogr. 2008, 53, 955–969. [Google Scholar] [CrossRef] [Green Version]
  37. Kowalczuk, P.; Cooper, W.J.; Whitehead, R.F.; Durako, M.J.; Sheldon, W. Characterization of CDOM in an organic-rich river and surrounding coastal ocean in the South Atlantic Bight. Aquat. Sci. 2003, 65, 384–401. [Google Scholar] [CrossRef]
  38. Kowalczuk, P.; Ston-Egiert, J.; Cooper, W.J.; Whitehead, R.F.; Durako, M.J. Characterization of chromophoric dissolved organic matter (CDOM) in the Baltic Sea by excitation emission matrix fluorescence spectroscopy. Mar. Chem. 2005, 96, 273–292. [Google Scholar] [CrossRef]
  39. Peuravuori, J.; Pihlaja, K. Molecular size distribution and spectroscopic properties of aquatic humic substances. Anal.Chim.Acta 1997, 337, 133–149. [Google Scholar] [CrossRef]
  40. Fichot, C.G.; Benner, R. A novel method to estimate DOC concentrations from CDOM absorption coefficients in coastal waters. Geophys. Res. Lett. 2011, 38. [Google Scholar] [CrossRef]
  41. Rochelle-Newall, E.J.; Fisher, T.R. Chromophoric dissolved organic matter and dissolved organic carbon in Chesapeake Bay. Mar. Chem. 2002, 77, 23–41. [Google Scholar] [CrossRef]
  42. Olmanson, L.G.; Brezonik, P.L.; Finlay, J.C.; Bauer, M.E. Comparison of Landsat 8 and Landsat 7 for regional measurements of CDOM and water clarity in lakes. Remote Sens. Environ. 2016, 185, 119–128. [Google Scholar] [CrossRef]
  43. Kutser, T. The possibility of using the Landsat image archive for monitoring long time trends in coloured dissolved organic matter concentration in lake waters. Remote Sens. Environ. 2012, 123, 334–338. [Google Scholar] [CrossRef]
  44. Hestir, E.L.; Brando, V.; Campbell, G.; Dekker, A.; Malthus, T. The relationship between dissolved organic matter absorption and dissolved organic carbon in reservoirs along a temperate to tropical gradient. Remote Sens. Environ. 2015, 156, 395–402. [Google Scholar] [CrossRef]
  45. Li, H.Y.; Minor, E.C. Dissolved organic matter in Lake Superior: Insights into the effects of extraction methods on chemical composition. Env. Sci. Process Impacts 2015, 17, 1829–1840. [Google Scholar] [CrossRef] [PubMed]
  46. Hur, J.; Jung, K.Y.; Schlautman, M.A. Altering the characteristics of a leaf litter-derived humic substance by adsorptive fractionation versus simulated solar irradiation. Water Res. 2011, 45, 6217–6226. [Google Scholar] [CrossRef]
  47. Kothawala, D.N.; Stedmon, C.A.; Muller, R.A.; Weyhenmeyer, G.A.; Kohler, S.J.; Tranvik, L.J. Controls of dissolved organic matter quality: Evidence from a large-scale boreal lake survey. Glob. Chang. Biol. 2014, 20, 1101–1114. [Google Scholar] [CrossRef] [Green Version]
  48. Spencer, R.G.M.; Aiken, G.R.; Butler, K.D.; Dornblaser, M.M.; Striegl, R.G.; Hernes, P.J. Utilizing chromophoric dissolved organic matter measurements to derive export and reactivity of dissolved organic carbon exported to the Arctic Ocean: A case study of the Yukon River, Alaska. Geophys. Res. Lett. 2009, 36, 6. [Google Scholar] [CrossRef]
  49. Fellman, J.B.; Hood, E.; Spencer, R.G.M. Fluorescence spectroscopy opens new windows into dissolved organic matter dynamics in freshwater ecosystems: A review. Limnol. Oceanogr. 2010, 55, 2452–2462. [Google Scholar] [CrossRef]
  50. Ma, Z.W.; Gray, E.; Thomas, E.; Murphy, B.; Zachos, J.; Paytan, A. Carbon sequestration during the Palaeocene-Eocene Thermal Maximum by an efficient biological pump. Nat. Geosci. 2014, 7, 382–388. [Google Scholar] [CrossRef]
  51. Osburn, C.L.; Wigdahl, C.R.; Fritz, S.C.; Saros, J.E. Dissolved organic matter composition and photoreactivity in prairie lakes of the U.S. Great Plains. Limnol. Oceanogr. 2011, 56, 2371–2390. [Google Scholar] [CrossRef] [Green Version]
  52. Zhou, Y.; Zhang, Y.; Shi, K.; Liu, X.; Niu, C. Dynamics of chromophoric dissolved organic matter influenced by hydrological conditions in a large, shallow, and eutrophic lake in China. Environ. Sci. Pollut. Res. 2015, 22, 12992–13003. [Google Scholar] [CrossRef] [PubMed]
  53. Wu, Z.S.; He, H.; Cai, Y.J.; Zhang, L.; Chen, Y.W. Spatial distribution of chlorophyll a and its relationship with the environment during summer in Lake Poyang: A Yangtze-connected lake. Hydrobiologia 2014, 732, 61–70. [Google Scholar] [CrossRef]
  54. Shang, Y.; Song, K.; Jacinthe, P.A.; Wen, Z.; Lyu, L.; Fang, C.; Liu, G. Characterization of CDOM in reservoirs and its linkage to trophic status assessment across China using spectroscopic analysis. J. Hydrol. 2019, 576, 1–11. [Google Scholar] [CrossRef]
  55. Jiang, T.; Kaal, J.; Liang, J.; Zhang, Y.; Wei, S.; Wang, D.; Green, N.W. Composition of dissolved organic matter (DOM) from periodically submerged soils in the Three Gorges Reservoir areas as determined by elemental and optical analysis, infrared spectroscopy, pyrolysis-GC–MS and thermally assisted hydrolysis and methylation. Sci. Total Environ. 2017, 603, 461–471. [Google Scholar] [CrossRef]
Figure 1. The distribution of sampling sites in typical wetland waters around Poyang Lake (the background image is a Landsat-8 OLI (Operational Land Imager) image (false color display, red: 850–880 nm, green: 640–670 nm, blue: 530–590 nm) of Poyang Lake on 27 September 2016).
Water 13 00274 g001
Figure 2. The maximum, minimum and average CDOM absorption spectra for each part of the wetland waters around Poyang Lake in 2016: (a) East; (b) South; (c) West; (d) North.
Water 13 00274 g002
Figure 3. Box plots of CDOM characteristic parameters in the east (n = 9), south (n = 8), west (n = 8), and north (n = 5) of the wetlands surrounding Poyang Lake in 2016: (a) E2/E3; (b) SUVA254; (c) S275–295; (d) SR. The horizontal edge of the box represents the upper and lower quartile, the middle solid line is the median, and the square points are the average. The upper and lower short lines represent the maximum and minimum values, respectively. Groups with different letters show significant differences at p ≤ 0.05.
Water 13 00274 g003
Figure 4. The spatial distribution of dissolved organic carbon (DOC) and CDOM in the wetland waters around Poyang Lake: (a) DOC concentration; (b) CDOM absorption coefficient ag(355).
Water 13 00274 g004
Figure 5. Box plots showing the DOC (a) and CDOM (b) in the wetland waters in the east (n = 9), south (n = 8), west (n = 8), and north (n = 5) of Poyang Lake. The horizontal edges of the boxes represent the upper and lower quartiles; the middle solid line is the median; the square points indicate the average; and the upper and lower short lines represent the maximum and minimum values, respectively. Groups with different letters show significant differences at p ≤ 0.05.
Water 13 00274 g005
Figure 6. The results of correlation analysis between CDOM and DOC.
Water 13 00274 g006
Table 1. Descriptive statistics of the water quality parameters for different areas of the Poyang Lake wetlands.
All Areas (n = 30)East (n = 9)South (n = 8)West (n = 8)North (n = 5)
MeanMin-MaxMeanMin-MaxMeanMin-MaxMeanMin-MaxMeanMin-Max
DOC (mg/L)3.85 ± 1.381.79−7.222.95 ± 0.901.94–4.634.65 ± 1.442.61–7.224.22 ± 1.062.07–5.783.62 ± 1.481.79–5.39
ag(355) (m−1)3.48 ± 1.750.91–7.972.08 ± 0.650.91–3.295.09 ± 1.682.91–7.974.13 ± 1.362.02–6.332.41 ± 0.741.68–3.40
pH7.68 ± 0.247.15–8.047.77 ± 0.197.41–8.037.67 ± 0.227.21–7.947.65 ± 0.237.32–8.047.61 ± 0.287.15–7.86
DO (mg/L)8.61 ± 1.584.75–10.508.80 ± 1.007.08–10.037.66 ± 1.924.75–10.268.98 ± 1.696.23–10.509.22 ± 0.857.62–9.98
T (°C)19.84 ± 3.0414.64–28.8520.55 ± 2.9614.64–24.1619.93 ± 4.5215.29–28.8520.00 ± 1.2618.46–22.8518.18 ± 0.7817.21–19.23
EC (µS/cm)125.10 ± 73.514.00–341.00140.44 ± 87.7950.00–316.00105.13 ± 56.294.00–213.0092.50 ± 24.8257.00–135.0181.60 ± 80.86121.00–341.00
Chl-a (μg/L)10.94 ± 7.542.20–28.808.24 ± 6.502.20–24.808.48 ± 5.044.70–21.1016.33 ± 9.312.40–28.8011.12 ± 4.055.20–16.20
Tur (NTU)95.24 ± 158.673.70–824.4059.61 ± 60.003.70–219.5056.08 ± 81.457.20–269.5066.31 ± 66.066.00–208.70268.34 ± 301.5626.10–824.40
SD (cm)16.35 ± 11.442.00–45.0014.67 ± 11.195.00–45.0020.06 ± 12.299.00–42.0019.81 ± 10.516.00–36.507.90 ± 4.842.00–16.00
TDS (g/L)0.090 ± 0.0510.003–0.2490.099 ± 0.0600.034–0.2190.076 ± 0.0390.003–0.1490.066 ± 0.01670.042–0.0920.135 ± 0.05780.091–0.249
Note: DOC—dissolved organic carbon; ag(355)—absorption coefficient of colored dissolved organic matter (CDOM) at 355 nm; DO—dissolved oxygen; T—water temperature; EC—electrical conductivity; Chl-a—chlorophyll a; Tur—turbidity; SD—water transparency; TDS—total dissolved solid; n denotes the number of samples.
Publisher’s Note: MDPI stays neutral with regard to jurisdictional claims in published maps and institutional affiliations.

